FHWA-NJ-2002-11
Field Implementation of Geopolymer Coatings
FINAL REPORT
September 2004 (Revised May 2008)
Submitted by Dr. P. N. Balaguru, Principal Investigator
Mohamed Nazier, Graduate Assistant Mohamed Arafa, Graduate Assistant
Dept. of Civil & Environmental Engineering Center for Advanced Infrastructure & Transportation (CAIT)
Rutgers, The State University Piscataway, NJ 08854-8014
NJDOT Research Project Manager Mr. Robert Sasor
In cooperation with
New Jersey Department of Transportation
Bureau of Research and
U.S. Department of Transportation Federal Highway Administration

Disclaimer Statement
The contents of this report reflect the views of the authors who are responsible for the facts and the
accuracy of the data presented herein. The contents do not necessarily reflect the official views or policies of the New Jersey Department of Transportation or the Federal Highway Administration. This report does not constitute
a standard, specification, or regulation.
The contents of this report reflect the views of the authors, Who are responsible for the facts and the accuracy of the
Information presented herein. This document is disseminated Under the sponsorship of the Department of Transportation, University Transportation Centers Program, in the interest of
information exchange. The U.S. Government assumes no liability for the contents or use thereof.

Field Implementation of Geopolymer Coatings
Dr. P.N. Balaguru, Mohamed Nazier, Mohamed Arafa
FHWA-NJ-2002-11
New Jersey Department of Transportation Federal Highway Administration P.O. Box 600 U.S. Department of Transportation Trenton, NJ 08625 Washington, D.C.
Final Report 02/01/2000 to 09/30/2001
15. Supplementary Notes
12. Sponsoring Agency Name and Address
7. Author(s)
2. Government Accession No. 1. Report No.
16. Abstract
17. Key Words
19. Security Classif (of this report) 20. Security Classif. (of this page)
18. Distribution Statement
21. No of Pages 22. Price
The results presented in this report deal with an evaluation of Geopolymer coatings for durability and field demonstration applications. The primary objectives were to establish a temperature range in which the coating could be applied, establish the surface conditions and requirements, and to demonstrate field applications which were done at Rutgers University campuses and on actual transportation structures. A brief description of fiber composites is presented in the introduction chapter. The study on the establishment of a temperature range is presented in Chapter 2. The durability test results under wetting and drying conditions and scaling are presented in Chapters 3 and 4, respectively, and the field applications are described in Chapter 5. Conclusions and recommendations are presented in Chapter 6. The recommended application procedure for the geopolymer coatings is presented in Appendix A.
Coating, geopolymer, inorganic, matrix, carbon reinforcement, concrete surface protection, concrete strengthening
Unclassified Unclassified 51
4. Ti t le and Subt i t le
Rutgers University 623 Bowser Road Piscataway, NJ 08880
13. Type of Report and Period Covered
11. Contract or Grant No.
10. Work Unit No.
9. Performing Organization Name and Address
14. Sponsoring Agency Code
TECHNICAL REPORT STANDARD TITLE PAGE3. Rec ip ient ’s Cata log No.
5 . Repor t Date
8. Performing Organization Report No.
September 2004, Revised May 2008
6. Performing Organizat ion Code CAIT/Rutgers
Form DOT F 1700.7 (8-69)

Acknowledgements
The authors wish to express their appreciation to the New Jersey Department of Transportation for the allotment of funds making this research possible. Special thanks are extended to Mr. Robert Sasor for his support and for extending the opportunity to participate in such a significant and extensive research program.
ii

Table of Contents
Page
Chapter 1- Introduction 1
1.1 Scope and Objective of This Study 1
1.2 Background Information on Fiber Composites 2
Chapter 2 – Curing Temperature and Parent Surface Condition 5
2.1 Test Setup for Establishing Curing Temperature Range 5
2.2 Test Results and Discussion 9
2.3 Parent Surface types and Preparation 13
2.4 Method of Application 16
Chapter 3 – Durability: Wet-Dry Conditions 17
3.1 Introduction 17
3.2 Experimental Evaluation 18
3.2.1 Preparation of Concrete Prisms 18
3.2.2 Application of Strengthening Systems 18
3.2.3 Test Procedure 19
Wet-Dry Chamber 19
Flexure Test 20
3.3 Test Variables and Results 20
Chapter 4 – Durability: Scaling Conditions 23
4.1 Introduction 23
4.2 Experimental Investigation 23
4.2.1 Sample Preparation 24
iii

Table of Contents
Page
4.2.2 Scaling Test Set-Up 24
4.2.3 Evaluation Procedure: Surface Condition 25
4.3 Test Results: Surface Condition 25
4.4 Test Results and Discussion: Strength Tests 27
4.5 Summary 29
Chapter 5 – Field Durability Study and Demonstration Applications 30
5.1 Field Durability Study 30
5.2 Field Applications on Transportation Structures 32
Chapter 6 - Conclusions 34
Appendix A – Guidelines for Application of Inorganic Geopolymer Coating 36
Bibliography 37
iv

List of Figures
Page
2.1(a) Concrete Prisms Coated with Geopolymer and Exposed to Running Water 6
2.1(b) Concrete Prisms Coated with Geopolymer and Exposed to Running Water 6
2.2 Application on a Smooth Surface 13
2.3 Application on a Vertical Wall, Relatively New Smooth Surface 14
2.4 Application on a 15 Year Old Aged Surface 14
2.5 Application on Rough Surface with Spalled Areas 15
2.6 Application on Very Rough Surface with 95% of the Aggregates Exposed 15
3.1 Comparison of Failure Loads: Control, 2 and 4 Percent Discrete Carbon Fibers 21
3.2 Comparison of Failure Loads: Control, 1, 2 and 3 Carbon Tows 22
3.3 Comparison of Failure Loads: Control, 1 and 2 Carbon Fabric Layers 22
4.1 Schematic of Scaling Test Specimen 24
4.2 Surface Condition of Samples Subjected to Scaling Conditions, Low Strength Concrete and Control 26
4.3 Surface Condition of Samples Subjected to Scaling Cycles, Low Strength Concrete 26
4.4 Comparison of Failure Loads: Control, 2 and 4 Percent Discrete Carbon Fibers 27
4.5 Comparison of Failure Loads: Control, 1, 2 and 3 Carbon Tows 28
4.6 Comparison of Failure Loads: Control, 1 and 2 Carbon Fabric Layers 28
5.1(a) Coating on Concrete Curb on Busch Campus 31
5.1(b) Coating on Concrete Curb on Busch Campus, The Second Set 31
5.1(c) Coating on Concrete Curb on Busch Campus, a Close Up View 32
v

List of Figures
Page
5.2 Coating on Route 1 South, Close-Up View 33
5.3 Application of Coating on Curb in Rhode Island 33
List of Tables
Page
2.1 Details of Matrix for Various Mixtures 7
2.2 Results of Tests (After 24 Hours of Curing) on Various Types of Coatings and Different Curing Temperatures 10
vi

1
Chapter 1
Introduction
1.1 Scope and Objective
In a previous study sponsored by the New Jersey Department of Transportation
(NJDOT), a fiber reinforced-inorganic polymer composite was formulated. The
composite, known as Geopolymer was evaluated as a protective coating material for
transportation infrastructure. The unique features of this composition are as follows:
• The matrix used in the composite is inorganic, and fire and UV resistant.
• The system is water-based and has no toxic substances. No toxins are released
during the application or curing.
• The coating can be applied with minimum surface preparation.
• The permeability of the coating material is much less than the permeability of
concrete but it allows the release of vapor pressure build-up. Therefore, the
coating does not delaminate from the parent surface.
• The matrix is compatible with concrete, bricks, steel and wood.
• The matrix cures to a glassy texture and hence organic paints do not adhere to
geopolymer coated surfaces. This aspect can be effectively used to create a
graffiti resistant surface, which was one of the primary motivations for this study.
For more information see the following relevant reports: Balaguru, P., Kurtz, S., and
Rudolph, J. (1996); Balaguru, P., Slattum, K. (1995); Foden, A., Balaguru, P., and Lyon,
R. (1996A).
The previous study established the viability of the Geopolymer product for
protective coating applications. The primary objectives of the current study are as
follows:
• Establish a temperature range in which the coating can be applied, given the
requirement being that the coating should be able to withstand rain after 24 hours
of curing.

• Establish the surface condition and requirements. One of the questions was,
whether the material can be applied on rough surfaces which have exposed
aggregates due to deterioration. In most cases, the surface preparation consists of
removing excess dust build-up and pre-wetting.
• Make field demonstration applications at Rutgers University campuses and on
actual transportation structures.
The results presented in this report deal with the aforementioned objectives and a
summary of durability tests in a parallel study supported by the New England
Transportation Consortium (NETC).
A brief description of fiber reinforced composites is presented in the introduction
chapter. The study on the establishment of temperature range is presented in Chapter 2.
The durability test results under wetting and drying conditions and scaling are presented
in Chapters 3 and 4 respectively, and the field applications are described in Chapter 5.
Conclusions and recommendations are presented in Chapter 6. The recommended
application procedure is presented in Appendix A.
1.2 Background Information on Fiber Composites
Recently, high strength fiber composites, known as Fiber Reinforced Polymers
(FRP), have been evaluated for rehabilitation of the transportation infrastructure and have
been found to show excellent potential. For example, fiberglass boats have been known
to provide excellent service for 50 years with little or no maintenance. Some of these
boats are constantly exposed to sea water, and bridge decks and other structural elements
are exposed to the same type of aggressive environment. If a protective layer of
composite can be placed around super structures, such as exposed piers and pier caps,
their service life can be extended.
The first step in the development of these composites is the selection of a matrix.
The matrix may be broadly defined as either organic or inorganic. The organic matrices
are generally comprised of acrylics, epoxies, latexes or polymers. They are usually single
or multi component systems, the latter of which exhibits better mechanical properties.
The first part is usually a resin, while the second part is an activator. Once the two parts
2

are mixed, setting time varies between 15 minutes to 2 hours, at which point they can be
formulated to adhere to most materials. These organic matrices have been used to
improve the performance of concrete for several decades. The strengths of the organic
matrices are their very low permeability, dimensional stability, and high elongation
before rupture. Although impermeability is strength in many applications of composites,
it is a weakness when they are used for concrete protection. Because they are completely
impermeable, the matrices are unable to release vapor pressure build-up within the
structure of concrete. Vapor pressure build-up is known to cause delamination of the
matrix and can be quite damaging to the concrete. (ACI Committee 515, 1986)
In an attempt to improve upon the performance of the organic matrices, a number
of inorganic matrices that contain polymer additives have been developed. The matrices
have permeability lower than concrete but are not totally impermeable. It is believed that
when used as a protective layer, the matrix can slow the ingress of water but at the same
time allow the vapor pressure to be released. The most widely used inorganic matrix thus
far has been a Portland cement based system. Because of the large grain sizes of the
cement, it has been difficult to develop thin and workable matrices. In addition to the
Portland cement based system, alumino silicate and phosphate based compounds are used
in inorganic matrices. The major advantages of these compounds are stability under UV
light, hardness and compatibility with concrete. A potassium alumino silicate, one of a
family of Geopolymer materials was used for the current project.
Reinforcing fibers for the composites are available in a wide variety of material
compositions and sizes. The common fiber types used in the construction industry are
carbon, glass, nylon, polyester and steel. In many applications, steel fibers would be
preferred because of their strength, stiffness and durability. In the current study, it is not
feasible to use steel fibers because the coatings are expected to be quite thin. Therefore,
only fine steel fibers would be acceptable. Micro steel fibers are available, but are quite
expensive and would impair the development of a cost effective system. Carbon fibers
are more expensive than glass and nylon fibers, but are the most durable. They are inert
and can be used with a number of matrices while withstanding temperatures up to 800°F.
Glass fibers deteriorate in alkali environments and nylon fibers are quite dense and
3

difficult to impregnate with the matrix. Each of the fibers is available in various forms:
micro fibers, discrete fibers 3 to 6 mm in length, tows, and fabrics.
For the current investigation, coatings based on polysilicates developed as a
polymer for use in composites were used. This matrix, which is water based, is non toxic,
cures at room temperature and was found to be durable under wet-dry and scaling
conditions. Various formulations were made using different alumina-silica ratios, micro
fibers and short discrete carbon fibers. The matrices were evaluated for working time and
curing temperatures ranging from 40°F to 70°F.
4
Chapter 2
Curing Temperature and Parent Surface Condition
The polymer used in this study is a two component system. The liquid, called
Component A, has to be mixed with a powder, called Component B, using a high shear
mixer. Typically, industrial strength drills with mixing blades that are used for mixing
two component polymers can be used in the field. The feasibility of this procedure was
demonstrated in one of the field applications described in Chapter 5. In the laboratory,
high shear mixers, known as choppers were used for mixing. Components A and B mix
to a thick paint consistency, which can be applied by brush, roller, or sprayer. These
application techniques were demonstrated both in the laboratory and in the field. The
coating dries in about 2 hours.
Based on the initial tests, it was assumed that if the ambient temperature is more
than 40°F, the surface can cure in 24 hours and can withstand rain in about 24 hours. The
upper limit is about 90°F. At temperatures higher than 90°F, the matrix looses
workability quickly. The working time or pot life at 70°F is about 2 hours. The pot life
reduces to about 1 hour at 90°F.
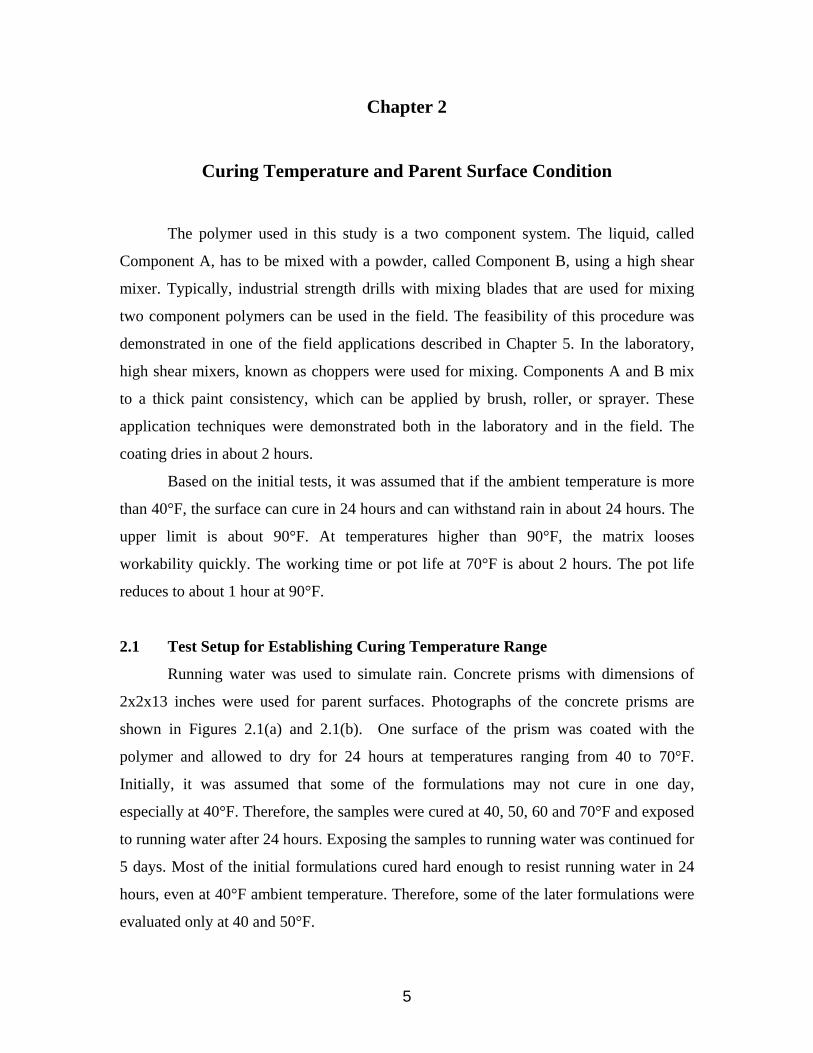
2.1 Test Setup for Establishing Curing Temperature Range
Running water was used to simulate rain. Concrete prisms with dimensions of
2x2x13 inches were used for parent surfaces. Photographs of the concrete prisms are
shown in Figures 2.1(a) and 2.1(b). One surface of the prism was coated with the
polymer and allowed to dry for 24 hours at temperatures ranging from 40 to 70°F.
Initially, it was assumed that some of the formulations may not cure in one day,
especially at 40°F. Therefore, the samples were cured at 40, 50, 60 and 70°F and exposed
to running water after 24 hours. Exposing the samples to running water was continued for
5 days. Most of the initial formulations cured hard enough to resist running water in 24
hours, even at 40°F ambient temperature. Therefore, some of the later formulations were
evaluated only at 40 and 50°F.
5

Figure 2.1(a) Concrete Prisms Coated with Geopolymer and Exposed to Running Water
Figure 2.1(b) Concrete Prisms Coated with Geopolymer and Exposed to Running Water
6

The major variables were: filler material type, filler volume fraction, fiber type
and fiber volume fraction. The filler materials were either ground zirconium sand or
titanium oxide powder. The fiber types were: micro fibers that were micrometers long
(called Woolastocote), carbon micro fibers that were less than 1mm long, 3mm long
carbon fibers, and 6mm long nylon fibers. The fiber volume fraction ranged from: 10 to
15 percent for micro fibers, 0.2 percent for nylon fibers, and up to 15 percent for carbon
fibers.
The various mixture combinations are presented in Table 2.1. In Table 2.1, White
SiO2 and AlSiO2 refer to two types of Component B (powder). White SiO2 consists of
only silica fume where as AlSiO2 contains both alumina and silica. MK is processed
Kaolin clay which is commercially available. The carbon powder refers to micro carbon
fibers that are less than 1mm long. The diameter of the 3 mm long carbon fibers is about
7 micrometers.
Other than erosion and cracks, the other response variables were reduction in
working time and consistency.
Table 2.1: Details of Matrix for Various Mixtures
Mix Number Composition
Mix 1 50g Liquid, 60g AlSiO2, 25g Woolastocote, 25g ZrSiO4 and 0.2g
nylon fibers
Mix 2 50g liquid, 67.5g White SiO2, 5g MK, 15g Woolastocote, 12g TiO2
liquid and 0.2g nylon fibers
Mix 3 50 g liquid,60g AlSiO2, 15g Woolastocote, 10g TiO2 powder and
0.2g nylon fibers
Mix 4 50g liquid, 60g White SiO2, 5g MK, 15g Woolastocote, 10g TiO2
powder and 0.2g nylon fibers
Mix 5 50g liquid, 60g White SiO2, 5g MK, 15g Woolastocote, 5g TiO2
powder, 5g TiO2 liquid and 0.2g nylon fibers
Mix 6 150g liquid, 180 AlSiO2, 60g Woolastocote, 60g ZrSiO4 and 0.6g
nylon fibers
7

Mix 7 100g liquid, 120g AlSiO2, 50g Woolastocote, 50g ZrSiO4
Mix 8 100g liquid, 120g AlSiO2, 50g Woolastocote, 20g TiO2 liquid, and
0.4g nylon fibers
Mix 9 100g liquid, 120g AlSiO2, 50g Woolastocote and 20g TiO2 liquid
Mix 10 100g liquid, 145g White SiO2, 10g MK and 30g Woolastocote
Mix 11 100g liquid, 145g White Sio2, 10g MK, 30g Woolastocote and 3g
Carbon fibers
Mix 12 100g liquid, 145g White Sio2, 10g MK, 30g Woolastocote, 14g
Carbon Powder and 3g Carbon fibers
Mix 13 100g liquid, 145g White Sio2, 10g MK, 30g Woolastocote, 28g
Carbon Powder and 3g Carbon fibers
Mix 14 100g liquid, 145g White Sio2, 10g MK, 30g Woolastocote, 15g
ZrSiO4, 28g Carbon Powder and 3g Carbon fibers
Mix 15 100g liquid, 127.1g White SiO2, 10g MK, 30g ZrSiO4 and 10g
Carbon Powder
Mix 16 100g liquid, 132.2g White SiO2, 10g MK, 25g ZrSiO4 and 15g
Carbon Powder
Mix 17 50g liquid, 69.6g White SiO2, 5g MK, 15g ZrSiO4, 1g Turmeric
powder and 2.5g Carbon Powder
Mix 18 50g liquid, 69.6g White SiO2, 5g MK, 15g ZrSiO4, 2g Turmeric
powder and 2.5g Carbon Powder
Mix 19 50g liquid, 69.6g White SiO2, 5g MK, 15g Woolastocote, 15g
ZrSiO4 and 2.5g Carbon Powder
Mix 20 50g liquid, 69.6g White SiO2, 5g MK, 15g Woolastocote, 15g
ZrSiO4, 2g Turmeric powder and 2.5g Carbon Powder
Mix 21 50g liquid, 69.6g White SiO2, 5g MK, 15g Woolastocote, 15g
ZrSiO4, and 2.5g Carbon Powder
8
Mix 22 50 g Liquid, 25g Geopolymer, 55g W210, 15g ZrSiO4 and 2.5g
Carbon Powder
Mix 23 50 g Liquid, 35.5g Geopolymer, 55g W210, 15g ZrSiO4 and 2.5g
Carbon Powder
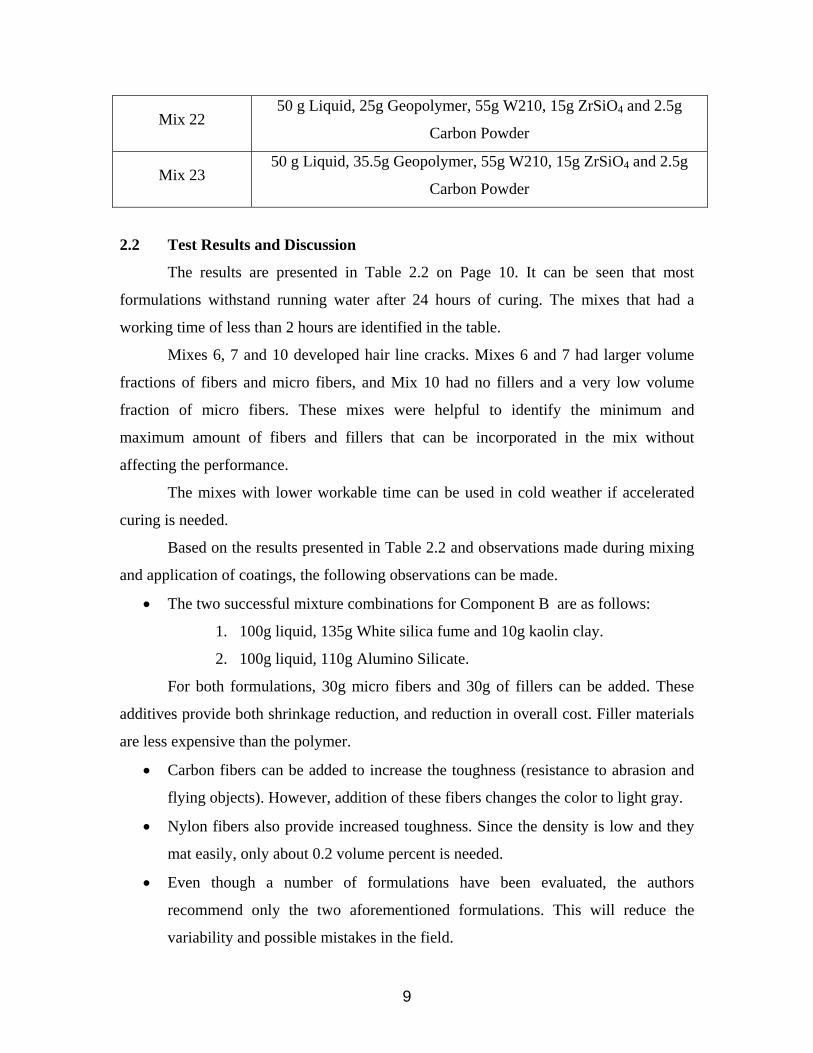
2.2 Test Results and Discussion
The results are presented in Table 2.2 on Page 10. It can be seen that most
formulations withstand running water after 24 hours of curing. The mixes that had a
working time of less than 2 hours are identified in the table.
Mixes 6, 7 and 10 developed hair line cracks. Mixes 6 and 7 had larger volume
fractions of fibers and micro fibers, and Mix 10 had no fillers and a very low volume
fraction of micro fibers. These mixes were helpful to identify the minimum and
maximum amount of fibers and fillers that can be incorporated in the mix without
affecting the performance.
The mixes with lower workable time can be used in cold weather if accelerated
curing is needed.
Based on the results presented in Table 2.2 and observations made during mixing
and application of coatings, the following observations can be made.
• The two successful mixture combinations for Component B are as follows:
1. 100g liquid, 135g White silica fume and 10g kaolin clay.
2. 100g liquid, 110g Alumino Silicate.
For both formulations, 30g micro fibers and 30g of fillers can be added. These
additives provide both shrinkage reduction, and reduction in overall cost. Filler materials
are less expensive than the polymer.
• Carbon fibers can be added to increase the toughness (resistance to abrasion and
flying objects). However, addition of these fibers changes the color to light gray.
• Nylon fibers also provide increased toughness. Since the density is low and they
mat easily, only about 0.2 volume percent is needed.
• Even though a number of formulations have been evaluated, the authors
recommend only the two aforementioned formulations. This will reduce the
variability and possible mistakes in the field.
9

• If the ambient temperature is more than 70°F, pot life can be extended by storing
the mixed polymer in a bed of ice. Typically, the bucket containing the polymer
can be placed in a large vessel that has ice cubes.
Table 2.2: Results of Tests (After 24 Hours of Curing) on Various Types of
Coatings and Different Curing Temperatures
Mix
Number
Number
of
Samples
Curing
temperatures Results
Mix 1 8 40, 50, 60, 70°F • No erosion and no cracks
Mix 2 8 40, 50, 60, 70°F • No erosion and no cracks
Mix 3 4 40, 50, 60, 70°F • No erosion and no cracks
Mix 4 4 40, 50, 60, 70°F • No erosion and no cracks
Mix 5 4 40, 50, 60, 70°F
• No erosion and no cracks
Mix 6 4 40, 50, 60, 70°F • Hairline cracks seen after three days
Mix 7 4 40, 50, 60, 70°F
• Hairline cracks seen after three days
• Good consistency and workability
compared to others
• Early setting compared to others
10

Mix 8 4 40, 50°F • Good workability and no cracks seen
Mix 9 4 40, 50°F • Good workability and no cracks seen
Mix 10 4 40, 50°F • Cracks appeared after two days
Mix 11 4 40, 50°F • No cracks
• Color lightened after three days
Mix 12 4 40, 50°F • No cracks
Mix 13 4 40, 50°F • No cracks
• Darker color then Mix 12
Mix 14 4 40, 50°F • No cracks
• Difficult to work with
Mix 15 4 40, 50°F
• Workability time more than 45
minutes at 70°F
• No cracks
Mix 16 4 40, 50°F • 30 minutes workability time
• No Cracks
Mix 17 4 40, 50°F
• 40 minutes workability time at 70°F
• No Cracks
• Looks like concrete
11

Mix 18 4 40, 50°F
• 40 minutes workability time at 70°F
• No Cracks
• Looks like concrete
Mix 19 4 40, 50°F • Workable
• No cracks
Mix 20 4 40, 50°F
• Workable
• No cracks
• More workable than Mix 19
Mix 21 4 40, 50°F • Workable
• No cracks
Mix 22 4 40, 50°F • No Cracks
Mix 23 4 40, 50°F • No Cracks
• Mixes 15, 17, 18, 20, 21-23 had a different hardener
• Mk - Processed kaolin clay
• TiO2 – Titanium dioxide
12

2.3 Parent Surface Types and Preparation
Different types of parent surfaces were evaluated using structures at the Rutgers
University, Livingston Campus. These were:
i. Smooth finish; top surface of a new high strength concrete slab with sheen
(almost polished surface) still present. Figure 2.2, below.
ii. Smooth finish of mortar on a relatively new wall (about 5-year old
surface), Figure 2.3, next page.
iii. Rough surface of an aged mortar wall (back of the Livingston Campus lab,
about 15-year old surface), Figure 2.4, next page.
iv. Rough surface with spalled areas (about 15 to 20 years old), Figure 2.5,
Page 15.
v. Very rough surface with exposed aggregated. In one surface more than
95% of the aggregated were exposed, Figure 2.6, Page 15.
All the surfaces were cleaned using low pressure water to remove excess dirt
build up. This was the only preparation. In all cases, the application was successful.
Figure 2.2 Application on a Smooth Surface
13

Figure 2.3 Application on a Vertical Wall, Relatively New Smooth Surface
Figure 2.4 Application on a 15 Year Old Aged Surface
14

Figure 2.5 Application on Rough Surface with Spalled Areas
Figure 2.6 Application on Very Rough Surface with 95% of the Aggregates Exposed
15

2.4 Method of Application
Most of the applications were done by using paint brushes. In addition two types
of sprayers, one a common commercial low cost sprayer and a custom made sprayer,
were also used. Since both sprayers were effective, the authors recommend the low cost
commercial unit for application. Based on the consistency and the flow through the
various nozzles used in this study, the authors expect that any sprayer used for epoxies
can be used for a Geopolymer matrix.
16

Chapter 3
Durability: Wet-Dry Conditions
3.1 Introduction
Continuous exposure to wet-dry conditions is detrimental to concrete used in
construction. The degradation is more rapid for structures located in marine environments
due to the presence of salt. Elements exposed to such environments are gradually
weakened and will eventually have to be replaced or repaired. Typically, concrete on the
exposed surface is weakened more rapidly than concrete within the structure. During
placement, the presence of water near the formwork makes the surface concrete weaker
because of an increase in the water-cement ratio resulting in faster degradation. Epoxy
coatings have been used to increase the durability of exposed surfaces. High strength
fibers made of aramid, glass or carbons have been used in conjunction with epoxies when
strengthening is required.
Epoxies and other organic matrices have been utilized as a protective coating for
several decades because they seal the surface of the concrete. Their main drawback is
their inability to release vapor pressure buildup that causes damage in the concrete and
delamination of the dried epoxy (ACI Committee 503, 1989). The results presented in
this chapter focus on the inorganic matrices that comprise the next generation of barrier
and strengthening systems. They are less permeable than concrete, thus slowing the flow
of water through the weakened exterior surfaces. Vapor pressure is released because the
matrices are not totally impermeable. In strengthening applications, the matrices form a
strong bond between the surface of the concrete and the fiber reinforcement.
The objective of this part of the investigation was to evaluate the effect of wet-dry
cycles found in marine environments. In barrier applications, the objective was to
evaluate the coatings and the durability of coated concrete. In strengthening applications,
the effectiveness of the matrices used in conjunction with carbon reinforcement was
studied.
17

3.2 Experimental Evaluation
The Geopolymer matrix was used to bond continuous carbon fibers in the form of tows or
fabrics. The reinforcement consisted of one, two or three tows, or one or two layers of
unidirectional fabric. The area of one carbon tow was 0.00286 in2 and the carbon fabric
had an area of 0.0115 in2. In addition, samples were strengthened with a discrete fiber
reinforced mix. The Geopolymer matrix was comprised of a potassium alumino silicate
solution and silica fume with no carbon contamination. The pure silica fume was needed
to obtain a matrix that could be used to wet the carbon fibers. The standard formulation
was as follows.
Liquid: 100g
Silica fume: 125g
Wetting Agent: 1g
3.2.1 Preparation of Concrete Prisms
Two mix proportions were used to prepare the concrete prisms. The dimensions
of the prisms were 2 X 2 X 13 inches. For the first concrete mix, the cement : fine
aggregate : course aggregate ratio was 1: 2.14 : 1.79. The maximum size of the course
aggregate was 0.375 in. The water/cement ratio was 0.5. This concrete was designated as
high strength concrete. For the second concrete mix, the cement: fine aggregate: course
aggregate ratio was 1 : 2.95 : 2.04. Again, the maximum size of the course aggregate was
0.375 in. and the water/cement ratio was 0.6. This mix was designated as the low strength
mix. The prisms were cast using 2 X 2 X 13 in. steel molds, covered with polyethylene
sheets and kept for 24 hours at room temperature and humidity. At the end of 24 hours,
the samples were removed from the molds and cured for 28 days in a room maintained at
100% relative humidity.
3.2.2 Application of Strengthening Systems
[The following procedure is similar to the procedure used for field applications as
recommended by ACI Committee 515]. The concrete prisms were sand blasted and
cleaned with a wire brush. Sand blasting was performed using silica quartz sand at a
pressure of 80 psi. Once the surface was cleaned, a thin layer of the inorganic matrix was
18

applied to fill the small air voids and to create a smooth surface. Pre-cut carbon tows and
sheets were impregnated with the matrix and placed on the prepared concrete surface and
bonded using grooved rollers. A second layer of the matrix was applied as a protective
coating. The samples were cured for 24 hours at room temperature, followed by 24 hours
at 80°C (176°F). The elevated temperature was used to ensure adequate curing in a two
day period. The accelerated curing was used to save time. The high strength concrete
prisms were used for the tests.
3.2.3 Test Procedure
Exposure to wetting and drying were the two major steps involved in testing the
samples. . A special set-up was built for exposing the samples to wetting and drying. The
samples were tested under flexure using a third point loading. The following sections
provide the pertinent details.
Wet-Dry Chamber
A special set-up was built for exposing the samples to wetting and drying. A 53 X
27 X 24 inch stainless steel basin containing the specimens was elevated to a height of 4
feet. A reservoir containing 25 gallons of a 3% saline solution was installed beneath the
basin. In an attempt to more closely duplicate marine environments, a commercial
product named Instant Ocean™ was used to prepare the 3% saline solution. A heater and
a temperature gage were attached to the salt water reservoir to insure that the water
remained at a constant temperature of 100°F. Elevated temperature was used to further
accelerate the deterioration process. The salt water was pumped from the reservoir to the
basin containing the samples by a pump installed outside the reservoir. A timing valve
attached to the drain of the basin controlled the flow of the water back into the reservoir.
An 18 inch fan was installed 2 feet above the basin to help circulate air during dry cycles.
After the test specimens were placed in the stainless steel basin, the timer was set
to allow for three hour wet and three hour dry cycles. At the beginning of each wet cycle,
the pump filled the basin to a level that totally submerged the samples with salt water
from the reservoir. After three hours, the basin’s drain valve opened allowing water from
the basin to drain back into the reservoir and the fan began to circulate air above the
19

basin. At the conclusion of the three hour dry cycle, the wet portion of the next cycle
began. Visual inspection confirmed the complete drying of the samples.
Flexure Test
Samples strengthened with carbon reinforcement were tested in flexure using a
three point bending test. The simply supported clear span was 12 inches. The load was
applied using an MTS testing machine with a 10,000 lb. capacity. The mid-span
deflection was measured using an LVDT. Both load and deflection were recorded by a
computer.
3.3 Test Variables and Results
The test samples consisted of the following:
• Two control samples
• Two samples strengthened with two or four percent (by weight) discrete
carbon fibers
• Two samples strengthened with one, two or three carbon tows
• Two samples strengthened with one or two layers of carbon fabric
For each variable, two samples were tested at 0, 50, and 100 cycles of exposure.
The objective was to determine whether discrete fibers would add strength and toughness
to plain concrete and whether it is possible to add continuous reinforcement (tows and
fabric) to plain concrete. In both cases, the wet-dry cycling provided the information on
durability. Note that the carbon fibers do not corrode and therefore the failure can only
occur because of the deterioration of the matrix or the interface.
The response variables were maximum strength, flexural stiffness and toughness.
All of these parameters were obtained from the load deflection response. Only the
strength results are presented in this report. The performance was similar for toughness
and flexural stiffness.
A comparison of the failure loads is shown in Figures 3.1 to 3.3, Pages 21 & 22.
For each case, these figures show the average result for the two tested samples. The
failure loads are presented as a factor of the failure load of the unexposed control sample.
Flexural strength of the control samples improved after exposure to wet-dry conditions.
20

In some cases, after 100 cycles of wet-dry, the failure load of the control samples had
increased by approximately 50 percent. This increase occurred because of continued
curing since the testing of the exposed samples was done at a later date.
In all cases, the strengthened samples were durable up to 100 cycles of wetting
and drying. The strength and ductility of the concrete samples was increased by the
application of the carbon composite system. Peak load and toughness factor values
increased as the area of the carbon reinforcement was increased. Effectiveness of the
strengthening system was not diminished by exposure to wet-dry conditions.
Figure 3.1 Comparison of Failure Loads: Control, 2 Percent and 4 Percent Discrete
Carbon Fibers
21

0
0.5
1
1.5
2
2.5
3
0 50 100Cycles of Wet-Dry
Failu
re L
oad
as a
Fac
tor o
f Une
xpos
ed
Con
trol S
ampl
e
Control1 Tow2 Tows3 Tows
Figure 3.2 Comparison of Failure Loads: Control, 1, 2 and 3 Carbon Tows
0
0.5
1
1.5
2
2.5
3
0 50 100Cycles of Wet-Dry
Failu
re L
oad
as a
Fac
tor o
f Une
xpos
ed
Con
trol S
ampl
e
Control1 Layer2 Layer
Figure 3.3 Comparison of Failure Loads: Control, 1 and 2 Carbon Fabric Layers
22

Chapter 4
Durability: Scaling Conditions
4.1 Introduction
The presence of stagnant or ponded water in cold weather environments will lead
to the eventual decay of concrete surfaces. Scaling is one of the results of repeated cycles
of freezing and thawing in hardened concrete. When the concrete is permeable, moisture
flows through the surface of the concrete into any existing voids. When the temperature
drops below 0°C, the absorbed water freezes and expands. This expansion causes stress
build up that leads to cracking and spalling of the concrete surface. Scaling occurs when
the expansion pressure of the ice exceeds the tensile strength of the concrete causing
localized fracture at the surface.
One possible solution to the problem of scaling in concrete is to apply a protective
coating that will cover existing micro-cracks. The coating should have a lower
permeability than the concrete. If the flow rate of water into the structure of concrete is
decreased, the damage caused by the freezing cycle can be slowed or prevented. The
inorganic matrices evaluated in Chapter 3 have excellent potential in such an application.
These matrices can also be used to bond glass or carbon reinforcement to structural
elements that need strengthening. Scaling of the surface of the concrete reduces the
effectiveness of the repaired structural elements. Deterioration weakens the bond between
the surface of the concrete and the carbon reinforcement and may result in delamination
and subsequent failure of the repair.
This chapter presents the results of the scaling resistance study, which is
conducted using inorganic matrices and carbon fibers. The system can be used for both
coating and strengthening.
4.2 Experimental Investigation
The effectiveness of the inorganic geopolymer matrix (described in Section 3.2)
as a surface protector for concrete was evaluated. The matrices were applied to both a
23

high and low strength mortar and subjected to scaling conditions. The matrices used as a
surface protector were evaluated using an ASTM rating system throughout the series of
scaling cycles (American Society for Testing and Materials, 1996).
Additionally, the effectiveness of a strengthening system consisting of an
inorganic matrix used in conjunction with several commercially available forms of
carbon (discrete fibers, continuous fiber tows, and fabrics) was studied. In strengthening
applications, the effectiveness of the matrix was studied using flexure tests after exposure
to scaling conditions. The strength tests were done for high strength concrete samples.
4.2.1 Sample Preparation
Preparation of the samples was done using the procedure described in Chapter 3.
First, 2 X 2 X 13 inch prisms were cast and cured. These prisms were coated with the
various matrices or strengthened with carbon reinforcement.
4.2.2 Scaling Test Set-Up
A special set-up was built for exposing the test samples to scaling conditions.
Rectangular dams were built to fit atop the coated surface of the specimens. The height of
the dams was one inch. The dams were attached to the coated surface of the samples with
a bead of water proof caulk. Saline solution was contained in the dams atop the samples
to a depth of one-fourth of an inch. A mixture of various form of salt, commercially
known as Instant Ocean™, was used in the saline solution to duplicate marine
environments. A schematic of the scaling test set-up is shown in Figure 4.1.
Figure 4.1 Schematic of Scaling Test Specimen
24

The scaling test described in ASTM C672 was designed to allow the completion of one
scaling cycle in a 24-hour period (American Society for Testing and Materials, 1993).
The samples with the dams containing the saline solution were placed in a freezing
chamber maintained at 0°F. At the end of this freezing cycle, which lasted for 8 hours,
the samples were removed from the freezing chamber and kept at room temperature for
16 hours. Therefore, one scaling cycle (freezing and thawing) took one day. At the
completion of five scaling cycles, the surfaces of the samples were rinsed and the saline
solution was replaced. The samples were exposed to a total of fifty scaling cycles. In
certain instances, the testing was discontinued prematurely because the deterioration of
the sample prevented containment of the saline solution.
4.2.3 Evaluation Procedure: Surface Condition
The barrier coatings were applied to protect the surface of the samples from the
damaging effects of repeated scaling cycles. Deterioration is confined to the surface of
the specimens, unlike in the wet-dry cycles where the concrete was weakened internally.
A visual evaluation of the samples was sufficient to determine the effectiveness of the
barrier coatings. The rating system described in ASTM C672 was used to evaluate the
specimens in this chapter. Scaling of the samples was quantified using the system shown
below.
(0): Little or no scaling
(1): very slight scaling (2): slight to moderate scaling
(3): moderate scaling
(4): moderate to severe scaling
(5): severe scaling
The samples were evaluated and photographed before exposure to scaling conditions.
Additional evaluations were made at the completion of every fifth scaling cycle.
4.3 Test Results: Surface Condition
The data obtained from the durability testing of concrete samples under scaling
conditions, evaluated with the rating system introduced in ASTM procedure C672, is
presented in Figures 4.2 and 4.3, next page. Performance of the low strength concrete
25

control samples (no coating) is presented in Figure 4.2. The first sample degraded to
Level 5 in 15 cycles and broke into pieces. The second sample degraded to Level 5 in 15
cycles and broke into pieces at 25 cycles. The performance of the coated samples for low
strength concrete is shown in Figure 4.3. One specimen did not develop any damage and
the second one reached moderate scaling at 30 cycles.
High strength concrete samples, with and without coating, did not develop any
surface or other damage after 50 cycles of scaling. Since this test method is very
subjective, strength tests were performed and the results are presented in the next section.
0123456
5 10 15 20 25 30 35 40 45 50
Cycles of Scaling
ASTM
Rat
ing Sample 1
Sample 2
Figure 4.2 Surface Condition of Samples Subjected to Scaling Conditions, Low
Strength Concrete and Control
0123456
5 10 15 20 25 30 35 40 45 50
Cycles of Scaling
ASTM
Rat
ing
Sample 1
Sample 2
Figure 4.3 Surface Condition of Coated Samples Subjected to Scaling Cycles,
Low Strength Concrete
26

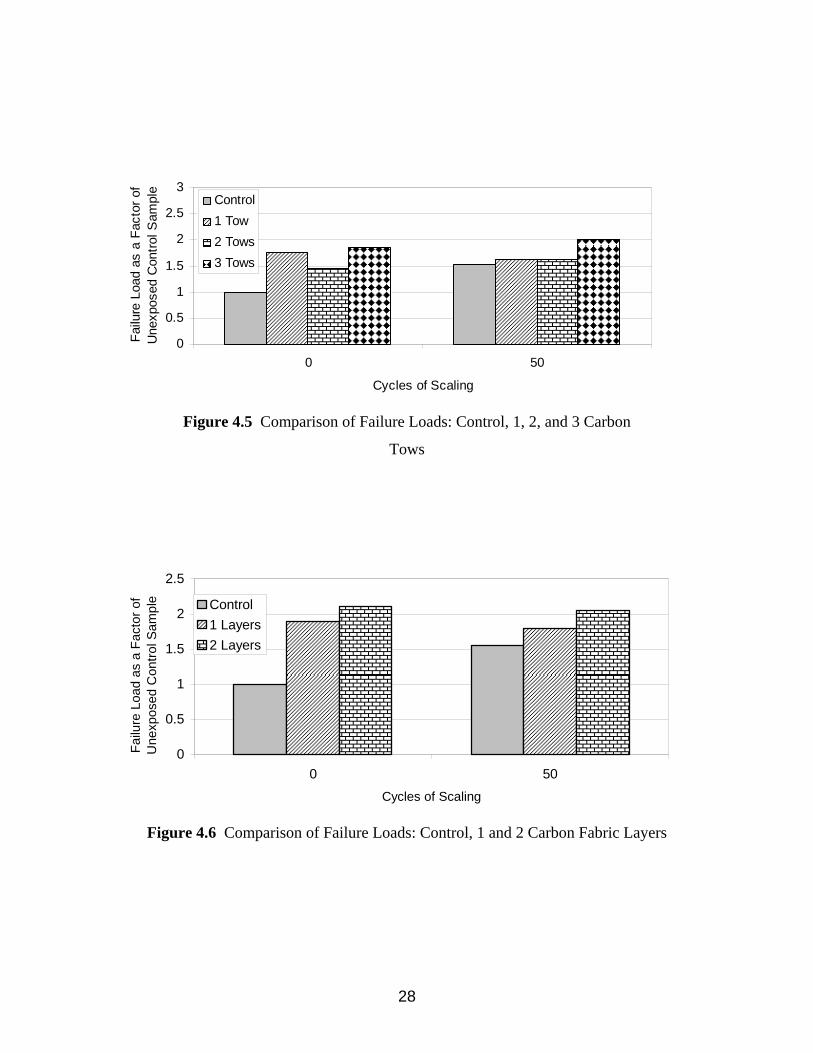
4.4 Test Results and Discussion: Strength Tests
Flexure testing was used to evaluate the strengthened samples exposed to scaling
conditions. The test procedure and set-up are described in Chapter 3, Section 3.2.3, of
this report. Evaluation was made at the completion of fifty scaling cycles. The data
obtained from the flexure testing of samples strengthened with carbon reinforcement is
shown in Figures 4.4 to 4.6, below and next page. Included in these figures are the
results obtained from the control samples and samples reinforced with chopped carbon
fibers, carbon tows and layers of carbon fabric. For each test variable, two samples were
tested. Figures 4.4 to 4.6 show the average result for the two tested samples. Unexposed
samples and samples exposed to fifty cycles of scaling were evaluated. The increase in
strength shown in these figures for the control samples at 50 cycles occurred because of
continued curing, since the testing of the exposed control samples was done at a later
date.
Insignificant changes in the flexural strength of the strengthened samples were
noted after exposure to the scaling conditions. Exposed strengthened samples maintained
at least 97 percent of their unexposed flexural strength.
The strengthening system comprised of layered carbon and the inorganic matrix
was proven to be durable in scaling environments. The carbon maintained a strong bond
with the concrete and delamination did not occur. The flexural properties of the exposed
samples were comparable to those of the unexposed samples.
00.5
11.5
22.5
3
0 50
Cycles of Scaling
Failu
re L
oad
as a
Fac
tor o
f U
nexp
osed
Con
trol S
ampl
e
Control
2 percent
4 percent
Figure 4.4 Comparison of Failure Loads: Control, 2 and 4 Percent
Discrete Carbon Fibers
27
0
0.5
1
1.5
2
2.5
3
0 50
Cycles of Scaling
Failu
re L
oad
as a
Fac
tor o
f U
nexp
osed
Con
trol S
ampl
e
Control1 Tow2 Tows3 Tows
Figure 4.5 Comparison of Failure Loads: Control, 1, 2, and 3 Carbon
Tows
0
0.5
1
1.5
2
2.5
0 50Cycles of Scaling
Failu
re L
oad
as a
Fac
tor o
f U
nexp
osed
Con
trol S
ampl
e Control1 Layers2 Layers
Figure 4.6 Comparison of Failure Loads: Control, 1 and 2 Carbon Fabric Layers
28

4.5 Summary
Exposure of scaling environments is detrimental to the surface of concrete
elements used in construction. In this chapter, the ability to prevent such degradation by
the application of a protective coating was studied. Because structural concrete of
various strengths is used in practice, high and low strength concrete mixes were used in
this investigation. The high strength concrete used in this investigation was able to resist
scaling without the application of a barrier coating. The low strength samples were
susceptible to surface damage when exposed to the scaling conditions. The destruction of
the surface of the low strength samples was significantly slowed or prevented by the
application of the Geopolymer coating.
The effectiveness of strengthening applications using high strength fibers can be
hampered by exposure to scaling environments. The system studied in this chapter was
comprised of inorganic matrix and various forms of carbon. The results obtained from the
flexure testing of these samples indicate that the system is resistant to scaling conditions.
The flexural strength and ductility of the specimens were determined before and after
exposure to the scaling conditions. Comparable results were observed regardless of the
type of carbon reinforcement used.
29

Chapter 5
Field Durability Study and Demonstration Applications
5.1 Field Durability Study
Durability under field (outside exposure) conditions was evaluated using two
locations at the Rutgers University Campus in New Brunswick, New Jersey. The first
location, at the Livingston Campus also served as a test bed for application of the
geopolymer coating to surfaces with different levels of deterioration. A total of 18 test
applications were made. Most of the surfaces were on vertical walls and some of them
were on a relatively smooth concrete surface, Figures 2.2 - 2.6, Pages 13 -15. In the case
of vertical walls, the surface deterioration varied from a weathered but good concrete
surface to completely spalled (with exposed aggregate) surface, Figure 2.6, Page 15.
In addition to surface deterioration, a second major variable was fiber type and
fiber volume content. Both micro and discrete fibers were evaluated at volume fractions
ranging from 0.5 to 20%. These applications also served as demonstration projects
confirming that very little surface preparation is needed. All these surfaces were cleaned
with low pressure water and allowed to dry to saturated surface dry conditions before
applying the coating. All but two coatings were applied using paint brushes. One coating
was applied using a custom made sprayer and another coating was applied using an
inexpensive sprayer. The coatings were applied between March and November to
evaluate the influence of temperature range.
The second set of coatings was applied on the curbs of a parking lot on Busch
Campus, Figures 5.1(a), 5.1(b) and 5.1(c), next page and Page 32. These curbs had a
good surface except in one case; part of the curb was broken. The surfaces were simply
wetted before the application of the coating. In these applications, the coatings were
subjected to snow exposure and abrasion of snow removal equipment. There was also
abrasion due to sand or dust particles blown by the wind.
Experience gained during these applications was used to formulate the
recommended application procedure presented in Appendix A. These applications
30

confirmed the earlier findings, that the coating can be applied on a pre-wetted surface at
ambient temperatures between 40° and 90° F. After mixing, the geopolymer matrix can
be stored in cold temperatures to increase the pot life. The coated surface becomes dry
after 4 hours and can resist a moist environment, including fog and drizzle. In one case, it
rained 2 hours after the application but the coating was not affected.
Figure 5.1(a) Coating on Concrete Curb on Busch Campus
Figure 5.1(b) Coating on Concrete Curb on Busch Campus, the Second Set
31

Figure 5.1(c) Coating on Concrete Curb on Busch Campus, a Close Up View
5.2 Field Applications on Transportation Structures
Field applications consisted of: (1) Coating a New Jersey Barrier in Trenton, N.J.,
(2) Coating a guide rail near Trenton, (3) coating a retaining wall on Route 18 in New
Brunswick, (4) Coating a New Jersey Barrier near an ocean front in Rhode Island, and (5)
Coating of curbs and a retaining wall on Route 1 and Route 295 near Providence, Rhode
Island.
The coating application on Route 1, Trenton was carried out with the cooperation
of NJDOT engineers and field personnel, see Figure 5.2, next page. The NJDOT
provided traffic control and pre-wetting. Graduate students and NJDOT field personnel
applied the coating with paint brushes.
The retaining wall coating on Route 18 was applied in November 2000 and
covered about 10 square feet. This coating contained only micro fibers and was applied
using paint brushes on the pre-wetted surface.
The coatings in Rhode Island were applied in October 1998 and April 1999 (see
curb, Figure 5.3, next page). Coatings on NJ barriers and curbs were applied using paint
brushes and the coating on the retaining wall was applied using a power sprayer. The
retaining wall on which the coating was power sprayed covered several hundred square
feet.
32

All the applications on the concrete surfaces are performing well. The first
application is about 8 (in 2008) years old. The coating application to the guide rail in
Trenton, N.J. was not successful.
These projects demonstrated the viability of field application using paint brushes
and a power sprayer.
Figure 5.2 Coating on Route 1 South, Close-Up View
Figure 5.3 Application of Coating on Curb in Rhode Island
33

Chapter 6
Conclusions
This report focus on the development of an inorganic geopolymer matrix that can
be used both as a protective coating and also as a strengthening coating with the addition
of micro, discrete, and continuous carbon fibers and carbon fabrics. Durability studies led
to the following conclusions.
• The geopolymer coating is durable in wetting and drying conditions.
Concrete samples coated with carbon reinforced geopolymer did not degrade
after 100 cycles of wetting and drying.
• Under scaling conditions, the geopolymer coating slowed or prevented
damage to the surface of the coated concrete samples.
Evaluation of plain concrete strengthened with an inorganic geopolymer coating
and subjected to wetting & drying and scaling conditions led to the following
conclusions.
• The inorganic matrix in combination with carbon tows and carbon fabrics can
be used to strengthen plain concrete members.
• Wetting and drying conditions (100 cycles) do not decrease the strength of
samples coated with carbon reinforced geopolymer.
• Strengthened samples exposed to scaling conditions had a small (about 3%)
decrease in strength from their unexposed strength.
Evaluation of the geopolymer matrix for field applications, which is the main
focus of this study, led to the following conclusions:
• The geopolymer coating can be applied in the ambient temperature range of
40 to 90° F. At temperatures higher than 80°F, the pot life might be less than 2
hours.
34

• The coated surface should be protected from direct rain or running water for
the first 24 hours.
• The coating should not be subjected to freezing in the first 24 hours.
• The geopolymer coating can be applied to new or weathered concrete surfaces
that have exposed aggregates.
• The surface should be pre-wetted. Loose and oily materials should be
removed. Light dust will not reduce the adherence of the geopolymer coating
material.
• The geopolymer coatings are durable in field conditions. The oldest
application, under saltwater exposure conditions in Rhode Island, is 9 (in
2008) years old.
35

Appendix A
Guidelines for Application of Inorganic Geopolymer Coating
Surface Preparation
The coating can be applied on both good and weathered surfaces. Loose dirt and
oily build-ups should be removed. The surface should be pre-wetted to saturated surface
dry condition.
Material and Equipment Needed
The Geopolymer matrix is supplied as a two component system. The liquid Part A
should be mixed with powder Part B using a high shear mixer or mixing blades attached
to industrial strength drills used for mixing paints or polymers. Fibers can be added
during the mixing.
Mixing Procedure
Part A, Part B and any additives, such as fibers, should be mixed to a uniform
paint like consistency.
Application Procedure
The coating can be applied using a brush, roller, or sprayer. Inexpensive slurry
systems used for spraying stucco or cement slurry can be used.
Protection for the First 24 Hours
The coated surface should be protected against heavy rain, running water, and
freezing for the first 24 hours. The coating will cure to a hard surface in dry or foggy
conditions.
Temperature range for application is 40° F to 90° F.
36

Bibliography
ACI Committee 318. (1999.) Building Code Requirements for Reinforced Concrete, ACI
Standard 318-99, Section 8.5.1, American Concrete Institute, Detroit, MI.
ACI Committee 440. (1996). “State-of-the-Art Report on Fiber Reinforced Plastic (FRP)
Reinforcement in Concrete Structures,” ACI Standard 440R-96, American Concrete
Institute, Detroit, MI, 68pp.
ACI Committee 503. (1989). “Use of Epoxy Compounds with Concrete,” ACI Standard
503-89, American Concrete Institute, Detroit, MI, 28 pp.
ACI Committee 515. (1986). “A Guide to the Use of Waterproofing, Damp Proofing,
Protective, and Decorative Barrier Systems for Concrete,” ACI Standard 515-86,
American Concrete Institute, Detroit, MI, 44 pp.
ACI Committee 548. (1995). “State-of-the-Art Report on Polymer Modified Concrete,”
ACI Standard 548-95, American Concrete Institute, Detroit, MI, 47 pp.
American Society for Testing and Materials (1993). “Standard Test Method for Scaling
Resistance of Concrete Surfaces Exposed to De-icing Chemicals.” Standard C-672,
Section 4, Volume 2, pp. 345-347.
American Society for Testing and Materials (1993). “Resistance of Concrete to Rapid
Freezing and Thawing.” Standard C-666A, Section 4, Volume 2, pp. 326-331.
Balaguru, P., Kurtz, S., and Rudolph, J. (1996). “Geopolymer for Repair and
Rehabilitation of Reinforced Concrete Beams,” Civil Engineering Report 96-14, Rutgers
University, 19pp.
37

Balaguru, P., Shah, S.P. (1992.) Fiber Reinforced Cement Composites, McGraw-Hill,
New York, NY, 535pp.
Balaguru, P., Slattum, K. (1995.) “Test Methods for Durability of Polymeric Fibers in
Concrete and UV Light Exposure,” American Concrete Institute - Special Publication
Number 155, Detroit, MI, pp. 115-136.
Bean, D.L. (1988.) “Surface Treatments to Minimize Concrete Deterioration: Survey of
Field and Laboratory Applications and Available Products,” Technical Report
REMR_CS-17, Report 1, U.S. Army Engineer Waterways Experiment Station,
Vicksburg, MS.
Berset, J.D. (1992.) “Strengthening of Reinforced Concrete Structures for Shear Using
Composite Materials,” M.S. Thesis, Massachusetts Institute of Technology.
Carter, P.D. (1989.) “The Use of Penetrating Sealers on Concrete Bridge Decks,”
Proceedings of the Sessions Related to Structural Materials at Structures Conference
1989, San Francisco, CA, pp. 292-302.
Chajes, M.J., Mertz, D.R., and Thomson, J.R. (1994.) “Durability of Composite Material
Reinforcement,” Proceedings of the Third Materials Engineering Conference, ASCE, pp.
598-605.
Davidovits, J. (1991.) “Geopolymers: Inorganic Polymeric New Materials,” Journal of
Thermal Analysis, Volume 37, pp. 1633-1756.
Davidovits, J., and Davidovics, M. (1991.) “Geopolymer: Ultra High Temperature
Tooling Material for the Manufacture of Advanced Composites,” 36th International
SAMPE Symposium, June 30 – May 5.
38

Dolan, C., Rizkalla, S., and Nanni, A., (editors, 1999.), Fiber Reinforced Polymer
Reinforcement for Reinforced Concrete Structures, American Concrete Institute – Special
Publication Number 188, Detroit, MI, 1152 pages.
Ehsani, M.R., Saadatmanash, H., Abdelghany, I.H., and Elkafrawy, W. (1993.) “Flexural
Behavior of Masonry Walls Strengthened With Composite Fabrics,” American Concrete
Institute – Special Publication Number 128, Detroit, MI, pp. 492-507.
Foden, A., Balaguru, P., and Lyon, R. (1996A.) “Mechanical Properties and Fire
Response of Geopolymer Structural Composite,” 41st International SAMPE Symposium,
May 30 – June 3.
Foden, A., Balaguru, P., and Lyon, R. (1996B.) “Mechanical Properties of Carbon
Composites Made Using an Inorganic Polymer,” ANTEC, pp. 3013-3018.
Foden, A., Balaguru, P., Lyon, R., and Davidovits, J. (1997.) “Flexural Fatigue
Properties of an Inorganic Matrix-Carbon Composite,” 41st International SAMPE
Symposium, May 29 – June 2.
Foden, A., Lyon, R., and Balaguru, P. (1996.) “A High Temperature Inorganic Resin for
Use in Fiber Reinforced Composites,” Proceedings of the First International Conference
on Composites in Infrastructure, NSF, Tucson, Arizona, pp. 166-177.
Gomez, J., and Casto, B. (1996.) “Freeze-Thaw Durability of Composite Materials,”
Proceedings of the First International Conference on Composites in Infrastructure, NSF,
Tucson, Arizona, pp. 947-955.
Hamid, J., Larralde, J., and Salama, A. (1993.) “Properties of Hollow Concrete Masonry
Reinforced with Fiberglass Composite,” American Concrete Institute – Special
Publication Number 128, Detroit, MI.
39
Harmon, T.G. and Slattery, K.T. (1992.) “Advanced Composite Confinement of
Concrete,” Proceedings of the First International Conference on Advanced Composite
Materials in Bridges and Structures, Sherbrooke, Quebec, Canada, pp. 299-306.
Huang, G.G. (1995.) “An Inorganic Polymer for Use in Fiber Composites,” Special
Project Report Submitted to Rutgers, The State University, May 1995, 73 pp.
Husbande, T.B., and Causey, F.E. (1989.) “Surface Treatments for Concrete,”
Proceedings of the Sessions Related to Structural Materials at Structures Congress 1989,
pp. 282-291.
Javed, S., Kumar, S.V., and GangaRao, V.S. (1996.) “Experimental Behavior of
Concrete Beams with Externally Bonded Carbon Fiber Tow Sheets,” Presented at the
51st Annual Meeting of SPI/CI Conference & Exposition.
Lavelle, J.A. (1988.) “Acrylic Latex-Modified Portland Cement,” ACI Materials Journal,
Volume 85, Number 1, Jan-Feb 1988, pp. 41-48.
Li, M.W., Saadatmanash, H., and Ehsani, M.R. (1992.) “Behavior of Externally
Confined Concrete Columns,” Proceedings of the Materials Engineering Congress,
Atlanta, Ga, pp. 677-690.
Lyon, E., Sorathia, U., Balaguru, P., Foden, A., and Davidovits, J. (1996.) “New Fire
Safe Material for Cabin Interiors,” AGARD Conference Proceedings, 587, pp. 27.1-27.8.
Lyon, R., Sorathia, U., Balaguru, P., and Foden, A. (1996.) “Fire Response of
Geopolymer Structural Composites,” Proceedings of the First International Conference
in Composites in Infrastructure, NSF, Tucson, Arizona, pp. 972-981.
Lyon, R E. Balaguru, P N. Foden, A. Sorathia, U. Davidovits, J. Davidovics, M. (1997.)
“Fire-resistant Alumino Silicate Composites,” Fire & Materials, Volume 21, Number 2,
Mar-Apr 1997, pp. 67-73.
40

Marusin, S.L. (1989.) “Enhancing Concrete Durability by Treatment with Sealers,”
Proceedings of the Sessions Related to Structural Materials at Structures Congress 1989,
pp. 270-281.
Marusin, S.L. (1987.) “Improvement of Concrete Durability Against Intrusion of
Chloride Laden Water by Using Sealers, Coatings, and Various Admixtures,” American
Concrete Institute – Special Publication Number 100.
M’Ba Zaa, I., Missihoun, M., and Labossiere (1996.) “Strengthening of Reinforced
Concrete Beams with CFRP Sheets,” Fiber Composites in Infrastructure, 1996, pp. 746-
759.
Meier, U. (1987.) “Bridge Repair with High Performance Composite Materials,”
Material UND Technik, Vol. 4, pp. 125-128.
MPA (Committee report) (1987.) “Bonding of Steel and GFRP Plates in the Area of
Coupling Joints, Talbruk Kattenbusch,” Federal Institute for Material Testing (MPS),
Braunschweig, Research Report No. 312611429.
Nanni, A., Editor, Fiber Reinforced Plastic (FRP) Reinforcement for Concrete Structures:
Properties and Applications, Elsevier Science Publishers, B.V., 450pp.
Nakamura, M., Sakai, H., Yagi, K., and Tanaka, T. (1996.) “Experimental Studies on the
Flexural Reinforcing Effect of Carbon Fiber Sheet Bonded to Reinforced Concrete
Beam,” Fiber Composites in Infrastructure, pp. 746-759.
Plevris, N., and Triantafillou, T.C. (1994.) “Time-dependent Behavior of RC Members
Strengthened with FRP Laminates,” Journal of Structural Engineering-ASCE, Volume
120, Number 3, March 1994, pp. 1016-1042.
Plevris, N., Triantafillou, T.C., and Veneziano, D. (1995.) “Reliability of RC Members
Strengthened with CFRP Laminates,” Journal of Structural Engineering-ASCE, Volume
121, Number 7, July 1995, pp. 1037-1044.
41

Priestley, M.J.N., Seible, F., and Fyfe, E. (1992.) “Column Seismic Retrofit Using
Fiberglass/Epoxy Jackets,” Proceedings of the First International Conference on
Advanced Composite Materials in Bridges and Structures, Sherbrooke, Canada, pp. 287-
298.
Rahman, A.H., Kingsley, and Crimi, J. (1996.) “Durability of a FRP Grid
Reinforcement,” Proceedings of the Second Annual International Conference on
Advanced Composite Materials in Bridges and Structures, Montreal, Canada, pp. 681-
690.
Ritchic, P.A., Thomas, D.A., Lu, L.W., and Connelly, G.M. (1991.) “External
Reinforcement of Concrete Beams Using Fiber Reinforced Plastics,” American Concrete
Institute Structural Journal, Volume 88, Number 4, pp. 490-500.
Saadatmanash, H., and Ehsani, M. (1991.) “RC Beams Strengthened with GFRP Plates:
Part I Experimental Study,” Journal of Structural Engineering-ASCE, Volume 117,
Number 10, pp. 3417-3433.
Saadatmanash, H., and Tannous, F. (1998.) “Durability of Fiber Reinforced Plastic
(FRP) Rebars and Tendons in Aggressive Environments,” Repair and Rehabilitation of
Reinforced Concrete Structures, ASCE, pp. 120-133.
Sadatmanesh, H., and Ehasani, M., Editors. (1996.) Fiber Composites in Infrastructure,
Second International Conference on Composites in Infrastructure, Tucson, Arizona,
January 5-7, 1999.
Sen, R., Mariscal, D., and Shahawy, M. (1993.) “Durability of Fiberglass Pretensioned
Beams,” ACI Structural Journal, Volume 90, Number 5, Sep-Oct 1993, pp. 525-533.
Soudki, K.A., and Green, M.F. (1996.) “Freeze-Thaw Durability of Concrete Beams
Strengthened with Carbon Fiber Sheets,” ACI Fall Convention, New Orleans, November
1996.
42

43
Toutanji, H., and Balaguru, P., "Durability of Carbon and Glass Fiber Reinforced
Concrete," Journal of Materials Engineering, ASCE, Volume 10, February 1998, pp. 52-
57.
Toutanji, H.A., and Gomez, W. (1997.) “Durability Characteristics of Concrete Beams
Externally Bonded with FRP Composite Sheets,” Cement and Concrete Composites,
Volume 19, pp. 351-358.
Walters, P.G. (1992.) “VAE Redisposable Powder Hydraulics Cement Admixtures,”
Concrete International, Volume 14, Number 4, pp. 30-34.
Recommended