SCUOLA DI DOTTORATO TERRA AMBIENTE E BIODIVERSITÀ
Dipartimento di Scienze Agrarie e Ambientali Produzione Territorio
Agroenergia
Ph.D. in Agricultural Ecology
XXV Cycle
Field-scale assessment of nutrient and soil losses during
surface runoff events, in an Oltrepò Pavese (southern
Lombardy – Italian region) vineyard hill
Ettore Bernardoni
N° R08075
Supervisor
Prof. Marco Acutis
Academic Year
2011-2012
Coordinator
Prof. Graziano Zocchi
UNIVERSITÀ DEGLI STUDI DI MILANO
Department of Agricultural and Environmental


Università degli Studi di Milano
Dipartimento di Scienze Agrarie e Ambientali Produzione Territorio
Agroenergia
Via Celoria 2, 20133 Milan – Italy
Titolo in Italiano: “Valutazioni a scala di campo della perdita di nutrienti
e di suolo in occasione di eventi deflusso superficiale, in un vigneto dell’
Oltrepò Pavese
Tesi di Dottorato in Ecologia Agraria
XXV Ciclo, Anno Accademico 2011-2012
UNIVERSITÀ DEGLI STUDI DI MILANO
Department of Agricultural and Environmental


Ph.D. in Agricultural Ecology - XXV Cycle
Ettore Bernardoni
Bernardoni, E., 2012. Field-scale assessment of nutrient and soil losses
during surface runoff events, in an Oltrepò Pavese (southern
Lombardy – Italian region) vineyard hill. Ph.D. Thesis, University of
Milan, pp. 112.
The aim of my Ph.D. work was to investigate sediment transport and
nutrient content in runoff water from an agricultural system.
The study was carried out in a representative sites of the Oltrepò Pavese,
in Lombardy region (northern Italy) in a vineyard equipped with
instruments for measuring volume and rate of runoff and collecting
samples to determine the amount of soil loss related to each rainfall
event. The site was equipped with a weather station, which included a
recording rain gauge.
The analysis was done under natural rainfall condition during the period
December 2008 - December 2012, in which 15 rainfall events were
recorded.
The first step of the research was to equip the field plot with a collection
system. An in-field runoff multislot collector, exploitable for monitoring
UNIVERSITÀ DEGLI STUDI DI MILANO
Department of Agricultural and Environmental

nutrients, pesticides and sediments loadings in runoff, was installed in the
field and was improved with a home made level reading system able to
measure with high temporal resolution, the runoff rate variation.
Subsequently every runoff event was investigated. Samples were taken
and analysed for quantifying the sediments loaded from runoff event and
the nutrient losses from the system. Samples were also analysed with a
laser diffraction technique in order to characterize, in natural conditions,
the distribution of sediment grain-size transported by rainfall runoff.
Credits evaluation
• Courses:
Elements of statistics.
Instrumental analysis.
Image analysis
• Attendance at international/national congress:
XI Convegno Nazionale di Agrometeorologia, (Italy)
XVI Nitrogen Workshop: Connecting different scales of nitrogen use in
agriculture. June 28th – July 1st 2009, Turin, Italy.
17th Nitrogen Workshop, Wexford (Ireland), June 26th – 29th
• Poster presentation at international/national congress:
Perego A., Brenna S., Carozzi M., Bernardoni E., Giussani A., Acutis M. Model estimation of nitrogen leaching under derogation measures on organic nitrogen fertilization of intensive cropping system in Lombardy (northern Italy). Proceedings of the 17th

Nitrogen Workshop, Wexford (Ireland), June 26th – 29th,1 2012: 150-151.
Carozzi M., Bernardoni, E., Fumagalli M., Acutis, 2011. “Analisi del contenuto idrico del suolo per due differenti sistemi di irrigazione”. Atti del XIV Convegno Nazionale di Agrometeorologia, Bologna, 7-8-9 Giugno 2011: 41-42.
Bernardoni, E., Carozzi M., Fumagalli M., Acutis M., 2011. “Tecnica di misura dei fenomeni di ruscellamento superficiale”. Atti del XIV Convegno Nazionale di Agrometeorologia, Bologna, 7-8-9 Giugno 2011: 99-100.
Perego, A., Acutis, M., Carozzi, M., Bernardoni, E., Brenna, S., 2010. Model forecast of N dynamics in Po Plain under different cropping systems provided for EU Nitrates Directive derogation. Proceedings of the 12th Congress of the European Society for Agronomy, Montpellier (Italy), August 29th-September 3rd: 379-380.
Perego, A., Fumagalli, M., Carozzi, M., Bernardoni, E., Brenna, S., Pastori, M., Acutis, M., 2009. Regional application of ARMOSA model to estimate nitrate leaching. Proceedings of the 16th Nitrogen Workshop, Turin (Italy), June 28th – July,1st 2009: 553-554.
• Publication:
Bernardoni E., Acutis M., Ventrella D., 2012. Long-term durum wheat monoculture: modeling and future projection. Italian Journal of Agronomy, 7, 86-92.
Bernardoni E., Carozzi M., Acutis M., 2012. Technical approach for the measurement of surface runoff. Italian Journal of Agrometeorology, 1, 29-34.
Perego A., Brenna S., Carozzi M., Bernardoni, E., Giussani A., Acutis M. Model estimation of nitrogen leaching under derogation measures on organic nitrogen fertilization of intensive cropping system in Lombardy (northern Italy). Proceedings of the 17th Nitrogen Workshop, Wexford (Ireland), June 26th – 29th,1 2012: 150-151.

Ruggieri S., Acutis, M., Bernardoni, E., Rinaldi M., 2011. “Un sistema di supporto alle decisioni per la gestione delle risorse idriche a scala comprensoriale”. Atti del XIV Convegno Nazionale di Agrometeorologia, Bologna, 7-8-9 Giugno 2011: 25-26.
Carozzi M., Bernardoni, E., Fumagalli M., Acutis, 2011. “Analisi del contenuto idrico del suolo per due differenti sistemi di irrigazione”. Atti del XIV Convegno Nazionale di Agrometeorologia, Bologna, 7-8-9 Giugno 2011: 41-42.
Bernardoni, E., Carozzi M., Fumagalli M., Acutis M., 2011. “Tecnica di misura dei fenomeni di ruscellamento superficiale”. Atti del XIV Convegno Nazionale di Agrometeorologia, Bologna, 7-8-9 Giugno 2011: 99-100.
Acutis, M., Perego, A., Bernardoni, E., Rinaldi, M., 2010. AQUATER software as a DSS for irrigation management in semi-arid Mediterranean areas. Italian Journal of Agronomy 5, 205-215.
Perego, A., Acutis, M., Carozzi, M., Bernardoni, E., Brenna, S., 2010. Model forecast of N dynamics in Po Plain under different cropping systems provided for EU Nitrates Directive derogation. Proceedings of the 12th Congress of the European Society for Agronomy, Montpellier (Italy), August 29th-September 3rd: 379-380.
Carozzi, M., Ferrara, R. M., Bernardoni, E., Bassi, L., Brenna, S., Acutis, M., 2010. Emissione di ammoniaca da suoli agricoli: approccio a diffusione passiva. Atti del XIII Convegno Nazionale di Agrometeorologia, Bari, 8-10 giugno 2010. Italian Journal of Agrometeorology: pp. 93-94.
Carozzi, M., Ferrara R.M., Martinelli, N., Di Tommasi, P., Bertolini, T., Bernardoni, E., Brenna, S., Acutis, M., 2009. Valutazione delle emissioni di ammoniaca da suoli agricoli in Lombardia: possibili approcci. Atti XXXVIII Convegno della Società Italiana di Agronomia, 21-23 settembre 2009, Firenze, pp. 301-302.
Perego, A., Fumagalli, M., Carozzi, M., Bernardoni, E., Brenna, S., Pastori, M., Acutis, M., 2009. Regional application of ARMOSA model to estimate nitrate leaching. Proceedings of the 16th Nitrogen Workshop, Turin (Italy), June 28th – July,1st 2009: pp. 553-554.

• Publication in regional research notebook:
Acutis, M., Bechini, L., Fumagalli, M., Perego, A., Carozzi, M., Bernardoni, E., Brenna, S., Pastori, M., Mazzetto, F., Sali, G., Vidotto, F., 2008. “Gestione dell’azoto sostenibile a scala aziendale, Itinerari tecnici – Progetto GAZOSA”. Regione Lombardia quaderno della ricerca n. 94.
Nitrati: come gestirli. Schede informative sulla gestione dei nitrati a scala aziendale.
http://www.ersaf.lombardia.it/upload/ersaf/NITRATI/03_00_presentazione.html
Gestione dell'azoto sostenibile a scala aziendale. Itinerari tecnici - Progetto GAZOSA. Quaderni della ricerca n. 94 - ottobre 2008
Supervisor:
Prof. Marco ACUTIS
Coordinator:
Prof. Graziano ZOCCHI
UNIVERSITÀ DEGLI STUDI DI MILANO
Department of Agricultural and Environmental


“The nation that destroys its soil destroys itself”
Franklin D. Roosevelt
"The threat of nuclear weapons and man's
ability to destroy the environment are really
alarming. And yet there are other almost
imperceptible changes - I am thinking of the
exhaustion of our natural resources, and especially
of soil erosion - and these are perhaps more
dangerous still, because once we begin to feel their
repercussions it will be too late."
The Dalai Lama


13
CONTENTS:
INTRODUCTION ............................................................ 17
1.1. SOIL EROSION BY WATER ........................................................................ 18
1.2. RUNOFF AND NUTRIENTS ....................................................................... 20
1.3. RESEARCH FRAMEWORK .......................................................................... 22
1.4. SYNOPSIS .................................................................................................... 22
1.5. NOTES ........................................................................................................ 23
TECHNICAL APPROACH FOR THE MEASUREMENT
OF SURFACE RUNOFF .................................................. 25
2.1. ABSTRACT .................................................................................................. 26
2.2. INTRODUCTION ........................................................................................ 26
2.3. MATERIALS AND METHODS ................................................................... 28
2.3.1. Study area and site ............................................................................ 28
2.3.2. Multislot divisor ................................................................................ 29
2.3.3. Collection tanks ................................................................................ 29
2.3.4. Level reading system ........................................................................ 31
2.3.5. Field arrangement ............................................................................. 34
2.3.6. Field installation ............................................................................... 34
2.3.7. Operation .......................................................................................... 35
2.3.8. Calibration ......................................................................................... 36
2.4. RESULTS ..................................................................................................... 37
2.4.1. Calibration ......................................................................................... 37
2.4.2. Cost .................................................................................................... 38
2.5. CONCLUSIONS ........................................................................................... 39

14
NUTRIENT LOSSES BY RUNOFF IN A VINEYARD
OF THE OLTREPÒ PAVESE (SOUTHERN
LOMBARDY – ITALIAN REGION) ............................... 43
3.1. ABSTRACT ................................................................................................... 44
3.2. INTRODUCTION ......................................................................................... 44
3.3. MATERIALS AND METHODS ..................................................................... 47
3.3.1. Site description .................................................................................. 47
3.3.2.Plot characteristics ............................................................................. 48
3.3.3. Rainfall and runoff data ................................................................... 48
3.4. RESULTS ..................................................................................................... 50
3.4.1 Soil characteristics .............................................................................. 50
3.4.2. Rainfall and runoff data ................................................................... 50
3.4.3. Nutrient and sediment concentration in surface water runoff .. 53
3.5. CONCLUSIONS ........................................................................................... 59
PARTICLE SIZE DISTRIBUTION OF ERODED
MATERIAL DURING RUNOFF EVENTS. ................... 63
4.1. ABSTRACT ................................................................................................... 64
4.2. INTRODUCTION ......................................................................................... 64
4.3. MATERIAL AND METHODS ....................................................................... 68
4.3.1 Runoff plot and study area ............................................................... 68
4.3.2 Particle size distribution determination .......................................... 69
4.3.3. Transport selectivity ......................................................................... 72
4.4. RESULTS AND DISCUSSION ....................................................................... 73
4.4.1. Soil characteristics ............................................................................. 73
4.4.2 Particle size distribution (PSD) analysis ......................................... 73
4.4.3. Transport selectivity ......................................................................... 77

15
4.5. CONCLUSIONS ........................................................................................... 79
APPENDIX ........................................................................ 83
PRACTICES THAT REDUCE RUNOFF. ...................... 83
Cover crop ................................................................................................... 84
Alley cropping ............................................................................................. 84
No-tillage farming ....................................................................................... 85
Contour Farming. ....................................................................................... 85
Strip Cropping. ............................................................................................ 86
Ridge and Mound Tillage. ......................................................................... 86
Terrace Farming. ......................................................................................... 87
Buffer strips ................................................................................................. 88
REFERENCES .................................................................. 91


Chapter 1
Introduction
rosion is a physical process responsible for the continuous
remodelling of the earth's surface, which determines the
removal of solid material from the surface of the soil and its
deposition elsewhere.
The erosion is a natural phenomenon that human activity is accelerating,
causing a gradual degradation of fertility and then the potential
productivity of the soils. It is defined as a process of detachment and
transport of soil particles operated by erosive agents (Ellison, 1944).
Soil may be detached and removed by water, wind or tillage. These three
erosive agents however differ greatly in terms of where and when they
occur; what happens to the area that is being eroded (on-site impacts)
how far the eroded soil is moved and, if the soil is moved away from the
place where it was eroded, what happens to the result (off-site impacts).
Speth (1994) suggest that about 80% of the world’s agricultural land
suffer moderate to severe erosion and 10% suffers slight to moderate
erosion.
Pimentel et al. (1995) calculates that during the last 40 years,
approximately 30% of the world’s arable land has been lost by erosion
and the process continues at a rate of more than 10 million hectares per
year. They calculate that in the United States, an estimation of 4 x 10⁹
Mg of soil and 130 x 109 Mg of water are lost from the 160 x 106 ha of
cropland each year. They report an economic loss of more than 27 billion
E

General Introduction
18
dollars each year, of which 20 billion is for replacement of nutrients and
7 billion for lost water and soil depth.
1.1. Soil erosion by water
Soil erosion by water on cultivated land is a worldwide problem. It
causes loss of a non renewable resources (Warrington et al., 2009 ) and a
series of damages on-site and off-site, including soil and nutrient losses
(Poesen and Hooke, 1997; Douglas et al., 1998; Corell et al., 1999;
Woodward, 1999; Gunatilake and Vieth, 2000; Steegen et al., 2001;
Verstraten and Poesen, 2002; Ng Kee Kwong et al., 2002; Ramos and
Martinez-Casasnovas, 2004), loss of productivity by soil degradation
(Lal, 1995; Roose, 1996; Alfsen et al., 1996; Gunatilake and Vieth, 2000)
reduction of fertility (Pimentel et al., 1995) and countless environmental
problems due to sediment shift from soils to the drainage network, river
systems and sea (Young and Onstad, 1978;Ongley et al., 1992; Ghadiri
and Rose, 1993; Hansen et al., 2002; Verstraeten et al., 2003). Soil
erosion is identified as the major cause of diffuse pollution and
specifically one of the major factors liable of water quality degradation in
lakes and reservoir over the world (Water National Quality Inventory,
1994). Suspended sediment is also considered the most visible pollutant
(Clark et al., 1985) and the physical pollutant in the surface water
environment (Guy and Ferguson, 1970). It has been recognized as an
important control factor related to geomorphological and biological
processes. Ongley (1996) highlights the impact of sediments on turbidity
that affects the penetration of sunlight into the water reducing food chain

19
production and limiting or prohibit the growth of algae and aquatic
plants. In addition to its physical role, suspended sediment plays an
important role in the transport and in biogeochemical cycling of nutrients
and other contaminants in the aquatic system (Ongley et al., 1981; Gao et
al., 2003).
Soil erosion by water involves two main processes, the detachment of
soil material from parental soil by the effect of raindrop or runoff shear;
and the transport of the sediment by raindrop splash effect and flowing
runoff.
The detachment of soil material is mainly influenced from the coverage
because the kinetic energy of raindrops is much larger than that of
surface flow. Than in bare soil the most important component of
detachment is due to the raindrop effect (Hudson 1971). Erosion process
is also intensified on sloping land, where more than 50% of the soil
contained in the splashes is transported downhill (Pimentel, 1995).
The transport of the detached soil is mainly due by surface overflow
(Young and Wiersma, 1973) witch increase sharply with slope and when
rilling is initiated (Warrington et al., 1989; Shainberg et al., 1992).
When precipitation exceeds the infiltration rate of the soil, or when the
soil is saturated, soil erosion by runoff occurs.
The infiltration capacity of the soil is a measure of the capability of the
soil to absorb and convey water. Runoff is limited on soils with high
infiltration capacity. This fact depends on the water transmission
characteristics and structural stability of the soil and its ability to
maintain continuous pores. The rate and amount of runoff are also
General Introduction
20
influenced by the intensity and the amount of rainfall, the soil moisture
content, the degree of relief, slope steepness and aspect. These factors
manifest themselves in a wide range of runoff management problems and
conservation requirements.
1.2. Runoff and nutrients
Soil transported with water erosion can reach receiving waters as
streams, rivers and lakes, causing sedimentation problems and are often
associated to a nutrient load.
The presence of nitrogen (N) and phosphorus (P) in surface water is a
major environmental problem because of the risk of eutrophication
(excessive growth of photosynthetic plants) caused by these elements,
with severe water quality deterioration. Several studies about erosion
processes take into account also the quantification of nutrient loss
(Reposa et al., 1994, Papini et al., 1997, Hussein et al., 1999, Ramos and
Martinez-Casasnovas, 2004, Pansak et al., 2005, Ramos and Martinez-
Casasnovas 2006, Lopez et al., 2007, Lu et al., 2007, Casali et al., 2008,
Xue et al., 2008) as an important aspect in these studies.
In particular, phosphorus is the limiting nutrient for the growth of aquatic
plants such as algae and water weeds .When it’s in excess, it causes
eutrophication, with abundant algal blooms, reduction of oxygen during
their decomposition, loss of aesthetic and ecological value of water
bodies, increased of cost for drinking water production.
The presence of N and P compounds are relevant parameter for water
protection plans at national scale, and are inserted in the macro

21
descriptors that define water quality standards (Legislative Decree
152/2006), which must reach the "good "category for all fresh water
bodies within 2016.
According to this law the following values (expressed in mg l-1) are
considered optimal: N03_N < 0.3, NH4_N <0.3 and total P < 0.07 and
low-quality values are considered if values are major of 1.5, 10 and 6
respectively for N03_N, NH4_N and P total.
The danger of eutrophication of waters is also perceived at international
level, and various environmental agencies indicate that runoff waters
from agricultural river basins often largely exceeded by the threshold
values.
Sharpley and Smith (1992) indicate in their study, for soluble phosphorus
a value of 0.01 mg l-1 like the threshold beyond which there’s
eutrophication water risk. The American Environmental Protection
Agency indicates in 0.1 mg l-1 the threshold beyond which there’s
accelerated eutrophication, while for nitrate they indicate a thresholds
ranging between 0.3 e 1 mg l-1.
Various studies in Italy (Acutis et al., 1996, Papini et al., 1997, Balestra
et al., 2001) and abroad (Sharpley and Smith, 1995, Heathwaite and
Johnes, 1996, Sharpley, 1997, Udawatta et al., 2004, 2006) refer highly
variable concentrations of nitrogen and phosphorus depending on the
type of the soil, the use of fertilizers and their doses and, more
generically, depending on the management.

General Introduction
22
1.3. Research framework
Nutrient losses from agricultural systems is a crucial concern in the
intensive agriculture of Lombardy region. Surface runoff from hill slope
area could represent a nonpoint source of pollution that we have to take
into account. No research has ever been carried out previously in these
areas.
The research consisted in:
• monitoring in natural condition the tendency of the selected
system to generate runoff;
• equip the vineyard plot with instruments able to collect and
sampling the runoff, measuring volume and rate of runoff;
• investigate about the sediment transported and the nutrient losses
during runoff event from an agricultural vineyard system under
natural condition;
• analyse the sampler in order to characterize, the distribution of
sediment’s grain-size transported by rainfall runoff.
1.4. Synopsis
In Chapter 2 (Technical approach for measurement of the surface runoff)
was presented the practical application, design and installation of an in-
field runoff collector, improved with a home made level reading system
able to measure the runoff rate variation.
Chapter 3 (Nutrient losses by runoff in a vineyard of the Oltrepò Pavese
(southern Lombardy – Italian region)) discuss about nutrient and

23
sediments losses by runoff events. The monitoring results are presented
in terms of registered runoff ratio, sediment concentration and nutrient
losses.
Chapter 4 (Particle size distribution of eroded material during runoff
events) eroded material was investigated for different runoff erosion
event on a field plot, to assess the soil size fraction involved in transport.
Chapter 5 (Appendix) reports some common practices for reducing the
runoff and his environment negative effects.
1.5. Notes
Chapter 2 has been published by Italian Journal of Agrometeorology.
Chapter 3 has been submitted for publication to Catena.
Chapter 4 has been submitted for publication to SSSAJ
The reference lists from individual chapters have been combined into one
list at the end of the thesis.


Chapter 2
Technical Approach For The Measurement
Of Surface Runoff
Bernardoni Ettore, Carozzi Marco, Acutis Marco.
Italian Journal of Agrometeorology (2012), 1, 29-34.
Keywords
Runoff, multislot, floating level system.
Measurement Of Surface Runoff
26
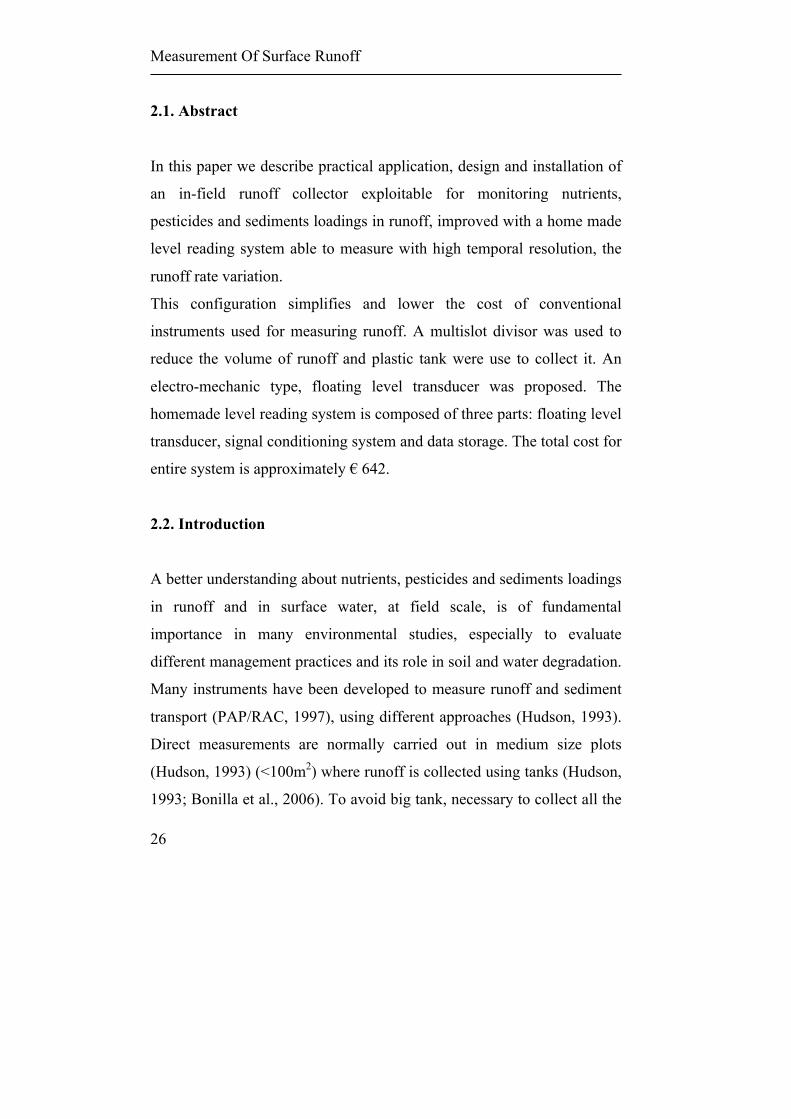
2.1. Abstract
In this paper we describe practical application, design and installation of
an in-field runoff collector exploitable for monitoring nutrients,
pesticides and sediments loadings in runoff, improved with a home made
level reading system able to measure with high temporal resolution, the
runoff rate variation.
This configuration simplifies and lower the cost of conventional
instruments used for measuring runoff. A multislot divisor was used to
reduce the volume of runoff and plastic tank were use to collect it. An
electro-mechanic type, floating level transducer was proposed. The
homemade level reading system is composed of three parts: floating level
transducer, signal conditioning system and data storage. The total cost for
entire system is approximately € 642.
2.2. Introduction
A better understanding about nutrients, pesticides and sediments loadings
in runoff and in surface water, at field scale, is of fundamental
importance in many environmental studies, especially to evaluate
different management practices and its role in soil and water degradation.
Many instruments have been developed to measure runoff and sediment
transport (PAP/RAC, 1997), using different approaches (Hudson, 1993).
Direct measurements are normally carried out in medium size plots
(Hudson, 1993) (<100m2) where runoff is collected using tanks (Hudson,
1993; Bonilla et al., 2006). To avoid big tank, necessary to collect all the

27
runoff derived from the plots, and reduce costs, the plots are frequently
characterized by small size (2-5m2) and therefore can become not much
representative of the field condition (Toy et al., 2002). Moreover total
collection tanks are often unsuitable also for medium plots because the
runoff can be excessive (Brakensiek et al., 1979). Other commons
instruments used in several runoff studies consists in sophisticated
instrumentation able to measure and sample runoff at field scale (Bonilla
et al., 2006). These instruments continuously measure and record the
runoff rate in a control section, and an automatic pumping sampler is
used to draw samples. These instruments returned more detailed
information about runoff and its rate evolution, through a mechanism to
measure the depth of water and the velocity or the flow rates in a known
section; but they are often too expensive and such system assume that
samples extracted non-continuously could be representative of the entire
phenomenon (Pinson et al., 2004; Bonilla et al., 2006).
To avoid problems in measuring, tools were introduced to collect runoff
water. Slot-type sampler, using multislot divisors, collect a representative
portion of runoff allowing to increase the plot size to better represent the
field condition (Sombatpanit et al., 1990; Reyes et al., 1999; Franklin et
al., 2001; Pinson et al., 2004; Bonilla et al., 2006), reducing the amount
of runoff that must be stored. Multislot dividers also know as slot
dividers, slot samplers or multislot samplers; were firstly introduced by
Geib (1933). In general a slot divisor consists in a box were the entire
flow pass throughout a multiple outlet slot. The output of one of these
slot was collected, between collection port or channel, to a tank and this

Measurement Of Surface Runoff
28
single sample represent a known portion of the entire runoff volume
(Pinson et al., 2004).
For studies that do not required a time variation data of the runoff but
only total event information, the slot dividers represent a low cost
method. To be representative, not only for the volume but also for the
sediment and contaminant concentration, the divisor should not permit
the deposition of the solid part of the runoff during the splitting.
The goal of this paper is to describe practical application, design and
installation of an infield runoff collector for measuring runoff, sediment
and chemical losses, enhanced with a level reading system able to
measure the runoff rate.
2.3. Materials and Methods
2.3.1. Study area and site
The study area is located in the Oltrepò Pavese, part of the Province of
Pavia, in the southwest Italian region of Lombardy. The area has an
Apennine mesoclimate (Mariani L., 2008) with an annual average
temperature of about 12°C and an annual rainfall of about 680 mm,
mainly concentrated in spring (May) and autumn (November) (Ottone
and Rossetti, 1980; Mariani L., 2008).
The study was carried out in a 9-year-old vineyard at the “Centro
Vitivinicolo Riccagioia” located in Torrazza Coste (latitude 44°58'40"44
N, longitude 09°5'4"56 E, 159 m a.s.l.). The plantation consists of single

29
Guyot trained vines, at 2.5 m × 1.0 m pattern, which run along the
maximum slope degree direction.
The plot of about 686 m2 includes four rows (three in-row), 88 meters
long. The slope of the plot is about 17%. Each plot is delimited by a
longitudinal, approximately 15 cm high earth embankment.
The grass cover in the inter-row is cut four or five times from April to
August, chemical weeding in row is renewed in March and July.
2.3.2. Multislot divisor
The multislot divisor used in this work (Fig. 1) is the same proposed in
Franklin et al. (2001).The only difference was in the use of a more thick
stainless steel sheet for the collector floor, to avoid the risk of warping,
indicated as a possible cause of the percent capture of runoff double than
expected recorded by Franklin et al. (2001). We used a 2 mm thickness
stainless sheet respect to the original 16 gauge (approx. 1.59 mm) sheet.
The height of the side wall and of the dividers, that it was not specified in
the original paper, was set to 15 cm.
2.3.3. Collection tanks
The two collection tanks (Fig.1) have been sized on the base of the
maximum volume of water potentially collectible by the multislot on
1/100 partition. In this way the 1/10 partition tank is useful to measure
runoff in small events and for the initial part of bigger events.

Measurement Of Surface Runoff
30
Fig. 1: Multislot divisor with tanks.
To calculate the size of the tank were necessary to estimate the
probability distribution of extreme runoff events and the corresponding
peak runoff rates, applying the Curve Number method (United States
Department of Agriculture, 1986). The volume was calculated on the
base of the years when the weather data were available, period 1992-
1996. A 125 dm3 (516 mm Ø × 568 mm height) PPE tank, with vertical
walls, was used for the application in reason of the entrance of the 25 cm
high collector from the multislot. At the bottom side of both tanks a
water taps were installed to evacuate the liquid after the sampling. Each

31
125 dm3 tank was allocated on a supplementary buried 380 dm3 PPE tank
(638 mm Ø × 1200 mm height) to simplify the operation of cleaning and
to place the level measuring device. The external tanks were equipped
with drainpipes, to permit the evacuation of the liquid, and with caps.
2.3.4. Level reading system
Three parts compose level reading system proposed: i) a transducer, ii) a
signal conditioning system, iii) and a data storage.
The chosen of the transducer was done considering the power
consumption, the accuracy, the spatial encumbrance and the minimum of
liquid height requested by some sensors to make a significant measure.
An electro-mechanic type, floating level transducer was selected for both
tanks as best meets the requirements described above. This device (Fig.
2) is composed by a floating part, a 250 mm diameter circle of 20 mm
high made by polystyrene in adherence with the liquid, linked to the
transducer organ through a timing belt (T5 type) connected in the centre
of the floating with a screw. The transducer is a 10 turn, metric, 10 kΩ
precision wire wound potentiometer 5% accuracy (Vishay Intertecnology
Inc. mod. (http://www.vishay.com/docs/57065/533534.pdf) and was
chosen for the reliability and the low friction on the starting movement.
This device is able to convert the rotary movement of the knob in a
variation of resistance and a consequent voltage change when powered.
The movement of the knob is allowed by a 18.25 mm Ø pulley (type 21
T5 12) mounted directly above the knob, that allows a measure of 573

Measurement Of Surface Runoff
32
mm in 10 turns of potentiometer. Major diameters allow covering more
length but in the same time decrease the measurement sensibility. A
timing belt runs up two pulleys, one connected to the potentiometer and
one idle. The timing belt is connected with polystyrene floating in one
side, and to a 150 g counterbalance in the other side.
Fig. 2: Floating level system.
The potentiometer is powered by the signal conditioning system. This
system is a simple board (Fig. 3) which permit the power alimentation of
the transducer and it receive back the voltage signal to sends to the data
storage. Specifically the board contains a 12 V to 2.5 V DC voltage
regulators (model LM 78L05) to supply the transducer, a unity gain
buffer amplifier (model LM 358) to improve the impedance of the
entrance signal and the basic electronics to operate these components.

33
The transducer receives tension from the regulator and provides a signal
from 0 to 2.5 V DC in function of the rotary movement of the pulley
linked to the floating. The power supply board is conducted by a12 V, 7
Ah battery connected to a solar panel of about 1W(12 V and 75mA).
Component Quantity
0.33µF Capacitor 1
1µF Capacitor 3
10K Resistor (1% 1/4W) 2
2 pin Terminal Block 3
3 pin Terminal Block 2
7805 (5V, 1A) Voltage Regulator 1
LM 358 Low Power Dual Operational Amplifier 1
Fig.3: Scheme of the signal condition system and component list.
The signal overcoming to the board goes directly to the data storage, a
12-bit HOBO U12-006 data logger
(http://www.onsetcomp.com/products/data-loggers/u12-006). This device
is battery powered, with four input channels and permits the storage of 0

Measurement Of Surface Runoff
34
to 2500 mV voltage signals at a frequency from 1 second to 18 hours,
with a resolution of 0.6 mV. For our purpose we use a 1 minute time step
acquisition with permit a 15 days data storage.
2.3.5. Field arrangement
Divider system and tanks are located over the field headland and the
water is conveyed to the multislot through earth embankment (Fig. 4).It
is planned to protect the embankments with plastic sheets. The field
headland is considered part of the experimental field and its contribute in
generate runoff is taken into account. The divider is placed at the end of
the headland, where the slope is about 2%.
2.3.6. Field installation
Field installation was initiated using a multislot divisor template to
identify holding tanks and divisor position. After the excavation,
levelling was done for the bottom of the holes and a 10 cm of sand bed
was created to ensure the stability of the tanks. The external tanks were
embedded until the collection port enters in a tank as high as possible.
Threaded rods were cemented into earth for levelling and fixing the
multislot. Nuts are places above and below the eyelet to level the
multislot.

35
Fig. 4: Field arrangement.
2.3.7. Operation
After every runoff event, the data logger is downloaded, water sample are
taken for analysis making sure to mix very well, tanks are emptied
opening the tap, and cleaned. Also the floating systems are rearranged to
the bottom of the tanks.

Measurement Of Surface Runoff
36
2.3.8. Calibration
Calibration of every tank is necessary to convert, in post processing, the
volts value in litres of runoff. For every 125 dm3 tank a known increment
in litres were applied. First we put in the tanks 5 litres of water in 10
steps of 0.5 litres, then we put, in steps of 5 litres, the volume of water
necessary to fill the tanks. Moreover, the percentage water of recovery
was assessed with the instrument installed in the field, using a tank of 0.5
m3 of water. 2 flow rates of 0.11 and 0.65 l s-1 with 2 replication was
used. The flow rate was obtained discharging 400 l of water in 10 and 60
minutes, respectively. Due to the long distance between the source of
water and the field equipped with the sampler, was not possible to
perform more replication and to test the device for other flow rates.
Franklin (2001) did not test the accuracy of division for transported
sediment, however precedent studies using very similar designs
(Sheridan et al., 1996) used also in Sheridan et al., 1999 and modified by
Franklin (2001) for use in water quality studies, indicated good sediment
division. Also recent studies (Butler et al., 2010; Matos et al., 2008;
Ortega et al., 2007; Sistani et al., 2008; Sotomayor-Ramírez et al., 2008;
White et al., 2003) use the Franklin splitter with good results.
Rayan (1981) attributes the accuracy of systems similar to that discussed
in this paper, in the use of a sludge tank so that the divisor only handles
water and suspended sediment in a smooth flow and the reliability of the
divisor system because there are no moving parts (Rayan, 1981).

37
2.4. Results
2.4.1. Calibration
Calibration lines for both tanks are shown in Figure 5. The determination
coefficients are close to 1 and linearity is excellent. Moreover, the slope
and the intercept of the linear regression are very similar for the two
tanks.
Tank of the 1/10 splitter Tank of the 1/100 splitter Fig. 5: Calibration curves of the two tanks.5 litres of water was added in 10 steps
of 0.5 litres than the volume of water necessary to fill the tanks was added in steps
of 5 litres.
Calibration of the tanks and of the automatic level meter also shows that
the material used is not subject to deformation due to the weight of the
water.

Measurement Of Surface Runoff
38
Tab. 1: Field calibration results. Mean recovery rate (%)
10x Divider 100x Divider
Flow rate 0.11 l s-‐1 0.65 l s-‐1 0.11 l s-‐1 0.65 l s-‐1
Mean 9.88 10.50 0.98 1.01
CV % 3.58 3.37 7.25 8.73
Table 1 showed the percentage of water recovery with its coefficient of
variation for the trials carried out. All the values are close to the expected
ones, for both flow rates, with little variations between the two
replications. The issue of a relevant overestimate of runoff from the 100x
divider highlighted by Franklin et al (2001) was not present in our
prototype. Moreover, the divider was tested for flow rates up to 5 times
greater of which was used by Franklin et al. (2001), demonstrating the
ability of the instrument to be used also for the evaluation of the
discharge of a whole plot, and not only for the width of the instrument as
in the Gerlach type sampler.
2.4.2. Cost
The total cost for the instrument is about 642 € per installation. Detailed
coasts are resumed in Table 2. A considerable amount of labour is
required for installation, but no additional cost for mechanical means are
necessary and low maintenance is required.
The cost is comparable to the system proposed by Pinson (Pinson et al.,
2004) but in addition, our system is able to register the runoff rate during
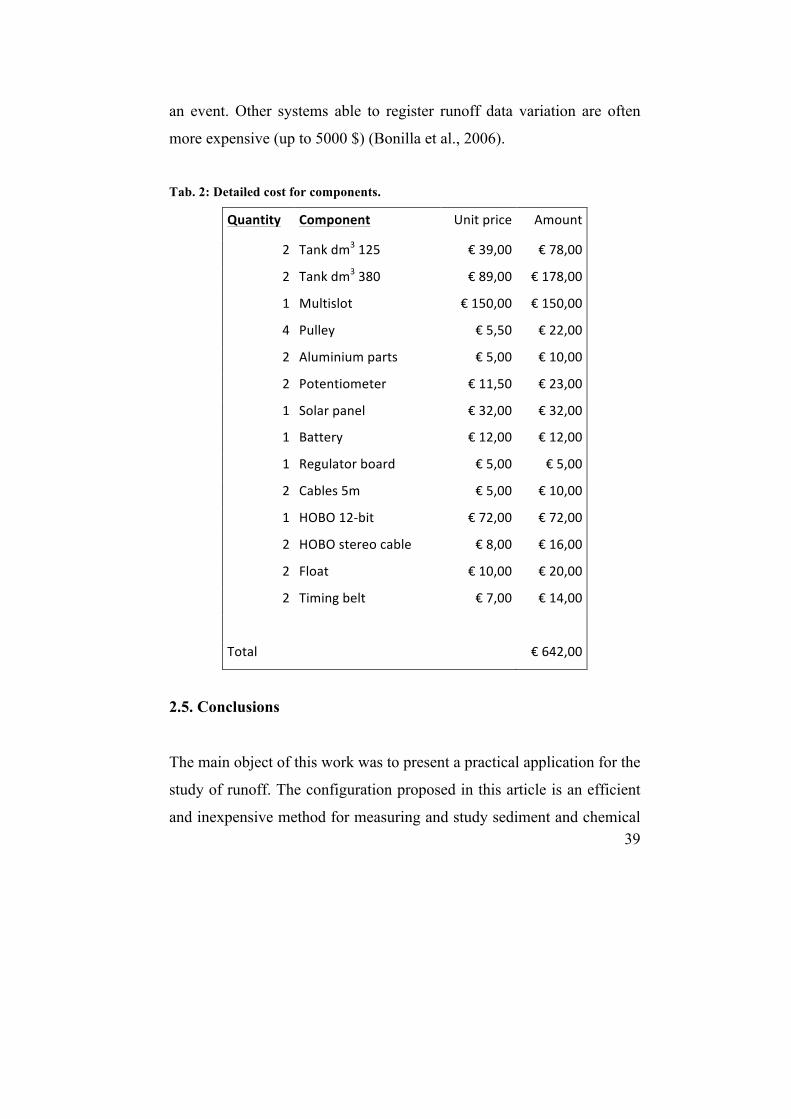
39
an event. Other systems able to register runoff data variation are often
more expensive (up to 5000 $) (Bonilla et al., 2006).
Tab. 2: Detailed cost for components.
Quantity Component Unit price Amount
2 Tank dm3 125 € 39,00 € 78,00
2 Tank dm3 380 € 89,00 € 178,00
1 Multislot € 150,00 € 150,00
4 Pulley € 5,50 € 22,00
2 Aluminium parts € 5,00 € 10,00
2 Potentiometer € 11,50 € 23,00
1 Solar panel € 32,00 € 32,00
1 Battery € 12,00 € 12,00
1 Regulator board € 5,00 € 5,00
2 Cables 5m € 5,00 € 10,00
1 HOBO 12-‐bit € 72,00 € 72,00
2 HOBO stereo cable € 8,00 € 16,00
2 Float € 10,00 € 20,00
2 Timing belt € 7,00 € 14,00
Total € 642,00
2.5. Conclusions
The main object of this work was to present a practical application for the
study of runoff. The configuration proposed in this article is an efficient
and inexpensive method for measuring and study sediment and chemical

Measurement Of Surface Runoff
40
losses under rainfall event. Measurement can be made at field scale, for
different size plot and also where external power sources are not
available. This instrument has been successfully used for over two years
in farm field providing several data about runoff process in vineyard.
Instrument’s low price permits the use of this equipment in several
replicates reducing the potential errors of singles observations.


Chapter 3
Nutrient losses by runoff in a vineyard of
the Oltrepò Pavese (southern Lombardy –
Italian region)
Bernardoni Ettore, Acutis Marco.
Keywords: Runoff; Nitrogen; Phosphorus; Soil Losses; Vineyards.

Nutrient losses by runoff in vineyard
44
3.1. Abstract
In this paper we discuss about nutrient and sediments losses by runoff
events in a vineyard of the Oltrepò Pavese.
The study was carried out in a commercial vineyard fitted with an in-
field runoff collector. The monitoring was carried out under natural
rainfall condition from December 2008 to December 2012, in which 15
runoff events was registered. Runoff ratio varied from 0.12% to 31.32%.
Sediment concentration was very variable ranging between 0.26 to 2.20 g
l-1, which also affected nutrient losses. Only few samples have total
nitrogen (TN) greater than 10 mg l-1. N loss does not pose an immediate
threat to the aquatic system, while the amount of total phosphorus (TP)
losses could have effects on eutrophication. The results show that the soil
losses are acceptable and are under the tolerable soil erosion values.
3.2. Introduction
Agriculture is a major cause of degradation of surface and groundwater
resources through erosion and chemical runoff (Ongley, 1994).
Soil erosion by water on cultivated land is a worldwide problem. It
causes loss of a non-renewable resources (Warrington et al., 2009 ) and a
series of damages on-site and off-site, including soil and nutrient losses
(Poesen and Hooke, 1997; Douglas et al., 1998; Corell et al., 1999;
Woodward, 1999; Gunatilake and Vieth, 2000; Steegen et al., 2001;
Verstraten and Poesen, 2002; Ng Kee Kwong et al., 2002; Ramos and
Martinez-Casasnovas, 2004), loss of productivity by soil degradation

45
(Lal, 1995; Roose, 1996; Alfsen et al., 1996; Gunatilake and Vieth, 2000)
reduction of fertility (Pimentel et al. 1995) and countless environmental
problems due to sediment shift from soils to the drainage network, river
systems and sea (Young and Onstad, 1978; Ongley et al., 1992; Ghadiri
and Rose, 1993; Hansen et al., 2002; Verstraeten et al., 2003). Soil
erosion is identified as the major cause of diffuse pollution and
specifically one of the major factors liable of water quality degradation in
lakes and reservoir over the world (Water National Quality Inventory,
1994). Suspended sediment is also considered the most visible pollutant
(Clark et al., 1985) and the physical pollutant in the surface water
environment (Guy and Ferguson, 1970).
Non-point source pollution (NPSP) of water bodies has become a
growing concern among scientists, policy makers, and the public at large,
particularly where point sources of pollution have been identified and
resolved. The fact that non-point source pollution accounts for most of
the total pollution contribution was reported in several studies (Isermann,
1990; Heckrath et al., 1995; Chiaudani and Premazzi, 1998; Stutter et al.,
2008). Agricultural sources of nitrogen (N) and phosphorus (P) often
contribute in the largest part in generating NPSP. N and P losses from
arable lands, both in dissolved and particle forms, not only tend to
deplete the stock of soil nutrient, lowering the soil productivity (Pimentel
et al., 1995), but may also cause eutrophication in water bodies (Foy et
al., 1995). Even if N and P transported by surface runoff are
agronomically not relevant, they may increase the concentration of N and
P in runoff waters to levels higher than the values generally proposed as
guidelines for degraded waters (Ng Kee Kwong et al., 2002). Study

Nutrient losses by runoff in vineyard
46
conducted by Zhang et al., (2003) recognized that a large portion of P
enters water in particulate-aggregate form. Where dissolved phosphorus
(DP) represents a readily available source of P for the algae, the P linked
to suspended soil particles represents a long-term reserve of available P
(Sharpley et al., 1992, Ekholm, 1994).
The contributing factors of agricultural NPSP nutrient loss by runoff
from arable land, have been widely studied (Zeng et al., 2008) and
rainfall intensity is considered the most important factor leads soil
erosion (Laly, 1988).
Runoff occurs when rainfall intensity exceeds the infiltration capacity of
the soil which is a measure of the ability of the soil to absorb and
transmit rain water. Therefore runoff is limited on soils with high
infiltration capacity. The rate and amount of runoff are besides
influenced by the intensity and amount of rainfall, the soil moisture
content and the slope.
These factors manifest themselves in a wide range of runoff management
problems and conservation needs.
Vineyards are one of the lands where the highest soil losses occur
(Tropeano, 1983, Wicherek, 1991, Wainwright, 1996), which increase
after the introduction of mechanisation due to trampling that reduced the
water infiltration capacity of the soil (Ramos and Martinez-Casasnovas,
2006). Because its diffusion and the different methods of cultivation
adopted around the world, more knowledge are needed. In hilly areas of
Italy, suitable to viticulture, the agricultural practices may results in high
loss of soil with high consequent degradation of the soil resource, both in
terms of reduction in thickness and soil quality. In addition to it, off-site

47
effects of soil erosion in vineyards are very important, due to sediment
transfer to the channel network and human infrastructures, especially
during extreme rainfall events (Bazzoffi and Chisci 1999).
The Oltrepò Pavese is located in the south-west of the Italian region of
Lombardy, where the vineyards account for 40% of the cultivated area,
mainly located in hilly terrains (ISTAT 2010). Nothing is known about
runoff erosion and nutrient losses in the Oltrepò Pavese area. In order to
contribute to the knowledge, the study presented in this paper attempts to
fill this gap of information. In this research we: i) measured runoff
events, ii) quantified the sediments loaded from runoff event, iii)
quantified the nutrient losses from the system.
3.3. Materials and methods
3.3.1. Site description
The study area is located in the south-west of the Italian region of
Lombardy where vineyards represent the largest use in hilly terrain. The
area has an Apennine mesoclimate (Mariani, 2008) with an annual
average temperature of about 12°C and an annual rainfall of about 680
mm, mainly concentrated in spring (May) and autumn (November)
(Ottone and Rossetti, 1980; Mariani, 2008).
Nutrient losses by runoff in vineyard
48
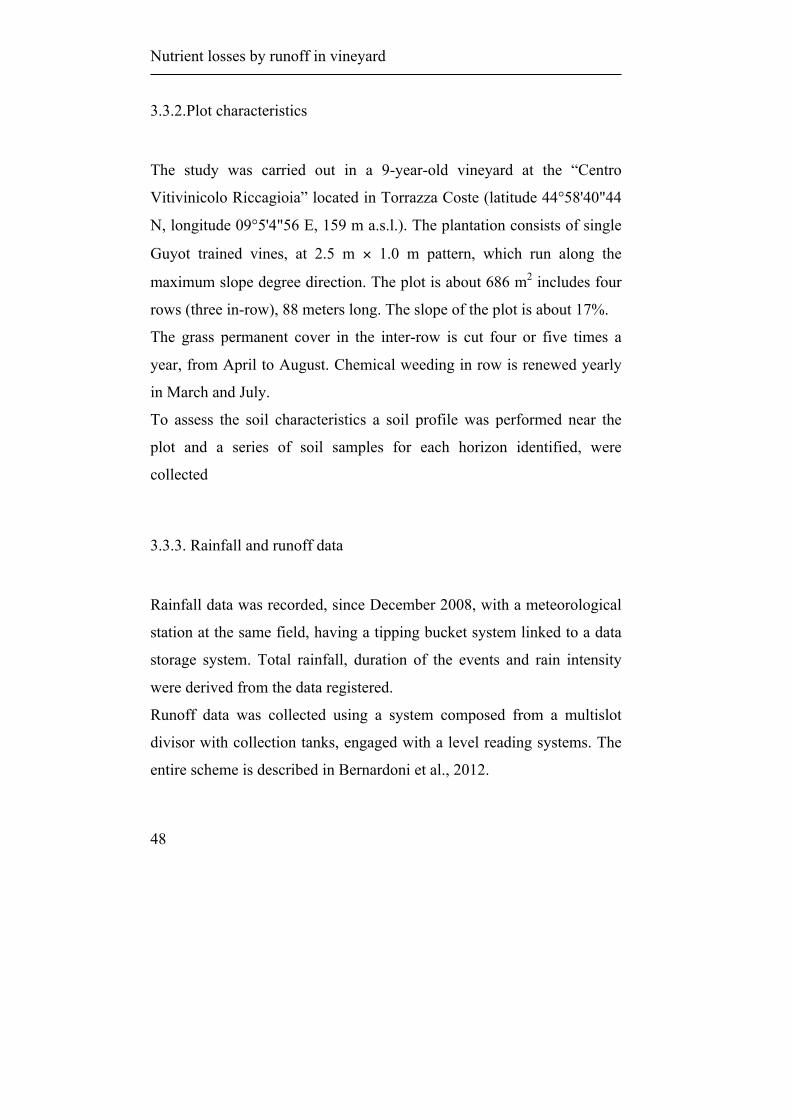
3.3.2.Plot characteristics
The study was carried out in a 9-year-old vineyard at the “Centro
Vitivinicolo Riccagioia” located in Torrazza Coste (latitude 44°58'40"44
N, longitude 09°5'4"56 E, 159 m a.s.l.). The plantation consists of single
Guyot trained vines, at 2.5 m × 1.0 m pattern, which run along the
maximum slope degree direction. The plot is about 686 m2 includes four
rows (three in-row), 88 meters long. The slope of the plot is about 17%.
The grass permanent cover in the inter-row is cut four or five times a
year, from April to August. Chemical weeding in row is renewed yearly
in March and July.
To assess the soil characteristics a soil profile was performed near the
plot and a series of soil samples for each horizon identified, were
collected
3.3.3. Rainfall and runoff data
Rainfall data was recorded, since December 2008, with a meteorological
station at the same field, having a tipping bucket system linked to a data
storage system. Total rainfall, duration of the events and rain intensity
were derived from the data registered.
Runoff data was collected using a system composed from a multislot
divisor with collection tanks, engaged with a level reading systems. The
entire scheme is described in Bernardoni et al., 2012.
49
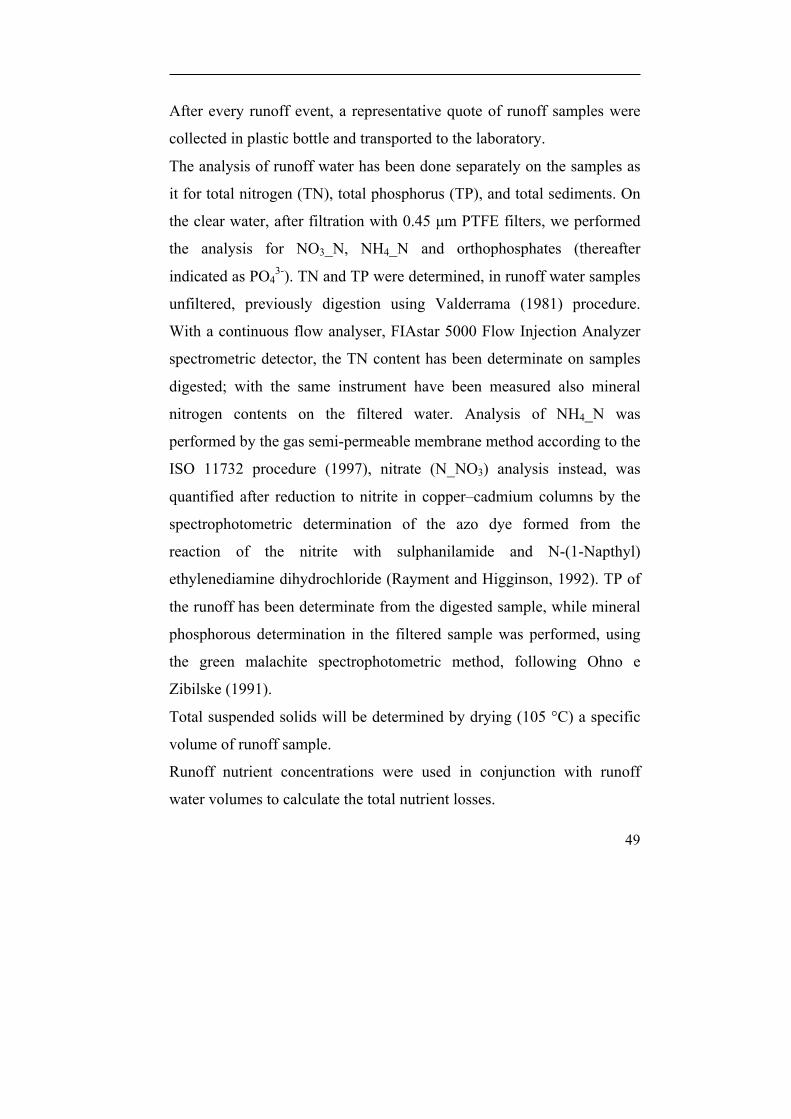
After every runoff event, a representative quote of runoff samples were
collected in plastic bottle and transported to the laboratory.
The analysis of runoff water has been done separately on the samples as
it for total nitrogen (TN), total phosphorus (TP), and total sediments. On
the clear water, after filtration with 0.45 µm PTFE filters, we performed
the analysis for NO3_N, NH4_N and orthophosphates (thereafter
indicated as PO43-). TN and TP were determined, in runoff water samples
unfiltered, previously digestion using Valderrama (1981) procedure.
With a continuous flow analyser, FIAstar 5000 Flow Injection Analyzer
spectrometric detector, the TN content has been determinate on samples
digested; with the same instrument have been measured also mineral
nitrogen contents on the filtered water. Analysis of NH4_N was
performed by the gas semi-permeable membrane method according to the
ISO 11732 procedure (1997), nitrate (N_NO3) analysis instead, was
quantified after reduction to nitrite in copper–cadmium columns by the
spectrophotometric determination of the azo dye formed from the
reaction of the nitrite with sulphanilamide and N-(1-Napthyl)
ethylenediamine dihydrochloride (Rayment and Higginson, 1992). TP of
the runoff has been determinate from the digested sample, while mineral
phosphorous determination in the filtered sample was performed, using
the green malachite spectrophotometric method, following Ohno e
Zibilske (1991).
Total suspended solids will be determined by drying (105 °C) a specific
volume of runoff sample.
Runoff nutrient concentrations were used in conjunction with runoff
water volumes to calculate the total nutrient losses.
Nutrient losses by runoff in vineyard
50
3.4. Results
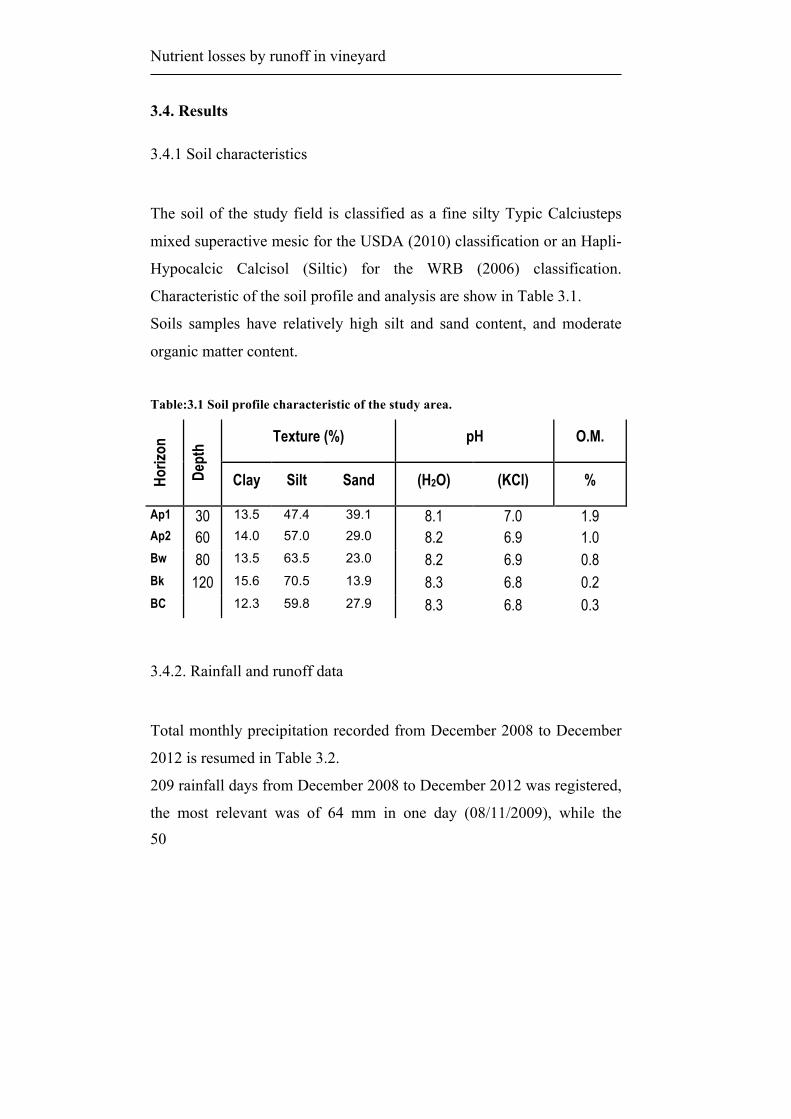
3.4.1 Soil characteristics
The soil of the study field is classified as a fine silty Typic Calciusteps
mixed superactive mesic for the USDA (2010) classification or an Hapli-
Hypocalcic Calcisol (Siltic) for the WRB (2006) classification.
Characteristic of the soil profile and analysis are show in Table 3.1.
Soils samples have relatively high silt and sand content, and moderate
organic matter content.
Table:3.1 Soil profile characteristic of the study area.
Horiz
on
Dept
h Texture (%) pH O.M.
Clay Silt Sand (H2O) (KCl) %
Ap1 30 13.5 47.4 39.1 8.1 7.0 1.9 Ap2 60 14.0 57.0 29.0 8.2 6.9 1.0 Bw 80 13.5 63.5 23.0 8.2 6.9 0.8 Bk 120 15.6 70.5 13.9 8.3 6.8 0.2 BC 12.3 59.8 27.9 8.3 6.8 0.3
3.4.2. Rainfall and runoff data
Total monthly precipitation recorded from December 2008 to December
2012 is resumed in Table 3.2.
209 rainfall days from December 2008 to December 2012 was registered,
the most relevant was of 64 mm in one day (08/11/2009), while the

51
maximum rain rate was 430 mm h-1 (registered at 1 minute interval),
recorded during the event of the 05/02/2011.
Fifteen runoff events were recorded during the four years.
Table 3.2 Amount of monthly precipitation recorded during the monitoring period
(* indicates the month with runoff events)
Jan Feb Mar Apr May Jun Jul Aug Sep Oct Nov Dec
2008 - - - - - - - - - - - 72
2009 57 91* 102* 155* 8 40 13 29 76 56 194* 57
2010 67 113 65 57 116* 54 3 71 47 188* 175* 97
2011 30 64 85 4 46 127* 15 0 61 30 107* 6
2012 27 15 40 84 63* 25 43 7 90 117 100 38
Table 3.3 shows total rainfall, event duration, rainfall duration, runoff
duration, maximum rainfall intensity, total runoff and runoff ratio
(runoff/rainfall) for each rainfall event that generate runoff.
Six events were recorded in both 2009 and 2010. Years 2011 and 2012
were drier than the two previous years, in consequence only two events
were recorded in 2011 and one in 2012.
Runoff ratio varied from 0.12% to 31.32%. The maximum runoff ratio
was registered during the 05/05/2010 second event (II). This is due to the
succession of two distinct events. In fact a 29.80 mm of precipitation was
registered from 03/05/2010 to 05/05/2010. This rainfall event ends in the
morning of the 05/05/2010, and after another event was registered
(05/05/2010 (II)) of about 32 mm. The soil already wetted from the

Nutrient losses by runoff in vineyard
52
previous precipitation resulted in a reduced water intake capacity of the
soil and generated large runoff.
Table 3.3 Total rainfall, event duration, rainfall duration, runoff duration,
maximum rainfall intensity, total runoff and runoff ratio (runoff/rainfall) for each
rainfall event that generate runoff.
Event Data or
period
Total
Rainfall
(mm)
Event
Duration
(h)
Rainfall
Duration
(h)
Runoff
Duration
(h)
Max
rainfall
Intensity
(mm h-1)
Total
Runoff
(mm)
Runoff
ratio
(%)
07/02/2009 07/02/2009 7.70 19.50 4.60 18.70 14.00 0.14 1.77
05/03/2009 05/03/2009 25.80 11.50 11.50 1.00 10.90 0.14 0.53
29/03/2009 29/03/2009 47.80 21.10 21.10 0.60 8.40 0.06 0.12
21/04/2009 19-21/04/2009 44.40 35.00 17.60 20.20 22.10 0.64 1.43
28/04/2009 26-28/04/2009 68.40 30.40 23.50 32.00 25.70 4.56 6.66
08/11/2009 05-08/11/2009 97.40 66.50 32.60 56.50 20.30 7.49 7.69
05/05/2010 03-05/05/2010 29.80 36.80 12.30 6.30 28.20 0.26 0.89
05/05/2010
(II) 05/05/2010 32.20 7.30 5.30 5.10 86.10 10.08 31.32
13/05/2010 13/05/2010 13.00 3.30 2.00 3.30 42.40 1.81 13.95
04/10/2010 04/10/2010 47.80 13.50 8.60 13.00 44.50 4.66 9.74
25/10/2010 25/10/2010 48.40 21.80 14.50 10.10 16.80 6.65 13.74
02/11/2010 30/10-
2/11/2010 144.60 69.20 39.30 62.50 25.10 7.70 5.32
05/06/2011 05/06/2011 20.00 4.00 3.30 3.70 101.00 2.38 11.90
05/11/2011 04-05/11/2011 85.80 39.00 27.30 22.60 23.20 1.63 1.90
01/05/2012 01/05/2012 21.80 6.00 1.00 1.50 53.60 0.74 3.39

53
3.4.3. Nutrient and sediment concentration in surface water runoff
Runoff was collected for nutrient and soil losses analysis after the fifteen
runoff events registered. Sediment concentration in runoff ranged from
0.26 to 2.20 g l-1.
The observed sediment concentrations in runoff represent soil losses by
up to 101 kg ha-1 in one single event. In the analysed years the value of
total annual losses is never higher than the upper value of 11 Mg ha-1
year-1 (McCormack et al., 1982, Hall et al., 1985), which is considered
the maximum annual amount of soil, which can be removed before the
long term natural soil productivity is compromised.
In this study we found that soil loss depend on total runoff more than on
rainfall intensity and follow a linear function (Figure 3.1).

Nutrient losses by runoff in vineyard
54
Table 3.4 Sediment concentration in runoff, soil losses, total nitrogen (TN) and
total phosphorus (TP) in runoff and nutrient losses by runoff for every runoff
event.
Nutrient concentration
Nutrient losses by runoff
Event Sediment
(g l-1)
TN
(mg l-1)
TP
(mg l-1)
Soil loss
(kg ha-1)
N
(kg ha-1)
P
(kg ha-1)
07/02/2009 0.520 10.711 0.032 0.708 0.015 < 0.001
05/03/2009 0.511 2.494 0.367 0.700 0.003 0.001
29/03/2009 2.207 4.748 0.990 1.223 0.003 0.001
21/04/2009 0.464 3.363 0.393 2.946 0.021 0.003
28/04/2009 0.767 2.933 0.457 34.928 0.134 0.021
08/11/2009 1.357 2.234 0.849 101.696 0.167 0.064
05/05/2010 0.408 6.375 2.066 1.077 0.017 0.005
05/05/2010 (II) 0.423 3.460 2.025 42.658 0.349 0.204
13/05/2010 0.845 10.925 1.988 15.314 0.198 0.036
04/10/2010 0.882 4.904 2.153 41.102 0.228 0.100
25/10/2010 0.433 2.624 1.481 28.822 0.174 0.098
02/11/2010 0.398 1.617 0.885 30.645 0.125 0.068
05/06/2011 0.544 4.220 2.119 12.942 0.100 0.050
05/11/2011 0.811 1.761 0.343 13.209 0.029 0.006
01/05/2012 0.266 2.381 0.304 1.962 0.018 0.002

55
Figure 3.1: Sediments on runoff samples as a function of total runoff.
Sediment concentration was not significantly correlated with mean and
maximum rainfall intensity.
Some studies carried out in the Mediterranean European region,
representing different landscapes and different land uses, point out that
vineyards are one of the lands that incur the highest runoff and soil
losses, ranging between 0.67 and 4.6 Mg ha-1 year-1, (Kosmas et al.,
1997). Other authors give much higher values for other specific sites. For
example Tropeano (1983) found values between 47 to 70 Mg ha-1 year-1
in northwest Italy, Wicherek (1991) register soil loss value of 35 Mg ha-1
year-1 in the Mid Aisne region (France), and 22 Mg ha-1 year-1 in the
Penedés–Anoia region (NE Spain) was registered by Usón (1998). Even
higher soil losses have been associated with extreme rainfall events as
demonstrated in Wainwright, (1996), that register a value of soil loss of
y = 6,2362x + 1,6528 R2=0.6 p<0.05
0
20
40
60
80
100
120
0 2 4 6 8 10 12
Sedimen
t (kg ha-‐1)
Total runoff (mm)

Nutrient losses by runoff in vineyard
56
34 Mg ha-1 in an extreme rainfall event in the SE France, 18–22 Mg ha-1
was measured at plot scale from Ramos and Porta (1994) in NE Spain,
11.51 Mg ha-1 in an extreme event in the Alt Penedès region (NE Spain)
(Ramos and Martínez-Casasnovas, 2006).
The difficulties in establishing a clear relationship between rainfall
characteristics and soil detachment and transport have been pointed out
by many authors. Reichert et al. (1994) said that sediment transport is
dependent on rainfall intensity, Spann et al. (2005), studying the
relationship between soil losses and rainfall characteristics under
different conditions, found that the maximum 10-min intensity and the
runoff percentage did not result in good correlations, however he found
good correlations with kinetic energy, total rainfall and an index of
erosivity (total rainfall x maximum intensity). Ramos and Martínez-
Casasnovas (2006) found that soil losses depend on rainfall intensity
more than on total rainfall, and the sediment concentration in runoff is
more correlated with rainfall erosivity, but not with kinetic energy and
maximum intensity. Pieri et al., (2009) found contrasting results for bare
and covered soils. In particular rain kinetic energy resulted not correlated
with sediment yield in covered soil; however the same Author found that
sediment yield is a function of total runoff water in both covered and bare
soil.
NH4_N in our study range between 0.05 and 2.36 mg l-1 and NO3_N
values range between 0.03 and 9.84 mg l-1. Average TN concentrations in
runoff ranged from 1.61 to 10.92 mg l-1 and mineral N ranged between

57
5% and 92% of the TN. Nitrogen concentration resulted not related to
sediments or runoff volume.
It is to be noted that N losses through surface runoff are generally small,
unless high rates of N fertilizer are not applied at the surface just before
heavy rains (Legg and Meisinger, 1982). Also Daniels et al., (1998)
reviewed that the amount, intensity and timing of the first rainfall event
after the application of the fertilizer are among the most important factor
affecting the concentration found in runoff.
Immediately algal available P values (dissolved orthophosphates – DP;
Pierzynsky, 2000), ranged between 0.01 to 0.84 mg l-1. DP is on average
35% of the TP. TP concentrations ranged from 0.03 to 2.15 mg l-1. In
general the TP concentration in runoff water is higher than DP, this leads
us to the P is mainly contained in the sediments. For example Gilliam et
al. (1999) reports that around 75 – 90% of P transported in runoff in
conventionally tilled land is associated with sediments and organic matter
and also Johnson et al. (1979) reports that 80-99% of the TP losses are
associated with the sediment.
There is a lack of consensus concerning the concentration at which P in
agricultural runoff leads to eutrophication, but it is generally accepted
that the critical level of TP in runoff is 0.1 mg l-1 (US EPA, 1986). In this
study, DP, exceeded the guideline value of 0.1 mg l-1 in 94% of the case.
Portielje and Van der Molen (1999) pointed out that TP concentrations in
water of 0.03-0.1 mg l-1 are associated with eutrophication. In Smith et
al. (1995), the authors state that a phosphorus soluble concentration
above 0.01 mg l-1 and a total concentration above 0.02 mg l-1 may
accelerate eutrophication.
Nutrient losses by runoff in vineyard
58
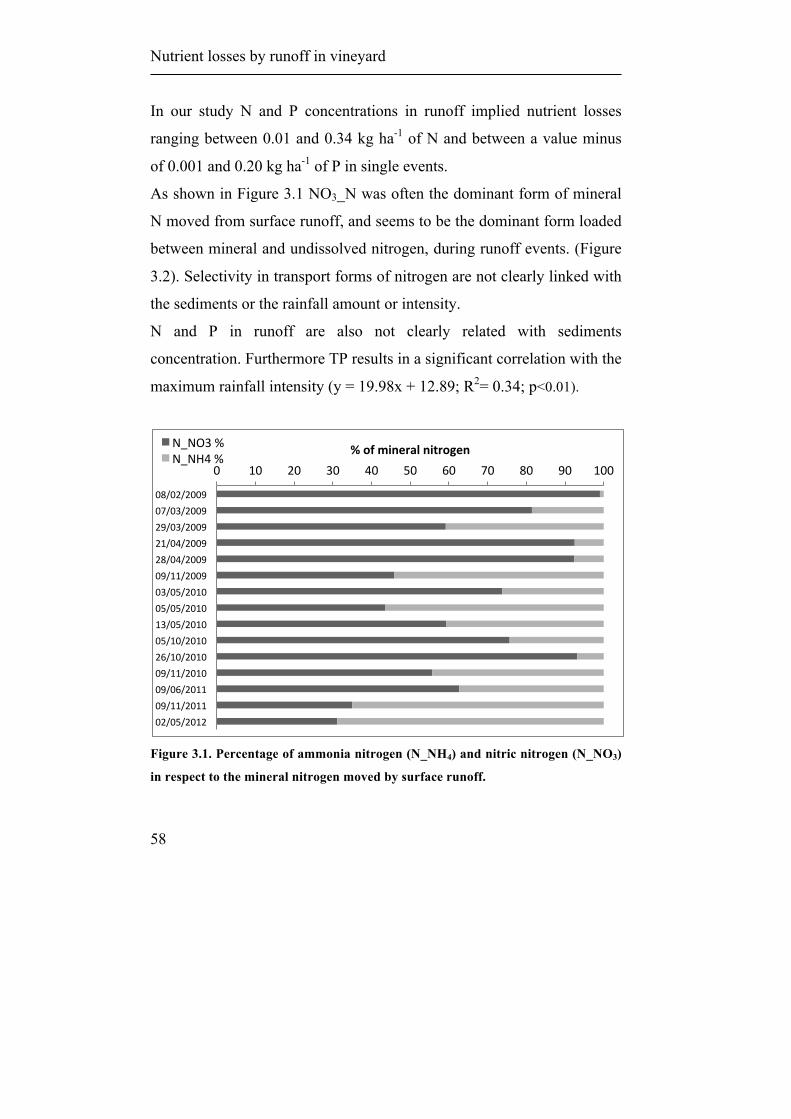
In our study N and P concentrations in runoff implied nutrient losses
ranging between 0.01 and 0.34 kg ha-1 of N and between a value minus
of 0.001 and 0.20 kg ha-1 of P in single events.
As shown in Figure 3.1 NO3_N was often the dominant form of mineral
N moved from surface runoff, and seems to be the dominant form loaded
between mineral and undissolved nitrogen, during runoff events. (Figure
3.2). Selectivity in transport forms of nitrogen are not clearly linked with
the sediments or the rainfall amount or intensity.
N and P in runoff are also not clearly related with sediments
concentration. Furthermore TP results in a significant correlation with the
maximum rainfall intensity (y = 19.98x + 12.89; R2= 0.34; p<0.01).
Figure 3.1. Percentage of ammonia nitrogen (N_NH4) and nitric nitrogen (N_NO3)
in respect to the mineral nitrogen moved by surface runoff.
0 10 20 30 40 50 60 70 80 90 100
08/02/2009 07/03/2009 29/03/2009 21/04/2009 28/04/2009 09/11/2009 03/05/2010 05/05/2010 13/05/2010 05/10/2010 26/10/2010 09/11/2010 09/06/2011 09/11/2011 02/05/2012
% of mineral nitrogen N_NO3 % N_NH4 %

59
Figure 3.2. Percentage of mineral nitrogen (MN) in respect to the total nitrogen
loaded in every runoff event.
Also another various studies conducted in Italy (Acutis et al., 1996,
Papini et al., 1997, Balestra et al., 2001) and abroad (Sharpley and Smith,
1995, Heathwaite and Johnes, 1996, Sharpley, 1997, Udawatta et al.,
2004, 2006) refer highly variable concentrations of N and P depending
on the type of the soil, the use of fertilizers and their doses and, more
generically, depending on the management.
3.5. Conclusions
Erosion process in this vineyard of the Oltrepò Pavese, produce low
runoff rates and the soil losses are lower than the soil loss tolerance.
0 10 20 30 40 50 60 70 80 90 100
08/02/2009 07/03/2009 29/03/2009 21/04/2009 28/04/2009 09/11/2009 03/05/2010 05/05/2010 13/05/2010 05/10/2010 26/10/2010 09/11/2010 09/06/2011 09/11/2011 02/05/2012
% of total nitrogen MN %

Nutrient losses by runoff in vineyard
60
Therefore we conclude that this soil is not susceptible to erosion because
this management is not harmful.
Sediment concentration in runoff is very variable from a rainfall event to
another. Soil losses are related with runoff amount. TP is related with the
maximum runoff rate.
Only few samples have TN greater than 10 mg l-1. We therefore believe
that N does not pose an immediate threat to the aquatic system but the
amount of TP losses could have effects on eutrophication, contributing to
increase the non point sources of pollution.


Chapter 4
Particle size distribution of eroded
material during runoff events.
Bernardoni Ettore, Acutis Marco
Keywords: PSD, Particle Size Distribution, Laser Granulometry

Particle size distribution
64
4.1. Abstract
In this paper, particle size distribution (PSD) of eroded material was
investigated for different runoff erosion event on a field plot. The study
was carried out in an experimental filed located in a hilly area, where
vineyards are the typical cultivation.
Sediment samples were collected for four years, after every runoff event
through a multislot runoff sampler.
The PSDs of eroded material were determined using a laser particle size
analyser, after dispersion of the samples. For each soil, PSD frequency
curves of eroded sediments and parent soils were generally of a similar
shape. The texture of the sediment was in general similar to that of the
parental soil but there is an evident depletion in clay and sand and an
enrichment in silt indicating the existence of transport selectivity.
A ratio between PSD of the transported material with that of the parental
soil provided a measure of the particle size selectivity of the transported
sediments. The ratio it’s on average 1.21 for the silt particles, 0.76 for the
sand and 0.55 for the clay.
4.2. Introduction
Loss of soil is a worldwide problem because a non renewable resource is
being lost and also because eroded material are potentially a source of
pollution and could degrading water in river systems and sea (Young and
Onstad, 1978; Ghadiri and Rose, 1993).

65
Soil erosion by water is a natural process that influences the origin and
dynamics of landscapes and therefore plays an important role in the
ecosystems evolution (de Lima et al., 2008). Moreover soil erosion has
several adverse effects on soil fertility (Pimentel et al., 1976; Morgan,
1986). Understanding the factors affecting water erosion is of
fundamental importance for the planning and designing of measures for
the soil conservation, particularly where the intensive use of soil has been
degrading land and water. Erosion of soil by water is caused by the
combined and the simultaneous effect of the processes of soil aggregates
breakdown by the impact of rain drops and then the transport of the
eroded material by runoff (e.g., Römkens et al., 1997; Meyer, 1980). Any
factor that influences runoff characteristics consequently affects the
erosion of soil by water. (de Lima et al., 2008).
In detail the phenomenon involves two main processes: first the
detachment of soil particles and aggregates (or the results of their
breaking) from parental soil by the effect of raindrop or runoff shear; and
second the transport of the material by raindrop splash effect and flowing
runoff.
Usually soil particle sizes are selectively eroded. Erosion often causes
selective loss of fines particles, encouraging the development of a
coarsening skeletal soil, with reduced moisture retentive properties
(Lewis, 1981; Frost and Speirs, 1984).
The detachment of soil material and the aggregates breakdown are
mainly influenced from the typology of soil cover. In fact the kinetic
energy of raindrops is much larger than that of surface flow, than in bare
soil the most important component of detachment is due to the raindrop
Particle size distribution
66
effect (Hudson, 1971). Erosion is also intensified on sloping land, where
more than 50% of the soil contained in the splashes is transported
downhill (Pimentel, 1995). However the movement of the detached soil
is mainly due by surface overflow (Young and Wiersma, 1973) witch
increase sharply with slope and when rilling is initiated (Warrington et
al., 1989; Shainberg et al., 1992).
These processes have been extensively studied using rain simulators
(Arnaez et al., 2007; Franklin et al., 2007; Pérez-Latorre et al., 2010) and
most of these studies used constant rainfall intensities, because the
primary objective in this sense is to collect measurable and constants
data, and not to mime the effect of natural events (Dunkerley, 2008). In
fact simulated rain differing significantly from the characteristics of
natural rainfall, which is very variable in intensity, distribution, size and
kinetic energy of the drops, temporal and spatial variability (Sharon,
1980; Helming, 2001; Willems, 2001). The spatial and temporal
distribution of rainfall is one of the main factors affecting runoff on
slopes (de Lima et al., 2008).
Soil particle-size distribution (PSD) is one of the most important physical
attributes because of its great influence on soil properties related to water
movement, productivity, and soil erosion (Huang and Zhang, 2005;
Montero, 2005). The land use largely influence PSD by helping or
hindering the soil erosion processes (Martínez-Casasnovas and Sánchez-
Bosch, 2000; Erskine et al., 2002; Basic et al., 2004). In this sense,
characterization of PSD may be a promising indicator to reveal the
influence of land use on soil properties (De Wang et al., 2008).
67
In order to assess the effects of the erosion process, it is important to
quantify PSD of the eroded sediments along with the total amount of soil
material lost. Clay is generally considered the size fraction of the
sediment that is most important in the transport of adsorbed chemicals in
the soil (Young and Onstad, 1978). It is well know that the finer material,
in general, can travel greater distances before being deposited, than an
understanding of the PSD of eroded material is essential to accurately
predict where soil components will be deposited, and how the PSD of the
eroded sediment may vary depending on soil type, texture and
management practices. Several studies have tried to characterize eroded
sediments in terms of their primary PSD, determined following complete
dispersion of the eroded material, and to comparing it with those of the
parent soil. The results are various. Some studies reported that sediments
from interrill erosion were enriched in sand to the detriment of the silt
and clay size fractions (Young and Onstad, 1978; Alberts et al., 1980). In
other studies, conversely, it was observed that clay, and not sand, was
enriched in the eroded sediment (Monke et al., 1977, Alberts et al., 1983,
Warrington et al., 2009). It was also been observed that the composition
of sediments changes during the rainfall event; at the beginning
sediments had finer material than that of the parent soil, but in the course
of the event the PSD of the sediments become comparable to that of the
parent soil (Gabriels and Moldenhauer, 1978; Mitchell et al., 1983,).
These differences between PSDs of eroded materials and their parent
soils results from differences in their soil properties (texture, clay
content), the existing conditions at the soil surface before a rainfall event,

Particle size distribution
68
as well as the characteristics of the precipitation event itself (intensity,
raindrop size and energy, and duration).
PSD of eroded material provides basic information about erosion
processes and may be useful for controlling the effect of sediments when
they reach surface waters (Meyer et al., 1980). Furthermore information
about the particle size distribution of the runoff eroded material is
necessary for developing improved erosion and sediment models for soil
loss predictions (Young, 1980).
The main objective of the study was to characterize, in natural
conditions, the distribution of sediment grain-size transported by rainfall
runoff generated in a vineyard hill.
4.3. Material and methods
4.3.1 Runoff plot and study area
A runoff plot of about 686 m2, located in a 9-year-old vineyard at the
“Centro Vitivinicolo Riccagioia”, Torrazza Coste country, (latitude
44°58'40"44 N, longitude 09°5'4"56 E, 159 m a.s.l.) was used for the
study. The plantation consists of single Guyot trained vines, at 2.5 m ×
1.0 m pattern, which run along the maximum slope degree direction. The
plot includes four rows (three in-row), 88 meters long; the slope is about
17%. This plot is used in a study in which runoff data, soil and nutrient
losses have been recorded since December 2008. The plot is equipped
with a collection systems composed by a multislot divisor and a
collection tanks with a level reading systems. This instrumentation is

69
used to measure soil losses and runoff at the lower end of the plot. A
meteorological station was located near the plot, and through a data
logger data was stored at a 1-minute intervals.
Sediments sampler were collected from the tanks after fourteen runoff
event and taken to the laboratory.
4.3.2 Particle size distribution determination
Particle size measurements were performed by means of laser diffraction
technique using a granulometric analyser, after soil dispersion by Na-
hexametaphosphate.
We decided to use the laser diffraction technique for PSD determination
because soil materials in runoff samplers were usually present in low
concentrations, would have made it necessary to sample and drying large
quantities of sample to obtain a quantity of soil for the classic analysis
methods. Furthermore the laser granulometer use dispersed granular
material in water, condition in which the samples are already found.
Another advantage using this technique is given by the fact that this
method provides a continuous PSD rather than an arbitrary division of
the particles between a limited number of size fractions (as determined
by conventional methods based on sedimentation and/or sieving) and
permits a more detailed analysis of a desired size range, especially in the
clay size fraction (Eshel et al., 2004).
We decided to disperse the sediment eroded and to study only the
primary PSD rather than examining the PSD of the non-dispersed
sediment samples. This is because there was some concern that during
the procedure for PSD determination of the non-dispersed samples,

Particle size distribution
70
further breakdown of aggregates could be induced leading to erroneous
results and conclusions (Warrington et al., 2009).
A Mastersizer 2000 laser diffraction granulometer units manufactured by
Malvern Instruments Ltd was used to perform the granulometric analysis.
This laser diffraction particle size analyser performed measuring particle
sizes between 0.02 to 2000 µm, using both blue (488.0 µm wavelength
LED) and red (633.8 µm wavelength He-Ne laser) light dual-wavelength,
single-lens detection system. The light energy diffracted by the dilute
suspension circulating through a cell is measured by 52 sensors. The light
intensity adsorbed by the suspended material is measured as obscuration
and indicates the amount of sample added in the dispersant liquid. Light
scattering data are classified in 100 size fractions class, which are
analysed at 1000 readings per second, and compiled with the Malvern’s
Mastersizer 2000 software by using the Mie diffraction theories or the
Fraunhofer Approximation (de Boer et al., 1987). The Fraunhofer
Approximation represents the easiest model, in contrast to Mie Theory, it
does not require to provide any optical property information. However,
its use can lead to significant errors due to the assumptions it makes
regarding the nature of the materials being measured. The Mie theory,
utilizes the refractive index (RI) and absorption (ABS) of the dispersed
granular material, and RI of the dispersant liquid. This theory is based on
some assumption: i) particles are mineralogically homogeneous; ii)
particles are spherical; iii) the optical properties of particle and dispersion
medium are known; iv) suspension dilution guarantees that light scattered
by one particles is measured before being-re-scattered by other particles.

71
The use of laser method for measuring particle size have been
widespread in recent decades in all areas in which those measures are
relevant (Black et al., 1996) and a number of reports have proposed that
recently developed laser diffraction instruments show potential for
automating the measurement of particle size distributions in soil and
related materials (Kowalenko and Babuin, 2013). However does not yet
exist, particularly in soil science, official or standard methods that
delineate unambiguously and defined procedures. Therefore, the
procedure of analysis and parameters setting of the laser used for the
determination of particle size of the samples of this work, were
determined on the basis of past experience of analysis with this
instrument at the CNR ISAFoM (De Mascellis and Basile, 2012; De
Mascellis et al., 2009). Following this procedure the samples were
previously subjected to chemical-physical dispersion through the addition
of a solution of 50 g l-1 sodium hexametaphosphate, in variable amounts
depending on the amount of the volume of the sample, but such as to
maintain a ratio of 2.5:1 between liquid and dispersant solution. The
samples were then subjected to agitation with an automatic vertical
agitator for one night. Finally, we proceeded to the determination of
particle size through the laser granulometer, preceded by a mechanical
dispersion by ultrasonication for a period of 2 minutes.
For each of the samples analysed, were performed six readings of the
duration of 1 minute each. The theory of calculation for the processing of
data in the diffraction particle size analysis was the Mie, whereas the RI
of the suspension amounted to 1.33, RI of the particles was set to 1.9 and
ABS index was equal to 0.5. With this configuration, the indexes

Particle size distribution
72
indicative of a good approximation of the measured data with respect to
the theoretical model of the Mie have given excellent results.
4.3.3. Transport selectivity
Comparison of the PSD of the eroded sediments with that of the parental
soil provides a measure of the selectivity of sediments transported during
runoff events. The enrichment ratio (ER), as defined by Massey and
Jackson (1952), is an important term and give an index of erosion
selectivity.
A value of ER greater than 1 represent an enrichment, a given class
forms a greater proportion of the transported load in runoff than in the
matrix soil. ER value less than one represent a depletion, a given class
forms a greater portion in the matrix soil than in the transported
sediment.
soilmatrix in class sizegiven ain particles of percentagerunoff surfacein class sizegiven ain particles of percentageER =

73
4.4. Results and discussion
4.4.1. Soil characteristics
The soil in the field under investigation is classified as a fine silty Typic
Calciusteps mixed superactive mesic for the USDA (2010) classification
or an Hapli-Hypocalcic Calcisol (Siltic) for the WRB (2006)
classification (Table 4.1).
Table 4.1: Soil profile characteristics.
4.4.2 Particle size distribution (PSD) analysis
The texture of the eroded material is in general silty loam then the texture
of the upper soil horizon (Figure 4.1).
The percentage of silt (2-20 µm) in parental soil account for 47.4% while
in average sediments was principally composed of silt which accounts on
average the 57% of the total eroded material. In the dispersed soil
parental material, particles > 250 µm (medium and coarse sand) represent
Horiz
on
Dept
h (c
m)
Texture (%) pH CaCO3 total OC OM cation exchange (meq/100g)
Sand Silt Clay (H2O) (KCl) % % % CSC Ca+Mg K Na
Ap1 30 13.5 47.4 39.1 8.1 7.0 14.7 1.1 1.9 22.4 20.2 2.06 0.19 Ap2 60 14.0 57.0 29.0 8.2 6.9 14.6 0.6 1.0 21.2 19.6 1.43 0.19 Bw 80 13.5 63.5 23.0 8.2 6.9 17.3 0.5 0.8 19.9 18.4 1.37 0.12 Bk 120 15.6 70.5 13.9 8.3 6.8 20.8 0.1 0.2 26.4 24.4 1.68 0.31 BC 12.3 59.8 27.9 8.3 6.8 10.2 0.2 0.3 23.7 22.0 1.31 0.44

Particle size distribution
74
the 6.24% of the soil; in dispersed eroded material this value range
between 0.08 to 6.85% (mean 3.67%).
Fig 4.1: Texture of matrix soil and sediments for all the events, represented in a
ISSS texture triangle.
Texture triangle
102030405060708090
102030405060708090 10
2030
4050
6070
8090
[%] Sand 50-2000 µm
[%] Clay 0-2 µm
[%] Silt 2-50 µm
HCl
SaClLCl
SiCl
SaClLo ClLo SiClLo
LoSa
Sa
SaLo Lo SiLo
Runoff sediments
Parental soil

75
Fig 4.2: An example of the particle size distribution between the first soil horizon
(Ap1) and two samplers of runoff.
According to Young (1980) soils with more than 33% of silt content (as
in this case) usually generate sediments in the silt-size range (mostly in
the range 20–35 µm). He also suggested that the most erodible size
ranges include particles and aggregates between 20 and 200 µm in silty
soils. The author postulated that particles with a size larger than 200 µm
have enough mass to limit their movement, whereas for particles below
20 µm, cohesive forces impede particle detachment. Therefore, according
to Meyer et al. (1981), Young (1990) and Asadi et al. (2011), soil texture
is the main factor behind differences in sediment size distribution. In fact
comparing the particle size distribution of the parental soil with that of
the eroded material (Table 4.2) we note that the distributions of the soil
particles in runoff samplers were significant correlated (p<0.01 for all) to
that of the matrix soil.
0
1
2
3
4
5
6
0,01 0,1 1 10 100 1000 10000
% (v
ol)
µm
PSD 21/04/09 09/06/11 Ap1 0-30

Particle size distribution
76
Table 4.2: Coefficient of determination (r2) between the particle size distribution of
the matrix soil and the eroded samplers based on % of volume in 100 class of
diameter. All the distribution are statistically correlated (p<0.01).
Event r2 07/03/09 0.94 23/03/09 0.68 21/04/09 0.70 28/04/09 0.77 09/11/09 0.68 03/05/10 0.25 05/05/10 0.95 13/05/10 0.81 05/10/10 0.95 26/10/10 0.96 09/11/10 0.95 09/06/11 0.90 09/11/11 0.89 02/05/12 0.95
The PSD curves of the parental soil present two main peak. A major peak
which occurred in the region of the silt, and a minor peak that occur in
the region of the sand. Also the PSD curves of the eroded material
generally presents two main peak, the major peak in the region of the silt
(about 15 µm) and the minor peak in the region of the medium-coarse
sand (about 500 µm).
Loch and Donnollan (1983) and Asadi et al. (2007) also found that
different sediment sizes is distributed bimodally. They theorize that the
bimodal distribution of sediments resulted from the different transport
mechanisms of suspension, saltation and rolling. Warrington et al. (2008)
found the same bimodal distribution strictly dependent to the
characteristic of parental soil. There are still some contrasting and
unexplained results regarding sediment sorting in erosion processes.

77
Sediment size distributions seem to depend on many factors such as
rainfall characteristics, vegetation cover, hydraulic flow type (sheet or
rill), soil properties and slope (Shi et al., 2012).
4.4.3. Transport selectivity
A general enrichment was observed for the silt fraction and is an
indicator of the transport selectivity (Figure 4.4). This is because
aggregates with a high silt content have lower density than others, and
are easily transported (Young, 1990).
The clay fraction in eroded material had an ER of 0.55 on average, while
a values of mean ER of 1.22 and 0.89 was found respectively for silt and
sand.

Particle size distribution
78
Figure 4.5: Enrichment ratio (ER) of the sediments.
0"0,5"1"1,5"2"2,5"
Clay"
Silt"
Sand
"
ER#
Enric
hmen
t#ra-
os#
07/03/09"
23/03/09"
21/04/09"
28/04/09"
09/11/09"
03/05/10"
05/05/10"
13/05/10"
05/10/10"
26/10/10"
09/11/10"
05/06/11"
09/11/11"
05/02/12"

79
A significant positive correlation between ER-clay and mean rainfall
intensity (p<0.01) was found (Figure 4.5). Martinez-Mena et al. (1999)
found that clay is mainly transported as aggregate. In general aggregates
are to heavy to be transported and detached and Durnford and King
(1993) reported that when rainfall energy is high enough to break soil
aggregates, clay became available for transport, result confirmed by Shi
et al. (2012).
Figure 4.5: Relationship between enrichment ratio (ER) of clay fraction in
sediments and mean rainfall intensity.
4.5. Conclusions
The laser granulometer has allowed to obtain information rarely
available. This type of information are necessary if we are to understand
the relation between erosion and soil degradation.
y = 0,0386x + 0,263 R² = 0,35
0
0,2
0,4
0,6
0,8
1
1,2
1,4
0 5 10 15 20
ER-‐clay
Mean rainfall intensity (mm h-‐1)
Particle size distribution
80
Characterization of the PSD of eroded sediments from an experimental
plot in a vineyard, under natural condition, showed that in transport
selectivity there is a general depletion of clay and sand and a
consequently enrichment in silt material in the eroded material in respect
to parental soil. Clay is positive correlated to the mean rainfall intensity,
showing that the transport of clay is driven by the energy of the rain to
transport/break aggregates containing clay.
Because of the effect of the soil erosion process can cause a variety of
negative environmental and agronomical effect, such as loss of top soil
and fertility, depletion in soil nutrient, we must be addressed by varying
soil management and introducing conservation practices.
Acknowledgements
Authors are grateful to ISAFoM CNR and to Dr. Roberto De Mascellis
for the laser granulometric analysis.


Appendix
Practices that reduce runoff.
The principle of these practices is to increase water intake and storage,
minimize the concentrations of nutrients and soil in the runoff and to
slow down the flow velocity, allowing the time to water to penetrate into
the soil, limiting its capacity to transport soil particles and reducing its
ability to cause erosion.
Mulch Farming
Mulch farming is a system in which, maintaining a permanent or semi-
permanent protective cover with vegetative residues (straw, maize stalks,
stubbles) on the soil surface, will limit the loss of soil by erosion. The
system is particularly useful when a satisfactory vegetation cover cannot
be established at the time of year when there is greater risk of erosion.
The beneficial effects of mulching include the protection of the soil
surface against raindrop impact, reducing the detachment from rain
impact, decrease the flow velocity by increasing the roughness, and
improve infiltration capacity. In some cases it also enhances the activity
of some species of earthworms (Lal, 1976) which increase transmission
of water through the soil profile (Aina, 1984), reduces surface crusting
and improves soil moisture storage in the root zone. These effects have
been widely reported. The mulch effect in reducing soil loss has been

Appendix
84
shown in both field (Borst and Woodburn, 1942; Lal, 1976) and
laboratory (Lattanzi et al., 1974) studies. Lal (1976) reports an annual
saving of 32% of rainfall in water runoff from mulching. Roose (1988)
reports drastic reductions in runoff and erosion from a mulched field on a
20% slope.
Cover crop
Cover crops are crops with the primary purpose of cover and protect the
soil. Using appropriate cover crops, it’s possible to improve also the
efficiency of water use, weed control and soil organic matter. The
benefits are similar to the mulch, cover crop are in general seeded when
the soil is bare and could be harvested before the primary culture.
Alley cropping
Alley cropping is a system in witch arable crops are seeded in spaces
between rows of planted trees. The crops growing simultaneously with
the long-term tree crop and provide annual income while the tree crop
matures. The trees are typically pruned minimizing shading to the crops.

85
No-tillage farming
No-tillage is a method of seeding on no tilled soil, through a crop residue
mulch. It operates by opening a narrow slot in the soil for seed placement
without mechanical or secondary tillage operations. Chemical weed
control is in generally required. The beneficial effects of no-tillage in soil
include soil moisture conservation due to reduction in rainfall detachment
and runoff shear, improved infiltration capacity and enhanced earthworm
activity. It also maintains organic matter content at high levels.
Reduction in runoff has been reported under no-tillage practices
compared to conventional tillage (Lal, 1976). The effectiveness of no-
tillage farming in soil conservation is improved when used in association
with planted cover crops.
Contour Farming.
Contour farming involves the alignment of plant rows and tillage lines
with right angles to normal flow direction of runoff. It creates detention
storage in the soil surface horizon and slows down the runoff thus giving
the water the time to infiltrate into the soil. The efficiency of the contour
farming in water and soil conservation depends not only on the design of
the system but also on soil characteristics, climatic condition, slope and
land use. The beneficial effect is less pronounced on compact or slowly
permeable soils because these become saturated quickly compared to
highly permeable soil.

Appendix
86
Strip Cropping.
This is a kind of agronomical practice of sloping land, in which ordinary
crops are planted in alternate contoured strips .These strips are so
arranged that the strip crops should always be separated by strips of close
growing and erosion resistance crop. The strips are aligned at right angles
to the direction of natural flow of runoff. The close growing strips have a
function of slow down the runoff and filter the soil washed from the land
in the intertilled crop. Usually, the close growing and intertilled crops are
planted in rotation. Strip cropping provides effective erosion control
against runoff on well-drained erodible soils on 6 to 15% slopes. The
width of the strips is varied with the erodibility of the soil, and slope
steepness. Generally the use of strip cropping practice for soil
conservation is decided in those areas where length of slope is not too
longer and in the area where terraces are not practically feasible due to
the fact that the length of slope is divided into different small segments.
Ridge and Mound Tillage.
The ridge furrow tillage system is commonly used physical practice
conservation tillage. When the ridge furrows are aligned parallel to the
contour lines have the dual effects of erosion control and surface
drainage. Their advantages are greater, the less steep is the ground and
the more permeable is the soil. Mounds and tied mounds are also
effective in conserving water and reduce soil erosion. The effectiveness

87
of ridges and mounds depends on soil, slope, rainfall and design
characteristics. These systems on clay soils may induce waterlogging
which may be followed by mass movement (Gray and Brenner, 1970). In
severe storms, poorly designed ridge furrow systems may fail, the row
catchments can over-top and the water flow freely goes down the slope
with the danger of it accumulating enough energy to detach and transport
soil.
Terrace Farming.
Terrace farming involves the creation of embankments built at right
angles to the steepest slope, and made excavating a channel on the uphill
side of a slop, the spoil resulting from the digging forms a bank on the
downhill side. With this method it’s possible to converts a slope into a
series of steps with horizontal shelves and vertical walls made of stone,
brick or timber, supporting the embankment. There are several varieties
of terraces, built by various techniques and called (according to method
of construction) bench terraces (Orlandini and Zanchi, 2005); Mangum
diversion terraces; Nichols terraces; broad-based and narrow-based types;
channel terraces; retention terraces etc.

Appendix
88
Buffer strips
The buffer strips are areas of planted or natural vegetation which are able
to filter sediments and their attached nutrients and pollutant from
agricultural water runoff. Numerous studies demonstrating the
effectiveness of buffers of different types and widths. Many factors can
affect buffer performance such as the slope and the soil type, whether the
area has been tilled or not, and the intensity of rainfall events that cause
runoff. Buffer strips are not very effective in trapping sediments and
nutrients in situations of concentrated flow and therefore are effectively
used where the source area has a moderate slope and produces runoff in
the form of sheet flow (Lee et al., 2000). Many researchers have
concluded that the width of the buffer is the most important factor that
influence the amount of total phosphorus (TP) removed from runoff (Lee
et al., 2000; Dillaha et al., 1989). Wider buffers are able to retain more
particles of sediment, especially of small dimension (Lee et al., 2000).
The capacity of a buffer strip to decrease sediment transport, in particular
of small particles, greatly affects the amount of TP that a buffer is able to
retain from the runoff, because most of the TP eroded from cultivated
lands is linked to the sediments.
Some study have found that the solids previously trapped in the buffer
strips could be released from the buffer, making the buffer as a source of
pollution. This problem can be partially solved by increasing the width
buffer, and harvesting or cutting the buffer vegetation.


91
References
Acutis, M., Argenti, G., Bersani, L., Bulletta, P., Caredda, S., Cavallero,
A., Giordani, C., Grignani, C., Pardini, A., Porqueddu, C., Reyneri, A.,
Roggero, P.P., Sulas, L., Talamucci, P., Zanchi, C., 1996. Effetti di tipologie di
suolo e colture foraggere sulle perdite per ruscellamento di azoto, fosforo e
potassio in differenti areali italiani. Rivista di Agronomia 3: pp. 329-338.
Aina, P.O. 1979. Soil changes resulting from long-term management
practices in Western Nigeria. Soil Sci. Soc. Am. J. 43: pp. 173-177
Alberts, E.E., Moldenhauer, W.C. and Foster, G.R. 1980. Soil aggregates
and primary particles transported in rill and interrill flow. Soil Science Society
of America Journal, 44: pp. 590–595.
Alberts, E.E., Wendt, R.C. and Piest, R.F. 1983. Physical and chemical
properties of eroded soil aggregates. Transactions of the American Society of
Agricultural Engineers, 26, 465–471.
Alfsen, K.H., De Franco, M.A., Glomsrød, S., Johnsen, T., 1996. The
cost of soil erosion in Nicaragua. Ecological Economics 16, 129–145.
Arnaez J., Lasanta T., Ruiz-Flano P., Ortigosa L., 2007. Factors affecting
runoff and erosion under simulated rainfall in Mediterranean vineyards. Soil
Till. Res. 93, 324–334.
92
Asadi, H., Ghadiri, H., Rose, C.W., Yu, B., Hussein, J., 2007b. An
investigation of flowdriven soil erosion processes at low stream powers. J.
Hydrol. 342, 134–142.
Asadi, H., Moussavi, A., Ghadiri, H., Rose, C.W., 2011. Flow-driven soil
erosion processes and the size selectivity of sediment. J. Hydrol. 406, 73–81.
Balestra, L., Toderi, M., Roggero, P.P., 2001. Sistemi colturali e qualità
delle acque in un'area collinare delle Marche in emergenza nitrati. In: Biondi E.,
Segale A. (ed.), Pianificazione e gestione delle aree protette: analisi
dell'ambiente e biodiversità, biomonitoraggio, agricoltura sostenibile. Il Lavoro
Editoriale Università, Ancona, 137-168.
Basic, F., Kisic, I., Mesic, M., Nestroy, O., Butorac, A., 2004. Tillage and
crop management effects on soil erosion in central Croatia. Soil Tillage Res.
78:pp. 197-206.
Bazzoffi P., Chisci G. 1999. Tecniche di conservazione del suolo in
vigneti e pescheti della collina cesenate. Riv Agron 3:pp. 177-184.
Bernardoni E., Carozzi M., Acutis M., 2012. Technical approach for the
measurement of surface runoff. Italian Journal of Agrometeorology, 1:pp. 29-
34.
Black D.L., McQuay M.Q., Bonin M.P., 1996. Laser-based techniques
for particle-size measurement: A review of sizing methods and their industrial
applications, Progress in Energy and Combustion Science 22, (3): pp. 267-306.
Bonilla C.A., Kroll D.G., Norman J.M., Yoder D.C., Molling C.C.,
Miller P.S., Panuska J.C., Topel J.B., Wakeman P.L., Karthikeyan K.G., 2006.
Instrumentation for Measuring Runoff, Sediment and Chemical Losses. Journal
of Environmental Quality, 35:pp. 216–223.

93
Borst, H.L. and Woodburn, R. 1942. The effect of mulching and methods
of cultivation on run-off and erosion from Muskingum silt loam. Agricultural
Engineering 23:pp.19-22.
Butler D.M., Franklin D.H., Cabrera M.L., Risse L.M., Radcliffe D.E.,
West L.T., Gaskin J.W., 2010. Assessment of the Georgia Phosphorus Index on
farm at the field scale for grassland management. Journal Soil of Water
Conservation, 65: 200–210.
Brakensiek D.L., Osborn H.B., Rawls W.J., 1979. Field manual for
research in agricultural hydrology. USDA Agricultural. Handbook 224. USDA,
Washington DC, pp. 547.
Casali J., R. Gastesi R., Alvarez-Mozos J., De Santisteban L.M., Del
Valle de Lersundi J., Gimenez R., Larranaga A., Goni M., Agirre U., Campo
M.A., Lopez J.J., Donezar M., 2008. Runoff, erosion, and water quality of
agricultural watersheds in central Navarre (Spain). Agricultural water
management 95, pp. 1111-1128.
Chiaudani, T., Premazzi, G., 1998. Environment and quality of life.
Water Quality Criteria in Environmental Management. Rep. EUR 116387.
Commission of European Communities, Luxembourg.
Clark, E. H., Haverkamp, J. A. and Chapman, W. (1985) Eroding Soils -
The Off-Farm Impacts. The Conservation Foundation, Washington, DC.
Corell, D.C., Thomas, E., Jordan, E., Weller, D.E., 1999. Precipitation
effects on sediment and associated nutrient discharges from Rhode river
watersheds. Journal of Environmental Quality 28, 1897– 1907.
94
Daniels, T.C., Sharpley, A.N., Lemunyon, J.L., 1998. Agricultural
phosphorus and eutrophication: a symposium overview. J. Environ. Qual. 27,
251–257.
de Boer, G. B. J., de Weerd, C., Thoenes, D., and Goossens, H. W. J.:
Laser diffraction spectrometry: Fraunhofer diffraction versus Mie scattering,
Particle Characterization, 4, 138–146, 1987.
De Mascellis R., Basile A., (2012). New tecniques for soil particle size
analysis: advancements and problems, in EUROSOIL 2012 - Soil Science for
the benefit of mankind and environment, Bari (IT), 2-6 Luglio 2012.
De Mascellis R., Impagliazzo A., Basile A., Minieri L., Orefice N.,
Terribile F., (2009). Methodological issues concerning the application of
reliable laser particle sizing in soils, in General Assembly of European
Geosciences Union, Vienna, 14-19 aprile, 2009.
de Lima, J. L. M. P., Souza, C. S., and Singh, V. P.: Granulometric
characterization of sediments transported by surface runoff generated by
moving storms, Nonlin. Processes Geophys., 15, 999–1011, doi:10.5194/npg-
15-999-2008, 2008.
De Wang, Fu B., Zhao W., Hu H., Wang Y. Multifractal characteristics
of soil particle size distribution under different land-use types on the Loess
Plateau, China (2008) Catena, 72 (1) , pp. 29-36.
Dillaha, T.A., R.B. Reneau, S. Mostaghimi, and D. Lee. 1989. Vegetative
filter strips for agricultural nonpoint source pollution control. Transaction of the
American Society of Agricultural Engineers 32:513-519.

95
Douglas, C.L., King, K.A., Zuzel, J.F., 1998. Nitrogen and phosphorous
in surface runoff and sediment from a wheat-pea rotation in north-earstern
Oregon. Journal of Environmental Quality 27, 1170– 1177.
Dunkerley D.L. 2008. Rain event properties in nature and in rainfall
simulation experiments: a comparative review with recommendations for
increasingly systematic study and reporting. Submitted to Hydrological
Processes 22, 4415-4435.
Durnford, D., King, P., 1993. Experimental study of processes and
particle size distributions of eroded soil. J. Irrig. Drain. Eng. 119, 383–398.
Ekholm, P., 1994. Bioavailability of phosphorus in agriculturally loaded
rivers in southern Finland. Hydrobiologia 287, 179–194.
Ellison W.D. 1944. Studies of raindrop erosion. Agric. Eng. 25: 131-181.
Erskine, W.D., Mahmoudzadeh, A., Myers, C., 2002. Land use effects on
sediment yields and soil loss rates in small basins of Triassic sandstone near
Sydney, NSW, Australia. Catena 49 (4), 271–287.
Eshel, G., Levy, G.J., Mingelgrin, U. & Singer, M.J. 2004. Critical
evaluation of the use of laser diffraction for particle size distribution analysis.
Soil Science Society of America Journal, 68:pp. 736–743.
Evans, R. 1981. Potential soil and crop losses by erosion. Proceedings,
SAWMA Conference on Soil and Crop Loss: Developments in erosion control.
National Agricultural Centre, Stoneleigh.
Franklin D.H., Cabrera M.L., Steiner J.L., Endale D.M., Miller W.P.,
2001. Evaluation of percent flow captured by a small in-field runoff collector.
Transaction of ASAE 44:pp. 551–554.
96
Franklin D.H., Truman C, Potter T, Bosch D, Strickland T, Bednarz C.,
2007. Nitrogen and phosphorus runoff losses from variable and constant
intensity rainfall simulations on loamy sand under conventional and strip tillage
systems. J. Environ. Qual. 7, 36 (3):pp. 846-854.
Frost, C.A. and Speirs, R.B., 1984. Water erosion of soils in southeast
Scotland-a case study. Res. Dev. Agric., 1: 145-152.
Gabriels, D. and Moldenhauer, W.C. 1978. Size distribution of eroded
material from simulated rainfall – effect over a range of texture. Soil Science
Society of America Journal, 42, 954–958.
Gao, Q. Z., Tao, Z., Xie, M., Cui, K. and Zcng, F. (2003) Effects of
hydrological processes on the chemical composition of river in suspended
sediment in the Zhujiang River, China. Hydrol. Processes 17, 2365-2373.
Geib H.V., 1933. A new type of installation for measuring soil and water
losses from control plots. Journal of American. Society of Agronomy 25: 429–
440.
Ghadiri, H. and Rose, C.W. 1993. Water erosion processes and the
enrichment of sorbed pesticides: part 2. Enrichment under rainfall dominated
erosion process. Journal of Environmental Management, 37, 37–50.
Gilliam, J.W., J.L. Baker, and K.R. Reddy. 1999. Water quality effects of
drainage in humid regions. In: Agricultural drainage, Skaggs, R.W., and J. Van
Schilfgaarde (eds). Agronomy, monongrah 38:801- 830. Academic Press, New
York

97
Gray, D.H. and Brenner, P.R. 1970. The hydrology and stability of
cutover slopes. In: Proceedings, Symposium on Interdisciplinary Aspects of
Watershed Management, Montana State University. Bozeman, ASCE. pp. 295-
326.
Guy, H. P. and Ferguson, G. E. (1970) Stream sediment: an
environmental problem. J. Soil Water Conserv. 25(6), 217-221.
Gunatilake, H.M., Vieth, G.R., 2000. Estimation of on-site cost of soil
erosion: a comparison of replacement and productivity change methods. Journal
of Soil and Water Conservation 55, 197–204.
Hall, G.F., Logan, T.J., Young, K.K., 1985. Criteria for determining
tolerable erosion rates. In: Follet, R.F., Stewart, B.A. (Eds.), Soil Erosion and
Crop Productivity. American Society of Agronomy, Madison, WI, pp. 173–187.
Hansen, L.T., Breneman, V.E., Davison, C.W., Dicken, C.W., 2002. The
cost of soil erosion to downstream navigation. Journal of Soil and Water
Conservation 57, 205– 212.
Heathwaite, A. L.; Johnes, P. J., 1996. Contribution of Nitrogen Species
and Phosphorus Fractions to Stream Water Quality in Agricultural Catchments.
Hydrological Processes, vol. 10, 7, 971-983
Heckrath, G., Brookes, P.C., Poulton, P.R., Goulding, K.W.T., 1995.
Phosphorus leaching from soils containing different phosphorus concentrations
in the broadbalk experiment. J. Environ. Qual. 24, 904–910.
Helming K., 2001. Wind speed effects on rain erosivity. Sustaining the
Global Farm, 771-776.
98
Huang, G.H., Zhang, R.D., 2005. Evaluation of soil water retention curve
with the pore–solid fractal model. Geoderma 127, 52–61
Hudson, N. 1971. Soil Conservation. Cornell University Press, Ithaca,
New York
Hudson N.W, 1993. Field Measurement of Soil Erosion and Runoff. FAO
Soils Bulletin No. 68. FAO, Rome, pp 139.
Hussein M.H., Hussein A.J., Awad M.M., 1999. Phosphorus and nitrogen
losses associated with runoff and erosion on an Aridisol in northern Iraq.
Hydrological Science-Journal-des Sciences Hydrologiques, 44(5), October
1999.
Isermann, K., 1990. Share of agriculture in nitrogen and phosphorus
emission into the surface water of Western Europe against their background of
eutrophication. Fertil. Res. 26, 253–269.
ISTAT (Istituto Nazionale di Statistica), 2010. 6° Censimento generale
dell’agricoltura 2010.
Johnson, H.P, J.L Baker, W.D. Schrader, and J.M. Laflen. 1979. Tillage
system effects on sediment and nutrient in runoff from small watersheds.
Transactions of the ASAE 22(5):1110-1114.
Kosmas, C., Danalatos, N., Cammeraat, L.H., Chabart, M.,
Diamantopoulos, J., Farand, R., Gutierrez, L., Jacob, A., Marques, H.,
Martinez-Fernandez, J., Mizara, A., Moustakas, N., Nicolau, J.M., Oliveros, C.,
Pinna, G., Puddu, R., Puigdefa´bregas, J., Roxo, M., Simao, A., Stamou, G.,
Tomasi, N., Usai, N., Vacca, A., 1997. The effect of land use of runoff and soil
erosion rates under Mediterranean conditions. Catena 29, 45–59.

99
Kowalenko C.G., Babuin D., (2013). Inherent factors limiting the use of
laser diffraction for determining particle size distributions of soil and related
samples, Geoderma, 193–194:pp. 22-28.
Lal, R. 1976. No-tillage effects on soil properties under different crops in
western Nigeria. Soil Sci. Soc. Am. J. 40: 762-768.
Lal, R. 1976. Soil erosion problems on an Alfisol in Western Nigeria and
their control. IITA Monograph No. 1. Ibadan, Nigeria.
Lal, R., 1995. Erosion crop productivity relationships for soils of Africa.
Soil Science Society of America Journal 59, 661–667.
Laly, R., 1988. Erodibility and erosivity. In: Lal, R. (Ed.), Soil Erosion
Research Methods, pp. 141–162.
Lattanzi, A.R., Meyer, L.D. and Baumgardner, M.F. 1974. Influences of
mulch rate and slope steepness on interrill erosion. Proc. Soil Sci. Soc. Am.
38:946-950.
Lee, K-H., T.M. Isenhart, R.C. Schultz, and S.K. Mickelson. 2000.
Multispecies riparian buffers trap sediment andnutrients during rainfall
simulations. Journal of Environmental Quality 29:1200-1205.
Legg, J.O., and J.J. Meisinger. 1982. Soil nitrogen budgets. In: Nitrogen
In Agricultural Soils, ed. A.L. Page, 503-566. Madison WI: American Society
of Agronomy.
Lewis, L.A., 1981. The movement of soil materials during a rainy season
in Western Nigeria. Geodetma, 25: 13-25.

100
Loch, R.J., Donnollan, T.E., 1983. Field rainfall simulator studies on two
clay soils of the Darling downs, Queensland. II. Aggregate breakdown,
sediment properties and soil erodibility. Aust. J. Soil Res. 21, 47–58.
Lopez A., Garcia J., 2007. Nitrate content of soil solution in vineyard
under different soil maintenance systems. En: Bosch Serea, A.D., Teira
Esmatges, M.R., Villar Mir, J.M. (eds). Towards a better efficiency in N use,
pp. 111-113.
Lü Y., Fu B., Chen L., Liu G. and Wei W., 2007, Nutrient transport
associated with water erosion: progress and prospect. Progress in Physical
Geography 31(6), pp. 607–620.
Mariani, L., 2008. Il clima dell'Oltrepò, in Guida all'utilizzo della
denominazione di origine Pinot Nero in Oltrepò Pavese. Pavia, Consorzio
Tutela Vini: 15–20.
Martínez-Casasnovas, J.A., Sánchez-Bosch, I., 2000. Impact assessment
of changes in land use/conservation practices on soil erosion in the Penedès–
Anoia vineyard region (NE Spain). Soil Tillage Res. 57, 101–106.
Martinez-Mena, M., Alvarez Rogel, J., Albaladejo, J., Castillo, V.M.,
1999. Influence of vegetal cover on sediment particle size distribution in natural
rainfall conditions in a semiarid environment. Catena 38, 175– 190.
Matos A. T., Pinho A. P., Costa L. M., Morris L. A., 2008. Streamside
Management Zone (SMZ) Efficiency in Herbicide Retention from Simulated
Surface Flow. Planta Daninha, 26, 131-142.
Massey, H.F., Jackson, M.L., 1952. Soil. Science Society of American
Journal 16, 353–356.

101
McCormack, D. E., K. K. Young, and L. W. Kimberlin. 1982. Current
criteria for determining soil loss tolerance. Chapter 9 in Schmidt, B. L., R. A.
Allmaras, J. V. Mannering, and R. 1. Papendick, editors, Determinants of Soil
Loss Tolerance, ASA Special Publication No. 45, Am. Soc. Agr., Madison, W1
53711.
Meyer, L.D., 1981. How rain intensity affects interill erosion. Trans. Am.
Soc. Agr. Eng. 23 (4), 527–544.
Meyer, L.D., Harmon, W.C., McDowell, L.L., 1980. Sediment sizes
eroded from crop row side slopes. Transactions of the ASAE 23, 891–898.
Mitchell, J.K., Mostaghimi, S. & Pond, M.C. 1983. Primary particle and
aggregate size distribution of eroded soil from sequenced rainfall events.
Transactions of the American Society of Agricultural Engineers, 26, 1773–
1777.
Montero, E., 2005. Rényi dimensions analysis of soil particle-size
distributions. Ecol. Model. 182, 305–315.
Morgan, R.P.C., 1986. Soil degradation and soil erosion in the loamy belt
of northern Europe. In: G. Chisci and R.P.C. Morgan (Ed%), Soil Erosion in the
European Community: Impact of Changing Agriculture. A.A. Balkema,
Rotterdam, pp. 165-172.
Monke, E.J., Marelli, H.J., Meyer, L.D. and Dejong, J.F. 1977. Runoff,
erosion, and nutrient movement from interrill areas. Transactions of the
American Society of Agricultural Engineers, 20, 58–61.

102
Ng Kee Kwong, K.F., Bholah, A., Volcy, L., Pynee, K., 2002. Nitrogen
and phosphorous transport by surface runoff from a silty clay loam soil under
sugarcane in the humid tropical environment of Mauritius. Agriculture,
Ecosystems and Environment 91, 147– 157.
Ongley, E. D. ( 1996) Control of Water Pollution from Agriculture.
Irrigation and Drainage Paper 55. FAO, Rome, Italy.
Ongley, E. D., Bynoe, M. C. and Percival, J. B. (1981) Physical and
geochemical characteristics of suspended solids, Wilton Creek, Ontario. Can. J.
Earth Sci. 18, 1365-1379.
Ongley, E., Krishnappan, B. G., Droppo, I., Rao, S. and Maguire, R
(1992) Cohesive sediment transport: emerging issues for toxic chemical
management. Hydrobiologia 235/236, 177-187.
Ohno, T., and L.M. Zibilske. 1991. Determination of low concentrations
of phosphorus in soil extracts using malachite green. Soil Sci. Soc. Am. J.
55:892–895.
Orlandini, S. and Zanchi, C. 2005. Primi risultati idrologici ed erosivi in
due sistemazioni idraulico agrarie del Chianti. Atti XXVI Convegno della
Società Italiana di Agronomia, Foggia 20-22 settembre 2005, p. 454-455
Ortega-Achury S.L., Martínez-Rodríguez G.A., Sotomayor-Ramírez D.,
Muñoz-Muñoz M., 2007. Nutrient concentrations in runoff from different
manure amended fields of the tropics under natural rainfall conditions. J. Agric.
Univ. P.R. 91: 101-115
Ottone C., Rossetti R., 1980. Condizioni termo-pluviometriche della
Lombardia, Atti dell’Istituto Geologico dell’Università di Pavia, 29: pp. 27–48.

103
Pansak W., Kongkeaw T., Hilger T.H., Cadish G., 2005. Nitrogen Losses
by erosion and leaching in hillside cropping systems of northeast Thailand as
affected by soil conservation measures: a case study. Conference on
International Agricultural Research for Development. Tropentag 2005,
Stuttgart-Hohenheim, October 11-13, 2005.
PAP/RAC, 1997. Guidelines for Mapping and Measurement of Rainfall-
Induced Erosion Processes in the Mediterranean Coastal Areas. PAP-
8/PP/GL.1. Priority Actions Programme Regional Activity Centre
(MAP/UNEP), with the cooperation of FAO, Split, pp. 70.
Papini R., Bazzoffi P., Pellegrini S. et al., 1997. Perdite di nutrienti per
ruscellamento da suoli argillosi marginali a diversa utilizzazione nella Val
d’Era. Agricoltura Ricerca, n°170, pp. 21-32.
Pérez-Latorre F., de Castro L., Delgado A., 2010. A comparison of two
variable intensity rainfall simulators for runoff studies. Soil and Tillage
Research 107 (1):pp. 11-16.
Pieri L., Bittelli M., Hanuskova M., Ventura F., Vicari A., Pisa P.R..
2009. Characteristics of eroded sediments from soil under wheat and maize in
the North Italian Apennines. Geoderma 154(1-2):pp. 20-29.
Pierzynski, G.M. (ed.). 2000. Methods for phosphorus analysis for soils,
sediments, residuals, and waters. Southern Cooperative Series Bulletin No. 396,
110 pages.
Pimentel D., Harey, C., Rososudarmo, P., Sinclair K., Kurz, D., Mcnair
M., Christ S., Shpritz, L. Fitton L., Saffouri R., Blair R.; 1995. Environmental
and economic costs of soil erosion and conservation benefits. Science, 267: pp.
1117–1123.

104
Pimentel, D., Terhune, E. C., Dyson-Hudson, R., Rochereau, S., Samis,
R., Smith, E. A., Denman, D., Reifschneider, D. and Shepard, M., 1976. Land
degradation: effects on food and energy resources. Science, 194: 149-155.
Foy, R.H., Smith, R.V., Jordan, C., Lennox, S.D., 1995. Upward trend in
soluble phosphorus loadings to Lough Neagh despite phosphorus reduction at
sewage treatment works. Water Res. 29 (4), 1051–1063.
Pinson W.T., Yoder D.C., Buchanan J.R., Wright W.C., Wilkerson
J.B.,2004. Design and evaluation of an improved flow divider for sampling
runoff plots, Applied Engineering in Agriculture 20 (4): 433–438.
Poesen, J., Hooke, J.M., 1997. Erosion, flooding and channel
management in the Mediterranean environments of southern Europe. Progress
in Physical Geography 21, 157– 199.
Portielje, R. and D. van der Molen, 1999. Relationships between
eutrophication variables: from nutrient loading to transparency. Hydrobiologia,
408/409: 375–387
Ramos, M.C., Martínez-Casasnovas, J.A., 2004. Nutrient losses from a
vineyard soil in North eastern Spain caused by an extraordinary rainfall event.
Catena 55, 79– 90.
Ramos, M.C., Martínez-Casasnovas, J.A. 2006. Nutrient losses by runoff
in vineyards of the Mediterranean Alt Penedès region (NE Spain). Agriculture,
Ecosystems and Environment, 113, 356-363.
Ramos, M.C., Porta, J., 1994. Rainfall intensity and erosive potentiality
in the NE Spain Mediterranean area: results on sustainability of vineyards. Il
Nuovo Cimento 17, 291– 299.

105
Rayan K.T., 1981. Sediment measurement techniques used by the Soil
Conservation Service of New South Wales, Australia. Proceedings of the
Florence Symposium: Erosion and Sediment Transport Measurement. Florence
June 1981. IAHS publication n. 133: 151–157.
Reichert, J.M., Norton, L.D., Huang, C., 1994. Sealing, amendment and
rain intensity effects on erosion of high clay soils. Soil Sci. Soc. Am. J. 58,
1199–1205.
Reyes M.R., Gayle G.A., Raczkowski C.W., 1999. Testing of a multislot
divisor fabricated from plastic. Transaction of the ASAE 42 (3): 721–723.
Reposa J.H., Pandit A., 1994. Inorganic nitrogen, phosphorus and
sediment losses from a citrus grove during storm water runoff. Florida Institute
of Technology.
Römkens, M. J. M., Prasad, S. N., and Gerits, J. J. P.: Soil erosion modes
of sealing soils: a phenomenological study, Soil Technol., 11, 31–41, 1997.
Roose, E.J. 1988. Soil and water conservation lessons from steep-slope
farming in French-speaking countries of Africa. In: Conservation Farming on
Steeplands. W.C. Moldenhauer and N.W. Hudson (eds.) pp. 129-139. SWCS,
Ankeny, IA.
Roose, E., 1996. Land Husbandry: Components and Strategy. 70 FAO
Soils Bulletin. Food and Agriculture Organization of the United Nations, Rome.
Shainberg, I., Warrington, D. And Laflen, J.M. 1992. Soil dispersibility,
rain properties, and slope interaction in rill formation and erosion. Soil Science
Society of America Journal, 56, 278–283.

106
Sharon, D.: The distribution of hydrologically effective rainfall incident
on sloping ground, J. Hydrol., 46, 165–188, 1980.
Sharpley A.N., 1997. Rainfall frequency and nitrogen and phosphorus
runoff from soil amended with poultry litter J. Environ. Qual. 26,1127-1132
Sharpley A.N., Smith S.J., 1992 Prediction of bio available phosphorous
loss in agricultural runoff. J. Environ. Qual. 21: 32–37
Sharpley, A. N., Smith, S. J., 1995 Nitrogen and phosphorus forms in
soils receiving manure. Soil Sci. 159,253-258.
Sheridan, J. M., Lowrance R. R., Henry H. H., 1996. Surface flow
sampler for riparian studies. Applied Eng. in Agric. 12(2): 183-188.
Sheridan J. M., Lowrance R. R., Bosch D. D., 1999. Management effects
on runoff and sediment transport in riparian forest buffers. Transactions,
American Society of Agricultural Engineers 42:55–64.
Shi, Z. H., Fang, N. F., Wu, F. Z., Wang, L., Yue, B. J., and Wu, G. L.:
Soil erosion processes and sediment sorting associated with transport
mechanisms on steep slopes, J. Hydrol., 454–455, 123–130, 2012.
Sistani K.R., Brink G.E., Oldham. J.L., 2008. Managing broiler litter
application rate and grazing to decrease watershed runoff losses. J. Environ.
Qual. 37:718–724.
Smith, R.E., Goodrich, D., and Quinton, J.N. 1995. Dynamic, distributed
simulation of watershed erosion: The KINEROS2 and EUROSEM models.
Journal of Soil and Water Conservation.

107
Sombatpanit S., Jai-Aree S., Sermsatanasusdi P., Hirunwatsiri S.,
Poonpanich C., 1990. Design of a double-split divisor for runoff plots. In:
Boardman J., Foster I.D.L, Dearing J.A., Soil Erosion on Agricultural Land.
John Wiley and Sons. Chichester, pp 687.
Soil Survey Staff. 2010. Keys to Soil Taxonomy, 11th ed. USDA-Natural
Resources Conservation Service, Washington, DC.
Sotomayor-Ramírez D., Ramírez-Avila J., Mas E., Martínez G., 2008.
Erosion and nutrient loss reduction with an alternative planting method for
coffee (Coffea arabica). J. Agric. Univ. P.R. 92: 153-169.
Spann, W.P., Sikking, A.F.S., Hoogmoed, W.B., 2005. Vegetation barrier
and tillage effects on runoff and sediment in an alley crop system on a Luvisol
in Burkina Faso. Soil Tillage Res. 83, 194–203.
Speth, J.G.: 1994, Towards an Effective and Operational International
Convention on Desertification, New. York, United Nations, International
Convention on desertification
Stutter, M.I., Langan, S.J., Cooper, R.J., 2008. Spatial and temporal
dynamics of stream water particulate and dissolved N, P and C forms along a
catchment transect, NE Scotland. J. Hydrol. 350, 187–202.
Toy T.J., Foster G.R., Renard K.G., 2002. Soil erosion: Processes,
prediction, measurement, and control. John Wiley and Sons, New York, pp 352.
Tropeano, D., 1983. Soil erosion on vineyards in the Tertiary
Piedmontese basin (north western Italy): studies on experimental areas. Catena
Suppl.4, 115–127.

108
Udawatta, R.P., Motavalli, P.P., Garrett, H.E., 2004. Phosphorus Loss
and Runoff Characteristics in Three Adjacent Agricultural Watersheds with
Claypan Soils. Journal of Environmental Quality 33, 1709-1719.
Udawatta R. P., Motavalli P.P., Garrett H.E., Krstansky J.J., 2006,
Nitrogen losses in runoff from three adjacent agricultural watersheds with
claypan soils, Agriculture, Ecosystems and Environment 117, 39–48.
United States Department of Agriculture, 1986. Urban hydrology for
small watersheds. Technical Release 55 (TR-55) (Second Edition). Natural
Resources Conservation Service, Conservation Engineering Division,
Springfield, pp 164.
US EPA, 1986. Quality Criteria for Water. Office of Water Regulation
and Standards. EPA-440/586-001.
Usón, A., 1998. Medidas de control de la erosión en suelos de vinã de las
comarcas Anoia–Alt Penedès (Barcelona): Efectividad y viabilidad. PhD
Thesis, University of Lleida, Lleida, p. 260.
Valderrama, J.C. 1981. The simultaneous analysis of total nitrogen and
total phosphorus in natural waters. Mar. Chem. 10: 109-122.
Verstraten, G., Poesen, J., 2002. Regional scale variability in sediment
and nutrient delivery from small agricultural watersheds. Journal of
Environmental Quality 31, 870– 879.
Verstraeten, G., Poesen, J., Govers, G., Gillijns, K., Van Rompaey, A.,
VanOost, K., 2003. Integrating science, policy and farmers to reduce soil loss
and sediment delivery in Flanders, Belgium. Environmental Science and Policy
6, 95– 103.

109
Wainwright, J., 1996. Infiltration, runoff and erosion characteristics of
agricultural land in extreme storm events, SE France. Catena 26, 24–47.
Warrington, D., Shainberg, I., Agassi, M. and Morin, J. 1989. Slopeand
phosphogypsum’s effects on runoff and erosion. Soil Science Society of
America Journal, 53, 1201–1205.
Warrington, D.N., Mamedov, A.I., Bhardwaj, A.K., Levy, G..J.,2009.
Primary particle size distribution of eroded material affected by degree of
aggregate slaking and seal development. European Journal of Soil Science, 60:
84-93.
Water National Quality Inventory, http://www.epa.gov/OWOW/
NPS/facts/point1.htm, 1994.
White W. J., Pinho A., Morris L.A., Jackson C.R.,2003. Proceedings of
the 2003 Georgia Water Resources Conference, held April 23-24, 2003, at the
University of Georgia. Kathryn J. Hatcher, editor, Institute of Ecology, The
University of Georgia, Athens, Georgia.
Wicherek, S., 1991. Viticulture and soil erosion in the north of Parisian
Basin. Example: the Mid Aisne region. Z. Geomorph. N.F., Suppl.-Bd.83, 115–
126.
Willems, P.: A spatial rainfall generator for small spatial scales, J.
Hydrol., 252, 126–144, 2001
Woodward, D.E., 1999. Method to predict cropland ephemeral gully
erosion. Catena 37, 393– 399.
WRB (World reference base for soil resources) 2006.World Soil
Resources Reports No. 103. FAO, Rome.

110
Young, R.A., 1980. Characteristics of eroded sediment. Trans. ASAE 23
(1139–1142),1146.
Young, R.A. and Onstad, C.A. 1978. Characterization of rill and interrill
eroded soil. Transactions of the American Society of Agricultural Engineers,
21, 1126–1130.
Young, R.A. andWiersma, J.L. 1973. Role of rainfall impact in soil
detachment and transport. Water Resources Research, 9, 1629–1636.
Xue L., Huo T., Zhang R., Li D., 2008. The distribution of nitrogen in
soil and rainfall intensity on nitrogen infiltration flux influence in partly
saturated soil. Bioinformatics and Biomedical Engineering, 2008. ICBBE 2008.
Zeng, S.C., Su, Z.Y., Chen, B.G., Wu, Q.T., Ouyang, Y., 2008. Nitrogen
and phosphorus runoff losses from orchard soils in South China as affected by
fertilization depths and rates. Pedosphere 18 (1), 45–53.
Zhang, G.L., Yang, J.L., Zhao, Y.G., 2003. Nutrient discharge from a
typical watershed in the hilly area of subtropical chain. Pedosphere 13 (1), 23–
30.


112
Curriculum vitae
Ettore Bernardoni was born in Voghera on March 19, 1982. In 2001 he
obtained a diploma of secondary school from the Istituto TecnicoAgrario
Statale "Carlo Gallini" with a vote of 90/100. He frequented the
University of Milan, Faculty of Agriculture. He graduated in Agricultural
Sciences and Technologies (1st Level Degree Course) with 105/110
marks, on February 2006. On April 2008 he graduated in Agricultural
and Environmental Sciences (2st Level Degree Course) with 108/110
marks. After degree, he started to carry out research in the Department of
Plant Production. In March 2008 he obtained a bursary at the Department
of Plant Production at the University of Milan. In March 2011 he
obtained a research grant at the Department of Plant Production at the
University of Milan. In October 2012 he stated to work for ERSAF (Ente
Regionale Servizi Agricoltura e Foreste) at the Department of
Agricultural Services, division of Services Networks, Research and
Experimentation.
Recommended