8/3/2019 Financial Health of a Company
http://slidepdf.com/reader/full/financial-health-of-a-company 1/42

8/3/2019 Financial Health of a Company
http://slidepdf.com/reader/full/financial-health-of-a-company 2/42
Pre-Read Module 1-3: Finance for Business Leaders
2
Another measure of profitable growth is return on assets or ROA. This defines the
percent that the company is earning on its total assets (which include such items as
cash, accounts receivable, inventory and fixed assets – land, buildings and equipment).
ROA is:
There are also other measures that can be used, such as return on capital or ROC.
Capital is defined as equity plus interest-bearing debt. ROC is:
One other financial indicator must be mentioned, earnings per share or EPS and istaught in succeeding Learning Bursts. EPS is:
This measure is often used by financial analysts to judge a company’s performance. In
many instances, when companies strive to grow profit faster than revenue, the profit
they are referring to is EPS.
Does your company have specific target levels for ROE or ROA or ROC? If so what arethey?
For example, several companies that we have worked for have stated their targets as
ROE = 25% and ROA = 10%.

8/3/2019 Financial Health of a Company
http://slidepdf.com/reader/full/financial-health-of-a-company 3/42
Pre-Read Module 1-3: Finance for Business Leaders
3
Quiz
1. Which financial target is used to measure a company’s market share?
a. profit
b. cash flow
c. sales
d. return-on-investment
2. Which of the following is not used as a measure of a company’s return-on-
investment?
a. Return on capital
b. Return on sales
c. Return on equity
d. Return on assets
3. According to financial analysts, the most important financial objective of a
company is to?
a. Surviveb. Grow its revenue
c. Achieve a high net profit margin
d. Increase the company’s value to its owners
8/3/2019 Financial Health of a Company
http://slidepdf.com/reader/full/financial-health-of-a-company 4/42
Pre-Read Module 1-3: Finance for Business Leaders
4
2. THE IMPORTANCE OF
CREATING SHAREHOLDER V ALUE
From a business perspective, the most important thing that a company can do is to
create value for its owners. Indeed, if it is possible, it should try to maximize this value.
All employees of a company, regardless of whether they own shares of stock in the
company should strive to achieve value maximization. It is more rewarding, both in
compensation, job, or career opportunities to work in financially healthy companies
that are maximizing shareholder value. The negative consequences for employees of
companies that fail to improve or maximize shareholder value are all too well known.
Key Learning Point: Share price and market value
For publicly held companies whose shares are traded in the stock market, their stock
price (also called their share price) is a primary measure of market value. In fact, the
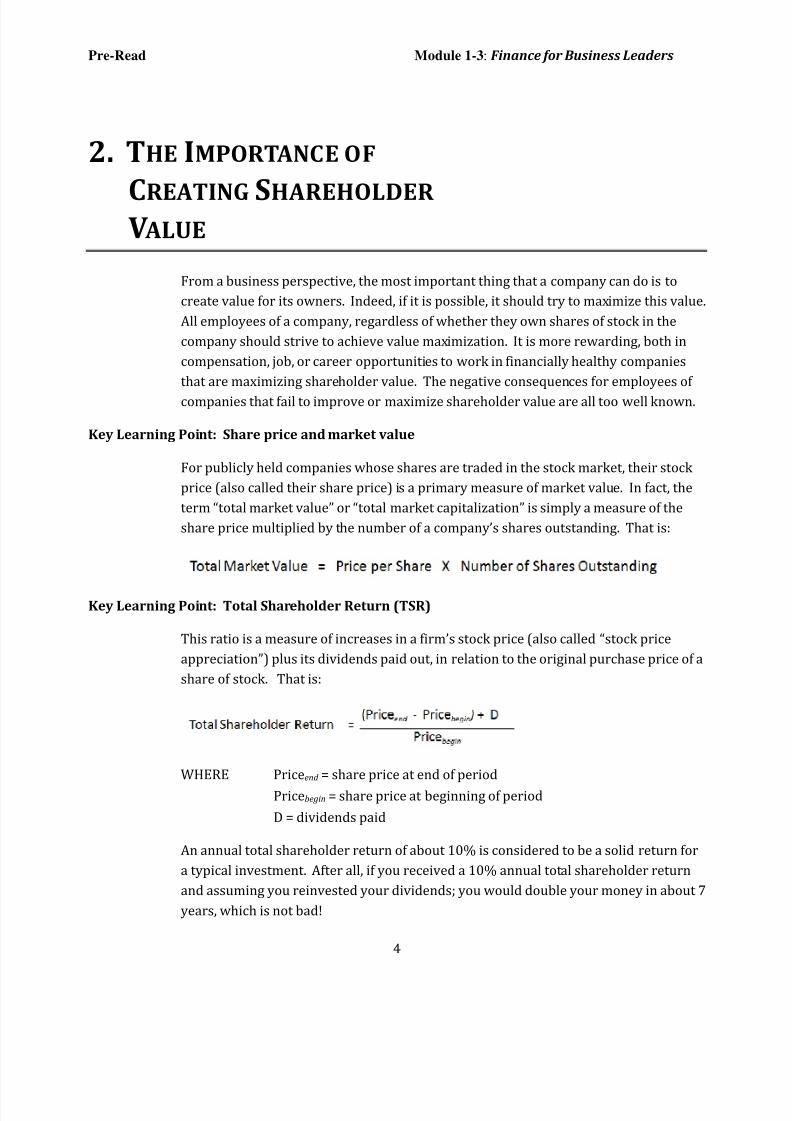
term “total market value” or “total market capitalization” is simply a measure of the
share price multiplied by the number of a company’s shares outstanding. That is:
Key Learning Point: Total Shareholder Return (TSR)
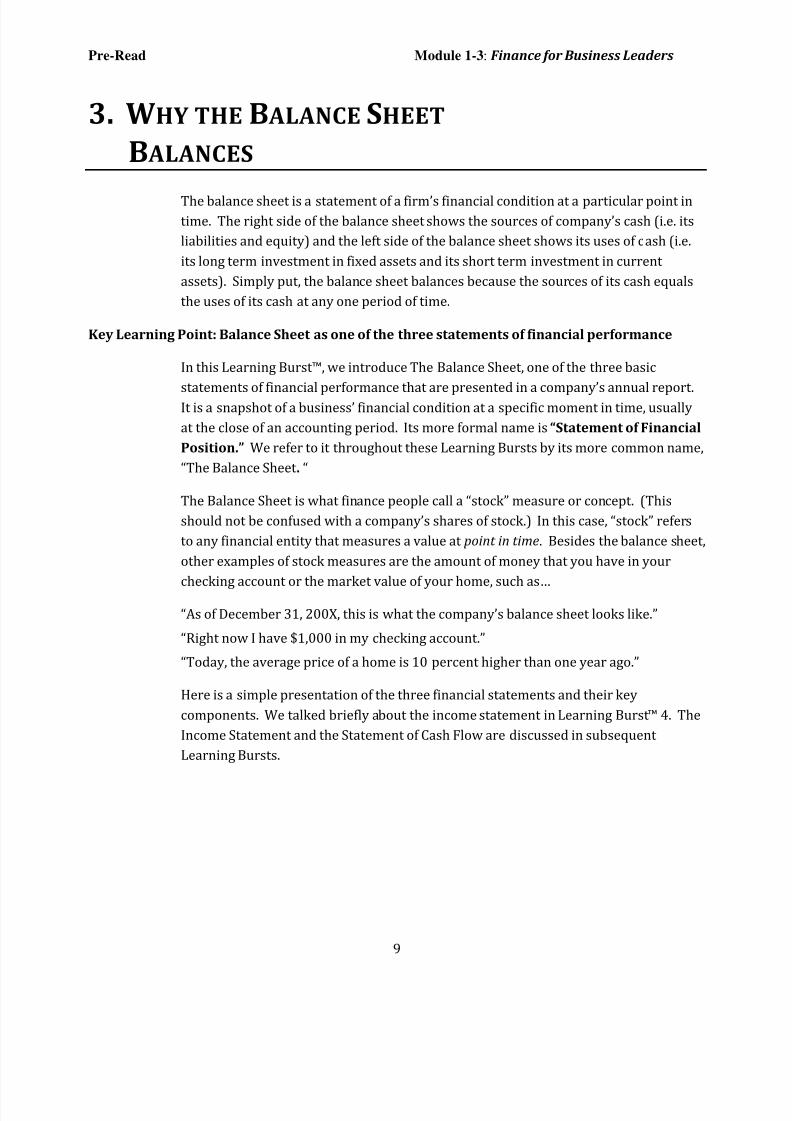
This ratio is a measure of increases in a firm’s stock price (also called “stock price
appreciation”) plus its dividends paid out, in relation to the original purchase price of a
share of stock. That is:
WHERE Priceend = share price at end of period
Pricebegin = share price at beginning of period
D = dividends paid
An annual total shareholder return of about 10% is considered to be a solid return for
a typical investment. After all, if you received a 10% annual total shareholder return
and assuming you reinvested your dividends; you would double your money in about 7
years, which is not bad!

8/3/2019 Financial Health of a Company
http://slidepdf.com/reader/full/financial-health-of-a-company 5/42
Pre-Read Module 1-3: Finance for Business Leaders
5
For the past five years, what is your company’s TSR?
What conclusions can you draw from this?
Key Learning Point: Price-Earnings Ratio (also called P-E Ratio, P-E Multiple, and Earnings
Multiple)
This ratio measures the relationship between a company’s stock price per share and its
earnings per share. The formula below shows how the P-E ratio is computed:
If last year’s earnings are used, then this ratio is referred to as the Trailing P-E Ratio. If
the projections of next year’s earnings per share are used, then the term Forward P-E
Ratio is used. The average P-E ratio of companies on the major stock exchanges in the
United States in past years is about 16.
Here are some important points to think about when you evaluate the P-E ratio of any
company:
1. Is the company’s ratio comparable to that of similar types of companies?
2. What is the average P-E ratio of this company’s industry? How does the
company compare with the industry average? Remember that P-E ratios can
differ among different industries.
3. What is the company’s growth potential? Generally companies with higher
growth potentials have higher P-E ratios.
What is your company’s EPS?
For last year, what is your company’s P-E Ratio? What is your industry’s average P-E
ratio? How do the two compare?
What steps can your company take to try to increase the P-E ratio?
Note: Because the potential growth of a company is an important factor that influences
its P-E ratio, many companies try to make sure that investors recognize their growth

8/3/2019 Financial Health of a Company
http://slidepdf.com/reader/full/financial-health-of-a-company 6/42
Pre-Read Module 1-3: Finance for Business Leaders
6
potential. For example, companies stress their increasing market presence in the
rapidly growing BRIC (Brazil, Russia, India and China) countries.
Does your company have a “BRIC” Strategy?
If so, what is it?
Key Learning Point: Market-to-Book Ratio
This ratio shows the relationship between a company’s total market value and its book
value. Simply put, a company’s “book value” is the value of its owners’ equity. The
basic idea is that at any given point in time, the equity on a company’s balance sheet indicates the total worth of the company to its owners based on the book value of its
assets minus all of the firm’s obligations to its creditors (i.e. its liabilities). The formula
to compute the Market-to-Book Ratio of a company is:
Let’s use a simple balance sheet to illustrate this. Using the simple balance sheet
shown below, we see that the Beacon Company’s Market-to Book Ratio is:

8/3/2019 Financial Health of a Company
http://slidepdf.com/reader/full/financial-health-of-a-company 7/42

8/3/2019 Financial Health of a Company
http://slidepdf.com/reader/full/financial-health-of-a-company 8/42
Pre-Read Module 1-3: Finance for Business Leaders
8
If you were conducting a quarterly results call with 15 analysts, what would you say to
them about your company’s performance? What message would you want to
communicate to the team you lead?
Quiz (check your answers in Appendix B)
1. The “Price-Earnings Ratio” is …
a. The price per share divided by earnings
b. The price per share divided by EPS
c. Stock price divided by profit
d. Stock price divided by a multiple of earnings
2. Which of the following indicates that a company is successful in creating value forits owners?
a. The Market-to-Book Ratio is equal to the P-E ratio
b. Total Shareholder return is positive
c. The Market-to-Book Ratio is positive
d. The P-E ratio is greater than 20
3. Which one of these ratios most closely measures the actual return that owners of a
company have received from their investment in a company?
a. The P-E Ratiob. The Market to Book Ratio
c. Total Shareholder Return
d. All of them indicate the actual return earned by owners of a company
8/3/2019 Financial Health of a Company
http://slidepdf.com/reader/full/financial-health-of-a-company 9/42
Pre-Read Module 1-3: Finance for Business Leaders
9
3. WHY THE B ALANCE SHEET
B ALANCES
The balance sheet is a statement of a firm’s financial condition at a particular point in
time. The right side of the balance sheet shows the sources of company’s cash (i.e. its
liabilities and equity) and the left side of the balance sheet shows its uses of cash (i.e.
its long term investment in fixed assets and its short term investment in current
assets). Simply put, the balance sheet balances because the sources of its cash equals
the uses of its cash at any one period of time.
Key Learning Point: Balance Sheet as one of the three statements of financial performance
In this Learning Burst™, we introduce The Balance Sheet, one of the three basic
statements of financial performance that are presented in a company’s annual report.It is a snapshot of a business’ financial condition at a specific moment in time, usually
at the close of an accounting period. Its more formal name is “Statement of Financial
Position.” We refer to it throughout these Learning Bursts by its more common name,
“The Balance Sheet . “
The Balance Sheet is what finance people call a “stock” measure or concept. (This
should not be confused with a company’s shares of stock.) In this case, “stock” refers
to any financial entity that measures a value at point in time. Besides the balance sheet,
other examples of stock measures are the amount of money that you have in your
checking account or the market value of your home, such as…
“As of December 31, 200X, this is what the company’s balance sheet looks like.”
“Right now I have $1,000 in my checking account.”
“Today, the average price of a home is 10 percent higher than one year ago.”
Here is a simple presentation of the three financial statements and their key
components. We talked briefly about the income statement in Learning Burst™ 4. The
Income Statement and the Statement of Cash Flow are discussed in subsequent
Learning Bursts.

8/3/2019 Financial Health of a Company
http://slidepdf.com/reader/full/financial-health-of-a-company 10/42
Pre-Read Module 1-3: Finance for Business Leaders
10
Here is a simple Balance Sheet and how it operates relative to the Income Statement
and Statement of Cash Flows.
It
comprises assets, liabilities, and owners’ or stockholders’ equity. At any given time,
assets must equal liabilities plus owners’ equity. The Balance Sheet along with the
Income Statement and Statement of Cash Flows make up The Principal Elements of the
Financial Report.
Key Learning Point: Why the Balance Sheet “Balances”
Every accounting student learns on the first day of class what accountants call the
“accounting equation.” That is: assets (A) must be equal to Liabilities (L) and Equity
(E). In other words:
To understand why, let’s look at definitions of each term.
Assets: Resources that a company invests in that are intended to generate future
streams of revenue, profit, and cash. Examples of assets are property, plant and
equipment, inventory, and accounts receivable.
Liabilities: Money that a company has borrowed and is obligated to repay. It includes
such obligations as money owed to creditors such as banks or suppliers.
Equity: (Also called “Total Equity, Owners’ Equity or Shareholders’ Equity) this is the
monetary value that represents the owners’ investment in the business.
Essentially, the balance sheet “balances” because the right-hand side of the balance
sheet (or the right side of the accounting equation) represents money that the
company’s creditors and owners have put into the company. The left-hand side of the
balance sheet (or the left side of the accounting equation) indicates what the managers
did with this money.

8/3/2019 Financial Health of a Company
http://slidepdf.com/reader/full/financial-health-of-a-company 11/42
Pre-Read Module 1-3: Finance for Business Leaders
11
Let’s try a short exercise to test your understanding.
Question 1: On the balance sheet where did the company get its cash?
Answer 1: From creditors and owners.
Question 2: Where did the cash go?
Answer 2: It was used to purchase the company’s assets.
Question 3: Why?
Answer 3: Because this investment in assets is intended to generate future revenue,
profit and cash flow. Enough to meet the obligations of the creditors and the
expectations of the owners for a return on their investment in the company.
This is why we say in the audio segment: “Where from? (Liabilities and Equity) Where
to? (Assets) and So what? (Revenue, Profit, Cash Flow).
Key Learning Point: Major Components of Assets, Liabilities, and Equity
We now look at the main components of a company’s assets, liabilities, and equity.
Sometimes, to make the distinction between each of these categories and their specific
components, finance people use the term “total.” Unless specified, you can assume that
when the term is used without any particular designation, it refers to the total. For
example, “assets” means “total assets.”
Total Assets
Current Assets: These are either cash or components that the company believes will
be converted into cash with a short period of time (less than one year from the time
the balance sheet is stated). The other components are: accounts receivable (moneyowed to the company by its customers) and inventory (goods bought or produced but
not yet sold).
Fixed Assets: Fixed assets are investments that tie up a company’s cash for more than
one year. Examples are property, plant, and equipment.

8/3/2019 Financial Health of a Company
http://slidepdf.com/reader/full/financial-health-of-a-company 12/42
Pre-Read Module 1-3: Finance for Business Leaders
12
Intangible Assets: As the name implies, these are fixed assets that are “intangible,” i.e.
they cannot be touched or felt. Examples are software and intellectual property, such
as patents and goodwill.2
For simplicity, throughout the Learning Bursts, we will consider both tangible fixed
assets and intangible assets to be part of the category “Fixed Assets.”
What are some of your company’s Fixed Assets?
Total Liabilities
Current Liabilities: These are obligations that the company must satisfy to its
creditors within one year of the statement of the balance sheet. Examples of these are
accounts payable (money owed to suppliers) and notes payable (money owed to
banks).
Long-term Liabilities: These are obligations that the company must satisfy more
than a year after the statement of the balance sheet. An example of this is a 5-year
bond.
What are some of your company’s Liabilities?
Total Equity (Also called Shareholders’ or Owners’ Equity)
Capital Stock: This is the value of the shares of stock when first issued to the owners
of the company.
Accumulated Retained Earnings (also called reinvested earnings): This is the totalamount of net profit that the company has earned each year, accumulated from the
2 To avoid getting too technical, let us simply say that goodwill represents the premium that a
company pays when it buys another company. This premium could represent the company’s brand,
its customer list, or the special skills and knowledge of its employees, all of which can be considered
“intangible.”

8/3/2019 Financial Health of a Company
http://slidepdf.com/reader/full/financial-health-of-a-company 13/42
Pre-Read Module 1-3: Finance for Business Leaders
13
time the company was started, minus the pay-out of dividends over this same time
period.
Key Learning Point: How the Balance Sheet is Constructed
Let’s demonstrate how the Balance Sheet works using the example from the audio
segment about Phil starting a restaurant and buying refrigerators from Dave’s
appliance store.
February 1st . Phil starts his restaurant with an equity investment from his family,
friends, and his personal savings. He issues 90 shares of stock at a price of $1,000 per
share. Thus, we can say that his capital stock is 90 x $1,000 or $90,000. Phil was also
able to obtain a small business loan of $10,000 from his local bank.
During the month of February, he took the money to buy an already existing restaurant
for $75,000. The equipment was worth $40,000. In addition, he made $10,000 of
capital improvements in the restaurant. Therefore his fixed assets are $50,000. Therealso was “goodwill” established by the previous owner worth $25,000. This is how his
balance sheet looked like at the end of the month.
Notice how the “right-hand” side of the balance sheet in effect is financing the “left-
hand” side of the balance sheet. In the audio, we explain that the right side shows
where the money is coming from in order for Phil to start his restaurant. In this case, it
comes from an equity investment of $90,000 and a loan of $10,000.
Other sources of future funding could come from additional loans and profits that are
not paid out in dividends to the owners (called “accumulated retained profit”). It could
also come from the current term such as accounts payable.
8/3/2019 Financial Health of a Company
http://slidepdf.com/reader/full/financial-health-of-a-company 14/42
Pre-Read Module 1-3: Finance for Business Leaders
14
The best way to become familiar with the balance sheet and its components is to work
on some exercises. Try the following.
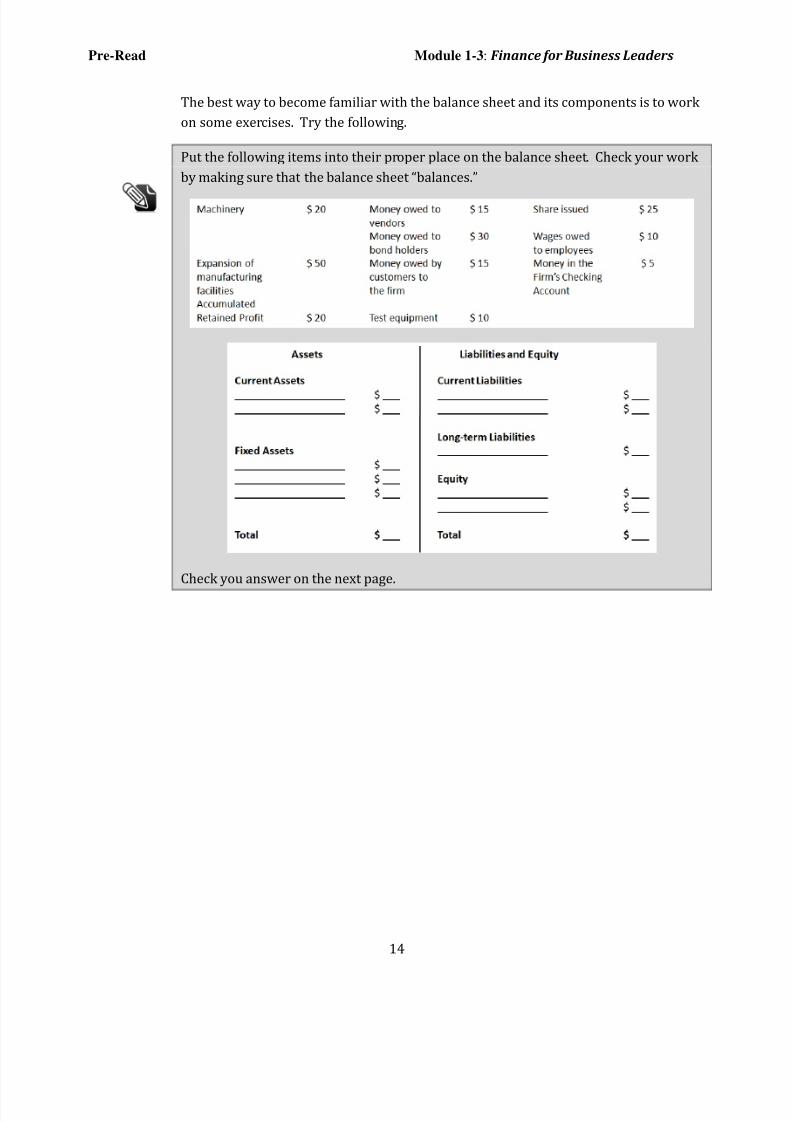
Put the following items into their proper place on the balance sheet. Check your work
by making sure that the balance sheet “balances.”
Check you answer on the next page.

8/3/2019 Financial Health of a Company
http://slidepdf.com/reader/full/financial-health-of-a-company 15/42
Pre-Read Module 1-3: Finance for Business Leaders
15
And the answer is …
Here’s another exercise that you can do, this time using your own company’s balancesheet.
Review your company’s balance sheet and identify the value of the following:
Total Assets ___________________________________
Total Liabilities ___________________________________
Total Shareholders’ Equity ___________________________________
Accounts Receivable ___________________________________
Accounts Payable ___________________________________
Cash on Hand ___________________________________
Quiz (check your answers in Appendix B)
1. Which of the following is a current asset?
a. Inventory
b. Accounts Payable
c. Machinery
d. Share Capital
2. What is the difference between a short-term liability and a long-term liability?
a. Short-term liability does not have to be repaid
b. Short-term liability must always match current assets
c. Short-term liability must be repaid within one year, long-term, beyond
one year

8/3/2019 Financial Health of a Company
http://slidepdf.com/reader/full/financial-health-of-a-company 16/42
Pre-Read Module 1-3: Finance for Business Leaders
16
d. Short-term must be repaid within one month, long-term liability,
beyond one month
3. Which item is not included in Owners’ Equity?
a. Cash
b. Accumulated retained earningsc. Capital stock
d. All are included

8/3/2019 Financial Health of a Company
http://slidepdf.com/reader/full/financial-health-of-a-company 17/42
Pre-Read Module 1-3: Finance for Business Leaders
17
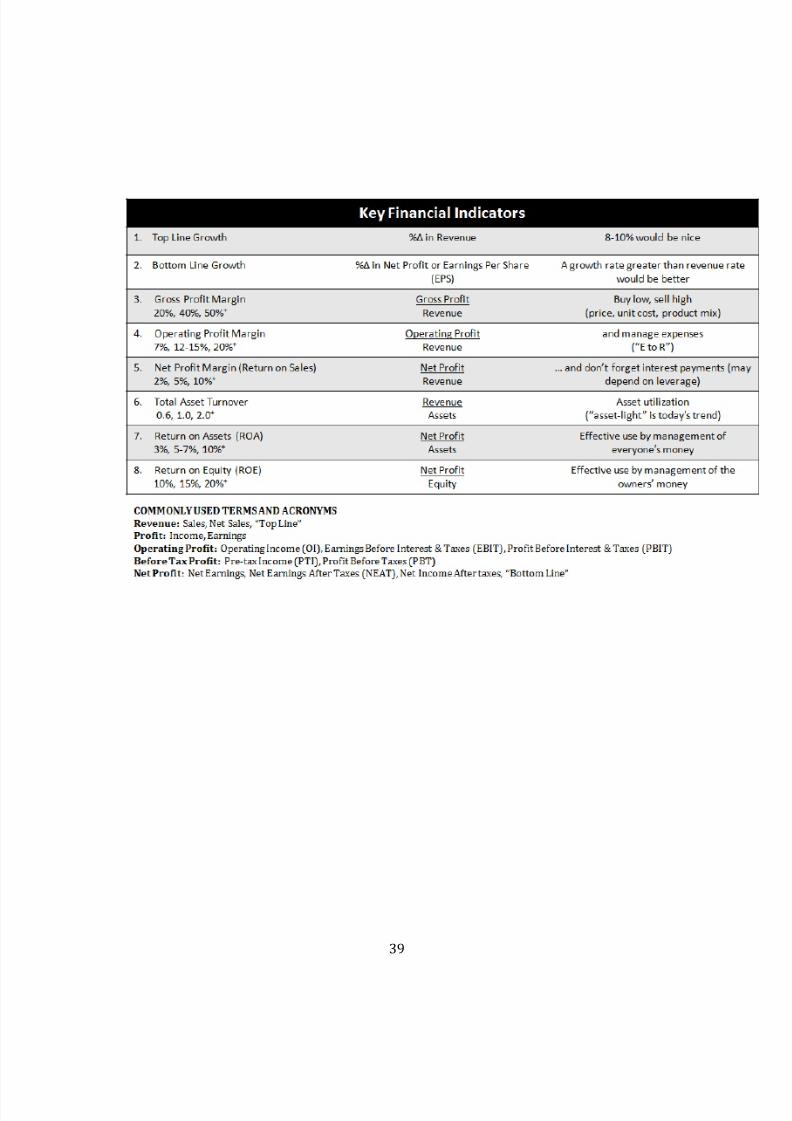
4. FROM TOP LINE
TO BOTTOM LINE
The top line of a company’s income statement is revenue or sales, and the bottom line
is net profit or net income.3 In between there are different levels of profit such as
gross profit, operating profit, and pre-tax profit. Other important line items on an
income statement are cost of goods sold, expenses, interest and taxes. Knowing these
items helps to analyze the different levels of profit.
Key Learning Point: The Distinction between Measures of “Stock” and “Flow”
A measure of financial performance for a given point in time is called a “stock
measure,” and a measure of performance for a given period of time is called a “flow
measure.” The Balance Sheet is a stock measure and the Income Statement is a flowmeasure. Therefore, any item on the Balance Sheet (e.g. cash, inventory, accounts
receivable, and fixed assets) is a stock measure. Any item on the Income Statement
(e.g., revenue, cost of goods sold, expenses, interest, and taxes) is a flow measure.
Question: In addition to the Balance Sheet and the Income Statement, there is a third
important financial statement in a company’s annual report called the “Statement of
Cash Flows.” Is this a stock or a flow measure?
Answer: As the name implies, it is a flow measure. Perhaps you thought we gave youa “trick question?”
3 The term “net profit” (or simply profit) is most commonly used in everyday financial discussions.
The term “net income” is the term generally used in the income statement in a company’s annual
report.

8/3/2019 Financial Health of a Company
http://slidepdf.com/reader/full/financial-health-of-a-company 18/42
Pre-Read Module 1-3: Finance for Business Leaders
18
Key Learning Point: Brief Description of the Major Items on an Income Statement
A typical Income Statement contains the following major items.
Revenue (also called Sales): Total monetary amount received or to be received later
from customers from the sale of products or provision of services during a given
reporting period.
Cost of Goods Sold (also called Cost of Sales or Cost of Revenue): Total cost of the
goods that were sold during the reporting period. For a manufacturer, this would
involve the cost of making the products that they shipped. For a retailer, this would
involve the wholesale cost of the goods that were sold to its retail customers. For a
provider of services, this would involve the cost of providing billable services,
particularly labor cost.
Operating Expenses: All expenses other than cost of goods sold. The main items
usually listed by companies are selling (includes marketing), general, and
administrative expenses (S, G, and A) and research and development (R&D).
Depreciation: Portion of the original cost of certain fixed assets (e.g., buildings,
machinery, equipment, tools, furniture, etc.) that is recorded as a cost or expense
during the reporting period.
Interest: Total interest payments on the firm’s debt owed during the reporting
period.
Taxes: Total income taxes due to the government during the reporting period.

8/3/2019 Financial Health of a Company
http://slidepdf.com/reader/full/financial-health-of-a-company 19/42
Pre-Read Module 1-3: Finance for Business Leaders
19
Net Income: Total amount of money that the firm earned during the reporting period
after all accrued expenditures have been subtracted from revenue. Other terms for Net
Income include: Net Profit, Net Profit After Taxes, Earnings, Net Earnings, Net Earnings
After Taxes, or simply the “Bottom Line.”
Key Learning Point: The Treatment of Depreciation on the Income Statement
As explained in Learning Burst™ 7, depreciation is considered to be an expenditure
even though it is not reflective of the actual cash expended by a company for the
purchase of a fixed asset. Depreciation can be considered either as part of the cost of
goods sold or as expenses, depending on how the fixed assets being depreciated are
used in company operations. For example, in a manufacturing company, the
depreciation of plant and equipment used in making products would be considered
part of cost of goods sold. The depreciation of fixed assets in such activities as sales
and marketing, customer support, and research and development would be part of the
“expenses” in an Income Statement.
Sometimes, depreciation is expressed as a separate line item in the formal
presentation of an Income Statement in a company’s annual report. However, usually
a company reports depreciation expenses in a footnote to the Income Statement. So if
you are really interested in knowing a company’s depreciation expenses, you’ll have to
be prepared to read the “fine print.” (Note: Depreciation is also reported in the
Statement of Cash Flows.)
Key Learning Point: The “Bottom” Bottom Line
One step below the bottom line of Net Income is the measure called “Earnings PerShare” or EPS. We have introduced this term in several other Learning Bursts, so we
just want to remind you that this is an important measure, particularly for financial
analysts who really want to know how much profit a company has made for its
shareholders. We also explained that this measure plays in important part in
determining a company’s “Price-Earnings Ratio.”
Income Statement Exercise
The best way to become familiar with all of the items in an Income Statement is do an
actual numerical exercise. (Note: We also give you more opportunity to practice in our
Learning Burst simulation.)
Construct an income statement based on the following activities. Note: Some of the
items do not belong on the income statement.

8/3/2019 Financial Health of a Company
http://slidepdf.com/reader/full/financial-health-of-a-company 20/42
Pre-Read Module 1-3: Finance for Business Leaders
20

8/3/2019 Financial Health of a Company
http://slidepdf.com/reader/full/financial-health-of-a-company 21/42
Pre-Read Module 1-3: Finance for Business Leaders
21
And the answer is …
Quiz (check your answers in Appendix B)
1. In which case would the depreciation of computers be considered a part of cost of
goods sold?
a. Computers used for in the company’s billing system (e.g. invoicing and
accounts receivable management)
b. Computers used in its research laboratories
c. Computers used in its manufacturing facilities
d. Personal computers used in its training facilities
2. In a typical Income Statement, which measure of profit would come after operating
income but before net income?
a.
Gross Profit b. EBIT
c. Gross Income
d. PTI

8/3/2019 Financial Health of a Company
http://slidepdf.com/reader/full/financial-health-of-a-company 22/42
Pre-Read Module 1-3: Finance for Business Leaders
22
5. UNDERSTANDING THE
DIFFERENT MEASURES OF
PROFIT AND PROFIT M ARGIN A key number in a company’s Income Statement is the bottom line or net profit. In
order to evaluate a company’s ability to earn a profit during a given time period, we
compute the different levels of profit as a percentage of revenue. In so doing, we are
measuring what is called profit margin.
Key Learning Point: The Gross Profit Margin
The formula for gross profit margin is:
The key factors that affect Gross Profit Margin are:
• Price per unit sold
• Cost of Goods Sold per unit
• Mix of the goods and services sold (i.e. the “product mix”)
Price per unit sold. If you can increase price without increasing unit cost, then GrossProfit will increase.
Cost of Goods Sold per unit. If you can reduce unit cost without a price decrease,
then you will realize a Gross Profit increase. Remember, Gross Profit = Revenue – COGS .
On a unit basis we can also say that Gross Profit = Price – Unit Cost. Whenever we
calculate Gross Profit Margin, we can either use the TOTAL or the UNIT number to
obtain the percentage. The following simple illustration shows this.

8/3/2019 Financial Health of a Company
http://slidepdf.com/reader/full/financial-health-of-a-company 23/42
Pre-Read Module 1-3: Finance for Business Leaders
23
As you can see, you can arrive at Gross Profit Margin either by using the Total numbers
or the Per Unit numbers. Both result in a 33% margin.
Mix of the goods and services sold. If a company can sell more products with a high
Gross Profit Margin, then its overall Gross Profit Margin will increase. For example, inLearning Burst™ 13, we talk about a restaurant improving its overall profit margin by
selling lots of high gross margin items such as specialty coffees, desserts, and, of
course, alcoholic beverages.
Key Learning Point: The Operating Profit Margin
The formula for operating profit margin is:
Other frequently used terms for this measure are: “OI Margin” (Operating Income
Margin), and “EBIT Margin” (Earnings Before Interest and Taxes Margin.)
Operating Profit Margin is a reflection of a company’s Gross Profit Margin and its
ability to manage expenses relative to its gross profit margin. A useful indicator of this
ability is the ratio of a company’s expenses to its revenue. Financial people may call
this “Expense to Revenue Ratio” or simply the “E to R.” Here it is as a formula.
Typical E to R ratios can range from 5 percent to as high as 30 percent. To analyze a
company’s ability to manage its expenses, you have to know and understand its gross
profit margin. Companies with high gross profit margins can afford to spend more on
expenses such as marketing and research and development and still end up with a
respectable net profit margin. Companies with low gross profit margins cannot afford
8/3/2019 Financial Health of a Company
http://slidepdf.com/reader/full/financial-health-of-a-company 24/42
Pre-Read Module 1-3: Finance for Business Leaders
24
to spend much on expenses because their net profit margin will quickly turn from
positive to negative.
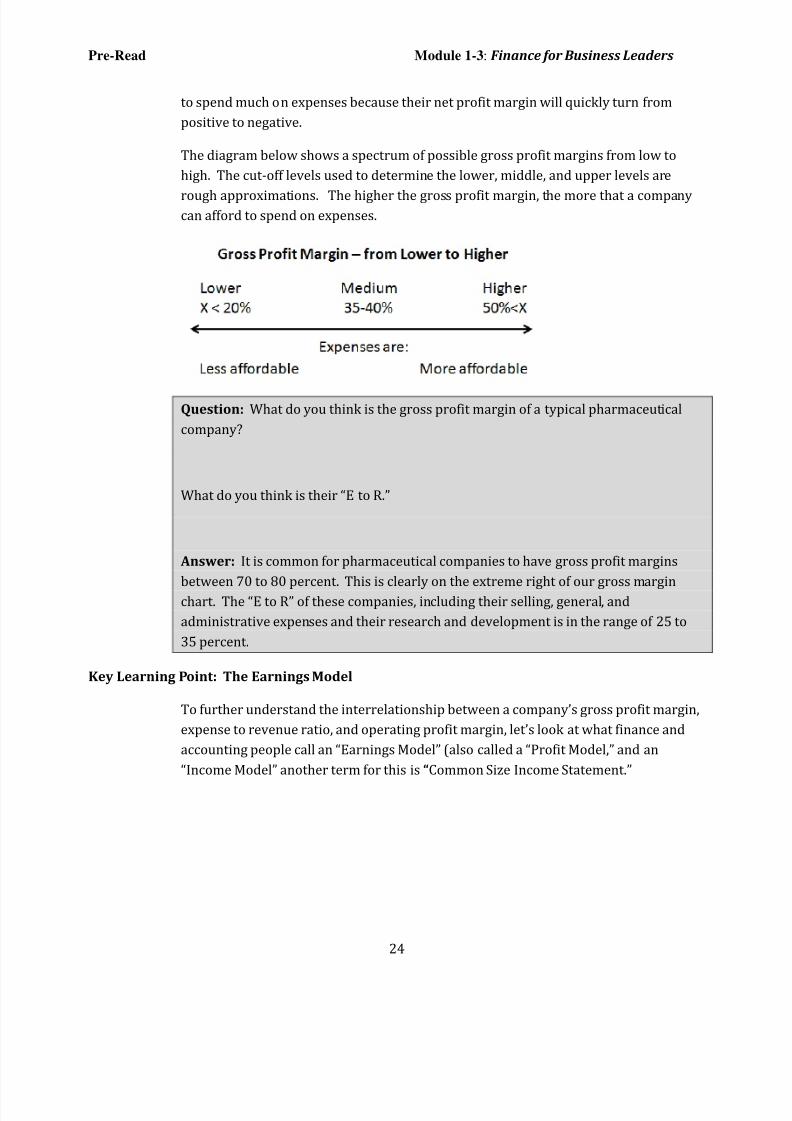
The diagram below shows a spectrum of possible gross profit margins from low to
high. The cut-off levels used to determine the lower, middle, and upper levels are
rough approximations. The higher the gross profit margin, the more that a companycan afford to spend on expenses.
Question: What do you think is the gross profit margin of a typical pharmaceutical
company?
What do you think is their “E to R.”
Answer: It is common for pharmaceutical companies to have gross profit margins
between 70 to 80 percent. This is clearly on the extreme right of our gross margin
chart. The “E to R” of these companies, including their selling, general, and
administrative expenses and their research and development is in the range of 25 to
35 percent.
Key Learning Point: The Earnings Model
To further understand the interrelationship between a company’s gross profit margin,
expense to revenue ratio, and operating profit margin, let’s look at what finance and
accounting people call an “Earnings Model” (also called a “Profit Model,” and an
“Income Model” another term for this is “Common Size Income Statement.”

8/3/2019 Financial Health of a Company
http://slidepdf.com/reader/full/financial-health-of-a-company 25/42
Pre-Read Module 1-3: Finance for Business Leaders
25
Take a closer look at the different elements of each company’s Income Statement as
they relate to revenue and each other. For ease of comparison, we show that company
A and B have the same amount of revenue.
Question: Company B’s Expense to Revenue Ratio is higher than company A’s. (40%
vs. 30%). Yet, it’s Operating Profit Margin and Net Profit Margins are higher. Why?
Answer: It is clear that company A has a greater Cost of Goods Sold and therefore a
lower Gross Profit Margin. In terms of Net Profit, company B’s net profit of 11% is
over twice that of company A’s at 5%. Conclusion: The advantage that company B has
in Gross Profit Margin outweighs the higher percentage of revenue that it incurs in
expenses.
Key Learning Point: Horizontal Analysis
Another way of looking at a company’s Income Statement is to track its changes over
time. This is called a Horizontal Analysis or Trend Analysis.

8/3/2019 Financial Health of a Company
http://slidepdf.com/reader/full/financial-health-of-a-company 26/42
Pre-Read Module 1-3: Finance for Business Leaders
26
Gross Profit varies over the 5 year period but end up in year 5 higher than in year 1.
Notice what has happened to Operating Profit Margin over the same 5 years – it has
declined even though Gross Profit Margin has increased.
Question: What do you think happened to cause these results?
Answer: It appears that the company has not been able to control its expenses while
growing Revenue and improving its Gross Profit Margin. Look at how it’s “E to R” grew
from 25% in year 1 to 29.2% in year 5.
Key Learning Point: Net Profit and Pre-tax Profit
The two remaining levels of profit are Pre-tax Profit and Net Profit. Both of these typesof profit margin are affected by the gross and operating margins. Throughout these
Learning Bursts we talk much more about Net Profit Margin than Pre-tax Profit
Margin. But you should be aware of both measures.
The difference between Pre-tax Profit and Net Profit is obviously the accrued amount
of a company’s income tax expense. Some companies are very good at managing their
income tax expenses, because they have skilled specialists who are very familiar with
tax laws and tax rates for any of the countries of the world in which a company might
be operating. As a measure of financial performance, Pre-tax Profit Margin does not
consider this particular skill in running a business. We will elaborate further on Net
Profit Margin in subsequent Learning Bursts.

8/3/2019 Financial Health of a Company
http://slidepdf.com/reader/full/financial-health-of-a-company 27/42
Pre-Read Module 1-3: Finance for Business Leaders
27
Quiz
1. Which of the following shows a company’s financial performance over a number of
years?
a. Earnings model
b. Common size income statement
c. Horizontal analysis
d. Profit model
2. “E to R” stands for
a. earnings to revenue
b. expenses to revenue
c. expenses to returns
d. expenditures to risk
3. Which of the following gross profit margins would a successful software company
be most likely to have?a. 35%
b. 50%
c. 60%
d. 75%
ANSWERS TO QUIZZES
Module 1: 1 –c, 2 –b, 3-d Module 2: 1-b,2-c Module 3: 1-a, 2-c,3-a Module 4: 1-c 2-d Module 5: 1-c,2-
b,3-d

8/3/2019 Financial Health of a Company
http://slidepdf.com/reader/full/financial-health-of-a-company 28/42
Pre-Read Module 1-3: Finance for Business Leaders
28
Glossary of Terms
ACCOUNTING EQUATION An equation that states that assets equal liabilities + shareholders' equity.
A = L + SEThe equation must always hold because assets represent the historical value of what the company
owns, and liabilities and equity represent the claims on these assets. The company is responsible for
the liabilities to the creditors first and then the equity of the owners. Therefore, equity is the residual
or balancing factor in the difference between assets and liabilities. That is:
SE = A — L
Seen in this way the balance sheet must always "balance" because the value of shareholders equity
will change depending on the difference between assets and liabilities.
ACCOUNTS PAYABLE An obligation to pay for goods or services that have been purchased on credit
from suppliers. This is a current liability in a firm’s balance sheet because it is payable within a year.
ACCOUNTS RECEIVABLE The amount owed to a company from customers who purchased goods or
services on credit.
ACCOUNTS RECEIVABLE TURNOVER A ratio showing the average amount of time that a company
holds its receivables before collecting them. Usually, companies also use a related term called "Days
Sales Outstanding" (DSO).
Accounts Receivable Turnover = Revenue
Average Accounts Receivable
ACCRUAL ACCOUNTING The accounting method that recognizes revenue when it is earned, without
regard to when the cash is collected, and recognizes expenses when they are incurred, regardless of
when cash is paid to meet these obligations.
ACCRUED EXPENSE Those expenses incurred, but not yet paid, at the end of an accounting period;
also called accrued liabilities.
Example: A company purchases $25,000 worth of office supplies on credit on December 29 and its
accounting period ends on December 31. It shows the $25,000 as an accrued expense on the balance
sheet for the year.
ACCUMULATED DEPRECIATION The total depreciation to date on a particular asset as shown in the
balance sheet.
AMORTIZATION The process of allocating the portion of an intangible asset's value (e.g. patents or
goodwill) that has been consumed during the current period against revenues. Similar to a company’s
depreciation of tangible assets.

8/3/2019 Financial Health of a Company
http://slidepdf.com/reader/full/financial-health-of-a-company 29/42
Pre-Read Module 1-3: Finance for Business Leaders
29
Generally Accepted Accounting Principles (GAAP) states that the amortization of an intangible asset
cannot exceed 40 years and that it must be done on a straight-line basis.

8/3/2019 Financial Health of a Company
http://slidepdf.com/reader/full/financial-health-of-a-company 30/42
Pre-Read Module 1-3: Finance for Business Leaders
30
ANNUAL REPORT A detailed statement that a company prepares at the end of its reporting year; the
reporting year can be either on a calendar or fiscal basis. This report contains a company's income
statement, balance sheet, statement of cash flows, statement of shareholders' equity, management's
discussion and analysis of operations, notes to the financial statements, and audit opinion. The
Financial Accounting Standards Board (FASB) also requires that companies include in their annual
reports operations in different industries, export sales, foreign operations, major customers, andgovernment contracts.
ASSET An economic resource of a company. Assets include money, land, buildings, property, and
property rights and machinery.
Characteristics:
• Must provide future economic benefits, etc.
• Must be controlled by its owner
• Must be the result of a previous event or transaction (e.g. the purchase of a new machine)
Assets can be tangible or intangible:
• Tangible: Assets that can be seen or felt
• Intangible: Assets that have no physical substance (e.g. patents and goodwill)
Assets can be current or non-current:
• Current : Assets that have future benefits that will be realized in one year or less
• Non-current (fixed or other): Assets that have future benefits that will be realized in more
than one year
ASSET TURNOVER (also called Total Asset Turnover) A ratio that measures the productivity of a
company's total assets. (Also called a measure of activity or efficiency). It shows how many dollars of
revenue are created by a $ of assets.
Asset Turnover = Revenue
Assets
BALANCE SHEET A statement representing a company's financial position at a specific date, usually
at the end of an accounting period; also called a "statement of financial position." It is composed of
assets, liabilities, and net worth.
BOOK VALUE
(1) The amount shown for an asset on a balance sheet. For fixed and other assets, it is based on
historic cost or the amount that was paid for the asset when it was purchased. For example, the
"book value" of a machine is its initial cost less its accumulated depreciation.
(2) Book value of a company can also be the amount shown as a company's stockholders' equity on a
balance sheet. Seen in this way, the book value of a company is the value of its "net worth" (assets
less liabilities).

8/3/2019 Financial Health of a Company
http://slidepdf.com/reader/full/financial-health-of-a-company 31/42
31
BOOK VALUE PER SHARE The assets of a company made available to its shareholders.
Book Value per Share = Total Stockholders’ Equity
Average Shares Outstanding
BREAK-EVEN ANALYSIS (also called Profit-Volume-Cost Analysis.) The calculation of the point at which sales revenue equals all costs and expenses.
Break-even Volume = Total Fixed Cost
Price - Average Variable Cost
CAPITAL Unless preceded by the term "working" (see Working Capital) this is the amount on the
balance sheet that represents the long term commitment of funds in a company, long-term debt,
and shareholders' equity.
Note: If the term "share capital" is used, it refers only to the value of the shares originally purchased
by the owners. This, along with accumulated retained earnings, is part of shareholders’
equity.
CAPITAL STOCK The shares representing the ownership of a company. Issued capital stock that
remains in the hands of stockholders is categorized as "outstanding." Stock that is repurchased and
not reissued by the company is called "treasury stock.”
CASH FLOW The cash receipts less the cash disbursements from a given operation or asset for a
particular period of time. There are a number of different measures of this term, depending on what
cash disbursements are taken into account for the particular time period. A clarification of these
different terms is best done using a "Statement of Cash Flows," provided in a company's annual
report. Here are a few examples:
"Basic Cash Flow" Net income + depreciation (often a quick and easy method for estimating acompany's operating cash flow, particularly for companies that have large fixed asset investments).
"Cash Flow From Operations" Net income + depreciation and amortization + or - changes in non-
cash working capital (a measure of cash flow now required to be shown in all companies’ annual
reports in their statement of cash flows).
"Free Cash Flow" Cash Flow From Operations less Capital Expenditures and Dividends (a measure
of cash flow that indicates how much cash a company has generated in a given accounting period
after meeting its operating and major financial requirements).
CONTRIBUTION MARGIN (CM) The amount by which a company's sales revenue exceeds the
variable cost of its production or service. Used to help determine the break-even point of a firm’soperations. (See "Breakeven Analysis.") This term is used in cost accounting. A similar, but not
equal term used in financial accounting is "gross profit margin."
COST ACCOUNTING A method of accounting for the costs of operating a business by allocating
these costs to the goods a company produces or the services it renders. The methods of cost
allocation are determined by the company for its internal use. They do not have to follow GAAP, the
standard that companies must follow for Financial Accounting for external reporting purposes.

8/3/2019 Financial Health of a Company
http://slidepdf.com/reader/full/financial-health-of-a-company 32/42
32
COST OF GOODS SOLD (also called COST OF SALES) Typically abbreviated as COGS, (often just
CGS) this is the cost of producing, converting or buying an item that the firm subsequently sells.
When subtracted from sales revenue, it shows the amount of a firm's gross profit.
Revenue- Cost of goods sold
Gross Profit
CURRENT ASSET Any asset shown on a firm's balance sheet that has a useful economic life of one
year or less. It can also be considered cash or any item that the company believes will become cash
within the one year period. This includes short-term marketable securities, accounts receivable,
inventory, and prepaid expenses.
CURRENT LIABILITY A debt that is payable within one year (based on the date shown on its
balance sheet). Typical current liabilities include accounts payable, short-term notes payable, and
the current portion of a firm's long-term debt.
DAYS IN INVENTORY (also called Days’ Sales in Inventory) A measure of the number of days it
takes to sell the average amount of inventory on hand during a particular period of time. As a rule,
the longer it takes to sell inventory, the greater the risk of not being able to sell it at full value. Also,
if a firm’s days inventory starts to increase, it may indicate a drain on its cash flow. To calculate
days in inventory, we first calculate the inventory turnover, as shown below:
Days In Inventory = 365 days
Inventory Turnover Ratio
Inventory Turnover Ratio = Cost of Goods Sold
Average Inventory on Hand
Example: If a company has an Inventory turnover of 5.25 days, its day inventory would be 365/5.25
or 69.5.
DEPRECIATION An accounting method of spreading the cost of a fixed asset, such as plant and
equipment, over its useful life. The basic concept behind depreciation is that the value of every
asset is reduced through use or obsolescence. Through depreciation, a relationship is established
between the asset's ability to generate revenue and the reduction of its value. This relationship is in
accordance to the "matching principle."
The three methods of depreciation are:
1) Straight line
2) Sum-of-the-years' digits
3) Double declining balance
In addition to deciding on the method to use, a company must also determine the estimated
expected useful life of the asset and the asset’s salvage value.
The higher the rate of depreciation used, the lower the company's accounting income that is
reported in its financial statement. However, higher rates of depreciation could have a positive

8/3/2019 Financial Health of a Company
http://slidepdf.com/reader/full/financial-health-of-a-company 33/42
33
impact on a firm's cash flow by reducing its tax obligations at an earlier rather than later time in the
life of the fixed assets.
DISCOUNTED CASH FLOW A method used to reduce a forecasted stream of cash flows to its
present value. The amount of the reduction is based on a company's cost of capital. This method is
the basis for a company's capital budgeting or long-term cash allocation decisions.
DIVIDEND The distribution of a company's earnings to stockholders. Cash dividends are most
common, although dividends can be issued in other forms such as stock or property.
EARNINGS PER SHARE (EPS) A measure of a company's profit shown in terms of each share of
common stock.
EPS = Net Income - Preferred Dividend
Average Common Stock Outstanding
EQUITY (also called stockholders Equity or owners' Equity) The monetary value that represents
ownership interest in a business. The two most important components of equity are:
1) Capital stock
2) Accumulated retained earnings. Also called retained earnings or even reinvested earnings
Two other items often listed are
1) Treasury stock
2) Foreign exchange translation adjustments
Because accountants define equity as equal to assets minus liabilities, equity is also referred to as
the “net worth” of a company. (See "Book Value.")
FINANCIAL ACCOUNTING An accounting method that records, interprets, and reports the
historical cost transactions of a company. Publicly held companies must follow financial accounting
principles laid down by the Financial Accounting Standards Board (FASB) and the American
Institute of Certified Public Accountants (AICPA). Together, these principles are referred to as
"Generally Accepted Accounting Principles (GAAP). The Securities and Exchange Commission (SEC)
is ultimately responsible for establishing financial reporting standards for publicly owned
companies, yet it lets the FASB and AICPA set up the ground rules.
FINANCIAL STATEMENTS Reports containing financial information about a company. The three
major financial statements found in an annual report are:
1. Balance sheet
2. Income statement, and3. Statement of cash flows
FIXED ASSET An item purchased for the operation of a business that has physical substance, useful
economic life greater than one year and is not to be sold to customers.
FIXED COST Costs and expenses that stay constant regardless of increases or decreases in business
activity.

8/3/2019 Financial Health of a Company
http://slidepdf.com/reader/full/financial-health-of-a-company 34/42
34
GENERALLY ACCEPTED ACCOUNTING PRINCIPLES (GAAP) The policies, standards, and rules
followed by accountants in the preparation of financial statements.
GOODWILL The value of intangible assets, such as reputation, name recognition, and customer
relations, that gives a company an advantage over competitors. Goodwill appears in a company'sfinancial statements only if it has been paid for in a business combination using the "purchase
method." In this case, the value of the goodwill is the difference between the purchase price of the
company and the book value of its assets.
The amortization of goodwill can be done over a period of not more than 40 years. It is shown on
the firm's financial statement but is not tax deductible.
GROSS PROFIT (also called Gross Margin) The excess of revenue over cost of goods sold.
INCOME STATEMENT (also called Profit and Loss statement or "P&L). A formal statement of the
elements used in determining a company’s net income. There is no uniform method of presenting
an income statement in an annual report. However, a typical statement could look like this:
Revenue (also Sales, Net Sales, or Sales Revenue) -
— Cost of Goods Sold
GROSS PROFIT
— Selling, general, and administrative expenses (S,G&A)
— Research and Development
OPERATING INCOME (Profit)
+ Other income
— Other expenses such as interest
INCOME BEFORE TAXES
— Provision for income taxes
INCOME FROM CONTINUING OPERATIONS
+ or — Extraordinary items
+ or — Cumulative effect of change in accounting principle
NET INCOME
INTERNAL RATE OF RETURN (IRR) The discount rate at which the net present value of all future
cash flows equals zero. This rate is often used to determine the financial desirability of a long-terminvestment. If the IRR is greater than the firm's cost of capital (the opportunity cost of its money),
then the project is considered to be economically justified.
INVENTORY Any goods available for resale at any given time. It is recorded at the lower of cost or
market value and reported on the balance sheet. The three types of inventory in manufacturing are:
1. Raw materials
2. Work-in-process

8/3/2019 Financial Health of a Company
http://slidepdf.com/reader/full/financial-health-of-a-company 35/42
35
3. Finished goods

8/3/2019 Financial Health of a Company
http://slidepdf.com/reader/full/financial-health-of-a-company 36/42
36
INVENTORY TURNOVER A measure of the number of times that the average amount of inventory
on hand is sold within a given period of time.
Inventory Turnover = Cost of Goods Sold
Average inventory on hand
Sometimes sales revenue is used instead of cost of goods sold. This is not a good method unless
cost of goods sold is not available.
LIABILITY An obligation payable in money, services, or goods. Liabilities are reported on the
balance sheet and include, among others, accounts payable, accrued expenses and debt (both short-
term and long-term.)
MARKET-TO-BOOK RATIO An indicator of the degree to which the management of a company has
been able to increase the value of shareholder investment. The higher the ratio, the better. If
management has increased the market value over the book value (the amount of investment by
stockholders), the ratio will be greater than 1. If the ratio is less than one, then value has been
destroyed.
Market-to-Book Ratio = Market Value
Book Value
Market Value = price of a share of stock
Book Value (per share) = equity/shares outstanding
NET INCOME (also called net profit, net after-tax profit, and net income after taxes) The result of
subtracting all costs, expenses, and taxes from revenue.
NET PRESENT VALUE (NPV) The present value of the future cash to be received from aninvestment in excess of the cost of the investment. An NPV greater than zero indicates an
economically justified investment opportunity.
NOTE PAYABLE A contract to pay a creditor at a future date. Reported on the balance sheet either
as a current or noncurrent liability, depending on when the principal is due.
PRICE-EARNINGS RATIO (P-E Ratio) A commonly used measure of a company's investment
potential. This ratio depends on investors' perceptions of a company's potential. Factors such as
risk, quality of management, growth potential, earnings history, and industry conditions all come
into play.
P-E Ratio = Price per Share
Earnings per Share
P-E Ratios in the high teens and twenties generally indicate that investors are very optimistic about
the company's earnings potential.

8/3/2019 Financial Health of a Company
http://slidepdf.com/reader/full/financial-health-of-a-company 37/42
37
PROFIT MARGIN A measure of a firm's profit-earning ability relative to its dollar volume of sales.
The type of profit margin depends on which measure of profit is being used.
Gross Profit Margin = Gross Profit
Revenue
Operating Profit Margin = Operating Profit
Revenue
Net Profit Margin = Net Profit
Revenue
Generally, the higher the gross profit margin, the greater the chances of a firm having a high
operating and net profit margin. 40% is typical of manufacturers, 25% is typical of supermarkets
and low-end retailers, 45% is typical of high-end retailers, and 80% is typical of software
companies. Manufacturers typically end up with around a 5% net profit margin, while successful
software companies (such as Microsoft) have net margins over 20%.
RETAINED EARNINGS (also called accumulated retained earnings or profit, or reinvested earnings,
income, or profit.) These are the total earnings of a company, less dividends, since its inception.
This is a major portion of a company's equity shown on its balance sheet.
RUN RATE A term often used in budget analysis in reference to projected costs based on past
expenditures. The benchmark used for past expenditures varies among companies. Some firms
simply use the previous month. Others may take the average of previous months (e.g. past 3
months, 6 months, etc.). For example, if the previous three months’ expenditures are 10, 12 and 12,
then the “run rate” is 11.33.
RETURN ON INVESTMENT (ROI) A measure of the productivity of a firm’s assets. There are threecommonly used versions of this measure.
Return on Assets (ROA) = Net Profit
Average Total Assets
Return on Equity (ROE) = Net Profit
Average Equity
Return on Capital Employed (ROCE) = Net Profit
Average Debt + Equity
REVENUE (also called sales and sales revenue) Gross income received by a company before any
deductions for expenses, discounts, returns, etc.
TURNOVER RATIO A measure of activity of any asset such as inventory, receivables, fixed assets
or total assets. See accounts receivable turnover, asset turnover, and inventory turnover.

8/3/2019 Financial Health of a Company
http://slidepdf.com/reader/full/financial-health-of-a-company 38/42
38
WORKING CAPITAL A measure of a company's ability to service its short-term financial
obligations. It is defined as current assets minus current liabilities.
8/3/2019 Financial Health of a Company
http://slidepdf.com/reader/full/financial-health-of-a-company 39/42
39

8/3/2019 Financial Health of a Company
http://slidepdf.com/reader/full/financial-health-of-a-company 40/42
40
NOTE: THIS DOCUMENT CONTAINS CHAPTERS FROM “BUSINESS ACUMEN: YOUR KEY TO
SUCCESS,” A SELF-DIRECTED COURSE PRODUCED BY LEARNING BURST ACADEMY. ALL RIGHTS
RESERVED BY P&D LEARNING, LLC

8/3/2019 Financial Health of a Company
http://slidepdf.com/reader/full/financial-health-of-a-company 41/42
41

8/3/2019 Financial Health of a Company
http://slidepdf.com/reader/full/financial-health-of-a-company 42/42
Recommended


![Financial Report [Company Update]](https://img.pdfslide.net/doc/110x75/577c7c401a28abe05499eb8a/financial-report-company-update.jpg)


![Financial Performance [Company Update]](https://img.pdfslide.net/doc/110x75/577ca7bd1a28abea748c88ca/financial-performance-company-update.jpg)