Financial Literacy in South Africa:
Results of a national baseline survey
2012
This booklet highlights the most significant research findings of the
national survey entitled:
Financial Literacy in South Africa: Results of a baseline national survey.
baseline
The
by
Human Sciences Research Council (HSRC)
Democracy, Governance & Service Delivery (DGSD)
Research Programme
Benjamin Roberts, Jarè Struwig, Steven Gordon,
Johan Viljoen and Marie Wentzel
30 July 2012
The comprehensive report can be viewed on www.fsb.co.za
report was prepared for the Financial Services Board (FSB)
Design & Printing: Bathopele Marketing 012 349 2951
Contents Contents Contents
Foreword by the EO of the Financial Services Board 4
Introduction to the baseline study 6
Methodology of the baseline study 7
Key findings and detailed findings of the 4 core domains:
I) Financial control 8
ii) Financial planning 15
iii) Choosing a financial product 22
iv) Knowledge and understanding 30
Financial literacy score results 34
Conclusion 37
Next steps 39
3
Mr Dube Tshidi, Chief Executive Officer
of the Financial Services Board
Foreword from the Executive Officer of the Financial Services Board
The Financial Services Board (FSB) is proud to
launch the results of a national baseline survey
on financial literacy in South Africa, which is a
first of its kind. The Human Sciences Research
Council (HSRC) was commissioned to conduct
the baseline study of the financial literacy of all
South Africans across all walks of life, cultures,
races and ages.
Thanks to the baseline study, we now have
sound empirical evidence regarding which
members of society are most vulnerable and
where attention is needed most.
The results of the baseline study give us rich and
composite data on how South Africans save,
manage their budget and spend, borrow and
plan for their financial future. Financial literacy is
not only for the poor and uneducated. Even the
educated can get themselves into financial
trouble if they do not have a proper under-
standing of financial concepts, products and
common "debt traps". When we look at the
hardships that many households go through
daily, the results highlight how important it is to
give people the information and resources they
need to make sound financial decisions.
The baseline study eliminates the 'one-size-fits-
all' approach in taking financial literacy
programmes to South Africans. This will enable
the FSB and its stakeholders in the financial
sector to take the message to consumers of the
need for financial control, proper financial
planning, being able to choose financial products
and improving their knowledge and under-
standing of the financial industry.
4
Foreword from the Executive Officer of the Financial Services Board
With substantial supporting facts and figures, the
FSB can gain support for and implement
structured programmes to targeted groups. We
hope to make a dynamic mind-shift within the
years to come and will use this study to
benchmark our progress.
We are dedicated to investor education and our
mission is to provide South Africans with the
knowledge, skills and tools necessary for
financial success throughout life.
We hope that this study can be used by all our
stakeholders to assist them and ourselves with
the task ahead.
Regards,
Dube Tshidi
5
INTRODUCTION
IntroductionIntroduction
Meaningful participation in the formal financial sector is beyond the reach of
many South Africans. The increasing diversification of financial products on offer
has complicated financial decision-making for ordinary South Africans. The
growing complexity of the financial environment highlights the importance of
financial understanding and consumer financial awareness as never before.
In 2011, the FSB commissioned the Human Sciences Research Council
(HSRC) to undertake a study of financial literacy in South Africa. The specific
objective of the study was to determine the levels of financial literacy in the
country. This would be used to inform public financial education policy and assist
in developing strategies to improve overall levels of financial literacy.
The FSB’s financial education programme has previously been hampered by
having very limited data available about the financial knowledge, attitudes, skills
and behaviours of consumers in South Africa. The purpose of this survey, the
first of its kind in South Africa, has been to undertake a national study in order to
generate information on the levels of awareness, knowledge and understanding
of financial literacy in South Africa.
Against this backdrop, the consequences of not having the necessary skills to
make sound financial decisions becomes severe. This is particularly true in
times of economic instability. It is during these times that resources may be more
limited and negative financial events, such as the loss of a job or a sharp decline
in income are more frequent. Not only has managing day-to-day finances
become more difficult, but there are also greater risks in getting it wrong.
This report therefore provides descriptive and analytical findings organised
around the four core domains of financial control; financial planning;
choosing appropriate financial products and knowledge & understanding.
A synopsis of the key and detailed findings within each of these domains is
provided. This is followed by a composite financial literacy score for South Africa
and how the FSB plans to use this study in future.
6
RESEARCH METHODOLOGY
Research Methodology
The research contained in this study is based on a pilot survey carried out by the
Organisation for Economic Co-operation and Development (OECD) in 2010. In
the pilot survey, 20 questions were used to obtain internationally comparable
indices which measured levels of financial literacy across 13 countries. The 20
questions were further expanded to 202 questions which were used for this
survey in order to acquire insight into South African financial literacy levels.
A representative sample of 2 972 South Africans participated in the survey.
The target population for the FSB financial literacy survey was individuals aged
16 years and over who lived in South Africa. The survey selected people
specifically living in households, hostels and other structures.
Enumerator Areas (EAs) from the 2001 Census formed the Primary Sampling
Unit (PSU), of which 500 EAs were selected throughout South Africa. Within
each PSU or EA, a total of 7 visiting points or households were selected for
interviewing, using random sampling.
One household member, who was 16 years or older, was selected randomly as a
respondent to complete the questionnaire in the language of his or her choice.
The fieldwork commenced in September 2011 and ended in
October 2011.
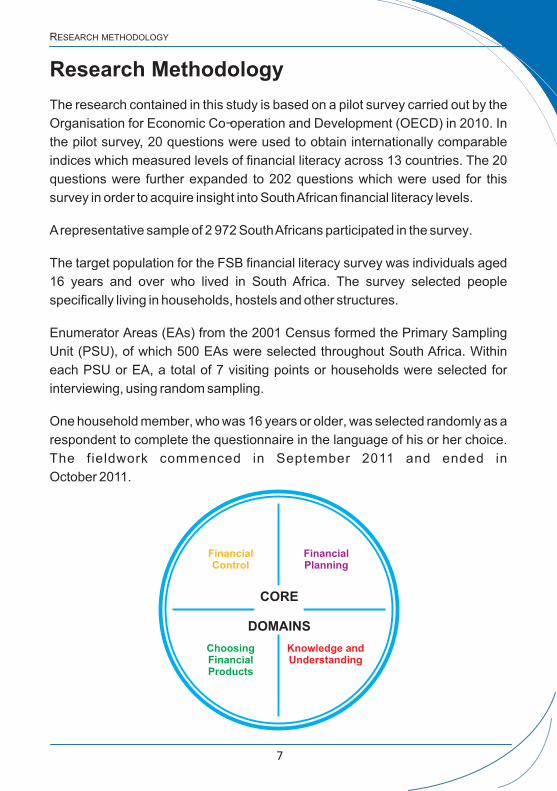
CORE
DOMAINS
FinancialControl
FinancialPlanning
ChoosingFinancialProducts
Knowledge andUnderstanding
7
FINANCIAL CONTROL
KEY FINDINGS:
Financial Control
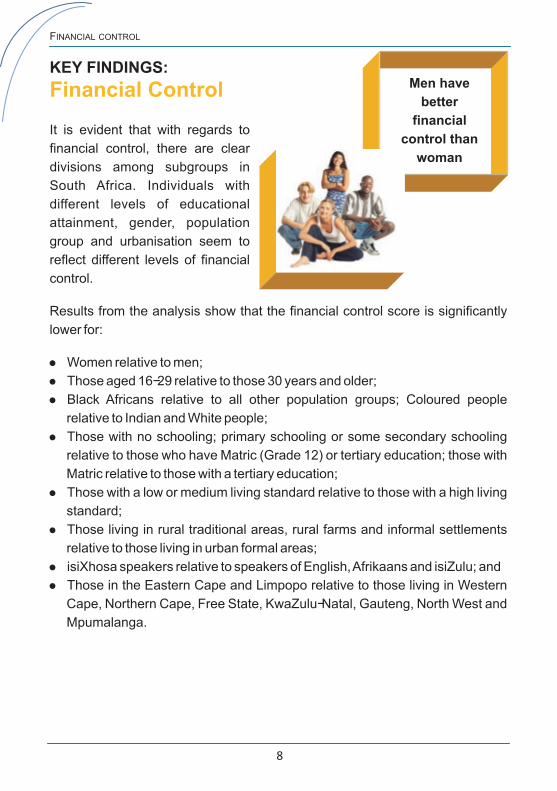
It is evident that with regards to
financial control, there are clear
divisions among subgroups in
South Africa. Individuals with
different levels of educational
attainment, gender, population
group and urbanisation seem to
reflect different levels of financial
control.
Results from the analysis show that the financial control score is significantly
lower for:
! Women relative to men;
! Those aged 16-29 relative to those 30 years and older;
! Black Africans relative to all other population groups; Coloured people
relative to Indian and White people;
! Those with no schooling; primary schooling or some secondary schooling
relative to those who have Matric (Grade 12) or tertiary education; those with
Matric relative to those with a tertiary education;
! Those with a low or medium living standard relative to those with a high living
standard;
! Those living in rural traditional areas, rural farms and informal settlements
relative to those living in urban formal areas;
! isiXhosa speakers relative to speakers of English, Afrikaans and isiZulu; and
! Those in the Eastern Cape and Limpopo relative to those living in Western
Cape, Northern Cape, Free State, KwaZulu-Natal, Gauteng, North West and
Mpumalanga.
8
Men have
better
financial
control than
woman
DETAILED FINDINGS:
Financial Control
Sou
th A
fric
a
Mal
e
Fem
ale
Bla
ck A
fric
an
Co
lou
red
Ind
ian
Wh
ite
Low
LSM
Me
diu
m L
SM
Hig
h L
SM
You 30 30 29 30 25 30 30 47 30 24
Other family member 28 31 26 31 24 20 12 20 33 24
You and your partner 20 20 21 17 19 32 43 17 15 29 You and another family member 13 13 13 13 19 11 6 9 13 15 Your partner 5 3 7 5 9 5 8 5 5 6 Someone else 3 2 3 3 4 2 1 0 3 2 Nobody 1 1 1 1 0 0 0 2 1 0 Total 100 100 100 100 100 100 100 100 100 100
FINANCIAL CONTROL: DETAILED FINDINGS
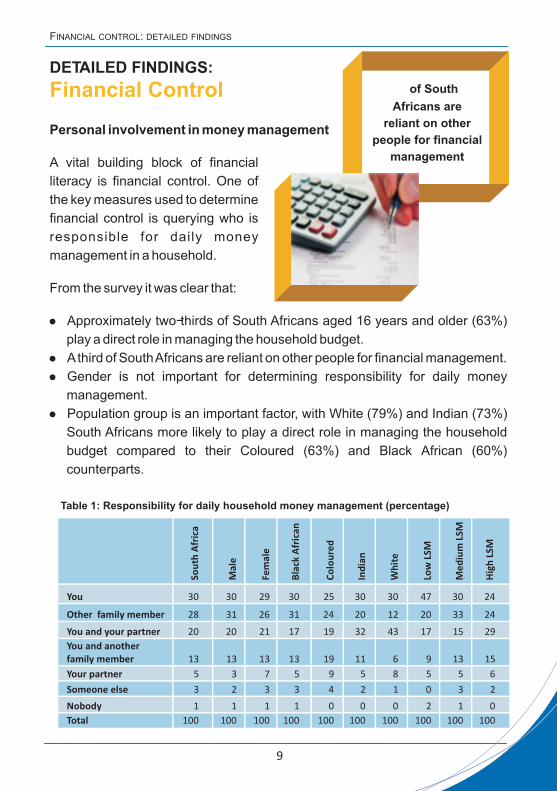
Personal involvement in money management
A vital building block of financial
literacy is financial control. One of
the key measures used to determine
financial control is querying who is
responsible for daily money
management in a household.
From the survey it was clear that:
! Approximately two-thirds of South Africans aged 16 years and older (63%)
play a direct role in managing the household budget.
! A third of South Africans are reliant on other people for financial management.
! Gender is not important for determining responsibility for daily money
management.
! Population group is an important factor, with White (79%) and Indian (73%)
South Africans more likely to play a direct role in managing the household
budget compared to their Coloured (63%) and Black African (60%)
counterparts.
9
Table 1: Responsibility for daily household money management (percentage)
⅓ of South
Africans are
reliant on other
people for financial
management
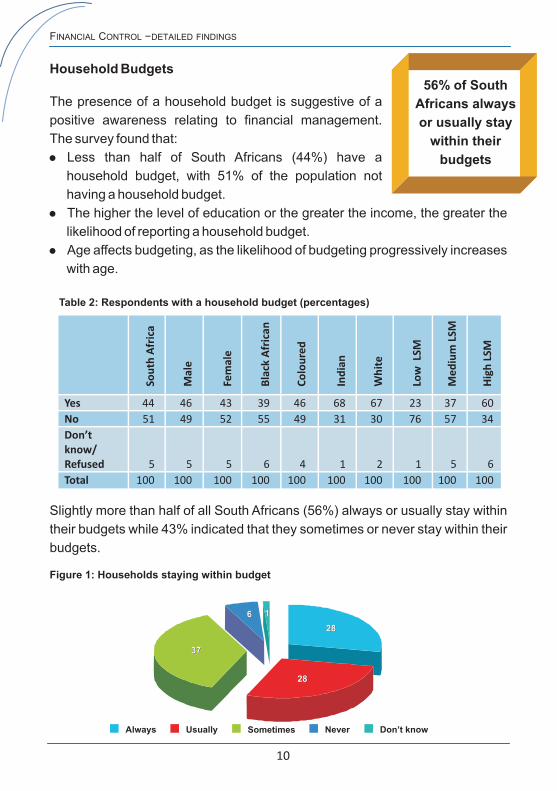
Table 2: Respondents with a household budget (percentages)
Sou
th A
fric
a
Mal
e
Fem
ale
Bla
ck A
fric
an
C
olo
ure
d
Ind
ian
Wh
ite
Low
LSM
Me
diu
m L
SM
Hig
h L
SM
Yes 44 46 43 39 46 68 67 23 37 60 No 51 49 52 55 49 31 30 76 57 34 Don’tknow/Refused 5 5 5 6 4 1 2 1 5 6 Total 100 100 100 100 100 100 100 100 100 100
Figure 1: Households staying within budget
FINANCIAL CONTROL - DETAILED FINDINGS
Household Budgets
The presence of a household budget is suggestive of a
positive awareness relating to financial management.
The survey found that:
! Less than half of South Africans (44%) have a
household budget, with 51% of the population not
having a household budget.
! The higher the level of education or the greater the income, the greater the
likelihood of reporting a household budget.
! Age affects budgeting, as the likelihood of budgeting progressively increases
with age.
Slightly more than half of all South Africans (56%) always or usually stay within
their budgets while 43% indicated that they sometimes or never stay within their
budgets.
10
Always Usually Sometimes Never Don’t know
37
6 1
28
28
37
6 1
28
28
56% of South
Africans always
or usually stay
within their
budgets
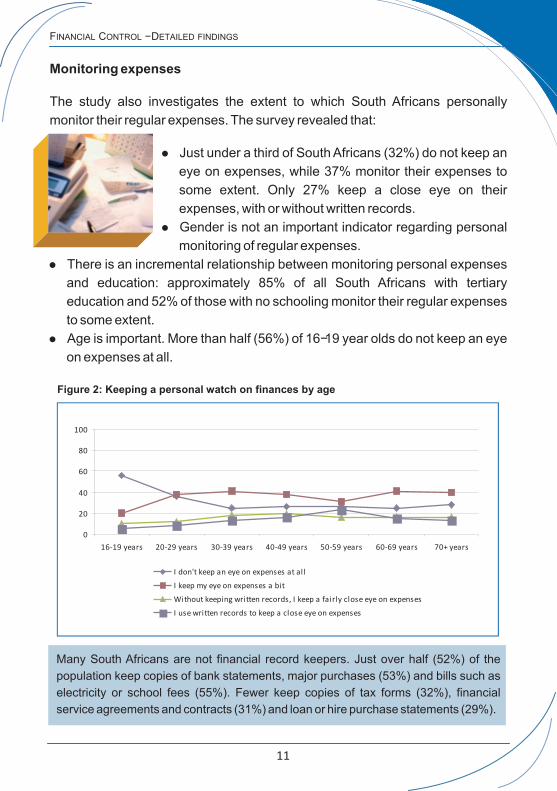
Figure 2: Keeping a personal watch on finances by age
FINANCIAL CONTROL - DETAILED FINDINGS
Monitoring expenses
The study also investigates the extent to which South Africans personally
monitor their regular expenses. The survey revealed that:
! Just under a third of South Africans (32%) do not keep an
eye on expenses, while 37% monitor their expenses to
some extent. Only 27% keep a close eye on their
expenses, with or without written records.
! Gender is not an important indicator regarding personal
monitoring of regular expenses.
! There is an incremental relationship between monitoring personal expenses
and education: approximately 85% of all South Africans with tertiary
education and 52% of those with no schooling monitor their regular expenses
to some extent.
! Age is important. More than half (56%) of 16-19 year olds do not keep an eye
on expenses at all.
Many South Africans are not financial record keepers. Just over half (52%) of the
population keep copies of bank statements, major purchases (53%) and bills such as
electricity or school fees (55%). Fewer keep copies of tax forms (32%), financial
service agreements and contracts (31%) and loan or hire purchase statements (29%).
11
0
20
40
60
80
100
16-19 years 20-29 years 30-39 years 40-49 years 50-59 years 60-69 years 70+ years
I don't keep an eye on expenses at all
I keep my eye on expenses a bit
Without keeping written records, I keep a fairly close eye on expenses
I use written records to keep a close eye on expenses
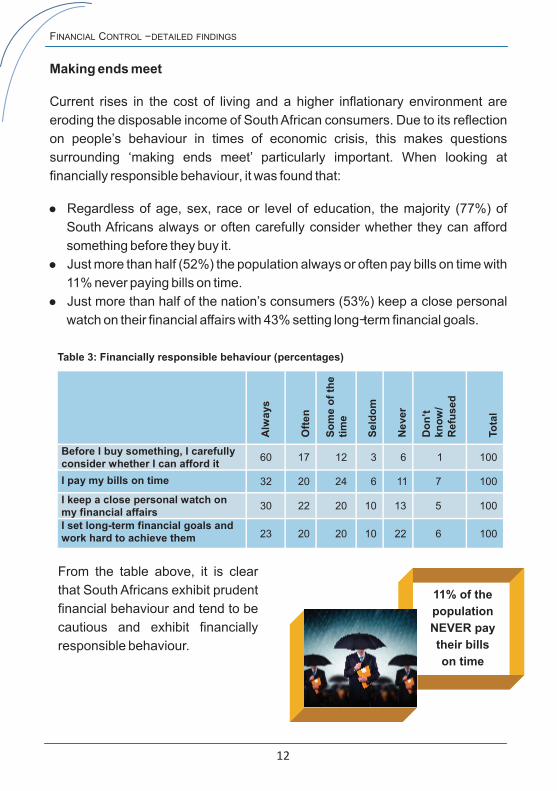
Table 3: Financially responsible behaviour (percentages)
Alw
ays
Oft
en
So
me o
f th
e
tim
e
Seld
om
Ne
ver
Do
n’t
kn
ow
/ R
efu
sed
To
tal
Before I buy something, I carefully consider whether I can afford it
60 17 12 3 6 1 100
I pay my bills on time 32 20 24 6 11 7 100
I keep a close personal watch on my financial affairs
30 22 20 10 13 5 100
I set long-term financial goals and work hard to achieve them 23 20 20 10 22 6 100
FINANCIAL CONTROL - DETAILED FINDINGS
Making ends meet
Current rises in the cost of living and a higher inflationary environment are
eroding the disposable income of South African consumers. Due to its reflection
on people’s behaviour in times of economic crisis, this makes questions
surrounding ‘making ends meet’ particularly important. When looking at
financially responsible behaviour, it was found that:
! Regardless of age, sex, race or level of education, the majority (77%) of
South Africans always or often carefully consider whether they can afford
something before they buy it.
! Just more than half (52%) the population always or often pay bills on time with
11% never paying bills on time.
! Just more than half of the nation’s consumers (53%) keep a close personal
watch on their financial affairs with 43% setting long-term financial goals.
From the table above, it is clear
that South Africans exhibit prudent
financial behaviour and tend to be
cautious and exhibit financially
responsible behaviour.
12
11% of the
population
NEVER pay
their bills
on time

Table 4: Household deprivation during the past twelve months
In the last 12 months, how
often has your family gone…
Often Sometimes Never Don’t know
.. without a cash income 16 34 49 1
.. without medicine/ medical treatment 10 29 60 1
.. without energy to cook food 8 30 62 1
.. without enough food to eat 7 29 64 0
.. without good shelter 4 8 87 1
Figure 3: Financial stress index
FINANCIAL CONTROL - DETAILED FINDINGS
Despite being cautious, many South Africans endured financial hardship in 2011
with:
! Almost half (44%) of the population not being able to cover their living costs;
! Nearly half (49%) of South Africans finding it difficult to pay all their expenses
and bills in a month;
! Half of all consumers often or sometimes going without a cash income; and
! Almost two-fifths (39%) going without medicine or medical treatment, 38%
going without energy to cook food, 36% going without food to eat and 12%
going without shelter.
Using the questions above, a Financial Stress Index (FSI) was constructed to
indicate which groups in South Africa are most stressed financially.
13
0
10
20
30
40
50Male
FemaleBlack African
Coloured
Indian
White
No schooling
Primary
Secondary
Matric
Tertiary education
Poorest
Quintile 2
Quintile 3
Quintile 4Richest
LowMedium
High
Urban, formal
Urban, informal
Rura Trad. Auth. Areas
Rural, formal
Western Cape
Eastern Cape
Northern Cape
Free State
KwaZulu-Natal
North West
Gauteng
MpumalangaLimpopo
Financial Stress Index National Average (30)
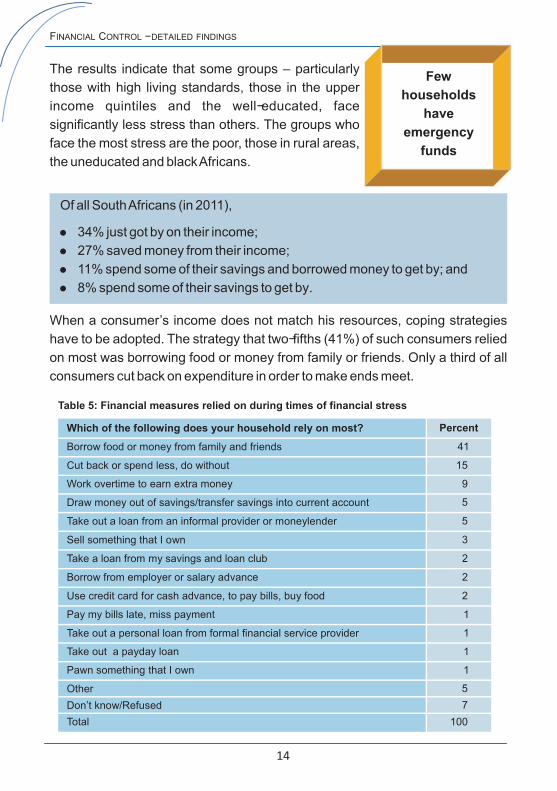
Table 5: Financial measures relied on during times of financial stress
Few
households
have
emergency
funds
Which of the following does your household rely on most? Percent
FINANCIAL CONTROL - DETAILED FINDINGS
The results indicate that some groups – particularly
those with high living standards, those in the upper
income quintiles and the well-educated, face
significantly less stress than others. The groups who
face the most stress are the poor, those in rural areas,
the uneducated and black Africans.
Of all South Africans (in 2011),
! 34% just got by on their income;
! 27% saved money from their income;
! 11% spend some of their savings and borrowed money to get by; and
! 8% spend some of their savings to get by.
When a consumer’s income does not match his resources, coping strategies
have to be adopted. The strategy that two-fifths (41%) of such consumers relied
on most was borrowing food or money from family or friends. Only a third of all
consumers cut back on expenditure in order to make ends meet.
14
Borrow food or money from family and friends 41
Cut back or spend less, do without 15
Work overtime to earn extra money 9
Draw money out of savings/transfer savings into current account 5
Take out a loan from an informal provider or moneylender 5
Sell something that I own 3
Take a loan from my savings and loan club 2
Borrow from employer or salary advance 2
Use credit card for cash advance, to pay bills, buy food 2
Pay my bills late, miss payment 1
Take out a personal loan from formal financial service provider 1
Take out a payday loan 1
Pawn something that I own 1
Other 5
Don’t know/Refused 7
Total 100
KEY FINDINGS:
Financial Planning Modern
consumerism
places a greater
emphasis on
spending and
less on saving.
FINANCIAL PLANNING
Great emphasis has historically been placed on
setting financial goals and working hard to meet
them, saving for the long term and having emergency
funds in place. However, modern consumerism
encourages a less frugal approach, placing a greater
emphasis on spending and less on saving.
Indeed, the average South African only scored 53 in the
financial planning domain. This score is, however, not
consistent across all subgroups.
Results from the analysis show that the financial planning
score is significantly lower for:
! Women relative to men;
! Those aged 16-29 relative to all other age groups; those aged 20-29 relative
to all those aged 30-60;
! Black African and Coloured people relative to Indian and White people;
! Those never married relative to married people; those divorced relative to
those married;
! Those with a low or medium living standard relative to those with a high living
standard;
! Those with no schooling, primary schooling or some secondary schooling
relative to those who have Matric or tertiary education; those with Matric
relative to those with a tertiary education;
! Those living in rural traditional areas, rural farms and informal settlements
relative to those living in urban formal areas;
! Speakers of isiXhosa reletive to speakers of English, Afrikaans and isiZulu;
! Those in the Eastern Cape, North West and Mpumalanga relative to those
living in KwaZulu-Natal, Gauteng; and
! Those living in Limpopo, Free State, Western Cape relative to those living in
KwaZulu-Natal.
15

DETAILED FINDINGS:
Financial Planning
Figure 4: South Africans with emergency funds to cover three months of expenses
FINANCIAL PLANNING - DETAILED FINDINGS
Emergency funds
Prudent saving behaviour is essential
for sound financial management. The
survey revealed, however, that many
respondents reported less than
sagacious saving behaviour.
! Just more than half (52%) of South Africans find it more satisfying to spend
money than save for the long term.
! More than half (56%) of the population plan for the future, with 28% living for
today.
! Just over two-fifths (43%) always / often plan financially for the long-term and
32% never / seldom do.
Less than one-third of South Africans (29%) reported setting aside emergency
or rainy day funds that would cover expenses for at least 3 months. This implies
that over two-thirds (67%) of all consumers will not be able to cover their
expenses for 3 months in case of an emergency.
On the whole, findings suggest that a majority of South Africans only have small
reserves that they could use to fund living expenses during prolonged times of
income loss before they would be forced to rely on other coping strategies.
16
Yes No Don’t know
67
4
29
67
4
29
56% of the
population
plan for
the future
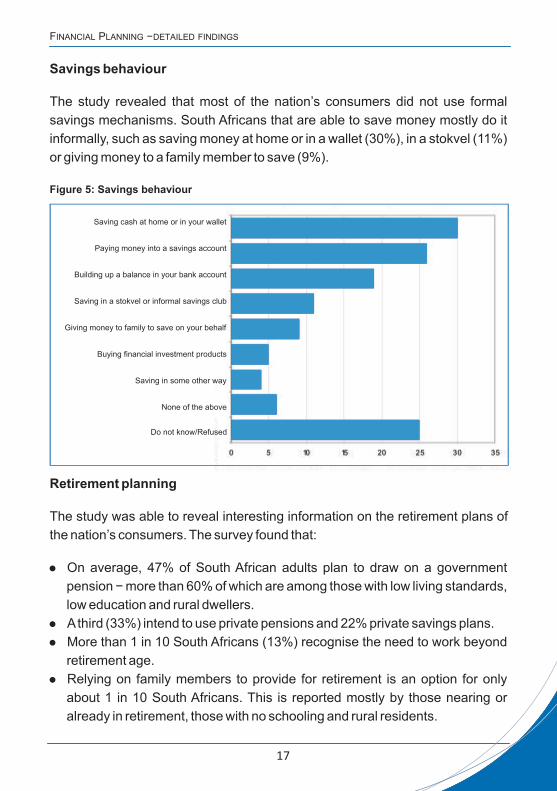
Figure 5: Savings behaviour
FINANCIAL PLANNING - DETAILED FINDINGS
Savings behaviour
The study revealed that most of the nation’s consumers did not use formal
savings mechanisms. South Africans that are able to save money mostly do it
informally, such as saving money at home or in a wallet (30%), in a stokvel (11%)
or giving money to a family member to save (9%).
Retirement planning
The study was able to reveal interesting information on the retirement plans of
the nation’s consumers. The survey found that:
! On average, 47% of South African adults plan to draw on a government
pension - more than 60% of which are among those with low living standards,
low education and rural dwellers.
! A third (33%) intend to use private pensions and 22% private savings plans.
! More than 1 in 10 South Africans (13%) recognise the need to work beyond
retirement age.
! Relying on family members to provide for retirement is an option for only
about 1 in 10 South Africans. This is reported mostly by those nearing or
already in retirement, those with no schooling and rural residents.
17
Saving cash at home or in your wallet
Paying money into a savings account
Building up a balance in your bank account
Saving in a stokvel or informal savings club
Giving money to family to save on your behalf
Buying financial investment products
None of the above
Do not know/Refused
Saving in some other way

Which of the following is included in your financial plan for retirement?
Percent
Government old age pension 47
Workplace pension 33
Personal retirement savings plan 22
Continuing to work after retirement age to earn money 13
Relying on your spouse or partner to support you 10
Relying on your children to support you 10
Relying on financial support from your wider family 9
Using an inheritance 6
Moving to a cheaper property in the same area 3
Moving to a cheaper area 3
Drawing an income from your own business 3
Selling your financial assets 2
Selling your non-financial assets 2
Other 3
Don’t know/Refused 12
Table 6: Items included in financial plans for retirement
FINANCIAL PLANNING - DETAILED FINDINGS
Only 44% are confident that their retirement income will ensure the standard of
living they hope for. An equal share is sceptical.
Concern is especially high for people…
...aged 70+ years;
...with a low living standard;
...with limited schooling; and
...living in rural areas and informal urban settlements.
18
Only 44% of the
population will
have enough
money for
retirement
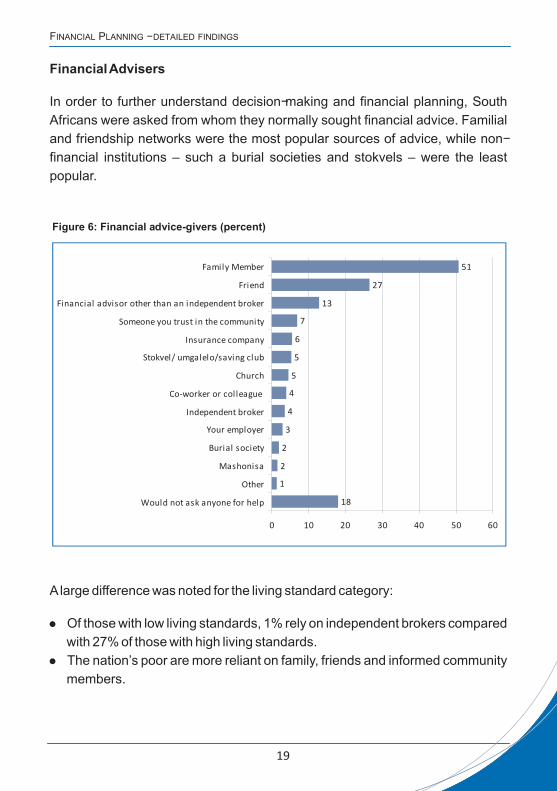
Figure 6: Financial advice-givers (percent)
FINANCIAL PLANNING - DETAILED FINDINGS
Financial Advisers
In order to further understand decision-making and financial planning, South
Africans were asked from whom they normally sought financial advice. Familial
and friendship networks were the most popular sources of advice, while non-
financial institutions – such a burial societies and stokvels – were the least
popular.
A large difference was noted for the living standard category:
! Of those with low living standards, 1% rely on independent brokers compared
with 27% of those with high living standards.
! The nation’s poor are more reliant on family, friends and informed community
members.
19
18
1
2
2
3
4
4
5
5
6
7
13
27
51
0 10 20 30 40 50 60
Would not ask anyone for help
Other
Mashonisa
Burial society
Your employer
Independent broker
Co-worker or colleague
Church
Stokvel/ umgalelo/saving club
Insurance company
Someone you trust in the community
Financial advisor other than an independent broker
Friend
Family Member
FINANCIAL PLANNING - DETAILED FINDINGS
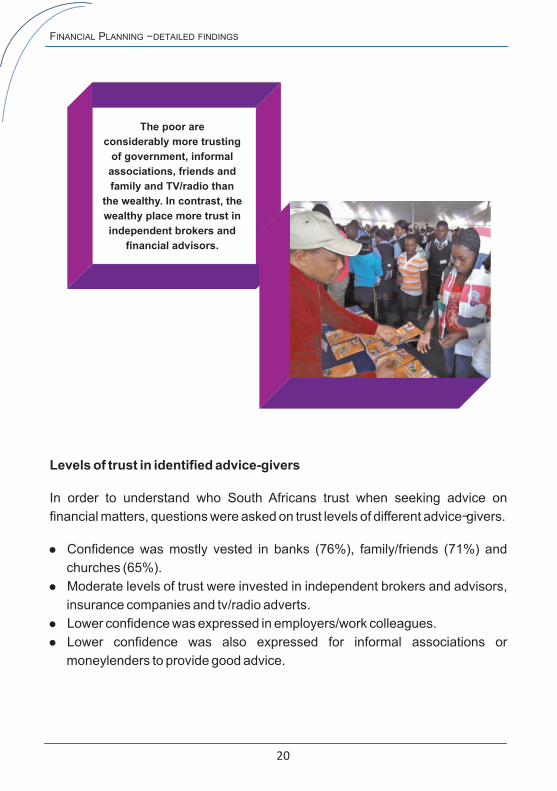
Levels of trust in identified advice-givers
In order to understand who South Africans trust when seeking advice on
financial matters, questions were asked on trust levels of different advice-givers.
! Confidence was mostly vested in banks (76%), family/friends (71%) and
churches (65%).
! Moderate levels of trust were invested in independent brokers and advisors,
insurance companies and tv/radio adverts.
! Lower confidence was expressed in employers/work colleagues.
! Lower confidence was also expressed for informal associations or
moneylenders to provide good advice.
20
The poor are
considerably more trusting
of government, informal
associations, friends and
family and TV/radio than
the wealthy. In contrast, the
wealthy place more trust in
independent brokers and
financial advisors.
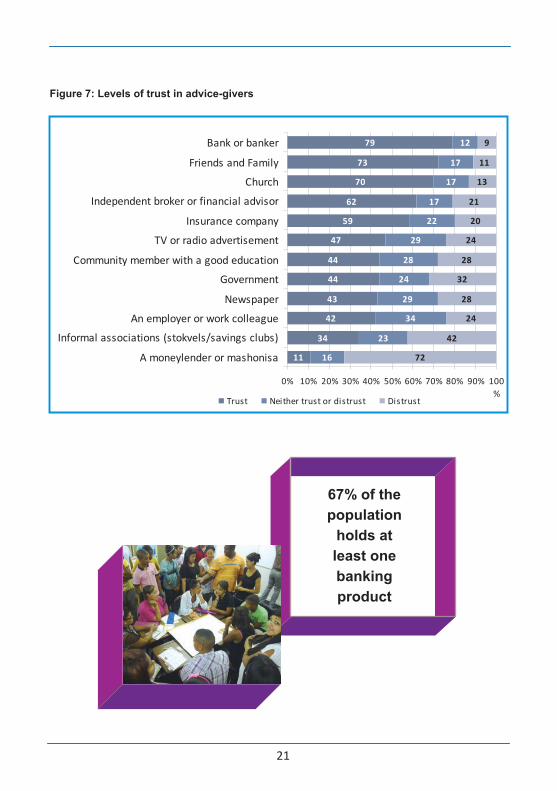
Figure 7: Levels of trust in advice-givers
67% of the
population
holds at
least one
banking
product
21
11
34
42
43
44
44
47
59
62
70
73
79
16
23
34
29
24
28
29
22
17
17
17
12
72
42
24
28
32
28
24
20
21
13
11
9
0% 10% 20% 30% 40% 50% 60% 70% 80% 90% 100
%
A moneylender or mashonisa
Informal associations (stokvels/savings clubs)
An employer or work colleague
Newspaper
Government
Community member with a good education
TV or radio advertisement
Insurance company
Independent broker or financial advisor
Church
Friends and Family
Bank or banker
Trust Neither trust or distrust Distrust
KEY FINDINGS:
Choosing financial products The product
choice score
remains at a
low 45 for
South
Africans.
CHOOSING FINANCIAL PRODUCTS
In the last 20 years, South Africans have been
trying to disentangle themselves from a legacy of
inequality in which access to financial products
was almost exclusively the province of certain
population groups. Our evidence suggests that
although a measure of social mobility may have taken place, social inequality
remains very much with us. The product choice domain score for South Africans
remains low at 45 and the score itself is highly differential based on the obvious
wealth disparity between provinces, social classes and population groups.
Results from the analysis show that the product choice score is significantly
lower for:
! Women relative to men;
! Those aged 16-19 relative to those aged between 20 and 60; those aged
20-29 and 70+ relative to all those in their 40s and 50s;
! Black Africans relative to all other population groups, Coloured people
relative to Indian and White people;
! Those never married, divorced, separated, widowed or married by customary
laws relative to those married by civil laws or those married by both customary
and civil laws;
! Those with a low living standard relative to those with a medium living
standard or high living standard;
! Those with a medium living standard relative to those with a high living
standard;
! All educational groups were statistically significantly different, with product
choice scores increasing as the level of educational attainment increased;
! Those living in rural traditional areas, rural farms and informal settlements
relative to those living in urban formal areas;
! isiXhosa, isiZulu, Setswana and Sepedi speakers relative to English and
Afrikaans speakers;
! Those in Limpopo, Eastern Cape and Western Cape relative to those in the
Northern Cape, Gauteng, KwaZulu-Natal; and
! Those in North West and Free State, relative to those living in Gauteng.
22

DETAILED FINDINGS:
CHOOSING FINANCIAL PRODUCTS - DETAILED FINDINGS
Choosing financial products
The baseline study identified 4 primary
financial product areas: banking, credit
and loan, investment and savings, and
insurance. The study asked South
Africans to identify their awareness of
different products in each of these
product areas and what kind of
products they held.
Before the 4 primary financial product areas are discussed, it is important to note
that the reported mean number of financial products South African consumers
are aware of and possess has a class basis. The mean is highest for those with a
tertiary education, White South Africans and those in regular self-employment.
Household-level disadvantage plays a considerable role in product awareness
as well as the number of products held by respondents. More wealthy South
Africans are inclined to be aware of more products than their poorer
counterparts. Unsurprisingly, the wealthy also have a greater tendency to own
more products than the poor.
23
55% of the
population hold
no investment
or savings
product
29% of all
consumers
hold at least
one credit and
loan product
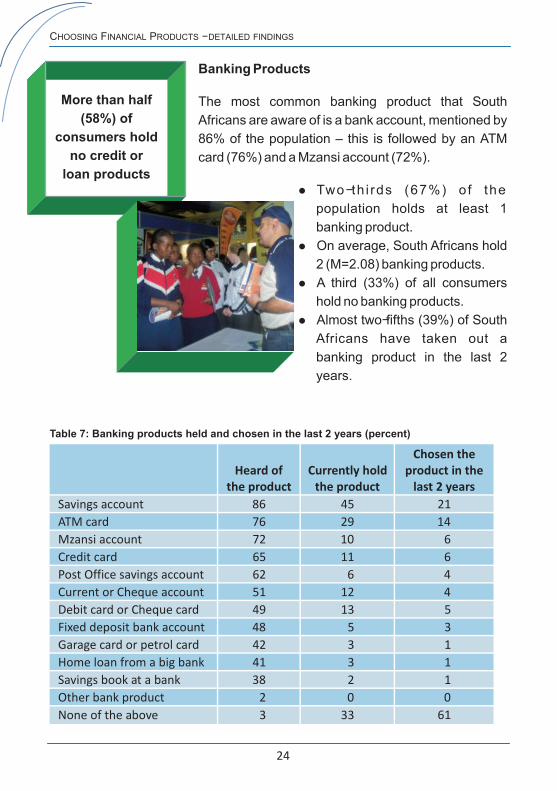
Table 7: Banking products held and chosen in the last 2 years (percent)
Heard of the product
Currently hold the product
Chosen the product in the
last 2 years
Savings account 86 45 21
ATM card 76 29 14
Mzansi account 72 10 6
Credit card 65 11 6
Post Office savings account 62 6 4
Current or Cheque account 51 12 4
Debit card or Cheque card 49 13 5
Fixed deposit bank account 48 5 3
Garage card or petrol card 42 3 1
Home loan from a big bank 41 3 1
Savings book at a bank 38 2 1
Other bank product 2 0 0
None of the above 3 33 61
CHOOSING FINANCIAL PRODUCTS - DETAILED FINDINGS
24
Banking Products
The most common banking product that South
Africans are aware of is a bank account, mentioned by
86% of the population – this is followed by an ATM
card (76%) and a Mzansi account (72%).
! Two- th i rds (67%) o f the
population holds at least 1
banking product.
! On average, South Africans hold
2 (M=2.08) banking products.
! A third (33%) of all consumers
hold no banking products.
! Almost two-fifths (39%) of South
Africans have taken out a
banking product in the last 2
years.
More than half
(58%) of
consumers hold
no credit or
loan products
Heard of the product
Currently hold the product
Chosen the product in the last 2
years
Formal credit and loans
Store card 75 18 10
Lay-buy 72 7 4
Loan from a micro-lender 70 6 4
Hire Purchase (HP) 55 7 5
Vehicle or car finance 54 7 3
Overdraft facility 31 2 1
Informal credit and loans
Loan from friends or family 65 9 7
Loan from informal money lender 60 2 2
Loan from a stokvel/umgalelo 51 3 2
Store account - you pay later 27 2 1
Loan from local spaza 24 4 2
Loan from an employer 20 2 2
None of the above 1 58 68
Don’t know/Refused 0 2 2
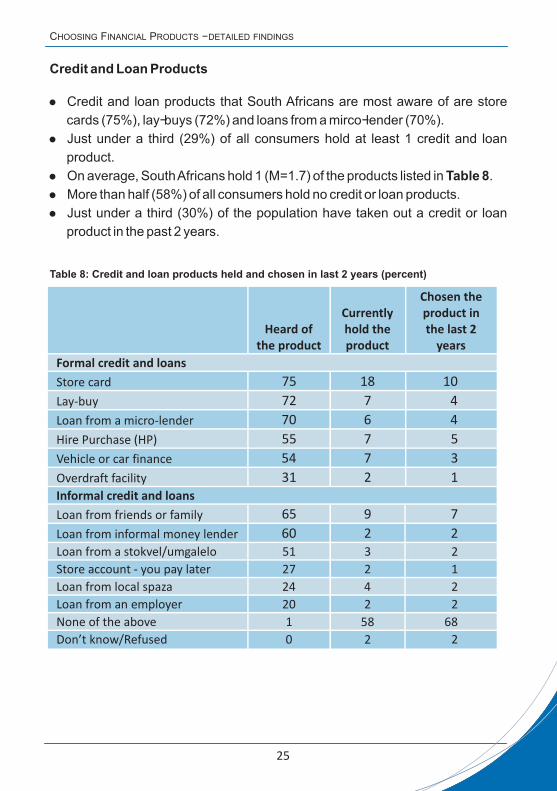
Table 8: Credit and loan products held and chosen in last 2 years (percent)
CHOOSING FINANCIAL PRODUCTS - DETAILED FINDINGS
25
Credit and Loan Products
! Credit and loan products that South Africans are most aware of are store
cards (75%), lay-buys (72%) and loans from a mirco-lender (70%).
! Just under a third (29%) of all consumers hold at least 1 credit and loan
product.
! On average, South Africans hold 1 (M=1.7) of the products listed in Table 8.
! More than half (58%) of all consumers hold no credit or loan products.
! Just under a third (30%) of the population have taken out a credit or loan
product in the past 2 years.
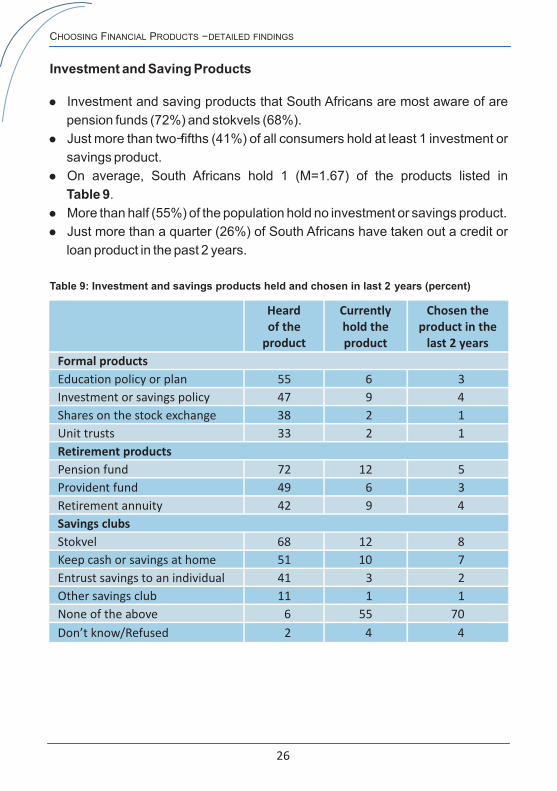
Table 9: Investment and savings products held and chosen in last 2 years (percent)
Heardof the
product
Currently hold the product
Chosen the product in the
last 2 years
Formal products
Education policy or plan 55 6 3
Investment or savings policy 47 9 4
Shares on the stock exchange 38 2 1
Unit trusts 33 2 1
Retirement products
Pension fund 72 12 5
Provident fund 49 6 3
Retirement annuity 42 9 4
Savings clubs
Stokvel 68 12 8
Keep cash or savings at home 51 10 7
Entrust savings to an individual 41 3 2
Other savings club 11 1 1
None of the above 6 55 70
Don’t know/Refused 4 4
CHOOSING FINANCIAL PRODUCTS - DETAILED FINDINGS
26
Investment and Saving Products
! Investment and saving products that South Africans are most aware of are
pension funds (72%) and stokvels (68%).
! Just more than two-fifths (41%) of all consumers hold at least 1 investment or
savings product.
! On average, South Africans hold 1 (M=1.67) of the products listed in
Table 9.
! More than half (55%) of the population hold no investment or savings product.
! Just more than a quarter (26%) of South Africans have taken out a credit or
loan product in the past 2 years.
2
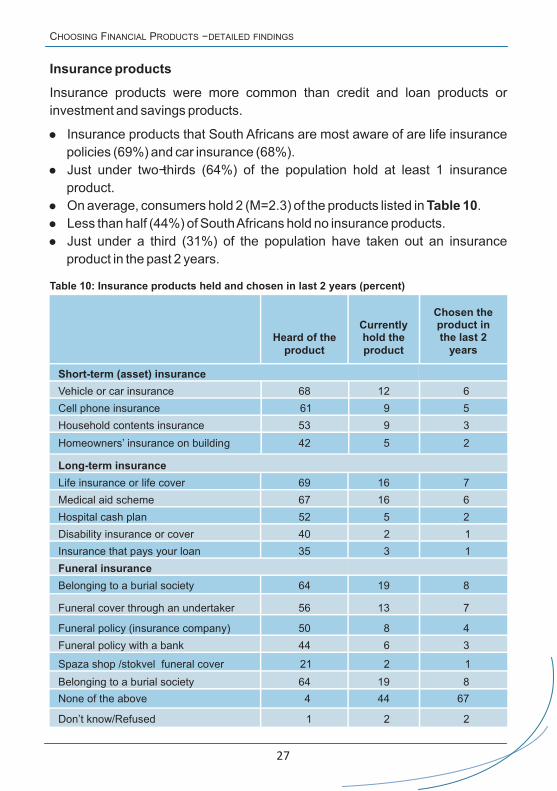
Table 10: Insurance products held and chosen in last 2 years (percent)
Heard of the product
Currently hold the product
Chosen the product in the last 2
years
Short-term (asset) insurance
Vehicle or car insurance 68 12 6
Cell phone insurance 61 9 5
Household contents insurance 53 9 3
Homeowners’ insurance on building 42 5 2
Long-term insurance
Life insurance or life cover 69 16 7
Medical aid scheme 67 16 6
Hospital cash plan 52 5 2
Disability insurance or cover 40 2 1
Insurance that pays your loan 35 3 1
Funeral insurance
Belonging to a burial society 64 19 8
Funeral cover through an undertaker 56 13 7
Funeral policy (insurance company) 50 8 4
Funeral policy with a bank 44 6 3
Spaza shop /stokvel funeral cover 21 2 1
Belonging to a burial society 64 19 8
None of the above 4 44 67
Don’t know/Refused 1 2 2
CHOOSING FINANCIAL PRODUCTS - DETAILED FINDINGS
27
Insurance products
Insurance products were more common than credit and loan products or
investment and savings products.
! Insurance products that South Africans are most aware of are life insurance
policies (69%) and car insurance (68%).
! Just under two-thirds (64%) of the population hold at least 1 insurance
product.
! On average, consumers hold 2 (M=2.3) of the products listed in Table 10.
! Less than half (44%) of South Africans hold no insurance products.
! Just under a third (31%) of the population have taken out an insurance
product in the past 2 years.
CHOOSING FINANCIAL PRODUCTS - DETAILED FINDINGS
Gathering Information for Financial Decision-Making
It is a fair assumption that the financially literate, as far as possible, try to make
informed decisions regarding their finances, but the HSRC study found that
many lack the confidence. The survey revealed that:
! Only 44% of all South Africans are confident of their financial knowledge and
need no advice, compared to 36% who are not confident.
! Of all consumers, 55% claimed to research products thoroughly when
making a financial decision, compared to 25% who did not.
Those with high levels of educational attainment were more likely to conduct
research before making a financial decision when compared to those with low
levels of educational attainment.
Getting financial assistance
In order to understand the power relationship between ordinary South Africans
and financial institutions, the survey asked how confident a respondent felt that
she/he could make an effective complaint against a bank or financial institution.
It was revealed that about 46% of the population indicated that they were
confident that they could make an effective complaint and with 41% reporting
that they were ‘not feeling confident’. More than 12% either refused to answer or
responded they did not know.
A lack of confidence could be linked to an inability to detect unsuitable financial
products. Only a minority of consumers were able to identify financial products in
their portfolio that did not suit them. Of the total respondents, 5% indicated that
they had discovered an unsuitable financial product in their portfolio in the last 5
years. The financial products identified as unsuitable ranged from household
content insurance to a loan from a mashonisa. The financial products that were
identified most often were credit cards, bank accounts (or a card linked to a bank
account) and store cards (or account).
28
Percent
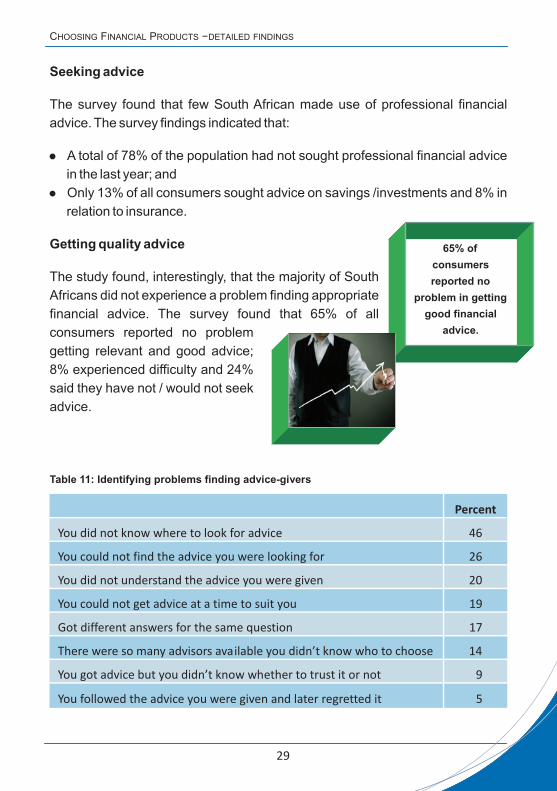
You did not know where to look for advice 46
You could not find the advice you were looking for 26
You did not understand the advice you were given 20
You could not get advice at a time to suit you 19
Got different answers for the same question 17
There were so many advisors available you didn’t know who to choose 14
You got advice but you didn’t know whether to trust it or not 9
You followed the advice you were given and later regretted it 5
Table 11: Identifying problems finding advice-givers
65% of
consumers
reported no
problem in getting
good financial
advice.
Seeking advice
The survey found that few South African made use of professional financial
advice. The survey findings indicated that:
! A total of 78% of the population had not sought professional financial advice
in the last year; and
! Only 13% of all consumers sought advice on savings /investments and 8% in
relation to insurance.
Getting quality advice
The study found, interestingly, that the majority of South
Africans did not experience a problem finding appropriate
financial advice. The survey found that 65% of all
consumers reported no problem
getting relevant and good advice;
8% experienced difficulty and 24%
said they have not / would not seek
advice.
CHOOSING FINANCIAL PRODUCTS - DETAILED FINDINGS
29
KEY FINDINGS:
Knowledge and understanding
KNOWLEDGE AND UNDERSTANDING
30
Domain scores discussed thus far have focused on the application of financial
knowledge to life circumstances, an individual's saving practices, product
choices, willingness to set financial goals, etc. It is necessary, however, to
measure not only aspects of behaviour, but also pure cognitive understanding
on basic mathematics, inflation, interest and risk investment in order to better
understand financial literacy in South Africa.
Measuring knowledge and understanding allows us to discern the relationships
between class, formal education and geographic location in terms of general
financial knowledge and understanding. The national average for this domain is
56 which indicates a score that is not extremely low but at the same time does not
inspire confidence. As we have observed with the other domain scores
discussed, there is a considerable level of disparity between subgroups in South
Africa.
Results from the analysis show that the financial knowledge score is significantly
lower for:
! Women relative to men; ! Those aged 70+ relative to those in their 20's, 40's and 50's; ! Black Africans relative to all other population groups; Coloured people
relative to Indian and White people; ! Those with a low living standard relative to those with a medium living
standard or high living standard; those with a medium living standard relative to those with a high living standard;
! All educational groups were statistically significantly different, with product choice scores increasing as the level of educational attainment increased;
! Those living in rural traditional areas relative to those living in urban formal and informal areas; rural farms relative to urban formal areas;
! isiXhosa, Sesotho, Setswana and Sepedi speakers relative to English, Afrikaans and isiZulu speakers;
! Those in the Free State relative to those living in KwaZulu-Natal, Western Cape, Mpumalanga, Gauteng and Limpopo;
! Those in the Eastern Cape relative to those living in KwaZulu-Natal, Western Cape, Mpumalanga and Gauteng;
! Those in North West, Northern Cape, Limpopo, Gauteng and Mpumalanga relative to those in the KwaZulu-Natal and Western Cape; and
! Those in the Western Cape relative to those in KwaZulu-Natal.
DETAILED FINDINGS:
Knowledge and understanding
KNOWLEDGE AND UNDERSTANDING - DETAILED FINDINGS
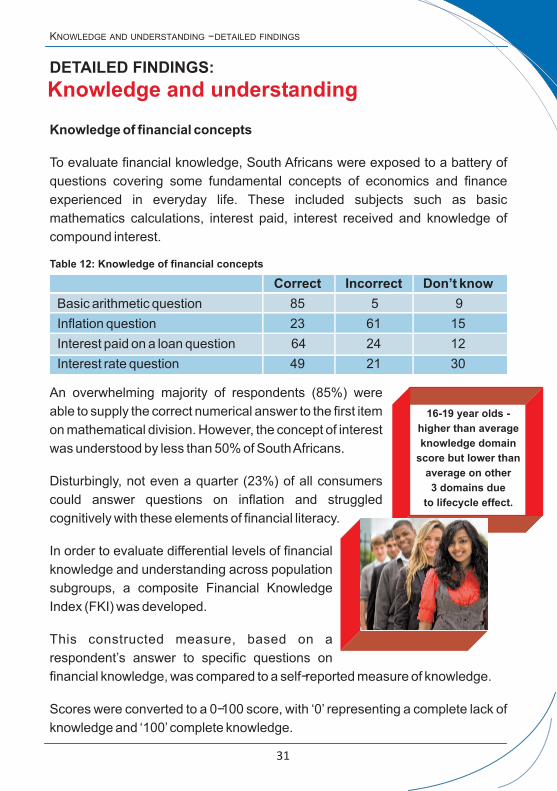
Knowledge of financial concepts
To evaluate financial knowledge, South Africans were exposed to a battery of
questions covering some fundamental concepts of economics and finance
experienced in everyday life. These included subjects such as basic
mathematics calculations, interest paid, interest received and knowledge of
compound interest.
An overwhelming majority of respondents (85%) were
able to supply the correct numerical answer to the first item
on mathematical division. However, the concept of interest
was understood by less than 50% of South Africans.
Disturbingly, not even a quarter (23%) of all consumers
could answer questions on inflation and struggled
cognitively with these elements of financial literacy.
In order to evaluate differential levels of financial
knowledge and understanding across population
subgroups, a composite Financial Knowledge
Index (FKI) was developed.
This constructed measure, based on a
respondent’s answer to specific questions on
financial knowledge, was compared to a self-reported measure of knowledge.
Scores were converted to a 0-100 score, with ‘0’ representing a complete lack of
knowledge and ‘100’ complete knowledge.
31
Correct Incorrect Don’t know
Basic arithmetic question 85 5 9
Inflation question 23 61 15
Interest paid on a loan question 64 24 12
Interest rate question 49 21 30
Table 12: Knowledge of financial concepts
16-19 year olds -
higher than average
knowledge domain
score but lower than
average on other
3 domains due
to lifecycle effect.
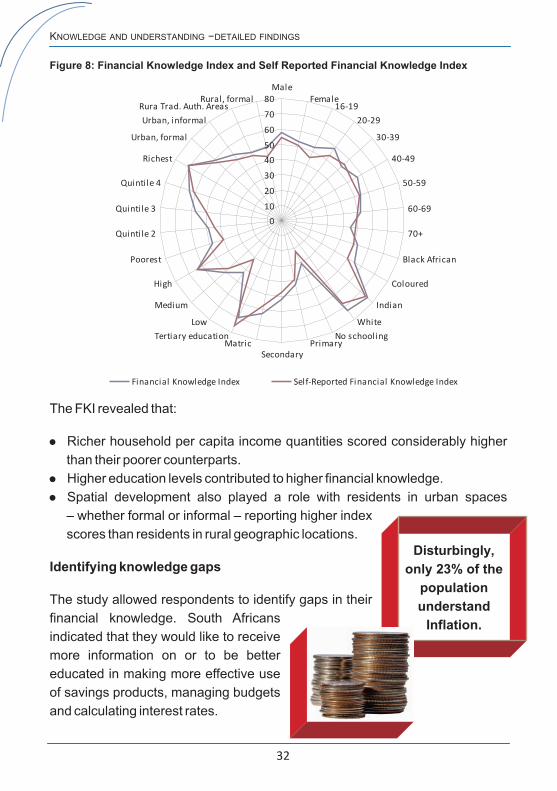
Figure 8: Financial Knowledge Index and Self Reported Financial Knowledge Index
KNOWLEDGE AND UNDERSTANDING - DETAILED FINDINGS
The FKI revealed that:
! Richer household per capita income quantities scored considerably higher
than their poorer counterparts.
! Higher education levels contributed to higher financial knowledge.
! Spatial development also played a role with residents in urban spaces
– whether formal or informal – reporting higher index
scores than residents in rural geographic locations.
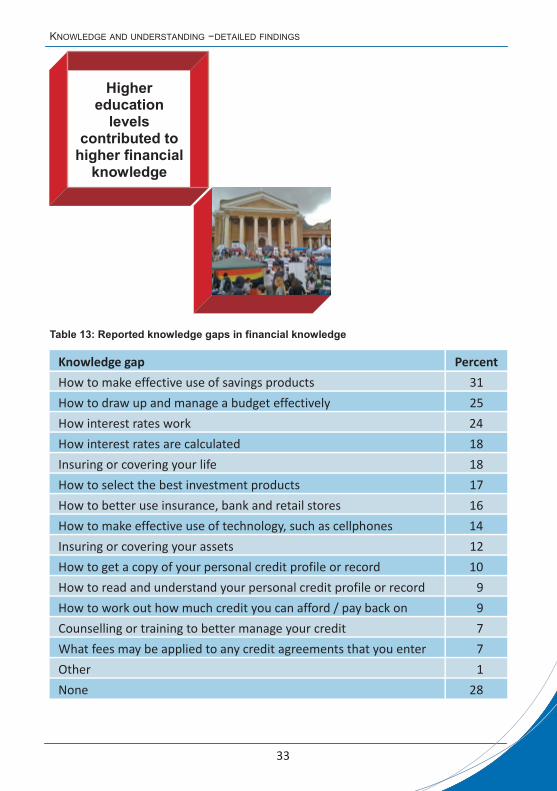
Identifying knowledge gaps
The study allowed respondents to identify gaps in their
financial knowledge. South Africans
indicated that they would like to receive
more information on or to be better
educated in making more effective use
of savings products, managing budgets
and calculating interest rates.
32
Disturbingly,
only 23% of the
population
understand
Inflation.
0
10
20
30
40
50
60
70
80Male
Female16-19
20-29
30-39
40-49
50-59
60-69
70+
Black African
Coloured
Indian
White
No schoolingPrimary
SecondaryMatric
Tertiary education
Low
Medium
High
Poorest
Quintile 2
Quintile 3
Quintile 4
Richest
Urban, formal
Urban, informal
Rura Trad. Auth. AreasRural, formal
Financial Knowledge Index Self-Reported Financial Knowledge Index
Higher education
levels contributed to
higher financial knowledge
Table 13: Reported knowledge gaps in financial knowledge
Knowledge gap Percent
How to make effective use of savings products 31
How to draw up and manage a budget effectively 25
How interest rates work 24
How interest rates are calculated 18
Insuring or covering your life 18
How to select the best investment products 17
How to better use insurance, bank and retail stores 16
How to make effective use of technology, such as cellphones 14
Insuring or covering your assets 12
How to get a copy of your personal credit profile or record 10
How to read and understand your personal credit profile or record 9
How to work out how much credit you can afford / pay back on 9
Counselling or training to better manage your credit 7
What fees may be applied to any credit agreements that you enter 7
Other 1
None 28
KNOWLEDGE AND UNDERSTANDING - DETAILED FINDINGS
33
KEY FINDINGS:
Financial literacy score results
FINANCIAL LITERACY SCORE - KEY FINDINGS
An examination of each individual financial domain score has allowed the
identification of common trends and themes to emerge from the analysis.
However, in order to better depict these common themes, an overall financial
literacy score was calculated. This score, which stands at 54, allows financial
literacy to be measured nationally and across sub-groups.
Results from the analysis show that the overall financial score is significantly
lower for:
! Women relative to men;
! Those aged 16-19 relative to those aged between 20 and 60; those aged
20-29 relative to all those in their 30’s, 40’s, 50’s and 60’s;
! Black Africans relative to all other population groups; Coloured people
relative to Indian and White people;
! Those with a low living standard relative to those with a medium living
standard or high living standard; those with a medium living standard relative
to those with a high living standard;
! All educational groups were statistically significantly different, with product
choice scores increasing as the level of educational attainment increased;
! Those living in rural traditional areas, rural farms, urban informal and informal
areas relative to urban formal areas;
! isiXhosa, Tshivenda & Xitsonga and Setswana speakers relative to English,
Afrikaans and isiZulu speakers;
! Those in the Eastern Cape and Limpopo relative to those living in Western
Cape, Northern Cape, KwaZulu-Natal and Gauteng;
! Those in North West relative to those in Western Cape, KwaZulu-Natal and
Gauteng; and
! Those in the Free State, Mpumalanga, Gauteng, Western Cape relative to
those in KwaZulu-Natal.
34
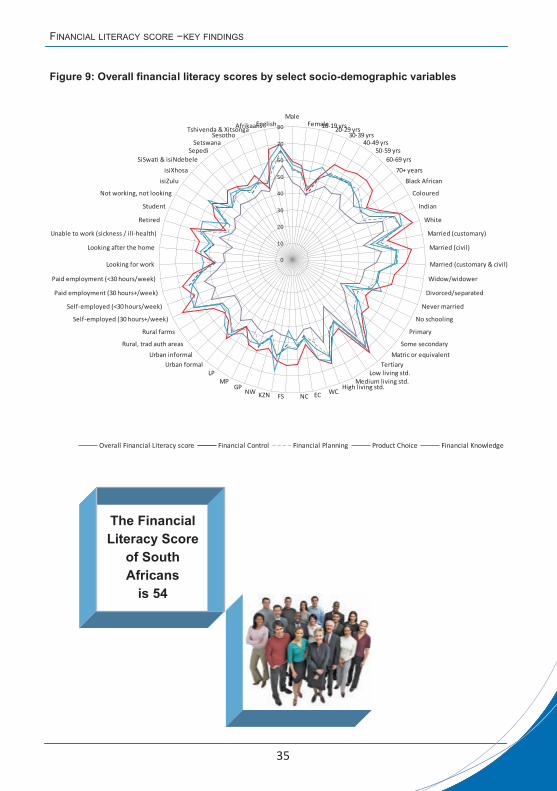
Figure 9: Overall financial literacy scores by select socio-demographic variables
The Financial
Literacy Score
of South
Africans
is 54
FINANCIAL LITERACY SCORE - KEY FINDINGS
35
0
10
20
30
40
50
60
70
80
MaleFemale16-19 yrs
20-29 yrs30-39 yrs
40-49 yrs50-59 yrs
60-69 yrs
70+ years
Black African
Coloured
Indian
White
Married (customary)
Married (civil)
Married (customary & civil)
Widow/widower
Divorced/separated
Never married
No schooling
Primary
Some secondary
Matric or equivalent
TertiaryLow living std.
Medium living std.High living std.
WCECNCFSKZNNWGP
MPLP
Urban formal
Urban informal
Rural, trad auth areas
Rural farms
Self-employed (30 hours+/week)
Self-employed (<30 hours/week)
Paid employment (30 hours+/week)
Paid employment (<30 hours/week)
Looking for work
Looking after the home
Unable to work (sickness / ill-health)
Retired
Student
Not working, not looking
isiZulu
isiXhosa
SiSwati & isiNdebele
SepediSetswana
SesothoTshivenda & Xitsonga
AfrikaansEnglish
Overall Financial Literacy score Financial Control Financial Planning Product Choice Financial Knowledge
DETAILED FINDINGS:
Financial literacy score results
FINANCIAL LITERACY SCORE - DETAILED FINDINGS
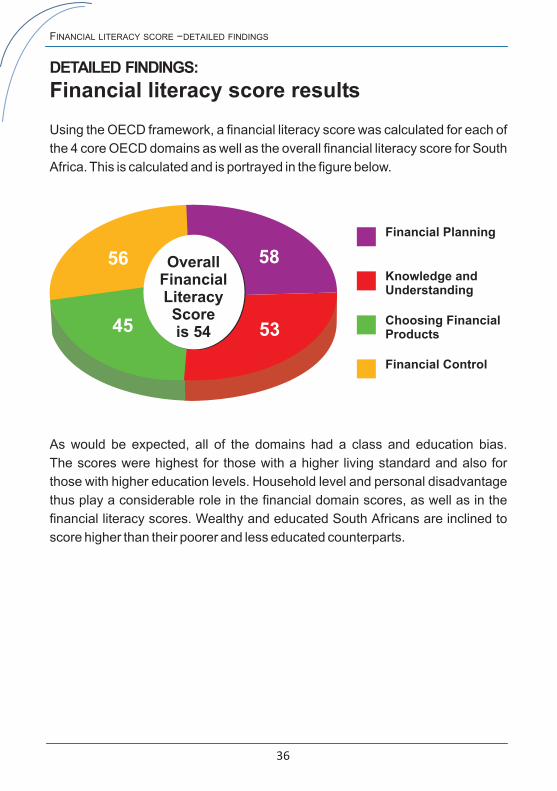
Using the OECD framework, a financial literacy score was calculated for each of
the 4 core OECD domains as well as the overall financial literacy score for South
Africa. This is calculated and is portrayed in the figure below.
OverallFinancialLiteracyScoreis 54
56
45
58
53
Financial Planning
Knowledge and Understanding
Choosing Financial Products
Financial Control
As would be expected, all of the domains had a class and education bias.
The scores were highest for those with a higher living standard and also for
those with higher education levels. Household level and personal disadvantage
thus play a considerable role in the financial domain scores, as well as in the
financial literacy scores. Wealthy and educated South Africans are inclined to
score higher than their poorer and less educated counterparts.
36
Conclusion The baseline study
eliminates the
“one-size-fits-all”
approach in
taking financial
literacy to all South
Africans.
FINANCIAL LITERACY SCORE - CONCLUDING REMARKS
The results of this financial baseline study
confirm the apprehensions of National
Treasury. Not only did a considerable number
of South Africans display very low levels of
financial literacy, but only a minority relied on
experts for financial advice and guidance.
This suggests that a substantial proportion of
the country's population may not be adequately equipped to make sound
financial decisions. Indeed, the baseline study provides strong evidence for the
existence of low levels of financial knowledge in South Africa. The findings of the
study supports a more comprehensive and aggressive programme of consumer
financial education.
The creation of a single score to measure financial literacy creates a better
understanding of financial knowledge in modern South Africa. It is now possible
to accurately present financial literacy in the country with a single measure that
has the potential to inform decision-making at a policy level.
The financial literacy index provides the means by which we can
(i) measure an individual's understanding of
financial management and thus his/her
ability to make good financial decisions;
(ii) determine how consumers cope with the
growing complexity of financial products;
(iii) better understand where consumers look
for important information and objective
advice; and
(iv) learn from whom consumers access
financial products and services.
37
FINANCIAL LITERACY SCORE - NEXT STEPS
This study can provide a platform for
researchers to reach a common
framework of analysis. In addition, the
findings will better allow collaboration and
co-ordinat ion of f inancial sector
stakeholders to raise the financial literacy
levels of all consumers in South Africa.
Moreover, it will now be possible to
measure and monitor the cumulative
effect of interventions and
soc ie ta l progress by
comparing the baseline to
subsequent surveys.
The financial literacy index
can provide some measure
against which the success
of financial education
p rog rammes can be
assessed. Further, the
i ndex can ass i s t i n
determining whether policy and programme objectives are being achieved.
The brief description of the typography of financial literacy in South Africa
highlights the need for policy-makers to target specific regions for financial
consumer education interventions.
To be effective, financial consumer education programmes must be aware of the
need to differentiate between individuals and groups. Resources available for
consumer financial education are not infinite and relying on a “one-size-fits-all”
approach would only lead to ineffective interventions and poor outcomes.
38
The study will be
repeated in the
next 3-5 years to
review the financial
literacy levels of
South Africans
FINANCIAL LITERACY SCORE - KEY FINDINGS
39
Next steps
Subsequent to this study, the following will take place:
! An annual update of key indicators as identified in the OECD Pilot Survey.
! The survey instrument and data will be made available on the FSB‘s website
(www.fsb.co.za) and the future Consumer Education website so that
organisations, researchers and others can use the results to develop and
implement financial education programmes that address the financial literacy
needs of all South Africans.
! Continuous analysis of the survey data in order to inform the risk-based
approach articulated by National Treasury for addressing the financial
education needs of consumers.
! The study will be repeated in the next 3 to 5 years to assess the impact of
efforts to increase the financial literacy of South Africans.
For a copy of the comprehensive report visit www.fsb.co.za,
Enquiries can be emailed to [email protected]
Or call +27 (0) 12 428 8000 and ask for the Consumer Education
Department.
Report prepared for
The Financial Services Board (FSB)
by Human Sciences Research Council (HSRC)
Democracy, Governance & Service Delivery (DGSD) Research Programme
Recommended