The University of Akron (a component unit of the State of Ohio)
Financial Report With Supplemental Information
June 30, 2011

The University of Akron
Table of Contents Pages Management's Discussion and Analysis .................................................................... 1 - 7 Report of Independent Auditors ............................................................................. 8 Basic Financial Statements
Statements of Net Assets .............................................................................. 9 Statements of Revenues, Expenses, and Changes in Net Assets ............................... 10 Statements of Cash Flows ......................................................................... 11 - 12 Notes to the Financial Statements ............................................................... 13 – 32
Supplemental Financial Information ........................................................................ 33
Report on Internal Control Over Financial Reporting and on Compliance and Other Matters Based on an Audit of Financial Statements
Performed in Accordance with Government Auditing Standards ................. 34 - 35 Report on Compliance with Requirements Applicable to Each Major
Program and Internal Control Over Compliance in Accordance with OMB Circular A-133 ................................................................. 36 - 37
Schedule of Expenditures of Federal Awards .................................................. 38 - 43 Notes to Schedule of Expenditures of Federal Awards ....................................... 44 – 46 Schedule of Findings and Questioned Costs .................................................... 47 - 49 Summary of Prior Audit Findings .................................................................... 50
The University of Akron Management's Discussion and Analysis
June 30, 2011
1
The discussion and analysis of The University of Akron’s (The University) annual financial performance provides an overall review of The University’s financial activities for the fiscal year ended June 30, 2011. This discussion and analysis views The University’s financial performance as a whole; readers should also review the financial statements and related notes to the financial statements to enhance their understanding of The University’s financial performance.
Using the Annual Financial Report
The annual report consists of this Management’s Discussion and Analysis, three separate but interrelated financial statements prepared in accordance with Governmental Accounting Standards Board (GASB) Statement No. 34, Basic Financial Statements and Management’s Discussion and Analysis for State and Local Governments, as amended by GASB Statement No. 35, Basic Financial Statements and Management’s Discussion and Analysis for Public Colleges and Universities, and the Report of Independent Auditors. The financial statements are prepared using the accrual basis of accounting, which is similar to the accounting method used by many private sector companies. Under the accrual basis of accounting, revenues are recognized when earned while expenses are recognized when incurred. The University’s financial statements include the Statements of Net Assets; Revenues, Expenses and Changes in Net Assets; and Cash Flows. The financial statements focus on the financial condition, results of operations, and cash flows of The University, as a whole. The Statement of Net Assets includes all assets and liabilities, with the difference between the two reported as net assets. The assets and liabilities are presented in the order of relative liquidity while net assets are categorized as Invested in capital assets, net of related debt; Restricted; or Unrestricted. Over time, increases or decreases in net assets are an indicator of the improvement or erosion of The University’s financial health. The Statement of Revenues, Expenses, and Changes in Net Assets presents revenues earned and expenses incurred during the year. The revenues and expenses are classified as either operating or nonoperating. The State of Ohio (State) provides significant operating and capital financial resources to The University, which are classified as Nonoperating revenues; therefore, substantial Operating losses are not uncommon for public colleges and universities. For the fiscal years ended June 30, 2011, 2010, and 2009, the State provided approximately $116 million, $128 million, and $119 million, respectively, for operating and capital purposes while The University’s operating losses were approximately $141 million, $139 million, and $154 million for each of those years. The Statement of Cash Flows presents information related to cash inflows and outflows summarized within the activities of operating, noncapital financing, capital and related financing, and investing activities. Cash flows from operating activities generally result from the provision of goods or services in the normal course of doing business and are generally the cash effects of transactions that determine operating income. Meanwhile, noncapital financing activities typically include borrowing and repaying money for purposes other than acquiring, constructing, or improving capital assets. Conversely, Capital and related financing activities generally include acquiring and disposing of capital assets, borrowing and repaying money for acquiring, constructing, or improving capital assets, and paying for capital assets obtained from vendors on credit. The investing activities generally relate to making and collecting loans and acquiring and disposing of debt or equity instruments. The University is considered a discretely presented component unit of the State of Ohio and as such, The University’s financial activity is also included within the State of Ohio’s Comprehensive Annual Financial Report.
The University of Akron Management's Discussion and Analysis
June 30, 2011
2
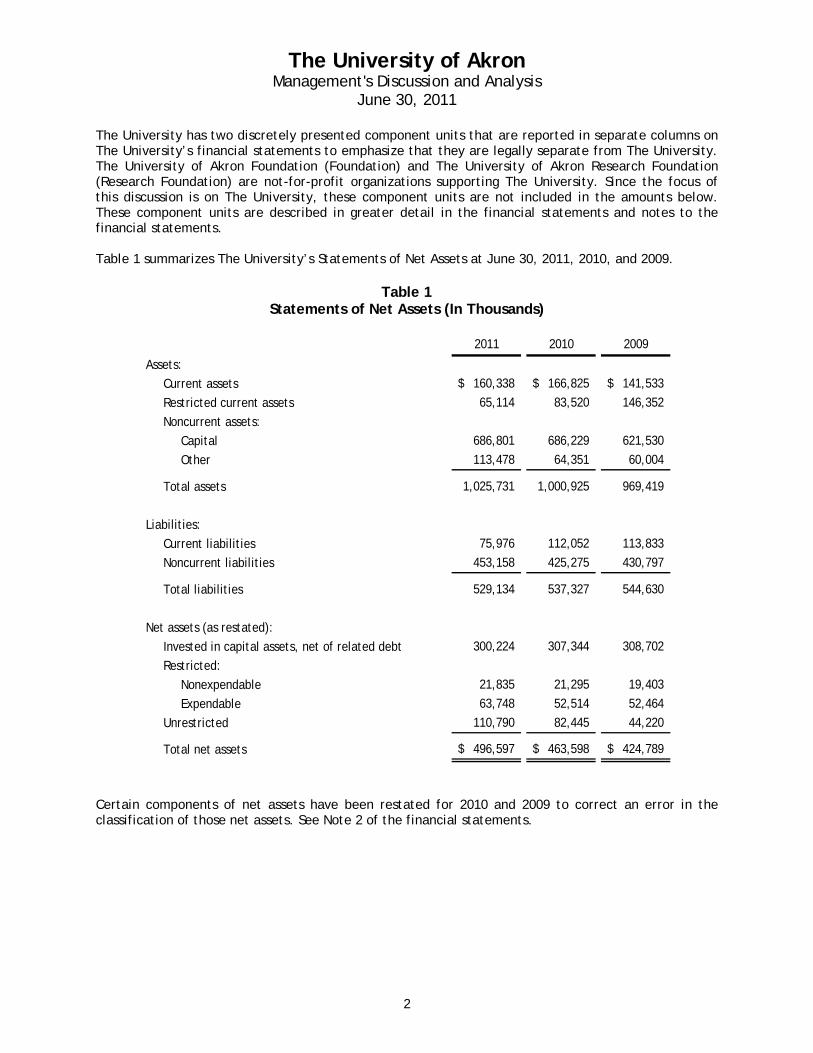
The University has two discretely presented component units that are reported in separate columns on The University’s financial statements to emphasize that they are legally separate from The University. The University of Akron Foundation (Foundation) and The University of Akron Research Foundation (Research Foundation) are not-for-profit organizations supporting The University. Since the focus of this discussion is on The University, these component units are not included in the amounts below. These component units are described in greater detail in the financial statements and notes to the financial statements. Table 1 summarizes The University’s Statements of Net Assets at June 30, 2011, 2010, and 2009.
Table 1 Statements of Net Assets (In Thousands)
2011 2010 2009
Assets:
Current assets 160,338$ 166,825$ 141,533$
Restricted current assets 65,114 83,520 146,352
Noncurrent assets:
Capital 686,801 686,229 621,530
Other 113,478 64,351 60,004
Total assets 1,025,731 1,000,925 969,419
Liabilities:
Current liabilities 75,976 112,052 113,833
Noncurrent liabilities 453,158 425,275 430,797
Total liabilities 529,134 537,327 544,630
Net assets (as restated):
Invested in capital assets, net of related debt 300,224 307,344 308,702
Restricted:
Nonexpendable 21,835 21,295 19,403
Expendable 63,748 52,514 52,464
Unrestricted 110,790 82,445 44,220
Total net assets 496,597$ 463,598$ 424,789$
Certain components of net assets have been restated for 2010 and 2009 to correct an error in the classification of those net assets. See Note 2 of the financial statements.
The University of Akron Management's Discussion and Analysis
June 30, 2011
3
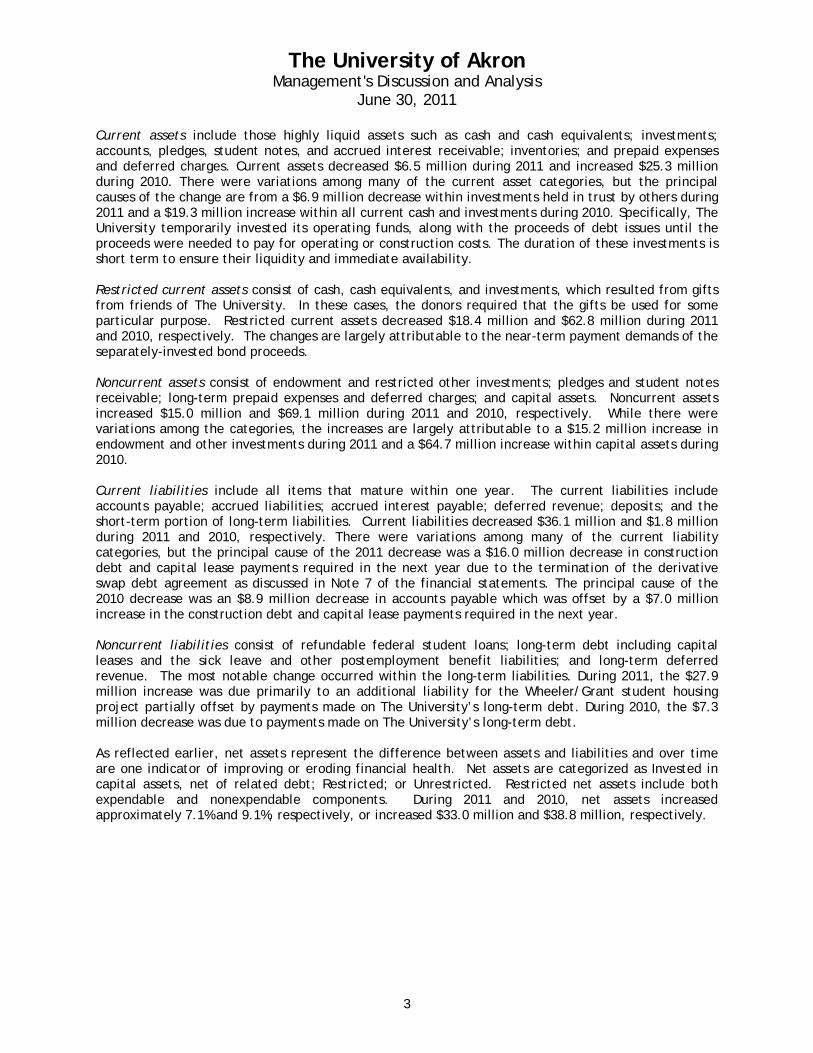
Current assets include those highly liquid assets such as cash and cash equivalents; investments; accounts, pledges, student notes, and accrued interest receivable; inventories; and prepaid expenses and deferred charges. Current assets decreased $6.5 million during 2011 and increased $25.3 million during 2010. There were variations among many of the current asset categories, but the principal causes of the change are from a $6.9 million decrease within investments held in trust by others during 2011 and a $19.3 million increase within all current cash and investments during 2010. Specifically, The University temporarily invested its operating funds, along with the proceeds of debt issues until the proceeds were needed to pay for operating or construction costs. The duration of these investments is short term to ensure their liquidity and immediate availability. Restricted current assets consist of cash, cash equivalents, and investments, which resulted from gifts from friends of The University. In these cases, the donors required that the gifts be used for some particular purpose. Restricted current assets decreased $18.4 million and $62.8 million during 2011 and 2010, respectively. The changes are largely attributable to the near-term payment demands of the separately-invested bond proceeds. Noncurrent assets consist of endowment and restricted other investments; pledges and student notes receivable; long-term prepaid expenses and deferred charges; and capital assets. Noncurrent assets increased $15.0 million and $69.1 million during 2011 and 2010, respectively. While there were variations among the categories, the increases are largely attributable to a $15.2 million increase in endowment and other investments during 2011 and a $64.7 million increase within capital assets during 2010. Current liabilities include all items that mature within one year. The current liabilities include accounts payable; accrued liabilities; accrued interest payable; deferred revenue; deposits; and the short-term portion of long-term liabilities. Current liabilities decreased $36.1 million and $1.8 million during 2011 and 2010, respectively. There were variations among many of the current liability categories, but the principal cause of the 2011 decrease was a $16.0 million decrease in construction debt and capital lease payments required in the next year due to the termination of the derivative swap debt agreement as discussed in Note 7 of the financial statements. The principal cause of the 2010 decrease was an $8.9 million decrease in accounts payable which was offset by a $7.0 million increase in the construction debt and capital lease payments required in the next year. Noncurrent liabilities consist of refundable federal student loans; long-term debt including capital leases and the sick leave and other postemployment benefit liabilities; and long-term deferred revenue. The most notable change occurred within the long-term liabilities. During 2011, the $27.9 million increase was due primarily to an additional liability for the Wheeler/Grant student housing project partially offset by payments made on The University’s long-term debt. During 2010, the $7.3 million decrease was due to payments made on The University’s long-term debt. As reflected earlier, net assets represent the difference between assets and liabilities and over time are one indicator of improving or eroding financial health. Net assets are categorized as Invested in capital assets, net of related debt; Restricted; or Unrestricted. Restricted net assets include both expendable and nonexpendable components. During 2011 and 2010, net assets increased approximately 7.1% and 9.1%, respectively, or increased $33.0 million and $38.8 million, respectively.

The University of Akron Management's Discussion and Analysis
June 30, 2011
4
Table 2 summarizes The University’s Statements of Revenues, Expenses, and Changes in Net Assets for the years ended June 30, 2011, 2010, and 2009.
Table 2 Statements of Revenues, Expenses, and Changes in Net Assets (In Thousands)
2011 2010 2009
Operating revenues:
Tuition and fees 197,508$ 189,066$ 176,843$
Grants and contracts 35,114 33,472 35,763
Sales and services 14,572 13,494 12,280
Auxiliary enterprises 56,207 50,955 47,905
Other operating revenues 816 991 1,006
Total operating revenues 304,217 287,978 273,797
Operating expenses:
Educational and general:
Instruction and departmental research 142,092 136,009 134,676
Other educational and general 201,150 199,295 202,401
Auxiliary enterprises 63,458 59,367 57,345
Depreciation and loss on disposal 38,475 32,744 32,935
Total operating expenses 445,175 427,415 427,357
Operating loss (140,958) (139,437) (153,560)
Nonoperating revenues (expenses):
State appropriations 95,959 95,836 107,665
Federal fiscal stabilization funds 15,664 15,244 -
Federal grants 43,035 34,424 22,941
Gifts and distributions 23,249 20,376 17,174
Other (net) (10,067) (7,556) (15,884)
Net nonoperating revenues 167,840 158,324 131,896
Gain (loss) before other changes 26,882 18,887 (21,664)
Other changes:
Capital appropriations 4,215 17,029 11,369
Other changes (net) 1,902 2,893 2,440
Total other changes 6,117 19,922 13,809
Increase (decrease) in net assets 32,999 38,809 (7,855)
Net assets:
Net assets - beginning of year 463,598 424,789 432,644
Net assets - end of year 496,597$ 463,598$ 424,789$

The University of Akron Management's Discussion and Analysis
June 30, 2011
5
The student tuition and fees increased $8.4 million or 4.5% during 2011 and increased $12.2 million or 6.9% during 2010. The increases in tuition and fees are attributed to the student headcount, student credit hours taken, and fees charged. The University’s total student headcount increased approximately 5% in both the Fall 2010 and 2009 census. Along with headcount, the total student credit hours (or actual courses taken) increased 5% in 2011 and 2010. The University enacted a tuition freeze for the fall semester of the 2010 academic year. Tuition and general fees were increased 3.5% for the spring 2010 semester and an additional 3.5% in Summer 2010. In addition to the fees collected, GASB requires the portion of student aid which is provided in the form of reduced tuition to be reported as a reduction of revenue. This reduction, or scholarship allowance, increased $11.2 million to $66.7 million in 2011 and increased $12.7 million to $55.5 million in 2010. Both increases were a reflection of increased scholarships awarded and other funding opportunities for students. The combined federal, state, local, and private grants and contracts revenue levels represent The University’s continued pursuit of federal, state, local, and private funding for research-related activities. Federal revenues represented the largest component of these revenues at $20.0 million and $17.0 million in 2011 and 2010, respectively, followed by private revenues at $7.5 million and $8.5 million in 2011 and 2010, respectively. The largest federal sources were the Office of Education (OE) and the National Science Foundation (NSF) with the awards for scholarships and grants. OE provided nearly $5.0 million and $4.9 million during 2011 and 2010, respectively. NSF provided $3.9 million and $3.8 million during 2011 and 2010, respectively. The largest source of private revenue totaling $1.2 million in 2011 was from a grant to establish the High Institute for Elastomer Industries (HIEI). The largest source of private revenue in 2010 was the Reading First grant which provided $1.2 million. The state and local revenues consisted of multiple smaller dollar awards. Sales and services revenue are from certain operations, which provide services to both students and other departments within The University campus. The most significant of these operations was Computer Solutions, which generated sales totaling $4.6 million for 2011 and $3.7 million for 2010. Auxiliary enterprises revenue is generated from operations which predominantly exist to furnish goods or services to students, faculty, staff, or the general public. These types of activities are intended to be self-supporting in that the revenues generated are intended to cover the costs of providing the services. The University’s auxiliary services include the residence halls, student unions, intercollegiate athletics and athletic facilities, parking services, E.J. Thomas Performing Arts Hall, telecommunications, and dining facilities. Auxiliary enterprises revenue increased $5.3 million and $3.1 million in 2011 and 2010, respectively. The predominant revenues within this area are from dining facilities, residence halls, and parking services. During 2011, the revenues generated from those three areas represented $16.4 million, $19.1 million, and $9.6 million, respectively, or 80.2% of the total $56.2 million revenues. During 2010, the revenues generated from those three areas represented $15.4 million, $16.2 million, and $7.8 million, respectively, or 77.3% of the total $51.0 million revenues. The educational and general expenses category is the single largest category of expenses and includes all academic and administrative support salary and benefit-related costs. Overall, these expenses increased 2.4% during 2011 and had a slight decrease of nearly 0.5% during 2010. The most notable increase during 2011 of $6.1 million occurred within instruction and departmental research. This increase was largely due to increased expenditures for instructional faculty and staff wages and departmental expenses. The greatest increase during 2010 of $7.1 million occurred within scholarships and fellowships and reflects increased scholarships paid to students. This increase was offset by a $7.2 million decrease in institutional support during 2010.

The University of Akron Management's Discussion and Analysis
June 30, 2011
6
Auxiliary enterprises expenses result from those operations, which as previously noted, predominantly furnish goods or services to students, faculty, staff, or the general public. Auxiliary enterprise expenses increased $4.1 million and $2.0 million in 2011 and 2010, respectively. The largest increase during 2011 occurred within residence halls which was a result of the opening of the Spicer Residence Hall along with other increases in maintenance costs. The largest increase during 2010 occurred within intercollegiate athletics which assumed responsibility for the Stile Field House and related operating costs. Unlike many items that are expensed when purchased, The University capitalizes most long-term assets. The assets are then expensed over estimated useful lives ranging from 3 years for certain equipment to 40 years for buildings. Generally, depreciation expense is predictable from year to year, taking into account items which become fully depreciated during the prior year and capital asset additions and deletions for the current year. Depreciation expense increased $4.6 million in 2011 and $1.0 million in 2010, respectively, due to changing levels of capital asset purchases related to the capital project initiative. The University periodically sells or disposes of obsolete capital assets. Unlike many revenue and expense areas, which tend to be predictable among years, the gains or losses from the disposition of capital assets are often a result of management discretion. The University realized losses totaling $1.3 million and $0.2 million during 2011 and 2010, respectively. The losses occurred with the removal of buildings and sale of equipment. The state appropriations represent the most significant nonoperating revenue source for The University. In 2011 and 2010, state appropriations were enhanced with fiscal stabilization funding from the federal government to the State of Ohio. Together, the state appropriations, fiscal stabilization funding, and student tuition and fees are the predominant resources used to fund The University’s daily operations. The state appropriations and fiscal stabilization funding combined increased $0.5 million and $3.4 million in 2011 and 2010, respectively. The declining increases are part of continued shifts in higher education funding over the past few years and are largely attributable to state-level fiscal challenges. The State of Ohio also provides capital appropriations to The University. Unlike the operating resources reflected previously, these resources are provided to help with The University’s capital needs. The funding is provided through the Ohio Board of Regents (OBOR) based upon certain formulas and a capital plan provided by The University. The capital appropriations decreased $12.8 million and increased $5.7 million in 2011 and 2010, respectively. The University also records Pell grant awards as nonoperating federal grant revenue. Pell grant revenue increased $8.6 million or 25.0% and $11.5 million or 50.1% during 2011 and 2010, respectively. The University views continued donor support as a vital ingredient to its continued success. Many student scholarships, capital construction costs, and endowed positions are a result of our very generous contributors. The University receives gifts from a wide array of friends including alumni, the business community, and foundations. Oftentimes, gifts and awards are accompanied by donor restrictions. In those cases, The University maintains a system of internal controls to ensure the gifts are used solely in accordance with the grantor’s requirements. For 2011 and 2010, gifts and grants for these purposes and additions to permanent endowments totaled $25.2 million and $23.3 million, respectively.
The University of Akron Management's Discussion and Analysis
June 30, 2011
7
Other net nonoperating revenues and expenses represent the remaining sources and uses of funds that generally do not result from providing educational and instructional services in connection with The University’s principal ongoing operations. Investment income, including the unrealized change in fair value of investments, totaled $12.0 million and $8.4 million during 2011 and 2010, respectively. Investment income, net of investment expenses, increased $0.5 million in 2011 and $7.2 million in 2010. The changes are due to overall fluctuations in returns on all investments. Those investments were not redeemed; nevertheless, GASB Statement No. 31 requires those investments be reported at fair value for financial statement reporting purposes. Meanwhile, the $3.2 million and $2.4 million net increase in 2011 and 2010, respectively, within net unrealized appreciation on investments occurred because of market conditions as of fiscal year end and the fair value of the investments changing substantially. Once again, those investments were not redeemed, but were adjusted to fair value for financial statement reporting purposes. The University reviewed its investment policies over the past two years and modified its strategies to reduce the portfolio’s vulnerability to significant market fluctuations while maintaining certain returns. Interest on debt includes the interest incurred during the fiscal year on all debt and capital leases less capitalized interest. Interest expense increased $4.7 million to $19.6 million in 2011 and decreased by $1.7 million to $14.9 million in 2010. Capital Assets and Long-term Debt Activity
The University uses state capital appropriations, internal resources including the proceeds from debt issuances, and gifts and other grants for capital asset expansion throughout the campus. During 2011 and 2010, additions to capital assets approximated $83.9 million and $125.7 million, respectively, net of construction in progress additions. The capital asset activity is reflected in more thorough detail within Note 6 of the financial statements. The University’s long-term debt principally consists of its general receipts bonds, which totaled $394.2 million in 2011 and $418.6 million in 2010. During 2011, The University issued $131.4 million of General Receipts Refunding Bonds, Series 2010A. The proceeds of the Series 2010A Bonds were used to refund $123.1 million of The University’s outstanding General Receipts Bonds, Series 2008C1 & 2008C2 and pay issuance costs. No additional long-term debt was issued during 2010. The University continued to make payments on other outstanding debt for a total of approximately $13.9 million. The long-term debt activity is reflected in more thorough detail within Note 7 of the financial statements. Factors Impacting Future Periods
The student tuition and fees, state appropriations, and federal fiscal stabilization funding are the principal revenue sources which supported The University’s annual operations over the last two years. For both 2011 and 2010, those three revenue sources alone represented $309.1 million and $300.1 million, respectively, of The University’s total operating and nonoperating revenues while the aggregate remaining operating and nonoperating revenues, excluding the change in the fair value of investments, totaled $185.6 million and $179.7 million, respectively. The University will no longer receive federal fiscal stabilization funding. In turn, state support provided through the State Share of Instruction subsidy is projected to decline approximately $15 million for fiscal year 2012. The University’s ability to maintain or expand existing academic programs and to pursue other initiatives will be directly impacted by the remaining major revenue sources. In this uncertain economic climate, The University needs to pursue opportunities to diversify its revenue sources. In addition, The University’s financial future will also be significantly affected by its ability to manage and control expenses proportional to revenue fluctuations.

8
Independent Auditor's Report
To the Board of Trustees University of Akron
We have audited the accompanying statement of net assets of University of Akron (the "University"), a discretely presented component unit of the State of Ohio, and its component units as of June 30, 2011 and 2010 and the related statements of revenue, expenses, and changes in net assets and cash flows for the years then ended. These financial statements are the responsibility of the University's management. Our responsibility is to express an opinion on these financial statements based on our audits.
We conducted our audits in accordance with auditing standards generally accepted in the United States of America. In addition, the basic financial statements were audited in accordance with Government Auditing Standards, issued by the Comptroller General of the United States. Those standards require that we plan and perform the audit to obtain reasonable assurance about whether the financial statements are free of material misstatement. An audit includes examining, on a test basis, evidence supporting the amounts and disclosures in the financial statements. An audit also includes assessing the accounting principles used and significant estimates made by management, as well as evaluating the overall financial statement presentation. We believe that our audits provide a reasonable basis for our opinion.
In our opinion, the financial statements referred to above present fairly, in all material respects, the financial position of University of Akron as of June 30, 2011 and 2010 and the results of its operations and cash flows for the years then ended, in conformity with accounting principles generally accepted in the United States of America.
As discussed in Note 2 to the financial statements, certain errors resulting in a restatement within categories of net assets for the year ended June 30, 2010 were discovered during the current year. Accordingly, the 2010 financial statements have been restated and an adjustment has been made to net assets at June 30, 2010 to correct the errors. In accordance with Government Auditing Standards, we have also issued a report dated December 2, 2011 on our consideration of University of Akron's internal control over financial reporting and on our tests of its compliance with certain provisions of laws, regulations, contracts, grant agreements, and other matters for the year ended June 30, 2011. The purpose of that report is to describe the scope of our testing of internal control over financial reporting and compliance and the results of that testing, and not to provide opinions on the internal control over financial reporting or on compliance. That report is an integral part of an audit performed in accordance with Government Auditing Standards and should be considered in assessing the results of our audit.
The management's discussion and analysis presented on pages 1 through 7 is not a required part of the basic financial statements but is supplemental information required by the Governmental Accounting Standards Board. We have applied certain limited procedures, which consisted principally of inquiries of management, regarding the methods of measurement and presentation of the supplemental information. However, we did not audit the information and express no opinion on it. The accompanying schedule of expenditures of federal awards is presented for the purpose of additional analysis as required by U.S. Office of Management and Budget Circular A-133, Audits of States, Local Governments, and Non-Profit Organizations, and is not a required part of the basic financial statements. Such information has been subjected to the auditing procedures applied in the audit of the basic financial statements and, in our opinion, is fairly stated, in all material respects, in relation to the basic financial statements taken as a whole.
December 2, 2011 Toledo, Ohio

ASSETS 2011 2010 2011 2010Current assets:
Cash and cash equivalents 40,481,227$ 323,160$ 688,527$ 1,674,258$ Pooled investments 86,036,820 104,988,937 - - Investments held in trust by others 8,374 6,937,208 - - Accounts receivable, net 26,615,103 29,331,243 1,677,418 1,512,108 Pledges receivable, net 287,606 451,864 2,885,535 3,845,444 Notes receivable, net 1,946,289 2,195,786 5,007,617 5,008,989 Accrued interest receivable 641,555 785,066 - - Inventories 939,026 900,001 - - Prepaid expenses and deferred charges 3,381,650 5,553,650 17,572 92,780 Deferred outflow of resources-derivatives - 15,357,675 - -
Total current assets 160,337,650 166,824,590 10,276,669 12,133,579
Restricted current assets:Cash and cash equivalents 9,539,404 35,077,089 2,300,697 2,545,919 Pooled investments 55,574,306 48,442,898 5,991,323 8,278,749 Other investments - - 4,189,558 8,223,473
Total restricted current assets 65,113,710 83,519,987 12,481,578 19,048,141
Noncurrent assets:Endowment investments 57,164,838 48,170,051 135,987,811 116,132,063 Restricted other investments 40,873,588 - 292,352 371,966 Pledges receivable, net 240,782 451,736 9,618,904 12,973,486 Notes receivable, net 9,728,434 10,355,883 - - Prepaid expenses and deferred charges 5,470,891 5,373,446 - - Capital assets, net 686,800,628 686,229,538 12,977,649 10,011,787
Total assets 1,025,730,521 1,000,925,231 181,634,963 170,671,022
LIABILITIESCurrent liabilities:
Accounts payable 5,120,781 14,067,339 3,277,736 2,275,040 Accrued liabilities 23,619,763 21,282,715 756,838 795,954 Accrued interest payable 280,095 9,019,055 - - Deferred revenue 25,866,764 30,413,428 4,342,663 6,746,204 Deposits 1,518,084 1,727,445 4,189,558 8,223,473 Current portion of long-term liabilities 19,570,517 35,541,675 5,052,547 6,549,301
Total current liabilities 75,976,004 112,051,657 17,619,342 24,589,972
Noncurrent liabilities:Refundable federal student loans 11,665,283 11,785,297 - - Actuarial liability for annuity/unitrust agreements - - 12,033,539 10,775,286 Long-term liabilities 441,492,390 413,490,235 2,819,066 2,871,613
Total liabilities 529,133,677 537,327,189 32,471,947 38,236,871
NET ASSETS (as restated)
Invested in capital assets, net of related debt 300,224,476 307,343,887 10,158,583 7,140,174 Restricted: Nonexpendable: Endowment 21,834,571 21,294,987 91,004,853 84,997,668 Expendable: Current operations 29,912,337 26,768,749 - - Loans 727,537 899,230 - - Endowment 24,604,003 19,178,480 50,611,189 47,742,771 Capital projects 8,476,386 5,656,518 - - Debt service 27,500 11,142 - - Unrestricted 110,790,034 82,445,049 (2,611,609) (7,446,462)
Total net assets 496,596,844$ 463,598,042$ 149,163,016$ 132,434,151$
The University of Akron Component Units
The University of AkronStatements of Net AssetsJune 30, 2011 and 2010
See accompanying notes to financial statements 9

REVENUES 2011 2010 2011 2010Operating revenues:
Student tuition and fees (net of scholarshipallowance of $66,752,079 and $55,539,207) 197,508,153$ 189,065,708$ -$ -$
Federal grants and contracts 19,924,153 16,999,634 132,657 201,146 State grants and contracts 6,959,436 7,224,224 - - Local grants and contracts 754,481 700,785 - - Private grants and contracts 7,476,191 8,547,014 4,318,433 3,862,449 Gifts and contributions - - 6,440,171 9,017,954 Sales and services 14,571,844 13,493,832 - - Auxiliary enterprises 56,207,250 50,955,352 - - Other sources 815,907 991,231 1,932,977 1,078,880
Total operating revenues 304,217,415 287,977,780 12,824,238 14,160,429
EXPENSESOperating expenses:
Educational and general:Instruction and departmental research 142,092,473 136,009,387 - - Separately budgeted research 23,639,951 24,195,795 3,609,860 2,533,237 Public service 16,551,088 17,778,174 - - Academic support 36,062,559 33,787,724 - - Student services 14,028,724 13,212,303 - - Institutional support 48,029,864 49,606,799 809,845 696,331 Operation and maintenance of plant 25,548,284 25,763,196 - - Scholarships and fellowships 37,289,644 34,951,202 - -
Auxiliary enterprises 63,457,908 59,366,776 - - Depreciation 37,183,087 32,538,642 277,581 210,003 Loss on disposal of property 1,291,916 205,188 - -
Total operating expenses 445,175,498 427,415,186 4,697,286 3,439,571
Operating (loss) income (140,958,083) (139,437,406) 8,126,952 10,720,858
NONOPERATING REVENUES (EXPENSES)State appropriations 95,958,798 95,835,787 - - Federal fiscal stabilization funds 15,664,344 15,244,152 - - Federal grants 43,034,521 34,424,171 - - Gifts 7,073,246 6,370,430 - - Investment income, net 12,046,510 8,417,533 20,820,644 11,518,843 Interest on debt (19,558,143) (14,881,737) (73,689) (266,714) Distributions to The University 16,175,583 14,005,817 (16,175,583) (14,005,817) Distributions on behalf of The University - - (642,279) (682,239) Other nonoperating (expenses) revenues (2,555,559) (1,091,670) 398,202 291,878
Net nonoperating revenues (expenses) 167,839,300 158,324,483 4,327,295 (3,144,049)
Income before other changes 26,881,217 18,887,077 12,454,247 7,576,809
OTHER CHANGESState capital appropriations 4,215,168 17,029,314 - - Capital gifts and grants 1,478,251 1,904,293 - - Additions to permanent endowments 424,166 988,774 4,274,618 2,905,073
Total other changes 6,117,585 19,922,381 4,274,618 2,905,073
Increase in net assets 32,998,802 38,809,458 16,728,865 10,481,882
NET ASSETSNet assets - beginning of year 463,598,042 424,788,584 132,434,151 121,952,269
Net assets - end of year 496,596,844$ 463,598,042$ 149,163,016$ 132,434,151$
The University of AkronStatements of Revenues, Expenses, and Changes in Net Assets
For the Years Ended June 30, 2011 and 2010
The University of Akron Component Units
See accompanying notes to financial statements 10

2011 2010
CASH FLOWS FROM OPERATING ACTIVITIESTuition and fees 196,463,938$ 189,762,687$ Grants and contracts 33,757,001 30,644,390 Auxiliary enterprises 57,124,111 50,626,772 Sales and service of educational activities 14,571,844 13,493,832 Payments to suppliers (110,130,567) (97,785,787) Payments for compensation and benefits (263,456,630) (261,288,732) Payments for scholarships and fellowships (25,258,773) (24,066,793) Loans issued to students (1,119,364) (2,205,324) Collection of loans to students 1,816,301 1,201,911 Other payments (7,858,615) (5,281,129)
Net cash used in operating activities (104,090,754) (104,898,173)
CASH FLOWS FROM NONCAPITAL FINANCING ACTIVITIESState appropriations 95,958,798 95,835,787 Federal fiscal stabilization funds 15,664,344 15,244,152 Gifts, grants and contracts for other than capital purposes 62,739,532 52,595,914 Private gifts for endowment purposes 437,057 1,032,762 Other payments (2,555,559) (1,091,670)
Net cash provided by noncapital financing activites 172,244,172 163,616,945
CASH FLOWS FROM CAPITAL AND RELATED FINANCING ACTIVITIESProceeds from capital debt 8,275,000 3,400,000 Capital appropriations 4,215,168 17,029,314 Capital grants and gifts received 7,074,106 4,964,880 Purchases of capital assets (35,074,986) (80,720,699) Principal paid on capital debt and leases (13,912,890) (9,522,483) Interest paid on capital debt and leases (12,246,244) (19,471,295) Collection of loans issued for capital purposes 180,009 174,713
Net cash used in capital financing activites (41,489,837) (84,145,570)
CASH FLOWS FROM INVESTING ACTIVITIESProceeds from sales and maturities of investments 325,816,370 509,646,018 Interest on investments 6,339,710 5,717,222 Purchase of investments (344,199,279) (478,568,653)
Net cash (used in) provided by investing activites (12,043,199) 36,794,587
Net increase in cash and cash equivalents 14,620,382 11,367,789
Cash and cash equivalents - beginning of the year 35,400,249 24,032,460
Cash and cash equivalents - end of the year 50,020,631$ 35,400,249$
(continued)
The University of AkronStatements of Cash Flows
June 30, 2011 and 2010
See accompanying notes to financial statements 11

2011 2010
The University of AkronStatements of Cash Flows
June 30, 2011 and 2010
RECONCILIATION OF OPERATING LOSS TONET CASH USED IN OPERATING ACTIVITIES:
Operating loss (140,958,083)$ (139,437,406)$ Adjustments to reconcile operating loss to net cash used inoperating activities:
Depreciation expense 37,183,087 32,538,642Loss on disposal of property 1,291,916 205,188Changes in assets and liabilities:
Accounts receivable, net 3,263,817 (520,075)Notes receivable, net 696,937 (1,003,413)Inventories (39,025) 55,043Prepaid expenses and deferred charges 101,184 (39,988)Accounts payable (7,375,830) 661,313Accrued liabilities 2,337,048 (606,608)Deferred revenue (4,546,664) (1,609,075)Deposits held for others (209,361) 503,952Sick leave liability 192,529 245,394OPEB liability 4,091,705 4,091,705Refundable federal student loans (120,014) 17,155
Net cash used in operating activities (104,090,754)$ (104,898,173)$
See accompanying notes to financial statements 12

The University of Akron Notes to Financial Statements
June 30, 2011 and 2010
13
1. Summary of Significant Accounting and Reporting Policies
Organization
The University of Akron (The University) is a coeducational, degree granting state university which was established by the General Assembly of the State of Ohio (the State) in 1967 by statutory act under Chapter 3359 of the Revised Code of the State of Ohio. The University offers degrees at the undergraduate, masters, and doctoral levels. The University is exempt from federal income taxes under Section 115 of the Internal Revenue Code, except for unrelated business income.
In addition to the main campus, The University operates one branch campus, Wayne College in Orrville, Ohio, and three educational centers, the Medina County University Center in Medina, Ohio, the Holmes County Higher Education Center in Millersburg, Ohio, and the Midpoint Campus Center in Brunswick, Ohio. The Midpoint Campus Center is a partnership with Lorain County Community College (LCCC).
The University, together with Kent State University and Youngstown State University, created a consortium to establish and govern Northeastern Educational Television of Ohio, Inc. (NETO), Channels 45 and 49, Kent, Ohio. The University, along with several partners, formed the Austen BioInnovation Institute in Akron (ABIA) to develop biomaterial and medical research, education, clinical services and commercialization. These organizations are legally separate from The University; accordingly, their financial activity is not included within the accompanying financial statements, and The University bears no financial liability for these organizations.
In accordance with Governmental Accounting Standards Board (GASB) Statement No. 14, The Reporting Entity, as amended by Statement No. 39, Determining Whether Certain Organizations Are Component Units, The University’s financial statements are included as a discretely presented component unit within the State of Ohio’s Consolidated Annual Financial Report. Transactions with the State relate primarily to appropriations, grants from various state agencies, and payments to the State retirement programs for certain University employees.
Furthermore, in accordance with GASB Statement No. 39, two discretely presented component units are reported in a separate column on The University’s financial statements to emphasize that they are legally separate from The University. The University of Akron Foundation (Foundation) and The University of Akron Research Foundation (Research Foundation) are not-for-profit organizations supporting The University. The Foundation acts primarily as a fund-raising organization to supplement the resources that are available to The University in support of its programs. The Research Foundation promotes, encourages, and provides assistance to the research activities of The University. Financial statements for the Foundation may be obtained by writing to The University of Akron Foundation, 302 Buchtel Common, Akron, Ohio 44325-6220. Financial statements for the Research Foundation may be obtained by writing to The University of Akron Research Foundation, Goodyear Polymer Center, 170 University Circle, Akron, Ohio 44325-2130. Activity of these component units is described in greater detail in Note 11.
Basis of Accounting
The financial statements of The University have been prepared on the accrual basis whereby all revenues are recorded when earned and all expenses are recorded when they have been reduced to a legal or contractual obligation to pay.
Pursuant to GASB Statement No. 20, Accounting and Financial Reporting for Proprietary Funds and Other Governmental Entities That Use Proprietary Fund Accounting, The University has elected not to apply the provisions of all relevant pronouncements of the Financial Accounting Standards Board (FASB), statements and interpretations issued after November 30, 1989, which do not conflict or contradict GASB pronouncements.

The University of Akron Notes to Financial Statements
June 30, 2011 and 2010
14
1. Summary of Significant Accounting and Reporting Policies – continued
Measurement Focus and Financial Statement Presentation
The financial statements of the University have been prepared in accordance with generally accepted accounting principles as prescribed by the Governmental Accounting Standards Board including Statement No. 34, Basic Financial Statements - and Management’s Discussion and Analysis - for State and Local Governments, and Statement No. 35, Basic Financial Statements - and Management’s Discussion and Analysis - for Public Colleges and Universities (an amendment of GASB No. 34). The presentation required by GASB No. 34 and GASB No. 35 provides a comprehensive, entity-wide perspective of the University’s assets, liabilities, net assets, revenues, expenses, and changes in net assets and cash flows. It replaces fund groups with net asset groups, and requires the direct method of cash flow presentation.
Operating revenues and expenses generally result from providing educational and instructional services in connection with The University’s principal ongoing operations. The principal operating revenues include student tuition. The University also recognizes as operating revenue grants classified as exchange transactions and auxiliary activities. Operating expenses include educational costs, administrative expenses and depreciation on capital assets. All revenues and expenses not meeting this definition, including State share of instruction, are reported as nonoperating revenues and expenses.
The Foundation and the Research Foundation are not-for-profit organizations that report under FASB reporting standards. As such, certain revenue recognition criteria and presentation features are different from GASB revenue recognition criteria and presentation features. With the exception of necessary presentation adjustments, no modifications have been made to the Foundation's or the Research Foundation’s financial information in The University's financial report for these differences.
Cash and Cash Equivalents
Cash and cash equivalents are defined as highly liquid investments with an initial maturity of three months or less when purchased.
Investments
Investments are stated at fair value based on quoted market prices in accordance with GASB Statement No. 31, Accounting and Financial Reporting for Certain Investments and for External Investment Pools. The University does not invest in derivatives. Unrealized gains and losses on investments are recorded as a nonoperating revenue or expense on the Statement of Revenues, Expenses, and Changes in Net Assets. Investments for bond issue proceeds and the income earned on those investments are separately managed and recorded on the Statements of Net Assets as restricted other investments in noncurrent assets.
Inventories
Inventories are stated at the lower of cost or market (net realizable value) using the first-in, first-out (FIFO) method.
Pledges Receivable
The University records pledges and unconditional promises to give as receivables and revenue in the year the pledge is made. Those that are expected to be collected within one year are recorded at net realizable value. Unconditional promises to give that are expected to be collected in future years are recorded at the present value of their estimated future cash flows. The discounts on those amounts are computed using risk-free interest rates applicable to the years in which the promises are made. Amortization of the discounts is included in contribution revenue. Conditional promises to give are not included as revenue until the conditions are substantially met.
Derivative Instruments
Derivative instruments consist primarily of interest rate swap agreements associated with The University’s outstanding long-term debt obligations. Derivative instruments are stated at fair value as established by major securities markets.
The University of Akron Notes to Financial Statements
June 30, 2011 and 2010
15
1. Summary of Significant Accounting and Reporting Policies – continued
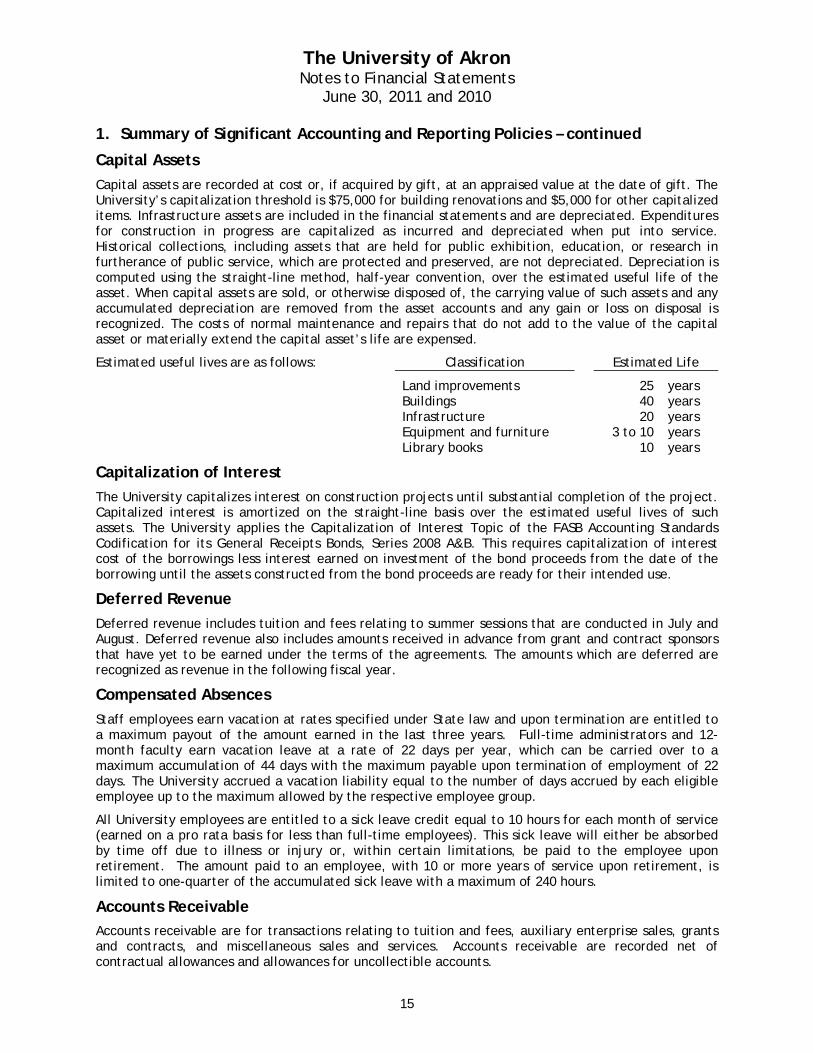
Capital Assets
Capital assets are recorded at cost or, if acquired by gift, at an appraised value at the date of gift. The University’s capitalization threshold is $75,000 for building renovations and $5,000 for other capitalized items. Infrastructure assets are included in the financial statements and are depreciated. Expenditures for construction in progress are capitalized as incurred and depreciated when put into service. Historical collections, including assets that are held for public exhibition, education, or research in furtherance of public service, which are protected and preserved, are not depreciated. Depreciation is computed using the straight-line method, half-year convention, over the estimated useful life of the asset. When capital assets are sold, or otherwise disposed of, the carrying value of such assets and any accumulated depreciation are removed from the asset accounts and any gain or loss on disposal is recognized. The costs of normal maintenance and repairs that do not add to the value of the capital asset or materially extend the capital asset’s life are expensed.
Estimated useful lives are as follows: Classification Estimated Life Land improvements 25 years Buildings 40 years Infrastructure 20 years Equipment and furniture 3 to 10 years Library books 10 years
Capitalization of Interest
The University capitalizes interest on construction projects until substantial completion of the project. Capitalized interest is amortized on the straight-line basis over the estimated useful lives of such assets. The University applies the Capitalization of Interest Topic of the FASB Accounting Standards Codification for its General Receipts Bonds, Series 2008 A&B. This requires capitalization of interest cost of the borrowings less interest earned on investment of the bond proceeds from the date of the borrowing until the assets constructed from the bond proceeds are ready for their intended use.
Deferred Revenue
Deferred revenue includes tuition and fees relating to summer sessions that are conducted in July and August. Deferred revenue also includes amounts received in advance from grant and contract sponsors that have yet to be earned under the terms of the agreements. The amounts which are deferred are recognized as revenue in the following fiscal year.
Compensated Absences
Staff employees earn vacation at rates specified under State law and upon termination are entitled to a maximum payout of the amount earned in the last three years. Full-time administrators and 12-month faculty earn vacation leave at a rate of 22 days per year, which can be carried over to a maximum accumulation of 44 days with the maximum payable upon termination of employment of 22 days. The University accrued a vacation liability equal to the number of days accrued by each eligible employee up to the maximum allowed by the respective employee group.
All University employees are entitled to a sick leave credit equal to 10 hours for each month of service (earned on a pro rata basis for less than full-time employees). This sick leave will either be absorbed by time off due to illness or injury or, within certain limitations, be paid to the employee upon retirement. The amount paid to an employee, with 10 or more years of service upon retirement, is limited to one-quarter of the accumulated sick leave with a maximum of 240 hours.
Accounts Receivable
Accounts receivable are for transactions relating to tuition and fees, auxiliary enterprise sales, grants and contracts, and miscellaneous sales and services. Accounts receivable are recorded net of contractual allowances and allowances for uncollectible accounts.
The University of Akron Notes to Financial Statements
June 30, 2011 and 2010
16
1. Summary of Significant Accounting and Reporting Policies - continued
Endowment and Quasi Endowments
The University’s Board of Trustees established an investment policy with the objectives of protecting principal and maximizing total investment return without assuming extraordinary risks. It is the goal of The University to provide spendable income levels that are reasonably stable and sufficient to meet budgetary requirements and to maintain a spending rate, currently established at 5%, which ensures a proper balance between the preservation of corpus and enhancement of the purchasing power of investment earnings.
Scholarship Allowances and Student Aid
Financial aid to students is reported under the alternative method as prescribed by the National Association of College and University Business Officers (NACUBO). Certain aid such as loans, funds provided to students as awarded by third parties, and Federal Direct Lending is accounted for as a third-party payment (credited to the student’s account as if the student made the payment). All other aid is reflected as operating expenses, or scholarship allowances, which reduce revenues. The amount reported as operating expense represents the portion of aid that was provided to the student in the form of cash. Scholarship allowances represent the portion of aid provided to the student in the form of reduced tuition. Under the alternative method followed by The University, scholarship allowances are computed by allocating the cash payments to students, excluding payments for services, on the ratio of using aid not considered to be third-party aid to total aid.
Federal Grants and Contracts Revenue
Federal grants and contracts operating revenue consists of sponsored program revenue from federal sources along with student-related grants such as College Work Study and Supplemental Educational Opportunity Grant programs. For the years ended June 30, 2011 and 2010, student-related grants amounted to approximately $2.4 million and $4.2 million, respectively, with the balance of $17.5 million and $12.8 million, respectively, related to sponsored programs.
Service Organization
The University processes certain Lorain County Community College (LCCC) data on equipment and applications which are owned by The University or licensed to The University. Additionally, certain LCCC data is also stored on University equipment. The data processing functions are performed and managed by University employees. As such, The University is a service organization as prescribed by Statement on Auditing Standards No. 70 while LCCC is a user organization.
Net Assets
Net assets are classified according to external donor restrictions or availability of assets for satisfaction of University obligations. Nonexpendable restricted net assets are gifts that have been received for endowment purposes. The resources are invested with only the investment income available for purposes established by the donor or, in the case of funds functioning as endowment, by The University. These purposes include loans, scholarships, and departmental support. Expendable restricted net assets represent funds that have been awarded or gifted for specific purposes, funds used for capital projects and debt service, and funds held in federal loan programs.
Accounting Standards
In November 2010, GASB issued Statement No. 60, Accounting and Financial Reporting for Service Concession Arrangements. This Statement addresses issues related to service concession arrangements which are a type of public-private or public-public partnership.
In November 2010, GASB issued Statement No. 62, Codification of Accounting and Financial Reporting Guidance Contained in Pre-November 30, 1989 FASB and AICPA Pronouncements. This Statement incorporates into the GASB’s authoritative literature certain accounting and financial reporting guidance that is included in the following pronouncements issued on or before November 30, 1989, which does not conflict with or contradict GASB pronouncements.

The University of Akron Notes to Financial Statements
June 30, 2011 and 2010
17
1. Summary of Significant Accounting and Reporting Policies - continued
Accounting Standards - continued
In June 2011, GASB issued Statement No. 63, Financial Reporting of Deferred Outflows of Resources, Deferred Inflows of Resources, and Net Position. This Statement provides financial reporting guidance for deferred outflows of resources and deferred inflows of resources and amends the net asset reporting requirements by incorporating deferred outflows of resources and deferred inflows of resources into the definitions of the required components of the residual measure and by renaming that measure as net position, rather than net assets. The requirements of Statements 60, 62 and 63 are effective for financial statements for periods beginning after December 15, 2011.
In November 2010, GASB issued Statement No. 61, The Financial Reporting Entity: Omnibus—an amendment of GASB Statements No. 14 and No. 34. This Statement modifies certain requirements for inclusion of component units in the financial reporting entity. The requirements of this Statement are effective for financial statements for periods beginning after June 15, 2012.
University management has not yet determined the impact that implementation of these GASB Statements will have on The University’s financial statements.
2. Prior Period Restatement
Certain components of net assets have been restated for June 30, 2010 to correct an error in the classification of those net assets. Details of the restatement are as follows:
6/30/2010 6/30/2010
as reported Reclassification as restated
Invested in capital assets, net of related debt 307,343,887$ -$ 307,343,887$
Restricted:
Nonexpendable: Endowment 29,742,767 (8,447,780) 21,294,987
Expendable: Current operations 26,768,749 - 26,768,749
Loans 899,230 - 899,230
Endowment - 19,178,480 19,178,480
Capital projects 16,558,349 (10,901,831) 5,656,518
Debt service 769,718 (758,576) 11,142
Unrestricted 81,515,342 929,707 82,445,049
Total net assets 463,598,042$ -$ 463,598,042$
3. Cash and Investments
Cash
At June 30, 2011 and 2010, the carrying amounts of The University’s bank deposits and interest-bearing cash equivalents were $50,020,631 and $35,400,249 as compared to bank balances of $52,393,626 and $36,513,779, respectively. The differences between carrying amounts and bank balances were caused by items in-transit. Of the June 30, 2011 and 2010 bank balances, $50,809,060 and $35,541,456, respectively, was uninsured but collateralized with securities held by the depository bank’s and The University’s name.
Investments
In accordance with the Policies of the Board of Trustees of The University, the types of investments which may be purchased include United States government securities, federal agency securities, common and preferred stocks, obligations of commercial banks including certificates of deposit, repurchase agreements, notes, debentures, banker’s acceptances and commercial paper, obligations of corporations, municipal notes and bonds, and investment programs offered by The Commonfund. University policy requires that depository banks pledge collateral for funds on deposit, including certificates of deposit, with a market value at all times at least equal to the uninsured amount of the deposit or instrument. The fair value of investments represents published market quotations.

The University of Akron Notes to Financial Statements
June 30, 2011 and 2010
18
3. Cash and Investments - continued
GASB Statement No. 3, Deposits with Financial Institutions, Investments (including Repurchase Agreements), and Reverse Repurchase Agreements, as amended by GASB Statement No. 40, Deposit and Investment Risk Disclosures, requires certain disclosures related to interest rate, market, and credit risk. Due to the level of risk associated with certain investment securities, it is at least reasonably possible that changes in the values of investment securities will occur in the near term and that such changes could materially affect the amounts reported in the statement of net assets.
Interest rate risk exists when there is a possibility that changes in interest rates could adversely affect an investment’s fair value. Credit risk exists when there is a possibility that the issuer or other counterparty to an investment may be unable to fulfill its obligations. Concentration of credit risk is the risk of loss attributed to the magnitude of investment in a single issuer. At June 30, 2011, The University did not have more than 5% of its fixed-income investments in any single issuer. Foreign currency risk is the risk that changes in exchange rates will adversely affect the fair value of an investment. At June 30, 2011, The University did not have investments that are subject to foreign currency risk.
To limit exposure to these risks, The University’s investment policies set guidelines for maturities based on investment type (short-term or intermediate), limits percentage exposure to a single issuer or market, and requires that a majority of the holdings consist of domestic (U.S.) securities of investment grade (at least rated BBB or BAA) as rated by a nationally recognized statistical rating organization.
2011 2010
Fair Value Fair Value
Pooled investments:Repurchase agreement -$ 948,706$
U.S. agencies 45,996,102 67,959,162
U.S. Treasury 28,102,368 17,419,974
Corporate notes 52,766,613 15,729,752
PFM: Prime Series 14,746,043 51,374,241
Total pooled investments 141,611,126 153,431,835
Endowment investments: Marketable securities:U.S. Treasury 1,443,793 3,959,115
U.S. agencies 2,123,264 4,395,541
Common stocks 35,233,655 27,636,155
Managed Fixed Income 1,484,603 -
U.S. and corporate bonds 10,131,478 11,833,762
PFM: Government Series 2,092,708 307,976
PIMCO AAAA 4,622,449 -
The Commonfund: Private Equity 31,858 34,170
Cash surrender value of life insurance 1,030 3,332
Total endowment investments 57,164,838 48,170,051
Investments held in trust by others:U.S. agencies 8,374 6,937,208
Other restricted investments:U.S. Treasury 15,827,815 -
Commercial paper sweep 4,120,122 -
Commercial paper 20,925,651 -
Total other investments 40,873,588 -
Total investments 239,657,926$ 208,539,094$

The University of Akron Notes to Financial Statements
June 30, 2011 and 2010
19
3. Cash and Investments - continued
The U.S. Treasury and agencies securities and corporate bonds were invested through banks that keep the securities in their names in safekeeping accounts at the Federal Reserve Bank. The Commonfund is a nonprofit membership corporation which provides investment management services for its member colleges, universities and independent schools and offers a series of pooled investment funds.
The credit ratings and maturities of The University’s interest-bearing investments at June 30, 2011 are as follows:
Rating
Investment (S&P) Less than 1 1 to 5 6 to 10 More than 10 Totals
PFM Funds: Prime Series AAA 16,794,860$ -$ -$ -$ 16,794,860$
U.S. agencies AAA 2,008,860 37,573,212 5,487,119 1,176,150 46,245,341
Commercial paper sweep AAA 4,120,122 - - - 4,120,122
U.S. and corporate notes AAA 8,142,575 3,551,562 - - 11,694,137 AA - 20,330,601 - - 20,330,601 A - 17,140,036 - - 17,140,036
Total U.S. and corporate notes 8,142,575 41,022,199 - - 49,164,774
U.S. and corporate bonds AAA 4,222,265 - - - 4,222,265 AA 716,225 - - - 716,225 A 1,734,737 - - - 1,734,737
BBB 1,317,721 - - - 1,317,721 BB 611,736 - - - 611,736 B 613,517 - - - 613,517
Below B 417,102 - - - 417,102
Total U.S. and corporate bonds 9,633,303 - - - 9,633,303
Totals 40,699,720$ 78,595,411$ 5,487,119$ 1,176,150$ 125,958,400$
Investment maturity (in years)
The credit ratings and maturities of The University’s interest-bearing investments at June 30, 2010 are as follows:
Rating
Investment (S&P) Less than 1 1 to 5 6 to 10 Totals
Repurchase agreement AAA 948,706$ -$ -$ 948,706$
PFM Funds: Prime Series AAA 52,327,838 - - 52,327,838
U.S. corporate notes AAA 1,031,090 - - 1,031,090 AA 10,672,131 - - 10,672,131 A 4,026,531 - - 4,026,531
Total U.S. corporate notes 15,729,752 - - 15,729,752
U.S. agencies AAA 6,498,926 61,979,181 856,410 69,334,517
U.S. and corporate bonds AAA 7,973,886 - - 7,973,886 AA 1,016,845 - - 1,016,845 A 1,322,688 - - 1,322,688
BBB 763,871 - - 763,871 BB 690,481 - - 690,481 B 65,991 - - 65,991
Total U.S. and corporate bonds 11,833,762 - - 11,833,762
Totals 87,338,984$ 61,979,181$ 856,410$ 150,174,575$
Investment maturity (in years)

The University of Akron Notes to Financial Statements
June 30, 2011 and 2010
20
4. Accounts and Notes Receivable
Accounts and notes receivable at June 30, 2011 and 2010 consisted of the following:
2011 2010
Accounts receivable, net:
Federal, state, local governments, foundations, and companies 9,306,816$ 10,703,085$
Student receivables, net of allowance for doubtful
accounts of $21,005,717 and $18,518,715, respectively 16,052,767 17,660,601
Other, net of allowance for doubtful accounts of
$39,381 and $608,149, respectively 1,255,520 967,557
Total accounts receivable, net 26,615,103 29,331,243
Notes receivable, net:
Student notes receivables, net of allowance for doubtful
notes of $764,298 and $1,001,071, respectively 11,370,615 12,067,552
Other notes receivable 304,108 484,117
Total notes receivable, net 11,674,723 12,551,669
Accounts and notes receivable, net 38,289,826$ 41,882,912$
5. Pledges Receivable
Unconditional promises to give to The University recorded as pledges receivable at June 30, 2011 and 2010 were as follows:
2011 2010
Pledges Current Pledges Current
Receivable Portion Receivable Portion
Total pledges receivable 564,668$ 303,194$ 942,578$ 459,536$
Less: amount estimated to be uncollectible (28,581) (15,588) (15,342) (7,672)
Less: unamortized discount (7,699) - (23,636) -
Pledges receivable, net 528,388 287,606$ 903,600 451,864$
Less: current portion (287,606) (451,864)
Pledges receivable, noncurrent portion 240,782$ 451,736$
As of June 30, 2011 and 2010, The University has approximately $3,208,000 and $3,333,000, respectively, in numerous outstanding pledges, which are considered to be intentions to give and are contingent upon future events. These pledges are not recorded as pledges receivable because they do not represent unconditional promises to give.

The University of Akron Notes to Financial Statements
June 30, 2011 and 2010
21
6. Capital Assets
Changes in capital assets during fiscal 2011 and 2010 were as follows:
Balance Additions/ Reductions/ Balance
July 1, 2010 Transfers Transfers June 30, 2011
Nondepreciable capital assets:
Land $ 37,375,544 $ 1,732,078 $ - $ 39,107,622
Historical collections 4,679,963 - 382,950 4,297,013
Construction in progress 69,558,536 25,575,194 70,421,288 24,712,442
Total nondepreciable capital assets 111,614,043 27,307,272 70,804,238 68,117,077
Depreciable capital assets:
Land improvements 46,558,009 230,600 251,411 46,537,198
Buildings 750,361,161 70,937,601 4,424,534 816,874,228
Infrastructure 19,394,089 1,300,933 - 20,695,022
Equipment, furniture and books 126,742,494 9,690,975 13,560,175 122,873,294
Total depreciable capital assets 943,055,753 82,160,109 18,236,120 1,006,979,742
Total capital assets 1,054,669,796 109,467,381 89,040,358 1,075,096,819
Less accumulated depreciation:
Land improvements 23,639,990 1,852,756 251,411 25,241,335
Buildings 259,617,938 21,324,351 4,330,886 276,611,403
Infrastructure 6,478,371 1,002,228 - 7,480,599
Equipment, furniture and books 78,703,959 13,003,752 12,744,857 78,962,854
Total accumulated depreciation 368,440,258 37,183,087 17,327,154 388,296,191
Capital assets, net $ 686,229,538 $ 72,284,294 $ 71,713,204 $ 686,800,628
Balance Additions/ Reductions/ Balance
July 1, 2009 Transfers Transfers June 30, 2010
Nondepreciable capital assets:
Land $ 35,765,281 $ 1,610,263 $ - $ 37,375,544
Historical collections 4,399,452 280,511 - 4,679,963
Construction in progress 97,861,383 82,696,453 110,999,300 69,558,536
Total nondepreciable capital assets 138,026,116 84,587,227 110,999,300 111,614,043
Depreciable capital assets:
Land improvements 45,364,463 2,018,543 824,997 46,558,009
Buildings 646,217,004 104,144,157 - 750,361,161
Infrastructure 15,356,285 4,627,933 590,129 19,394,089
Equipment, furniture and books 119,386,220 13,064,602 5,708,328 126,742,494
Total depreciable capital assets 826,323,972 123,855,235 7,123,454 943,055,753
Total capital assets 964,350,088 208,442,462 118,122,754 1,054,669,796
Less accumulated depreciation:
Land improvements 22,648,065 1,816,922 824,997 23,639,990
Buildings 239,904,803 19,713,135 - 259,617,938
Infrastructure 6,214,494 854,006 590,129 6,478,371
Equipment, furniture and books 74,052,520 10,154,579 5,503,140 78,703,959
Total accumulated depreciation 342,819,882 32,538,642 6,918,266 368,440,258
Capital assets, net $ 621,530,206 $ 175,903,820 $ 111,204,488 $ 686,229,538

The University of Akron Notes to Financial Statements
June 30, 2011 and 2010
22
7. Long-term Liabilities
Changes in long-term liabilities during fiscal 2011 were as follows:
Balance Balance Current
July 1, 2010 Additions Reductions June 30, 2011 Portion
Note payable:
The University of Akron $ 5,000,000 $ - $ - $ 5,000,000 $ 5,000,000
Total note payable 5,000,000 - - 5,000,000 5,000,000
Bonds payable:
General receipts bonds -
37,325,000 - 775,000 36,550,000 840,000
General receipts bonds -
31,070,000 - 715,000 30,355,000 740,000
General receipts refunding bonds -
17,655,000 - 1,765,000 15,890,000 1,840,000
Deferred amount on refunding -
Series 2005 refunding bonds (618,045) - (53,743) (564,302) (53,743)
General receipts bonds -
205,085,000 - 3,795,000 201,290,000 3,920,000
Deferred amount on refunding -Series 2008A&B bonds (3,588,652) - (129,711) (3,458,941) (129,710)
General receipts refunding bonds -
128,345,000 - 128,345,000 - -
Deferred amount on refunding -Series 2008C1&C2 refunding bonds (12,038,180) - (12,038,180) - -
Derivative instrument -
Interest rate swap,Series 2008C1&C2 refunding bonds 15,357,675 4,187,119 19,544,794 - -
General receipts refunding bonds -
Series 2010A, 2.00% to 5.00%, - 131,410,000 - 131,410,000 4,745,000
Deferred amount on refunding -
Series 2010A refunding bonds - (18,221,097) (971,792) (17,249,305) (971,792)
Total bonds payable 418,592,798 117,376,022 141,746,368 394,222,452 10,929,755
Summit County Port Authority Lease - 33,770,000 - 33,770,000 -
Capitalized lease obligations 6,314,519 - 1,652,891 4,661,628 1,383,956
Sick leave liability 6,718,092 192,529 - 6,910,621 2,256,806
OPEB liability 12,406,501 4,091,705 - 16,498,206 -
Totals $ 449,031,910 $ 155,430,256 $ 143,399,259 $ 461,062,907 $ 19,570,517
Less: current portion (19,570,517)
Long-term liabilities $ 441,492,390
Series 2008A&B, 3.0% to 5.0%,
due serially through 2038
Series 2008C1&C2, 3.45%,
Foundation, 0.64%
due serially through 2022
due serially through 2035
due serially through 2029
Series 2003A, 1.5% to 5.0%,
Series 2004B, 2.00% to 5.00%,
Series 2005, 3.50% to 5.00%,
due serially through 2029
due serially through 2033

The University of Akron Notes to Financial Statements
June 30, 2011 and 2010
23
7. Long-term Liabilities - continued
Changes in long-term liabilities during fiscal 2010 were as follows:
Balance Balance Current
July 1, 2009 Additions Reductions June 30, 2010 Portion
Note payable:
The University of Akron $ 1,800,000 $ 3,200,000 $ - $ 5,000,000 $ 5,000,000
Total note payable 1,800,000 3,200,000 - 5,000,000 5,000,000
Bonds payable:
General receipts bonds -
3,620,000 - 3,620,000 - -
General receipts bonds -
38,030,000 - 705,000 37,325,000 775,000
General receipts bonds -
31,765,000 - 695,000 31,070,000 715,000
General receipts refunding bonds -
19,365,000 - 1,710,000 17,655,000 1,765,000
Deferred amount on refunding -
Series 2005 refunding bonds (671,788) - (53,743) (618,045) (53,743)
General receipts bonds -
205,085,000 - - 205,085,000 3,795,000
Deferred amount on refunding -Series 2008A&B bonds (3,718,362) - (129,710) (3,588,652) (129,710)
General receipts refunding bonds -
129,680,000 - 1,335,000 128,345,000 5,210,000
Deferred amount on refunding -Series 2008C1&C2 refunding bonds (12,680,250) - (642,070) (12,038,180) (642,070)
Derivative instrument -
Interest rate swap,Series 2008C1&C2 refunding bonds 10,760,827 4,596,848 - 15,357,675 15,357,675
Total bonds payable 421,235,427 4,596,848 7,239,477 418,592,798 26,792,152
Capitalized lease obligations 7,720,477 3,637,284 5,043,242 6,314,519 1,671,079
Sick leave liability 6,472,698 245,394 - 6,718,092 2,078,444
OPEB liability 8,314,796 4,091,705 - 12,406,501 -
Totals $ 445,543,398 $ 15,771,231 $ 12,282,719 $ 449,031,910 $ 35,541,675
Less: current portion (35,541,675)
Long-term liabilities $ 413,490,235
Series 2003A, 1.5% to 5.0%,
Series 2004B, 2.00% to 5.00%,
Series 2005, 3.50% to 5.00%,
Series 2008A&B, 3.0% to 5.0%,
due serially through 2038
Series 2008C1&C2, 3.45%,
due serially through 2029
due serially through 2010
Foundation, 0.75%
due serially through 2022
due serially through 2035
due serially through 2033
Series 1999, 4.8% to 5.125%,
The general receipts bonds and the general receipts refunding bonds are payable from and secured by a first pledge and lien on the general receipts of The University, excluding state appropriations.
The University of Akron Notes to Financial Statements
June 30, 2011 and 2010
24
7. Long-term Liabilities - continued
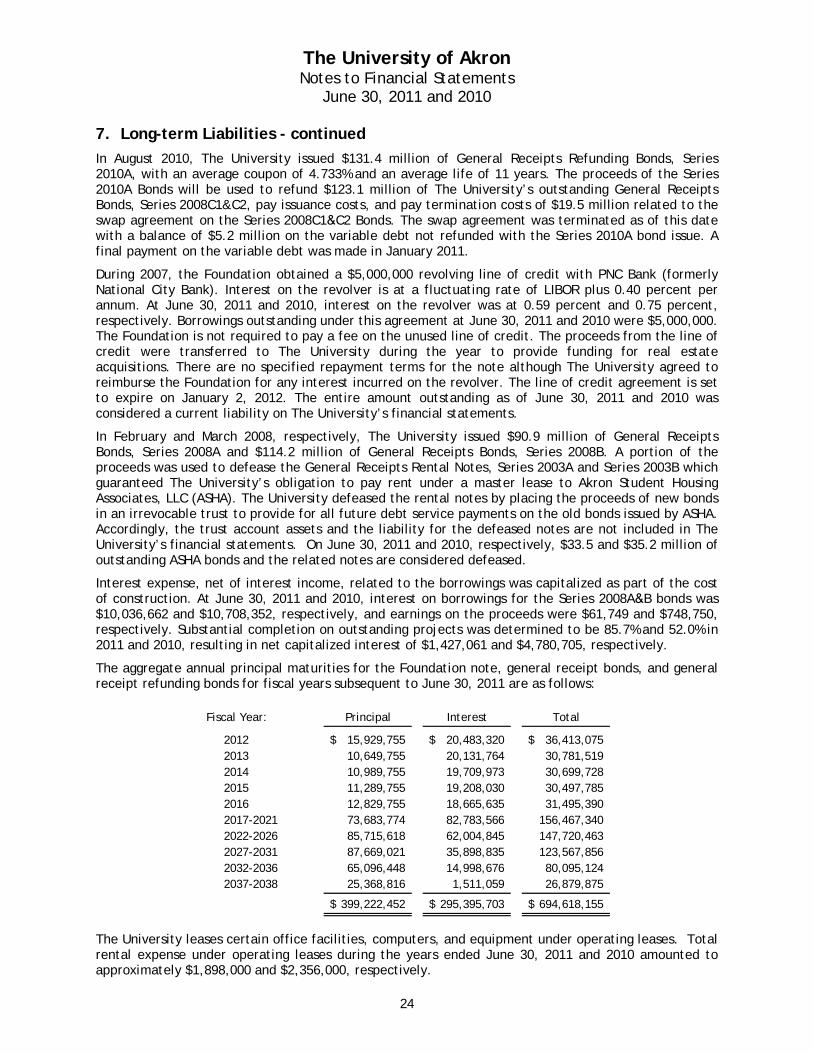
In August 2010, The University issued $131.4 million of General Receipts Refunding Bonds, Series 2010A, with an average coupon of 4.733% and an average life of 11 years. The proceeds of the Series 2010A Bonds will be used to refund $123.1 million of The University’s outstanding General Receipts Bonds, Series 2008C1&C2, pay issuance costs, and pay termination costs of $19.5 million related to the swap agreement on the Series 2008C1&C2 Bonds. The swap agreement was terminated as of this date with a balance of $5.2 million on the variable debt not refunded with the Series 2010A bond issue. A final payment on the variable debt was made in January 2011.
During 2007, the Foundation obtained a $5,000,000 revolving line of credit with PNC Bank (formerly National City Bank). Interest on the revolver is at a fluctuating rate of LIBOR plus 0.40 percent per annum. At June 30, 2011 and 2010, interest on the revolver was at 0.59 percent and 0.75 percent, respectively. Borrowings outstanding under this agreement at June 30, 2011 and 2010 were $5,000,000. The Foundation is not required to pay a fee on the unused line of credit. The proceeds from the line of credit were transferred to The University during the year to provide funding for real estate acquisitions. There are no specified repayment terms for the note although The University agreed to reimburse the Foundation for any interest incurred on the revolver. The line of credit agreement is set to expire on January 2, 2012. The entire amount outstanding as of June 30, 2011 and 2010 was considered a current liability on The University’s financial statements.
In February and March 2008, respectively, The University issued $90.9 million of General Receipts Bonds, Series 2008A and $114.2 million of General Receipts Bonds, Series 2008B. A portion of the proceeds was used to defease the General Receipts Rental Notes, Series 2003A and Series 2003B which guaranteed The University’s obligation to pay rent under a master lease to Akron Student Housing Associates, LLC (ASHA). The University defeased the rental notes by placing the proceeds of new bonds in an irrevocable trust to provide for all future debt service payments on the old bonds issued by ASHA. Accordingly, the trust account assets and the liability for the defeased notes are not included in The University’s financial statements. On June 30, 2011 and 2010, respectively, $33.5 and $35.2 million of outstanding ASHA bonds and the related notes are considered defeased.
Interest expense, net of interest income, related to the borrowings was capitalized as part of the cost of construction. At June 30, 2011 and 2010, interest on borrowings for the Series 2008A&B bonds was $10,036,662 and $10,708,352, respectively, and earnings on the proceeds were $61,749 and $748,750, respectively. Substantial completion on outstanding projects was determined to be 85.7% and 52.0% in 2011 and 2010, resulting in net capitalized interest of $1,427,061 and $4,780,705, respectively.
The aggregate annual principal maturities for the Foundation note, general receipt bonds, and general receipt refunding bonds for fiscal years subsequent to June 30, 2011 are as follows:
Fiscal Year: Principal Interest Total
2012 15,929,755$ 20,483,320$ 36,413,075$ 2013 10,649,755 20,131,764 30,781,519 2014 10,989,755 19,709,973 30,699,728 2015 11,289,755 19,208,030 30,497,785 2016 12,829,755 18,665,635 31,495,390 2017-2021 73,683,774 82,783,566 156,467,340 2022-2026 85,715,618 62,004,845 147,720,463 2027-2031 87,669,021 35,898,835 123,567,856 2032-2036 65,096,448 14,998,676 80,095,124 2037-2038 25,368,816 1,511,059 26,879,875
399,222,452$ 295,395,703$ 694,618,155$
The University leases certain office facilities, computers, and equipment under operating leases. Total rental expense under operating leases during the years ended June 30, 2011 and 2010 amounted to approximately $1,898,000 and $2,356,000, respectively.

The University of Akron Notes to Financial Statements
June 30, 2011 and 2010
25
7. Long-term Liabilities - continued
The University’s bookstore facilities and operations and certain food operations are leased to outside operators. These leases provide for annual rental receipts of approximately $584,000 and contingent rentals based upon gross sales. Contingent rentals earned in fiscal 2011 and 2010 totaled approximately $402,000 and $393,000, respectively. During fiscal 2011 and 2010, The University also received rental receipts approximating $816,000 and $1,006,000, respectively, from renting various other campus facilities under the terms of operating lease agreements.
In May 2011, The University entered into a Facilities Lease Agreement with The Summit County Port Authority (Port Authority) to finance and construct the Wheeler/Grant student housing facility. This agreement provided for the Port Authority to issue $33.8 million Summit County Port Authority, Lease Revenue Bonds, Series 2011 in May 2011 to finance the project and for the housing facility to be leased to The University upon completion of construction. The University is required to pay semi-annual rental payments to the Port Authority for the life of the revenue bonds. The agreement allows for The University to purchase the housing facility with a bargain purchase option at the end of the agreement.
The University’s other capital leased assets consist of a chilled water tank, property, and duplicating or other equipment. Future minimum lease payments as of June 30, 2011 under all capital leases with an initial or remaining noncancelable lease term in excess of one year, along with the present value of net minimum capital lease payments, are as follows by major class:
Port
Authority Building Land Equipment Total
2012 1,800,612$ 574,194$ 85,042$ 947,161$ 3,407,009$
2013 2,344,513 574,194 85,042 771,900 3,775,649
2014 2,349,712 574,194 35,434 9,108 2,968,448
2015 2,347,088 574,194 - - 2,921,282
2016 2,348,937 574,194 - - 2,923,131 2017-2021 11,717,456 382,797 - - 12,100,253 2022-2026 11,676,963 - - - 11,676,963 2027-2031 11,635,900 - - - 11,635,900 2032-2036 11,567,150 - - - 11,567,150 2037-2041 11,495,400 - - - 11,495,400
2042 2,286,600 - - - 2,286,600
71,570,331 3,253,767 205,518 1,728,169 76,757,785
(37,800,331) (298,045) (19,208) (208,573) (38,326,157)
33,770,000$ 2,955,722$ 186,310$ 1,519,596$ 38,431,628$
Less amount representing interest
Present value of net minimumcapital lease payments
Fiscal Year:
Total minimum lease payments
Interest Rate Swaps (or Derivative Instruments)
The University held one interest rate swap instrument as of June 30, 2010. This swap agreement was terminated as of September 9, 2010 and a termination cost of $19.5 million was paid with the Series 2010A bond issue proceeds. The University had entered into the agreement at the same time and amount as the issuance of the Series 2008C1&C2 Bonds variable rate debt; with the intent of creating a synthetic fixed rate debt, at an interest rate that is lower than if fixed rate debt were to have been issued directly. As of June 30, 2010, The University determined that the swap agreement was an effective hedge. The fair value was calculated by the counterparty to the transaction and approximated the termination value of the interest rate swap. As of June 30, 2010 the swap agreement was summarized as follows (in millions):
Business-type activities: Classification Amount Classification Amount Notional
Cash flow hedges:
Pay-fixed interest rate swaps (receive-variable):
June 30, 2010 Deferred charge 4.6$ Debt 15.4$ 125.7$
Changes in Fair Value Fair Value

The University of Akron Notes to Financial Statements
June 30, 2011 and 2010
26
7. Long-term Liabilities - continued
Interest Rate Swaps (or Derivative Instruments) - continued
Effective
date Type Objective
Notional
amount Pay terms
Receive
terms
Maturity
date
Counter-
party credit
rating
4/1/2008 Pay-fixed,
Receive-
variable
Cash flow hedge
for Series 2008
C1&C2
$131.0 3.465% fixed Floating rate
of USD-LIBOR
1/1/2029 AAA/Aaa
The interest rate swaps are subject to the following risks:
Credit and termination risk The University was not exposed to credit risk on the interest rate swap as of June 30, 2010, since the University owed J. P. Moran Chase if the swap agreement was terminated. The occurrence of a credit event with respect to The University, defined as a reduction in the long-term bond rating to less than Aaa by Moody’s Investors Service, Inc. or AAA by Fitch Ratings, Inc., could have resulted in termination of the swap agreement. The aggregate fair value of the hedging derivative instrument represented the maximum loss that would be recognized at the reporting date if all counterparties failed to perform as contracted. As of June 30, 2010 the bonds had not been downgraded, so no termination event occurred.
Interest rate risk The University was exposed to interest rate risk on its interest rate swap. On its pay-fixed, receive-variable interest rate swap, as LIBOR swap decreased, The University’s net payment on the swap increased.
Basis risk The pay-fixed, receive-variable interest rate swap agreement converted the Series 2008 C1&C2 Bonds’ variable interest rate to a fixed rate of 3.465%, settled on the first day of January and July. The variable interest was paid monthly on the first day of each month. The University was exposed to variances in the interest paid on the variable portion of the bonds which was based on market rates and the reimbursement of the variable interest which was based on a percentage of the one-month LIBOR. This variance could have been favorable or unfavorable to The University. At June 30, 2010, The University paid an interest rate of 0.38% on its variable-rate debt, while the reimbursement was 90 percent of LIBOR which was 0.312%.
Rollover risk The University was exposed to rollover risk on hedging derivative instruments that were hedges of debt that mature or may be terminated prior to the maturity of the hedged debt. When these hedging derivative instruments terminated, or in the case of a termination option, if the counterparty exercised its option, The University would have been re-exposed to the risks being hedged by the hedging derivative instrument.
8. State Support
The University is a State-assisted institution of higher education, which receives a student-based State share of instruction (appropriation) from the State. This State share of instruction is determined annually based upon a formula devised by the State. In addition to the State share of instruction, the State also provides certain capital funding and assistance for major academic facilities. The capital funding is provided through the Ohio Board of Regents (OBR) from revenue bond proceeds issued by the Ohio Public Facilities Commission (OPFC). The capital assets are transferred from the OBR to The University upon completion. Costs incurred during construction are included in construction in progress.
In accordance with the requirements of Ohio Revised Code Section 124.21(D) and (E), university facilities are not pledged as collateral for the revenue bonds. Instead, the bonds are supported by a pledge of monies in the Higher Education Bond Service Fund established in the custody of The Treasurer of State. If sufficient monies are not available from this fund, a pledge exists to assess a special student fee uniformly applicable to students in state-assisted institutions of higher education throughout the State.

The University of Akron Notes to Financial Statements
June 30, 2011 and 2010
27
8. State Support - continued
As a result of the above described financial assistance provided by the State to The University, outstanding debt issued by OPFC is not included within The University’s financial statements. In addition, appropriations by the State’s General Assembly to the Board of Regents for payment of debt service are not reflected as appropriation revenue received by The University, and the related debt service payments are not recorded in The University’s accounts.
The Ohio Board of Regents adopts a two-year operating budget that includes line items to fund infrastructure investments for higher education. The Capital Component program is an appropriation line item in the Ohio Board of Regents operating budget. The program was designed to add flexibility to the capital funding process and to provide incentives for the efficient use of state capital funding provided to higher education institutions. The Capital Component constitutes a reform of capital funding for higher education as part of the capital funding policy adopted in 1997. This new capital funding policy provided state-assisted institutions of higher education with the annual debt service equivalent of capital appropriations that the institution otherwise could have received via the new formula-based higher education capital budget. The formula is driven by considering existing space shortages on campus, student enrollments, and other campus activities (i.e., non-credit activities, community service functions and research). Thus, if the formula allocation exceeds the amount requested, 10% of the difference is paid to the institution for 15 years in the form of Excess Capital Component Allocation (Capital Component). The University intends to use this Capital Component toward funding the debt service obligation of the Series 2003A and 2004B Bond Issues.
9. Employee Benefit Plans
Retirement Plans
Employee retirement benefits are available for substantially all employees under contributory retirement plans administered by the State Teachers Retirement System (STRS), the School Employees Retirement System (SERS), and the law enforcement division of the Ohio Public Employees Retirement System (OPERS-LE). These retirement programs are statewide, cost-sharing, multiple-employer defined benefit plans. STRS, SERS, and OPERS-LE provide retirement and disability benefits, annual cost of living adjustments, and death benefits for plan members and beneficiaries. Authority to establish and amend benefits is provided by State statute per Chapter 3307 of the Ohio Revised Code (ORC).
Each retirement system issues stand-alone Comprehensive Annual Financial Reports that may be obtained by contacting:
State Teachers Retirement System 275 E. Broad Street Columbus, Ohio 43215-3371 (888) 227-7877 www.strsoh.org
School Employees Retirement System 300 East Broad Street, Suite 100 Columbus, Ohio 43215-3746 (800) 878-5853 www.ohsers.org
Ohio Public Employees Retirement System 277 East Town Street Columbus, Ohio 43215-4642 (800) 222-7377 www.opers.org
The ORC provides statutory authority for employee and employer contributions. The contribution rates on covered payroll and The University’s contributions to each system are:
Employee Employer The University's contributionsContribution Contribution For the years ended 6/30
Rate Rate 2011 2010 2009
STRS 10.0% 14.00% 11,954,443$ 11,611,599$ 11,422,714$ SERS 10.0% 14.00% 8,616,498 8,713,603 8,574,481 OPERS-LE 11.1% 17.87% 497,903 448,834 431,651
21,068,844$ 20,774,036$ 20,428,846$
The University’s contributions are equal to the required contributions for each year.

The University of Akron Notes to Financial Statements
June 30, 2011 and 2010
28
9. Employee Benefit Plans - continued
Other Postretirement Employee Benefits
STRS provides comprehensive health care benefits to retirees and their dependents. Coverage includes hospitalization, physician fees, prescription drugs, and reimbursement of monthly Medicare Part B premiums. All benefit recipients and sponsored dependents are eligible for health care coverage. Pursuant to ORC, STRS Board has discretionary authority over how much, if any, of the health care costs will be absorbed by STRS. All benefit recipients, for the most recent year, are required to pay a portion of the health care cost in the form of a monthly premium. By Ohio law, the cost of the coverage paid from STRS funds shall be included in the employer contribution rate, currently 14% of covered payroll. For fiscal year ended June 30, 2010, benefits are funded on a pay-as-you-go basis through an allocation of employer contributions equal to 1% of covered payroll to a Health Care Stabilization Fund from which health care benefits are paid. The amount of STRS employer contributions used to fund OPEB for the years ended June 30, 2011, 2010, and 2009 were $853,889, $829,400, and $815,908, respectively.
The ORC gives SERS the discretionary authority to provide postretirement health care to retirees and their beneficiaries. Coverage is made available to service retirees, with ten or more years of qualifying service credit, disability and survivor benefit recipients. All retirees and beneficiaries are required to pay a portion of their premium for health care. The portion is based on years of service, Medicare eligibility, and retirement status. After the allocation for basic benefits, the remainder of the employer’s 14% contribution is allocated to providing health care benefits. At June 30, 2011, the allocation rate is 1.43%. The amount of the SERS employer contributions used to fund health care for the years ended June 30, 2011, 2010, and 2009 were $880,115, $286,303, and $2,547,847, respectively. An additional health care surcharge on employers is collected for employees earning less than an actuarially determined minimum compensation amount, pro-rated according to service credit earned. Statutes provide that no employer shall pay a health care surcharge greater than 2% of that employer’s SERS-covered payroll; nor may SERS collect in aggregate more than 1.5% of the total statewide SERS-covered payroll for the health care surcharge. For fiscal year 2011, the minimum compensation level was established at $35,800. The surcharge amount paid to SERS for the years ended June 30, 2011, 2010, and 2009 was $934,081, $921,197, and $860,782, respectively. Qualified benefit recipients who pay Medicare Part B premiums may apply for and receive a monthly reimbursement from SERS. The reimbursement amount is limited by statute to the lesser of the January 1, 1999 Medicare Part B premium or the current premium. The Retirement Board, acting with the advice of the actuary, allocates a portion of the current employer contribution rate to the Medicare B Fund. For fiscal year 2010, the actuarially required allocation was .76%. The amount of the SERS employer contributions used to fund Medicare B for the years ended June 30, 2011, 2010, and 2009 were $467,755, $473,027, and $459,343, respectively.
The Ohio Revised Code provides the statutory authority requiring public employers to fund post-retirement health care through their contributions to OPERS. OPERS provides retirement, disability, and survivor benefits as well as post-retirement health care coverage. Coverage includes hospitalization, physicians’ fees, prescription drugs, and partial reimbursement of monthly Medicare premiums. A portion of the employer OPERS contribution is set aside to fund the health care benefits. The portion of employer contributions for all employers allocated to health care ranged between 4.23% and 5.5% based on the type of plan. The amount of the OPERS-LE employer contributions used to fund OPEB for the years ended June 30, 2011, 2010, and 2009 were $177,801, $160,278, and $173,653, respectively.
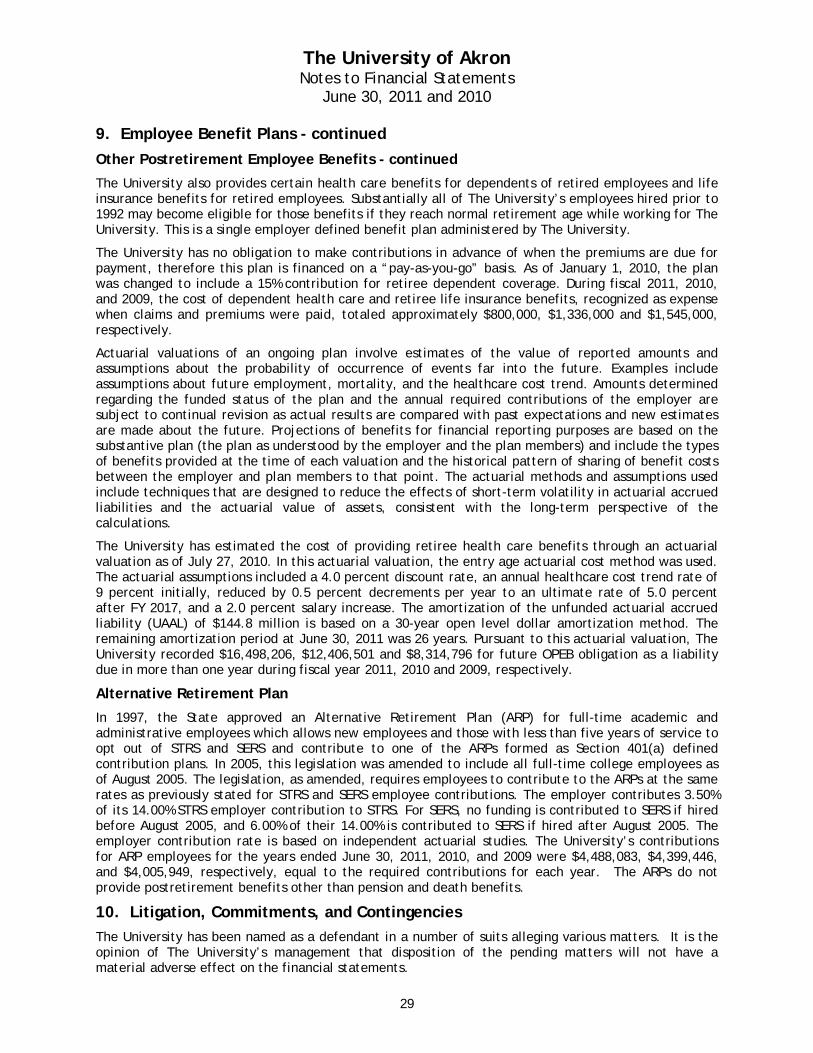
The University of Akron Notes to Financial Statements
June 30, 2011 and 2010
29
9. Employee Benefit Plans - continued
Other Postretirement Employee Benefits - continued
The University also provides certain health care benefits for dependents of retired employees and life insurance benefits for retired employees. Substantially all of The University’s employees hired prior to 1992 may become eligible for those benefits if they reach normal retirement age while working for The University. This is a single employer defined benefit plan administered by The University.
The University has no obligation to make contributions in advance of when the premiums are due for payment, therefore this plan is financed on a “pay-as-you-go” basis. As of January 1, 2010, the plan was changed to include a 15% contribution for retiree dependent coverage. During fiscal 2011, 2010, and 2009, the cost of dependent health care and retiree life insurance benefits, recognized as expense when claims and premiums were paid, totaled approximately $800,000, $1,336,000 and $1,545,000, respectively.
Actuarial valuations of an ongoing plan involve estimates of the value of reported amounts and assumptions about the probability of occurrence of events far into the future. Examples include assumptions about future employment, mortality, and the healthcare cost trend. Amounts determined regarding the funded status of the plan and the annual required contributions of the employer are subject to continual revision as actual results are compared with past expectations and new estimates are made about the future. Projections of benefits for financial reporting purposes are based on the substantive plan (the plan as understood by the employer and the plan members) and include the types of benefits provided at the time of each valuation and the historical pattern of sharing of benefit costs between the employer and plan members to that point. The actuarial methods and assumptions used include techniques that are designed to reduce the effects of short-term volatility in actuarial accrued liabilities and the actuarial value of assets, consistent with the long-term perspective of the calculations.
The University has estimated the cost of providing retiree health care benefits through an actuarial valuation as of July 27, 2010. In this actuarial valuation, the entry age actuarial cost method was used. The actuarial assumptions included a 4.0 percent discount rate, an annual healthcare cost trend rate of 9 percent initially, reduced by 0.5 percent decrements per year to an ultimate rate of 5.0 percent after FY 2017, and a 2.0 percent salary increase. The amortization of the unfunded actuarial accrued liability (UAAL) of $144.8 million is based on a 30-year open level dollar amortization method. The remaining amortization period at June 30, 2011 was 26 years. Pursuant to this actuarial valuation, The University recorded $16,498,206, $12,406,501 and $8,314,796 for future OPEB obligation as a liability due in more than one year during fiscal year 2011, 2010 and 2009, respectively.
Alternative Retirement Plan
In 1997, the State approved an Alternative Retirement Plan (ARP) for full-time academic and administrative employees which allows new employees and those with less than five years of service to opt out of STRS and SERS and contribute to one of the ARPs formed as Section 401(a) defined contribution plans. In 2005, this legislation was amended to include all full-time college employees as of August 2005. The legislation, as amended, requires employees to contribute to the ARPs at the same rates as previously stated for STRS and SERS employee contributions. The employer contributes 3.50% of its 14.00% STRS employer contribution to STRS. For SERS, no funding is contributed to SERS if hired before August 2005, and 6.00% of their 14.00% is contributed to SERS if hired after August 2005. The employer contribution rate is based on independent actuarial studies. The University’s contributions for ARP employees for the years ended June 30, 2011, 2010, and 2009 were $4,488,083, $4,399,446, and $4,005,949, respectively, equal to the required contributions for each year. The ARPs do not provide postretirement benefits other than pension and death benefits.
10. Litigation, Commitments, and Contingencies
The University has been named as a defendant in a number of suits alleging various matters. It is the opinion of The University’s management that disposition of the pending matters will not have a material adverse effect on the financial statements.

The University of Akron Notes to Financial Statements
June 30, 2011 and 2010
30
10. Litigation, Commitments, and Contingencies - continued
In addition to purchasing insurance to cover potential losses from certain litigation, The University participates in two risk pools, along with other State universities, for commercial property coverage and commercial casualty coverage. Each university contributes on a basis equal to their percentage of the total insurable value of the pool. Future contributions will be adjusted based upon each university’s loss history. Each university has a base deductible of $100,000 for each pool. For commercial property coverage, the next $250,000 of any one claim is the responsibility of the pool, which has a total annual aggregate limit of $700,000. The commercial property insurer is liable for the amount of any claim in excess of $350,000, or $100,000 in the event the pool has reached its annual aggregate. For commercial casualty coverage, the next $900,000 of any one claim is the responsibility of the pool. The University purchases a $4,000,000 liability insurance policy that sits over top of the pool.
The University has elected to provide employee health insurance benefits through a self-insurance program as of January 1, 2011. Two third-party administrators, Apex Benefit Services for medical insurance and Delta Dental of Ohio for dental insurance, review all claims which are then paid by The University. Full-time employees are eligible for health insurance benefits effective on the first day of the month following appointment or date of hire. Employees are offered two traditional PPO medical plans with different levels of coverage and one PPO dental plan. Employees make contributions to pay a portion of health insurance benefits based on plan selections and annual salary ranges.
A claims liability of $2,675,900, included with accrued liabilities as of June 30, 2011, is based on the requirements of GASB Statement No. 10, Accounting and Financial Reporting for Risk Financing and Related Insurance Services, which requires that a liability for unpaid claim costs, including estimates of costs relating to incurred but not reported claims, be reported. The change in the total liability for actual and estimated claims is summarized below:
2011
Liability at beginning of year -$
Claims incurred and changes in estimates 10,809,257
Claim payments (8,133,357)
Liability at end of year 2,675,900$
To reduce potential loss exposure, The University has established a reserve for health insurance stabilization of $8.7 million as of June 30, 2011.
The University receives grants and contracts from certain federal and state agencies to fund research and other activities. The federal grants are audited annually in accordance with Office of Management and Budget Circular A-133. Federal agencies also may conduct additional audits under federal law or regulations or may arrange for funding the cost of such additional audits by independent auditing firms. The state grants are subject to review and audit by the grantor agencies or their designee. Such federal or state audits could lead to a request for reimbursement by the grantor agency for expenditures disallowed under the terms of the grant. No significant costs have been questioned to date, and management believes that any disallowance or adjustment of such costs would not have a material adverse effect on the financial statements.
The University has been appropriated $5.2 million from the State for buildings and renovations, of which $2.7 million has been expended as of June 30, 2011. In addition, as of June 30, 2011, University construction projects will cost an estimated $17.8 million to complete with 73.6%, or $13.1 million, funded from bond proceeds.
The University, as part of its commitment to the Austen BioInnovation Institute in Akron, must make annual supporting contributions of $800,000 through fiscal year 2013. This commitment must consist of not less than $400,000 in cash with the balance made in in-kind capital contributions as approved by the other partners.

The University of Akron Notes to Financial Statements
June 30, 2011 and 2010
31
11. Component units
Details of the component units’ net assets at June 30, 2011 and 2010 are as follows:
2011 2010
Research Research
Foundation Foundation Totals Foundation Foundation Totals
Assets
Current assets:
Cash and cash equivalents 688,527$ -$ 688,527$ 1,674,258$ -$ 1,674,258$
Accounts receivable, net 467,813 1,209,605 1,677,418 466,015 1,046,093 1,512,108
Pledges receivable, net 2,885,535 - 2,885,535 3,845,444 - 3,845,444
Notes receivable 5,007,617 - 5,007,617 5,008,989 - 5,008,989
Prepaid expenses and
deferred charges - 17,572 17,572 - 92,780 92,780
Total current assets 9,049,492 1,227,177 10,276,669 10,994,706 1,138,873 12,133,579
Restricted current assets:
Cash and cash equivalents - 2,300,697 2,300,697 - 2,545,919 2,545,919
Pooled investments - 5,991,323 5,991,323 - 8,278,749 8,278,749
Other investments 4,189,558 - 4,189,558 8,223,473 - 8,223,473
Total restricted current assets 4,189,558 8,292,020 12,481,578 8,223,473 10,824,668 19,048,141
Noncurrent assets:
Endowment investments 135,987,811 - 135,987,811 116,132,063 - 116,132,063
Other investments - 292,352 292,352 - 371,966 371,966
Pledges receivable, net 9,618,904 - 9,618,904 12,973,486 - 12,973,486
Capital assets, net 7,727,045 5,250,604 12,977,649 5,541,850 4,469,937 10,011,787
Total assets 166,572,810 15,062,153 181,634,963 153,865,578 16,805,444 170,671,022
Liabilities
Current liabilities:
Accounts payable 846,148 2,431,588 3,277,736 179,038 2,096,002 2,275,040
Accrued liabilities 88,805 668,033 756,838 76,091 719,863 795,954
Deferred revenue 30,000 4,312,663 4,342,663 30,000 6,716,204 6,746,204
Deposits 4,189,558 - 4,189,558 8,223,473 - 8,223,473
Current portion of
long-term liabilities 5,000,000 52,547 5,052,547 6,500,000 49,301 6,549,301
Total current liabilities 10,154,511 7,464,831 17,619,342 15,008,602 9,581,370 24,589,972
Noncurrent liabilities:
Actuarial liability for
annuity/unitrust agreements 12,033,539 - 12,033,539 10,775,286 - 10,775,286
Long-term liabilities - 2,819,066 2,819,066 - 2,871,613 2,871,613
Total liabilities 22,188,050 10,283,897 32,471,947 25,783,888 12,452,983 38,236,871
Net assets
Invested in capital assets, net 7,727,045 2,431,538 10,158,583 5,541,850 1,598,324 7,140,174
Restricted:
Nonexpendable 91,004,853 - 91,004,853 84,997,668 - 84,997,668
Expendable 50,611,189 - 50,611,189 47,742,771 - 47,742,771
Unrestricted (4,958,327) 2,346,718 (2,611,609) (10,200,599) 2,754,137 (7,446,462)
Total net assets 144,384,760$ 4,778,256$ 149,163,016$ 128,081,690$ 4,352,461$ 132,434,151$

The University of Akron Notes to Financial Statements
June 30, 2011 and 2010
32
11. Component units - continued
Details of the component units’ revenues, expenses, and changes in net assets at June 30, 2011 and 2010 are as follows:
2011 2010
Research Research
Foundation Foundation Totals Foundation Foundation Totals
Revenues
Operating revenues:
Federal grants and contracts -$ 132,657$ 132,657$ -$ 201,146$ 201,146$
Private grants and contracts - 4,318,433 4,318,433 - 3,862,449 3,862,449
Gifts and contributions 6,440,171 - 6,440,171 9,017,954 - 9,017,954
Other sources - 1,932,977 1,932,977 - 1,078,880 1,078,880
Total operating revenues 6,440,171 6,384,067 12,824,238 9,017,954 5,142,475 14,160,429
Expenses
Operating expenses:
Educational and general:
Separately budgeted research - 3,609,860 3,609,860 - 2,533,237 2,533,237
Institutional support 809,845 - 809,845 696,331 - 696,331
Depreciation - 277,581 277,581 - 210,003 210,003
Total operating expenses 809,845 3,887,441 4,697,286 696,331 2,743,240 3,439,571
Operating income 5,630,326 2,496,626 8,126,952 8,321,623 2,399,235 10,720,858
Nonoperating revenues (expenses)
Investment income (loss), net 20,351,581 469,063 20,820,644 11,185,644 333,199 11,518,843
Interest on debt - (73,689) (73,689) - (266,714) (266,714)
Distributions to The University (13,414,295) (2,761,288) (16,175,583) (11,686,384) (2,319,433) (14,005,817)
Distributions on behalf of The
University (642,279) - (642,279) (682,239) - (682,239)
Other nonoperating revenues 103,119 295,083 398,202 97,838 194,040 291,878
Net nonoperating revenues (expenses) 6,398,126 (2,070,831) 4,327,295 (1,085,141) (2,058,908) (3,144,049)
Gain (loss) before other changes 12,028,452 425,795 12,454,247 7,236,482 340,327 7,576,809
Other changes
Additions to permanent
endowments 4,274,618 - 4,274,618 2,905,073 - 2,905,073
Increase (decrease) in net assets 16,303,070 425,795 16,728,865 10,141,555 340,327 10,481,882
Net assets – beginning of year 128,081,690 4,352,461 132,434,151 117,940,135 4,012,134 121,952,269
Net assets – end of year 144,384,760$ 4,778,256$ 149,163,016$ 128,081,690$ 4,352,461$ 132,434,151$

33
Supplemental Information
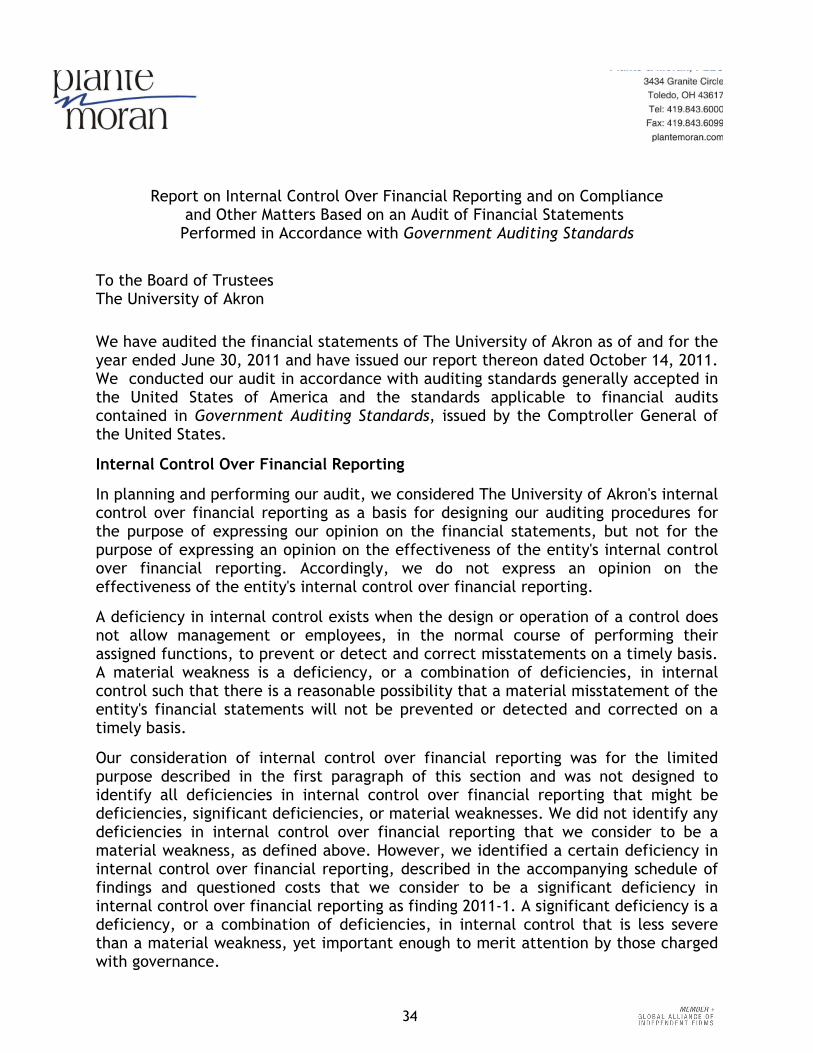
Report on Internal Control Over Financial Reporting and on Complianceand Other Matters Based on an Audit of Financial Statements Performed in Accordance with Government Auditing Standards
To the Board of TrusteesThe University of Akron
We have audited the financial statements of The University of Akron as of and for theyear ended June 30, 2011 and have issued our report thereon dated October 14, 2011.We conducted our audit in accordance with auditing standards generally accepted inthe United States of America and the standards applicable to financial auditscontained in Government Auditing Standards, issued by the Comptroller General ofthe United States.
Internal Control Over Financial Reporting
In planning and performing our audit, we considered The University of Akron's internalcontrol over financial reporting as a basis for designing our auditing procedures forthe purpose of expressing our opinion on the financial statements, but not for thepurpose of expressing an opinion on the effectiveness of the entity's internal controlover financial reporting. Accordingly, we do not express an opinion on theeffectiveness of the entity's internal control over financial reporting.
A deficiency in internal control exists when the design or operation of a control doesnot allow management or employees, in the normal course of performing theirassigned functions, to prevent or detect and correct misstatements on a timely basis.A material weakness is a deficiency, or a combination of deficiencies, in internalcontrol such that there is a reasonable possibility that a material misstatement of theentity's financial statements will not be prevented or detected and corrected on atimely basis.
Our consideration of internal control over financial reporting was for the limitedpurpose described in the first paragraph of this section and was not designed toidentify all deficiencies in internal control over financial reporting that might bedeficiencies, significant deficiencies, or material weaknesses. We did not identify anydeficiencies in internal control over financial reporting that we consider to be amaterial weakness, as defined above. However, we identified a certain deficiency ininternal control over financial reporting, described in the accompanying schedule offindings and questioned costs that we consider to be a significant deficiency ininternal control over financial reporting as finding 2011-1. A significant deficiency is adeficiency, or a combination of deficiencies, in internal control that is less severethan a material weakness, yet important enough to merit attention by those chargedwith governance.
34
To the Board of TrusteesThe University of Akron
Compliance and Other Matters
As part of obtaining reasonable assurance about whether The University of Akron’sfinancial statements are free of material misstatement, we performed tests of itscompliance with certain provisions of laws, regulations, contracts, and grantagreements, noncompliance with which could have a direct and material effect onthe determination of financial statement amounts. However, providing an opinion oncompliance with those provisions was not an objective of our audit and, accordingly,we do not express such an opinion. The results of our tests disclosed no instances ofnoncompliance or other matters that are required to be reported under GovernmentAuditing Standards.
The University of Akron’s response to the findings identified in our audit is describedin the accompanying schedule of findings and questioned costs. We did not audit TheUniversity of Akron's response and, accordingly, we express no opinion on it.
This report is intended solely for the information and use of management, the boardof trustees, others within the entity, federal awarding agencies, and pass-throughentities and is not intended to be and should not be used by anyone other than thesespecified parties.
October 14, 2011
35

Report on Compliance with Requirements That Could Have a Direct andMaterial Effect on Each Major Program and on Internal Control Over
Compliance in Accordance with OMB Circular A-133
To the Board of TrusteesThe University of Akron
Compliance
We have audited the compliance of The University of Akron with the types ofcompliance requirements described in the U.S. Office of Management and Budget(OMB) Circular A-133 Compliance Supplement that could have a direct and materialeffect on each of its major federal programs for the year ended June 30, 2011. Themajor federal programs of The University of Akron are identified in the summary ofauditor's results section of the accompanying schedule of findings and questionedcosts. Compliance with the requirements of laws, regulations, contracts, and grantsapplicable to each of its major federal programs is the responsibility of The Universityof Akron's management. Our responsibility is to express an opinion on The Universityof Akron's compliance based on our audit.
We conducted our audit of compliance in accordance with auditing standardsgenerally accepted in the United States of America; the standards applicable tofinancial audits contained in Government Auditing Standards, issued by theComptroller General of the United States; and OMB Circular A-133, Audits of States,Local Governments, and Non-Profit Organizations. Those standards and OMB CircularA-133 require that we plan and perform the audit to obtain reasonable assuranceabout whether noncompliance with the types of compliance requirements referred toabove that could have a direct and material effect on a major federal programoccurred. An audit includes examining, on a test basis, evidence about TheUniversity of Akron's compliance with those requirements and performing such otherprocedures as we considered necessary in the circumstances. We believe that ouraudit provides a reasonable basis for our opinion. Our audit does not provide a legaldetermination on The University of Akron's compliance with those requirements.
In our opinion, The University of Akron complied, in all material respects, with thecompliance requirements referred to above that could have a direct and materialeffect on each of its major federal programs for the year ended June 30, 2011.
36

To the Board of TrusteesThe University of Akron
Internal Control Over Compliance
The management of The University of Akron is responsible for establishing andmaintaining effective internal control over compliance with requirements of laws,regulations, contracts, and grants applicable to federal programs. In planning andperforming our audit, we considered The University of Akron's internal control overcompliance with requirements that could have a direct and material effect on amajor federal program in order to determine our auditing procedures for the purposeof expressing our opinion on compliance and to test and report on internal controlover compliance in accordance with OMB Circular A-133, but not for the purpose ofexpressing an opinion on the effectiveness of internal control over compliance.Accordingly, we do not express an opinion on the effectiveness of the entity's internalcontrol over compliance.
A deficiency in internal control over compliance exists when the design or operationof a control over compliance does not allow management or employees, in the normalcourse of performing their assigned functions, to prevent or detect and correctnoncompliance with a type of compliance requirement of a federal program on atimely basis. A material weakness in internal control over compliance is a deficiency,or combination of deficiencies, in internal control over compliance such that there isa reasonable possibility that material noncompliance with a type of compliancerequirement of a federal program will not be prevented or detected and corrected ona timely basis.
Our consideration of internal control over compliance was for the limited purposedescribed in the first paragraph of this section and was not designed to identify alldeficiencies in internal control over compliance that might be deficiencies,significant deficiencies, or material weaknesses. We did not identify any deficienciesin internal control over compliance that we consider to be material weaknesses, asdefined above.
This report is intended solely for the information and use of management, the boardof trustees, others within the entity, federal awarding agencies, and pass-throughentities and is not intended to be and should not be used by anyone other than thesespecified parties.
October 14, 2011
37

The University of Akron
See Notes to Schedule of Expenditures of Federal Awards.
38
Schedule of Expenditures of Federal Awards Year Ended June 30, 2011
Federal
Expenditures
Student Financial Aid ClusterDepartment of Education:
Direct programs:
Federal Pell Grant Program 84.063 43,034,521$
Federal Supplemental Educational Opportunity Grant 84.007 1,127,959
Federal College Work-Study 84.033 1,228,839
Academic Competitive Grants 84.375 1,199,329
National Science and Mathematics Access to Retain Talent (SMART) Grants 84.376 678,082
Teacher Education Assistance for College and Higher Education Grants (TEACH Grants) 84.379 147,000
Federal Perkins Loan Program 84.038 12,035,546
Federal Direct Loans 84.268 175,836,771
Total Department of Education 235,288,047
Department of Health and Human Services:
Direct program:
Nursing Student Loans 93.364 1,135,243
Total Student Financial Aid Cluster 236,423,290
Research and Development ClusterDepartment of Agriculture:
Direct program:
Agricultural Research-Basic and Applied Research 10.001 1,827
Department of Commerce:
Direct program:
Center for Sponsored Coastal Ocean Research, Coastal Ocean Program 11.478 22,181
Pass-through program:
Ohio State University-Sea Grant Support 11.417 NA06OAR4170020 20,204
Total Department of Commerce 42,385
Department of Defense:
Direct programs:
Office of Naval Research-Basic and Applied Scientific Research 12.300 61,184
United States Army-Basic Scientific Research 12.431 663,858
USAF-Air Force Defense Research Sciences Program 12.800 259,680
Air Force Defense Research Sciences Program 12.800 1,962,334
Pass-through programs:
University of Akron Research Foundation (UARF)-Basic and Applied Scientific Research 12.300 N00014-08-M-0325 85
UARF-Basic and Applied Scientific Research 12.300 10,101
UARF-Basic and Applied Scientific Research 12.300 N68335-10-C-0419 407
University of Connecticut-Basic and Applied Scientific Research 12.300 N00014-10-0944 31,762
Babcock & Wilcox-Basic and Applied Scientific Research 12.300 N00024-07-C-2100 7,920
UARF-Basic Scientific Research 12.431 W911QY-08-C-0085 8,075
UARF-Basic Scientific Research 12.431 S690000034 21,791
UARF-United States Army-Basic Scientific Research 12.431 12,190
UARF-Air Force Defense Research Sciences Program 12.800 FA9550-10-C-0167 16,317
AFRL/Dayton Area Graduate Studies Institute-Air Force Defense Research Sciences Program 12.800 83,772
Mandaree Enterprise-Air Force Defense Research Sciences Program 12.800 FA8501-06-D-0001 239,071
University of Dayton-Air Force Defense Research Sciences Program 12.800 FA8650-09-D-5223/0003 71,941
UES Inc-Air Force Defense Research Sciences Program 12.800 FA8650-09-D-5037 71,869
Alpha Star Corporation-Air Force Defense Research Sciences Program 12.800 FA8650-10-M-5115 4,580
Ohio Aerospace Institute-Air Force Defense Research Sciences Program 12.800 FA8650-09-D-2945 94,564
Centro de Investigation en Materials Avanzados, S.C.-Air Force Defense Research Sciences Program 12.800 FA9550-10-1-0236 42,901
Wright State University-Air Force Defense Research Sciences Program 12.800 FA9550-09-1-0358 7,247
Federal Grantor/Pass-through Grantor/Program or Cluster Title
Pass-through Entity Identifying Number
Catalog Federal
Domestic Assistance

The University of Akron
See Notes to Schedule of Expenditures of Federal Awards.
39
Schedule of Expenditures of Federal Awards (Continued) Year Ended June 30, 2011
Federal
Expenditures
SORAA Inc.-Air Force Defense Research Sciences Program 12.800 FA9550-10-C-0114 56,981
University of Illinois-Research and Technology Development 12.910 HR0011-10-1-0077 33,670
Total Department of Defense 3,762,300
Department of Housing and Urban Development:
Pass-through program:
AMHA-Demolition and Revitalization of Severely Distressed Public Housing 14.866 54,729
Department of the Interior:
Direct program:
Cultural Resource Management 15.224 43,716
Department of Justice:
Direct program:
National Institute of Justice Research, Evaluation, and Development Project Grants 16.560 923
Pass-through program:
City of Cleveland-Drug Court Discretionary Grant Program 16.585 2010-DC-BX-0012 2,259
NEOMED-Ohio Criminal Justice-Edward Byrne Memorial Justice Assistance Grant Program 16.738 15,833
Total Department of Justice 19,015
Department of Transportation:
Direct programs:
University Transportation Centers Program 20.701 341,246
Pass-through programs:
Ohio Department of Public Safety-State and Community Highway Safety 20.600 37,010
National Transportation Research Center-University Transportation Centers Program 20.701 DTRT06-G-0043 23,829
Auburn University/University of Tennessee-Biobased Transportation Research 20.761 DTOS59-07-G-00050 44,663
Total Department of Transportation 446,748
National Aeronautics and Space Administration:
Direct program:
Technology transfer 43.002 1,442,621
Pass-through programs:
UARF-Technology Transfer 43.002 NNC09BA02B 7,645
Brown University-Technology Transfer 43.002 NNX07AO07A 11,399
Sunpower Inc-Technology Transfer 43.002 NAS3-03128 40,546
Ohio Space Grant Consortium-Technology Transfer 43.002 89,643
Total National Aeronautics and Space Administration 1,591,854
National Science Foundation:
Direct programs:
Engineering Grants 47.041 1,061,839
Mathematical and Physical Sciences 47.049 1,723,373
Geosciences 47.050 19,355
Computer and Information Science and Engineering 47.070 60,580
Biological Sciences 47.074 227,608
Social, Behavioral, and Economic Sciences 47.075 67,353
Educational and Human Resources 47.076 271,331
ARRA-Trans-NSF Recovery Act Research Support 47.082 315,672
Pass-through programs:
University of Dayton-Engineering Grants 47.041 CMS-0609077 (35,120)
UARF-Engineering Grants 47.041 IIP-0822914 341
UARF-Engineering Grants 47.041 IIP-1010240 51,282
Case Western Reserve University-Engineering Grants 47.041 CMMI-1047655 119,345
Federal Grantor/Pass-through Grantor/Program or Cluster Title
Catalog Federal
Domestic Assistance
Pass-through Entity Identifying Number

The University of Akron
See Notes to Schedule of Expenditures of Federal Awards.
40
Schedule of Expenditures of Federal Awards (Continued) Year Ended June 30, 2011
Federal
Expenditures
The Ohio State University Research Foundation-Mathematical and Physical Sciences 47.049 CHE-0526864 66,667
The Ohio State University Research Foundation-Mathematical and Physical Sciences 47.049 CHE-05322560 8,260
University of Arkansas-Educational and Human Resources 47.076 HRD-0533208 (800)
University of Virginia-Educational and Human Resources 47.076 DUE-0717820 9,521
North Carolina State-Educational and Human Resources 47.076 DUE-0914404 14,592
The Ohio State University Research Foundation-Office of Cyber infrastructure 47.080 OCI-0753287 19,191
Total National Science Foundation 4,000,390
Department of Energy:
Direct programs:
Office of Science Financial Assistance Program 81.049 385,598
ARRA-Conservation Research and Development 81.086 446,869
Renewable Energy Research and Development 81.087 374,611
Fossil Energy Research and Development 81.089 546,660
ARRA-Geologic Sequestration Training and Research Grant Program 81.133 52,360
Pass-through programs:
Arizona State University 81.000 DE-FG36-06G016029/A000 (42,868)
Arizona State University-Renewable Energy Research and Development 81.087 DE-FG36-06GO16029 37,500
Total Department of Energy 1,800,730
Department of Education:
Pass-through program:
Ohio Department of Education 84.000 37,980
Total Department of Education 37,980
Department of Health and Human Services:
Direct programs:
Centers for Disease Control 93.000 2
Nurse Anesthetist Traineeships 93.124 9,318
Mental Health Research Grants 93.242 115,125
Advanced Education Nursing Grant Program 93.358 57,816
Nursing Research 93.361 304,274
Academic Research Enhancement Award 93.390 43,075
Cancer Detection and Diagnosis Research 93.394 133,378
Cancer Treatment Research 93.395 82,951
ARRA-Trans-NIH Recovery Act Research Support 93.701 191,718
Diabetes, Endocrinology and Metabolism Research 93.847 32,028
Extramural Research Programs in the Neurosciences and Neurological Disorders 93.853 131,633
Biomedical Research and Research Training 93.859 388,398
Pass-through programs:
ARRA-Ohio Department of Mental Health 93.000 HHSH250200900042C 1,500
Pregnancy Support Center-Healthy Marriage Promotion and Responsible Fatherhood Grants 93.086 90FE0055 36,678
City of Cleveland-Project of Regional and National Significance 93.243 1H79TI019946-01 104,784
NEOMED/ODMH/SAMHSA-Project of Regional and National Significance 93.243 20,760
Summit Co. Community Partnership-SAMHSA-Drug Free Communities Support Program Grants 93.276 5 H79 SP12407-04 35,452
Rutgers, The State University of New Jersey-Discovery and Applied Research for
Technological Innovations to Improve Human Health 93.286 5P41EB001046-08 19,180
Ohio Dept. of Jobs and Family Services-Foster Care Title IV-E 93.658 40,156
ARRA-Indiana University-Trans-NIH Recovery Act Research Support 93.701 2R01DC006436-04A2 32,627
Washington University St. Louis-Diabetes, Endocrinology and Metabolism Research 93.847 1 R01 DK082546-01A1 44,247
NEOMED-Block Grants for Community Mental Health Services 93.958 131
Total Department of Health and Human Services 1,825,231
Total Research and Development Cluster 13,626,905
Federal Grantor/Pass-through Grantor/Program or Cluster Title
Catalog Federal
Domestic Assistance
Pass-through Entity Identifying Number
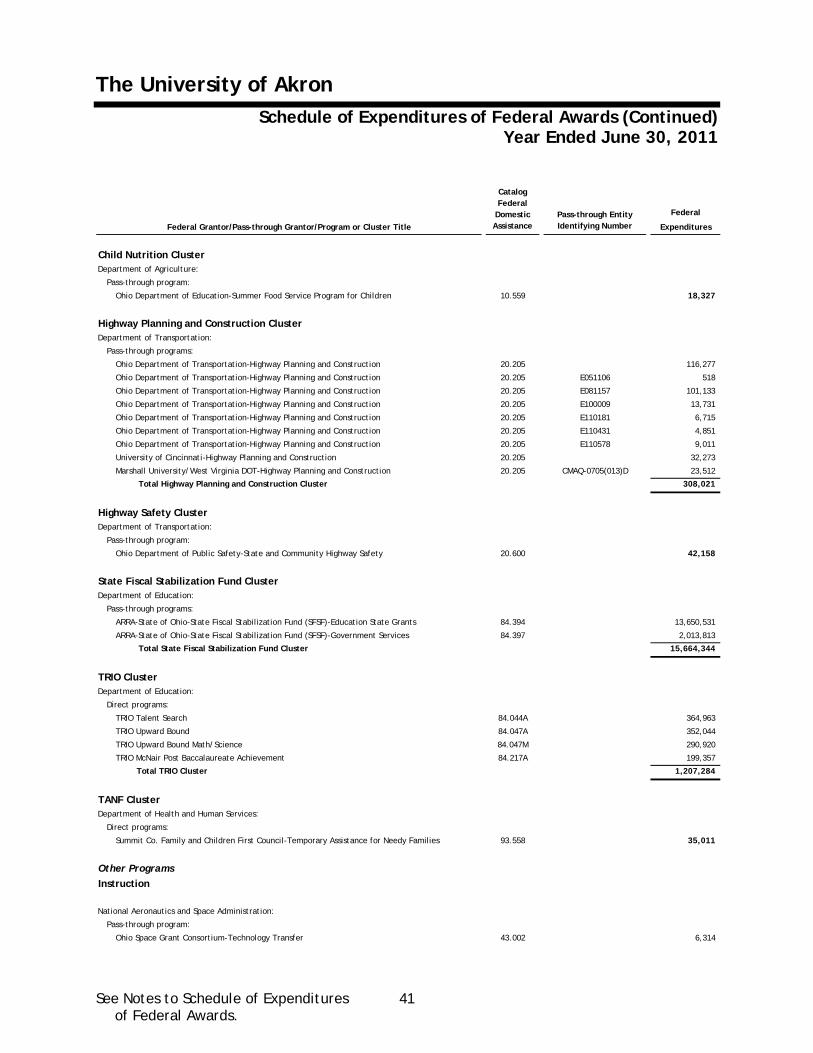
The University of Akron
See Notes to Schedule of Expenditures of Federal Awards.
41
Schedule of Expenditures of Federal Awards (Continued) Year Ended June 30, 2011
Federal
Expenditures
Child Nutrition ClusterDepartment of Agriculture:
Pass-through program:
Ohio Department of Education-Summer Food Service Program for Children 10.559 18,327
Highway Planning and Construction ClusterDepartment of Transportation:
Pass-through programs:
Ohio Department of Transportation-Highway Planning and Construction 20.205 116,277
Ohio Department of Transportation-Highway Planning and Construction 20.205 E051106 518
Ohio Department of Transportation-Highway Planning and Construction 20.205 E081157 101,133
Ohio Department of Transportation-Highway Planning and Construction 20.205 E100009 13,731
Ohio Department of Transportation-Highway Planning and Construction 20.205 E110181 6,715
Ohio Department of Transportation-Highway Planning and Construction 20.205 E110431 4,851
Ohio Department of Transportation-Highway Planning and Construction 20.205 E110578 9,011
University of Cincinnati-Highway Planning and Construction 20.205 32,273
Marshall University/West Virginia DOT-Highway Planning and Construction 20.205 CMAQ-0705(013)D 23,512
Total Highway Planning and Construction Cluster 308,021
Highway Safety ClusterDepartment of Transportation:
Pass-through program:
Ohio Department of Public Safety-State and Community Highway Safety 20.600 42,158
State Fiscal Stabilization Fund ClusterDepartment of Education:
Pass-through programs:
ARRA-State of Ohio-State Fiscal Stabilization Fund (SFSF)-Education State Grants 84.394 13,650,531
ARRA-State of Ohio-State Fiscal Stabilization Fund (SFSF)-Government Services 84.397 2,013,813
Total State Fiscal Stabilization Fund Cluster 15,664,344
TRIO ClusterDepartment of Education:
Direct programs:
TRIO Talent Search 84.044A 364,963
TRIO Upward Bound 84.047A 352,044
TRIO Upward Bound Math/Science 84.047M 290,920
TRIO McNair Post Baccalaureate Achievement 84.217A 199,357
Total TRIO Cluster 1,207,284
TANF ClusterDepartment of Health and Human Services:
Direct programs:
Summit Co. Family and Children First Council-Temporary Assistance for Needy Families 93.558 35,011
Other Programs
Instruction
National Aeronautics and Space Administration:
Pass-through program:
Ohio Space Grant Consortium-Technology Transfer 43.002 6,314
Federal Grantor/Pass-through Grantor/Program or Cluster Title
Catalog Federal
Domestic Assistance
Pass-through Entity Identifying Number
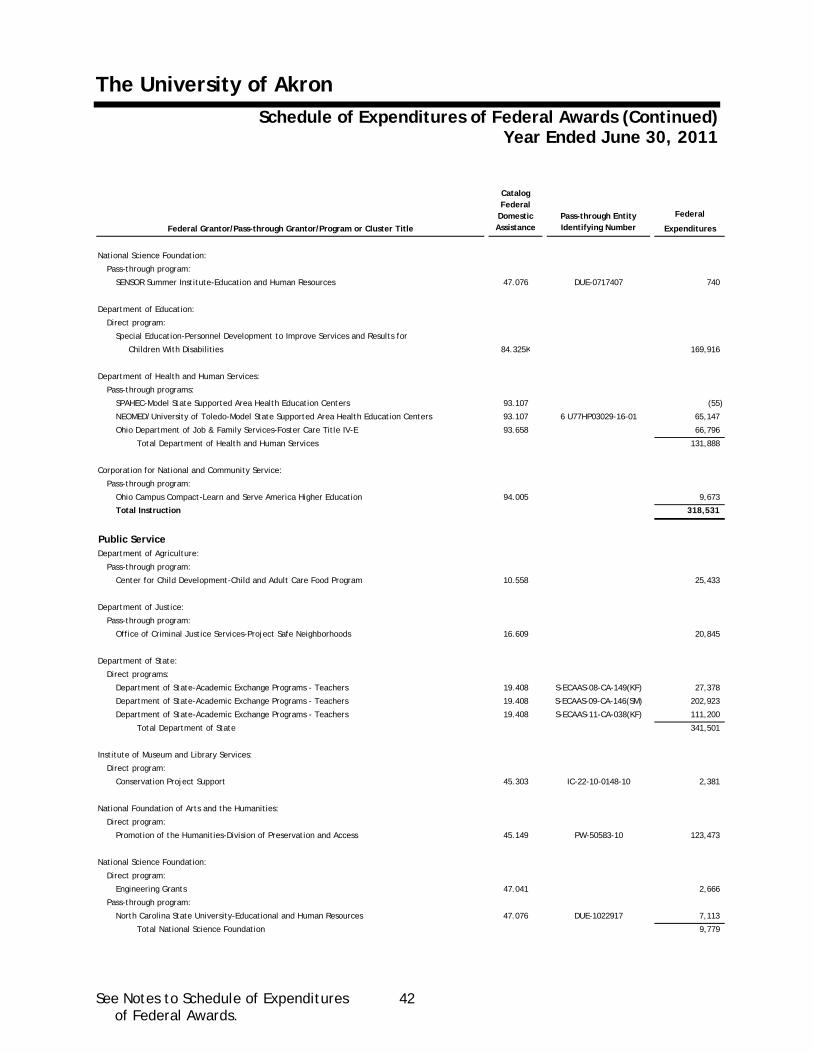
The University of Akron
See Notes to Schedule of Expenditures of Federal Awards.
42
Schedule of Expenditures of Federal Awards (Continued) Year Ended June 30, 2011
Federal
Expenditures
National Science Foundation:
Pass-through program:
SENSOR Summer Institute-Education and Human Resources 47.076 DUE-0717407 740
Department of Education:
Direct program:
Special Education-Personnel Development to Improve Services and Results for
Children With Disabilities 84.325K 169,916
Department of Health and Human Services:
Pass-through programs:
SPAHEC-Model State Supported Area Health Education Centers 93.107 (55)
NEOMED/University of Toledo-Model State Supported Area Health Education Centers 93.107 6 U77HP03029-16-01 65,147
Ohio Department of Job & Family Services-Foster Care Title IV-E 93.658 66,796
Total Department of Health and Human Services 131,888
Corporation for National and Community Service:
Pass-through program:
Ohio Campus Compact-Learn and Serve America Higher Education 94.005 9,673
Total Instruction 318,531
Public ServiceDepartment of Agriculture:
Pass-through program:
Center for Child Development-Child and Adult Care Food Program 10.558 25,433
Department of Justice:
Pass-through program:
Office of Criminal Justice Services-Project Safe Neighborhoods 16.609 20,845
Department of State:
Direct programs:
Department of State-Academic Exchange Programs - Teachers 19.408 S-ECAAS-08-CA-149(KF) 27,378
Department of State-Academic Exchange Programs - Teachers 19.408 S-ECAAS-09-CA-146(SM) 202,923
Department of State-Academic Exchange Programs - Teachers 19.408 S-ECAAS-11-CA-038(KF) 111,200
Total Department of State 341,501
Institute of Museum and Library Services:
Direct program:
Conservation Project Support 45.303 IC-22-10-0148-10 2,381
National Foundation of Arts and the Humanities:
Direct program:
Promotion of the Humanities-Division of Preservation and Access 45.149 PW-50583-10 123,473
National Science Foundation:
Direct program:
Engineering Grants 47.041 2,666
Pass-through program:
North Carolina State University-Educational and Human Resources 47.076 DUE-1022917 7,113
Total National Science Foundation 9,779
Federal Grantor/Pass-through Grantor/Program or Cluster Title
Catalog Federal
Domestic Assistance
Pass-through Entity Identifying Number

The University of Akron
See Notes to Schedule of Expenditures of Federal Awards.
43
Schedule of Expenditures of Federal Awards (Continued) Year Ended June 30, 2011
Federal
Expenditures
Department of Education:
Direct programs:
Fund for the Improvement of Education 84.215K 106,221
Early Reading First 84.359B 1,443,482
Pass-through programs:
Ohio Department of Education -Vocational Education Basic Grants to States 84.048 22,400
Summit Co. Educational Service Center-Fund for the Improvement of Education 84.215X U215X080287 87,225
Stark County Educational Service Center-Fund for the Improvement of Education 84.215X U215X100034 69,395
Ohio Department of Education-Tech Prep Education 84.243 164,871
Cleveland State University/Ohio Dept of Education-Reading First State Grants 84.357 11,652
Ohio Department of Education-Reading First State Grants 84.357 268,694
Ohio Board Regents-Improving Teacher Quality State Grants 84.367 83,113
ARRA-Ohio Department of Education-State Fiscal Stabilization Fund (SFSF)-
Race-to-the-Top Incentive Grants 84.395 11,967
Total Department of Education 2,269,020
Department of Health and Human Services:
Pass-through programs:
SPAHEC - Model State Supported Area Health Education Centers 93.107 (769)
Summit County Child Support Enforcement-Child Support Enforcement Demonstrations
and Special Projects 93.601 90FI0109/01 11,028
ODADAS-Block Grants for Prevention and Treatment of Substance Abuse 93.959 21,795
Total Department of Health and Human Services 32,054
Corporation for National and Community Service:
Pass-through program:
Harrisburg Univ of Science & Technology-Learn and Serve America Higher Education 94.005 09LHAPA002 40,931
Total Public Service 2,865,417
Total Other Programs 3,183,948
Total Expenditures of Federal Awards 270,509,288$
Federal Grantor/Pass-through Grantor/Program or Cluster Title
Catalog Federal
Domestic Assistance
Pass-through Entity Identifying Number

The University of Akron
44
Notes to Schedule of Expenditures of Federal Awards Year Ended June 30, 2011
Note 1 - Summary of Significant Accounting Policies Basis of Presentation The accompanying schedule of expenditures of federal awards (the “Schedule”) includes the federal grant activity of The University of Akron (the “University”) under programs of the federal government for the year ended June 30, 2011. Expenditures reported on the Schedule are reported on the same basis of accounting as the basic financial statements, although the basis for determining when federal awards are expended is presented in accordance with the requirements of OMB Circular A-133, Audits of States, Local Governments, and Non-Profit Organizations. In addition, expenditures reported on the Schedule are recognized following the cost principles contained in OMB Circular A-21, wherein certain types of expenditures are not allowable or are limited as to reimbursement. Therefore, some amounts presented in this Schedule may differ from amounts presented in, or used in the preparation of, the basic financial statements. Because the Schedule presents only a selected portion of the operations of the University, it is not intended to and does not present the financial position, changes in net assets or cash flows, if applicable, of the University. Pass-through entity identifying numbers are presented where available. Facilities and Administrative Costs The University recovers facilities and administrative costs by means of predetermined rates. The predetermined rates are a result of negotiated agreements with the U.S. Department of Health and Human Services. The predetermined rates are 48.5% for on-campus research and 26% for off-campus research through June 30, 2011.
Note 2 – Loans Outstanding The following schedule represents total loans advanced to students by The University and balances outstanding for the Perkins and Nursing Student Loan Programs for the year ended June 30, 2011:
Cluster/Program Title CFDA
Numbers
Advances Outstanding
Balances
Perkins Loan Program 84.038 $ 867,958 $ 12,035,546 Nursing Student Loan Program 93.364 129,682 1,135,243
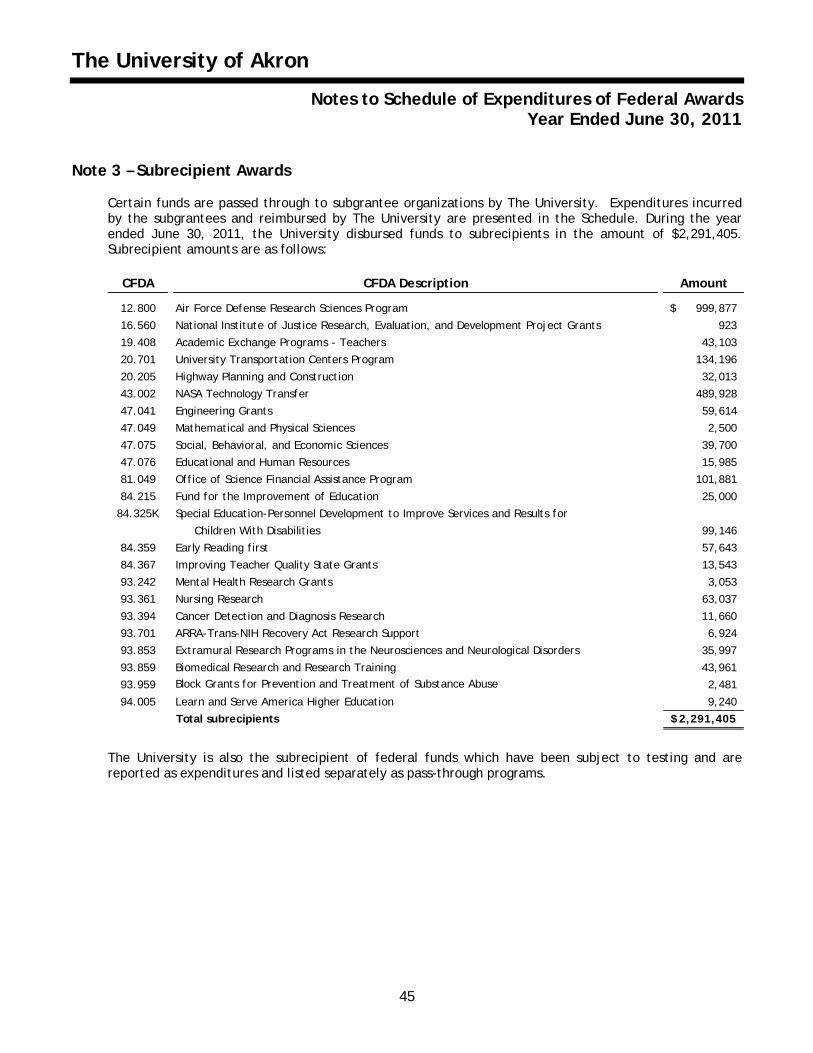
The University of Akron
45
Notes to Schedule of Expenditures of Federal Awards Year Ended June 30, 2011
Note 3 – Subrecipient Awards Certain funds are passed through to subgrantee organizations by The University. Expenditures incurred by the subgrantees and reimbursed by The University are presented in the Schedule. During the year ended June 30, 2011, the University disbursed funds to subrecipients in the amount of $2,291,405. Subrecipient amounts are as follows:
CFDA CFDA Description Amount
12.800 Air Force Defense Research Sciences Program 999,877$
16.560 National Institute of Justice Research, Evaluation, and Development Project Grants 923
19.408 Academic Exchange Programs - Teachers 43,103
20.701 University Transportation Centers Program 134,196
20.205 Highway Planning and Construction 32,013
43.002 NASA Technology Transfer 489,928
47.041 Engineering Grants 59,614
47.049 Mathematical and Physical Sciences 2,500
47.075 Social, Behavioral, and Economic Sciences 39,700
47.076 Educational and Human Resources 15,985
81.049 Office of Science Financial Assistance Program 101,881
84.215 Fund for the Improvement of Education 25,000
84.325K Special Education-Personnel Development to Improve Services and Results for
Children With Disabilities 99,146
84.359 Early Reading first 57,643
84.367 Improving Teacher Quality State Grants 13,543
93.242 Mental Health Research Grants 3,053
93.361 Nursing Research 63,037
93.394 Cancer Detection and Diagnosis Research 11,660
93.701 ARRA-Trans-NIH Recovery Act Research Support 6,924
93.853 Extramural Research Programs in the Neurosciences and Neurological Disorders 35,997
93.859 Biomedical Research and Research Training 43,961
93.959 Block Grants for Prevention and Treatment of Substance Abuse 2,481
94.005 Learn and Serve America Higher Education 9,240
Total subrecipients 2,291,405$
The University is also the subrecipient of federal funds which have been subject to testing and are reported as expenditures and listed separately as pass-through programs.
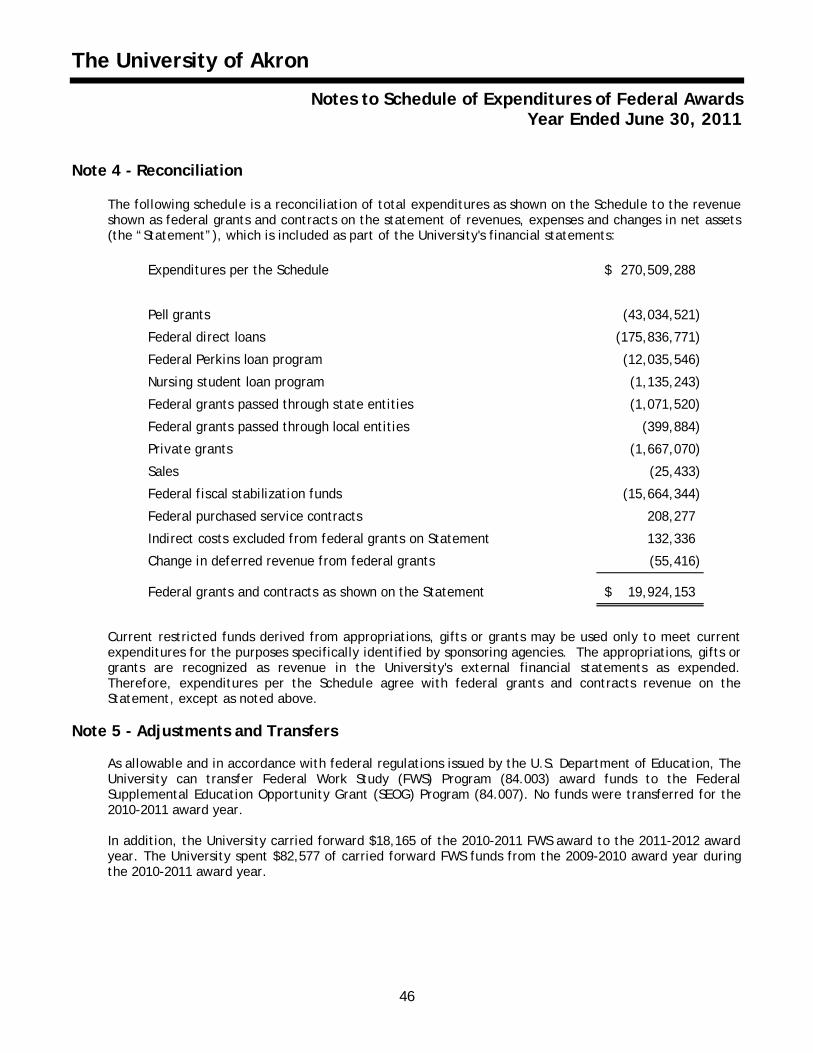
The University of Akron
46
Notes to Schedule of Expenditures of Federal Awards Year Ended June 30, 2011
Note 4 - Reconciliation The following schedule is a reconciliation of total expenditures as shown on the Schedule to the revenue shown as federal grants and contracts on the statement of revenues, expenses and changes in net assets (the “Statement”), which is included as part of the University's financial statements:
Expenditures per the Schedule 270,509,288$
Pell grants (43,034,521)
Federal direct loans (175,836,771)
Federal Perkins loan program (12,035,546)
Nursing student loan program (1,135,243)
Federal grants passed through state entities (1,071,520)
Federal grants passed through local entities (399,884)
Private grants (1,667,070)
Sales (25,433)
Federal fiscal stabilization funds (15,664,344)
Federal purchased service contracts 208,277
Indirect costs excluded from federal grants on Statement 132,336
Change in deferred revenue from federal grants (55,416)
Federal grants and contracts as shown on the Statement 19,924,153$
Current restricted funds derived from appropriations, gifts or grants may be used only to meet current expenditures for the purposes specifically identified by sponsoring agencies. The appropriations, gifts or grants are recognized as revenue in the University's external financial statements as expended. Therefore, expenditures per the Schedule agree with federal grants and contracts revenue on the Statement, except as noted above.
Note 5 - Adjustments and Transfers
As allowable and in accordance with federal regulations issued by the U.S. Department of Education, The University can transfer Federal Work Study (FWS) Program (84.003) award funds to the Federal Supplemental Education Opportunity Grant (SEOG) Program (84.007). No funds were transferred for the 2010-2011 award year. In addition, the University carried forward $18,165 of the 2010-2011 FWS award to the 2011-2012 award year. The University spent $82,577 of carried forward FWS funds from the 2009-2010 award year during the 2010-2011 award year.

The University of Akron
47
Schedule of Findings and Questioned Costs Year Ended June 30, 2011
Section I - Summary of Auditor's Results Financial Statements: Type of auditor's report issued: Unqualified Internal control over financial reporting: Material weakness(es) identified? Yes X No
Significant deficiency(ies) identified that are not considered to be material weaknesses?
X
Yes
None reported
Noncompliance material to financial statements noted? Yes X No Federal Awards: Internal control over major programs: Material weakness(es) identified? Yes X No
Significant deficiency(ies) identified that are not considered to be material weaknesses?
Yes
X
None reported
Type of auditor's report issued on compliance for major programs: Unqualified Any audit findings disclosed that are required to be reported in accordance with Circular A-133, Section .510(a)?
Yes
X
No
Identification of major programs:
CFDA Number Name of Federal Program or Cluster
84.063, 84.007, 84.033, 84.038, 84.268, 84.375, 84.376, 84.379, 93.364 Student Financial Aid Cluster
84.359 Early Reading First
84.394, 84.397 ARRA – State Fiscal Stablization
Fund Cluster Dollar threshold used to distinguish between Type A and Type B programs:
$1,022,580
Auditee qualified as low-risk auditee? Yes X No

The University of Akron
48
Schedule of Findings and Questioned Costs (Continued) Year Ended June 30, 2011
Section II - Financial Statement Findings
Reference Number
Findings
2011-1
Internal Controls for Net Asset Classification Finding Type – Significant deficiency Criteria – The University is required to implement effective internal controls over the classification of net assets between invested in capital assets, net of related debt, restricted and unrestricted net assets. Condition – Net assets which were internally designated for capital projects were originally classified as restricted net assets. Context – The total amount which was incorrectly classified was approximately $17,390,000 and was discovered when completing the audit procedures for the year ended June 30, 2011. Cause – The University was not classifying the net assets in accordance with guidance provided by the Government Accounting Standards Board. Effect – As a result of the issue, unrestricted net assets was understated by approximately $17,390,000. An audit adjustment was made to the financial statements to correct the error. Recommendation – Management should review the net asset classifications used and ensure net asset balances are presented in accordance with guidance provided by the Government Accounting Standards Board. Views of responsible officials and planned corrective actions – These net assets were from board-designated funds that still are restricted for the purpose of capital project expenditures, but do not fully meet the Governmental Accounting Standards Board definition of restricted expendable net assets. These classifications would not have an effect on most analysis of the University’s financial position, but we agree to review all net asset balances to ensure that they are properly recorded on the financial statements in accordance with GASB definitions.
The University of Akron
49
Schedule of Findings and Questioned Costs (Continued) Year Ended June 30, 2011
Section III - Federal Program Audit Findings
Reference Number
Findings
Current Year
None

The University of Akron
Summary Schedule of Prior Audit FindingsYear Ended June 30, 2011
Prior yearFindingNumber
FederalProgram
Original FindingDescription Status
PlannedCorrective
Action
2010-03
StudentFinancialAid Cluster- FederalFamilyEducationLoans(FFEL) -84.032
FFEL were notdisbursed tostudents withinthe required 3business days.
Corrective actionhas been taken
Correctiveactionhasbeentaken
2010-01
NA - FinancialStatement
finding
Internal controlsfor pledgesreceivable
Corrective actionhas been taken
Correctiveaction
hasbeentaken
2010-02
NA - FinancialStatement
findingInternal controls
for cash cycleCorrective action
has been taken
Correctiveaction
hasbeentaken
50
Recommended