1
RECOUP Working Paper No. 42
Financing Education in Pakistan: The Impact of Public Expenditure and Aid
on Educational Outcomes
Rabea Malik* and Arif Naveed
Abstract
Given the low outcomes and high levels of poverty in the country, in addition to its geo-
political/geo-strategic importance, Pakistan has been a country of interest for the donor
community. Although Pakistan is not as aid dependent as many of its developing country
counterparts, development funding from donors has been an historically important source of
public finance for social sectors. This paper presents a broad picture of the state of education
financing in Pakistan by tracing the trends in two sources of public financing – state and donor
funding – and analyses what these trends a) reveal about relationship between the country and
donors; b) imply as regards the trajectory of trends in observed educational outcomes. The
discussion is focused on two decades – 1990s and post 2000 – which mark two phases of donor
involvement in Pakistan. We find that while linking sources of public finance to educational
outcomes is a non-trivial task, improvements in some key output indicators suggests progress
made through increasing resource allocations to the education sector. However, the donors have
had more limited success in influencing budgetary priorities.
___________________________
*Corresponding author: University of Cambridge, Faculty of Education, 184 Hills Road,
Cambridge CB2 8PQ; email: [email protected]
This paper forms part of the Research Consortium on Educational Outcomes and Poverty
(RECOUP). Neither DFID nor any of the partner institutions are responsible for the views
expressed here. For details of the objectives, composition and work of the consortium see:
www.educ.cam.ac.uk/RECOUP

2
Table of Contents
Introduction
Section 1: Public Financing of Education in Pakistan
1.1 National level allocations, tight fiscal space and reliance on donor funding
1.2 Gaps in commitments and actual expenditures
1.3 Intra-sectoral priorities
1.4 Recurrent and development expenditure
1.5 Priorities within the education budget
1.6 Discussion
Section 2: Aid to Education in Pakistan
2.1 Trends in aid to education in Pakistan
2.2 Influence of aid – two eras of donor involvement
2.3 Sub-sectoral breakdown of aid to education
2.4 Trends in multilateral and bilateral Sources
2.5 Aid to education and development vs. recurrent expenditure
Section 3: Impact of Public Financing – Trends in outcomes of education 1990 - 2007
3.1 Literacy rates
3.2 Student teacher ratios
3.3 The goal of Universal Primary Education (UPE)
3.4 Gender parity in enrolments
3.5 Increasing role of the private sector
3.6 Retention rates
3.7 Discussion
Section 4: Conclusions
Annex A: Trends in Aid Receipts - Multilateral and Bilateral Sources

3
List of Tables
Table 1: Fiscal space, revenue sources and expenditure levels (%age of GDP)
Table 2: Expenditure Priorities: Public Expenditure on Education, Defence and Debt Re-servicing
(%age of GDP)
Table 3: Consolidated Federal and Provincial Expenditures (% of total expenditure)
Table 4: Recurrent Versus Development Expenditure within the education sector
Table 5: Prioritising spending: sub-sectoral allocation as a %age of total expenditure on education
Table 6: Breakdown of Current Expenditure for Primary Education in Punjab (%age of Total
Non-Development Expenditure on Primary Education):
Table 7: Trends in foreign aid for education 1990-2006
Table 8: Aid to Education by sub-sector (a)
Table 9: Availability of teachers (000s)
Table 10: Trends in Primary and Secondary Gross and Net Enrolments
Table 11: Gender Disparity in primary enrolments % (gross and net)
Table 12: Primary Enrolment by Sector (%age of total primary enrolment) in Pakistan 1992-2005
Table 13: Retention rates for students in primary schools 1990-2005
Table 14: Differences in improvements in retention rates for girls and boys at the primary level
Table 15: Urban-rural disparities in retention rates at the primary level 1990-2005
4
List of Figures
Figure 1: Gaps in projections and actual expenditure on education (%age of GDP) between 1990-
2016
Figure 2: Trends in aid dependency (1990-2006): ODA as a proportion of GNI and Central
Government Expenditure
Figure 3: Aid to education by sub-sector (b)
Figure 4: Trends in Literacy Rates (1997-2004)
Figure 5: Changes in Gender Parity in Literacy - 1998 and 2005
Figure 6: Trend in Student Teacher Ratio – Primary Schools
Figure 7: Gender parity between 1992 and 2007: GERs, number of institutions and number of
teachers
5
Financing Education in Pakistan: The Impact of Public Expenditure and Aid on
Educational Outcomes
Rabea Malik and Arif Naveed1
Introduction:
Education is recognised and guaranteed as a basic human right by the state. Governments invest
in education for a number of reasons: to generate human capital and fuel growth; insure against
imperfections of the market that may result in under-investment at the individual level; human
rights; promotion of good citizenship; strengthen equality of opportunity. In addition acquiring
education is linked to reduction in incidence of poverty as it imparts skills and generates income-
earning ability. Provision and financing of education remain the primary responsibility of the
state in Pakistan. Historically, in Pakistan, the state’s commitment to social service delivery -
education in particular- has often competed with (and lost out against) heavy debt repayments,
large and ever-expanding defence budgets and unproductive expenditures on running an
oversized government.
Given the low outcomes and high levels of poverty in the country, in addition to its geo-
political/geo-strategic importance, Pakistan has been a country of interest for the donor
community. Donors in Pakistan have sought to influence the government to increase financial
allocations (at the national level and within the education sector) and donor funding has made a
direct contribution to observable educational outcomes. The proportion of financial assistance in
overall social sector investment is low compared to some African states - aid to education in
Pakistan is approximately 10% of total central government expenditure2. Comparatively low
volumes of aid notwithstanding, the influence of multilateral and bilateral donors and the
international development agenda in Pakistan is clear and present.
This paper presents a broad picture of the state of education financing in Pakistan by tracing the
trends in two sources of public financing – state and donor funding – and analyses what these
trends a) reveal about relationship between the country and donors; b) imply as regards the
trajectory of trends in observed educational outcomes. The level of influence of both sources is
interconnected and needs to be explored to understand the trajectory of educational outcomes in
Pakistan. The nature and success of donor influence varies at various levels. The second
objective of the paper is to map trends in aid inflows and those in educational outcomes most
commonly used as target indicators for judging progress towards EFA and UPE goals to illustrate
the impact long standing donor activities may have had on education sector outcomes in Pakistan.
The discussion is focused on two decades – the 1990s and post 2000 – which mark two phases of
donor involvement in Pakistan. To address the first two sub-objectives (a), the analysis relies on
primary and secondary data sources on government finance to engage in a budget tracking
exercise. For the purposes of tracking donor funding, the paper presents a unique consolidated
overview of all sectoral and sub-sectoral aid inflows based on primary data from the Ministry of
Economic Affairs and Statistics during this time period. All together the analysis presented
contributes significantly. While the political relationship between the donors and the government
and its potential impact on education policy is alluded to briefly, the paper does not discuss issues
of politics of aid. A detailed discussion on related issues (politics of aid, the relations between
1 With special thanks to Dr. Faisal Bari
2 In some African countries this proportion is as high as 35 or 50%.
6
successive political and military governments and donors and other institutional issues that relate
to the success of donor interventions in the education sector) are covered in a parallel set of
research outputs3.
Evidence presented in the paper is based on data collected from primary sources at the central,
provincial and district levels of government (Budget documents; Population Census), a household
survey dataset for Punjab and NWFP (RECOUP), official policy documents and reports (GoP’s
Five Year Plans; Education Policies; Medium Term Development Frameworks; Poverty
Reduction Strategy papers). This includes data on actual and planned expenditure, recurrent and
development expenditure etc. in education from budget documents, economic surveys and policy
documents. Trends in outcomes of education have been generated by drawing on primary
statistics gathered from the Ministry of Education and secondary statistics from economic surveys
and other policy documents. The analysis is also informed by elite interviews with education
specialists at the ministries and representatives at donor agencies.
There are certain limitations of data availability and consistency that are recognised at the outset
to limit the analysis to some degree. Collecting consistent data on financing and outcomes (across
reported sources as well as over time) was a challenge. Changes in accounting procedures since
1990 make tracking budgetary allocations and expenditures difficult. Furthermore, the analysis
suffers from a lack of breakdown of expenditures at the provincial and district levels, lack of
trend data on expenditures in schools and on private sources of finance. There are similar issues
for reported data on enrolment rates, retention rates and learning outcomes. These limitations
have been acknowledged as far as possible during the analysis. That notwithstanding, the
analysis makes a significant contribution by presenting a comprehensive overview of the sources
of aid and public finance in education, and their potential contribution towards educational
outcomes.
The paper is laid out as follows: Section 1 reviews trends in education financing in Pakistan since
1990. Section 2 traces trends in aid flows. Section 3 traces the trajectory of key educational
outcomes over the past two decades by way of discussing the impact aid and state financing
appears to have had on outcomes.
3 King and Malik (2008) and Malik and King (forthcoming). The analysis is referenced clearly however
some of the links drawn are based on a synthesis of information gleaned from informal discussions as well
as a series of interviews with education specialists in 22 donor agencies and various relevant government
agencies.

7
Section 1: Public Financing of Education in Pakistan
Pakistan is a poor country with low per capita income levels4. Adult literacy rate is 44%, which
disguises the fact that half as many women are literate as men; school completion rate is 59%.
More than 6 million children are out of school and the female enrolment rate is 74% that of boys
(Watson and Khan, 2005). The country scores low on learning outcomes as well, especially in
schools run by the state. The public sector in the country suffers from years of neglect – lack of
resources and policy reform – resulting in the low quality of service delivery. The historically low
levels of education indicators have 1) repeatedly highlighted the need for the Pakistani state to
raise its levels of investment in education, 2) are the reasons donors are interested in the country.
Although international literature on educational outcomes has shown that increasing resource
allocations to schools alone does not improve educational outcome (Hanushek, 1995, 2003), a
minimum level of investment in basic infrastructure and human resources in low income
countries is deemed a necessary first step. The link between outcomes and financing, albeit
indirect, exists. Colclough with Lewin (1993) predicted that slower progress towards (or non-
achievement) of universal primary education (UPE) is more likely among poorer countries.
Furthermore, the proportion of national income and resources allocated to education is one
indication of the priority given to the sector and recognition of its contribution to poverty
reduction and human development. Hence, the expenditure targets by federal and provincial
governments, levels of public debt and sectoral and intra-sectoral budget expenditures are as
much of interest to donors as educational outcome targets (learning outcomes, enrolment rates
etc.).
Public spending on education in Pakistan has remained under 2% of GDP for the past 20 years.
This figure is low by regional standards and far below the target set to ensure achievement of
universal access and quality. Pakistan is compelled by its constitutional commitments and
commitments to international agreements to ensure a minimum level of funding and to undertake
policy reform. These commitments have often competed with (and lost out against) heavy debt
repayments, large and ever-expanding defence budgets and unproductive expenditures on running
an oversized government. Implicitly, the state and levels of education financing reflect the level
of donor influence on these softer targets.
The objective of tracing trends in public financing is two-fold: 1) to present a broad picture of the
state of education financing in Pakistan by tracing the trends proportions of GDP and total
government expenditure as the primary source of financing and what these trends imply as
regards trends in observed educational outcomes (these trends will be linked with outcomes in the
last section); 2) assess, however indirectly, the nature and success of donor influence in this
regard. We’re constrained by lack of availability of requisite data to draw a causal link between
education outcomes and education financing (at the school, district or provincial level). However,
we attempt as far as possible a comprehensive analysis. A comprehensive analysis of education
financing in Pakistan needs to take into account a number of issues: commitment at the federal
level (GDP allocations); gap between commitments and actual allocations; the proportion of
development expenditure in total allocations etc.
4 GDP per capita was US $ 1664 in 1995 and US $ 2370 in 2005. The growth in GDP per capita was 2.4%
in 1995 and 5.2% in 2005. But this disguises negative growth of –1.4% in 1996-97 and less than 1%
growth in 1998-99 and between 2000 and 2002.

8
1.1 National level allocations, tight fiscal space and reliance on donor funding
Pakistan spends less than 2% of its GDP on education. This amount is considered lower than is
necessary to achieve set targets of universal education and standard quality. Various studies by
international development organisations as well as by the government ministries have estimated
4% of GDP as level of investment needed for ensuring the required access and quality agreed to
in the UPE and SFA goals under the broader MDG banner (GoP, 1998). Cost based assessments,
part of education policy documents, note that annual outlays of 40% of total expenditure and
4.4% of GDP are required to meet the EFA goals (GoPb, 2003). However, a gap in commitment
and allocation of resources remains. Expenditure-tracking exercises reveal that education funding
levels fall short of targets. Figure 1 tracks trends in allocated and actual expenditures to illustrate
the point. In the year 2000-01 1.8% of GDP was spent on education. In 2006-07 this had gone up
to 2.9% of the GDP; the same level as that in 1990 (2.6%).
Under-financing of the education sector and low allocations are the most prevalent criticism and
oft-cited reason for slow progress towards EFA goals. One reason for low investment in
development sectors in Pakistan is non-availability of sufficient resources/fiscal space; Pakistan
has over the past two decades generated less income than it has spent. The state has a low revenue
generation capacity. Tax revenue as a proportion of total revenue decreased from 82.6% of total
revenue in 1997-98 to 68.7% in 2007-08. The contribution of non-tax revenue to the total revenue
pool has increased from 17.4% to 31.2% over the same period (GoP, 2008: Economic Survey
2007-08). The tax-to-GDP ratio and the revenue-to-GDP ratio also declined between 1990 and
2006-07 (See Table 1). Interest payments on borrowing used to finance the debt constrain the
fiscal space further. Fiscal discipline has been a cause for constrained resources in Pakistan for a
number of decades as the country has continued to live beyond its means. Table 1 shows that the
budget deficit in Pakistan was at 8% of GDP in 1997-98 and remained at the same level in 2007-
08 (although it fell to 2-3% of GDP in years 2003-05). The deficit has been financed through
external and domestic borrowing. Domestic debt stood at 30% and external debt at 43.3% of the
GDP in 20035.
Resource availability at the federal level determines the amount of resources the provincial
governments have at their disposal. As shown in Table 1, total revenue available to the federal
government has declined overtime thus shrinking the fiscal space available for meeting increased
demands of public service delivery. Grants from foreign resources become a part of non-tax
revenues and increase the resource pool at the federal government’s disposal. Donor intervention
has to some degree taken this issue into account. New lending instruments (General Budget
Support and program lending) are designed to create much needed fiscal space for financially
constrained provinces.
Such fiscal indiscipline is conducive neither for growth nor poverty reduction6. High deficits have
pushed the country to borrow from the IMF, loans that come with attached conditions of
5 The external debt fell to 30% of GDP in 2005. In recent months however, the economic slowdown, subsidies
given on electricity and gas prices, the costs associated with the war on terror and massive internal displacement
of the population have increased the burden on the government’s purse. 6 One direct anti-poverty impact of large deficits, apart from crowing out social sector investment is the
likelihood to opt for ‘seignorage’ (financing deficits through inflation), the burden for which falls directly and
disproportionately on the poor (MHHDC, 1999).
9
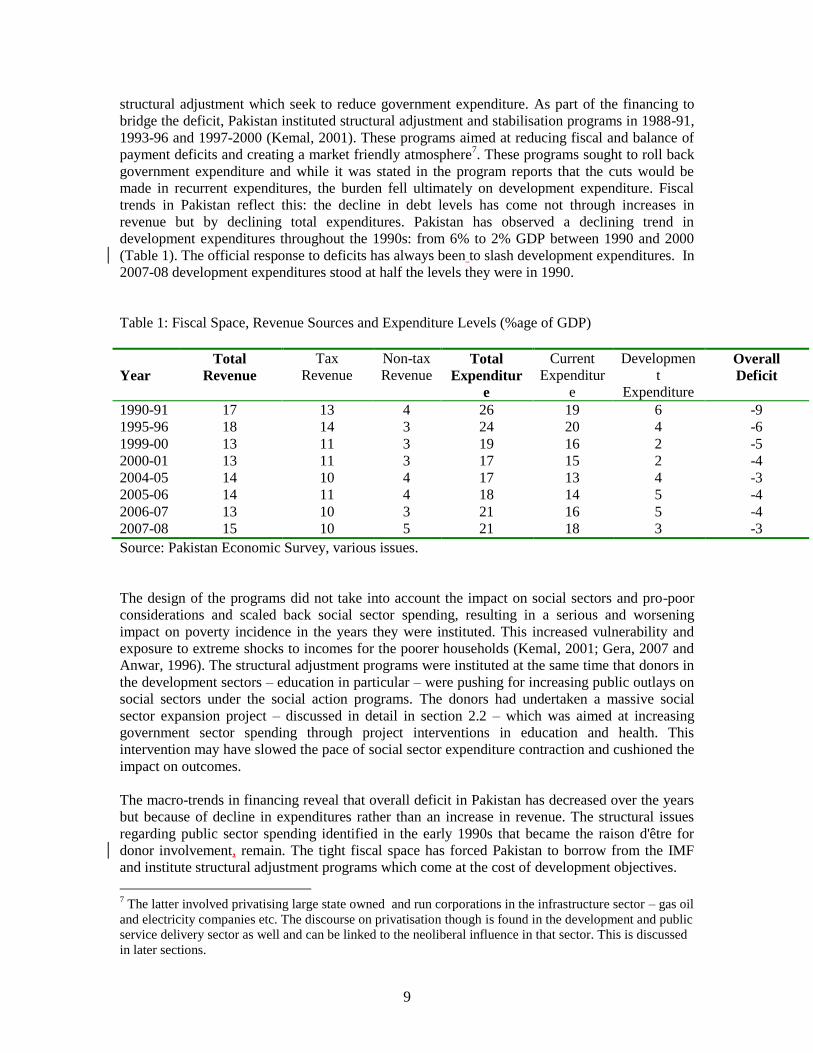
structural adjustment which seek to reduce government expenditure. As part of the financing to
bridge the deficit, Pakistan instituted structural adjustment and stabilisation programs in 1988-91,
1993-96 and 1997-2000 (Kemal, 2001). These programs aimed at reducing fiscal and balance of
payment deficits and creating a market friendly atmosphere7. These programs sought to roll back
government expenditure and while it was stated in the program reports that the cuts would be
made in recurrent expenditures, the burden fell ultimately on development expenditure. Fiscal
trends in Pakistan reflect this: the decline in debt levels has come not through increases in
revenue but by declining total expenditures. Pakistan has observed a declining trend in
development expenditures throughout the 1990s: from 6% to 2% GDP between 1990 and 2000
(Table 1). The official response to deficits has always been to slash development expenditures. In
2007-08 development expenditures stood at half the levels they were in 1990.
Table 1: Fiscal Space, Revenue Sources and Expenditure Levels (%age of GDP)
Year
Total
Revenue
Tax
Revenue
Non-tax
Revenue
Total
Expenditur
e
Current
Expenditur
e
Developmen
t
Expenditure
Overall
Deficit
1990-91 17 13 4 26 19 6 -9
1995-96 18 14 3 24 20 4 -6
1999-00 13 11 3 19 16 2 -5
2000-01 13 11 3 17 15 2 -4
2004-05 14 10 4 17 13 4 -3
2005-06 14 11 4 18 14 5 -4
2006-07 13 10 3 21 16 5 -4
2007-08 15 10 5 21 18 3 -3
Source: Pakistan Economic Survey, various issues.
The design of the programs did not take into account the impact on social sectors and pro-poor
considerations and scaled back social sector spending, resulting in a serious and worsening
impact on poverty incidence in the years they were instituted. This increased vulnerability and
exposure to extreme shocks to incomes for the poorer households (Kemal, 2001; Gera, 2007 and
Anwar, 1996). The structural adjustment programs were instituted at the same time that donors in
the development sectors – education in particular – were pushing for increasing public outlays on
social sectors under the social action programs. The donors had undertaken a massive social
sector expansion project – discussed in detail in section 2.2 – which was aimed at increasing
government sector spending through project interventions in education and health. This
intervention may have slowed the pace of social sector expenditure contraction and cushioned the
impact on outcomes.
The macro-trends in financing reveal that overall deficit in Pakistan has decreased over the years
but because of decline in expenditures rather than an increase in revenue. The structural issues
regarding public sector spending identified in the early 1990s that became the raison d'être for
donor involvement, remain. The tight fiscal space has forced Pakistan to borrow from the IMF
and institute structural adjustment programs which come at the cost of development objectives.
7 The latter involved privatising large state owned and run corporations in the infrastructure sector – gas oil
and electricity companies etc. The discourse on privatisation though is found in the development and public
service delivery sector as well and can be linked to the neoliberal influence in that sector. This is discussed
in later sections.

10
1.2 Gaps in commitments and actual expenditures
Apart from low allocations, actual expenditures on education have fallen short of budgetary
commitments at all levels (primary, secondary etc.) in each planning phase since the 1950s.
During the 1950s and 60s less than 50% of the amount committed was spent at the primary level.
However, as the utilisation capacity of the state sector has improved, the gap between allocations
and expenditures has declined. During the 1980s and through to the 1990s, between 63 to 71% of
the amount allocated was realised as expenditure for primary education (GoP, 1998).
Figure 1 shows the trend in the gap between allocations and actual expenditures. The target of 4%
of GDP was set in 1992, then again in 1998 and in 2006. This level of allocation has yet to be
realised. Education policy papers (GoP, 1992, 1998) as well as development plans have projected
steady increases in allocations that fail to materialise. The GoP (1992) projected expenditure
allocation to increase to 2.8 % from 2.2% of GDP between 1992-2002. These targets were reset
by the NEP 1998: allocations to increase from 2.2% in 1998 to 4% by 2002-038. However, policy
documents in 2005-06 revealed that the actual expenditures incurred (amounts invested) in 1998
and 2002-03 were only 1.8% of GDP (Aly, 2006).
Figure 1: Gaps in projections and actual expenditure on education (%age of GDP) between 1990-
2016
Source: Author’s own construction based on MoE statistics; NEP, 1992, 998.
8 The GDP growth rate that the calculations are based on was assumed to be 7% in 1992 (constant for the next 10
years) and 6% from 1998 (constant for next 10 years). The actual expenditures for each year since 1992 were
made from a smaller pie than that which the allocations were based on.

11
A white paper on ‘education policy priorities’ predicted an increase in resource allocation to 4%
of GDP by 2010 and 6% by 2015. This is unlikely to be met. The paper, however, acknowledges
potential pitfalls:
“Total public sector investment will need to be agreed to by the Ministry of Finance and
the Planning Commission and the shares between the provinces and the federal
governments guaranteed bilaterally. The targets to achieve goals and objectives of the
education policy may be alternated in size and timelines, if the funds as projected are not
guaranteed/ available” (Aly, 2006).
There is an additional and interlinked issue of absorptive capacity. Actual expenditures incurred
are low because the state apparatus in the various ministries and policy implementation
arms/agencies lack the capacity to undertake the scale and pace of work required. Watson and
Khan (2005) attribute the lack of success in building capacity for governance and inefficient
public service delivery partially to the donors. Donors have stated building capacity at the
provincial and district levels as their express goal, but certain modalities of project
implementation such as project management units (that take government employees out of their
regular jobs) are contradictory to the stated objective (King and Malik, 2008).
1.3 Intra-sectoral priorities
Social sectors have competed with the defence sector and debt repayment for a share of
government revenues. Historically, expenditure on defence has claimed the largest share of total
public expenditure (Table 1 – 22% in 1997-98), crowding out the social sectors. However, since
the early 1990s, debt repayments on national and international loans have claimed the largest
portion of the government’s revenues (34% in 1997-98). For every dollar of public expenditure
spent on social sectors, Pakistan spent more than four dollars on defence and debt servicing in
1997-98. Nearly half of Pakistan’s debt in the same year was financed through external
borrowing (19% higher than in 1980) and the domestic debt exceeded 40% of GDP (MHHDC,
1999).
Table 2: Expenditure Priorities: Public Expenditure on Education, Defence and Debt Re-servicing
(%age of GDP)
Education Expenditure Defence Expenditure Debt Re-servicing
1995 2.8 5.3 5.3
1996 3.0 5.1 5.2
1997 2.7 4.9 6.5
1998 2.0 4.8 3.7
1999 2.6 3.9 4.7
2000 1.8 3.7 3.9
2001 1.8 3.9 4.2
2002 1.8 3.9 4.0
2003 2.0 3.7 3.7
2004 2.0 3.6 4.4
2005 2.3 3.5 2.2
Source: MHHDC, 2008; PRSP II, 2009.
12
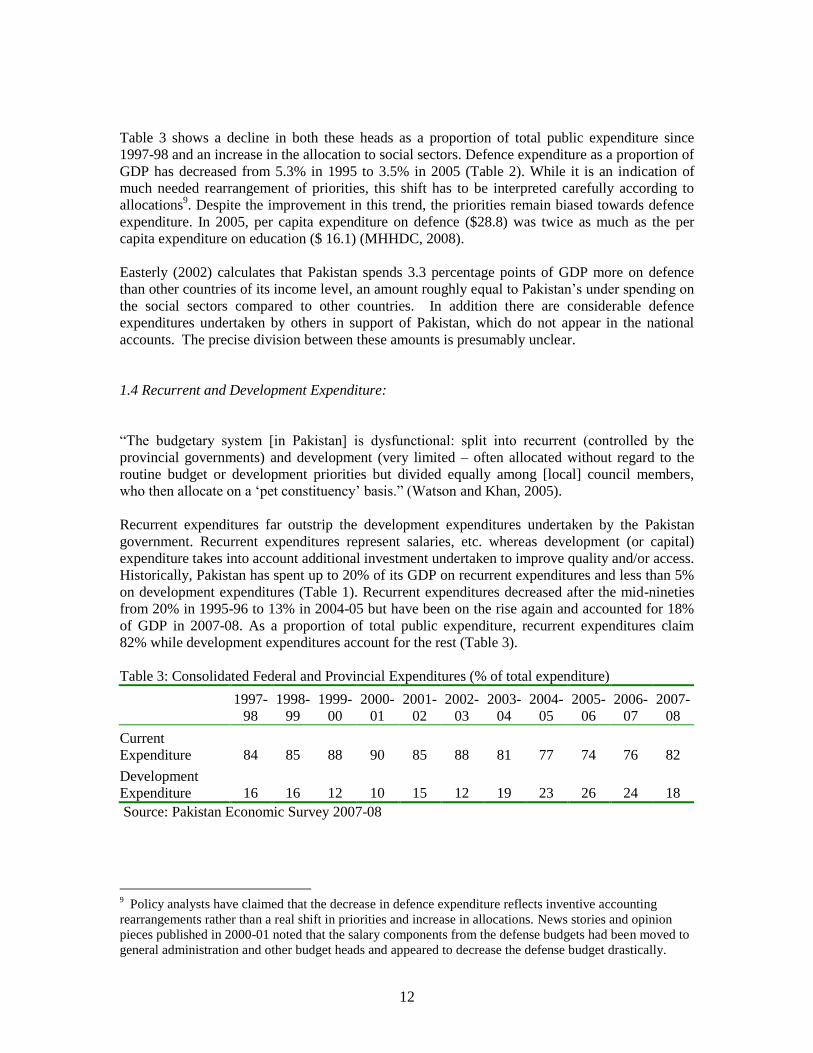
Table 3 shows a decline in both these heads as a proportion of total public expenditure since
1997-98 and an increase in the allocation to social sectors. Defence expenditure as a proportion of
GDP has decreased from 5.3% in 1995 to 3.5% in 2005 (Table 2). While it is an indication of
much needed rearrangement of priorities, this shift has to be interpreted carefully according to
allocations9. Despite the improvement in this trend, the priorities remain biased towards defence
expenditure. In 2005, per capita expenditure on defence ($28.8) was twice as much as the per
capita expenditure on education ($ 16.1) (MHHDC, 2008).
Easterly (2002) calculates that Pakistan spends 3.3 percentage points of GDP more on defence
than other countries of its income level, an amount roughly equal to Pakistan’s under spending on
the social sectors compared to other countries. In addition there are considerable defence
expenditures undertaken by others in support of Pakistan, which do not appear in the national
accounts. The precise division between these amounts is presumably unclear.
1.4 Recurrent and Development Expenditure:
“The budgetary system [in Pakistan] is dysfunctional: split into recurrent (controlled by the
provincial governments) and development (very limited – often allocated without regard to the
routine budget or development priorities but divided equally among [local] council members,
who then allocate on a ‘pet constituency’ basis.” (Watson and Khan, 2005).
Recurrent expenditures far outstrip the development expenditures undertaken by the Pakistan
government. Recurrent expenditures represent salaries, etc. whereas development (or capital)
expenditure takes into account additional investment undertaken to improve quality and/or access.
Historically, Pakistan has spent up to 20% of its GDP on recurrent expenditures and less than 5%
on development expenditures (Table 1). Recurrent expenditures decreased after the mid-nineties
from 20% in 1995-96 to 13% in 2004-05 but have been on the rise again and accounted for 18%
of GDP in 2007-08. As a proportion of total public expenditure, recurrent expenditures claim
82% while development expenditures account for the rest (Table 3).
Table 3: Consolidated Federal and Provincial Expenditures (% of total expenditure)
1997-
98
1998-
99
1999-
00
2000-
01
2001-
02
2002-
03
2003-
04
2004-
05
2005-
06
2006-
07
2007-
08
Current
Expenditure 84 85 88 90 85 88 81 77 74 76 82
Development
Expenditure 16 16 12 10 15 12 19 23 26 24 18
Source: Pakistan Economic Survey 2007-08
9 Policy analysts have claimed that the decrease in defence expenditure reflects inventive accounting
rearrangements rather than a real shift in priorities and increase in allocations. News stories and opinion
pieces published in 2000-01 noted that the salary components from the defense budgets had been moved to
general administration and other budget heads and appeared to decrease the defense budget drastically.

13
Within the education sector, recurrent expenditure accounted for 80% and 70% of total
expenditure for the 7th
(1988-93) and 8th (1993-98) five-year plans respectively (NEP, 1998).
Table 4 shows the trend in development and recurrent expenditure shares of GDP for the
education sector. In the year 1997-98, 88% of total expenditure on education was under the
recurrent head whereas 12% was classified as development expenditure.
The proportion of recurrent and development expenditures is more significantly skewed at the
provincial level (Figure 210
). As an example, more than 90% of total expenditure is recurrent.
The provincial governments have discretionary space of only 10% to invest in development
projects for the education sector.
Table 4: Recurrent Versus Development Expenditure within the education sector
Development
(Rs. blns)
Recurrent
Rs (blns)
Total
Rs. (blns)
Total (%
GDP)
Development
(%age Total)
Recurrent
(% Total)
1990-91 4.3 18.1 22.3 2.1 19 81
1991-92 3.9 23.6 27.5 2.2 14 86
1992-93 5.4 24.6 30 2.2 18 82
1993-94 4.9 29.9 34.8 2.2 14 86
1994-95 6.3 37.8 44.1 2.4 14 86
1995-96 7.5 45.1 52.6 2.4 14 86
1996-97 12.7 51.8 64.5 2.6 20 80
1997-98 7.6 56.4 64.1 2.3 12 88
1998-99 6.3 62.3 68.6 2.2 9 91
1999-
2000 7.7 63.44 71.1 2.1 11 89
2000-01 6.4 69.5 75.9 1.8 8 92
2001-02 8.5 70.4 78.9 1.8 11 89
2002-03 10.4 79.5 89.9 1.9 12 88
2003-04 29.9 94.3 124.2 2.2 24 76
2004-05 33.4 106.6 140 2.2 24 76
2005-06 41.9 128.9 170.8 2.2 25 75
2006-07 56.6 159.9 216.5 2.5 26 74
2007-08 63.5 190.2 253.7 2.5 25 75
2008-09* 75.1 200.4 275.5 2.1 27 73
Some literature links reduction in levels of recurrent expenditure to increases in GERs. It is
difficult to judge whether development or recurrent expenditures are more productive and
desirable11
. In the education sector recurrent expenditures can often be more productive than
development expenditures in cases where tiny proportions of the recurrent budget are spent upon
10 The proportions in the figure do not match the proportion in Table 4. This is one example of the lack of consistency
of data from different sources. The inconsistency may be caused by differing calculation techniques. 11
Colclough with Lewin (1993) provide a schema whereby reducing per capita recurrent expenditure, while keeping
per pupil cost the same, results in an increase in enrolments. Any increase in total expenditure then improves access for
new enrolments rather than increasing expenditure on current students. Based on this schema the authors suggest likely
policy changes required to achieve UPE and SFA. Such calculations are outside the scope of this paper due to limited
data availability. However, some basic calculations for Pakistan show that recurrent expenditure per student at the
primary in Pakistan has risen between 1992 and 1998 and not declined. As data on costs is not available to us, it is
difficult to say whether the increase in recurrent expenditure in Pakistan may have resulted in higher enrolments.

14
items such as learning materials or books. Increasing such amounts can often be much more
important than building another school store room or classroom. Similarly, if teacher morale is
low and absenteeism is high, improvements to salaries may be more desirable than more
development spending in some cases. It is contingent upon the particular constraints that are
holding back education from doing a better job. However, these are not unusual proportions as
development spending is almost always substantially smaller than recurrent, and these data for
Pakistan are not in themselves problematic.
1.5 Priorities within the education budget
Financial allocations (eg as a proportion of GNP) can serve as indicators of the priority given to
the sector by the state. Allocations made to sub-sectors (primary, secondary etc.) as a proportion
of total expenditure on education can also be indicative of policy priorities.
Table 5: Prioritising spending: sub-sectoral allocation as a %age of total expenditure on education
Primary Secondary Teacher Training
1955-60 17 22 7.6
1960-65 16 20 3.5
1970-78 16 17 17
1978-83 28 30 3.5
1983-88 37 21 1.6
1988-93 45 28 1.3
1993-98 47 24 4.9
1998-2003 58 28 1.6
Source: Pakistan Education Policy 1998-2010;
Table 5 shows the allocations of state resources to different sub-sectors within the education
sector. The primary sector received 17% of total allocations to education in the 1950s. But by the
early 90s this had increased to 47% and during the period 1998-2003 almost 60% of total
resources were being allocated to this sector. The 8th five-year plan (1993-98) set aside a total of
Rs. 228 billion for the education sector of which 47% was for the primary sector. Nearly half of
the development expenditure in this five-year period was to be incurred for the donor driven SAP
projects (47.3% of the PSDP budget was SAP component). In comparison, secondary education
has received less than 30% of total expenditure.
By way of priorities, teacher training has received very little: 7.6% of total government
expenditure was allocated to this head in the 1950s but for almost three decades since the 1970s,
teacher training has received less than 2% of total government spending. It should be noted
however, that almost all teacher-training programs since the 1990s have been undertaken by the
donors as projects.
In developing countries, the majority of resources are tied up in salary expenditure. This is true
for Pakistan also (See Table 6). Spending on social services as a whole is heavily concentrated in
spending on the salaries of providers. The relatively low non-salary expenditures on education in
the 1990s, were additionally sqeezed by the slow down in development spending.
15
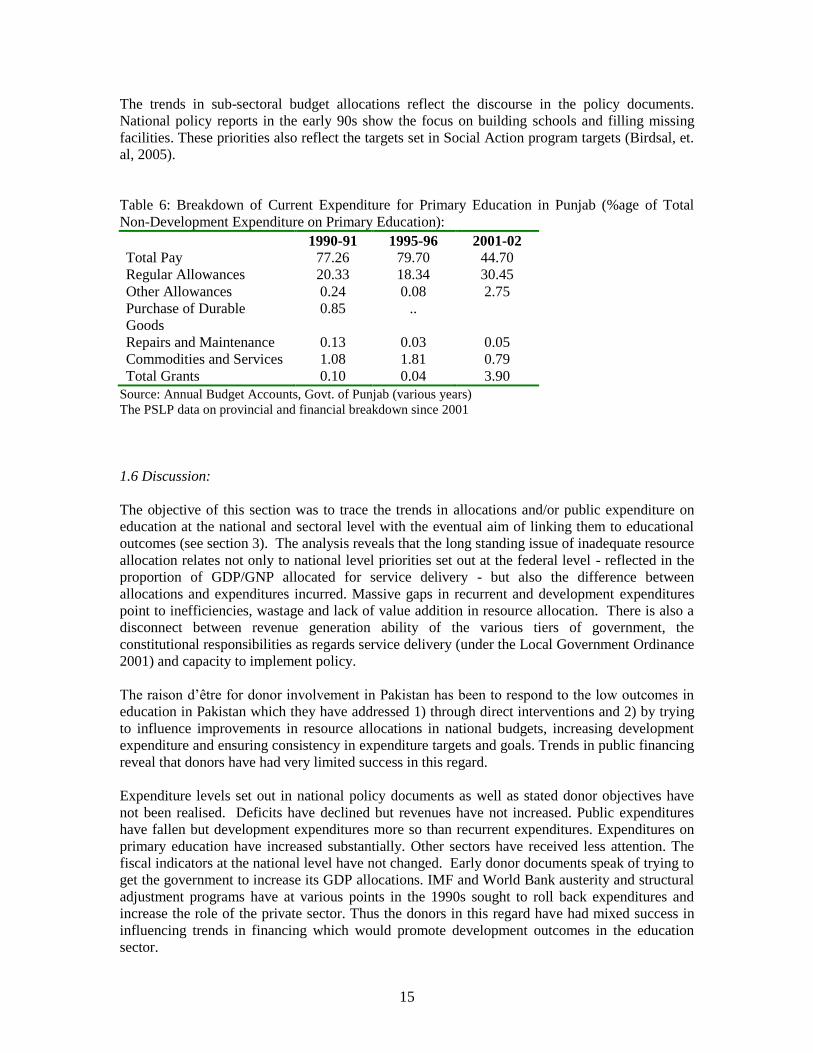
The trends in sub-sectoral budget allocations reflect the discourse in the policy documents.
National policy reports in the early 90s show the focus on building schools and filling missing
facilities. These priorities also reflect the targets set in Social Action program targets (Birdsal, et.
al, 2005).
Table 6: Breakdown of Current Expenditure for Primary Education in Punjab (%age of Total
Non-Development Expenditure on Primary Education):
1990-91 1995-96 2001-02
Total Pay 77.26 79.70 44.70
Regular Allowances 20.33 18.34 30.45
Other Allowances 0.24 0.08 2.75
Purchase of Durable
Goods
0.85 ..
Repairs and Maintenance 0.13 0.03 0.05
Commodities and Services 1.08 1.81 0.79
Total Grants 0.10 0.04 3.90
Source: Annual Budget Accounts, Govt. of Punjab (various years)
The PSLP data on provincial and financial breakdown since 2001
1.6 Discussion:
The objective of this section was to trace the trends in allocations and/or public expenditure on
education at the national and sectoral level with the eventual aim of linking them to educational
outcomes (see section 3). The analysis reveals that the long standing issue of inadequate resource
allocation relates not only to national level priorities set out at the federal level - reflected in the
proportion of GDP/GNP allocated for service delivery - but also the difference between
allocations and expenditures incurred. Massive gaps in recurrent and development expenditures
point to inefficiencies, wastage and lack of value addition in resource allocation. There is also a
disconnect between revenue generation ability of the various tiers of government, the
constitutional responsibilities as regards service delivery (under the Local Government Ordinance
2001) and capacity to implement policy.
The raison d’être for donor involvement in Pakistan has been to respond to the low outcomes in
education in Pakistan which they have addressed 1) through direct interventions and 2) by trying
to influence improvements in resource allocations in national budgets, increasing development
expenditure and ensuring consistency in expenditure targets and goals. Trends in public financing
reveal that donors have had very limited success in this regard.
Expenditure levels set out in national policy documents as well as stated donor objectives have
not been realised. Deficits have declined but revenues have not increased. Public expenditures
have fallen but development expenditures more so than recurrent expenditures. Expenditures on
primary education have increased substantially. Other sectors have received less attention. The
fiscal indicators at the national level have not changed. Early donor documents speak of trying to
get the government to increase its GDP allocations. IMF and World Bank austerity and structural
adjustment programs have at various points in the 1990s sought to roll back expenditures and
increase the role of the private sector. Thus the donors in this regard have had mixed success in
influencing trends in financing which would promote development outcomes in the education
sector.
16
Section 2: Aid to the Education in Pakistan
The closer link between aid financing and educational outcome is the after-effect of the Jomtien
conference in 1990 which set the outcome and financing targets for the education sectors in the
developing world and the Dakar Education Conference 2000 where the international community
revised targets and committed itself to providing the necessary financial support to countries with
viable plans for achieving EFA. In the given global context, the education sector in Pakistan has
also received attention from the international community to provide basic quality education to its
citizens. The shifting dynamics of international aid worldwide have also been reflected in the
modalities of aid to education and the priorities associated with the aid to Pakistan.
Aid disbursements, although a small proportion of total public expenditure on education, have
played a pivotal role in education policy making in Pakistan. This was made possible through
conditionalities attached to the monies and in the 1990s through project aid modalities that
allowed direct interventions. Trends in aid receipts have also been highly influenced by
geopolitical factors.
This section provides trends of international aid to education in Pakistan, and its respective share
in total expenditure on education by the government as well as in the total Overseas Development
Assistance (ODA) for Pakistan. It also attempts to highlight the role of foreign aid in financing
development expenditure on education in Pakistan. Trends in the sub-sectoral allocation of aid to
education are also discussed. A brief overview of the nature of aid to education, the respective
share of bilateral and multilateral aid, and that of grants and loans is also provided. The
discussion in this section is mainly based upon a unique consolidated data set on aid inflows from
the Ministry of Economic Affairs and Statistics, Government of Pakistan. The dates provide a
useful marker of two phases - the 90s decade and the post 2000 phase – of donor involvement in
Pakistan.
2.1 Trends in Aid to Education in Pakistan
Low revenue generating capacity, poor resource allocation to the education sector, and
consequently the poor educational outcomes provide the space for a great role to be played by
international aid in the education sector of the country. International aid has played an important
role in influencing educational policy and priorities in Pakistan mainly by attaching
conditionalities to the monies, and in the 1990s through project aid modalities that allowed for
direct interventions. However, a brief look at the trends in the overall inflow of international aid
to Pakistan suggests that geo-political developments and frequently changing political regimes
make the overall international aid an often fluctuating and less than reliable resource.

17
Figure 2: Trends in aid dependency (1990-2006): ODA as a proportion of GNI and Central
Government Expenditure
Source: WDI 2006
As shown in Figure 2, the Official Development Assistance (ODA) over the given time period
(1990-2006), on the average, makes 1.9 percent of the Gross National Income (GNI) and finances
more than 10 percent of the total expenditure by the central government (WDI 2006). There are
however, considerable fluctuations in aid inflows to Pakistan over the years under study, with
foreign aid financing ranging from the lowest level of only 5.1 per cent of central government
expenditure in 1997 to the highest level of and 17.6 per cent in 2001. These fluctuations in
foreign aid may partly be because of the frequently changing political regimes and unstable
governments. The level of foreign aid remained significantly high during Nawaz Sharif’s first
government (1990-94) – when the massive Social Action Programme was started that attracted
large donor funds. The subsequent political instability was also reflected in the aid inflows that
started falling during Benazir Bhutto’s tenure (1994-97). During the second tenure of Nawaz
Sharif (1997-99), overall foreign aid fell to as low as 6.5 percent of total central expenditure by in
1999 due to the US imposed sanctions on Pakistan following nuclear explosions. The inflow of
foreign aid remained low during the first two years of the Musharraf regime; however, following
the aggressive involvement of USA in the region after 9-11, and the earthquake in Pakistan,
foreign aid hiked up to 17.6 percent of the total expenditure by the central government in 2001.
From the year 2001 to 2006, foreign aid, on the average, financed 12.2 percent of the total
expenditure by the central government.
A quick glance , for the year 2005, suggests Pakistan is relatively less aid dependent (1.5 % of
GDP) comparative to most of the countries in South Asia such as Bangladesh (2.2%), Nepal
18
(5.8%), Sri Lanka (5.1%), Bhutan (10.7%), with an exception of India, where it is as low as 0.2%
of GDP (MHHDC, 2008). Pakistan also appears to be, in terms of amount of money flowing in as
assistance, relatively less dependent on aid than some of its developing counterparts in Africa.
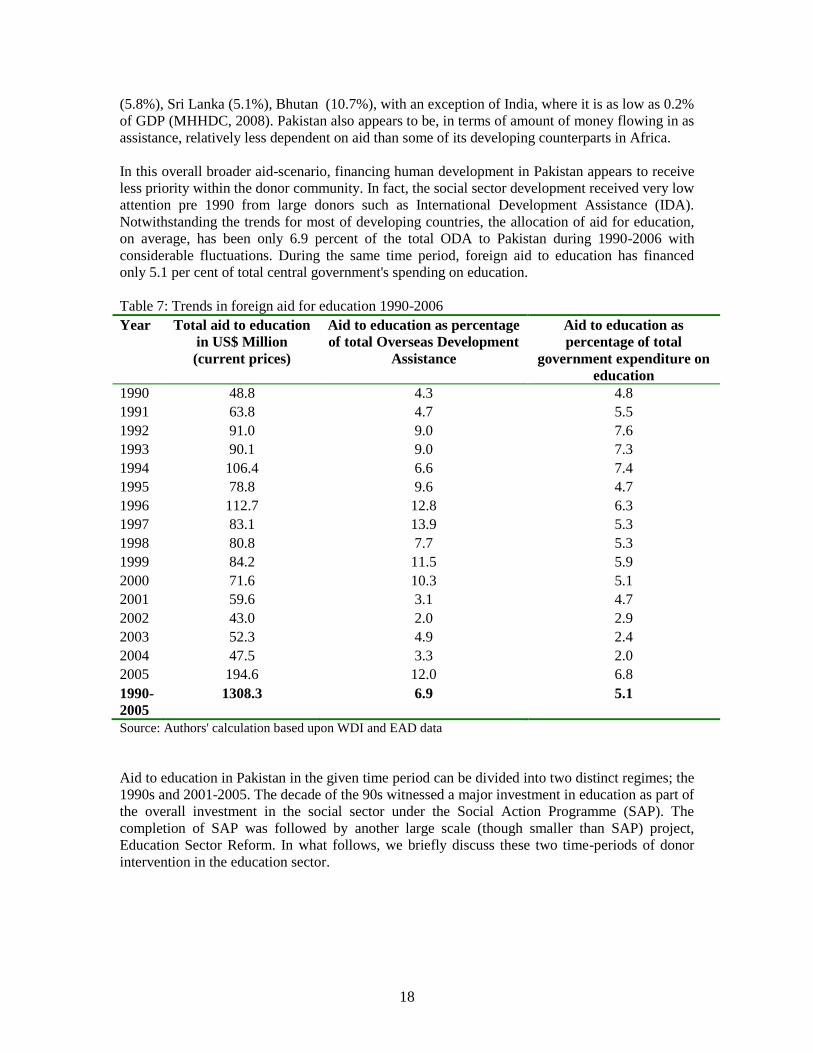
In this overall broader aid-scenario, financing human development in Pakistan appears to receive
less priority within the donor community. In fact, the social sector development received very low
attention pre 1990 from large donors such as International Development Assistance (IDA).
Notwithstanding the trends for most of developing countries, the allocation of aid for education,
on average, has been only 6.9 percent of the total ODA to Pakistan during 1990-2006 with
considerable fluctuations. During the same time period, foreign aid to education has financed
only 5.1 per cent of total central government's spending on education.
Table 7: Trends in foreign aid for education 1990-2006
Year Total aid to education
in US$ Million
(current prices)
Aid to education as percentage
of total Overseas Development
Assistance
Aid to education as
percentage of total
government expenditure on
education
1990 48.8 4.3 4.8
1991 63.8 4.7 5.5
1992 91.0 9.0 7.6
1993 90.1 9.0 7.3
1994 106.4 6.6 7.4
1995 78.8 9.6 4.7
1996 112.7 12.8 6.3
1997 83.1 13.9 5.3
1998 80.8 7.7 5.3
1999 84.2 11.5 5.9
2000 71.6 10.3 5.1
2001 59.6 3.1 4.7
2002 43.0 2.0 2.9
2003 52.3 4.9 2.4
2004 47.5 3.3 2.0
2005 194.6 12.0 6.8
1990-
2005
1308.3 6.9 5.1
Source: Authors' calculation based upon WDI and EAD data
Aid to education in Pakistan in the given time period can be divided into two distinct regimes; the
1990s and 2001-2005. The decade of the 90s witnessed a major investment in education as part of
the overall investment in the social sector under the Social Action Programme (SAP). The
completion of SAP was followed by another large scale (though smaller than SAP) project,
Education Sector Reform. In what follows, we briefly discuss these two time-periods of donor
intervention in the education sector.
19
2.2 Influence of aid – Two eras of donor involvement
Prior to the 1990s, the aid to education in Pakistan has mostly been in the form of standalone
projects, funded by various multilateral and bilateral donors. However, as the discourse on
international aid to education in the early 1990s came to realize the need for a Sector Wide
Approach (SWAp)12
, using existing institutional mechanisms – taking a divergence from the
previous, parallel project-specific approaches - it was also reflected in the donor support to
education in Pakistan (such as the Country Assistance Strategy of the World Bank for Pakistan).
The Social Action Programme (henceforth, SAP) that was developed by the Government of
Pakistan was initially financially supported by the World Bank and was then joined by some
other multilateral and bilateral donor agencies through the establishment of a Multi-donor
Support Unit (MSU) (Asian Development Bank (ADB), Department for International
Development (DFID) of UK and the Netherland Government). It was implemented in two phases;
SAP – Ι (1992-1996) and SAP – ΙΙ (1997/98-2001/02). The SAP was aimed at reducing poverty
through improvement of the social sector by increased spending on basic education, primary
health care, reproductive health, and rural water supply and sanitation13
. The main education
related goals of the SAP were; a) to increase financing for primary education; b) to reduce gender
and rural-urban disparities; and c) the increased role of private sector in the provision of
education. The lessons learnt during 1980s emphasized upon investing in primary education to
eradicate poverty (Colclough 1982; Behrman 1990). This appreciation also guided the SAP
toward a strong focus on primary education. Trends in aid flows in Table 7 corroborate the
policy focus education – aid to education rose from 4.7% of total ODA in 1991 to 13.9 % in 1998
over the period of implementation of SAP I and II. Furthermore, the greater focus on primary
education is evident also from the trends in sub-sectoral allocations of aid money in Table 8: of
the total aid received in education, the primary sector received between 77 to 86 per cent yearly
during the period 1995 -2000.
Within the primary education sector, SAP emphasized; a) the construction of new schools and
renovation of the existing ones with focus on girls schools; b) the recruitment of additional
teachers with an emphasis upon female teachers; c) increased primary enrollment with emphasis
upon girls enrollment. The increased access to primary education, the reduction of gender and
rural-urban disparity in education, the greater role of private sector in education sector and
increased community participation also remained major targets of the programme.
In terms of aid modalities, SAP is considered a departure from the traditional project specific
interventions towards a SWAp in Pakistan, since it was a multi-donor programme which
emphasized various subsectors of education14
. Nonetheless, there remain serious institutional
12
Sector Wide Approaches (SWAps) in education aim at enabling development partners at the country
level to work jointly with the Government to review national education sector plans and priorities, as a
basis for pooling support through a sector budget or a general budget support process. Moreover SWAps in
education also emphasis upon all sectors of education such as basic, secondary, tertiary, vocational, etc. 13
It might be useful for the reader to keep in mind the respective share of government and donor agencies
in the overall SAP. In the first phase (1993-94 to 1996/97), government's actual spending on SAP for the
ach fiscal year, as percentage of GDP were 1.6, 1.6, 1.7, and 1.6 compared to aid financing of 0.2, 0.4, 0.4,
and 0.4 for each year (World Bank 1998). In the second phase (1997/98-2001/02), share of international aid
to SAP projects made 0.1 per cent of GDP for each year and government's contribution was 1.6, 1.5, 1.3,
1.3, and 1.4 per cent of GDP, respectively, during these five years (World Bank 2003) . 14
However, this claim is also contested by the critics on the basis that SAP and other interventions in the
education sector have heavily focused upon primary education (that differs from the notion of basic
education as highlighted in the Jometian or Dakar Conference) thus the prevalent modes are Sub Sector
Wide Approaches (SSWAp).

20
challenges to adopt SWAp in the education sector in Pakistan as there are a whole array of
ministries, departments, commissions, councils, and boards dealing with various subsectors of
education (King and Malik 2008). This institutional complexity increases the cost of coordination
for SWAp thus reducing efficiency. The SAP, which was a multi-donor project and emphasized
various sub-sectors of the education system, is considered to be the first example of SWAp in
Pakistan.
SAP had intended to increase the government's allocation of resources to the social sector.
However, the overall expenditure on education fell from 2.1% to 1.8% over the SAP period rather
than increasing. Donor intervention during this period and financing has been more successful in
achieving output targets (such as number of school buildings etc.) than larger outcomes (such as
overall resource allocation). Several independent and internal evaluations – the primary resource
for information - overwhelmingly classify SAP as an unsuccessful initiative due to several
reasons; one of the main ones being a lack of the government's institutional capacity to implement
an over-ambitious set of reforms (Bridsal Lewin and Ibrahim. 2005). Alongside the government's
inability to effectively carry out reforms, SAP was confronted with another, parallel set of
reforms, the Structural Adjustment Programme, funded by the World Bank and the International
Monetary Fund. The Structural Adjustment Programme was aimed at improving public sector
management, better expenditure allocation and higher revenue collection, deregulation of
economy and privatization of government enterprises, and trade reforms. While both Social
Action Programme and the Structural Adjustment Programme were claimed to be complimentary,
as the World Bank's document puts it "better public expenditure allocation and higher revenues
would augment resources for social sector expenditure", the impact of the Structural Adjustment
Programme has been negative on the SAP. It is highlighted in the literature that the Structural
Adjustment Programme had imposed a ban on hiring new teachers when a large number of new
schools were built across the country and there was a tremendous need for teaching staff.
The post-SAP period, informed by the criticism of SAP experience, witnessed significant changes
in the priorities associated with the aid to education. The concerns about education quality
attained the priority of the donors' interventions. Moreover, in terms of modalities, there was
again an increased reliance on "project" specific interventions with more focus on outcomes
(King and Malik 2008). The major financing of education through foreign aid, in the period 2001-
05, has been under the Government of Pakistan's Education Sector Reforms programme that was
financially supported by the USAID under the Strategic Objective Grants Agreement (SOGA).
The ESR/SOGA has the following seven objectives; a) increasing national literacy rates; b)
providing quality universal primary education for all (by increasing participation, reducing gender
disparity, improve primary school completion); c) improving the quality of education through
curricula reforms and teachers training and reforms in exams and assessment; d) improving
technical and vocational education at secondary and post secondary levels; e) strengthening the
higher education system in Pakistan; f) mainstreaming the madrassahs into Pakistan’s general
education system; g) expanding the public-private partnership in order to increase access to
quality. While the EAD data does not provide the sector-wide breakdown of the aid funding
under the ESR/SOGA project, the other available information suggests that basic education
received the major share of resources. Thus, the improvement of quality, the provision of basic
education, and the increase of public-private partnership received more focus in the projects
funded under the SOGA. To what extent ESR/SOGA succeeded in achieving its objectives is
difficult to measure as there are no evaluation studies available so far, apart from some internal
documents. It is also pertinent to mention here that ESR/SOGA, despite being the major donor
intervention, was not the only one in the post-SAP era. Instead several other bilateral and

21
multilateral donors continued supporting the education sector of Pakistan using a variety of aid
modalities including direct budgetary support to sector-specific areas. The relative share of
multilateral and bilateral support to education during these years is provided in the Annex.
In brief, donor support to education during the period under study has strongly focused on the
increased access to basic education, removing gender and regional disparity, improving the
quality of education and the increased role of the private sector in education. This recap will help
us analyse the outcomes of aid to education in the last section of this paper.
2.3 Sub-sectoral breakdown of aid to education
Table 8 and Figure 3 show the sector-wide breakdown of aid to education in Pakistan from the
years 1994-95 to 2004-05. In-line with the discussion above, the table suggests that primary
education has received the largest share of foreign aid throughout the time period.
Table 8: Aid to education by sub-sector (a)
Year Primary
Education
Secondary
Education
Tertiary
Education
Vocational Teacher's
Training
Others* Total
1994-95 86.6 3.8 5.5 0.0 2.4 1.6 100
1995-96 77.9 0.9 15.6 0.0 4.2 1.3 100
1996-97 81.4 0.07 4.4 3.9 2.5 7.6 100
1997-98 85.9 0.1 4.9 1.3 6.7 1.1 100
1998-99 83.2 0.0 5.9 8.4 0.5 2.0 100
1999-00 79.3 0.8 6.4 0.0 2.4 11.0 100
2000-01 85.3 3.2 6.5 4.6 0.4 0.0 100
2001-02 61.9 17.0 12.4 6.5 0.3 1.9 100
2002-03 50.5 9.9 0.5 13.9 0.01 25.1 100
2003-04 38.7 11.8 2.5 13.2 0.0 33.6 100
2004-05 21.9 8.6 2.5 2.7 0.0 64.3 100
2005-06 10.1 1.9 2.1 0.5 0.0 85.3 100
Source: Authors' calculation based upon EAD data

22
Figure 3: Aid to education by sub-sector (b)
During the SAP years, the allocation of foreign aid to primary education remained higher than 80
per cent of total aid to education, followed by very small proportions spent on tertiary education,
teachers' training, and other sub-sectors. As one of the major objectives of SAP was to increase
access to primary education, particularly in rural areas, thousands of new schools were
constructed and the infrastructure/facilities at the existing schools were improved. This is well
reflected in the table and figure above with very high shares of aid spent on primary education.
There is an apparent decline in the proportion of aid to primary education in the post-SAP era that
is; a) partly because of the completion of SAP; and b) mainly because the sectoral breakdown of
aid under SOGA is not provided, so it is accounted for under the head of "others" which is
significantly inflated during the ESR/SOGA period. Nonetheless, given that basic education was
the priority under the ESR/SOGA project, primary education continued to be the major
beneficiary of foreign aid with a great emphasis placed on the quality of education. In the mean
time, teachers' training has also benefited from donor support throughout the period under study
(the ESR/SOGA has implemented sub-projects with emphasis upon teachers' training). In brief, in
line with the declaration of the Jomtien Conference and the Dakar Conference, donor assistance
to education in Pakistan has largely financed the subsector of primary education in Pakistan.
23
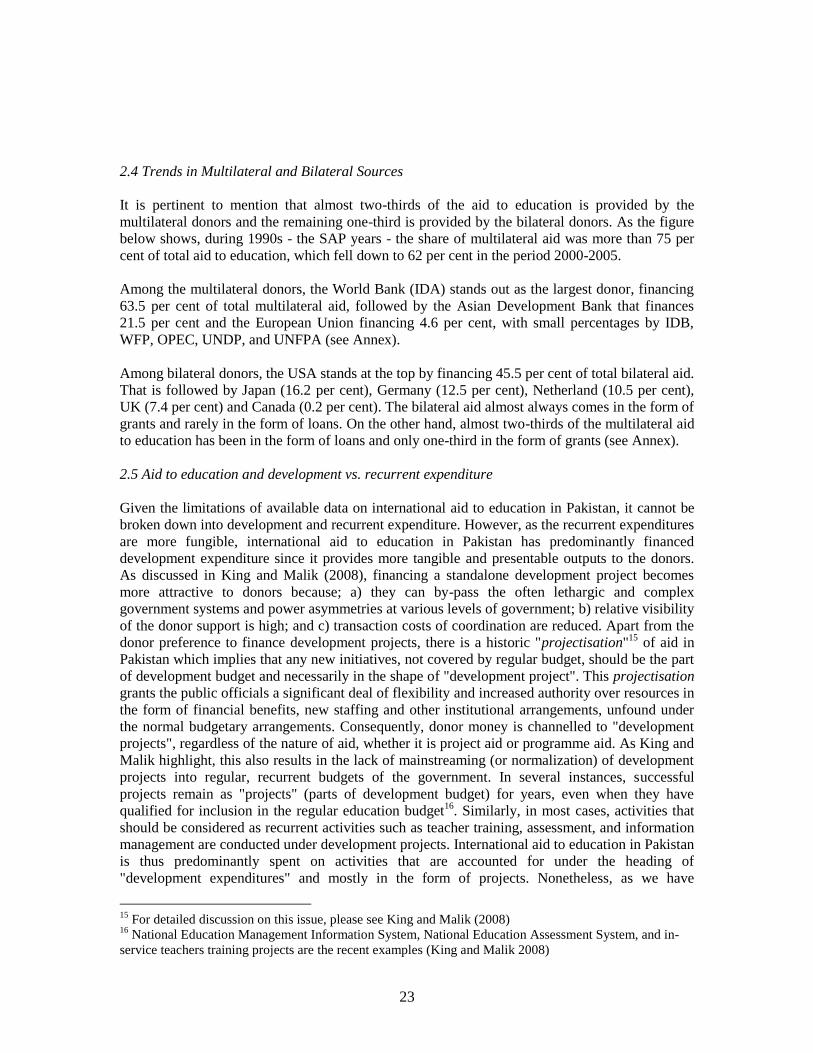
2.4 Trends in Multilateral and Bilateral Sources
It is pertinent to mention that almost two-thirds of the aid to education is provided by the
multilateral donors and the remaining one-third is provided by the bilateral donors. As the figure
below shows, during 1990s - the SAP years - the share of multilateral aid was more than 75 per
cent of total aid to education, which fell down to 62 per cent in the period 2000-2005.
Among the multilateral donors, the World Bank (IDA) stands out as the largest donor, financing
63.5 per cent of total multilateral aid, followed by the Asian Development Bank that finances
21.5 per cent and the European Union financing 4.6 per cent, with small percentages by IDB,
WFP, OPEC, UNDP, and UNFPA (see Annex).
Among bilateral donors, the USA stands at the top by financing 45.5 per cent of total bilateral aid.
That is followed by Japan (16.2 per cent), Germany (12.5 per cent), Netherland (10.5 per cent),
UK (7.4 per cent) and Canada (0.2 per cent). The bilateral aid almost always comes in the form of
grants and rarely in the form of loans. On the other hand, almost two-thirds of the multilateral aid
to education has been in the form of loans and only one-third in the form of grants (see Annex).
2.5 Aid to education and development vs. recurrent expenditure
Given the limitations of available data on international aid to education in Pakistan, it cannot be
broken down into development and recurrent expenditure. However, as the recurrent expenditures
are more fungible, international aid to education in Pakistan has predominantly financed
development expenditure since it provides more tangible and presentable outputs to the donors.
As discussed in King and Malik (2008), financing a standalone development project becomes
more attractive to donors because; a) they can by-pass the often lethargic and complex
government systems and power asymmetries at various levels of government; b) relative visibility
of the donor support is high; and c) transaction costs of coordination are reduced. Apart from the
donor preference to finance development projects, there is a historic "projectisation"15
of aid in
Pakistan which implies that any new initiatives, not covered by regular budget, should be the part
of development budget and necessarily in the shape of "development project". This projectisation
grants the public officials a significant deal of flexibility and increased authority over resources in
the form of financial benefits, new staffing and other institutional arrangements, unfound under
the normal budgetary arrangements. Consequently, donor money is channelled to "development
projects", regardless of the nature of aid, whether it is project aid or programme aid. As King and
Malik highlight, this also results in the lack of mainstreaming (or normalization) of development
projects into regular, recurrent budgets of the government. In several instances, successful
projects remain as "projects" (parts of development budget) for years, even when they have
qualified for inclusion in the regular education budget16
. Similarly, in most cases, activities that
should be considered as recurrent activities such as teacher training, assessment, and information
management are conducted under development projects. International aid to education in Pakistan
is thus predominantly spent on activities that are accounted for under the heading of
"development expenditures" and mostly in the form of projects. Nonetheless, as we have
15
For detailed discussion on this issue, please see King and Malik (2008) 16
National Education Management Information System, National Education Assessment System, and in-
service teachers training projects are the recent examples (King and Malik 2008)
24
discussed above, in the 1990s, foreign aid constituted the major part of the government's
development expenditure on education. While the emphasis on the post-SAP donor funded
education project has shifted towards an emphasis on the quality of education, foreign aid still
constitutes a major part of development expenditure in the education sector of the country.
Section 3: Impact of Public Financing - Trends in outcomes of education between 1990-2006
Assessing the impact of the public financing of education on educational outcomes, over a short
period of 16 years is a difficult task. There have been several other factors that might have
influenced the educational outcomes during this time period such as policy shifts, improvements
(or otherwise) in governance, changing political regimes with varying levels of commitments to
implement reforms, natural disasters, a volatile security situation, and so on. In this context,
public sector financing is merely one of the factors behind the variations in educational outcomes
over the years. Nonetheless, in a resource constrained economy, where allocation to education has
historically been very low, levels of financing have a great potential to affect the educational
outcomes. The provision of schools, hiring and training of teachers, improvements in the
curricula, advanced management information systems, performance monitoring – all need
financial resources. Thus financing becomes the crucial determinant of educational outcomes. In
the previous sections, we have analyzed trends in the public sector financing of education as well
as the international aid to education and how these compliment to each other. In this section, we
analyze the trends in educational outcomes during the period under study. Wherever possible, an
attempt is made to establish the link of educational outcomes and the financing of education, and
the reforms associated with education financing through aid.
Before we discuss the trends in educational outcomes, it is imperative to keep in mind that the
link between aid and education outcomes works through improvements in governance and policy,
and in changes to public sector fiscal behaviour. Franco-Rodriguez, Morrissey and McGillivray
(1998) analyse the impact of aid on public sector spending in Pakistan and finds it to be positively
correlated with investment and consumption spending by the public sector and has a negative
impact on tax effort. Nevertheless, attributing good or bad education outcomes to domestic or
donor spending remains a non-trivial problem. In recent years, with budget support becoming the
modality of choice for the larger international donors, the impact of public funding and aid is
harder to distinguish as government spending and donor spending has become indistinguishable.
In these circumstances to judge aid effectiveness is to judge public service delivery mechanisms
and absorptive capacity. Assessing the impact of development assistance on education outcomes
entails assessing the impact of policies being encouraged, directly through political influence and
indirectly through incentives and designs of aid policies, by international donors.
Outcomes of reforms and government policies are judged by their impact on measurable
standardised outcomes. Trends in literacy, gross and net enrolments, internal efficiency measures
and those of quality show improvements in service delivery since the 1990s but significant
gender, regional and rural-urban disparities remain.
3.1 Literacy Rates
While there have been improvements in the literacy rates over the years under study, these are
nonetheless, far less in comparison to the very high percentage of illiterates. Less progress has
been made in relation to the targets set in educational policies, of 72 per cent literacy rates in the
1992-2002 policy, and of doubling the literacy rates in the 1998 policy. As the figure below

25
suggests, almost 60 per cent of adults were illiterate in 1997. In 2004, their percentage is only
reduced to 50 per cent. Female literacy rates have been extremely low throughout the period. In
1997 only one-quarter of the female population was literate and in 2004 almost two-thirds are still
illiterate.
Figure 4: Trends in Literacy Rates (1997-2004)
4144 45 43 44 42
49 50
2529 30 28 29 29
35 36
0
10
20
30
40
50
60
1997 1998 1999 2000 2001 2002 2003 2004
Adult literacy rates Female Literacy rates
Source: WDI, 2008
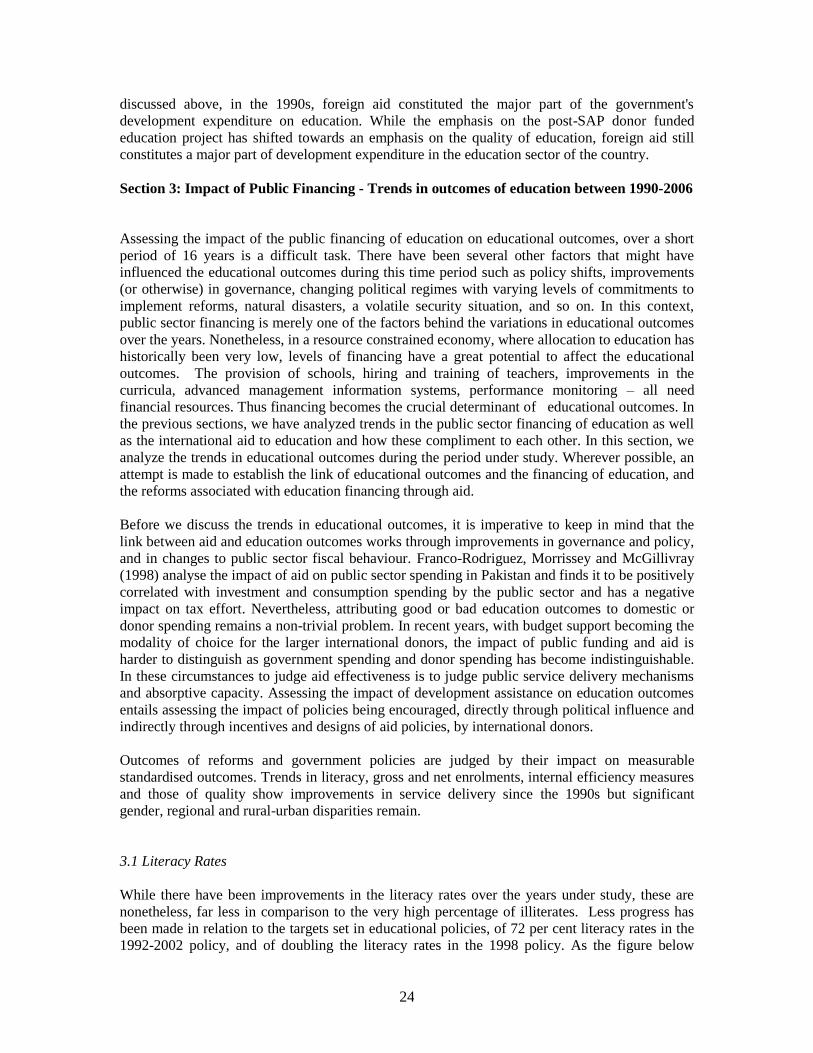
Literacy rates have improved – 41% adults were considered literate in 1997
compared to 50% in 2004. Gender parities remain in literacy achievements as well – more men as
compared to women are literate (Figure 5). As the picture shows, the gender gap in literacy,
particularly among the youth remains almost unchanged from 1998 to 2005.
Figure 5: Changes in Gender Parity in Literacy - 1998 and 2005
26
43.1
67.1
55.353.1
76.7
65.1
0.0
10.0
20.0
30.0
40.0
50.0
60.0
70.0
80.0
90.0
Female (% of females ages 15-24)
Male (% of males ages 15-24) Youth total (% of people ages 15-24)
1998 2005
Source: WDI, 2008; MHHDC, 2008
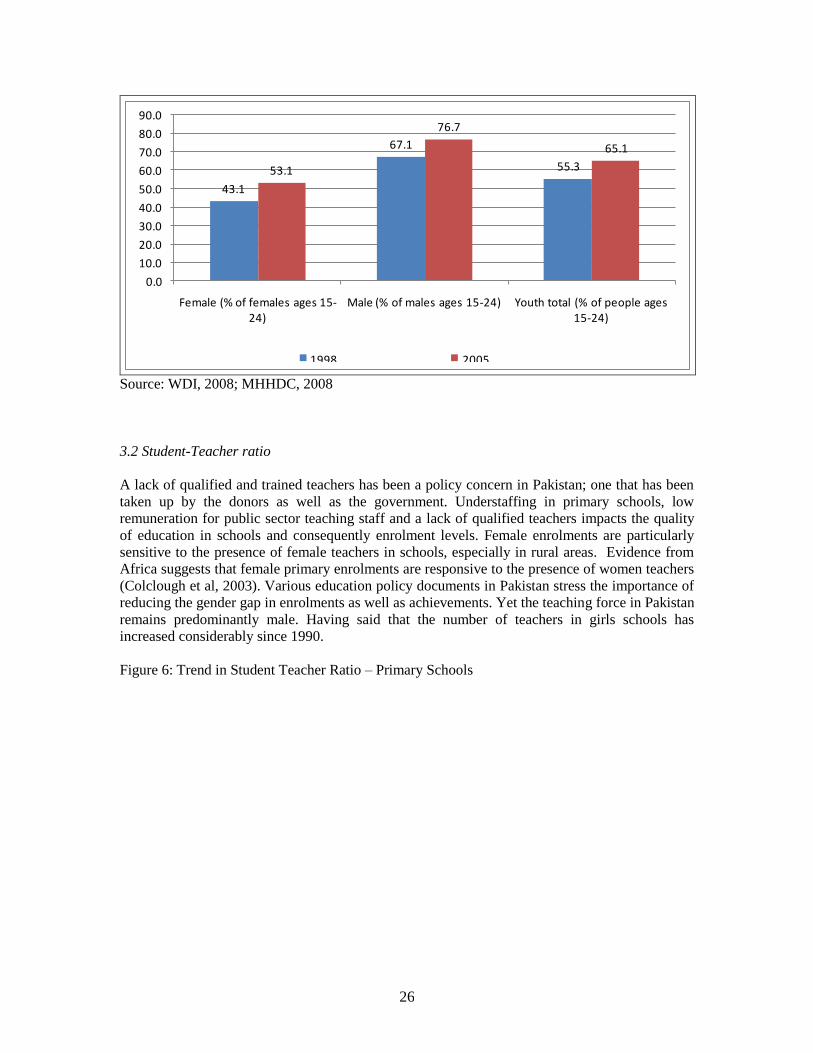
3.2 Student-Teacher ratio
A lack of qualified and trained teachers has been a policy concern in Pakistan; one that has been
taken up by the donors as well as the government. Understaffing in primary schools, low
remuneration for public sector teaching staff and a lack of qualified teachers impacts the quality
of education in schools and consequently enrolment levels. Female enrolments are particularly
sensitive to the presence of female teachers in schools, especially in rural areas. Evidence from
Africa suggests that female primary enrolments are responsive to the presence of women teachers
(Colclough et al, 2003). Various education policy documents in Pakistan stress the importance of
reducing the gender gap in enrolments as well as achievements. Yet the teaching force in Pakistan
remains predominantly male. Having said that the number of teachers in girls schools has
increased considerably since 1990.
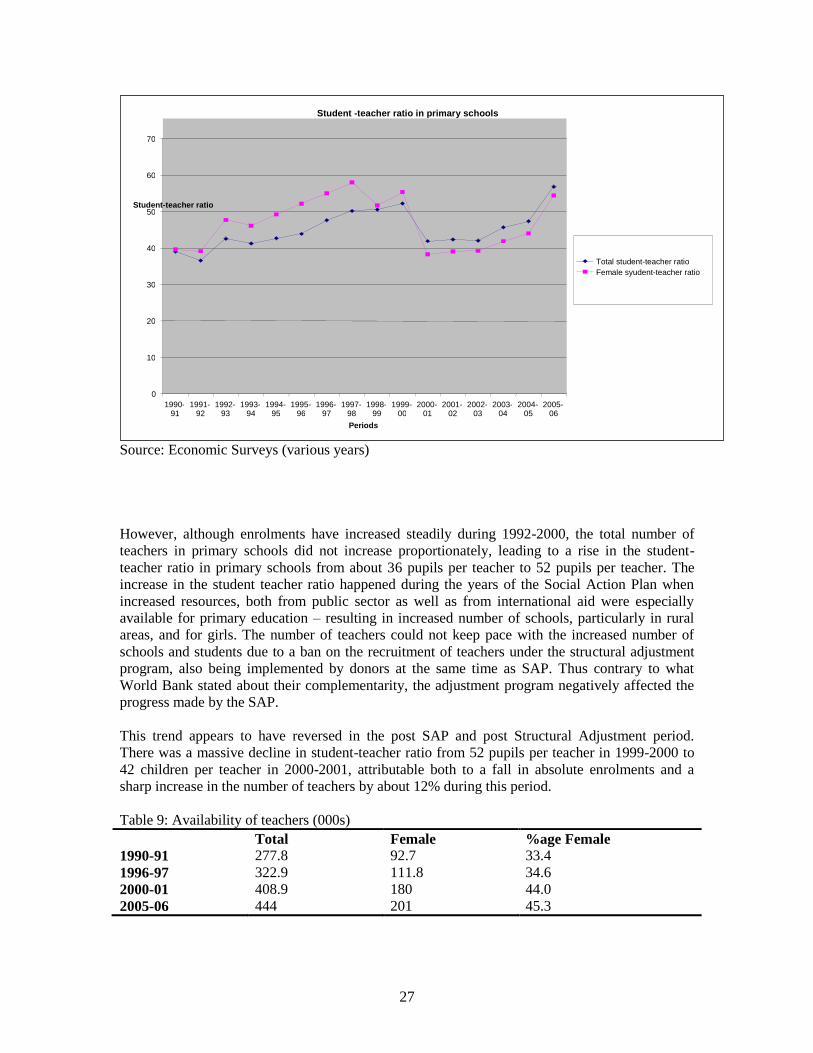
Figure 6: Trend in Student Teacher Ratio – Primary Schools
27
Source: Economic Surveys (various years)
However, although enrolments have increased steadily during 1992-2000, the total number of
teachers in primary schools did not increase proportionately, leading to a rise in the student-
teacher ratio in primary schools from about 36 pupils per teacher to 52 pupils per teacher. The
increase in the student teacher ratio happened during the years of the Social Action Plan when
increased resources, both from public sector as well as from international aid were especially
available for primary education – resulting in increased number of schools, particularly in rural
areas, and for girls. The number of teachers could not keep pace with the increased number of
schools and students due to a ban on the recruitment of teachers under the structural adjustment
program, also being implemented by donors at the same time as SAP. Thus contrary to what
World Bank stated about their complementarity, the adjustment program negatively affected the
progress made by the SAP.
This trend appears to have reversed in the post SAP and post Structural Adjustment period.
There was a massive decline in student-teacher ratio from 52 pupils per teacher in 1999-2000 to
42 children per teacher in 2000-2001, attributable both to a fall in absolute enrolments and a
sharp increase in the number of teachers by about 12% during this period.
Table 9: Availability of teachers (000s)
Total Female %age Female
1990-91 277.8 92.7 33.4
1996-97 322.9 111.8 34.6
2000-01 408.9 180 44.0
2005-06 444 201 45.3
Student -teacher ratio in primary schools
0
10
20
30
40
50
60
70
1990- 91
1991- 92
1992- 93
1993- 94
1994- 95
1995- 96
1996- 97
1997- 98
1998- 99
1999- 00
2000- 01
2001- 02
2002- 03
2003- 04
2004- 05
2005- 06
Periods
Student-teacher ratio
Total student-teacher ratio Female syudent-teacher ratio

28
The proportion of female teachers in particular has gone up from 33% of total to 45% during
1990 and 2006. The major increases have come particularly since the early 2000s.
3.3 The goal of Universal Primary Education (UPE)
Gross enrolment rates at the primary level have improved considerably in Pakistan from less than
50% in 1990 to almost 87% in 2005-06. Net enrolment rates, which represent the proportion of
enrolments of the correct school going age among children, have also shown improvement but at
a much lesser pace: net enrolments for primary level are at 53% in 2005-06. Thus, a little more
than half of the children of the correct age are in school. Low net enrolments, in comparison with
the total enrolled, signify a large proportion of over and underage children in the schooling
system and that the cycle of schooling is not being completed efficiently, thus increasing costs of
attaining policy targets and taking away from focusing resources on expansion and development.
Table 10: Trends in Primary and Secondary Gross and Net Enrolments
Primary Enrolments % Secondary Enrolments %
Gross Net Gross Net
1990 49 .. ..
1995 69 42 26 ..
1996 74 .. 26 16
1997 73 .. 42 ..
1998 86 .. 37 ..
1999 99 .. 33 ..
2000 75 67 29 16
2001 72 58 25 ..
2002 73 .. 24 ..
2003 76 .. 24 ..
2004-05 86 52 27 22
2005-06 87 53 27 21
..
Source: GoP (2008) [Economic Survey 2007-08] ; MHHDC (2007).
Trends in primary GERs show increases during 1990-99, decline between 1999 and 2002 and
increase again between 2002 and 2007. The increases coincide with periods of democratic rule
and declines with military regimes. From Table 2 there appears to be no clear link between these
trends in GERs and total expenditure on education as a percentage of GDP. However, expenditure
on education as a percentage of total expenditure on education clearly reflects that primary
education was given priority since 1988 through to 2003 (Table 5).
Gross and net enrolment rates at the secondary level are much lower compared to those at the
primary level. Overall gross enrolment rates are at 27% in 2006-07 and they have not improved in
the seventeen years since 1990. This indicates mass drop-outs after the primary level. This also
reflects sectoral priorities; be it Social Action Plan or the Education Sector Reforms, primary
education appears to be the single most important sector to attract resources. Moreover, the
international discourse often associated with foreign aid has also emphasized primary education
over and above other sectors.
Despite this significant increase in the gross enrolments in primary education the universal net
enrolment is not likely to be achieved by 2015. Gross enrolments are already nearing the 100%

29
mark in urban areas and for boys. Rural areas and female enrolments, however, are lagging
behind.
The education policy documents seem not to differentiate between gross and net enrolments with
the emphasis being on all children in an age bracket, wider than that stipulated for the expected
primary school going age, being in school. There are wide gaps between enrolments in urban and
rural areas. Urban areas, with increased demand for education, better provision of education
facilities and a larger presence of the private sector, has managed to increase enrolments more
quickly.
3.4 Gender Parity in enrolments
Progress towards achieving EFA targets in countries with adverse attitudes towards female
education is hampered in particular by the under-enrolment of girls. While Pakistan has shown
significant increases in GERs, the overall figures and trends disguise persistent gender disparities
(Table 10): GER for boys is 87% in 2005-06 while that for girls is 80%. Similar gender disparity
is observed in terms of net enrolments.
Table 11: Gender Disparity in primary enrolments % (gross and net)
Gross Net
Total Male Female Total Male Female
2001-02 72 83 61 42 46 38
2004-05 86 94 77 52 56 48
2005-06 87 94 80 53 56 48
Source: Economic Survey 2006-07; 2007-08 (PSLM figures)
Figure 7 summarises the gender parity in terms of enrolments, institutions and teachers (females'
as a proportion of males'), over the period 1992-93 to 2006-07. Female enrolments as a % of
male enrolments have improved 8 percentage points in 17 years. For every 100 boys schools
there were 45 schools for girls in 1990. This ratio had improved to 62 girl schools for every 100
boys schools in 2006. The number of teachers available for girl schools improved the most: there
were 81 girl school teachers for every 100 boys' school teachers in 2006 compared with only 58
in 1990. Factors contributing to low gender parity are fewer schools for girls and fewer teachers
available in addition to adverse parental attitudes that reduce demand for female education.
(Aslam, 2007)
Figure 7: Gender parity17
between 1992 and 2007: GERs, number of institutions and number of
teachers
17 The gender parity measure is
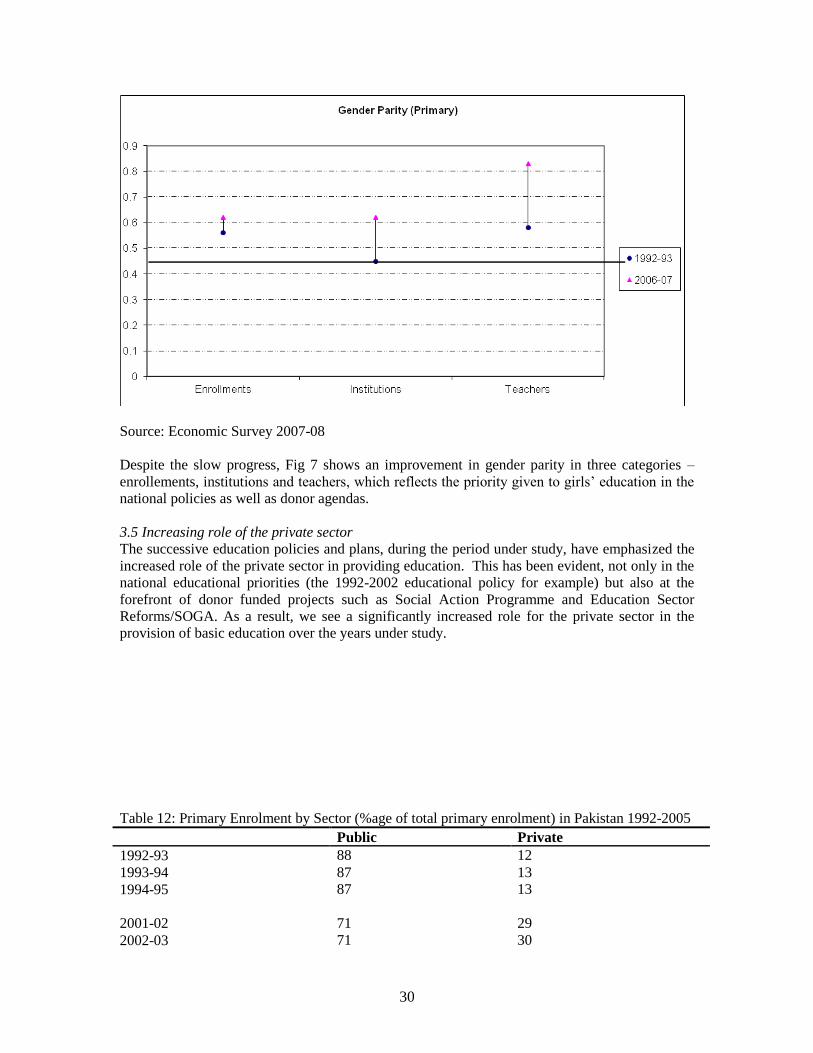
30
Source: Economic Survey 2007-08
Despite the slow progress, Fig 7 shows an improvement in gender parity in three categories –
enrollements, institutions and teachers, which reflects the priority given to girls’ education in the
national policies as well as donor agendas.
3.5 Increasing role of the private sector
The successive education policies and plans, during the period under study, have emphasized the
increased role of the private sector in providing education. This has been evident, not only in the
national educational priorities (the 1992-2002 educational policy for example) but also at the
forefront of donor funded projects such as Social Action Programme and Education Sector
Reforms/SOGA. As a result, we see a significantly increased role for the private sector in the
provision of basic education over the years under study.
Table 12: Primary Enrolment by Sector (%age of total primary enrolment) in Pakistan 1992-2005
Public Private
1992-93 88 12
1993-94 87 13
1994-95 87 13
2001-02
71
29
2002-03 71 30

31
2003-04 64 35
2004-05 64 36
Source: Pakistan Education Statistics (various years)
As the table suggests, the share of private sector in the total primary enrolments was small in the
early 1990s – the first phase of SAP - a period of massive investment to increase access to basic
education within public sector. There was a tremendous increase in the private sector's share of
enrolment over the next five years and in the year 2004-05, the private sector enrolled more than
one-third of total students at primary level. The increased role of private sector was facilitated by
the creation of National Education Foundation (NEF) and the education foundations at the
provincial level. These foundations encouraged private sector through providing finances,
voucher schemes, etc.
The public sector primary school teachers are more likely to be qualified than those in the private
sector18
. NEC 2005 revealed that at the primary level, 38% of the public sector primary school
teachers possess the minimum required professional training, compared to 10% in the private
sector. 40% of female teachers are qualified as compared to 30% of male teachers. Also apparent
as a major difference between the public and the private sector is the wage gap – primary school
teachers in the private sector are paid one-fourth that of their counterpart’s remuneration in the
public sector. Nonetheless, due to better management, and being market driven, private schools
have provided good results thus attracted a significant share of enrolments.
The increasing role of private sector provision of education reflects the donor influence very
directly as most of the international development discourse states that relying on private sector
schools is perhaps the only way to ensure attainment of UPE goals by 2015. Organisations like
the World Bank and other bilateral donors are therefore pushing the agenda of public private
partnerships which have been taken on in a big way in Pakistan. The aforementioned education
foundations have been established with this view.
3.6 Retention Rates:
Retention in school is a function of supply and demand. The most oft-cited reason for dropping
out of school is poverty. Drop out rates at the primary level in Pakistan have declined from 56%
to 37% between 1990 and 2004. Despite improvements more than half the girls dropped out in
2004. However, table 13 shows that there has been progress in retaining children in primary
school. Between 1999-2000, 28% students dropped out between grades 1 and 2 and only 47% of
those that enrolled made it all the way to grade 5. This proportion has improved since 2001: for
every 100 students enrolled in grade 1 around 60 remain in school and complete grade 5.
Table 13: Retention rates for students in primary schools 1990-2005
Grade 1 Grade II Grade III Grade IV Grade V
1999-2000 100 72 63 49 47
18
The minimum level of qualification for public school teachers is a BEd.

32
2000-2005 100 78.2 70.2 63.8 58.1
Source: Based on data from Shami et. al
Note: Each grade represents a year’s progression
Table 14 shows more progress has been made in retaining girls in schools. Retention rates for
girls have gone up from 49% to 63% between 1990-2000 and 2000-2005. Table 15 shows
regional disparities: more students stay in school in urban areas than they do in rural areas.
Table 14: Differences in improvements in retention rates for girls and boys at the primary level
Grade 1 Grade II Grade III Grade IV Grade V
Boys 1999-2000 100 75 66 53 50
2000-2005 100 76.4 66.4 62.3 56.3
Girls 1999-2000 100 67 60 42 43
2000-2005 100 81.2 71.4 66.5 61
Source: Based on data from Shami et. al,
Table 15: Urban-rural disparities in retention rates at the primary level 1990-2005
Grade 1 Grade II Grade III Grade IV Grade V
Urban 1999-2000 100 82 73 64 68
2000-2005 100 82 75.6 75.1 69.3
Rural 1999-2000 100 69 61 45 42
2000-2005 100 77.2 66.5 61 55.3
Primary schools, their facilities and teaching methods adopted all affect retention and drop out
rates. Overcrowded schools, inadequate facilities, untrained teaching staff and dysfunctional
outmoded assessment systems all add up to make an unchallenging and uninspired learning
experience.
Provision of sufficient basic facilities has been identified as a major factor which directly affects
child retention in primary schools. On the policy side, absence of general promotion and
repetition of classes upon failing annual exams has been cited as a cause for high drop out rates.
3.7 Discussion
There appear to have been improvements in areas where the donors have focused, either through
direct intervention, or have put pressure on the government to address national and provincial
policies. Primary school enrolments increased as the donors and the government focused on
expanding schools and infrastructure in the early 1990s. Gender parity in particular has improved
and the divide in enrolments between urban and rural areas has decreased. All three areas are part
of the international aid agenda as explicit goals and are attached as target goals for aid to
Pakistan.

33
One of the most apparent transformations of education in Pakistan that can be attributed to donor
influence is the move towards public private partnerships. International development discourse
values the role of the private sector in expanding access to education and its ability to address the
quality deficit. While a significant proportion of the growth in the private sector schools is
indigenous, the setting up of federal and provincial education foundations are a direct result of
donor influence on the policy agenda in Pakistan.
Section 4: Conclusions
Drawing conclusive causal links between levels of public spending and primary enrolment ratios
requires more sophisticated analysis than that presented in this paper. However, levels of public
spending reveal a great deal about commitment to development goals and progress, in addition to
indicating appropriate policy direction for achieving UPE and meeting related goals/targets.
Pakistan has made progress in improving educational outcomes as measured by enrolment,
literacy and retention rates. However, the sustainability of these trends is in question. The
commitment of the state, as measured by the amount of resources it allocates to the education
sector, is low. Cost assessments by internal and external studies find the need to allocate 4% of
GDP to education to be critical. This level of resource allocation has not been achieved in the past
twenty years, despite the government’s own intention and donor involvement and encouragement.
Pakistan continues to spend less than the regional average on education. The proportion of GNP
has been declining until recently. Pakistan makes disproportionately large allocations to defence
and debt servicing. Low levels of public spending are linked to insufficient progress towards
achieving UPE. While international evidence suggests that high levels of debt service and defence
commitments are not strongly associated with failure to achieve UPE, they are significant
contributory factors. This is particularly true for Pakistan.
Historically the tendency in Pakistan has been to cut development costs and the reductions in
current costs have come through slashing non-salary expenditure. Intra-sectoral priorities as
viewed through the lens of budgetary analysis reveal low priority given to teacher training. The
quality of teachers is arguably the most critical input for quality improvement for the public
sector.
Efficiency of spending is compromised further by the complications of governance structures.
Incomplete fiscal decentralisation, unclear delegation of responsibilities for various tiers of
government and a debilitating mismatch between revenue generation ability at the district and
provincial level compromise the effectiveness of decentralisation reforms that have the potential
to improve outreach and the quality of the public sector education service delivery in Pakistan.
Despite the apparent commitment of the state, prolonged donor presence and influence, and
financing and governance reforms - in the education sector as a whole and for primary education
service delivery in particular - have not kept pace with commitments to ensure minimum basic
outcomes. This is evident from achievement gaps on a number of objectives and goals: be it
ensuring 100% enrolment, guaranteeing standard quality, improving learning outcomes or
decreasing gender disparities. Despite education being a national priority, evidence from the last
two decades tells a story of neglect. Historically low budget allocations have resulted in chronic
infrastructure shortages and low status of teaching as a profession. Policy texts in Pakistan have
over the years attempted policy prioritisation through increased resource allocation, widening
34
outreach of service provision as well as improvements in quality. While some initiatives have
been a result of internal progression on a learning curve in public policy formulation, others have
been brought about by the involvement of the international community. As with all donor-
recipient relationships, the one between Pakistan and its donors is multidimensional.
This paper has demonstrated that aid to education has played a significant role in determining
policy priorities since the 1990s. It appears to have made a greater impact through project aid -
such as teacher training or school sponsorship – than through the newer modalities such as
SWAps. Despite being less aid-dependent than many of its developing counterparts in South
Asia, donor involvement in the education sector in Pakistan has contributed to improvements to a
number of indicators of educational outputs in the country since the 1990s, but significant gender,
regional and rural-urban disparities remain. As regards having a broader influence upon
governance structures and policy priorities, the donors have had more limited success,
particularly due to the incompatibility of the simultaneously run Structural Adjustment
Programme. Whilst the introduction of the Social Action Programme (SAP) attempted to meet
deficiencies within the education system, alongside broader concerns over the delivery of social
services, there has still been a tendency within Pakistan to channel donor funds into ‘development
projects’, regardless of the nature of aid, whether project- or programme-based. Therefore,
despite improving trends in literacy, gross and net enrolments, and internal efficiency and quality
measures, donors have had less success in influencing Pakistan’s budgetary priorities.
Nevertheless, donor influence has led to an increased focus on education (particularly at primary
level) in Pakistan which, for long periods of its history, was grossly under-funded. Despite the
remaining challenges as regards low allocations of public expenditure, donor involvement has
been fundamental to the steps being taken in 2009/10 by the government toward improving the
quality of education in Pakistan.
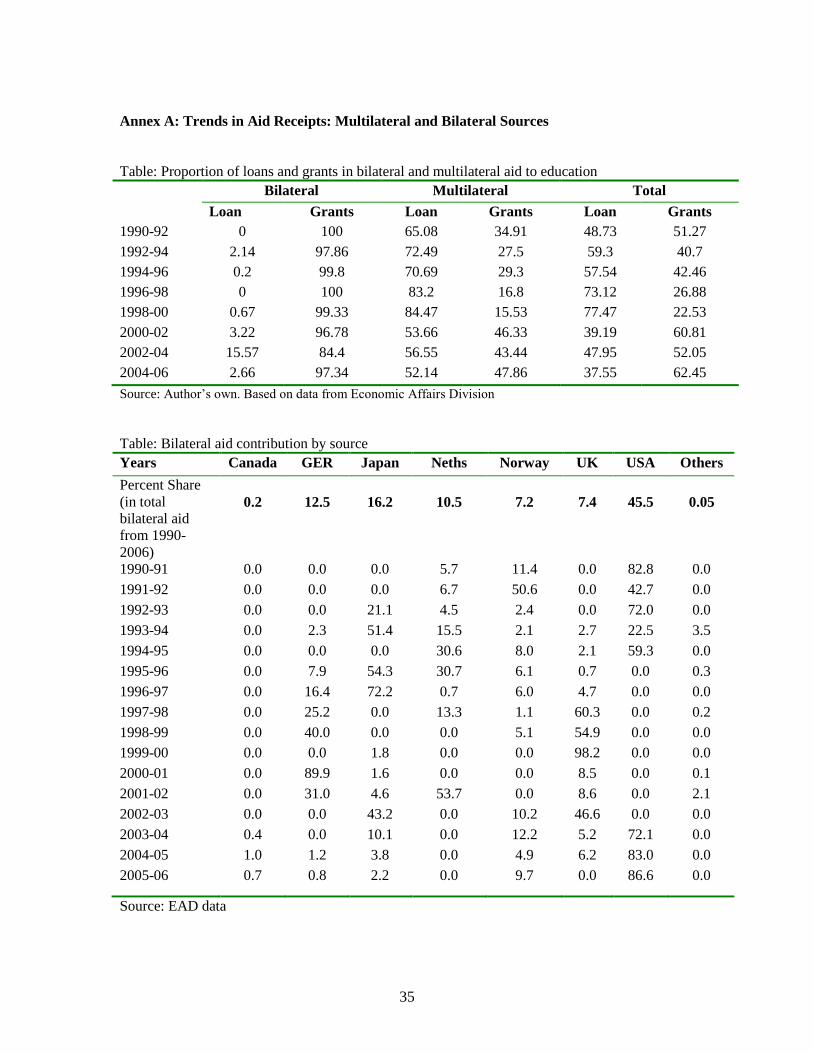
35
Annex A: Trends in Aid Receipts: Multilateral and Bilateral Sources
Table: Proportion of loans and grants in bilateral and multilateral aid to education
Bilateral Multilateral Total
Loan Grants Loan Grants Loan Grants
1990-92 0 100 65.08 34.91 48.73 51.27
1992-94 2.14 97.86 72.49 27.5 59.3 40.7
1994-96 0.2 99.8 70.69 29.3 57.54 42.46
1996-98 0 100 83.2 16.8 73.12 26.88
1998-00 0.67 99.33 84.47 15.53 77.47 22.53
2000-02 3.22 96.78 53.66 46.33 39.19 60.81
2002-04 15.57 84.4 56.55 43.44 47.95 52.05
2004-06 2.66 97.34 52.14 47.86 37.55 62.45
Source: Author’s own. Based on data from Economic Affairs Division
Table: Bilateral aid contribution by source
Years Canada GER Japan Neths Norway UK USA Others
Percent Share
(in total
bilateral aid
from 1990-
2006)
0.2
12.5
16.2
10.5
7.2
7.4
45.5
0.05
1990-91 0.0 0.0 0.0 5.7 11.4 0.0 82.8 0.0
1991-92 0.0 0.0 0.0 6.7 50.6 0.0 42.7 0.0
1992-93 0.0 0.0 21.1 4.5 2.4 0.0 72.0 0.0
1993-94 0.0 2.3 51.4 15.5 2.1 2.7 22.5 3.5
1994-95 0.0 0.0 0.0 30.6 8.0 2.1 59.3 0.0
1995-96 0.0 7.9 54.3 30.7 6.1 0.7 0.0 0.3
1996-97 0.0 16.4 72.2 0.7 6.0 4.7 0.0 0.0
1997-98 0.0 25.2 0.0 13.3 1.1 60.3 0.0 0.2
1998-99 0.0 40.0 0.0 0.0 5.1 54.9 0.0 0.0
1999-00 0.0 0.0 1.8 0.0 0.0 98.2 0.0 0.0
2000-01 0.0 89.9 1.6 0.0 0.0 8.5 0.0 0.1
2001-02 0.0 31.0 4.6 53.7 0.0 8.6 0.0 2.1
2002-03 0.0 0.0 43.2 0.0 10.2 46.6 0.0 0.0
2003-04 0.4 0.0 10.1 0.0 12.2 5.2 72.1 0.0
2004-05 1.0 1.2 3.8 0.0 4.9 6.2 83.0 0.0
2005-06 0.7 0.8 2.2 0.0 9.7 0.0 86.6 0.0
Source: EAD data

36
Figure : Contribution of bilateral and multilateral sources of aid to education in Pakistan

37
References
ADB/DfID/WB. (2004). Devolution in Pakistan: An Assessment & Recommendation for Action.
Al-Samarrai, S., Bennell, P. & Colclough, C. (2002). From Projects to SWAps: An Evaluation of
British Aid to Primary schooling 1988-2000. Evaluation Report EV639. London: DFID
Aly, H. (2007) Education in Pakistan – A White Paper. Ministry of Education
Aslam. M. (2007) The Relative Effectiveness of Government and Private Schools in Pakistan:
Are Girls Worse Off? RECOUP Working Paper 4
Behrman, J. (1990). Human Resource Led Development? Review of issues and evidence,
ILOARTEP, New Delhi
Birdsall, N. Levine, R & Ibrahim, A. (2005). Towards Universal Primary Education: investments,
incentives and institutions. UN Millennium Project Task Force on Education and Gender Equality
UNDP
Colclough, C. (1982). 'The impact of primary schooling on economic development: a
review of the evidence', World Development, 19(3),167-185.
Colclough, C., with Lewin, K., (1993). Educating All the Children. Oxford: Clarendon Press.
Colclough, C., Al-Samarrai, S., Rose, P., Tembon, M. (2003) Achieving Schooling for All
in Africa: Costs, Commitment and Gender, Ashgate, Aldershot, 2003
Easterly, W. (2002). Political Economy of Growth without Development: A Case Study of
Pakistan. Paper for Analytical Narratives of Growth Project, Kennedy School of Government,
Harvard University. available at: ksghome.harvard.edu/~drodrik/Growthper
cent20volume/Easterly- Pakistan.pdf
Government of Pakistan (GOP). (2005). Financing of Girls Elementary Education: 2002-03,
2003-04 $ 2004-05. Ministry of Education, Planning & Policy Wing, Islamabad.
GOP. (2006). Financing of Education in the Public Sector. Ministry of Education, Planning &
Policy Wing, Islamabad.
GOP. (2006). Financing of Secondary, Higher Secondary and College Education. Ministry of
Education, Planning & Policy Wing, Islamabad.
38
GOP. (2007). Financing of Girls Secondary, Higher Secondary and College Education in Punjab.
Ministry of Education, Planning & Policy Wing, Islamabad.
GOP. (1988). Seventh Five Year Plan (1988-93) & Perspective Plan 1988-2003.. Islamabad:
Planning Commission.
GOP. (1992). National Education Policy ’92: 1992-2002. Islamabad: Ministry of Education
GOP. (1994). Eighth Five Year Plan (1993-98). Islamabad: Planning Commission.
GOP. (1998). National Education Policy 1998-2010. Islamabad: Ministry of Education
GoPa. (2003) Accelerating Economic Growth and Reducing Poverty: The Road Ahead (Poverty
Reduction Strategy Paper). Ministry of Finance.
GoPb. (2003). Financing Education in Pakistan – an estimation of required and
available resources to achieve EFA goals. Islamabad: Ministry of Education.
GOP. (2005). Working Draft: Medium Term Development Framework 2005-10, Planning
Commission, Islamabad
GoP (2006). Data on Aid inflows to Pakistan, Economic Affairs Division.
GoP. (2006) Poverty Reduction Strategy Paper: Annual Progress Report 2005-06. Ministry of
Finance.
GoP. (2007) Pakistan Economic Survey 2007-08. Islamabad: Ministry of Finance
GOP (2008). Pakistan Labour Force Survey 2007-08. Islamabad: Federal Bureau of
Statistics, Statistics Division.
GoP. (2009) Poverty Reduction Strategy Paper: First Quarterly Progress Report 2009-2010.
Ministry of Finance. Available at http://finance.gov.pk/poverty/PRSP_first_quarter_09_10.pdf
GoP. (various years) Annual Budget Statements. Ministry of Finance
GoP. (various years) Demands for Grants and Appropriations. Ministry of Finance
Hanushek, E. (1995) Interpreting recent research on schooling in developing countries. The
World Bank Research Observer Vol. 10 (2) p.227-46
39
Hanushek, E. (2003) Failure of Input-based Schooling Policies. The Economic Journal Vol. 113
Kemal, A.R. (2001) Structural Adjustment, Macroeconomic Policies, and Poverty Trends in
Pakistan presented at Asia and Pacific Forum on Poverty: Reforming Policies and Institutions for
Poverty Reduction, ADB Manila.
Franco-Rodriguez, S. Morrissey,O. and McGillivray, M. (1998) Aid and the Public Sector in
Pakistan World Development. 26(7) 1241-1250.
MHHDC (Mahbub-ul-Haq Human Development Center). (1999). Human Development in South
Asia 1998: The Education Challenge. Karachi: Oxford University Press.
MHHDC (Mahbub-ul-Haq Human Development Center). (2008). Human Development in South
Asia 2007: A Ten-year Review. Karachi: Oxford University Press
Watson, D and Khan, A (2005). Capacity Building for decentralised education service delivery
in Pakistan. Discussion Paper No. 57 G. European Centre for Development Policy Management.
World Bank (1996). Pakistan Improving Basic Education: Community Participation, Systems
World Bank (1997). Towards a strategy for elementary education. Population and Human
Resources
World Bank (1998). Implementation Completion Report: Pakistan Social Action Programme
Project. Poverty Reduction and Economic Management Division, South Asia Region. Report No.
18043. June 22, 1998.
World Bank (2003): Implementation Completion Report on a Credit in the Amount of US$250
Million to the Islamic Republic of Pakistan for a Second Social Action Programme Project.
Human Development Sector Unit, South Asia Region. Report No. 26216. June 25, 2003.
World Bank (2006) World Development Indicators 2006-07
World Bank (2008) World Development Indicators 2008-09
Recommended