Finding the Simple Rule for Diagnosing the
Operation Fault of Freezer
Seung Yeoun Choi Graduate School of Architecture, Seoul National University of Science and Technology, 01811, Korea
Email: [email protected]
Sean Hay Kim School of Architecture, Seoul National University of Science and Technology, 01811, Korea (Corresponding author)
Email: [email protected]
Abstract—This study aims to find a simple rule to see if a
freezer door is left open, or if refrigerant is insufficiently
charged. We devised a comparative experiment to find an
opportunity where the simple rule is able to replace the
machine learning approach. In contrast to the previous
study performed with the machine learning approach, this
paper has derived more explanatory variables and rules for
diagnosing the operation faults of a freezer. i) Freezer wall
temperature is found to be the most sensitive variable for
diagnosing the door opening. When the open door rule
based on the freezer wall temperature is applied to the
actual state, however, only 62.4% of windows are assessed
as “True”. In other words, there is 37.6% chance of a false
alarm. ii) We also assume that refrigerant mass is
proportional to the ratio of accumulated power to power
factor. However, only 51.5% of windows turn out “True”
when the insufficient refrigerant rule is applied to the actual
state. When refrigerant is actually insufficient, there is a
33% chance that critical false alarms still occur, which can
harm the credibility of the insufficient refrigerant rule. iii)
To diagnose if the door is left open by means of using
machine learning, all three variables (Active Power,
Laboratory indoor temperature, Refrigerator wall
temperature) may not be necessary. Only the refrigerator
wall temperature framed within a 3 minute window appears
sufficiently credible, rather than the refrigerator wall
temperature at each time step. iv) To diagnose if the
refrigerant is insufficiently charged, instead of using the
three variables, only power related variables including
active power and power factor would be sufficient for
simpler monitoring and more accurate assessment.
Index Terms— FDD, fault detection, rule, diagnosis,
machine learning
I. INTRODUCTION
Freezer malfunctions most frequently occur when refrigerant leaks and/or when the door is left open by mistake. The most frequent freezer malfunctions are caused when refrigerant leaks and/or the door is left open by mistake. The first of these factors can occur with secondhand freezers which are not under proper maintenance or attention. The latter can occur with almost all freezers. While the first factor causes refrigeration to be delayed, the latter causes a sudden
Manuscript received June 1, 2018; revised December 12, 2018.
temperature rise. Both cases can eventually cause unexpected Faults and a subsequent deterioration of the content. If the freezer contains temperature-sensitive foods and ice, this can result in serious financial loss.
In the previous study, we developed a freezer
monitoring system called the Freezer Keeper, as shown in
Fig. 1. The Freezer Keeper monitors the freezer
temperature, power consumption and power-related
variables; such that when it appears to work abnormally,
alarms are sent to the client before any damage occurs.
One of the research issues was how to diagnose the
operation fault as quickly as possible. To address this
issue, we adopted machine learning algorithms. Since the
previous work is still under publication [1], a brief
description of the process and selected machine learning
algorithms and summary of the results can be found in
Section 2.
Figure 1. System architecture of the freezer keeper [1].
The machine learning algorithms showed an outstanding performance in predicting and detecting the operation fault [1]. However, only the well-trained machine learning model with accurately “labelled” data can assure its rated accuracy when the model is actually applied in this field. This raises a question concerning what would happen if a freezer expert needed long term monitored data to make a state judgement for training the machine learning model, but it was not actually available in this field. Additionally, to ensure a certain degree of accuracy when machine learning algorithms are used for diagnostics and prediction, a sufficient amount of field data must be firstly collected.
135
International Journal of Mechanical Engineering and Robotics Research Vol. 8, No. 1, January 2019
© 2019 Int. J. Mech. Eng. Rob. Resdoi: 10.18178/ijmerr.8.1.135-140

TABLE I. STATES OF THE FREEZER [1]
States Description Door State Refrigerant Mass Freezer Temperature
Door_open Regardless of refrigerant mass, the door leaves open
Open door Ignored Ignored
Lack_rfg Insufficient refrigerant, and the door is
closed Closed door
30g, 40g
50g, 60g
Tries to reach
at -20℃
Normal Sufficient refrigerant with the door
closed Closed door 70g, 80g, 90g
Tries to reach
at -20℃
Steady state Sufficient refrigerant with the door closed
Closed door 70g, 80g, 90g Already reached
at -20℃
Steady_lack_rfg Less refrigerant, and the door is closed
Closed door 30g, 40g
50g, 60g
Already reached
at -20℃
This study, therefore, aims to find a simple rule to tell
if a freezer door is left open, and/or if the refrigerant is
insufficiently charged. To achieve this, we divided an
experiment to see whether the simple rule is able to
replace the machine learning approach.
Figure 2. Schematic definition of states [1].
II. SUMMARY OF THE PREVIOUS STUDY
A. Demonstration of Freezer Operation and Data
Collection
We analyzed frequent operation faults of freezers and
then identified five freezer states, as described in Table I.
Each state is also depicted in Figure 2. To demonstrate
the five states, refrigerant mass was varied from 30g to
90g increasing by 10g for each refrigerant condition (7
conditions in total); The number of bricks varied from 0
to 28 by 7 bricks for each food content condition (4
conditions in total); the door was left open for 1-2 hours
and was closed again (total 2 conditions). A total of 56
combinations were made in the lab.
Then, we started with 13 monitoring variables
including A (Current), P (Active Power), Q (Reactive
Power), S (Apparent Power), PF (Power factor), T1
(Central temperature in the refrigerator), T2 (Laboratory
indoor temperature), T3 (Refrigerant temperature
entering the evaporator), T4 (Refrigerant temperature
leaving the evaporator), T5 (Refrigerator wall
temperature), RFG (Refrigerant mass), M (Number of
bricks), and D (Door open/closure).
For each combination, raw data were collected every
10 seconds. Eventually about 190,000 sets of the 13
monitoring variables were collected.
Figure 3. Regression analysis when door opening (D) is used as the control variable [1].
B. Machine Learning and Accuracy
The five machine learning algorithms [2] were applied
for experiments, KNN (K-Nearest Neighbors) [3], SVM
(Support Vector Machine) [3], Decision Tree [3], ANN
(Artificial Neural Network) [3], and Naïve Bayes
Classification [3].
Since the 13 variables may not all be significant, and it
takes quite a long time to train the machine learning
model with the full dataset, purging variables was a
necessary pre-processing step.
Firstly, we started with a correlation analysis to select
8 out of the 13 variables. Then we chose the final 6
variables (P, T2, T5, RFG, M, D) via regression analysis
(Fig. 3). While RFG (Refrigerant mass), M (Number of
bricks), and D (Door open/closure) are control variables,
the rest of the variables represent the freezer response [4].
75% of the collected data was used for training the
model, and the rest of the collected data was used for
testing the model [5].
Because predicted states by machine learning
algorithms may or may not match actual states, the
accuracy of each model needs to be calculated to estimate
how accurately each model predicts. Thus, the accuracy
was defined as the amount of correctly predicted data out
of the entire test data. Their accuracy is listed in Table Ⅱ.
Kernel-based algorithms such as KNN and SVM have
higher accuracy than others. Naïve Bayes algorithm,
however, has the lowest accuracy because it does not
consider independence between data, i.e., Naïve Bayes
algorithm assumes all data are related, although some
136
International Journal of Mechanical Engineering and Robotics Research Vol. 8, No. 1, January 2019
© 2019 Int. J. Mech. Eng. Rob. Res
variables apparently behave independently from others.
Decision Tree was not able to suggest clear criteria when
data values are discrete.
TABLE II. ACCURACY OF MACHINE LEARNING ALGORITHMS
ML Algorithms Accuracy
KNN 99.24%
SVM 96.21%
ANN 92.79%
DT 85.54%
Naïve Bayes Classification 75.43%
III. EXTRACTING THE RULE TO DIAGNOSE THE
OPERATION FAULT
In the previous study, we selected P (Active Power),
T2 (Laboratory indoor temperature), and T5 (Refrigerator
wall temperature) as the indicators of freezer states; they
were chosen by inductive reasoning, rather than an
analytical deductive approach.
We, thus, restart the deductive analysis with 13
variables to figure out simple rules and explanatory
variables of the rules.
A. Simple Problem Solving
Most engineering problems are compound in that
wherever there are choices of materials, subsystems or
methods that emphasize one or another property, the
problem is compound [6]. Since they are only partly
deductive, deductive problem solving can only be triable
with some part of the entire problem.
Even complex real world problems, however, can be
simplified, if their scope, constraints and criteria are well
defined. In this study, we focus more on the explicit
causality to simplify the problem and also to try
deductive analyses if the freezer door is left open, freezer
temperature would go up, and if the refrigerant is fully
charged, freezer compressor would consume more
electricity to get the refrigerant circulated.
B. Open Door State
When the door is left open, indoor air enters the freezer,
causing the freezer temperatures, such as T1 and T5, to
start to increase. Regardless of refrigerant mass, it is
observed that temperature rises show some patterns as
depicted in Fig. 4. Specifically, T5 increases as time goes
on while maintaining a certain pattern. By setting the
monitoring window at each 3 minutes, we derive the
equation (1).
(1)
Since equation (1) is closer to a linear regression
equation, the R2 at each ‘a’ value is calculated and listed
in Table III. After several tests, we found that as long as
the slope ‘a’ is a positive value, it can be determined that
the door is left open. When refrigerant mass is over 80g,
T5 appears to not increase following (1), because a fully
charged refrigerant is able to keep the current freezer
temperature for the time being even if the door is left
open.
Figure 4. T5 per refrigerant mass varying from 30g to 90g.
TABLE III. SLOPE ‘A’ OF (1) WHEN THE DOOR LEAVES OPEN
Refrigerant
mass [g]
Slope ‘a’ of Equation (1)
Number of bricks [M]
M=14 M=7 M=0
30 3.867 83% 5.304 96% 3.181 77%
40 3.719 87% 3.934 89% (NA) (NA)
50 2.196 57% 4.060 89% 3.664 79%
60 3.659 75% 4.833 90% 5.060 92%
70 3.990 82% 3.178 88% 2.678 85%
80 2.422 63% 6.699 66% 3.034 83%
90 0.183 72% 3.742 61% 0.694 12%
B. Insufficient Refrigerant State
Although T5 is a good indicator to diagnose the door
opening, T5 can vary not only per refrigerant mass, but
also per other disturbance factors. We, therefore,
considered another indicator to see if the refrigerant was
still insufficient.
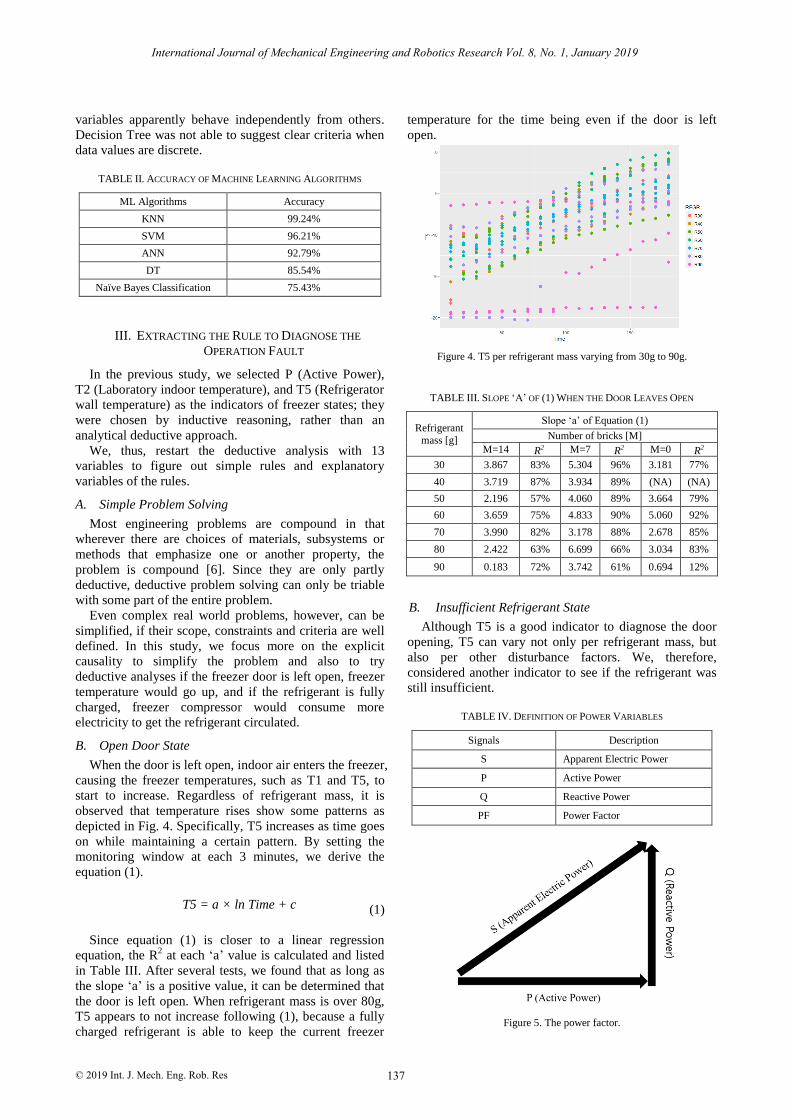
TABLE IV. DEFINITION OF POWER VARIABLES
Signals Description
S Apparent Electric Power
P Active Power
Q Reactive Power
PF Power Factor
Figure 5. The power factor.
R2 R2 R2
T5 = a × ln Time + c
137
International Journal of Mechanical Engineering and Robotics Research Vol. 8, No. 1, January 2019
© 2019 Int. J. Mech. Eng. Rob. Res

If refrigerant is fully charged and also sufficiently
subcooled, the refrigerant does not need to circulate
between the evaporator and compressor as frequently as it
should do when the refrigerant is less charged. This
eventually results in a lower power factor, because there
is a lower cooling load even at the same apparent power
(Table Ⅳ and Fig. 5) [7][8]. Therefore, it can be derived
that refrigerant mass is inversely proportional to the
power factor.
Additionally, if refrigerant is fully charged, the
compressor needs to work harder to “squeeze” more
refrigerant [9]. Thus, the freezer consumes more power
compared to when the refrigerant is less charged. When
the power consumption accumulates over some time, the
accumulated power becomes more obvious in
distinguishing between a fully charged refrigerant and a
lower charged refrigerant. Therefore, it can be derived
that refrigerant mass is proportional to the accumulated
power (WP).
Finally, we arrive at the assumption that refrigerant
mass is proportional to WP/PF as described in the
equation (2).
(2)
We calculated slope “a” of (2) while monitoring WP
and PF for each 30 minutes. As depicted in Fig. 6, WP/PF
shows specific patterns per refrigerant mass. Additionally,
for each combination of refrigerant mass and the number
of bricks, slope “a” of (2) was calculated as listed in
Table Ⅴ.
Eventually we classified slope “a” into three groups:
If a < , then the refrigerant is
insufficiently charged (yellow cells in Table Ⅴ).
If < a < , then although
refrigerant is insufficiently charged, T1 can still
arrive at the steady state (blue cells in Table Ⅴ)
If a > then refrigerant is fully charged
(white cells in Table Ⅴ)
Figure 6. WP/PF varying per refrigerant mass.
TABLE I. SLOPE ‘A’ OF (2) AT EACH COMBINATION OF
REFRIGERANT MASS AND NUMBER OF BRICKS
Refrigera
nt mass [g]
Slope ‘a’ of the (2)
Number of bricks [M]
M=28 M=14 M=7 M=0
30 3.597 3.627 3.591 3.494
40 3.659 3.799 3.745 (NA)
50 4.357 4.031 4.121 (NA)
60 4.623 3.926 4.009 4.051
70 5.174 4.35 4.226 4.118
80 5.297 4.257 4.276 4.293
90 4.781 4.363 4.234 4.236
IV. VERIFICATION OF THE RULES
A. The Open Door Rule to See if the Door Is Left Open
or Closed
To verify the accuracy of the open door rule, we
divided up the full data into 3 minute windows, because it
is composed with a series of data acquired for each 3
minutes. As shown in Table Ⅵ, total 10,904 windows
were obtained. If someone opens the door at the
beginning of a 3 min window, and then the door is left
open until the end of the 3-minute window, the open door
rule would determine the door is open. Unfortunately, if
the door is kept closed and someone starts to open it
during the last time step of a 3-minute window, the door
open rule will determine the door is closed. In the next 3-
minute window, however, it is likely the open door rule
would determine that the door is left open.
When the open door rule is applied to the actual state,
only 6,783 windows out of 10,904 windows (62.4%) are
assessed as true, as listed in Table VI. In other words,
there is a 37.6% chance of a false alarm; even when the
door is actually left open, the rule makes a judgement that
the door is “closed” for 92 windows.
TABLE II. ACTUAL STATE VS. ASSESSED STATE BY THE OPEN DOOR
RULE
Assessed by the open door rule
Actual State
Door closed Door open
Door closed 6,250 (True) 92
Door open 4,029 533 (True)
B. The Insufficient Refrigerant Rule to See if Refrigerant
is Still Insufficiently Charged
To verify the accuracy of the insufficient refrigerant
rule, we divided up the full data with 30 minute windows.
Although a total of 1,090 windows were obtained, the
cases when PF is almost zero (i.e., it arrives at the steady
state) were excluded, because it made WP/PF in (2)
exceptionally high. Consequently, the insufficient
refrigerant rule was applied to only 378 windows.
As described in Table VII, only 195 (=138+48+9)
windows out of 378 windows (51.5%) turned out “True”
when the insufficient refrigerant rule is applied.
138
International Journal of Mechanical Engineering and Robotics Research Vol. 8, No. 1, January 2019
© 2019 Int. J. Mech. Eng. Rob. Res
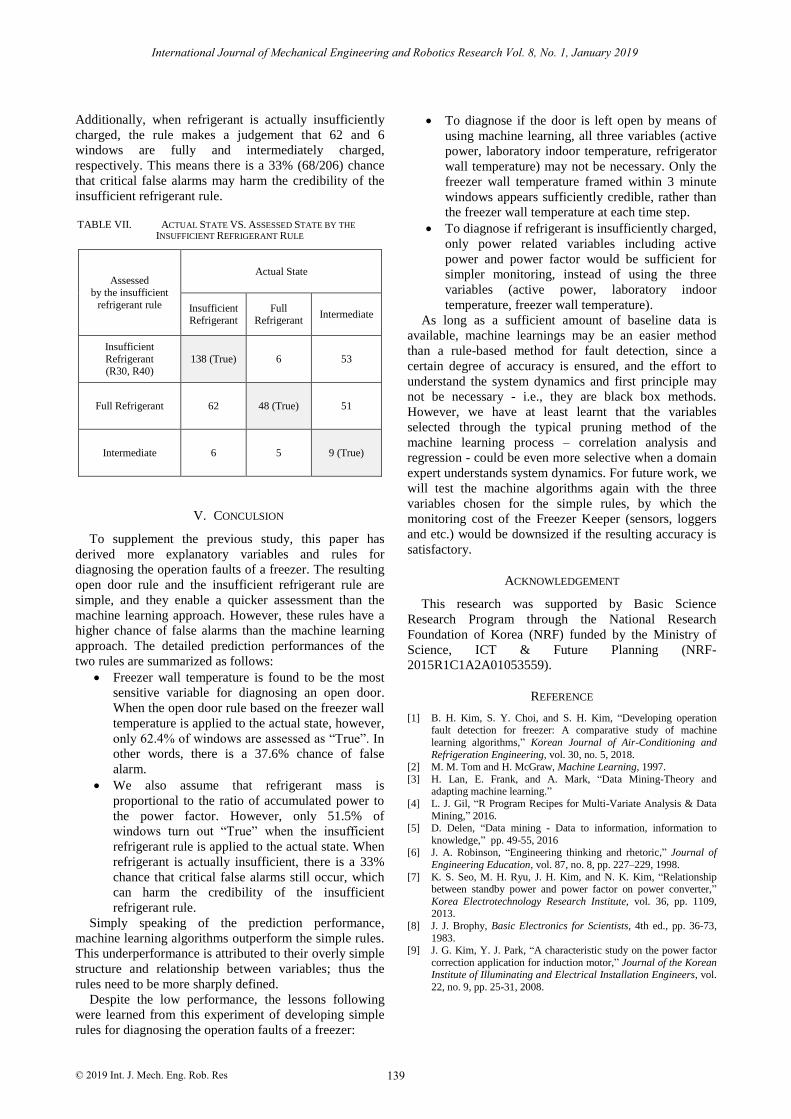
Additionally, when refrigerant is actually insufficiently
charged, the rule makes a judgement that 62 and 6
windows are fully and intermediately charged,
respectively. This means there is a 33% (68/206) chance
that critical false alarms may harm the credibility of the
insufficient refrigerant rule.
TABLE VII. ACTUAL STATE VS. ASSESSED STATE BY THE
INSUFFICIENT REFRIGERANT RULE
Assessed by the insufficient
refrigerant rule
Actual State
Insufficient Refrigerant
Full Refrigerant
Intermediate
Insufficient
Refrigerant (R30, R40)
138 (True) 6 53
Full Refrigerant 62 48 (True) 51
Intermediate 6 5 9 (True)
V. CONCULSION
To supplement the previous study, this paper has
derived more explanatory variables and rules for
diagnosing the operation faults of a freezer. The resulting
open door rule and the insufficient refrigerant rule are
simple, and they enable a quicker assessment than the
machine learning approach. However, these rules have a
higher chance of false alarms than the machine learning
approach. The detailed prediction performances of the
two rules are summarized as follows:
Freezer wall temperature is found to be the most
sensitive variable for diagnosing an open door.
When the open door rule based on the freezer wall
temperature is applied to the actual state, however,
only 62.4% of windows are assessed as “True”. In
other words, there is a 37.6% chance of false
alarm.
We also assume that refrigerant mass is
proportional to the ratio of accumulated power to
the power factor. However, only 51.5% of
windows turn out “True” when the insufficient
refrigerant rule is applied to the actual state. When
refrigerant is actually insufficient, there is a 33%
chance that critical false alarms still occur, which
can harm the credibility of the insufficient
refrigerant rule.
Simply speaking of the prediction performance,
machine learning algorithms outperform the simple rules.
This underperformance is attributed to their overly simple
structure and relationship between variables; thus the
rules need to be more sharply defined.
Despite the low performance, the lessons following
were learned from this experiment of developing simple
rules for diagnosing the operation faults of a freezer:
To diagnose if the door is left open by means of
using machine learning, all three variables (active
power, laboratory indoor temperature, refrigerator
wall temperature) may not be necessary. Only the
freezer wall temperature framed within 3 minute
windows appears sufficiently credible, rather than
the freezer wall temperature at each time step.
To diagnose if refrigerant is insufficiently charged,
only power related variables including active
power and power factor would be sufficient for
simpler monitoring, instead of using the three
variables (active power, laboratory indoor
temperature, freezer wall temperature).
As long as a sufficient amount of baseline data is
available, machine learnings may be an easier method
than a rule-based method for fault detection, since a
certain degree of accuracy is ensured, and the effort to
understand the system dynamics and first principle may
not be necessary - i.e., they are black box methods.
However, we have at least learnt that the variables
selected through the typical pruning method of the
machine learning process – correlation analysis and
regression - could be even more selective when a domain
expert understands system dynamics. For future work, we
will test the machine algorithms again with the three
variables chosen for the simple rules, by which the
monitoring cost of the Freezer Keeper (sensors, loggers
and etc.) would be downsized if the resulting accuracy is
satisfactory.
ACKNOWLEDGEMENT
This research was supported by Basic Science
Research Program through the National Research
Foundation of Korea (NRF) funded by the Ministry of
Science, ICT & Future Planning (NRF-
2015R1C1A2A01053559).
REFERENCE
[1] B. H. Kim, S. Y. Choi, and S. H. Kim, “Developing operation fault detection for freezer: A comparative study of machine
learning algorithms,” Korean Journal of Air-Conditioning and
Refrigeration Engineering, vol. 30, no. 5, 2018.
[2] M. M. Tom and H. McGraw, Machine Learning, 1997.
[3] H. Lan, E. Frank, and A. Mark, “Data Mining-Theory and adapting machine learning.”
[4] L. J. Gil, “R Program Recipes for Multi-Variate Analysis & Data
Mining,” 2016. [5] D. Delen, “Data mining - Data to information, information to
knowledge,” pp. 49-55, 2016 [6] J. A. Robinson, “Engineering thinking and rhetoric,” Journal of
Engineering Education, vol. 87, no. 8, pp. 227–229, 1998.
[7] K. S. Seo, M. H. Ryu, J. H. Kim, and N. K. Kim, “Relationship between standby power and power factor on power converter,”
Korea Electrotechnology Research Institute, vol. 36, pp. 1109, 2013.
[8] J. J. Brophy, Basic Electronics for Scientists, 4th ed., pp. 36-73,
1983. [9] J. G. Kim, Y. J. Park, “A characteristic study on the power factor
correction application for induction motor,” Journal of the Korean Institute of Illuminating and Electrical Installation Engineers, vol.
22, no. 9, pp. 25-31, 2008.
139
International Journal of Mechanical Engineering and Robotics Research Vol. 8, No. 1, January 2019
© 2019 Int. J. Mech. Eng. Rob. Res

Seung Yeoun Choi received the B.E. degree
in chemical engineering in Soong-sil
University, Seoul, Korea. He is currently pursuing for an M. S. degree in
Architecture from the Seoul National University of Science and Technology.
Sean Hay Kim received B.E. degree in
Architecture engineering in Yonsei University, M.S. degree in Master of Science in Carnegie
Mellon University, and Ph.D. degree in
Georgia Institute of Technology.
She is currently an Assistant Professor of
Architecture in the Seoul National University of Science and Technology. Her current
research interests include Building
Performance analysis, Building supervisory controls, Building energy simulation and BIM2BEM (Building
Information Model to Building Energy Model).
140
International Journal of Mechanical Engineering and Robotics Research Vol. 8, No. 1, January 2019
© 2019 Int. J. Mech. Eng. Rob. Res
Recommended