First in Human Assessment of the Novel M1 Muscarinic
Acetylcholine Receptor PET Radiotracer 11C-LSN3172176
Authors:Mika Naganawa1,Nabeel Nabulsi1,Shannan Henry1,David Matuskey1,Shu-fei Lin1,
Lawrence Slieker2,Adam J. Schwarz2,Nancy Kant2,Cynthia Jesudason2,Kevin Ruley2,
Antonio Navarro2,Hong Gao1,Jim Ropchan1,David Labaree1,Richard E. Carson1,Yiyun Huang1
1PET Center,Department of Radiology and Biomedical Imaging,Yale School of Medicine,New
Haven,CT,USA
2Eli Lilly and Company,Indianapolis,IN,USA
Corresponding author:Mika Naganawa,801 Howard Avenue,PO Box 208048,New
Haven,CT,06520-8048,USA,Ph:203-737-5582,Fx:203-785-3107,[email protected]
Financial support:This study was sponsored by Eli Lilly.
Word count:5000/5000
Running Title:First-in-Human Studies of Brain M1AChR
Journal of Nuclear Medicine, published on August 28, 2020 as doi:10.2967/jnumed.120.246967

ABSTRACT
Objectives:This is a first-in-human study of the PET radiotracer 11C-LSN3172176 for the muscarinic
acetylcholine receptor subtype 1 (M1). The objectives of this study were to determine the appropriate kinetic
model to quantify the tracer’s binding to M1 receptors, and the reliability of the chosen quantification method.
Methods: Six healthy subjects completed the test-retest protocol and five healthy subjects completed the
baseline-scopolamine blocking protocol. Multiple modeling methods were applied to calculate volume of
distribution (VT) and binding potentials (BPND) in various brain regions. The reference region was selected from
the blocking study. The occupancy plot was applied to compute receptor occupancy by scopolamine and non-
displaceable distribution volume (VND).
Results:Tracer uptake was highest in the striatum, followed by neocortical regions and white matter, and lowest
in the cerebellum. Regional time-activity curves were fitted well by all models. The two-tissue compartment
(2TC) model fits were good, but the 2TC parameters often could not be reliably estimated. There was an
excellent correlation of VT between 2TC and one-tissue compartment (1TC) models after excluding unreliable
estimates, so the 1TC model was chosen as the most appropriate. The cerebellum showed the lowest VT,
consistent with preclinical studies showing little to no specific binding in the region. Further, cerebellar VT did
not change between baseline and blocking scans, indicating that the cerebellum is a suitable reference region.
The simplified reference tissue model (SRTM) slightly underestimated 1TC BPND and SRTM2 improved BPND
estimation. An 80-min scan duration was sufficient to quantify VT and BPND. The test-retest study showed
excellent absolute test-retest variability for 1TC VT(≤5%) and BPND(≤10%). In the baseline and blocking study,
the striatum displayed lower occupancy values than non-striatal regions, which may be attributed to differences
in regional acetylcholine concentrations.
Conclusion:The 1TC and SRTM2 models are appropriate methods for quantitative analysis of
11C-LSN3172176 imaging data. 11C-LSN3172176 displayed excellent test-retest reproducibility and is a highly
promising ligand to quantify M1 receptors in the human brain.
Keywords:Muscarinic Acetylcholine Receptor 1; Positron emission tomography; Test-retest reproducibility;
Brain imaging; Scopolamine

INTRODUCTION
The M1 subtype of muscarinic acetylcholine receptors (mAChRs) is a G protein-coupled receptor, and the
most prevalent among the five identified mAChR subtypes (M1 to M5). The M1 mAChR is richly expressed in
forebrain regions including the striatum, hippocampus, and cortical areas, but absent in the cerebellum (1). M1
abundant regions are involved in motor control, cognition, and memory regulation. As a result, the M1 is
implicated in diseases such as Alzheimer’s disease, Parkinson’s disease, and other psychiatric disorders (2,3).
M1 receptors are G protein-coupled receptors that has two interconvertible affinity states: high-affinity or active
state, and low-affinity or inactive (silent) state (4). According to the classic two-state theory of G protein-
coupled receptors, antagonist PET ligands bind to receptors in both the active and inactive states, while agonist
ligands binds only to the receptors in the high affinity, active state (5).
There are several previously reported mAChR antagonist radiotracers, e.g., 11C-scopolamine (6), 11C-
NMPB (7), [N-11C-methyl]-benztropine (8), and 11C-QNB (9). However, most of them demonstrated a lack of
selectivity to the M1 subtype, slow kinetics, or low specific binding. As for mAChR agonist radiotracers, 11C-
xanomeline and 11C-butylthio-TZTP are not selective for the M1, and also display high affinity for the sigma
receptors (10). The putative M1 agonist radiotracer 11C-AF150(S) displayed rapid kinetics in rats, but no
measurable specific binding (11). 11C-GSK1034702 was an M1 allosteric agonist with good brain uptake in
humans, but its distribution volume (VT) values were similar across brain regions, including the cerebellum,
suggesting negligible specific binding (12). More recently, 11C-(S,R)-1-Methylpiperidin-3-yl)2-cyclopentyl-2-
hydroxy-2-phenylacetate was reported to be an M1 agonist radioligand with good imaging characteristics in
monkeys (13). However, its binding was only partially blocked by the M1 selective antagonist pirenzepine,
indicating a moderate M1 selectivity. We have developed a novel M1 agonist radioligand 11C-LSN3172176
(Figure 1) (14) and evaluated it in monkeys (15). LSN3172176 exhibited high binding affinity to M1 (Ki=8.9
nM) and lower binding affinity for other mAChR subtypes, in rank order of
M1>M4(Ki=41.4nM),M5(Ki=55.6nM),M2(Ki=63.8nM)>>M3(Ki=3,031nM) (14). In monkeys, 11C-
LSN3172176 demonstrated highly favorable in vivo imaging properties such as high brain uptake, appropriate
kinetics amenable to quantitative kinetic modeling, and high specific binding signals (15).

In this study, we present first-in-human PET imaging results with the novel radiotracer 11C-LSN3172176.
Baseline and blocking studies with scopolamine were conducted to evaluate the appropriate kinetic model to
quantify tracer binding, and test-retest variability of binding parameters.
MATERIALS AND METHODS
Radiotracer Synthesis
The PET tracer 11C-LSN3172176 was synthesized as described recently (15).
Human Subjects
A total of 11 healthy human subjects were included in this study. All subjects had a comprehensive
screening assessment that included a complete physical examination with medical history, routine blood tests,
electrocardiogram and urine toxicology. Individuals were excluded if they had a current or past serious medical,
psychiatric or neurological illness (including a history of head injury with loss of consciousness), a history of
substance abuse or dependence or metal in their body which would result in MRI contraindication.
Six subjects (37±10 y;3 male and 3 female) were enrolled in a test-retest study, and another five subjects
(42±2 y;3 male and 2 female) completed a baseline-scopolamine blocking study. The study protocol was
approved by the Yale Human Investigation Committee (HIC, the local IRB) and Yale-New Haven Hospital
Radiation Safety Committee, and performed in accordance with federal guidelines and regulations of the United
States for the protection of human research subjects contained in Title 45 Part 46 of the Code of Federal
Regulations (45 CFR 46). All subjects signed a written informed consent.
Brain PET Studies
PET imaging. Subjects were administered a dose of 11C-LSN3172176 as an intravenous injection over 1
min by an automatic pump (Harvard PHD 22/2000, Harvard Apparatus Holliston, MA, USA). The approved
maximum injected mass was 10 μg per administration. Six subjects had two PET scans each on the same day,
5.8±0.9hours apart. Five subjects underwent the baseline and blocking PET scans on two consecutive days. The

blocking scan was conducted 23.6±0.3hours after scopolamine (1.5mg) was administered via transdermal patch
placed behind either the subject's left or right ear.
PET images were acquired for 120 min in list mode using the High Resolution Research Tomograph
(HRRT, Siemens Medical Systems, Knoxville, TN). A 6-min transmission scan was conducted for attenuation
correction. Dynamic scan data were reconstructed into 207 slices (1.2mm slice separation) in 33 frames
(6×30sec,3×1min,2×2min, and 22×5min) with corrections for attenuation, normalization, scatter, randoms, and
dead time using the MOLAR algorithm (16). Event-by-event motion correction (17) was included in the
reconstruction based on measurements with the Polaris Vicra sensor (NDI Systems,Waterloo,Canada) with
reflectors mounted on an elastic cap worn by the subject.
Magnetic resonance imaging. Each subject underwent an MR scan for PET image registration. MR
imaging was performed using a 3D MPRAGE pulse sequence with an echo time of 2.78ms, repetition time of
2,500ms, inversion time of 1,100ms, and flip angle of 7o on a 3T whole-body scanner (Trio;Siemens Medical
Systems) with a circularly polarized head coil.
Arterial input function measurement. Discrete blood samples were manually drawn every 10 seconds
from 10 to 90 seconds, every 15 seconds from 90seconds to 3 min, and then at 3.5, 5, 6.5, 8, 13.5, 15, 20, 25,
30, 45, 60, 75, 90, 105, and 120min. Samples were centrifuged to obtain plasma and then whole blood and
plasma were counted with a calibrated well counter.
Plasma analysis of radiotracer metabolism was performed from samples collected at 3, 8, 15, 30, 60, and
90min after injection. Metabolite analysis was performed using the column-switching HPLC method (18) to
determine the parent fraction. An ultrafiltration-based method (Centrifree,Millipore) was used for measuring
the plasma free fraction (fP). The detailed procedures have been described previously (15).
For the blocking scan of one subject, no arterial data were available. This subject was excluded from
occupancy calculations.
Image registration and regions of interest. PET images were corrected for motion by frame-by-frame
registration to a summed image (0-10 min post-injection) using a 6-parameter mutual information algorithm
(FLIRT,FSL). The summed PET image was then co-registered to the subject’s T1-weighted MR image (6-
parameter affine registration), which was subsequently co-registered to the Automated Anatomical Labeling
(AAL) template (19) in Montreal Neurological Institute (MNI) (20) space using a nonlinear transformation

(Bioimage suite) (21). Using the combined transformations from template-to-PET space, regional time-activity
curves (TACs) in 13 regions were generated: putamen, caudate, frontal cortex, occipital cortex, parietal cortex,
temporal cortex, amygdala, globus pallidus, hippocampus, thalamus, cerebellum, and centrum semiovale. The
ventral striatum was drawn on the template MR image as in previous work (22).
Quantitative analysis. Regional distribution volumes (VT) were computed using one-tissue (1TC) and two-
tissue (2TC) compartment models. Each scan and curve were fitted separately. Blood volume in the brain was
assumed to be 5% in the 1TC and 2TC models (𝐶PET t = 𝐶T t + 0.05𝐶WB t where CPET(t), CT(t), and CWB(t)
are the measured PET data, the brain activity, and whole blood activity, respectively).
Occupancy results were visualized with the Lassen plot (23) but analyzed with a nonlinear model, since
occupancy was not the same among all regions. The measured VT values in n regions at baseline and post-drug
administration were modeled as 𝑉T baseline = 𝑉ND + 𝑉S and 𝑉T blocking = 𝑉ND + 1 − 𝑟 𝑉S where VND is
the non-displaceable distribution volume, r is M1 receptor occupancy by scopolamine, and VS is the specific
distribution volume. Nonlinear least squares (NLLS) fitting (24) was used to estimate parameters 𝐩 =𝑉 , 𝑟 ,𝑉SROI ,𝑉S
ROI ,⋯ ,𝑉SROI by minimizing the following cost function:
𝑔 p = 𝑤 𝑉T baseline − 𝑉ND + 𝑉S + 𝑤 𝑉T blocking − 𝑉ND + 1 − 𝑟 𝑉S
where 𝑤 = T baseline and 𝑤 = T blocking were determined from the standard error of 1TC VT
estimates. Thus, a total of n+2 parameters were estimated using 2×n data points. A reference region was selected
by comparing VT values at baseline and blocking scans and the estimated VND.
BPND values were computed using VT values from the compartment models for all regions and the selected
reference region. The simplified reference tissue model (SRTM) and SRTM2 were also used to derive BPND
directly. In applying the SRTM2 model, all regional TACs were fitted simultaneously per scan with a common
parameter 𝑘 , the efflux rate of the reference region (coupled parameter fitting).
For VT and BPND values, the mean and standard deviation of the test-retest variability (TRV, 2×(retest–
test)/(test+retest)) and the mean of the absolute value of TRV (aTRV) were calculated. The intraclass correlation
coefficients (ICC) were also calculated.
The minimal scan duration sufficient for reliable estimation of VT and BPND was evaluated by considering
shorter datasets (30 to 120min in 10min increments,n=12). The percent difference in VT and BPND values

between x (<120min) and 120min were calculated for each scan duration. The minimum scan duration was
chosen using the criteria defined in (25):(1)the average VT ratio was between 95 and 105%;(2)the standard
deviation of the ratio was lower than 10%.
RESULTS
Radiochemistry
11C-LSN3172176 was prepared in 14±4% yield (range:5–21%) at the end of synthesis based on trapped
11C-methyl iodide. The radiochemical purity was 98±2%, and the molar activity was 692±400MBq/nmol
(range:144–1302MBq/nmol) at the end of synthesis. The average synthesis time was 48±2min.
Human Injection and Scan Parameters
The injected dose, injected mass, and specific activity at the time of injection for 11C-LSN3172176 are
listed in Table 1. Administered activity dose, injected mass, and specific activity were not statistically
significantly different between test and retest scans (2-tailed paired t test,P=0.43,P=0.19,and P=0.23,
respectively), or between baseline and blocking scans (2-tailed paired t test,P=0.81,P=0.46,and P=0.30,
respectively).
Safety
There were no adverse or clinically detectable pharmacologic effects in any of the subjects. No clinically
significant changes in vital signs, laboratory test results, or electrocardiograms were observed.
Plasma Analysis
The parent fraction of 11C-LSN3172176 in plasma decreased moderately over time (Figure 2). At 60 min
after injection, parent fractions were 66±5% and 67±5% for the test and retest scans, and 64±3% and 65±3%
for the baseline and blocking scans. Free fractions were 0.29±0.03 for test, retest, and baseline scans and
0.28±0.01 for blocking scans. There was no statistically significant difference in fP between the test and retest
scans (2-tailed paired t test,P=0.51) and the baseline and blocking scans (P=0.24). The TRV of fP was -3±11%.

Brain Distribution and Kinetics
Figure 3 shows typical images of 11C-LSN3172176 in standardized uptake value (SUV) unit. The highest
uptake was seen in the striatum regions (ventral striatum, putamen, and caudate), followed by neocortical
regions. The lowest uptake was in the cerebellum. Typical TACs and fitted curves are shown in Figure 4. For
baseline scans, peak uptake in cortical regions ranged from SUV values of 5 to 9, peaking at later times for the
regions with higher uptake. Regional TACs were fitted well with all models:1TC, 2TC, SRTM, and SRTM2.
The 2TC fitting of the TACs was significantly better than the 1TC in 44% of the fits as assessed by the F-test.
While the 2TC fits were statistically better overall, the individual parameters were often not reliably estimated
due to numerical identifiability problems (relative standard error of VT>10%). In cases where estimates were
reliable, there was an excellent match between 2TC- and 1TC-derived VT values (𝑉 , = 1.01𝑉 , −1.56,𝑅 = 0.99). Given the quality of fits and comparison of VT with the 2TC estimates, the 1TC model was
chosen as the model of choice when the arterial input function is available. The 1TC K1 estimates (mL/min/cm3)
ranged from 0.18±0.03 (centrum semiovale) to 0.49±0.12 (putamen). Estimates of 1TC VT without blood
volume correction were very similar to those with correction (𝑉 , = 0.99𝑉 , + 0.04,𝑅 =1.00). Mean regional VT values across subjects in the test/retest study are shown in Table 2. VT values were
highest in the striatum, followed by neocortical regions and white matter, and lowest in the cerebellum.
Scopolamine Blocking
Tracer uptake was reduced by scopolamine administration (Figure 3). Mean 1TC VT values across subjects
are shown in Table 3. The mean VT values in all regions except the cerebellum were reduced by scopolamine.
The mean cerebellum VT values were similar between baseline and blocking scans (4±11% difference,n=4).
Occupancy and VND values are listed in Table 4, with the assumption of uniform occupancy across regions (one-
occupancy model). Figure 5 shows the Lassen plot of the VT values averaged across subjects. It is noteworthy
that four regions (open circles) appear to belong to a different regression line than the other regions (closed
circles), with a lower slope. Thus, the assumption of uniform occupancy in all regions might not be adequate.
Therefore, occupancy and VND values were estimated assuming two occupancy groups: one for striatal regions
and the other for non-striatal regions, using a common VND (Table 4). The F test showed the two occupancy
model was significantly better than the one occupancy model (P<0.001 for all subjects). The VND value was
5.22±0.77mL/cm3, which was extremely similar to the mean cerebellum VT values (5.10±0.54 mL/cm3,n=5).
As seen in Figure 5, the cerebellum point is located on the x-axis, thus showing no blockade by scopolamine,
and supporting the use of cerebellum VT as VND. Therefore, the cerebellum was selected as the reference region.
The occupancies computed from %difference of BPND using 1TC and SRTM2 were similar level as those using
two-occupancy model (Supplemental Table 1).
Binding Potential
Shown in Table 2 are the mean BPND values calculated from 1TC and SRTM2 models across subjects.
BPND values were first calculated using SRTM, and these were well correlated to those from 1TC, but slightly
underestimated (𝐵𝑃 , = 0.90𝐵𝑃 , + 0.21,𝑅 = 0.97 ). The estimated values of 𝑘 , (1/min)
ranged from 0.065 to 0.099, while the 𝑘 , (1/min) in the cerebellum was 0.079±0.002. The values of 𝑘 ,
matched well with the 𝑘 , in the cerebellum (𝑘 , = 0.97𝑘 , + 0.005,𝑅 = 0.64). SRTM2 BPND
values matched better to the 1TC values: 𝐵𝑃 , = 0.94𝐵𝑃 , + 0.04,𝑅 = 0.98. Given the quality of
fits (Figure 4) and comparison of BPND with the 1TC estimates, SRTM2 is recommended as the best noninvasive
model for quantitative analysis.
Minimum Scan Time and Test-retest Variability of Binding Parameters
Listed in Table 2 are the minimum scan times required to achieve stable measurement of binding
parameters for each region. In general, longer scan times were needed for regions with higher VT values.
Compared with the 1TC 120-min estimates, the minimum scan was 70min for VT and 80min for BPND.
Table 5 shows the test-retest statistics for VT and BPND. The test-retest variability of VT was excellent:
aTRV≤5% in all regions and -2% for the global mean of TRV. The aTRV of 1TC BPND was also good(≤10%)
and the global mean of TRV was 1%. SRTM2 BPND showed slightly higher aTRV and TRV values than 1TC
BPND.

DISCUSSION
This is the first in human PET study using the mAChR M1 tracer 11C-LSN3172176. The primary aims of
this study were to determine an appropriate tracer kinetic model for quantitative analysis of imaging data, to
assess test-retest variability of kinetic parameters, and to evaluate a suitable reference region for simplified
analysis.
The novel PET tracer 11C-LSN3172176 showed high uptake in the brain and produced images of high
statistical quality. The pattern of the TACs demonstrated reversible binding. All regional TACs were described
well using all kinetic models: 1TC, 2TC, SRTM, and SRTM2. Based on the F-test, the 2TC model fitting was
better than the 1TC model fitting, however, regional VT values were not consistently estimated reliably by the
2TC model. On the other hand, VT values estimated by the 1TC model matched very well with those using the
2TC model. Therefore, the 1TC model was chosen as the best model for analysis of imaging data when input
function data are available. The 1TC K1 value in gray matter was 0.40 mL/cm3/min, suggesting very good
extraction of the tracer. The 1TC VT values displayed a rank order consistent with the M1 distribution in the
brain, i.e., high in striatal regions and lowest in the cerebellum. Given the high VT values, it was not surprising
that a blood volume correction was not needed.
The 1TC VT values in the cerebellum did not change between baseline and scopolamine blocking scans.
Also, the estimated VND value from occupancy estimation was very close to the cerebellum VT value. Based on
these results and a postmortem study (26), the cerebellum was selected as a reference region, satisfying the
requirements to accurately compute binding potential.
For reference region models, the SRTM and SRTM2 were evaluated for computation of BPND values.
SRTM2 coupled fit led to estimated 𝑘 value similar to the 1TC-estimated k2 in the cerebellum. SRTM2 BPND
values matched better with those from 1TC than SRTM. Therefore, SRTM2 was selected as the best noninvasive
model for quantitative analysis of 11C-LSN3172176 imaging data.
The test-retest reproducibility was excellent for both 1TC VT and BPND. The test-retest reproducibility was
slightly poorer for SRTM2 BPND, but still good. There is no published literature on reproducibility of other M1
tracers for comparison. Compared with our previously published test-retest studies with various tracers, the test-
retest reproducibility of 11C-LSN3172176 was similar to the synaptic vesicle 2A protein tracer, 11C-UCB-J (27),

and much better than other tracers, such as the kappa opioid receptor tracer 11C-LY2795050 (28) and dopamine
D2/D3 receptor tracer 11C-PHNO (29).
In the scopolamine blocking study, striatal and non-striatal regions showed different occupancy levels in
all subjects. This difference was visible in individual occupancy plots and two occupancy model was statistically
better than one occupancy model in all subjects. This result might be attributed to different endogenous
acetylcholine (ACh) concentrations between these regions. Drug occupancy is classically described as
D/(1+D+E) where D=[Drug]/IC50(Drug) and E=[ACh]/IC50(ACh), where [] denotes concentration. Therefore,
higher endogenous ACh concentration would lead to lower measured occupancy. Thus, the lower scopolamine
occupancy in the striatal regions may be caused by higher endogenous ACh concentrations. ACh exists
abundantly in the caudate and putamen in comparison with cortical regions in rat brain (30,31). Uptake of the
vesicular acetylcholine transporter tracer 18F-FEOBV was 5-6 times higher in striatum than cerebral cortices
(32). These results suggest that ACh concentrations in striatal regions are higher than those in cortical regions
in human. These differences in occupancy levels was observed because the occupancy by scopolamine was
moderate (~40%) in the present study. High occupancy (i.e., high scopolamine concentration) would diminish
an effect by endogenous ACh. Indeed the effect of endogenous ACh was undetectable during our preclinical
characterization of 11C-LY2795050 in rhesus macaques where average occupancy of 98.6% was achieved by
intravenous administration of 50μg/kg of scopolamine, without evidence of differential occupancy levels (15).
It should be noted, though, that the differences in regional occupancy levels might also be attributed to the
regional differences in the magnitude of ACh release induced by scopolamine. In rat studies (33,34),
scopolamine increased ACh release more in the frontal cortex(1,400% at peak) and hippocampus(1,200%) than
striatum(400%). If a similar effect of scopolamine on ACh occurs in human, the induced ACh release also
would lead to higher occupancy in the cortical than striatal regions. Therefore, the differential occupancy
observed in the present study could be due to the combination of these two factors: high baseline endogenous
ACh levels in the striatum, or higher induced ACh release in non-striatal regions. Further experiments are
needed to tease out these two factors.
Other possible causes for the differential occupancy by scopolamine are different levels of VND between
striatal and non-striatal regions and different proportions of binding to M1, M2, and M4 receptors. For the first
possible cause, we compared occupancy models to describe the results from the scopolamine blocking study.
The chosen model, 2 occupancies and 1 VND, was significantly better than the 1 occupancy and 1 VND model,
but not significantly different from the 2 occupancies and 2 VND model as judged by the F-test. Further, AIC of
the chosen model was smaller than the 1 occupancy and 2 VND model. These model comparison results support
a single VND value across all regions. For the next possible cause, scopolamine has similar affinity for
M1(1.1nM), M2(2.0nM), and M4(0.8nM) receptors(35). Therefore, the spatial distribution of these subtypes is
unlikely to affect the occupancy.
Finally, it is worth noting that although LSN3172176 displayed high in vitro binding affinity for the M1
mAChR(Ki=8.9 nM), it also had moderate affinities for M4(Ki=41.4nM) and M2(Ki=63.8nM). In preclinical
studies in rodents it has been demonstrated that the in vivo binding signals of 11C-LSN3172176 is predominantly
coming from M1. Nonetheless, it is possible that there are also small contributions from M4 and M2, especially
in striatal regions where levels of M4 and M2 are relatively high (14). To date a detailed mapping of the five
mAChR subtypes in the human brain is not available. Assuming that Bmax of M2/M4 is about half of that for
M1 (36), up to 10% of 11C-LSN3172176 BPND might be contributed by its binding to M2/M4. Therefore,
although 11C-LSN3172176 is fairly selective for the M1 mAChR, it is important to consider the contributions
from its M2/M4 binding when interpreting the imaging data, especially in the striatal regions. Assessment of
the exact contributions from M4 and M2 subtype binding will require future blocking studies with M4 and M2
selective compounds.
CONCLUSIONS
11C-LSN3172176, a new M1 mAChR PET tracer, displayed high brain uptake, heterogeneous distribution
among brain regions, and appropriate kinetics in the first-in-human PET study. The 1TC and SRTM2 models
were judged as the most suitable for describing the kinetics and an 80-minute scan time was sufficient to
quantify regional VT and BPND. Excellent test-retest reproducibility was found for 1TC VT and BPND. Based on
the result from blocking studies, the cerebellum was considered a suitable reference region to compute BPND.
Based on the results of this study, 11C-LSN3172176 is an excellent PET ligand to quantify M1 mAChR in the
human brain.

DISCLOSURE
LS, AJS, NK, CJ, KR, and AN were employees of Eli Lilly & Co. at the time of this study. No other
potential conflict of interest relevant to this article was reported.
ACKNOWLEDGMENTS
The authors appreciate the excellent technical assistance of the staff at the Yale University PET Center.
This study was sponsored by Eli Lilly. This publication was also made possible by CTSA Grant UL1 RR024139
jointly from the National Center for Research Resources (NCRR) and the National Center for Advancing
Translational Sciences (NCATS), components of the National Institutes of Health (NIH). Its contents are solely
the responsibility of the authors and do not necessarily represent the official view of NIH.
KEY POINTS
Question:Does 11C-LSN3172176 show suitable kinetic properties to quantify M1 muscarinic
acetylcholine receptor in humans?
Pertinent Findings:11C-LSN3172176 showed high brain uptake, favorable kinetics, high specific binding,
and excellent test-retest reproducibility.
Implications for Patient Care:Excellent kinetics of 11C-LSN3172176 will enable the quantification of
M1 receptors in human brains.
Figure legends
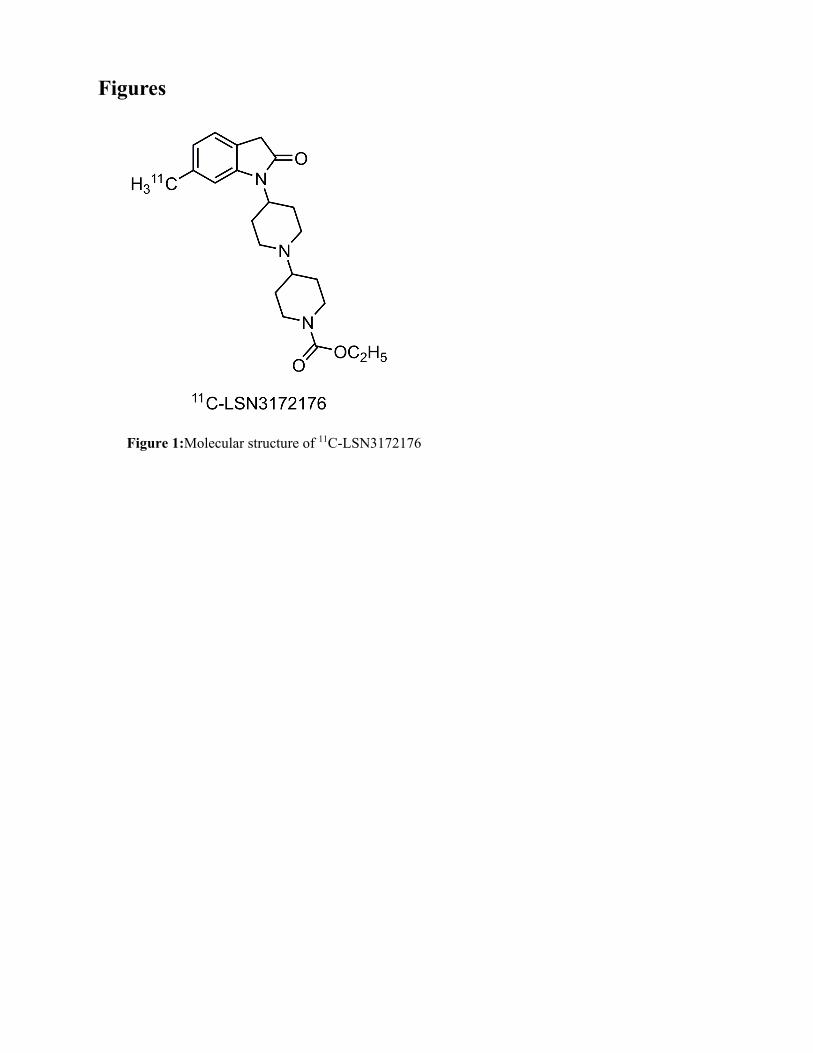
Figure 1:Molecular structure of 11C-LSN3172176
Figure 2:Mean±SD of (A) plasma parent fraction and (B) metabolite-corrected input function in the test (closed
circles) and retest (open circles) scans of 11C-LSN3172176. (C) plasma parent fraction and (D) metabolite-
corrected input function in the baseline (closed circles) and (open circles) blocking scans. Panels (B) and (D)
are displayed in SUV units.
Figure 3:MR and co-registered typical PET images of 11C-LSN3172176 under test and retest conditions in one
subject and baseline and blocking conditions in another subject. PET images were summed from 30 to 60 min
post-injection. PET images are displayed in SUV units.
Figure 4:Time-activity curves of 11C-LSN3172176 in (A) baseline and (B) blocking scans and fits with 1TC,
2TC, SRTM, and SRTM2.
Figure 5:Lassen plot of the mean regional 1TC VT values of 11C-LSN3172176 (n=4). Error bar shows standard
error of the mean. Ventral striatum (VST), putamen (PUT), caudate (CAU), pallidum (PAL), and cerebellum
(CER) are shown in open circles and other regions are shown in closed circles.
Figures
Figure 1:Molecular structure of 11C-LSN3172176

Figure 2:Mean±SD of (A)plasma parent fraction and (B)metabolite-corrected input function in the test
(closed circles) and retest (open circles) scans of 11C-LSN3172176. (C)plasma parent fraction and
(D)metabolite-corrected input function in the baseline(closed circles) and(open circles) blocking scans.
Panels (B) and (D) are displayed in SUV units.

Figure 3:MR and co-registered typical PET images of 11C-LSN3172176 under test and retest conditions
in one subject and baseline and blocking conditions in another subject. PET images were summed from 30
to 60 min post-injection. PET images are displayed in SUV units.

Figure 4:Time-activity curves of 11C-LSN3172176 in (A)baseline and (B)blocking scans and fits with
1TC, 2TC, SRTM, and SRTM2.

Figure 5:Lassen plot of the mean regional 1TC VT values of 11C-LSN3172176(n=4). Error bar shows
standard error of the mean. Ventral striatum(VST), putamen(PUT), caudate(CAU), pallidum(PAL), and
cerebellum(CER) are shown in open circles and other regions are shown in closed circles.

Tables
Table 1:Subject information and PET scan parameters
Parameter Test(n=6) Retest(n=6) Baseline(n=5) Blocking(n=5)
Age(y) 38±10 43±2
Body weight(kg) 81±16 88±13
Injected dose(MBq) 559±109 584±152 601±74 579±141
Specific activity at time of injection(MBq/nmol) 452±83 400±100 139±42 158±31
Injected mass(μg/kg) 0.006±0.002 0.008±0.004 0.021±0.008 0.017±0.006
Data are mean±SD.

Table 2:Binding parameters from test-retest study of 11C-LSN3172176
Regions
1TC VT(mL/cm3)(%COV) (n=6) 1TC BPND(%COV) (n=6) SRTM2 BPND(%COV) (n=6)
test retest
Minimum
scan time
(min)
test retest
Minimum
scan time
(min)
test retest
Ventral striatum 48.5(16%) 48.9(20%) 50 8.87(12%) 8.69(17%) 50 8.15(16%) 7.76(16%)
Putamen 38.6(22%) 39.3(22%) 60 6.82(20%) 6.74(18%) 60 6.31(23%) 5.99(17%)
Caudate 30.2(19%) 30.4(20%) 60 5.13(15%) 4.98(14%) 70 4.66(19%) 4.39(14%)
Amygdala 28.8(21%) 28.8(18%) 40 4.80(14%) 4.67(8%) 50 4.68(20%) 4.30(9%)
Temporal cortex 27.4(15%) 27.9(14%) 60 4.56(10%) 4.52(10%) 70 4.54(11%) 4.34(7%)
Occipital cortex 26.7(16%) 27.3(14%) 60 4.42(9%) 4.41(9%) 70 4.40(8%) 4.27(7%)
Parietal cortex 25.5(16%) 26.1(13%) 60 4.18(9%) 4.16(9%) 60 4.16(9%) 4.03(8%)
Frontal cortex 24.4(17%) 24.7(15%) 60 3.96(14%) 3.88(12%) 70 4.00(14%) 3.80(10%)
Hippocampus 17.5(18%) 18.0(15%) 70 2.55(16%) 2.58(16%) 80 2.71(21%) 2.71(16%)
Globus pallidus 16.4(24%) 16.6(24%) 40 2.31(25%) 2.27(24%) 40 2.26(28%) 2.12(24%)
Centrum semiovale 9.0(16%) 9.4(15%) 30 0.82(16%) 0.85(13%) 40 0.78(15%) 0.79(17%)
Thalamus 8.7(19%) 9.0(19%) 30 0.76(27%) 0.76(20%) 30 0.73(30%) 0.72(21%)
Cerebellum 4.9(12%) 5.1(14%) 30
%COV:coefficient of variation (intersubject variability).

Table 3:Binding parameters from baseline-blocking study of 11C-LSN3172176
Regions 1TC VT (mL/cm3)(%COV) 1TC BPND (%COV)
baseline(n=5) blocking(n=4) baseline(n=5) blocking(n=4)
Ventral striatum 44.6(10%) 34.0(12%) 7.82(8%) 5.68(7%)
Putamen 37.2(9%) 26.6(11%) 6.37(7%) 4.25(11%)
Caudate 29.7(19%) 21.2(24%) 4.85(14%) 3.14(19%)
Amygdala 27.4(12%) 18.9(15%) 4.44(16%) 2.71(10%)
Temporal cortex 24.7(9%) 16.5(14%) 3.89(8%) 2.25(10%)
Occipital cortex 23.8(7%) 14.9(11%) 3.71(7%) 1.94(10%)
Parietal cortex 23.1(7%) 14.9(13%) 3.59(11%) 1.94(14%)
Frontal cortex 22.5(12%) 14.6(15%) 3.45(11%) 1.88(13%)
Hippocampus 17.7(11%) 12.4(13%) 2.51(15%) 1.44(13%)
Globus pallidus 15.6(9%) 12.6(17%) 2.12(24%) 1.51(35%)
Centrum semiovale 8.7(14%) 6.8(14%) 0.72(28%) 0.34(40%)
Thalamus 9.4(13%) 7.3(9%) 0.86(12%) 0.43(12%)
Cerebellum 5.1(11%) 5.1(10%)
%COV:coefficient of variation (intersubject variability).

Table 4:Occupancy by scopolamine and non-displaceable distribution volume 11C-
LSN3172176
One occupancy model Two occupancy model
Occupancy(%) VND(mL/cm3) Non-striatum
occupancy(%)
Striatum
occupancy(%) VND(mL/cm3)
Subject 1 47(7%) 3.87(15%) 52(4%) 41(5%) 4.17(5%)
Subject 2 34(15%) 5.24(20%) 44(8%) 27(15%) 6.01(6%)
Subject 3 31(13%) 4.49(21%) 36(7%) 24(19%) 5.51(8%)
Subject 4 39(7%) 4.92(13%) 43(4%) 33(8%) 5.19(6%)
Mean±SD 4.63±0.59 5.22±0.77
Best fit values using nonlinear analysis (relative standard error %).

Table 5:Test-retest reproducibility parameters of 11C-LSN3172176
Regions 1TC VT(mL/cm3)(n=6) 1TC BPND(n=6) SRTM2 BPND(n=6)
*aTRV *TRV ICC *aTRV *TRV ICC *aTRV *TRV ICC
Ventral striatum 5% 0±7% 0.92 7% 3±8% 0.87 8% 7± 6% 0.83
Putamen 2% -2±2% 0.99 4% 1±4% 0.98 11% 6±12% 0.84
Caudate 1% 0±1% 1.00 4% 3±3% 0.96 6% -1±8% 0.79
Amygdala 3% -1±4% 0.99 6% 2±7% 0.81 8% 6±8% 0.67
Temporal cortex 3% -2±3% 0.98 4% 1±5% 0.92 6% 4±7% 0.61
Occipital cortex 4% -3±5% 0.93 6% 0±7% 0.72 9% 1±11% 0.34
Parietal cortex 5% -2±6% 0.92 6% 0±8% 0.67 8% 3±10% 0.35
Frontal cortex 4% -1±4% 0.97 6% 2±7% 0.89 7% 4±7% 0.78
Hippocampus 4% -4±4% 0.96 6% -1±8% 0.90 8% 3±11% 0.87
Globus pallidus 4% -2±5% 0.98 6% 2±9% 0.95 9% 4±9% 0.94
Centrum semiovale 4% -4±3% 0.94 7% -4±8% 0.87 7% 4±8% 0.91
Thalamus 4% -3±4% 0.97 10% -1±12% 0.91 11% -1±13% 0.88
Cerebellum 4% -3±3% 0.96
*TRV=2×(test–retest)/(test+retest), and aTRV is the absolute value of TRV.

REFERENCES
1. Mash DC,Potter LT. Autoradiographic localization of M1 and M2 muscarine receptors in the rat brain. Neuroscience.1986;19:551-564.
2. Douchamps V,Mathis C. A second wind for the cholinergic system in Alzheimer's therapy. Behav Pharmacol.2017;28:112-123.
3. Bymaster FP,Felder C,Ahmed S,McKinzie D. Muscarinic receptors as a target for drugs treating schizophrenia. Curr Drug Targets CNS Neurol Disord.2002;1:163-181.
4. Leff P. The two-state model of receptor activation. Trends Pharmacol Sci.1995;16:89-97. 5. Shalgunov V,van Waarde A,Booij J,Michel MC,Dierckx R,Elsinga PH. Hunting for the high-
affinity state of G-protein-coupled receptors with agonist tracers: Theoretical and practical considerations for positron emission tomography imaging. Med Res Rev.2019;39:1014-1052.
6. Vora MM,Finn RD,Boothe TE,Liskwosky DR,Potter LT. [N-methyl-C-11]-scopolamine - synthesis and distribution in rat-brain. J Labelled Compd Rad.1983;20:1229-1236.
7. Mulholland GK, Kilbourn MR, Sherman P, et al. Synthesis, in vivo biodistribution and dosimetry of [11C]N-methylpiperidyl benzilate ([11C]NMPB), a muscarinic acetylcholine receptor antagonist. Nucl Med Biol.1995;22:13-17.
8. Dewey SL, MacGregor RR, Brodie JD, et al. Mapping muscarinic receptors in human and baboon brain using [N-11C-methyl]-benztropine. Synapse.1990;5:213-223.
9. Varastet M,Brouillet E,Chavoix C, et al. In vivo visualization of central muscarinic receptors using [11C]quinuclidinyl benzilate and positron emission tomography in baboons. Eur J Pharmacol.1992;213:275-284.
10. Farde L,Suhara T,Halldin C, et al. PET study of the M1-agonists [11C]xanomeline and [11C]butylthio-TZTP in monkey and man. Dementia.1996;7:187-195.
11. Buiter HJ,Windhorst AD,Huisman MC, et al. [11C]AF150(S), an agonist PET ligand for M1 muscarinic acetylcholine receptors. EJNMMI Res.2013;3:19.
12. Ridler K,Cunningham V,Huiban M, et al. An evaluation of the brain distribution of [(11)C]GSK1034702, a muscarinic-1 (M 1) positive allosteric modulator in the living human brain using positron emission tomography. EJNMMI Res.2014;4:66.
13. Malmquist J, Varnas K, Svedberg M, et al. Discovery of a novel muscarinic receptor PET radioligand with rapid kinetics in the monkey brain. ACS Chem Neurosci.2018;9:224-229.
14. Mogg AJ,Eessalu T,Johnson M, et al. In vitro pharmacological characterization and in vivo validation of LSN3172176 a novel M1 selective muscarinic receptor agonist tracer molecule for positron emission tomography. J Pharmacol Exp Ther.2018;365:602-613.
15. Nabulsi NB,Holden D,Zheng MQ, et al. Evaluation of (11)C-LSN3172176 as a novel PET Tracer for imaging M1 muscarinic acetylcholine receptors in nonhuman primates. J Nucl Med.2019;60:1147-1153.
16. Carson RE,Barker WC,Liow JS,Johnson CA. Design of a motion-compensation OSEM list-mode algorithm for resolution-recovery reconstruction for the HRRT. IEEE 2003 Nuclear Science Symposium Conference Record. 2003;5:3281-3285.
17. Jin X, Mulnix T, Gallezot JD, Carson RE. Evaluation of motion correction methods in human brain PET imaging--a simulation study based on human motion data. Med Phys.2013;40:102503.
18. Hilton J,Yokoi F,Dannals RF,Ravert HT,Szabo Z,Wong DF. Column-switching HPLC for the analysis of plasma in PET imaging studies. Nucl Med Biol.2000;27:627-630.
19. Tzourio-Mazoyer N,Landeau B,Papathanassiou D, et al. Automated anatomical labeling of activations in SPM using a macroscopic anatomical parcellation of the MNI MRI single-subject brain. Neuroimage.2002;15:273-289.
20. Holmes CJ,Hoge R,Collins L,Woods R,Toga AW,Evans AC. Enhancement of MR images using registration for signal averaging. J Comput Assist Tomogr.1998;22:324-333.
21. Papademetris X,Jackowski MP,Rajeevan N, et al. BioImage Suite: An integrated medical image analysis suite: An update. Insight J.2006;2006:209.
22. Gaiser EC, Gallezot JD, Worhunsky PD, et al. Elevated dopamine D2/3 receptor availability in obese individuals: a PET imaging study with [(11)C](+)PHNO. Neuropsychopharmacology.2016;41:3042-3050.
23. Cunningham VJ, Rabiner EA, Slifstein M, Laruelle M, Gunn RN. Measuring drug occupancy in the absence of a reference region: the Lassen plot re-visited. J Cereb Blood Flow Metab. 2010;30:46-50.
24. Naganawa M,Gallezot JD,Rossano S,Carson RE. Quantitative PET imaging in drug development: estimation of target occupancy. Bull Math Biol.2019;81:3508-3541.
25. Frankle WG,Huang Y,Hwang DR, et al. Comparative evaluation of serotonin transporter radioligands 11C-DASB and 11C-McN 5652 in healthy humans. J Nucl Med.2004;45:682-694.
26. Cortes R,Probst A,Palacios JM. Quantitative light microscopic autoradiographic localization of cholinergic muscarinic receptors in the human brain: forebrain. Neuroscience.1987;20:65-107.
27. Finnema SJ,Nabulsi NB,Mercier J, et al. Kinetic evaluation and test-retest reproducibility of [(11)C]UCB-J, a novel radioligand for positron emission tomography imaging of synaptic vesicle glycoprotein 2A in humans. J Cereb Blood Flow Metab.2018;38:2041-2052.
28. Naganawa M,Zheng MQ,Henry S, et al. Test-retest reproducibility of binding parameters in humans with 11C-LY2795050, an antagonist PET radiotracer for the kappa opioid receptor. J Nucl Med.2015;56:243-248.
29. Gallezot JD, Zheng MQ, Lim K, et al. Parametric imaging and test-retest variability of 11C-(+)-PHNO binding to D2/D3 dopamine receptors in humans on the high-resolution research tomograph PET scanner. J Nucl Med.2014;55:960-966.
30. Hoover DB,Muth EA,Jacobowitz DM. A mapping of the distribution of acetycholine, choline acetyltransferase and acetylcholinesterase in discrete areas of rat brain. Brain Res.1978;153:295-306.
31. Shariatgorji M,Nilsson A,Goodwin RJ, et al. Direct targeted quantitative molecular imaging of neurotransmitters in brain tissue sections. Neuron.2014;84:697-707.
32. Petrou M,Frey KA,Kilbourn MR, et al. In vivo imaging of human cholinergic nerve terminals with (-)-5-(18)F-fluoroethoxybenzovesamicol: biodistribution, dosimetry, and tracer kinetic analyses. J Nucl Med.2014;55:396-404.
33. Toide K,Arima T. Effects of cholinergic drugs on extracellular levels of acetylcholine and choline in rat cortex, hippocampus and striatum studied by brain dialysis. Eur J Pharmacol.1989;173:133-141.
34. Day J, Damsma G, Fibiger HC. Cholinergic activity in the rat hippocampus, cortex and striatum correlates with locomotor activity: an in vivo microdialysis study. Pharmacol Biochem Behav.1991;38:723-729.
35. Bolden C,Cusack B,Richelson E. Antagonism by antimuscarinic and neuroleptic compounds at the five cloned human muscarinic cholinergic receptors expressed in Chinese hamster ovary cells. J Pharmacol Exp Ther.1992;260:576-580.
36. Piggott MA,Owens J,O'Brien J, et al. Muscarinic receptors in basal ganglia in dementia with Lewy bodies, Parkinson's disease and Alzheimer's disease. J Chem Neuroanat.2003;25:161-173.

Supplemental Table 1: The occupancies computed from %difference of BPND using 1TC
and SRTM2
1TC BPND SRTM2 BPND
Non-striatum
occupancy(%)
Striatum
occupancy(%)
Non-striatum
occupancy(%)
Striatum
occupancy(%)
Subject 1 48% 33% 43% 27%
Subject 2 52% 37% 50% 33%
Subject 3 40% 29% 38% 27%
Subject 4 45% 33% 46% 34%
Recommended