first investment first investment groupgroup
March 26, 2009March 26, 2009
2009 Economic Update2009 Economic UpdateSteve FrantzSteve Frantz
Senior Managing DirectorSenior Managing DirectorChief Investment OfficerChief Investment Officer

2
Post WWII Recessions Typically Last 10 MonthsDuration of Economic Recessions
0
10
20
30
40
50
60
70
Recession Periods
# o
f M
on
ths
Average back to 1945 = 10 months 2009 = 15 months
Source: National Bureau of Economic Research, Merrill Lynch

3
Recessions Last 18 Months On Average Back to 1855
Duration of Economic Recessions
0
10
20
30
40
50
60
70
1857
-185
8
1960
-186
1
1865
-186
7
1869
-187
0
1873
-187
9
1882
-188
5
1887
-188
8
1890
-189
1
1893
-189
4
1895
-189
7
1899
-190
0
2002
-190
4
1907
-190
8
1910
-191
2
1913
-191
4
1918
-191
9
1920
-192
1
1923
-192
4
1926
-192
7
1929
-193
3
1937
-193
819
45
1948
-194
9
1953
-195
4
1957
-195
8
1960
-196
1
1969
-197
0
1973
-197
519
80
1981
-198
2
1990
-199
120
0120
09
Recession Periods
# o
f M
on
ths
Average back to 1855 = 18 months
Source: National Bureau of Economic Research, Merrill Lynch

4
Stock Market Bottoms 60-70% Of The Way Through A Recession
*Average of 1969-70, 1973-75, 1981-82, 1990-91, and 2001 recessionsShaded area represents recession periodSource: National Bureau of Economic Research, Merrill Lynch
S&P 500 indexed to 100 at start of recession*
110
105
100
95
90
85
80
-52 -39 -26 -13 0 13 26 39 52
Start of recessionEnd of recession

5
Why So Severe?
Source: BEA, JPMorgan Asset Management

6
What Has Been The Primary Driver?
Source: Census Bureau, FactSet, EcoWin, JPMorgan Asset Management Source: (top chart) Census Bureau, FactSet, EcoWin, JPMorgan Asset Management
Source: (bottom chart) Census Bureau, Federal Reserve Board, BEA, JPMorgan Asset Management
7
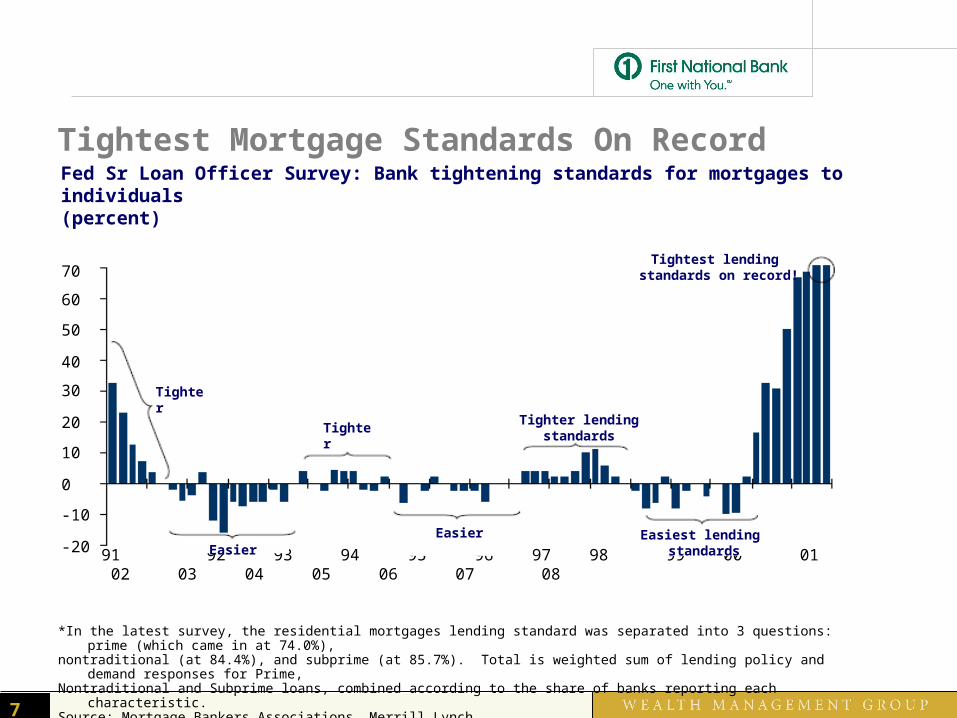
Tightest Mortgage Standards On Record
*In the latest survey, the residential mortgages lending standard was separated into 3 questions: prime (which came in at 74.0%),nontraditional (at 84.4%), and subprime (at 85.7%). Total is weighted sum of lending policy and demand responses for Prime,Nontraditional and Subprime loans, combined according to the share of banks reporting each characteristic.Source: Mortgage Bankers Associations, Merrill Lynch
Fed Sr Loan Officer Survey: Bank tightening standards for mortgages to individuals(percent)
70
60
50
40
30
20
10
0
-10
-20
91 92 93 94 95 96 97 98 99 00 01 02 03 04 05 06 07 08
Tighter
Tighter
Tighter lending standards
Tightest lending standards on record!
EasierEasier Easiest lending
standards

8
Omaha Housing Market
2008 2007 2006 2005 2004 2003
Avg. List Price Residential Closed
$172,147 $176,412 $178,324 $180,570 $166,738 $164,251
Avg. Sales Price Residential Closed
$166,822 $172,251 $178,578 $177,526 $165,929 $163,235
Avg. Market Time Residential Closed
71 68 70 54 52 52
Avg. Sales Closed as % of Avg. List Price
97% 98% 100% 98% 100% 99%
Total Volume $1.59B $1.93B $1.79B $1.95B $1.74B $1.60B
Source: Omaha Board of Realtors, MLS Data

9
US Debt-To-Income Ration Rose As Much In The Past 7 Years As It Did In The Previous 39 Years
Source: Mortgage Bankers Associations, Merrill Lynch
Household Debt-to-Income Ratio (percent)
140
130
120
110
100
90
80
70
60
50
40
30
52 56 60 64 68 72 76 80 84 88 92 96 00 04 08
1962 = 63%
2001 = 101%
Peak = 139%

10
National Debt as a Percent of GDP
Source: zFacts.com
1950 1960 1970 1980 1990 2000 2010
90%
80%
70%
60%
50%
40%
30%
20%
10%
0%
The National Debt as a Percent of
Gross Domestic Product(Data from whitehouse.gov)
2008 OMB
Budget
Prediction
Truman
Ike
Kennedy
LBJ
Nixon
Ford
Bush
Reagan
Clinton
W. Bush
zFacts.com

11
2009 Forecast 1Q GDP Worst for Economy
Modestly Positive GDP by 4Q
Unemployment Peaks 3Q above 8%
Equities – End Year Higher
Treasuries – End Year Lower
Oil Prices Higher by End of Year
Housing Market Bottoms – 2Q/3Q 2009
First Investment Group investment products are: *Not FDIC insured *May go down in value *Not financial institutionguaranteed *Not a deposit *Not insured by any federal government agency.

first investment first investment groupgroup
March 26, 2009March 26, 2009
2009 Economic Update2009 Economic UpdateSteve FrantzSteve Frantz
Senior Managing DirectorSenior Managing DirectorChief Investment OfficerChief Investment Officer
Recommended