FLIGHT TIME COMPONENTS AND THEIR DELAYS ON US DOMESTIC ROUTES
G i Sk lGerasimos SkaltsasDr. Peter BelobabaProf. Amy Cohn
MIT GLOBAL AIRLINE INDUSTRY PROGRAMIAB/Industry Consortium Joint MeetingIAB/Industry Consortium Joint Meeting
November 4, 2010
Database
D t bDatabase
FAA Aviation System Performance Metrics detailed flight data for 77 Airportsg p 80% of all scheduled domestic commercial flights in 2009 88% of all domestic enplanements (based on the T‐100 Domestic Segment )
Final analyzed sample
2276 directional non‐stop routes between 72 ASPM Airports operated by 40 US carriers in daily basisoperated by 40 US carriers in daily basis 54% of the all scheduled domestic commercial flights in 2009.
2
Carrier‐Routes in the Sample
133659%
1400
1600
59926%
25011% 62 27400
600
800
1000
1200
umbe
r of rou
tes
11%3%
271%
20
200
400
1 2 3 4 5 6
Nu
Number of carriers
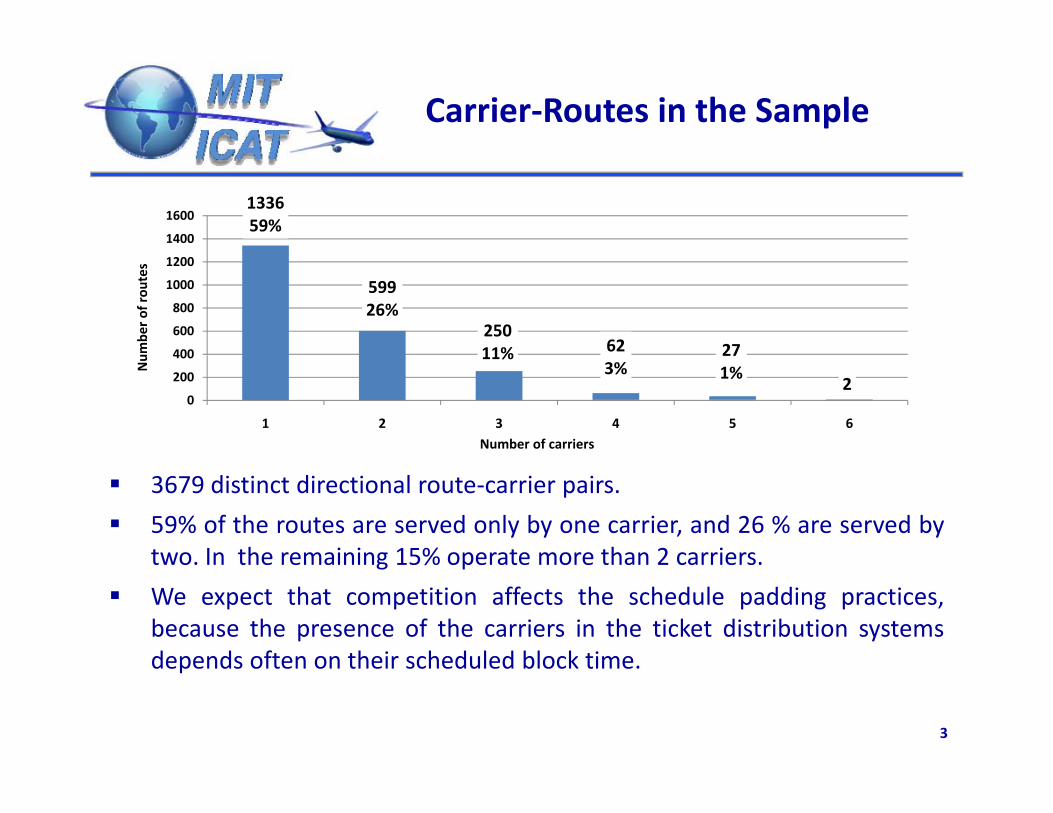
3679 distinct directional route‐carrier pairs.
59% of the routes are served only by one carrier, and 26 % are served bytwo In the remaining 15% operate more than 2 carrierstwo. In the remaining 15% operate more than 2 carriers.
We expect that competition affects the schedule padding practices,because the presence of the carriers in the ticket distribution systemsdepends often on their scheduled block time
3
depends often on their scheduled block time.
Schedule Padding by Time of Day(ORD – JFK, 2009)(ORD JFK, 2009)
140
150
160
minutes)
25 min
110
120
130
140
ed Block Tim
e (m
100
09‐10 10‐11 12‐13 13‐14 14‐15 15‐16 16‐17 17‐18 18‐19 19‐20 20‐21 21‐22 22‐23 23‐24Sche
dule
Scheduled Arrival Time
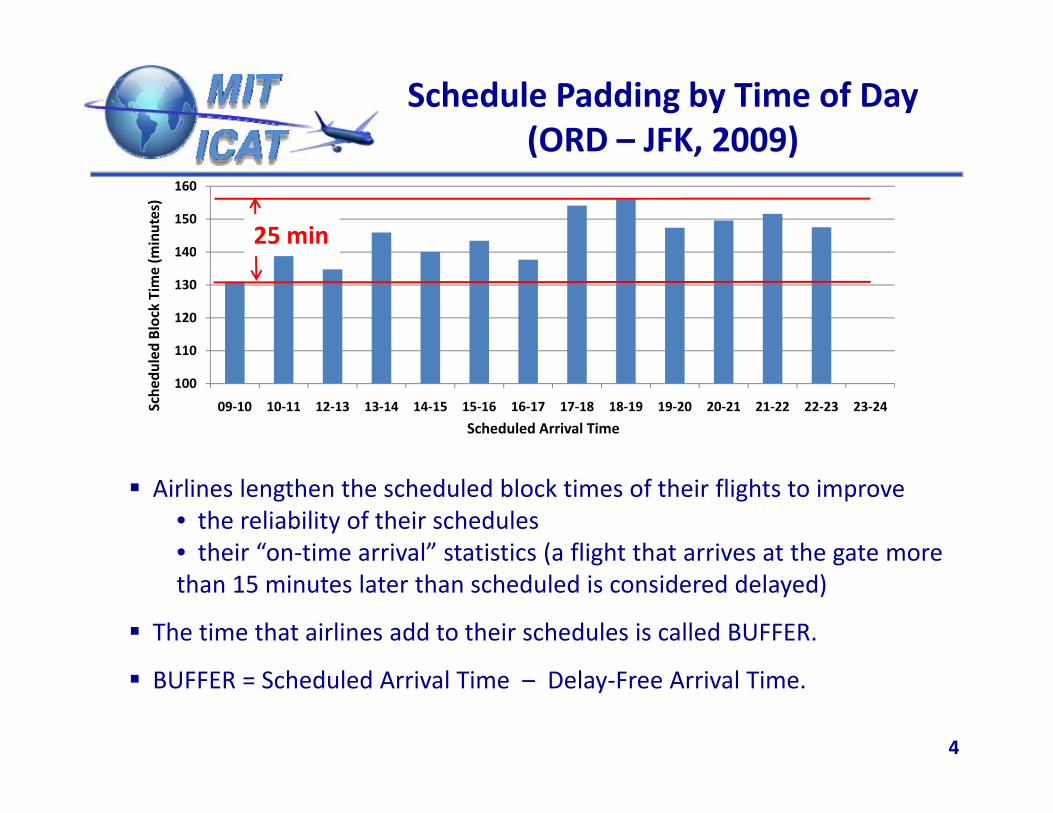
Airlines lengthen the scheduled block times of their flights to improve• the reliability of their schedules• their “on‐time arrival” statistics (a flight that arrives at the gate moretheir on time arrival statistics (a flight that arrives at the gate morethan 15 minutes later than scheduled is considered delayed)
The time that airlines add to their schedules is called BUFFER.
4
BUFFER = Scheduled Arrival Time – Delay‐Free Arrival Time.
Understanding theMeasurement of DelayMeasurement of Delay
5
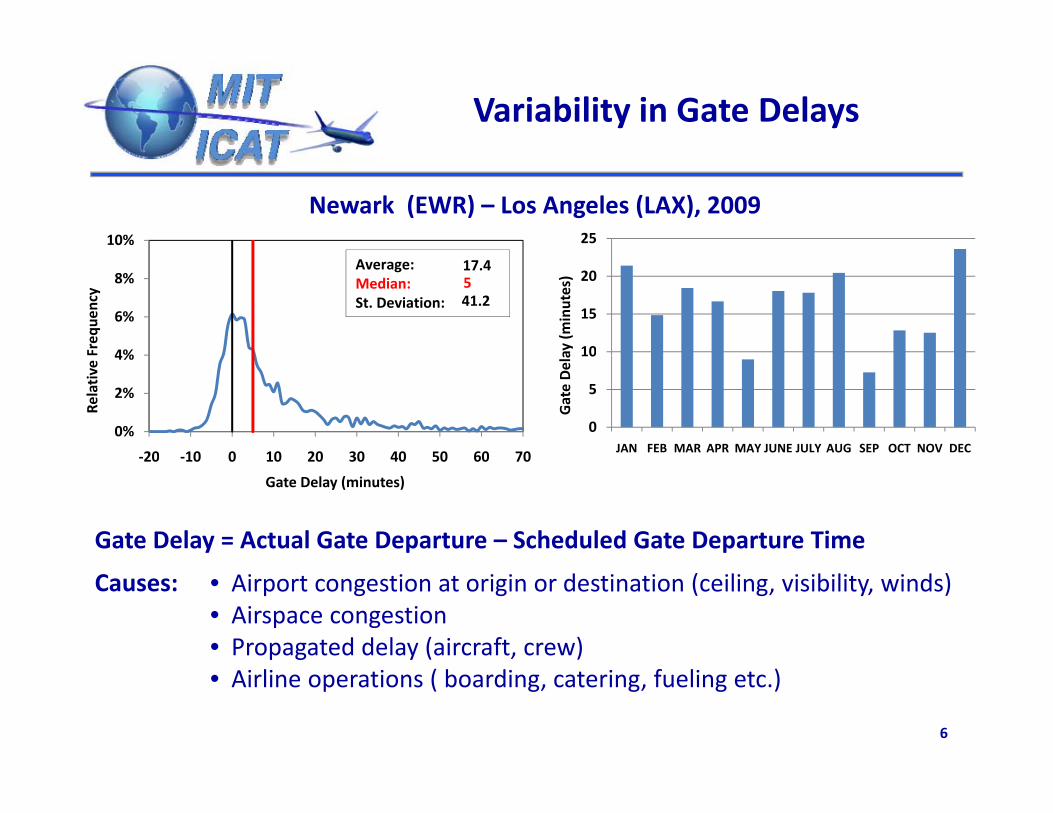
Variability in Gate Delays
25
Newark (EWR) – Los Angeles (LAX), 200910%
10
15
20
ay (m
inutes)
4%
6%
8%
Freq
uency
17.4Average:Median:St. Deviation:
541.2
0
5
10
JAN FEB MAR APR MAY JUNE JULY AUG SEP OCT NOV DEC
Gate Dela
0%
2%
4%
‐20 ‐10 0 10 20 30 40 50 60 70
Relative
Gate Delay = Actual Gate Departure – Scheduled Gate Departure Time
‐20 ‐10 0 10 20 30 40 50 60 70
Gate Delay (minutes)
Causes: • Airport congestion at origin or destination (ceiling, visibility, winds)• Airspace congestion • Propagated delay (aircraft, crew)
6
• Airline operations ( boarding, catering, fueling etc.)
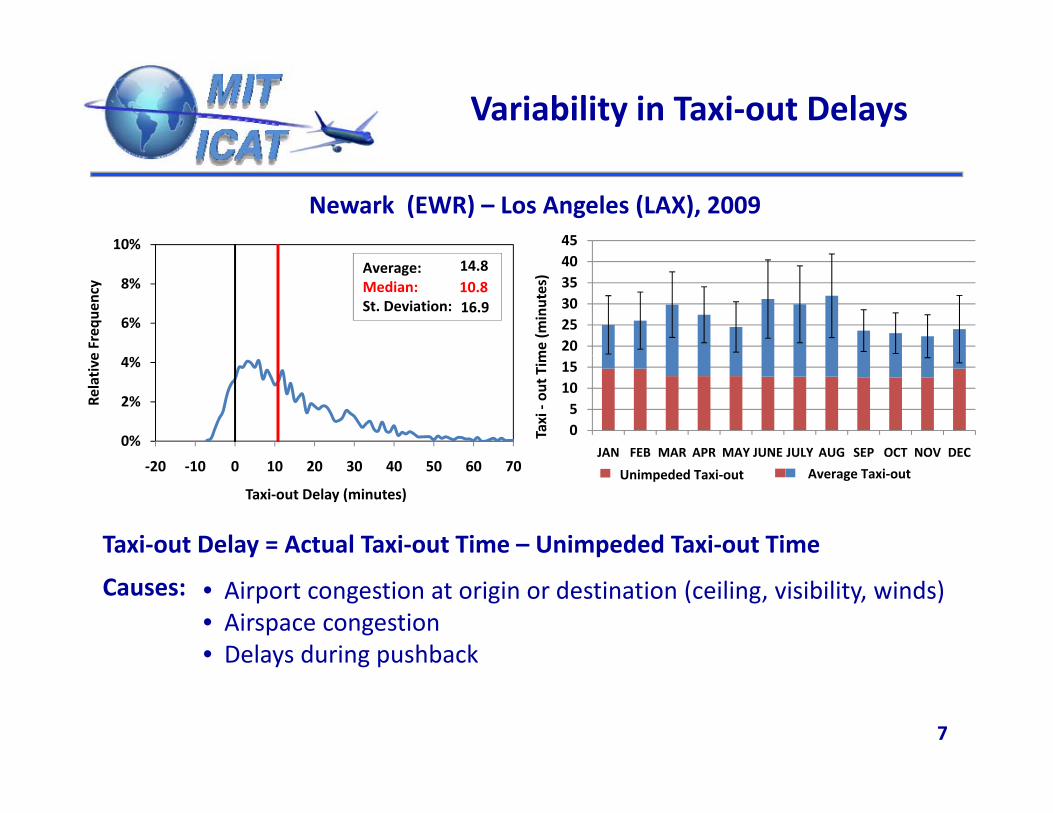
Variability in Taxi‐out Delays
Newark (EWR) – Los Angeles (LAX), 20094510%
2025303540
me (m
inutes)
6%
8%
e Freq
uency
14.8Average:Median: St. Deviation:
10.816.9
051015
JAN FEB MAR APR MAY JUNE JULY AUG SEP OCT NOV DEC
Taxi ‐ou
t Tim
0%
2%
4%
Relative
Unimpeded Taxi‐out Average Taxi‐out
Taxi‐out Delay = Actual Taxi‐out Time – Unimpeded Taxi‐out Time
‐20 ‐10 0 10 20 30 40 50 60 70
Taxi‐out Delay (minutes)
Causes: • Airport congestion at origin or destination (ceiling, visibility, winds)• Airspace congestion • Delays during pushback
7
y g p
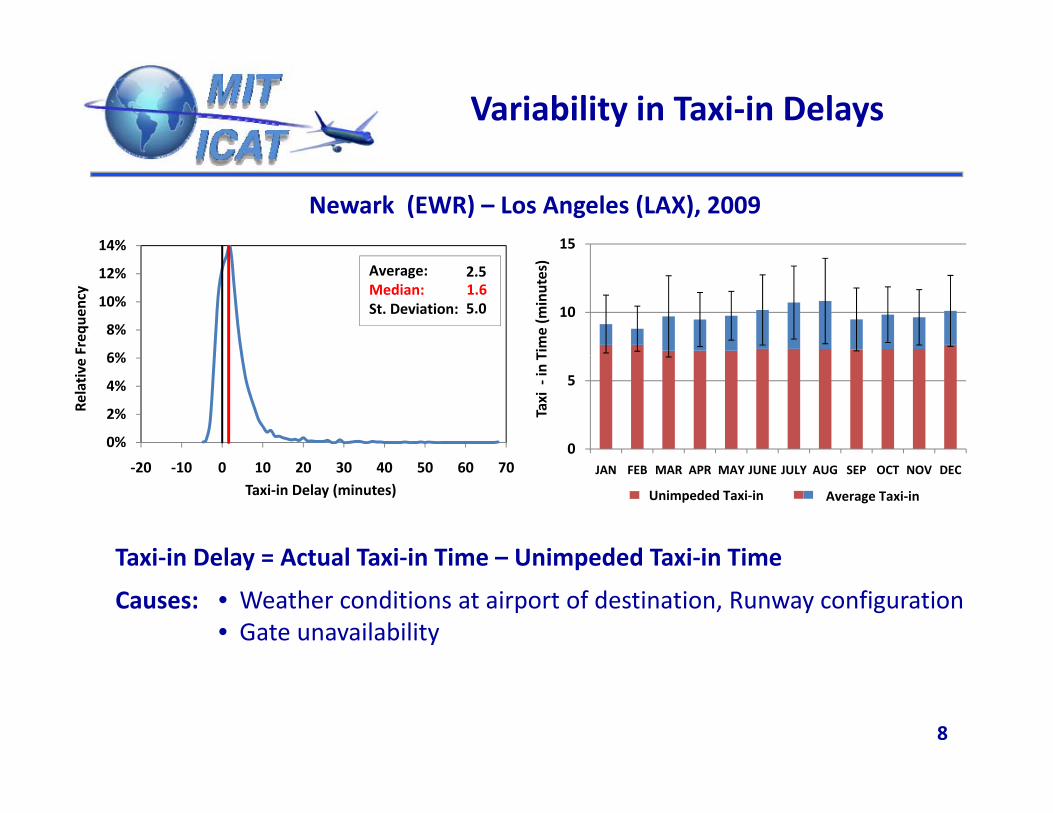
Variability in Taxi‐in Delays
14% 15
Newark (EWR) – Los Angeles (LAX), 2009
6%
8%
10%
12%
Freq
uency
2.5Average:Median:St. Deviation:
1.65.0 10
Time (m
inutes)
0%
2%
4%
6%
Relative
0
5
Taxi ‐in T
‐20 ‐10 0 10 20 30 40 50 60 70Taxi‐in Delay (minutes)
JAN FEB MAR APR MAY JUNE JULY AUG SEP OCT NOV DEC
Unimpeded Taxi‐in Average Taxi‐in
Taxi‐in Delay = Actual Taxi‐in Time – Unimpeded Taxi‐in TimeTaxi in Delay = Actual Taxi in Time Unimpeded Taxi in Time
Causes: • Weather conditions at airport of destination, Runway configuration• Gate unavailability
8
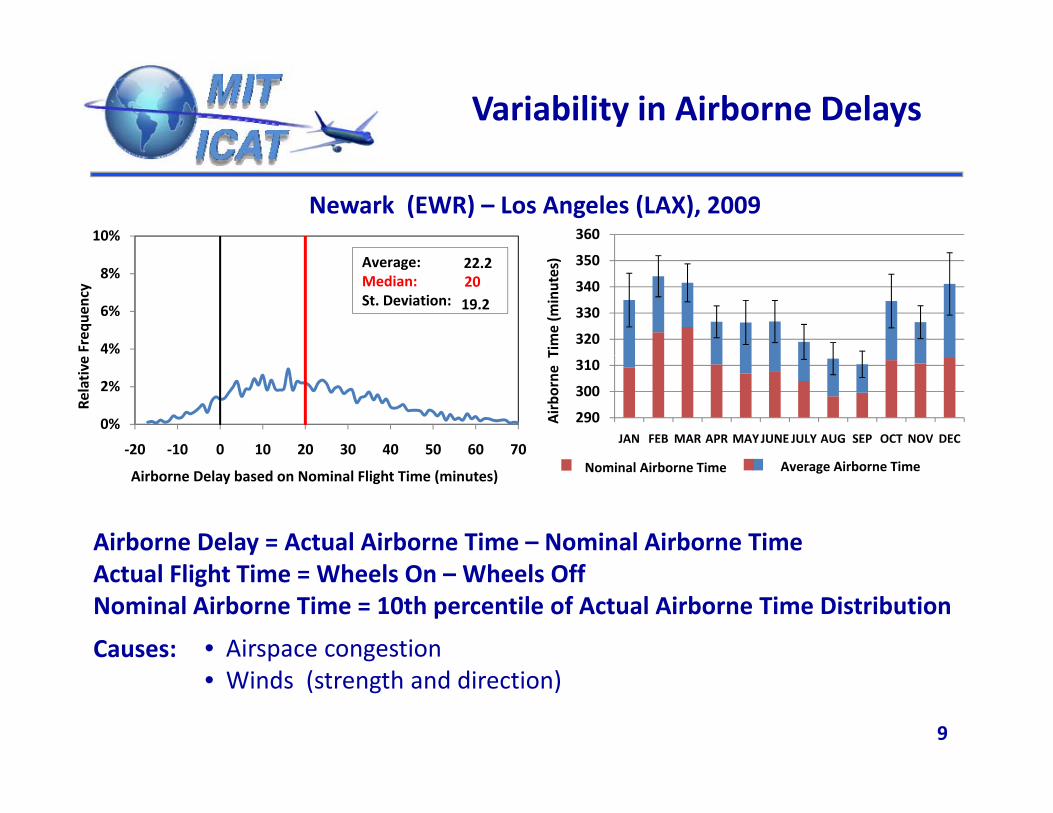
Variability in Airborne Delays
Newark (EWR) – Los Angeles (LAX), 200936010%
320
330
340
350
Time (m
inutes)
4%
6%
8%
Freq
uency
22.2Average:Median: St. Deviation:
2019.2
290
300
310
JAN FEB MAR APR MAYJUNE JULY AUG SEP OCT NOV DEC
Airbo
rne T
0%
2%
‐20 ‐10 0 10 20 30 40 50 60 70
Relative
Average Airborne TimeNominal Airborne Time
Airborne Delay = Actual Airborne Time – Nominal Airborne Time
Airborne Delay based on Nominal Flight Time (minutes)
Actual Flight Time = Wheels On – Wheels OffNominal Airborne Time = 10th percentile of Actual Airborne Time Distribution
Causes: • Airspace congestion
9
• Winds (strength and direction)
Variability in Block Delays
400
)
Newark (EWR) – Los Angeles (LAX), 200910%
350360370380390
k Time (m
inutes
4%
6%
8%
ive Freq
uency ‐3.8Average:
Median: St. Deviation:
‐624.1
320330340350
JAN FEB MAR APR MAY JUNE JULY AUG SEP OCT NOV DEC
Block
A S h d l d Bl k Ti A A l Bl k Ti0
0%
2%
‐70 ‐50 ‐30 ‐10 10 30 50 70
Relati
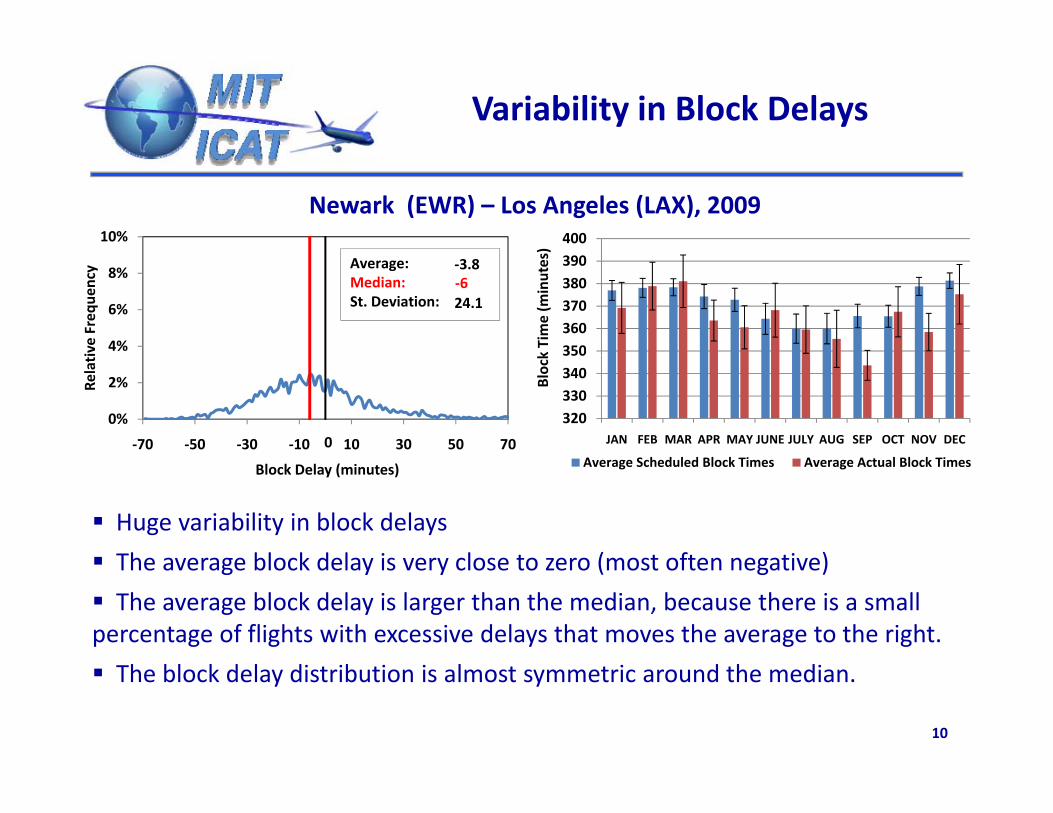
Huge variability in block delays
The average block delay is very close to zero (most often negative)
Average Scheduled Block Times Average Actual Block Times Block Delay (minutes)
The average block delay is very close to zero (most often negative)
The average block delay is larger than the median, because there is a small percentage of flights with excessive delays that moves the average to the right.
10
The block delay distribution is almost symmetric around the median.
Distribution of Block Delays(January 2009)
6%7%8%
rier pairs
( a ua y 009)
1%2%3%4%5%
age of ro
ute‐carr
0%
Percen
ta
Average Block Delay (minutes)
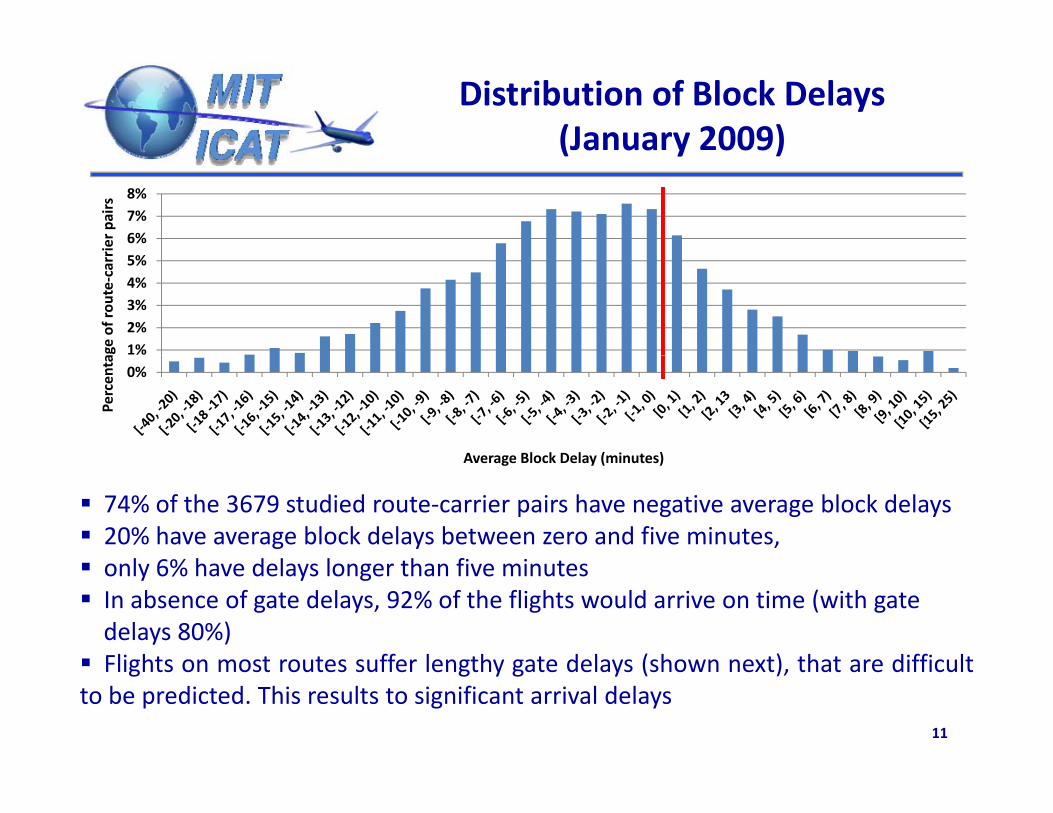
74% of the 3679 studied route‐carrier pairs have negative average block delays 20% have average block delays between zero and five minutes,
l 6% h d l l h fi i
Average Block Delay (minutes)
only 6% have delays longer than five minutes In absence of gate delays, 92% of the flights would arrive on time (with gatedelays 80%)
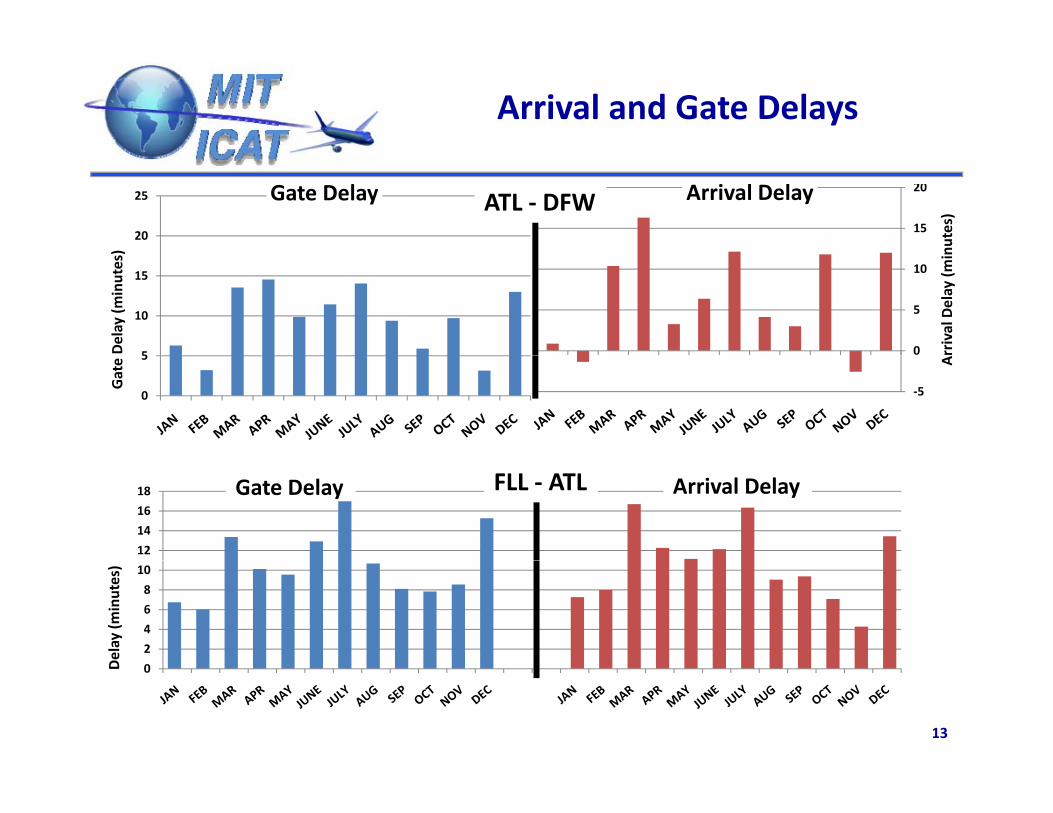
Flights on most routes suffer lengthy gate delays (shown next) that are difficult
11
Flights on most routes suffer lengthy gate delays (shown next), that are difficultto be predicted. This results to significant arrival delays
Correlation between Block Delay and Delay Components
25%
30%
35%
rrier pa
irs Taxi Out and Block Delay
Airborne and Block DelayTaxi In and Block Delay
y p
0%
5%
10%
15%
20%
age of ro
ute‐car Taxi In and Block Delay
0%
Percen
t
Pearson product‐moment correlation coefficient
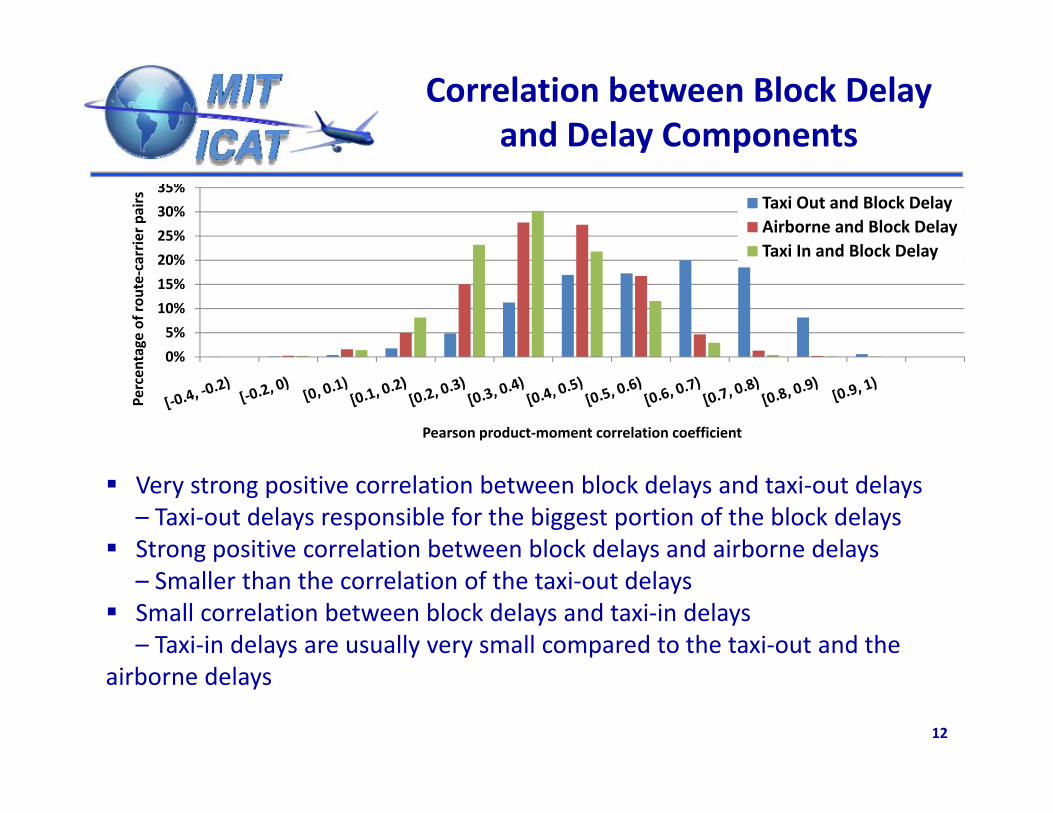
Very strong positive correlation between block delays and taxi‐out delays– Taxi‐out delays responsible for the biggest portion of the block delays
Strong positive correlation between block delays and airborne delaysg p y y– Smaller than the correlation of the taxi‐out delays
Small correlation between block delays and taxi‐in delays– Taxi‐in delays are usually very small compared to the taxi‐out and the
12
airborne delays
Arrival and Gate Delays
15
20
nutes)
Arrival Delay
20
25
)
Gate Delay ATL ‐ DFW
0
5
10
rrival Delay (m
in
5
10
15
Delay (m
inutes)
‐5
A
0
5
Gate
12
14
16
18 Arrival DelayGate Delay FLL ‐ ATL
2
4
6
8
10
Delay (m
inutes)
13
0D
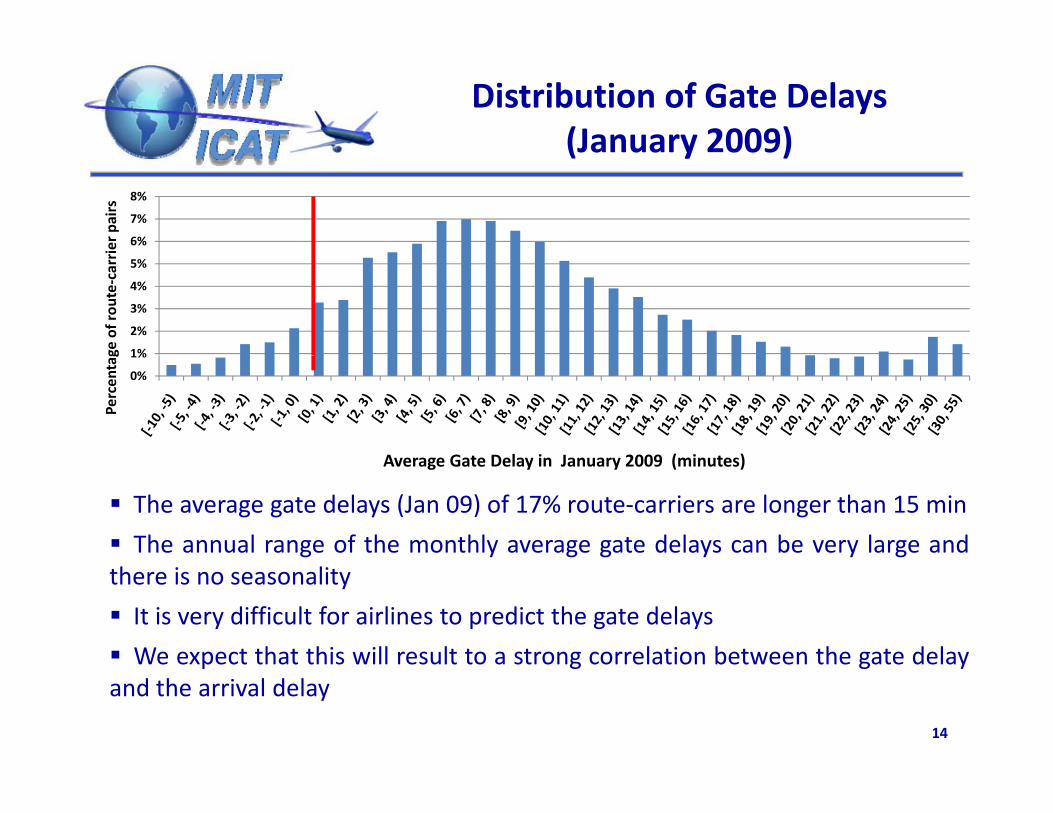
Distribution of Gate Delays(January 2009)
6%
7%
8%
ier pa
irs
(January 2009)
1%
2%
3%
4%
5%
ge of rou
te‐carri
0%
1%
Percen
tag
Average Gate Delay in January 2009 (minutes)
The average gate delays (Jan 09) of 17% route‐carriers are longer than 15 min
The annual range of the monthly average gate delays can be very large and
Average Gate Delay in January 2009 (minutes)
there is no seasonality
It is very difficult for airlines to predict the gate delays
We expect that this will result to a strong correlation between the gate delay
14
We expect that this will result to a strong correlation between the gate delayand the arrival delay
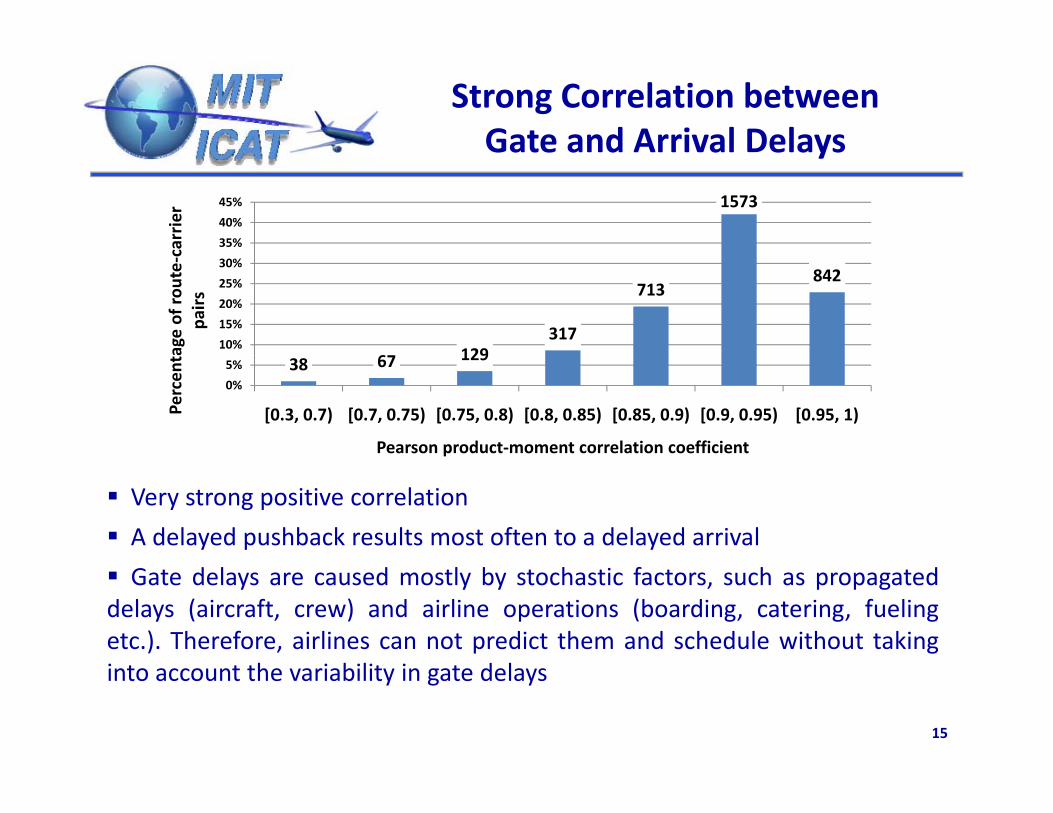
Strong Correlation between Gate and Arrival DelaysGate and Arrival Delays
1573
35%
40%
45%
carrier
67 129317
713842
10%
15%
20%
25%
30%
age of ro
ute‐c
pairs
38 67 129
0%
5%
[0.3, 0.7) [0.7, 0.75) [0.75, 0.8) [0.8, 0.85) [0.85, 0.9) [0.9, 0.95) [0.95, 1)Percen
t
Pearson product‐moment correlation coefficient
Very strong positive correlation
A delayed pushback results most often to a delayed arrival
Gate delays are caused mostly by stochastic factors, such as propagateddelays (aircraft, crew) and airline operations (boarding, catering, fuelingetc.). Therefore, airlines can not predict them and schedule without taking
h b l d l
15
into account the variability in gate delays
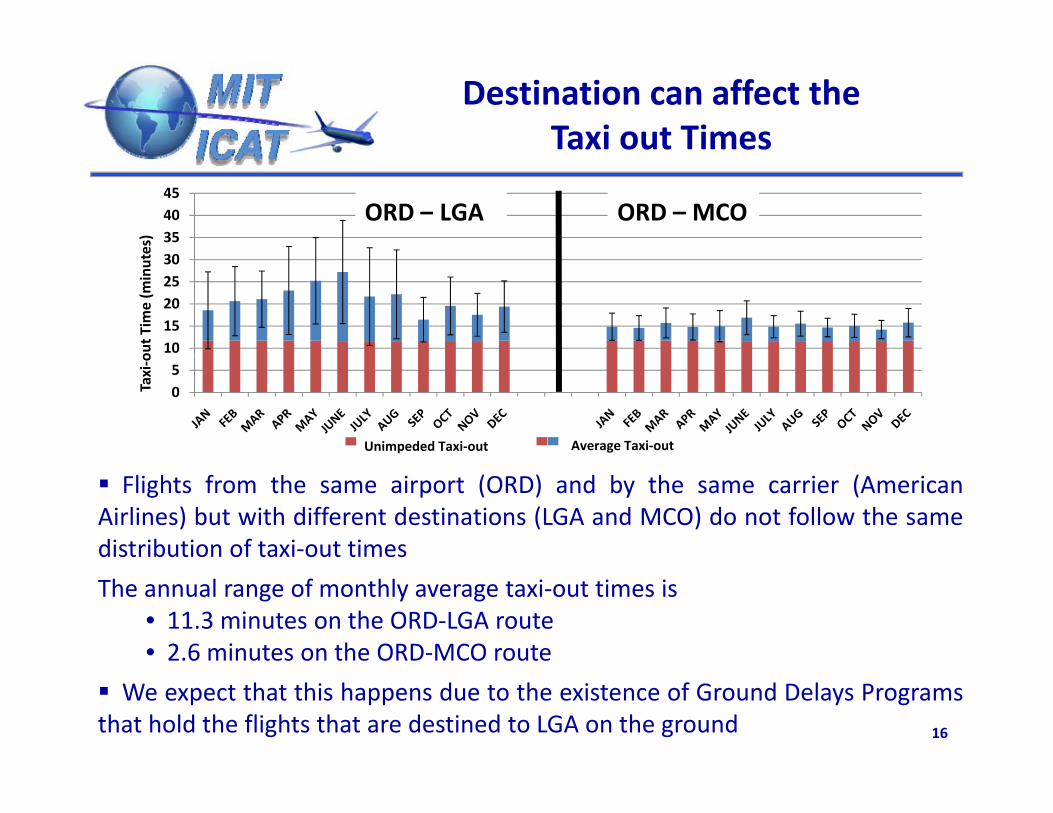
Destination can affect the Taxi out Times
354045
es)
ORD – LGA ORD – MCO
1015202530
out T
ime (m
inute
05
Taxi‐o
Unimpeded Taxi‐out Average Taxi‐out
Flights from the same airport (ORD) and by the same carrier (AmericanAirlines) but with different destinations (LGA and MCO) do not follow the samedistribution of taxi‐out times
The annual range of monthly average taxi‐out times is• 11.3 minutes on the ORD‐LGA route• 2.6 minutes on the ORD‐MCO route
16
We expect that this happens due to the existence of Ground Delays Programsthat hold the flights that are destined to LGA on the ground
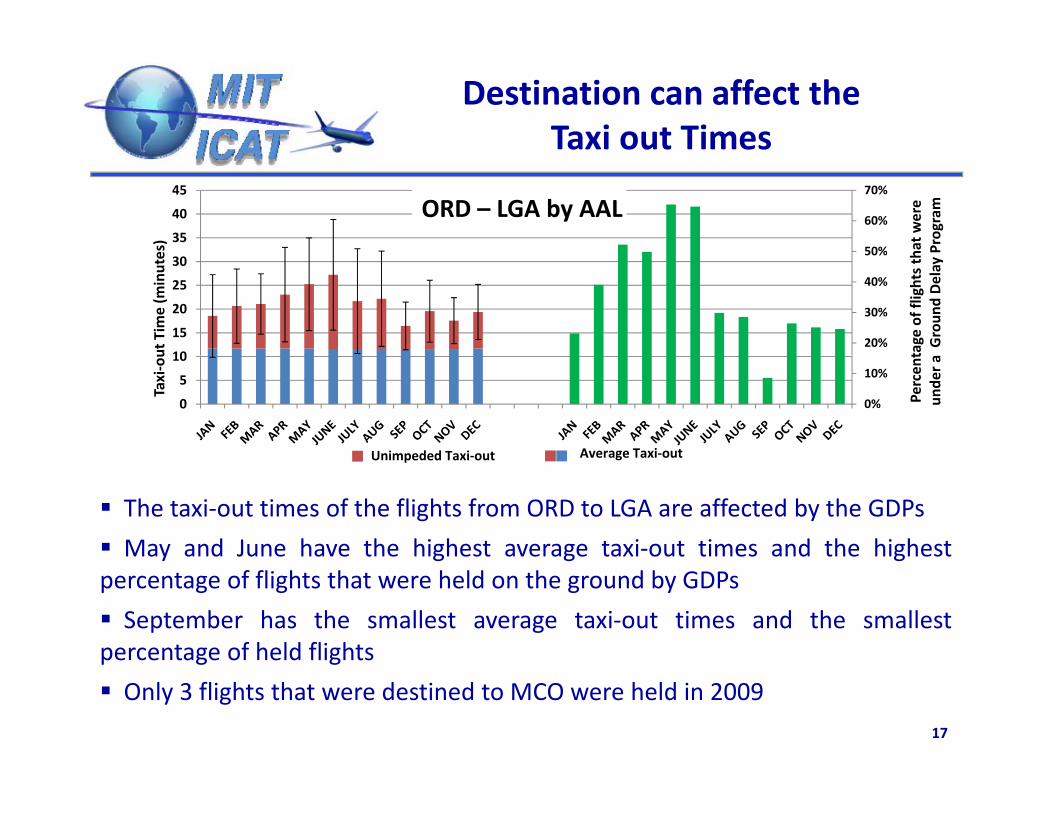
Destination can affect the Taxi out Times
50%
60%
70%
35
40
45
hat were
Program
es)
ORD – LGA by AAL
20%
30%
40%
50%
10
15
20
25
30
tage of flights th
Groun
d Delay
ut Tim
e (m
inute
0%
10%
0
5
10
Percen
tun
der a
Taxi‐ou
Unimpeded Taxi‐out Average Taxi‐outUnimpeded Taxi out g
The taxi‐out times of the flights from ORD to LGA are affected by the GDPs
May and June have the highest average taxi‐out times and the highesty g g gpercentage of flights that were held on the ground by GDPs
September has the smallest average taxi‐out times and the smallestpercentage of held flightsp g g
Only 3 flights that were destined to MCO were held in 200917
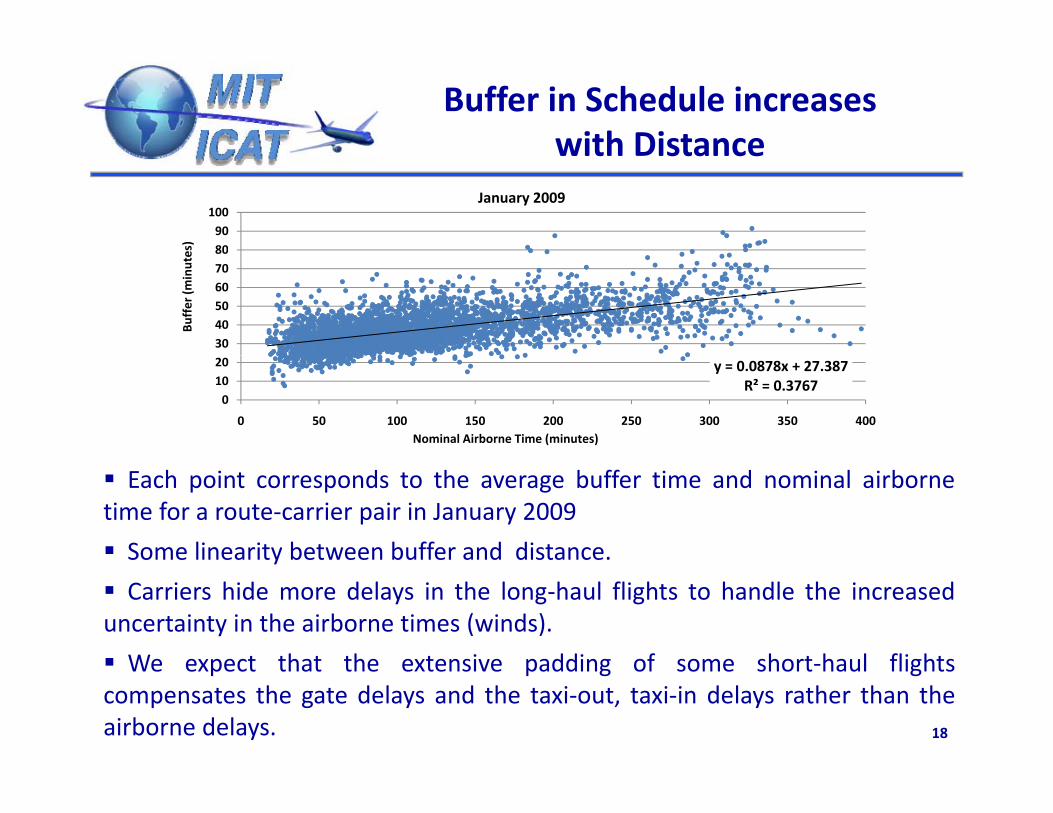
Buffer in Schedule increases with Distancewith Distance
8090
100
es)
January 2009
304050607080
Buffer (m
inute
y = 0.0878x + 27.387R² = 0.3767
01020
0 50 100 150 200 250 300 350 400Nominal Airborne Time (minutes)
Each point corresponds to the average buffer time and nominal airbornetime for a route‐carrier pair in January 2009
Some linearity between buffer and distance.y
Carriers hide more delays in the long‐haul flights to handle the increaseduncertainty in the airborne times (winds).
We expect that the extensive padding of some short haul flights
18
We expect that the extensive padding of some short‐haul flightscompensates the gate delays and the taxi‐out, taxi‐in delays rather than theairborne delays.
Conclusions
The average block delay is most of the times negative, and close to zero.Taxi out delays airborne delays and taxi in delays are very effectively hiddenTaxi‐out delays, airborne delays and taxi‐in delays are very effectively hiddenin the schedule
Very strong Correlation between gate delays and arrival delays. Carriersschedule without taking into account the variability in gate delays becauseschedule without taking into account the variability in gate delays becauseits difficult to predict them
Large seasonality in taxi‐out and airborne times. This makes necessary amonth basis analysis of the schedule padding practicesmonth basis analysis of the schedule padding practices
Limited seasonality and variability in taxi‐in times
The congestion in the arrival airport affects the gate delays and the taxi‐out times through the Ground Delay Programs
Linearity between buffer and distance. Long‐haul flights have in averagelarger delays than short‐haul flights
19
Future Research
1. For two selected months , use• linear regression methods • non parametric regression trees• non‐parametric regression treesto study the relationship between the buffer time and the
• fight components • distance • ground hold times
2. Measure quantitatively and qualitatively the benefits and the costs of
• time of the day • route competition • carrier type (LCC vs. NLC)
padding for the carriers and the airports.
For airlines:• Crew costs
For airports:• Delays
• Utilization costs• Recovery costs/ delay propagation• Presence in ticket distribution systems
y• Level of Service• Traffic• Revenues
• Reliability – on time performance • Cost for investments in terminals, runways, ATC technologies
20
Recommended