Flowserve Q1 2008 Earnings Conference CallApril 29, 2008
Lew Kling, President and Chief Executive OfficerMark Blinn, SVP, CFO and Latin America OperationsDick Guiltinan, VP and Chief Accounting OfficerZac Nagle, VP Investor Relations
Flowserve Corporation Proprietary & Confidential Page 2
Special NoteSAFE HARBOR STATEMENT: This presentation includes forward-looking statements. Forward-looking statements are all statements that are not statements of historical facts and include, without limitation, earnings forecasts, statements relating to our business strategy and statements of expectations, beliefs, future plans and strategies and anticipated developments concerning our industry, business, operations and financial performance and condition. The words “believe”, “seek”, “anticipate”, “plan”, “target”, “estimate”, “expect”, “intend”, “project”, “forecast”, “predict”, “potential”, “continue”, “will”, “may”, “could”, “should”, and other words of similar meaning are intended to identify forward-looking statements. The forward-looking statements made in this news release are made pursuant to safe harbor provisions of the Private Securities Litigation Reform Act of 1995. These forward-looking statements involve known and unknown risks, uncertainties and other factors that, in some cases, are beyond our control. These risks, uncertainties and factors may cause our actual results, performance and achievements, or industry results and market trends, to be materially different from any future results, performance, achievements or trends expressed or implied by such forward-looking statements. Important risks, uncertainties and other factors that could cause actual results to differ from these forward-looking statements include, but are not limited to, the following: inherent limitations of the effectiveness of our internal control over financial reporting; potential adverse consequences resulting from securities class action litigation and other litigation, including asbestos-containing product claims; the possibility of adverse consequences related to foreign government actions regarding our participation in the United Nations Oil-for-Food Program; the possibility of adverse consequences of governmental tax audits of our tax returns; our ability to convert bookings, which are neither subject to nor computed in accordance with generally accepted accounting principles, into revenues at acceptable, if any, profit margins, since such profit margins cannot be assured or assumed to follow historical trends; changes in the financial markets and the availability of capital; changes in the already competitive environment for our products or competitors' responses to our strategies; our inability to continue to expand our market presence through acquisitions, and unforeseen integration difficulties or costs resulting from acquisitions; economic, political and other risks associated with our international operations, including military actions or trade embargoes that could affect customer markets, including the continuing conflict in Iraq, uncertainties in certain Middle Eastern countries such as Iran, and their potential impact on Middle Eastern markets and global petroleum producers; our ability to comply with the laws and regulations affecting our international operations, including the U.S. export laws, and the effect of any noncompliance; the potential adverse impact of a significant downturn in petroleum, chemical, power and water industries; changes in economic conditions and the extent of economic growth in the U.S. and other countries and regions; unanticipated higher costs associated with environmental compliance and liabilities; our relative geographical profitability and its impact on our utilization of deferred tax assets, including foreign tax credits; the potential impact of our indebtedness on cash flows and our ability to meet the financial covenants and other requirements in our debt agreements; any terrorist attacks; adverse changes in the regulatory climate and other legal obligations imposed on us; and other factors described from time to time in our filings with the Securities and Exchange Commission. It is not possible to foresee or identify all the factors that may affect our future performance or any forward-looking information, and new risk factors can emerge from time to time. Given these risks and uncertainties, you should not place undue reliance on forward-looking statements as a prediction of actual results. All forward-looking statements included in this news release are based on information available to us on the date of this news release. We undertake no obligation to revise or update any forward-looking statement or disclose any facts, events or circumstances that occur after the date hereof that may affect the accuracy of any forward-looking statement.
Mining Pulp & PaperOil / Gas Power Chemical Water
Page 3Flowserve Proprietary & Confidential
INFRASTRUCTURE INDUSTRIES
North America Latin America Europe Middle East Africa China India Rest of Asia
GLOBAL PRESENCE
GENERAL INDUSTRIESFood & Bev
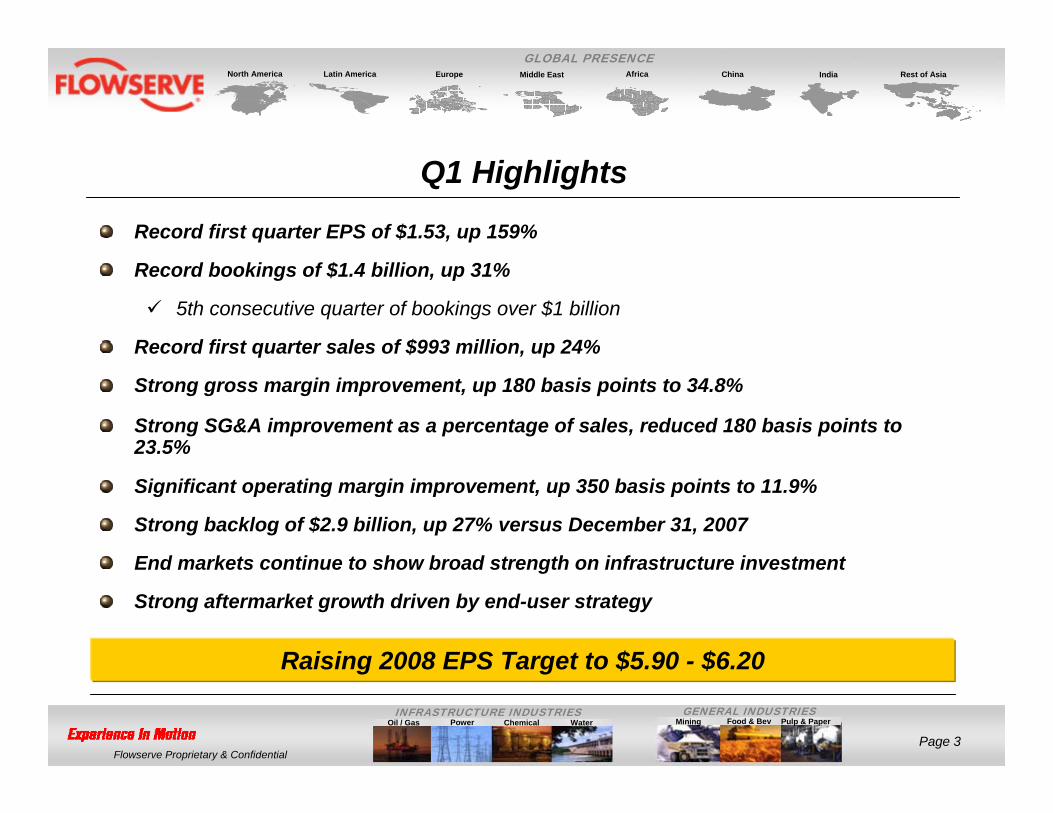
Q1 Highlights
Record first quarter EPS of $1.53, up 159%
Record bookings of $1.4 billion, up 31%
5th consecutive quarter of bookings over $1 billion
Record first quarter sales of $993 million, up 24%
Strong gross margin improvement, up 180 basis points to 34.8%
Strong SG&A improvement as a percentage of sales, reduced 180 basis points to 23.5%
Significant operating margin improvement, up 350 basis points to 11.9%
Strong backlog of $2.9 billion, up 27% versus December 31, 2007
End markets continue to show broad strength on infrastructure investment
Strong aftermarket growth driven by end-user strategy
Raising 2008 EPS Target to $5.90 - $6.20
Mining Pulp & PaperOil / Gas Power Chemical Water
Page 4Flowserve Proprietary & Confidential
INFRASTRUCTURE INDUSTRIES
North America Latin America Europe Middle East Africa China India Rest of Asia
GLOBAL PRESENCE
Food & BevGENERAL INDUSTRIES
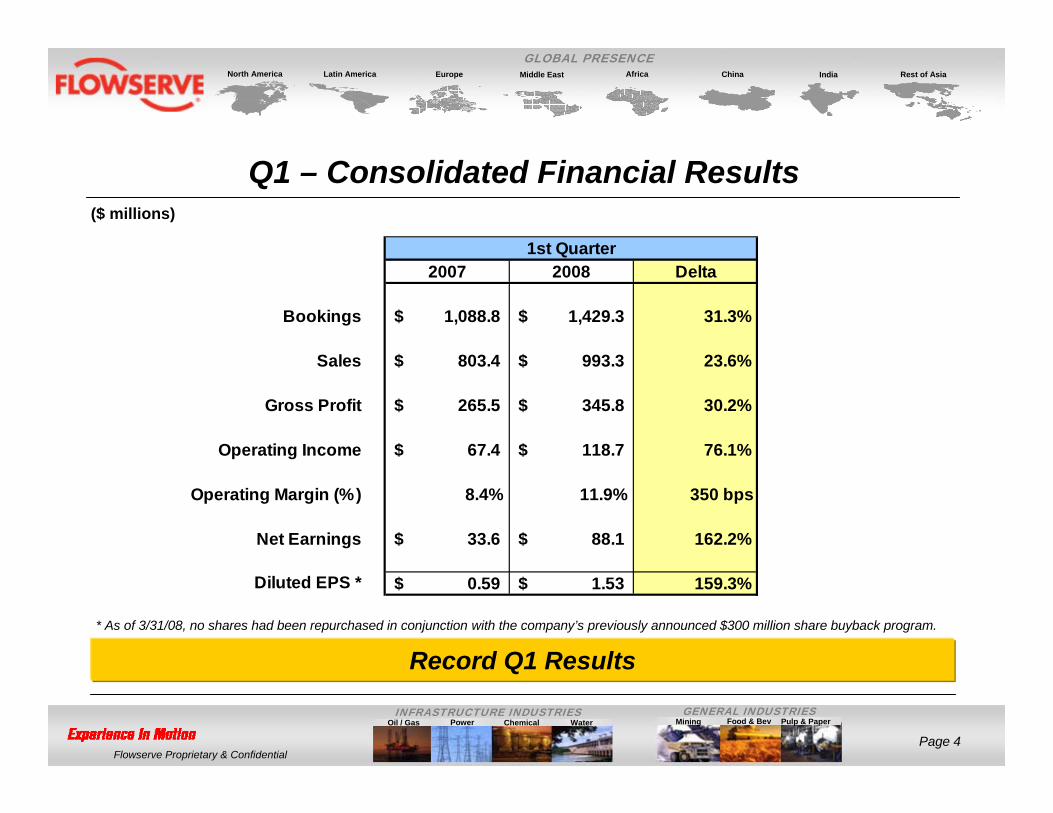
Q1 – Consolidated Financial Results
Record Q1 Results
($ millions)
* As of 3/31/08, no shares had been repurchased in conjunction with the company’s previously announced $300 million share buyback program.
2007 2008 Delta
Bookings 1,088.8$ 1,429.3$ 31.3%
Sales 803.4$ 993.3$ 23.6%
Gross Profit 265.5$ 345.8$ 30.2%
Operating Income 67.4$ 118.7$ 76.1%
Operating Margin (%) 8.4% 11.9% 350 bps
Net Earnings 33.6$ 88.1$ 162.2%
Diluted EPS * 0.59$ 1.53$ 159.3%
1st Quarter
Mining Pulp & PaperOil / Gas Power Chemical Water
Page 5Flowserve Proprietary & Confidential
INFRASTRUCTURE INDUSTRIES
North America Latin America Europe Middle East Africa China India Rest of Asia
GLOBAL PRESENCE
GENERAL INDUSTRIESFood & Bev
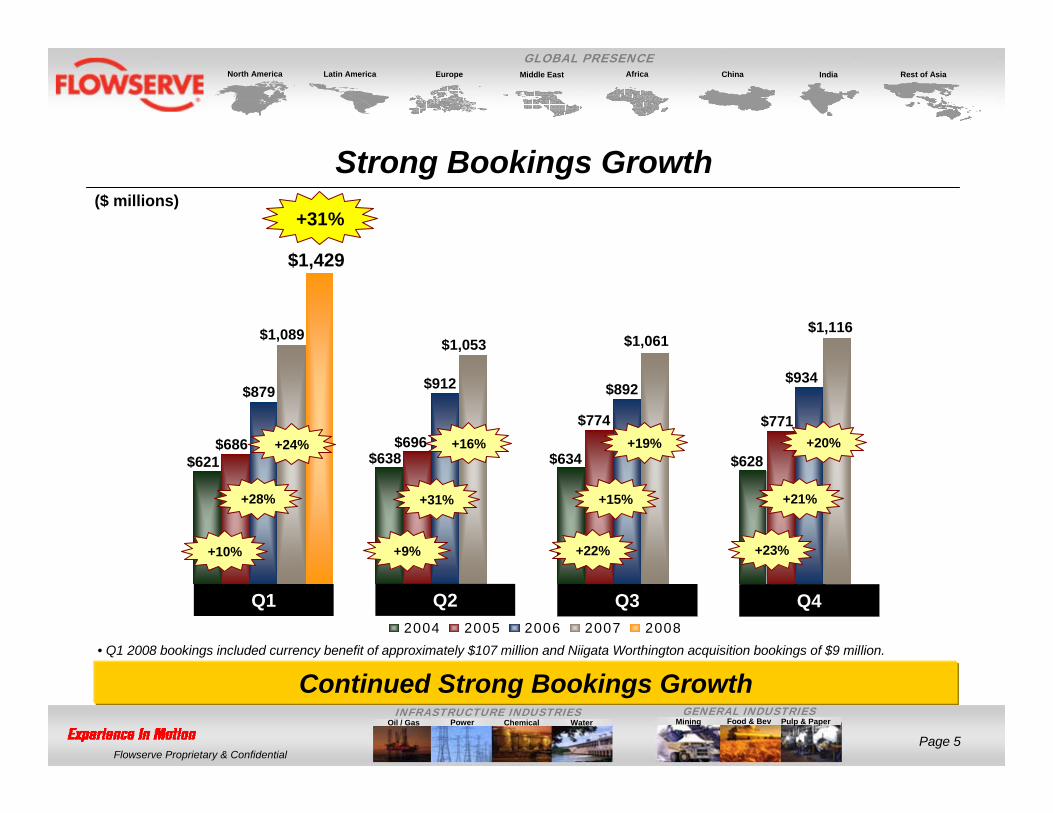
2004 2005 2006 2007 2008
+28%
• Q1 2008 bookings included currency benefit of approximately $107 million and Niigata Worthington acquisition bookings of $9 million.
Continued Strong Bookings Growth
$1,429
$686
$879
$1,089
+31%
+24%
+31%
+16%
+15%
+19%
+21%
+20%$696
$912
$1,053
$774
$892
$1,061
$771
$934
$1,116
Q2 Q3 Q4
$621
+10% +9% +22% +23%
$638 $634 $628
Q1
Strong Bookings Growth($ millions)
Mining Pulp & PaperOil / Gas Power Chemical Water
Page 6Flowserve Proprietary & Confidential
INFRASTRUCTURE INDUSTRIES
North America Latin America Europe Middle East Africa China India Rest of Asia
GLOBAL PRESENCE
GENERAL INDUSTRIESFood & Bev
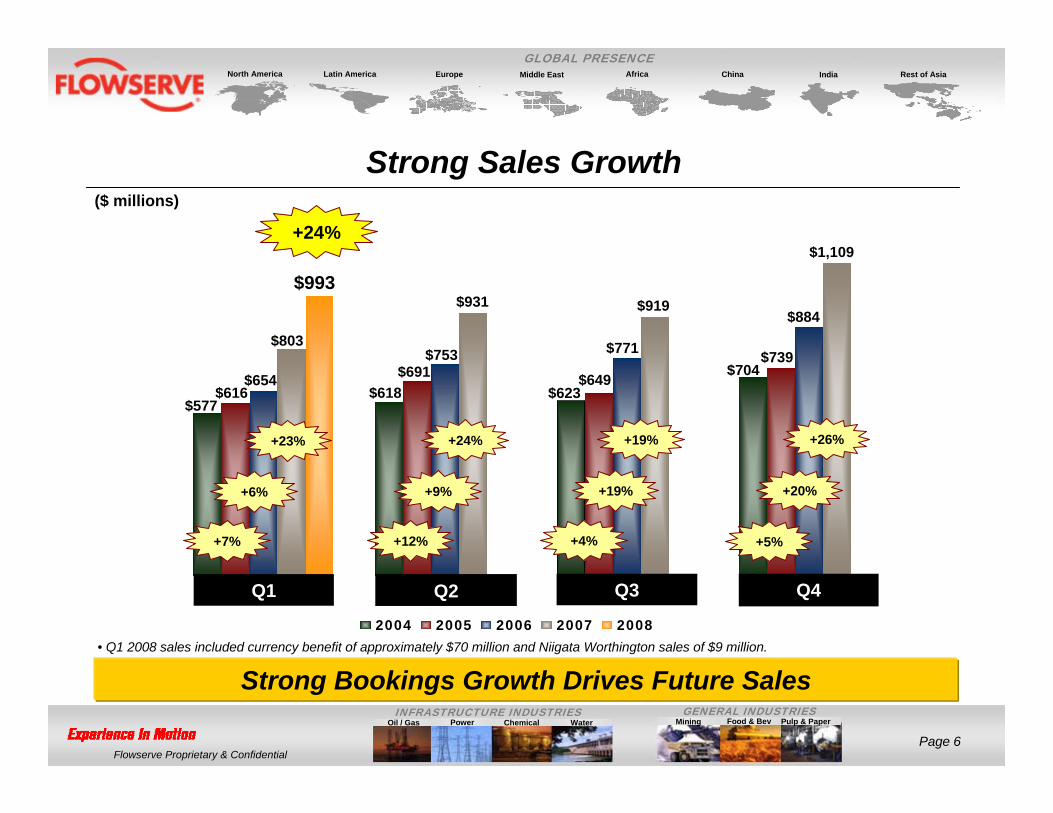
2004 2005 2006 2007 2008
+6%
($ millions)
• Q1 2008 sales included currency benefit of approximately $70 million and Niigata Worthington sales of $9 million.
Strong Bookings Growth Drives Future Sales
$993
$616$654
$803
Strong Sales Growth
+24%
+23%
+9%
+24%
+4%
+19%
+20%
+26%
$691$753
$931
$649
$771
$919
$739
$884
$1,109
$577$618 $623
$704
+7%
Q2 Q3 Q4
+12%
+19%
+5%
Q1
Mining Pulp & PaperOil / Gas Power Chemical Water
Page 7Flowserve Proprietary & Confidential
INFRASTRUCTURE INDUSTRIES
North America Latin America Europe Middle East Africa China India Rest of Asia
GLOBAL PRESENCE
GENERAL INDUSTRIESFood & Bev
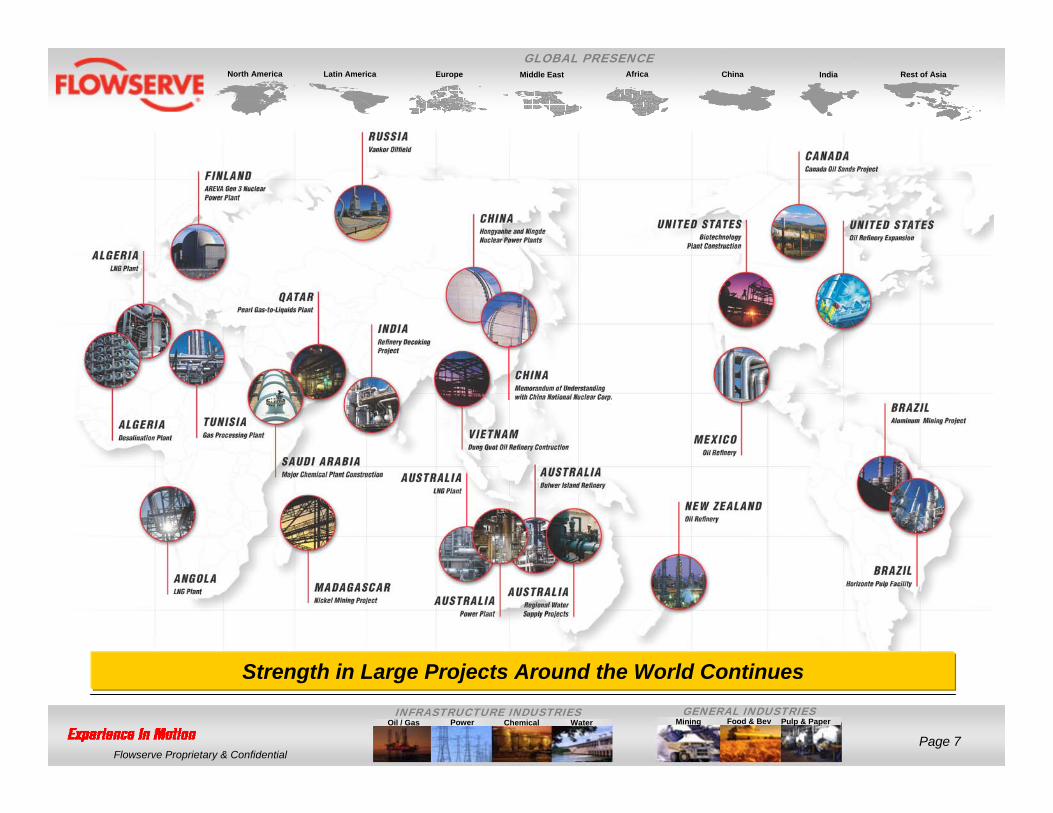
Strength in Large Projects Around the World Continues
Mining Pulp & PaperOil / Gas Power Chemical Water
Page 8Flowserve Proprietary & Confidential
INFRASTRUCTURE INDUSTRIES
North America Latin America Europe Middle East Africa China India Rest of Asia
GLOBAL PRESENCE
GENERAL INDUSTRIESFood & Bev
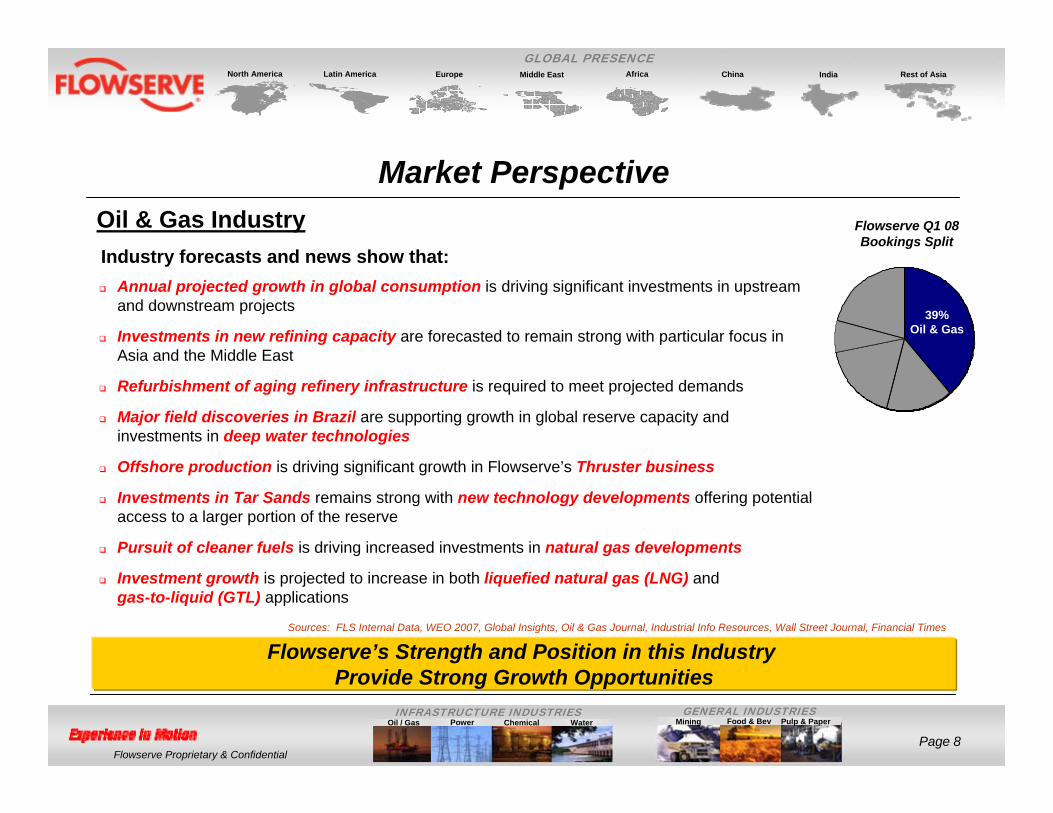
Market Perspective
Flowserve’s Strength and Position in this Industry Provide Strong Growth Opportunities
Flowserve Q1 08 Bookings Split
39%Oil & Gas
Sources: FLS Internal Data, WEO 2007, Global Insights, Oil & Gas Journal, Industrial Info Resources, Wall Street Journal, Financial Times
Oil & Gas Industry
Annual projected growth in global consumption is driving significant investments in upstream and downstream projects
Investments in new refining capacity are forecasted to remain strong with particular focus in Asia and the Middle East
Refurbishment of aging refinery infrastructure is required to meet projected demands
Major field discoveries in Brazil are supporting growth in global reserve capacity and investments in deep water technologies
Offshore production is driving significant growth in Flowserve’s Thruster business
Investments in Tar Sands remains strong with new technology developments offering potential access to a larger portion of the reserve
Pursuit of cleaner fuels is driving increased investments in natural gas developments
Investment growth is projected to increase in both liquefied natural gas (LNG) and gas-to-liquid (GTL) applications
Industry forecasts and news show that:
Mining Pulp & PaperOil / Gas Power Chemical Water
Page 9Flowserve Proprietary & Confidential
INFRASTRUCTURE INDUSTRIES
North America Latin America Europe Middle East Africa China India Rest of Asia
GLOBAL PRESENCE
GENERAL INDUSTRIESFood & Bev
Market Perspective
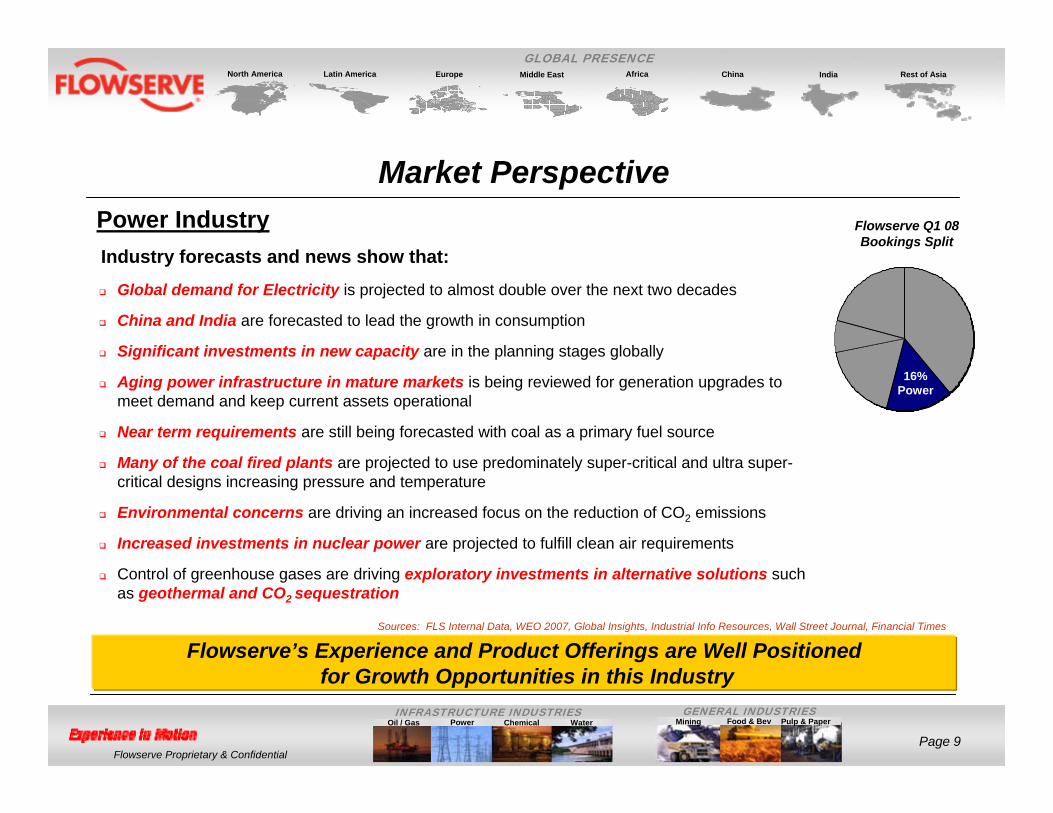
Flowserve’s Experience and Product Offerings are Well Positionedfor Growth Opportunities in this Industry
Sources: FLS Internal Data, WEO 2007, Global Insights, Industrial Info Resources, Wall Street Journal, Financial Times
Power Industry
Global demand for Electricity is projected to almost double over the next two decades
China and India are forecasted to lead the growth in consumption
Significant investments in new capacity are in the planning stages globally
Aging power infrastructure in mature markets is being reviewed for generation upgrades to meet demand and keep current assets operational
Near term requirements are still being forecasted with coal as a primary fuel source
Many of the coal fired plants are projected to use predominately super-critical and ultra super-critical designs increasing pressure and temperature
Environmental concerns are driving an increased focus on the reduction of CO2 emissions
Increased investments in nuclear power are projected to fulfill clean air requirements
Control of greenhouse gases are driving exploratory investments in alternative solutions such as geothermal and CO2 sequestration
Industry forecasts and news show that:
Flowserve Q1 08 Bookings Split
16%Power
Mining Pulp & PaperOil / Gas Power Chemical Water
Page 10Flowserve Proprietary & Confidential
INFRASTRUCTURE INDUSTRIES
North America Latin America Europe Middle East Africa China India Rest of Asia
GLOBAL PRESENCE
GENERAL INDUSTRIESFood & Bev
Market Perspective
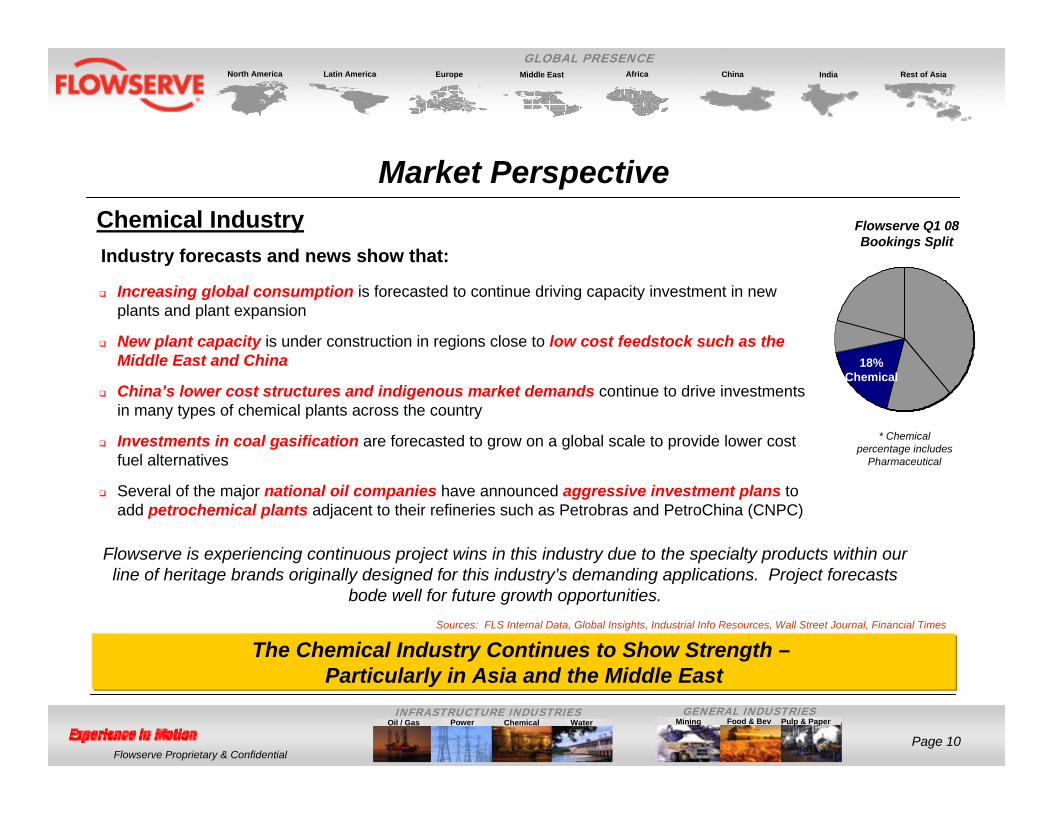
The Chemical Industry Continues to Show Strength –Particularly in Asia and the Middle East
Sources: FLS Internal Data, Global Insights, Industrial Info Resources, Wall Street Journal, Financial Times
Chemical Industry
Increasing global consumption is forecasted to continue driving capacity investment in new plants and plant expansion
New plant capacity is under construction in regions close to low cost feedstock such as the Middle East and China
China’s lower cost structures and indigenous market demands continue to drive investments in many types of chemical plants across the country
Investments in coal gasification are forecasted to grow on a global scale to provide lower cost fuel alternatives
Several of the major national oil companies have announced aggressive investment plans to add petrochemical plants adjacent to their refineries such as Petrobras and PetroChina (CNPC)
Industry forecasts and news show that:
Flowserve is experiencing continuous project wins in this industry due to the specialty products within our line of heritage brands originally designed for this industry’s demanding applications. Project forecasts
bode well for future growth opportunities.
* Chemical percentage includes
Pharmaceutical
Flowserve Q1 08 Bookings Split
18%Chemical
Mining Pulp & PaperOil / Gas Power Chemical Water
Page 11Flowserve Proprietary & Confidential
INFRASTRUCTURE INDUSTRIES
North America Latin America Europe Middle East Africa China India Rest of Asia
GLOBAL PRESENCE
GENERAL INDUSTRIESFood & Bev
Market Perspective
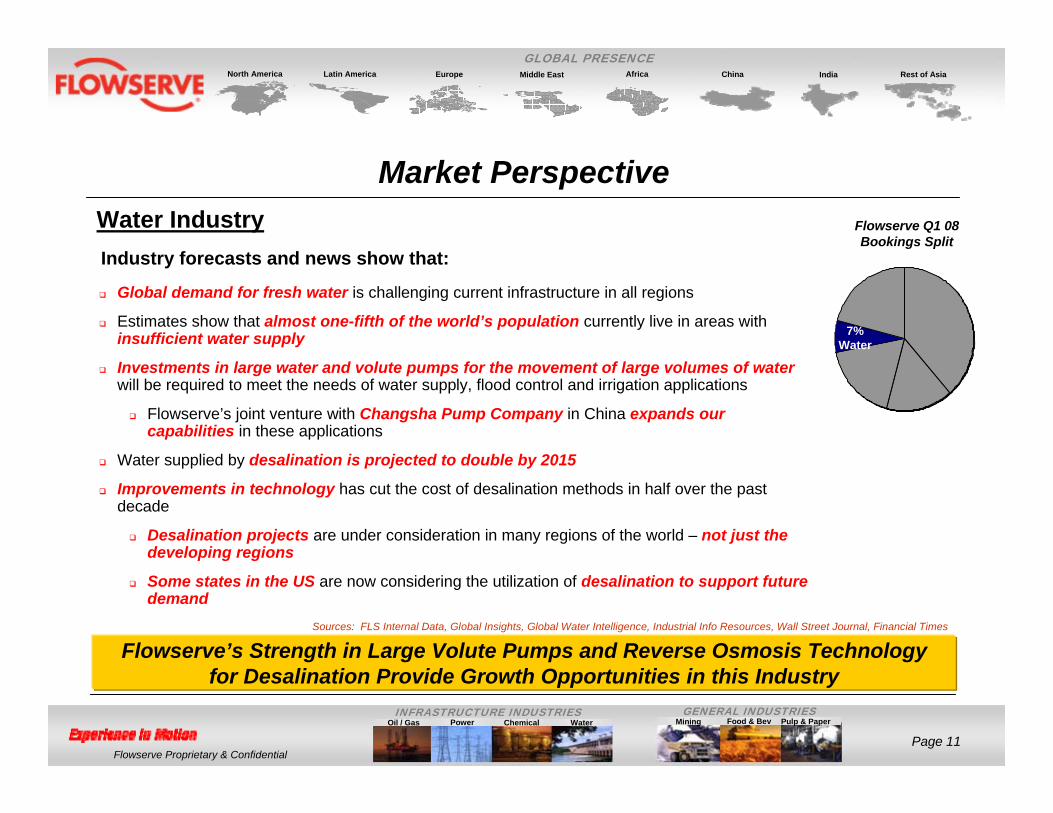
Flowserve’s Strength in Large Volute Pumps and Reverse Osmosis Technologyfor Desalination Provide Growth Opportunities in this Industry
Water Industry
Global demand for fresh water is challenging current infrastructure in all regions
Estimates show that almost one-fifth of the world’s population currently live in areas withinsufficient water supply
Investments in large water and volute pumps for the movement of large volumes of water will be required to meet the needs of water supply, flood control and irrigation applications
Flowserve’s joint venture with Changsha Pump Company in China expands our capabilities in these applications
Water supplied by desalination is projected to double by 2015
Improvements in technology has cut the cost of desalination methods in half over the past decade
Desalination projects are under consideration in many regions of the world – not just the developing regions
Some states in the US are now considering the utilization of desalination to support future demand
Industry forecasts and news show that:
Flowserve Q1 08 Bookings Split
7%Water
Sources: FLS Internal Data, Global Insights, Global Water Intelligence, Industrial Info Resources, Wall Street Journal, Financial Times
Mining Pulp & PaperOil / Gas Power Chemical Water
Page 12Flowserve Proprietary & Confidential
INFRASTRUCTURE INDUSTRIES
North America Latin America Europe Middle East Africa China India Rest of Asia
GLOBAL PRESENCE
GENERAL INDUSTRIESFood & Bev
Market Perspective
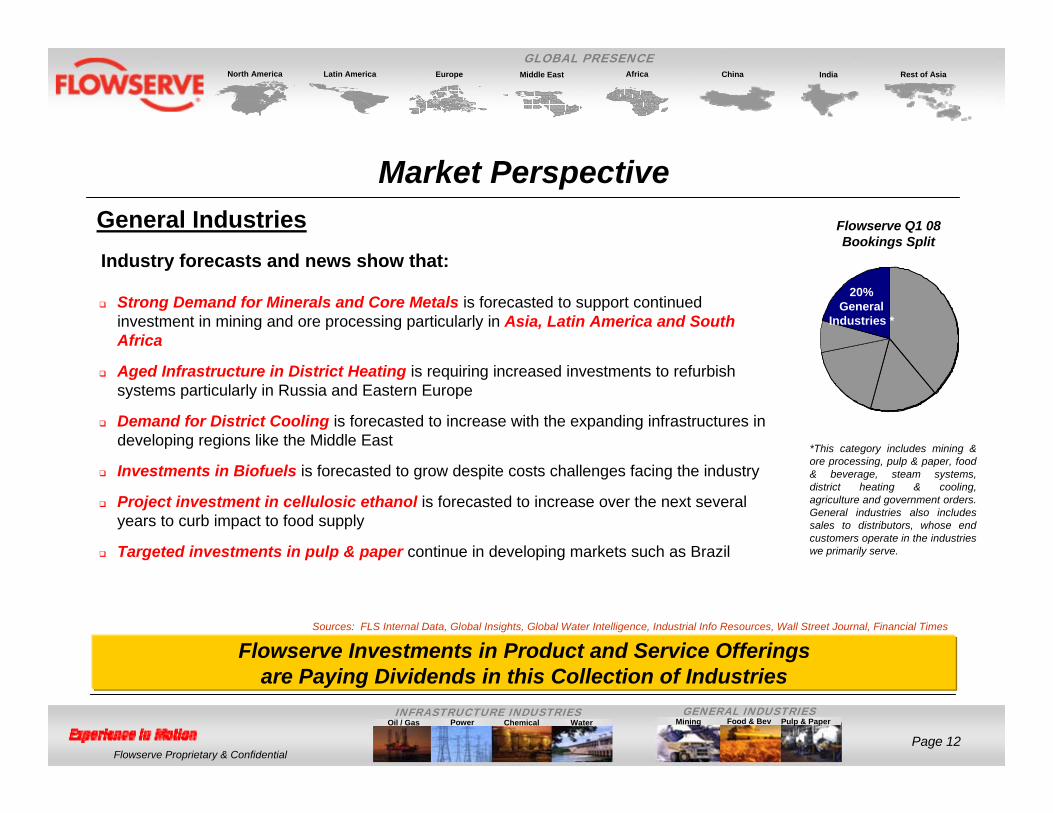
Flowserve Investments in Product and Service Offeringsare Paying Dividends in this Collection of Industries
General Industries
Strong Demand for Minerals and Core Metals is forecasted to support continued investment in mining and ore processing particularly in Asia, Latin America and South Africa
Aged Infrastructure in District Heating is requiring increased investments to refurbish systems particularly in Russia and Eastern Europe
Demand for District Cooling is forecasted to increase with the expanding infrastructures indeveloping regions like the Middle East
Investments in Biofuels is forecasted to grow despite costs challenges facing the industry
Project investment in cellulosic ethanol is forecasted to increase over the next several years to curb impact to food supply
Targeted investments in pulp & paper continue in developing markets such as Brazil
Industry forecasts and news show that:
Sources: FLS Internal Data, Global Insights, Global Water Intelligence, Industrial Info Resources, Wall Street Journal, Financial Times
*This category includes mining & ore processing, pulp & paper, food & beverage, steam systems, district heating & cooling, agriculture and government orders. General industries also includes sales to distributors, whose end customers operate in the industries we primarily serve.
Flowserve Q1 08 Bookings Split
20%General
Industries *
Mining Pulp & PaperOil / Gas Power Chemical Water
Page 13Flowserve Proprietary & Confidential
INFRASTRUCTURE INDUSTRIES
North America Latin America Europe Middle East Africa China India Rest of Asia
GLOBAL PRESENCE
GENERAL INDUSTRIESFood & Bev
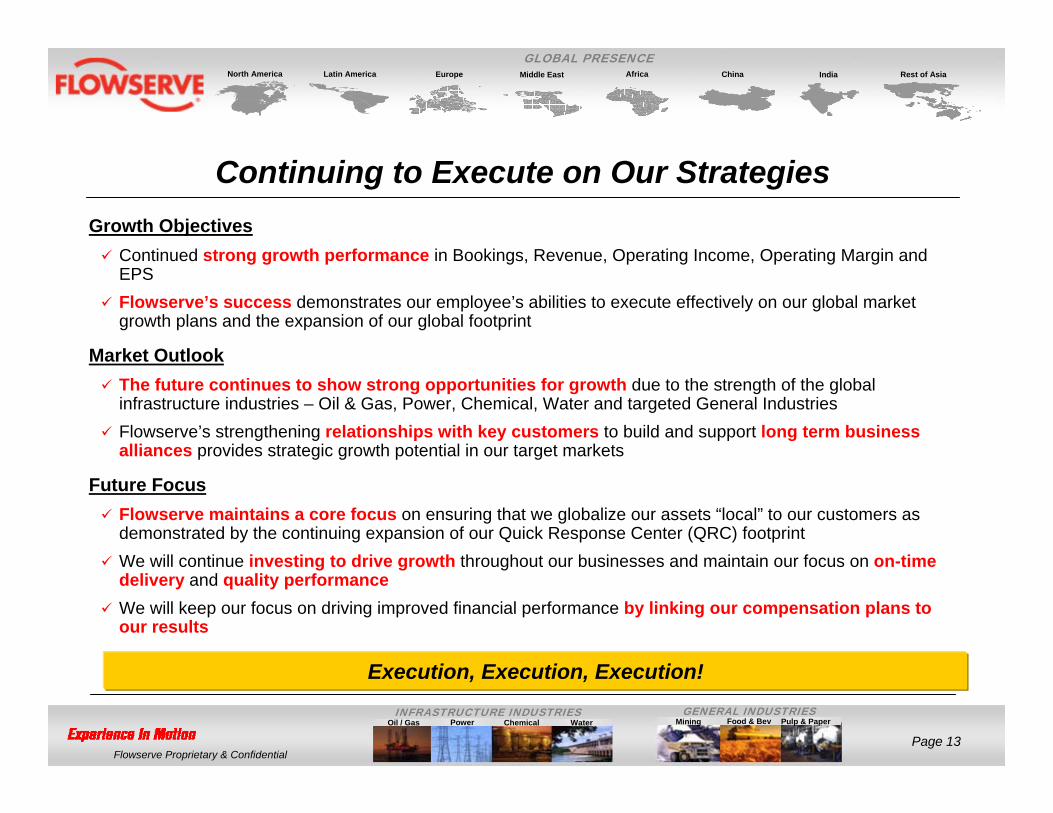
Continuing to Execute on Our StrategiesGrowth Objectives
Continued strong growth performance in Bookings, Revenue, Operating Income, Operating Margin and EPSFlowserve’s success demonstrates our employee’s abilities to execute effectively on our global market growth plans and the expansion of our global footprint
Market OutlookThe future continues to show strong opportunities for growth due to the strength of the global infrastructure industries – Oil & Gas, Power, Chemical, Water and targeted General IndustriesFlowserve’s strengthening relationships with key customers to build and support long term business alliances provides strategic growth potential in our target markets
Future FocusFlowserve maintains a core focus on ensuring that we globalize our assets “local” to our customers as demonstrated by the continuing expansion of our Quick Response Center (QRC) footprintWe will continue investing to drive growth throughout our businesses and maintain our focus on on-time delivery and quality performanceWe will keep our focus on driving improved financial performance by linking our compensation plans to our results
Execution, Execution, Execution!
Mining Pulp & PaperOil / Gas Power Chemical Water
Page 14Flowserve Proprietary & Confidential
INFRASTRUCTURE INDUSTRIES
North America Latin America Europe Middle East Africa China India Rest of Asia
GLOBAL PRESENCE
GENERAL INDUSTRIESFood & Bev
Financial Update
Mining Pulp & PaperOil / Gas Power Chemical Water
Page 15Flowserve Proprietary & Confidential
INFRASTRUCTURE INDUSTRIES
North America Latin America Europe Middle East Africa China India Rest of Asia
GLOBAL PRESENCE
GENERAL INDUSTRIESFood & Bev
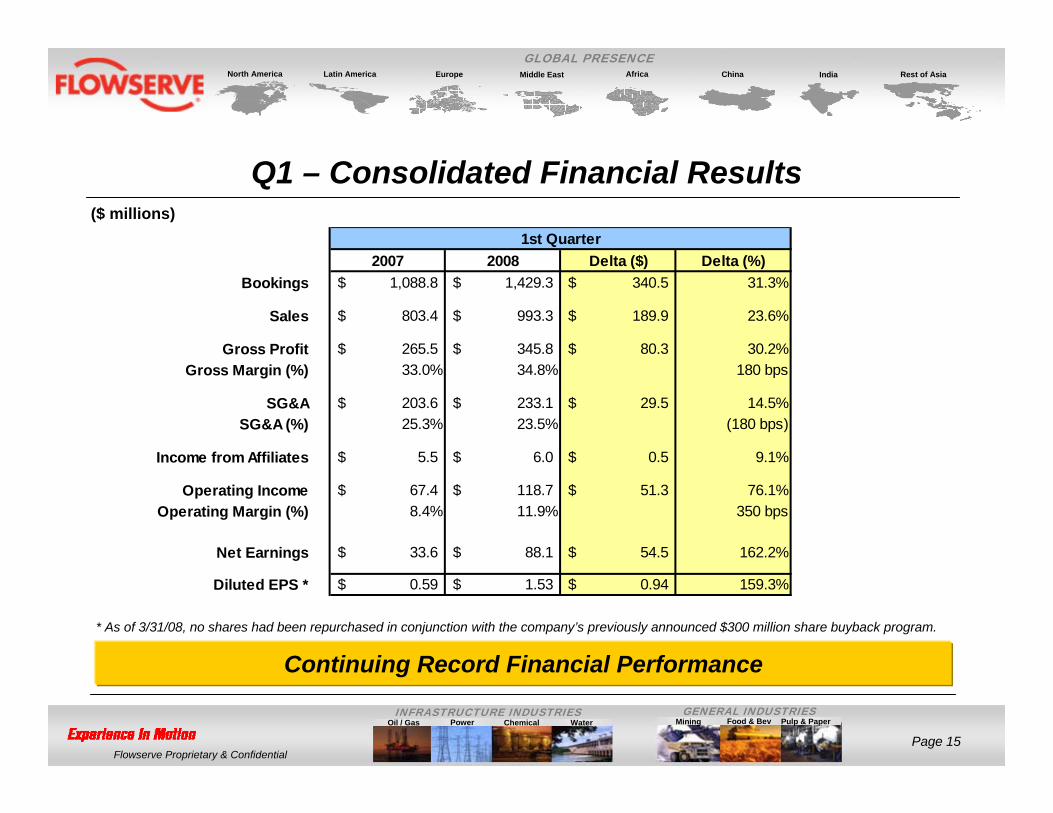
Continuing Record Financial Performance
($ millions)
Q1 – Consolidated Financial Results
* As of 3/31/08, no shares had been repurchased in conjunction with the company’s previously announced $300 million share buyback program.
2007 2008 Delta ($) Delta (%)Bookings 1,088.8$ 1,429.3$ 340.5$ 31.3%
Sales 803.4$ 993.3$ 189.9$ 23.6%
Gross Profit 265.5$ 345.8$ 80.3$ 30.2%Gross Margin (%) 33.0% 34.8% 180 bps
SG&A 203.6$ 233.1$ 29.5$ 14.5%SG&A (%) 25.3% 23.5% (180 bps)
Income from Affiliates 5.5$ 6.0$ 0.5$ 9.1%
Operating Income 67.4$ 118.7$ 51.3$ 76.1%Operating Margin (%) 8.4% 11.9% 350 bps
Net Earnings 33.6$ 88.1$ 54.5$ 162.2%
Diluted EPS * 0.59$ 1.53$ 0.94$ 159.3%
1st Quarter

Mining Pulp & PaperOil / Gas Power Chemical Water
Page 16Flowserve Proprietary & Confidential
INFRASTRUCTURE INDUSTRIES
North America Latin America Europe Middle East Africa China India Rest of Asia
GLOBAL PRESENCE
GENERAL INDUSTRIESFood & Bev
Flowserve Pump Division – Q1 Segment Results
Record Q1 Bookings, Sales, Gross Profit and OI
($ millions)
2007 2008 Delta ($) Delta (%)Bookings 658.2$ 890.2$ 232.0$ 35.2%
Sales 418.7$ 561.1$ 142.4$ 34.0%
Gross Profit 117.0$ 174.6$ 57.6$ 49.2%Gross Margin (%) 27.9% 31.1% 320 bps
SG&A 76.8$ 96.5$ 19.7$ 25.7%SG&A (%) 18.3% 17.2% (110 bps)
Income from Affiliates 1.6$ 0.4$ (1.2)$ (75.0)%
Operating Income 41.7$ 78.4$ 36.7$ 88.0%Operating Margin (%) 10.0% 14.0% 400 bps
1st Quarter
Mining Pulp & PaperOil / Gas Power Chemical Water
Page 17Flowserve Proprietary & Confidential
INFRASTRUCTURE INDUSTRIES
North America Latin America Europe Middle East Africa China India Rest of Asia
GLOBAL PRESENCE
GENERAL INDUSTRIESFood & Bev
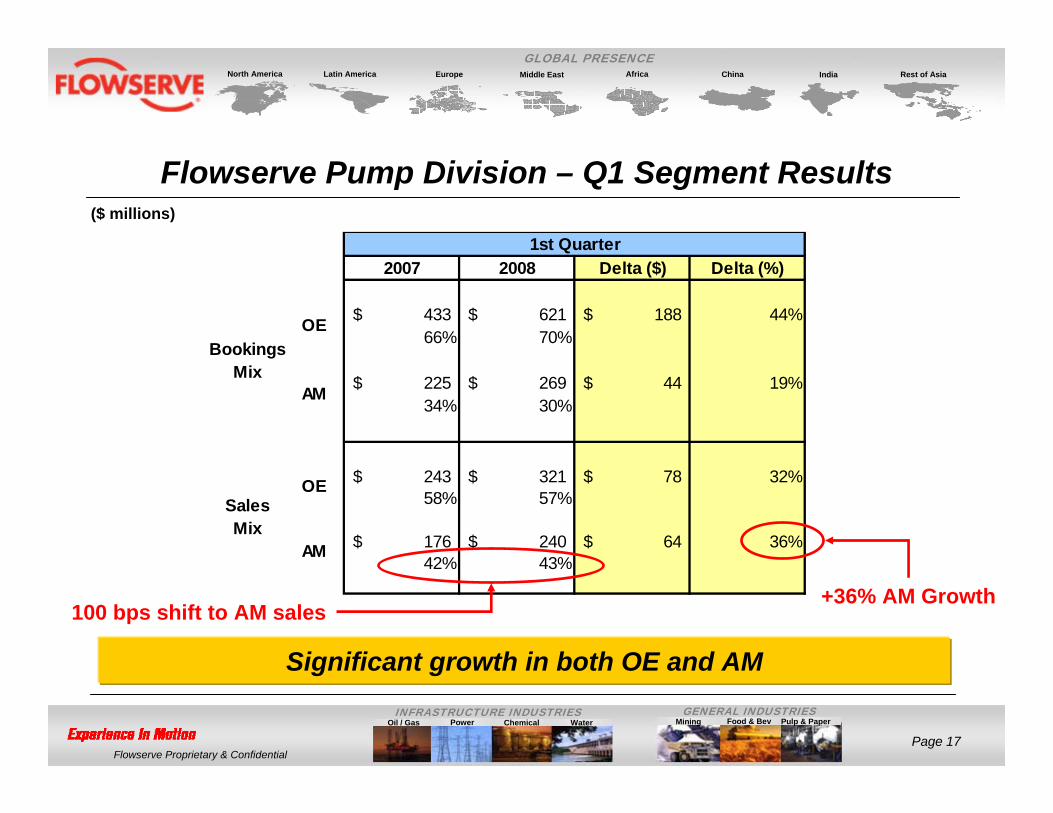
2007 2008 Delta ($) Delta (%)
433$ 621$ 188$ 44%66% 70%
225$ 269$ 44$ 19%34% 30%
243$ 321$ 78$ 32%58% 57%
176$ 240$ 64$ 36%42% 43%
1st Quarter
Bookings Mix
Sales Mix
OE
AM
OE
AM
+36% AM Growth
Significant growth in both OE and AM
Flowserve Pump Division – Q1 Segment Results ($ millions)
100 bps shift to AM sales
Mining Pulp & PaperOil / Gas Power Chemical Water
Page 18Flowserve Proprietary & Confidential
INFRASTRUCTURE INDUSTRIES
North America Latin America Europe Middle East Africa China India Rest of Asia
GLOBAL PRESENCE
GENERAL INDUSTRIESFood & Bev
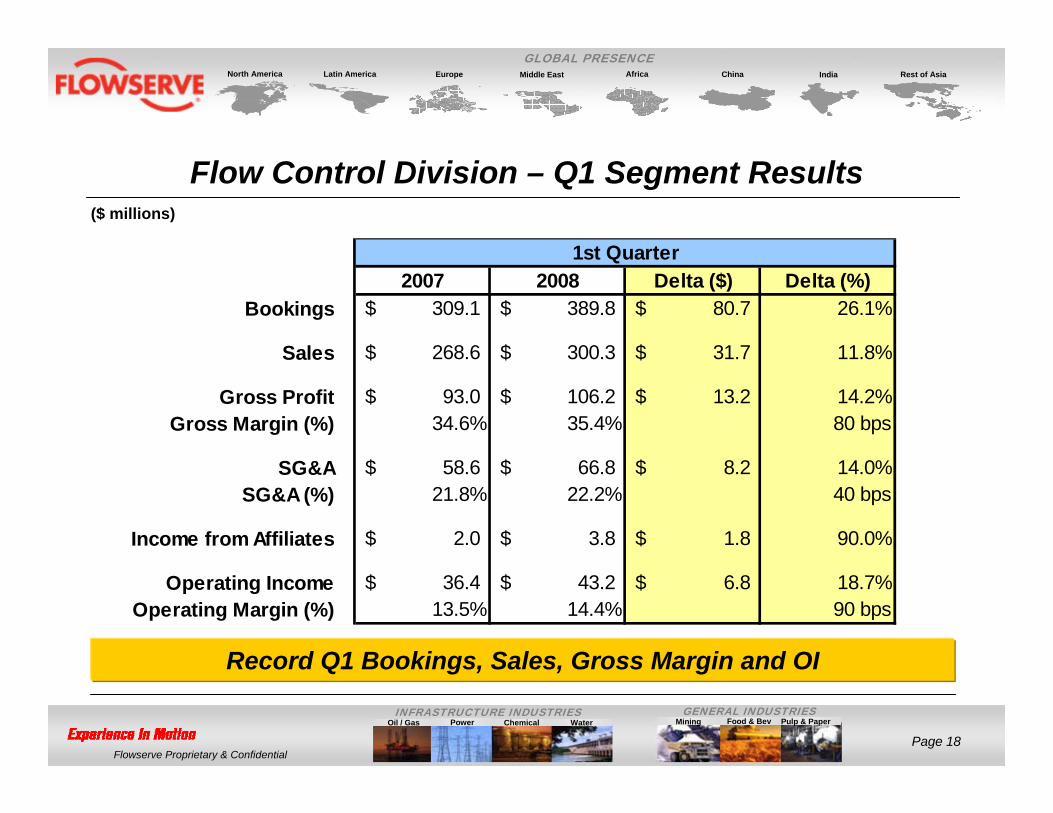
Flow Control Division – Q1 Segment Results
Record Q1 Bookings, Sales, Gross Margin and OI
($ millions)
2007 2008 Delta ($) Delta (%)Bookings 309.1$ 389.8$ 80.7$ 26.1%
Sales 268.6$ 300.3$ 31.7$ 11.8%
Gross Profit 93.0$ 106.2$ 13.2$ 14.2%Gross Margin (%) 34.6% 35.4% 80 bps
SG&A 58.6$ 66.8$ 8.2$ 14.0%SG&A (%) 21.8% 22.2% 40 bps
Income from Affiliates 2.0$ 3.8$ 1.8$ 90.0%
Operating Income 36.4$ 43.2$ 6.8$ 18.7%Operating Margin (%) 13.5% 14.4% 90 bps
1st Quarter
Mining Pulp & PaperOil / Gas Power Chemical Water
Page 19Flowserve Proprietary & Confidential
INFRASTRUCTURE INDUSTRIES
North America Latin America Europe Middle East Africa China India Rest of Asia
GLOBAL PRESENCE
GENERAL INDUSTRIESFood & Bev
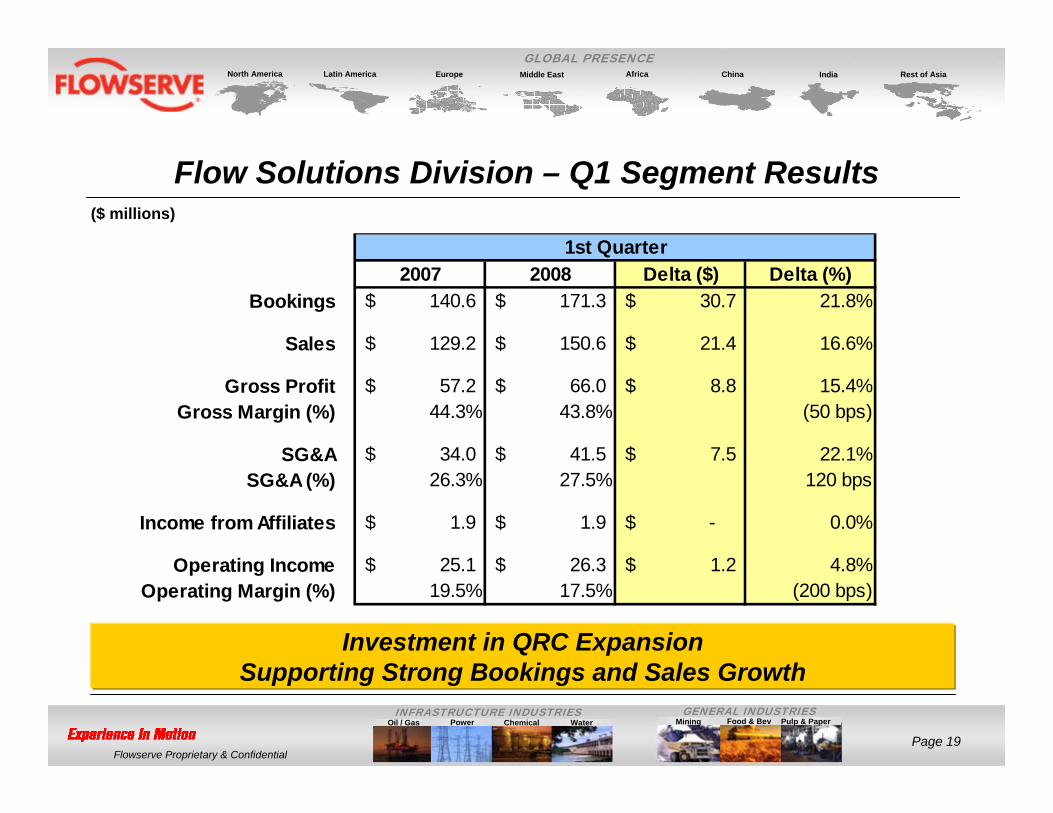
Investment in QRC Expansion Supporting Strong Bookings and Sales Growth
($ millions)
Flow Solutions Division – Q1 Segment Results
2007 2008 Delta ($) Delta (%)Bookings 140.6$ 171.3$ 30.7$ 21.8%
Sales 129.2$ 150.6$ 21.4$ 16.6%
Gross Profit 57.2$ 66.0$ 8.8$ 15.4%Gross Margin (%) 44.3% 43.8% (50 bps)
SG&A 34.0$ 41.5$ 7.5$ 22.1%SG&A (%) 26.3% 27.5% 120 bps
Income from Affiliates 1.9$ 1.9$ -$ 0.0%
Operating Income 25.1$ 26.3$ 1.2$ 4.8%Operating Margin (%) 19.5% 17.5% (200 bps)
1st Quarter
Mining Pulp & PaperOil / Gas Power Chemical Water
Page 20Flowserve Proprietary & Confidential
INFRASTRUCTURE INDUSTRIES
North America Latin America Europe Middle East Africa China India Rest of Asia
GLOBAL PRESENCE
GENERAL INDUSTRIESFood & Bev
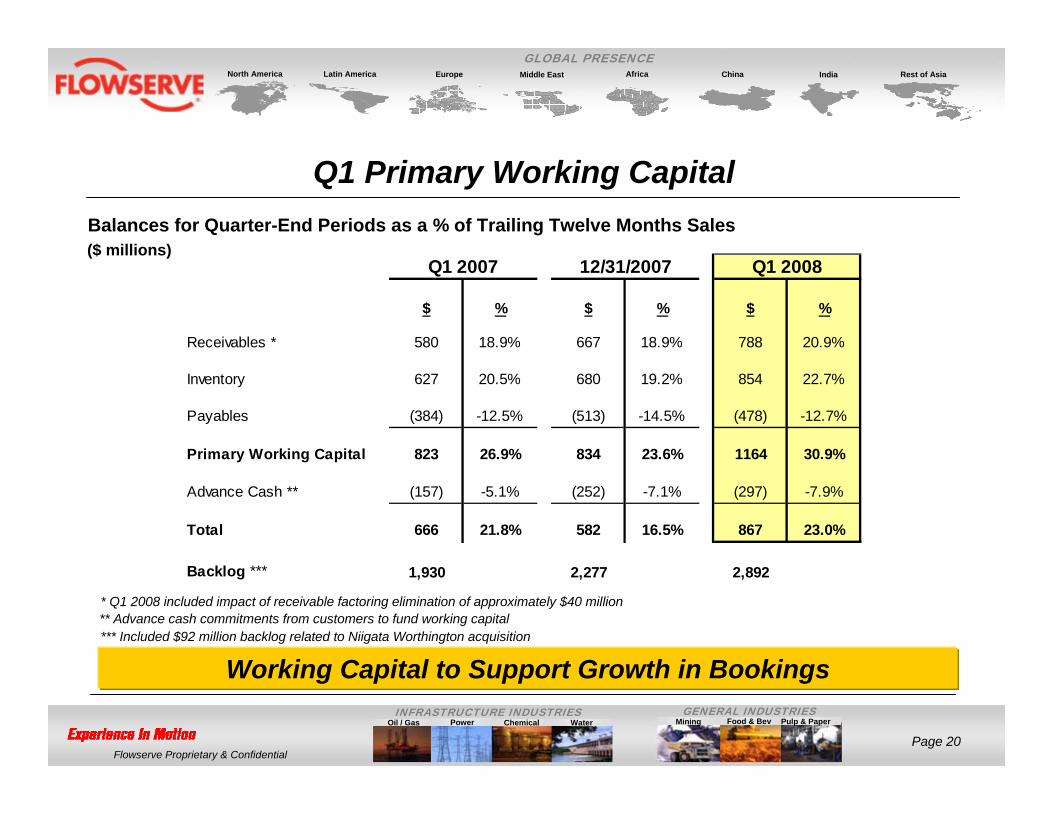
Q1 Primary Working Capital
Working Capital to Support Growth in Bookings
** Advance cash commitments from customers to fund working capital* Q1 2008 included impact of receivable factoring elimination of approximately $40 million
Balances for Quarter-End Periods as a % of Trailing Twelve Months Sales($ millions)
$ % $ % $ %
Receivables * 580 18.9% 667 18.9% 788 20.9%
Inventory 627 20.5% 680 19.2% 854 22.7%
Payables (384) -12.5% (513) -14.5% (478) -12.7%
Primary Working Capital 823 26.9% 834 23.6% 1164 30.9%
Advance Cash ** (157) -5.1% (252) -7.1% (297) -7.9%
Total 666 21.8% 582 16.5% 867 23.0%
Backlog *** 1,930 2,277 2,892
Q1 2007 12/31/2007 Q1 2008
*** Included $92 million backlog related to Niigata Worthington acquisition
Mining Pulp & PaperOil / Gas Power Chemical Water
Page 21Flowserve Proprietary & Confidential
INFRASTRUCTURE INDUSTRIES
North America Latin America Europe Middle East Africa China India Rest of Asia
GLOBAL PRESENCE
GENERAL INDUSTRIESFood & Bev
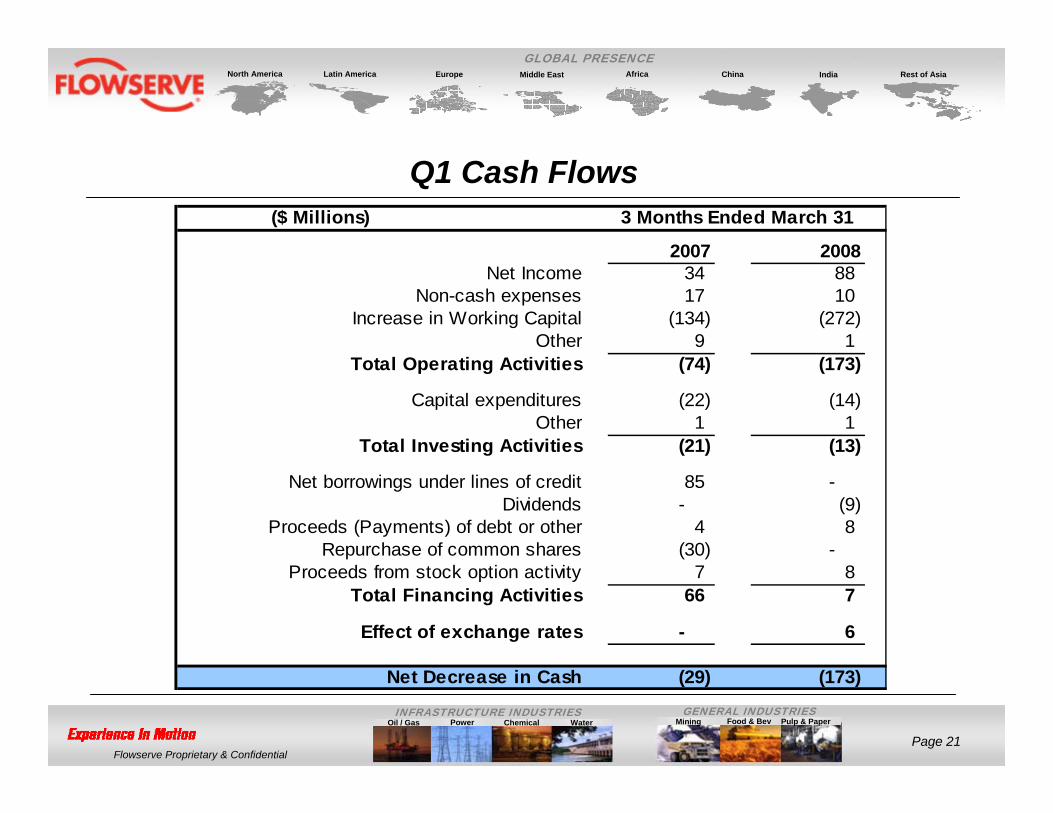
($ Millions)
2007 2008Net Income 34 88
Non-cash expenses 17 10 Increase in Working Capital (134) (272)
Other 9 1 Total Operating Activities (74) (173)
Capital expenditures (22) (14) Other 1 1
Total Investing Activities (21) (13)
Net borrowings under lines of credit 85 - Dividends - (9)
Proceeds (Payments) of debt or other 4 8 Repurchase of common shares (30) -
Proceeds from stock option activity 7 8 Total Financing Activities 66 7
Effect of exchange rates - 6
Net Decrease in Cash (29) (173)
3 Months Ended March 31
Q1 Cash Flows
Mining Pulp & PaperOil / Gas Power Chemical Water
Page 22Flowserve Proprietary & Confidential
INFRASTRUCTURE INDUSTRIES
North America Latin America Europe Middle East Africa China India Rest of Asia
GLOBAL PRESENCE
GENERAL INDUSTRIESFood & Bev
FY2008 Outlook
Mining Pulp & PaperOil / Gas Power Chemical Water
Page 23Flowserve Proprietary & Confidential
INFRASTRUCTURE INDUSTRIES
North America Latin America Europe Middle East Africa China India Rest of Asia
GLOBAL PRESENCE
GENERAL INDUSTRIESFood & Bev
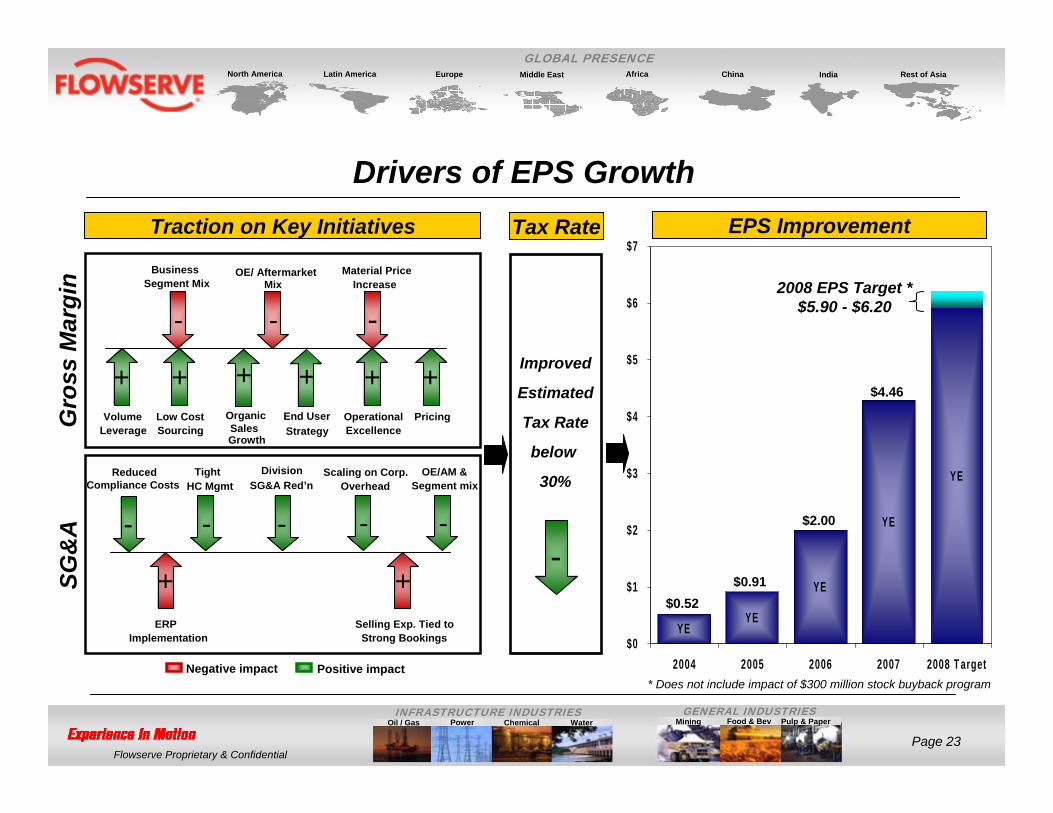
Drivers of EPS Growth
YEYE
YE
YE
YE
$0
$1
$2
$3
$4
$5
$6
$7
2004 2005 2006 2007 2008 T arget
2008 EPS Target *$5.90 - $6.20
$0.52$0.91
$2.00
$4.46
EPS ImprovementTraction on Key Initiatives
-
+ + ++
Business Segment Mix
OE/ AftermarketMix
Material Price Increase
Volume Leverage
Low Cost Sourcing
Operational Excellence
Pricing
- -
Negative impact Positive impact
- -
++
ERP Implementation
Selling Exp. Tied to Strong Bookings
ReducedCompliance Costs
Tight HC Mgmt
-
OE/AM &Segment mix
Division SG&A Red’n
- -
Scaling on Corp. Overhead
Improved
Estimated
Tax Rate
below
30%
OrganicSales Growth
SG&
AG
ross
Mar
gin
+End User Strategy
* Does not include impact of $300 million stock buyback program
+
Tax Rate
-
Mining Pulp & PaperOil / Gas Power Chemical Water
Page 24Flowserve Proprietary & Confidential
INFRASTRUCTURE INDUSTRIES
North America Latin America Europe Middle East Africa China India Rest of Asia
GLOBAL PRESENCE
GENERAL INDUSTRIESFood & Bev
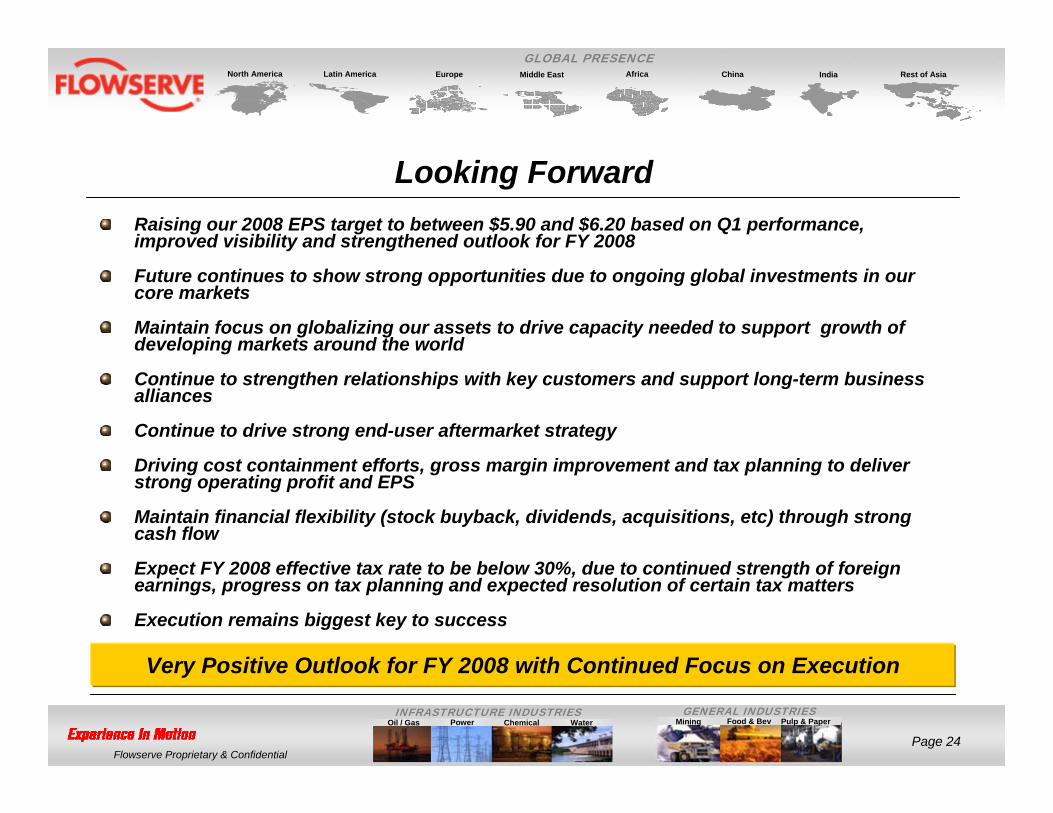
Looking ForwardRaising our 2008 EPS target to between $5.90 and $6.20 based on Q1 performance, improved visibility and strengthened outlook for FY 2008
Future continues to show strong opportunities due to ongoing global investments in our core markets
Maintain focus on globalizing our assets to drive capacity needed to support growth of developing markets around the world
Continue to strengthen relationships with key customers and support long-term business alliances
Continue to drive strong end-user aftermarket strategy
Driving cost containment efforts, gross margin improvement and tax planning to deliver strong operating profit and EPS
Maintain financial flexibility (stock buyback, dividends, acquisitions, etc) through strong cash flow
Expect FY 2008 effective tax rate to be below 30%, due to continued strength of foreign earnings, progress on tax planning and expected resolution of certain tax matters
Execution remains biggest key to success
Very Positive Outlook for FY 2008 with Continued Focus on Execution

Mining Pulp & PaperOil / Gas Power Chemical Water
Page 25Flowserve Proprietary & Confidential
INFRASTRUCTURE INDUSTRIES
North America Latin America Europe Middle East Africa China India Rest of Asia
GLOBAL PRESENCE
GENERAL INDUSTRIESFood & Bev
Questions and Answers
Recommended