2017 as a year of a record high stock market 1
A renewed ‘conundrum’ and ‘goldilocks’ economy in the bull market 2
The background of worldwide low bond yields 3
Impact of advanced ICT on rates and stock prices 4
Outline of the 2018 global economic outlook 5
Robust global economy leading Japan to its greatest recovery since WWII 6
Investment in labor-reducing ICT will support growth 7
Subdued wage growth despite the tight labor market 8
Still difficult to reach the 2% inflation target 9
Emerging speculation about early normalization of BOJ monetary policy 10
Reviewing Abenomics over the past 5 years 11
Remaining tasks to revive the Japanese economy 12
Missing perspectives on ‘Human Resource Innovation’ 13
See Appendix A-1 for analyst certification, important disclosures and the status of non-US analysts.
Japan in the World
The year of record high stock markets
Source: Nomura based on Bloomberg data
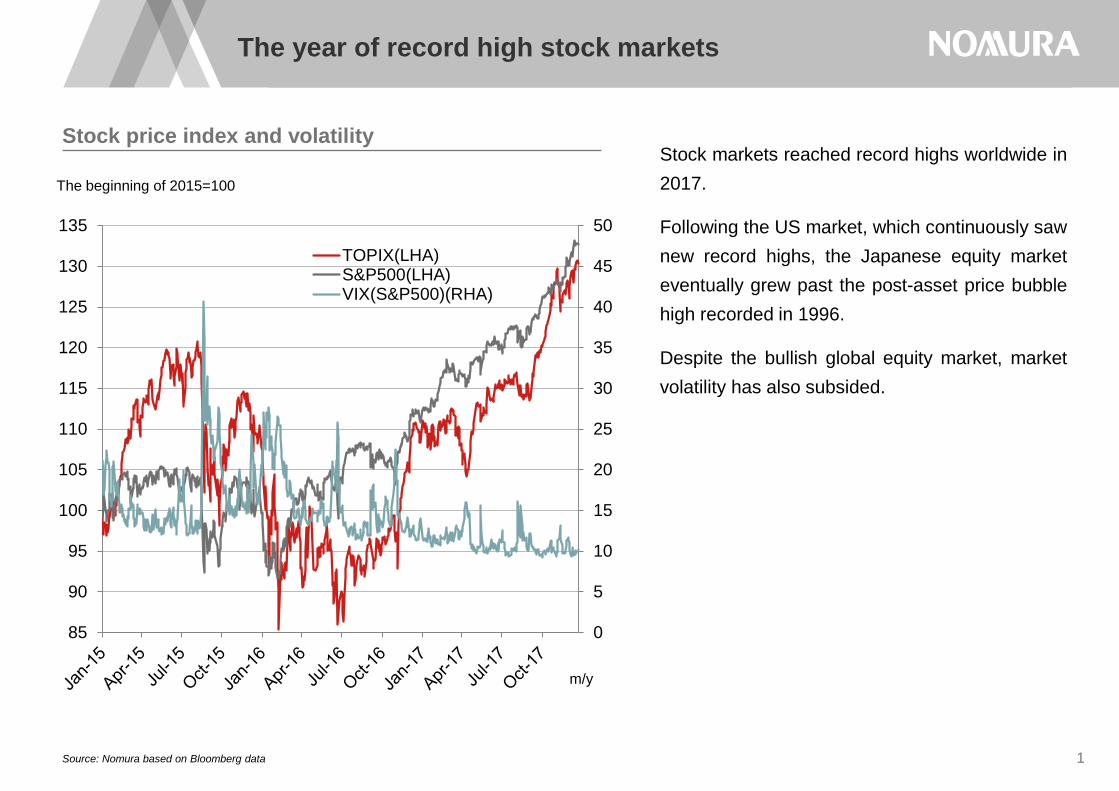
Stock price index and volatility Stock markets reached record highs worldwide in
2017.
Following the US market, which continuously saw
new record highs, the Japanese equity market
eventually grew past the post-asset price bubble
high recorded in 1996.
Despite the bullish global equity market, market
volatility has also subsided.
1
0
5
10
15
20
25
30
35
40
45
50
85
90
95
100
105
110
115
120
125
130
135
TOPIX(LHA)S&P500(LHA)VIX(S&P500)(RHA)
m/y
The beginning of 2015=100
0
1
2
3
4
5
6
7
8
00 01 02 03 04 05 06 07 08 09 10 11 12 13 14 15 16 17
Fed Fund Rates Target
UST10year
%
CY
A renewed ‘conundrum’ in the bull market
Source: Nomura based on Bloomberg data
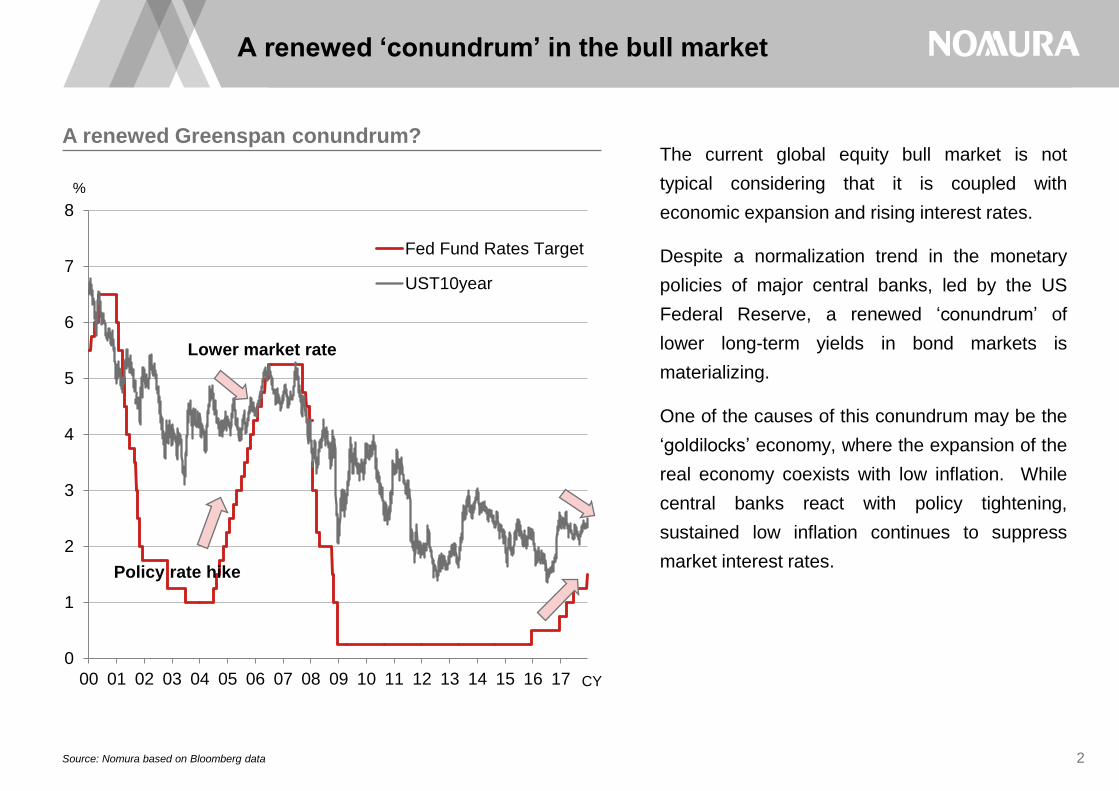
A renewed Greenspan conundrum? The current global equity bull market is not
typical considering that it is coupled with
economic expansion and rising interest rates.
Despite a normalization trend in the monetary
policies of major central banks, led by the US
Federal Reserve, a renewed ‘conundrum’ of
lower long-term yields in bond markets is
materializing.
One of the causes of this conundrum may be the
‘goldilocks’ economy, where the expansion of the
real economy coexists with low inflation. While
central banks react with policy tightening,
sustained low inflation continues to suppress
market interest rates.
2
Policy rate hike
Lower market rate
The background of worldwide low bond yields
Source: Nomura based on US department of commerce and US department of labor
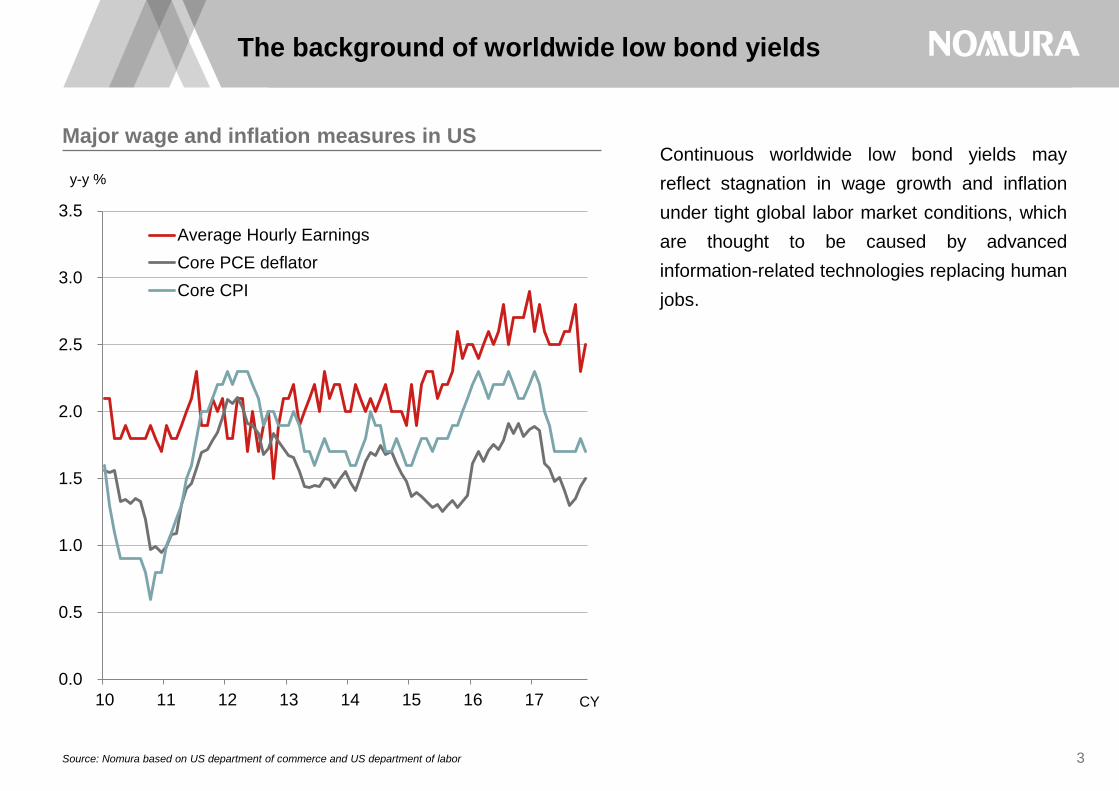
Major wage and inflation measures in US Continuous worldwide low bond yields may
reflect stagnation in wage growth and inflation
under tight global labor market conditions, which
are thought to be caused by advanced
information-related technologies replacing human
jobs.
3
0.0
0.5
1.0
1.5
2.0
2.5
3.0
3.5
10 11 12 13 14 15 16 17
Average Hourly Earnings
Core PCE deflator
Core CPI
y-y %
CY
Impact of advanced ICT on rates and stock prices
Source: Nomura based on FRB
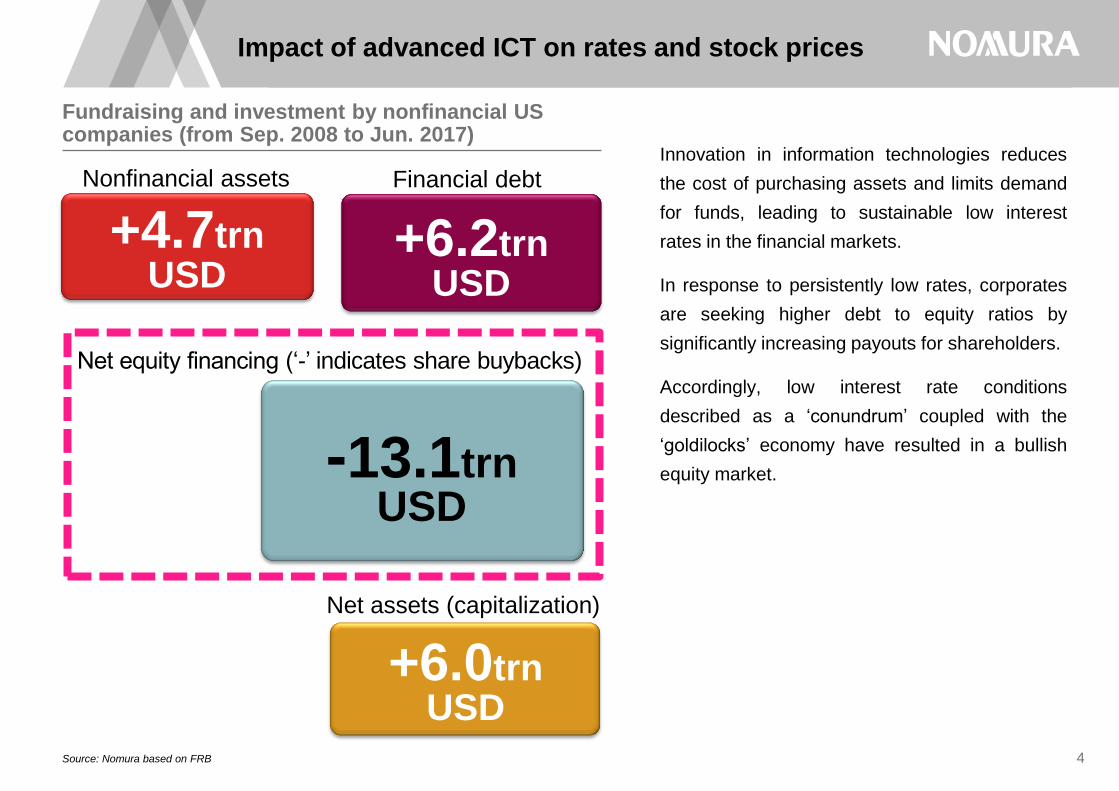
Fundraising and investment by nonfinancial US companies (from Sep. 2008 to Jun. 2017)
Innovation in information technologies reduces
the cost of purchasing assets and limits demand
for funds, leading to sustainable low interest
rates in the financial markets.
In response to persistently low rates, corporates
are seeking higher debt to equity ratios by
significantly increasing payouts for shareholders.
Accordingly, low interest rate conditions
described as a ‘conundrum’ coupled with the
‘goldilocks’ economy have resulted in a bullish
equity market.
4
Nonfinancial assets Financial debt
Net equity financing (‘-’ indicates share buybacks)
Net assets (capitalization)
+4.7trn USD
+6.2trn USD
-13.1trn USD
+6.0trn USD
Summary of 2018 global economic forecast
Note: as of 18 December 2017
Source: Nomura global research
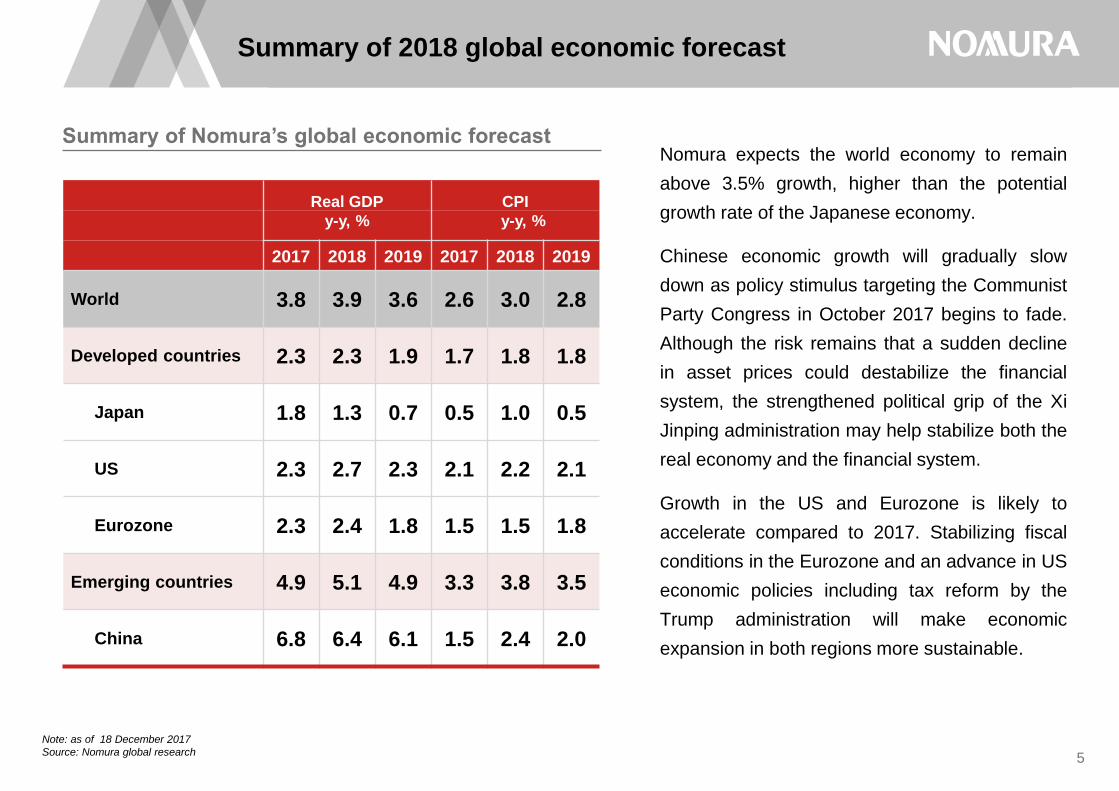
Summary of Nomura’s global economic forecast Nomura expects the world economy to remain
above 3.5% growth, higher than the potential
growth rate of the Japanese economy.
Chinese economic growth will gradually slow
down as policy stimulus targeting the Communist
Party Congress in October 2017 begins to fade.
Although the risk remains that a sudden decline
in asset prices could destabilize the financial
system, the strengthened political grip of the Xi
Jinping administration may help stabilize both the
real economy and the financial system.
Growth in the US and Eurozone is likely to
accelerate compared to 2017. Stabilizing fiscal
conditions in the Eurozone and an advance in US
economic policies including tax reform by the
Trump administration will make economic
expansion in both regions more sustainable.
5
Real GDP CPI y-y, % y-y, %
2017 2018 2019 2017 2018 2019
World 3.8 3.9 3.6 2.6 3.0 2.8
Developed countries 2.3 2.3 1.9 1.7 1.8 1.8
Japan 1.8 1.3 0.7 0.5 1.0 0.5
US 2.3 2.7 2.3 2.1 2.2 2.1
Eurozone 2.3 2.4 1.8 1.5 1.5 1.8
Emerging countries 4.9 5.1 4.9 3.3 3.8 3.5
China 6.8 6.4 6.1 1.5 2.4 2.0
A robust global economy leading to the greatest
recovery in Japan since WWII
Source: Nomura based on US Department of Commerce
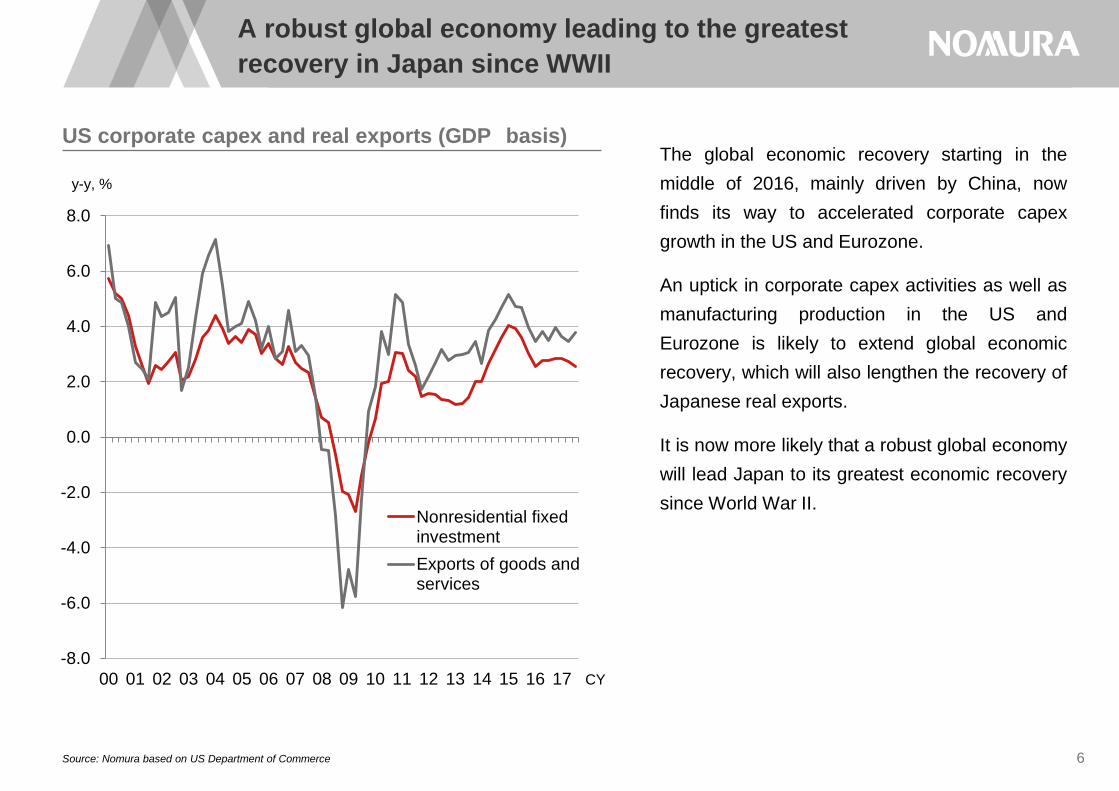
US corporate capex and real exports (GDP basis) The global economic recovery starting in the
middle of 2016, mainly driven by China, now
finds its way to accelerated corporate capex
growth in the US and Eurozone.
An uptick in corporate capex activities as well as
manufacturing production in the US and
Eurozone is likely to extend global economic
recovery, which will also lengthen the recovery of
Japanese real exports.
It is now more likely that a robust global economy
will lead Japan to its greatest economic recovery
since World War II.
6
-8.0
-6.0
-4.0
-2.0
0.0
2.0
4.0
6.0
8.0
00 01 02 03 04 05 06 07 08 09 10 11 12 13 14 15 16 17
Nonresidential fixedinvestment
Exports of goods andservices
y-y, %
CY
Investment in labor-reducing ICT will support growth
Note: Including software investment but excluding land investment. All enterprises in all industries basis.
Source: Nomura based on BOJ data.
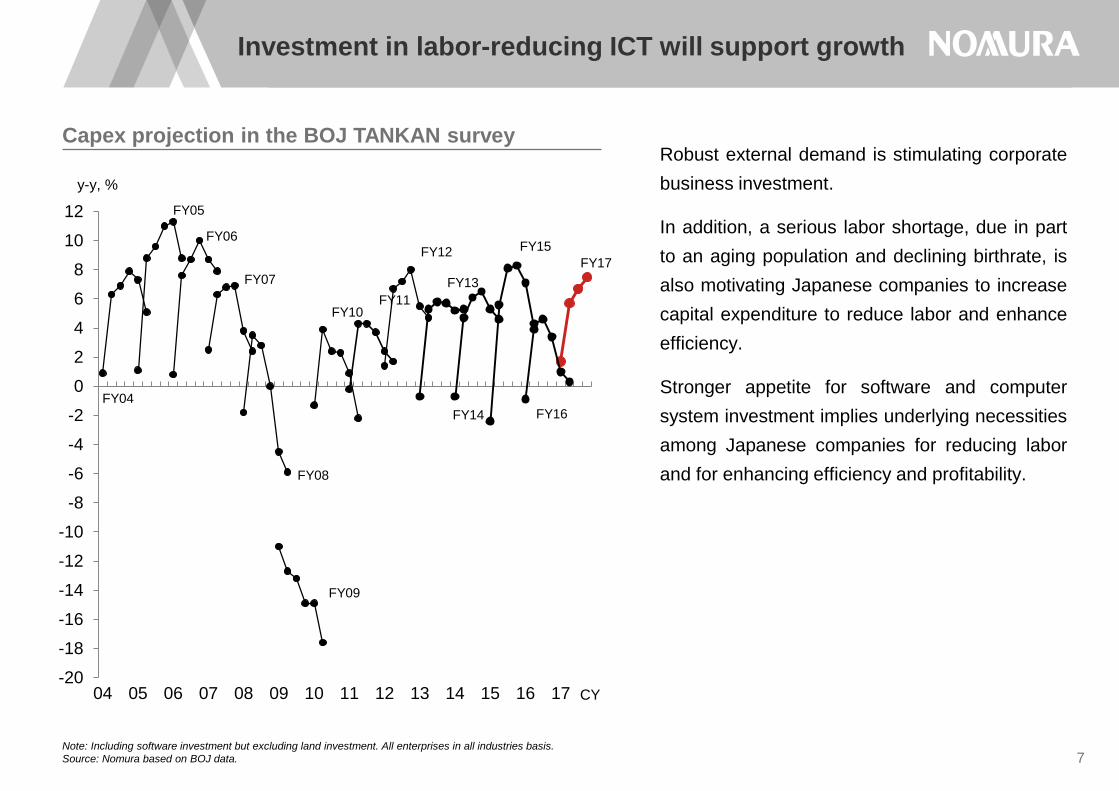
Robust external demand is stimulating corporate
business investment.
In addition, a serious labor shortage, due in part
to an aging population and declining birthrate, is
also motivating Japanese companies to increase
capital expenditure to reduce labor and enhance
efficiency.
Stronger appetite for software and computer
system investment implies underlying necessities
among Japanese companies for reducing labor
and for enhancing efficiency and profitability.
7
-20
-18
-16
-14
-12
-10
-8
-6
-4
-2
0
2
4
6
8
10
12
04 05 06 07 08 09 10 11 12 13 14 15 16 17
y-y, %
FY04
FY05
FY11
FY06
FY07
FY08
FY09
FY10
CY
FY12
FY13
FY14
FY15
FY16
FY17
Capex projection in the BOJ TANKAN survey
Subdued wage growth despite the tight labor market
Source: Nomura based on Ministry of Health, Labor and Welfare
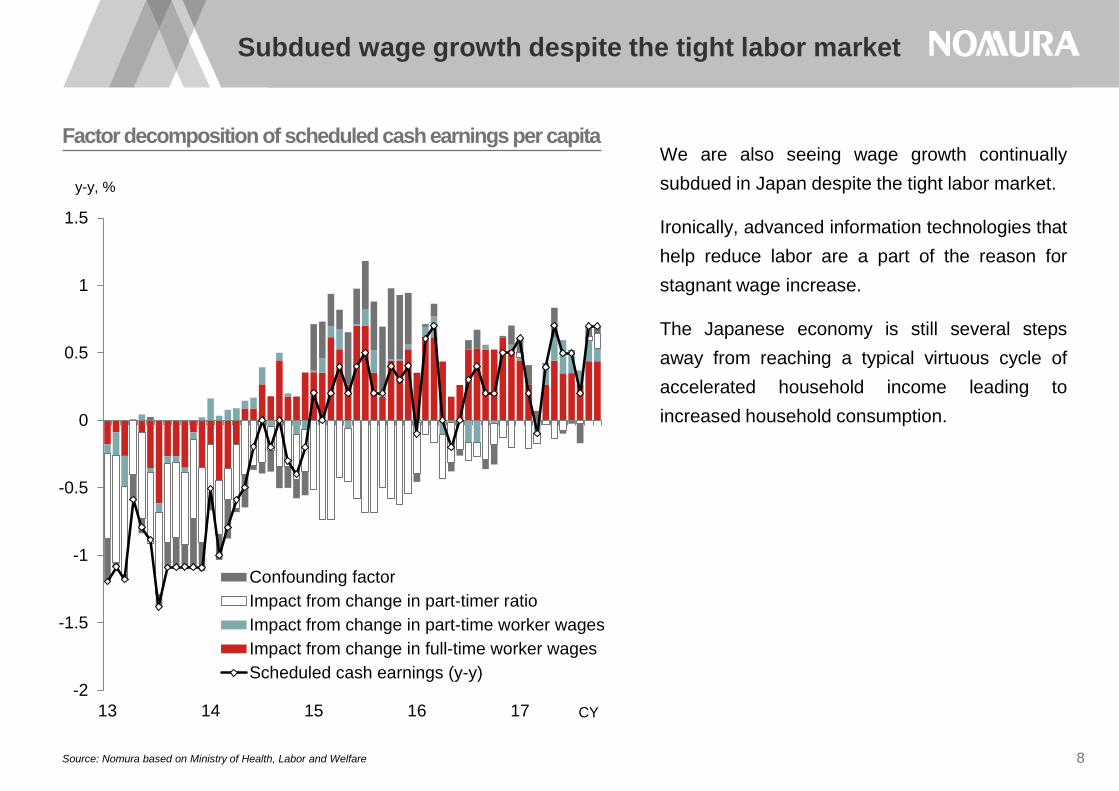
Factor decomposition of scheduled cash earnings per capita We are also seeing wage growth continually
subdued in Japan despite the tight labor market.
Ironically, advanced information technologies that
help reduce labor are a part of the reason for
stagnant wage increase.
The Japanese economy is still several steps
away from reaching a typical virtuous cycle of
accelerated household income leading to
increased household consumption.
8
-2
-1.5
-1
-0.5
0
0.5
1
1.5
13 14 15 16 17 CY
Confounding factor
Impact from change in part-timer ratio
Impact from change in part-time worker wages
Impact from change in full-time worker wages
Scheduled cash earnings (y-y)
y-y, %
Still difficult to reach 2% inflation target
Note: Core food refers to foods excluding fresh foods and alcoholic beverages.
Source: Nomura based on Ministry of General Affairs data
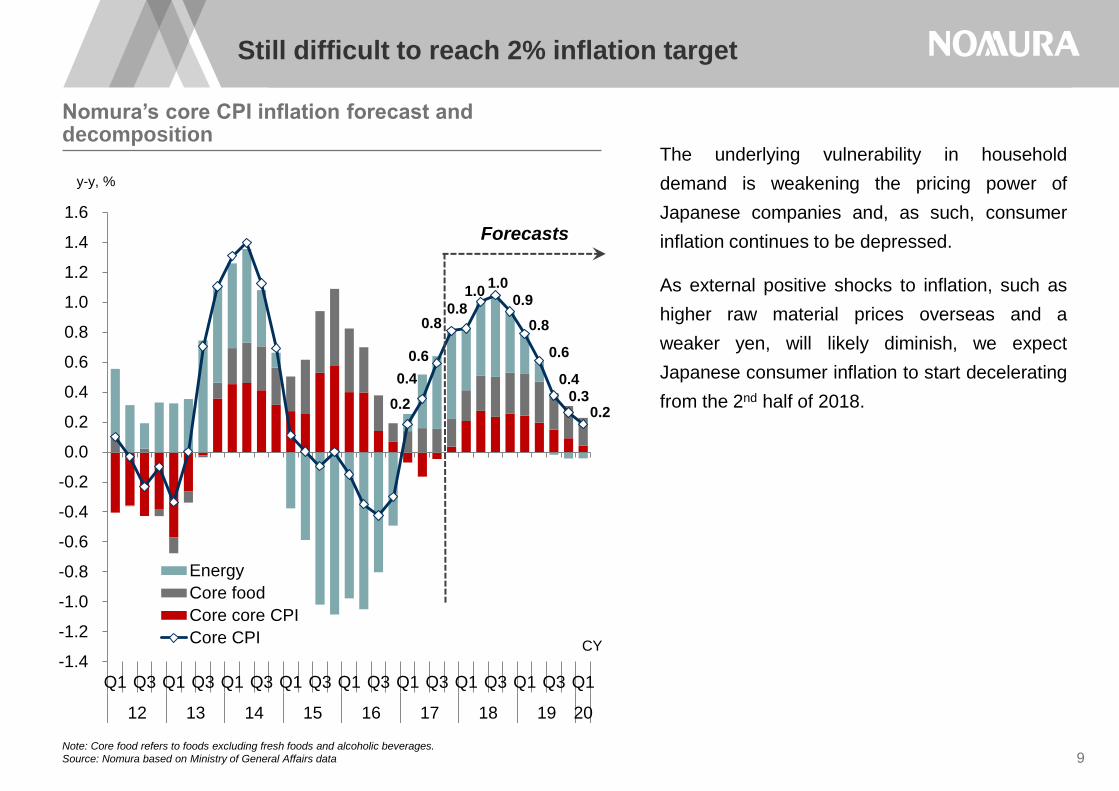
Nomura’s core CPI inflation forecast and decomposition
The underlying vulnerability in household
demand is weakening the pricing power of
Japanese companies and, as such, consumer
inflation continues to be depressed.
As external positive shocks to inflation, such as
higher raw material prices overseas and a
weaker yen, will likely diminish, we expect
Japanese consumer inflation to start decelerating
from the 2nd half of 2018.
9
0.2
0.4
0.6
0.8 0.8
1.0 1.0
0.9
0.8
0.6
0.4 0.3
0.2
-1.4
-1.2
-1.0
-0.8
-0.6
-0.4
-0.2
0.0
0.2
0.4
0.6
0.8
1.0
1.2
1.4
1.6
Q1 Q3 Q1 Q3 Q1 Q3 Q1 Q3 Q1 Q3 Q1 Q3 Q1 Q3 Q1 Q3 Q1
12 13 14 15 16 17 18 19 20
Energy
Core food
Core core CPI
Core CPI
y-y, %
Forecasts
CY
Emerging speculation about early normalization of
BOJ monetary policy
Source: Nomura based on BOJ, FRB and ECB data.
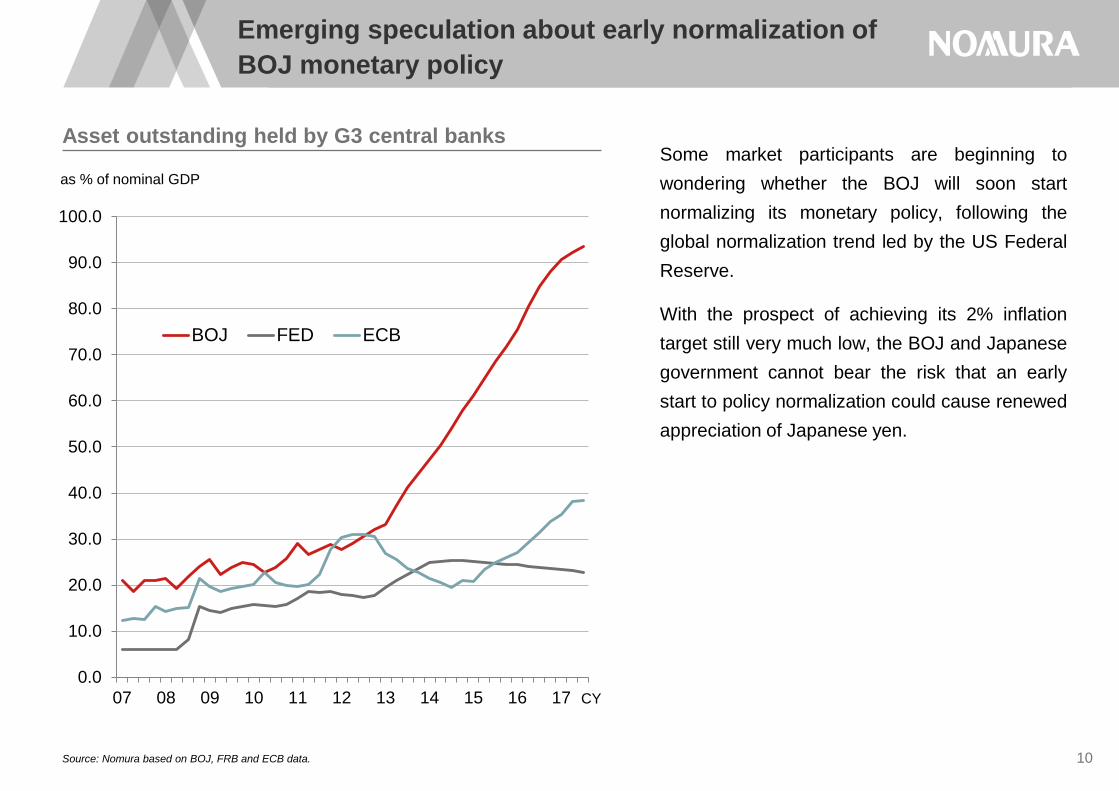
Asset outstanding held by G3 central banks Some market participants are beginning to
wondering whether the BOJ will soon start
normalizing its monetary policy, following the
global normalization trend led by the US Federal
Reserve.
With the prospect of achieving its 2% inflation
target still very much low, the BOJ and Japanese
government cannot bear the risk that an early
start to policy normalization could cause renewed
appreciation of Japanese yen.
10
0.0
10.0
20.0
30.0
40.0
50.0
60.0
70.0
80.0
90.0
100.0
07 08 09 10 11 12 13 14 15 16 17
BOJ FED ECB
as % of nominal GDP
CY

Reviewing Abenomics over the past 5 years
Source: Nomura based on Ministry of General Affairs
Accumulative increase in the number of employees One of the successes of Abenomics has been
the steady creation of new jobs in line with the
economic recovery achieved thus far.
Increased employment since the start of the Abe
administration, however, has been mostly
concentrated on women and the elderly, for
whom employment contracts are generally part-
time and the level of compensation is not
considerably high.
The fact that the jobs created under Abenomics
have not been very high-quality implies that there
are still tasks remaining for the administration to
tackle in its macroeconomic policy.
11
0
50
100
150
200
250
300
350
2013 2014 2015 2016 2017
Of which female btw ages 35-54
Male over age 65
Total
Accumulative increase since the end of 2012, 10 thd
CY

Remaining tasks to revive the Japanese economy
Source: Nomura based on BOJ
Potential growth of the Japanese economy and decomposition
A contradictory outcome of increased general
demand and employment coupled with the
deteriorating quality of jobs might be indicative of
deceleration in productivity growth.
Under the renewed probability that the Japanese
economy is likely to face labor constraints as the
labor participation rate of women and the elderly
approaches its natural limit, improved productivity
growth is becoming increasingly necessary to
raise the potential growth rate of the economy.
12
-2.0
-1.0
0.0
1.0
2.0
3.0
4.0
5.0
6.0
83 87 91 95 99 03 07 11 15
Number of employed
Hours worked
Capital stock
Total factor productivity
Potential growth rate
y-y, %, contribution
CY
Missing perspectives on ‘Human Resource
Innovation’
Note: Human capital = total for country as a whole of present value of per capita lifelong wages. Nonhuman
capital = capital stock (estimated using rate of population growth, average rate of economic growth, and rate
of depreciation).
Source: Nomura, based on UN University, IHDP, Inclusive Wealth Report 2014
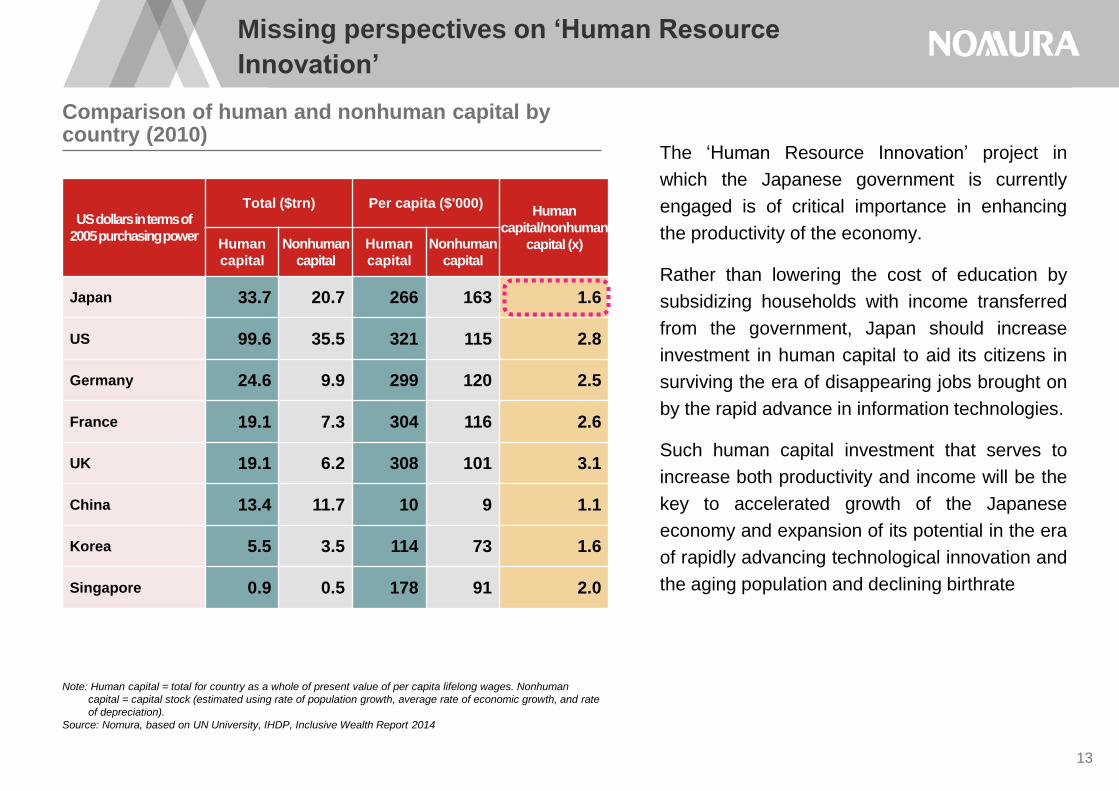
Comparison of human and nonhuman capital by country (2010)
The ‘Human Resource Innovation’ project in
which the Japanese government is currently
engaged is of critical importance in enhancing
the productivity of the economy.
Rather than lowering the cost of education by
subsidizing households with income transferred
from the government, Japan should increase
investment in human capital to aid its citizens in
surviving the era of disappearing jobs brought on
by the rapid advance in information technologies.
Such human capital investment that serves to
increase both productivity and income will be the
key to accelerated growth of the Japanese
economy and expansion of its potential in the era
of rapidly advancing technological innovation and
the aging population and declining birthrate
13
US dollars in terms of
2005 purchasing power
Total ($trn) Per capita ($'000) Human
capital/nonhuman
capital (x) Human
capital
Nonhuman
capital
Human
capital
Nonhuman
capital
Japan 33.7 20.7 266 163 1.6
US 99.6 35.5 321 115 2.8
Germany 24.6 9.9 299 120 2.5
France 19.1 7.3 304 116 2.6
UK 19.1 6.2 308 101 3.1
China 13.4 11.7 10 9 1.1
Korea 5.5 3.5 114 73 1.6
Singapore 0.9 0.5 178 91 2.0

Source: Nomura 14
Biography
Takashi Miwa is the Chief Japan Economist of Nomura Securities Co. Ltd. He provides in-depth
analysis and forecasts of the Japanese economy, based on interregional analysis of the macro
economy and financial market analysis across various asset classes. He has a particular strength in
analysing the macro economy from legal and administrative perspectives. Since joining Nomura
Research Institute in 1990, he has engaged in macroeconomic analysis and financial market
forecasting for various regions. In 1994-96, he moved to the Fixed Income Department of Nomura
Securities and analysed the macro economy from more market-oriented perspectives while engaging
in forecasting monetary policy and interest rates. He also made feasibility studies and conducted
investment strategy planning with a view to the start of European Monetary Union in 1999.
He received his master’s degree in Law from the University of Tokyo in 2001 and his bachelor’s degree
in Liberal Arts and Science from the University of Tokyo in 1990. While in the graduate school of law,
he studied contract law, corporate law and bankruptcy law, and made an analysis of financial contracts
and corporate behaviour from the perspectives of ‘Law and Economics’. This experience proved useful
in analysing banking behaviour, administrative responses and price reactions of fixed income and other
securities during Japan’s financial turmoil through 2003 and the global financial crisis after the collapse
of Lehman Brothers in 2008.
From 2001, he provided economic analysis and investment ideas for major regional financial
institutions including regional banks in Japan and gained an extremely good reputation among the top
management of those clients. He moved to Nomura Securities in 2004. After belonging to the
Economic Research, Investment Research, and Investment Research and Investor Services
departments, he took his current position in May 2016.
He has authored several textbooks on economics and finance for beginners that are popular among
university students and young graduates starting careers in financial institutions.
Takashi Miwa Chief Japan Economist
Appendix A-1
Disclaimers THIS MATERIAL IS: (I) FOR YOUR PRIVATE INFORMATION, AND WE ARE NOT SOLICITING ANY ACTION BASED UPON IT; (II) NOT TO BE CONSTRUED AS AN
OFFER TO SELL OR A SOLICITATION OF AN OFFER TO BUY ANY SECURITY IN ANY JURISDICTION WHERE SUCH OFFER OR SOLICITATION WOULD BE
ILLEGAL; AND (III) BASED UPON INFORMATION FROM SOURCES THAT WE CONSIDER RELIABLE, BUT HAS NOT BEEN INDEPENDENTLY VERIFIED BY
NOMURA GROUP.
Nomura Group does not warrant or represent that the document is accurate, complete, reliable, fit for any particular purpose or merchantable and does not accept liability
for any act (or decision not to act) resulting from use of this document and related data. To the maximum extent permissible all warranties and other assurances by Nomura
group are hereby excluded and Nomura Group shall have no liability for the use, misuse, or distribution of this information.
Opinions or estimates expressed are current opinions as of the original publication date appearing as below and the information, including the opinions and estimates
contained herein, are subject to change without notice. Nomura Group is under no duty to update this document. Any comments or statements made herein are those of
the author(s) and may differ from views held by other parties within Nomura Group. Clients should consider whether any advice or recommendation in this report is suitable
for their particular circumstances and, if appropriate, seek professional advice, including tax advice. Nomura Group does not provide tax advice.
Nomura Group, and/or its officers, directors and employees, may, to the extent permitted by applicable law and/or regulation, deal as principal, agent, or otherwise, or have
long or short positions in, or buy or sell, the securities, commodities or instruments, or options or other derivative instruments based thereon, of issuers or securities
mentioned herein. Nomura Group companies may also act as market maker or liquidity provider (within the meaning of applicable regulations in the UK) in the financial
instruments of the issuer. Where the activity of market maker is carried out in accordance with the definition given to it by specific laws and regulations of the US or other
jurisdictions, this will be separately disclosed within the specific issuer disclosures.
NO PART OF THIS MATERIAL MAY BE (I) COPIED, PHOTOCOPIED, OR DUPLICATED IN ANY FORM, BY ANY MEANS; OR (II) REDISTRIBUTED WITHOUT THE
PRIOR WRITTEN CONSENT OF A MEMBER OF NOMURA GROUP.
Disclaimers required in Japan Investors in the financial products offered by Nomura Securities may incur fees and commissions specific to those products (for example, transactions involving Japanese
equities are subject to a sales commission of up to 1.404% on a tax-inclusive basis of the transaction amount or a commission of ¥2,808 for transactions of ¥200,000 or
less, while transactions involving investment trusts are subject to various fees, such as commissions at the time of purchase and asset management fees (trust fees),
specific to each investment trust). In addition, all products carry the risk of losses owing to price fluctuations or other factors. Fees and risks vary by product. Please
thoroughly read the written materials provided, such as documents delivered before making a contract, listed securities documents, or prospectuses.
Nomura Securities Co., Ltd. Financial instruments firm registered with the Kanto Local Finance Bureau (registration No. 142)
Member associations: Japan Securities Dealers Association; Japan Investment Advisers Association; The Financial Futures Association of Japan; and Type II Financial
Instruments Firms Association.
December 29, 2017
Copyright © 2018 Nomura Securities Co., Ltd.. All rights reserved.

All electricity to print this booklet is generated by green energy.(273.4kWh)
Recommended