Prefatory Note The attached document represents the most complete and accurate version available based on original copies culled from the files of the FOMC Secretariat at the Board of Governors of the Federal Reserve System. This electronic document was created through a comprehensive digitization process which included identifying the best-preserved paper copies, scanning those copies,1
and then making the scanned versions text-searchable.2
Though a stringent quality assurance process was employed, some imperfections may remain. Please note that some material may have been redacted from this document if that material was received on a confidential basis. Redacted material is indicated by occasional gaps in the text or by gray boxes around non-text content. All redacted passages are exempt from disclosure under applicable provisions of the Freedom of Information Act. 1 In some cases, original copies needed to be photocopied before being scanned into electronic format. All scanned images were deskewed (to remove the effects of printer- and scanner-introduced tilting) and lightly cleaned (to remove dark spots caused by staple holes, hole punches, and other blemishes caused after initial printing). 2 A two-step process was used. An advanced optical character recognition computer program (OCR) first created electronic text from the document image. Where the OCR results were inconclusive, staff checked and corrected the text as necessary. Please note that the numbers and text in charts and tables were not reliably recognized by the OCR process and were not checked or corrected by staff.
Content last modified 6/05/2009.

Confidential (FR) Class II FOMC
Part 1 November 9, 1977
CURRENT ECONOMIC ANDFINANCIAL CONDITIONS
Summary and Outlook
Prepared for the Federal Open Market CommitteeBy the staff of the Board of Governors of the Federal Reserve System

CONFIDENTIAL (FR)
November 9, 1977
SUMMARY AND OUTLOOK
By the StaffBoard of Governors
of the Federal Reserve System

SUMMARY AND OUTLOOK

I - 1
DOMESTIC NONFINANCIAL DEVELOPMENTS
Summary. Recent economic indicators suggest a somewhat more
rapid pace of activity in the fourth quarter than the reduced third
quarter rate. Consumer demand appears to have picked up, and
residential construction remains buoyant. There are also signs of
continued advance in capital outlays. However, industrial production
and employment rose only moderately in October and private surveys of
business fixed investment plans indicate smaller gains for 1978 than
this year. At the same time, finished goods prices at wholesale rose
sharply in October, possibly presaging a larger price rise at retail
following the small increases in August and September.
Retail sales are estimated on the basis of weekly data to
have moved up sharply in October, after several months of lackluster
performance. Purchases at general merchandise, furniture and appliance,
and food stores appear to have moved up quite sharply. Unit auto sales
also increased somewhat in October; sales of domestic models, which may
have been adversely affected in September by the delayed availability
of 1978 models, rose to a 9.1 million unit annual rate. Sales of foreign
autos edged down to a 1.8 million unit annual rate, reportedly because of
depleted inventories of some popular models.
Industrial production is tentatively estimated to have in-
creased by one-quarter to one-half per cent in October. Employment growth
slowed and the unemployment rate edged back up to 7.0 per cent, the

I - 2
seventh consecutive month at about that level. The increase in nonfarm
payroll employment totaled only 120,000 (165,000 after allowance for
increased strike activity); the service-producing industries showed
smaller gains, and layoffs in the steel industry and strikes at
aerospace firms more than offset moderate job rises in most other sectors
of manufacturing. The average workweek in manufacturing edged back up
to 40.3 hours.
Residential building activity has continued at a robust pace.
Total private housing starts were at a 2.04 million unit annual rate
in September--about the same as the third quarter average, which was
almost 8 per cent above the second quarter. Single family starts con-
tinued near a record rate of 1.5 million while multi-family starts
moved somewhat lower. Continued strength in demand is evidenced by the
very strong sales pace of new and existing houses during the quarter.
Moreover, vacancy rates remain historically quite low.
On the basis of incomplete data, the Commerce Department
estimated that nonfarm inventory accumulation (GNP basis) in the third
quarter was slightly reduced from the second quarter pace. Book value
data indicate a relatively slow rate of increase at manufacturers early
in the third quarter. In September, however, accumulation picked up,
largely reflecting faster growth for nondurables, especially food and
related products. Accumulation at trade establishments was exceptionally
large in August.

I - 3
Indicators of business fixed investment activity continue
mixed. New orders for nondefense capital goods rose 8.7 per cent in
September but for the third quarter as a whole these orders were off
marginally from the second quarter rate. However, the machinery
component of such orders--generally a better indicator of future
trends in business fixed investment than the total--was up about
5-1/2 per cent from the second quarter. In addition, construction
contracts for commercial and industrial buildings (measured in square
feet) rose sharply in the third quarter, to their highest level since
1974, with both components showing strong gains.
At the same time, the McGraw-Hill capital spending survey--
generally considered the most reliable of the private surveys--indicated
an increase of only 11 per cent in 1978. The survey suggested continued
strength for most durable manufacturers. However, little increase was
indicated for petroleum and the rise planned by electric utilities was
significantly under the 1977 increase. An overall rise of this magnitude
would result in a smaller increase in business fixed investment in real
terms than this year's likely gain of about 8-3/4 per cent.
Increases in government spending contributed substantially
to the growth of real output in the third quarter, as implementation of
public service employment programs contributed to a large gain in State
and local employment. State and local construction activity was apparently
little changed between the second and third quarter, however, despite
substantial disbursements of Federal funds under the Public Works Program.

I - 4
Retail price increases have been smaller recently than during
the first half of the year. The Consumer Price Index rose only 0.3 per
cent in September--about the same as in August--as both food and non-
food commodities rose modestly and prices of services increased at a
slower pace than earlier in the year. In October, however, wholesale
prices rose 0.8 per cent, as prices of farm products and processed feeds
increased sharply after declining for four months. Among industrial
commodities, there were large price rises for a number of producer
finished goods (trucks, aircraft and some machinery items). In addition,
prices of consumer nonfood finished goods registered another sizable
increase last month.
Outlook. The staff estimate of real growth in the fourth
quarter has been revised down slightly. Inventory investment, which was
somewhat greater in the third quarter than the staff had previously
assumed, is now expected to show a smaller rise in the fourth quarter.
But consumption outlays appear likely to be a bit stronger, and on
balance we now anticipate an increase in real GNP at an annual rate of
5 per cent.
The fiscal and monetary policy assumptions underlying the
forecast are unchanged from those incorporated last month. The deficit
expected for fiscal year 1978 remains a shade below $59 billion and the
full employment budget still is expected to move toward balance by the
end of the year. Growth of M1 is still assumed to average 5-1/4 per cent
I - 5
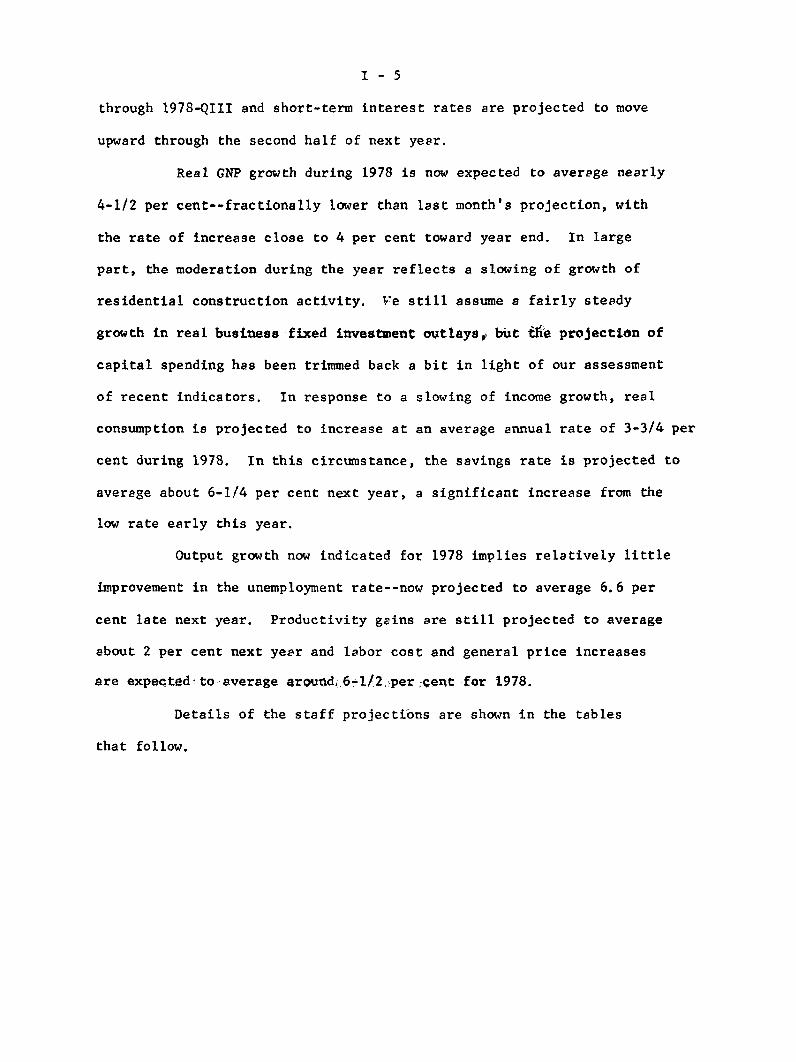
through 1978-QIII and short-term interest rates are projected to move
upward through the second half of next year.
Real GNP growth during 1978 is now expected to average nearly
4-1/2 per cent--fractionally lower than last month's projection, with
the rate of increase close to 4 per cent toward year end. In large
part, the moderation during the year reflects a slowing of growth of
residential construction activity. We still assume a fairly steady
growth in real business fixed investment outlays, but the projection of
capital spending has been trimmed back a bit in light of our assessment
of recent indicators. In response to a slowing of income growth, real
consumption is projected to increase at an average annual rate of 3-3/4 per
cent during 1978. In this circumstance, the savings rate is projected to
average about 6-1/4 per cent next year, a significant increase from the
low rate early this year.
Output growth now indicated for 1978 implies relatively little
improvement in the unemployment rate--now projected to average 6.6 per
cent late next year. Productivity gains are still projected to average
about 2 per cent next year and labor cost and general price increases
are expected to average around 6-1/2 per cent for 1978.
Details of the staff projections are shown in the tables
that follow.

I-6
STAFF GNP PROJECTIONS
Per cent changes, annual rateGross business
product Unemploymentfixed-weighted rate
Nominal GNP Real GNP price index (per cent)10/12/77 11/9/77 10/12/77 11/9/77 10/12/77 11/9/77 10/12/77 11/9/77
1974 8.1 8.1 -1.4 -1.4 10.4 10.4 5.6 5.61975 1 8.2 8.2 -1.3 -1.3 9.5 9.5 8.5 8.5197 6- 11.6 11.6 6.0 6.0 5.4 5.4 7.7 7.71977 10.8 10.7 4.8 4.8 6.0 6.0 7.1 7.11978 11.3 11.2 4.7 4.6 6.4 6.3 6.6 6.6
1/1977-1- 13.2 13.2 7.5 7.5 6.8 6.8 7.4 7.41977-I-11 13.7 13.7 6.2 6.2 7.5 7.5 7.0 7.0
1/1977-III- 9.2 9.2 3.8 3.8 5.3 5.2 7.0 7.01977-IV 12.4 12.1 5.2 5.0 6.0 6.0 6.9 6.9
1978-I 11.4 11.4 4.8 4.7 6.8 6.8 6.7 6.71978-11 11.2 10.9 4.7 4.5 6.5 6.5 6.7 6.71978-III 10.6 10.5 4.3 4.2 6.2 6.2 6.6 6.61978-IV 11.3 11.3 4.3 4.1 6.3 6.3 6.6 6.6
Change:76-I11I77-I1- 10.5 10.5 4.7 4.7 6.1 6.1 -.4 -.4
76-IV to77-IV 12.1 12.0 5.7 5.6 6.4 6.4 -1.0 -1.0
77-11 to78-11 11.0 10.9 4.6 4.5 6.1 6.1 -. 3 -. 3
77-IV to78-IV 11.1 11.0 4.5 4.4 6.4 6.4 -. 3 -. 3
1/ Actual.

November 9, 1977
CONFIDENTIAL - FRCLASS II FOMC GROSS NATIONAL PRODUCT AND RELATED ITEMS
(Quarterly figures are seasonally adjusted. Expenditures and income
figures are billions of dollars, with quarter figures at annual rates.)
1977 1978Projected
I I III IV I II III IV
1810.8
1797.01422.1
1430.3
Gross National ProductFinal purchases
PrivateExcluding net exports
Personal consumption expendituresGoodsServices
Gross private domestic investmentResidential constructionBusiness fixed investmentChange in business inventories
Nonfarm
1/Net exports of goods and services-
/
ExportsImports
Gov't. purchases of goods and services
Federal 2/
State and local
1869.9
1848.21457.6
1467.3
1172.4 1194.0
643.6 653.0
528.8 541.1
271.881.0
177.0
13.814.1
-8.2
170.4
178.6
374.9136.3238.5
Gross national product in
constant (1972) dollars
Personal income
Wage and salary disbursements
Disposable incomeSaving rate (per cent)
Corporate profits with I.V.A. and C.C. Adj.
Corporate profits before tax
Federal government surplus or deficit (-)
(N.I.A. basis)
High employment surplus or deficit (-)
State and local government surplus ordeficit (-) (N.I.A. basis)
Excluding social insurance funds
Civilian labor force (millions)
Unemployment rate (per cent)
Nonfarm payroll employment (millions)Manufacturing
Industrial production (1967=100)
Capacity utilization: all manufacturing (per cent)Materials (per cent)
Housing starts, private (millions, A.R.)
Sales new autos, (millions, A.R.)Domestic models
Foreign models
1/ Balance of payments data and projection underlyingof this part of the Greenbook.
294.9
90.8
182.421.722.4
-9.7
178.1
187.7
390.6143.6
247.0
1911.31891.51485.9
1497.5
1966.8
1945.71526.2
1539.3
2020.7
2002.1
1572.2
1583.7
2073.5
2049.71609.4
1625.1
2125.72100.51649.41665.8
2183.5
2156.11691.6
1708.2
1216.7 1246.7 1279.4 1310.9 1342.0 1375.0
654.9 669.9 687.6 704.1 720.7 738.5
561.8 576.8 591.8 606.8 621.3 636.5
300.6
93.1
187.719.8
19.3
313.799.1
193.521.120.8
322.9
104.6199.718.6
18.6
338.0108.1
206.123.8
23.8
349.0111.1212.7
25.225.2
360.6
113.6219.627.4
27.4
-11.6 -13.1 -11.5 -15.7 -16.4 -16.6
174.9 173.9 186.6 192.1 198.6 204.3186.6 187.1 198.2 207.9 215.1 221.0
405.6
151.5254.1
419.5157.6261.9
429.9160.2
269.7
440.3163.0277.3
451.1166.3284.8
1311.0 1330.7 1343.2 1359.6 1375.3 1390.6 1404.8
1476.8
951.31252.4
4.1
1517.2
980.9
1292.55.3
1548.3
997.11320.5
5.5
1597.7
1025.31363.1
6.2
1635.5
1053.31401.2
6.4
1675.8
1077.8
1433.4
6.2
1724.01103.8
1467.0
6.2
464.5172.2292.3
1419.1
1770.21133.21503.4
6.2
125.4 140.2 147.2 153.7 150.4 156.2 159.7 165.6161.7 174.0 171.2 185.7 182.7 188.7 192.2 198.1
-38.8 -40.3 -59.3 -59,6 -54.b -49.3 -43.3 -40.89.4 -.5 -18.5 -19.9 -12.7 -7.7 -2.3 -.2
27.3 25.4 30.6 28.0 25.8 25.1 23.7 21.711.9 10.0 15.1 10.9 8.3 7.1 5.2 2.7
96.1 97.2 97.6 98.2 98.7 99.3 99.9 100.47.4 7.0 7.0 6.9 6.7 6.7 6.6 6.6
80.9 81.9 82.5 83.1 83.7 84.3 84.9 85.419.3 19.6 19.6 19.7 19.9 20.1 20.3 20.5
133.681.2
80.4
1.76
11.129.281.84
137.0 138.6 140.0 142.5 145.182.7 83.0 83.0 83.7 84.482.6 82.8 83.0 83.9 84.7
1.9111.70
9.342.36
2.05 2.15
10.92 11.208.88 9.202.04 2.00
cnese estimaces are snown
2.20
11.35
9.451.90
2.1011.409.501.90
147.484.985.3
2.0511.409.501.90
149.7
85.386.0
2.00
11.40
9.501.90
in the International Developments section
2/ Components of purchases and total receipts and total expenditures are shown in the Federal Sector Accounts table whichfollows.
-~---- --- ------
I - 7

CONFIDENTIAL - FRCLASS II FOMC
I - 8
CHANGES IN GROSS NATIONAL PRODUCTAND RELATED ITEMS
November 9, 1977
1977 1978
ProjectedI II III IV I II III IV
- -------------- Billions of dollars--------------
Gross National ProductInventory changeFinal purchases
PrivateNet exportsExcluding net exports
Personal consumption expendituresGoodsServices
Residential fixed investmentBusiness fixed investment
GovernmentFederalState and local
GNP in constant (1972) dollarsFinal purchasesPrivate
Gross National ProductFinal purchases
Private
Personal consumption expendituresGoodsServices
Gross private domestic investmentResidential structuresBusiness fixed investment
Gov't. purchases of goods and servicesFederalState and local
GNP in constant (1972) dollarsFinal purchasesPrivate
GNP implicit deflator-Gross business product fixed-weighted price index-
Personal incomeWage and salary disbursements
Disposable income
Corporate profits before tax
Nonfarm payroll employmentManufacturing
Nonfarm business sectorOutput per hourCompensation per hourUnit labor costs
Industrial productionHousing starts, privateSales new autos
Domestic modelsForeign models
55.414.740.735.8
-11.247.033.418.514.9
4.39.44.92.12.7
59.17.9
51.235.5-1.537.021.69.412.39.85.4
15.77.38.5
41.4-1.943.328.3-1.930.222.71.9
20.72.35.3
15.07.97.1
52.8 52.2 57.85.2 1.4 2.2
47.6 50.8 55.637.2 40.0 42.2-4.2 -.7 -.241.4 40.7 42.431.5 31.1 33.016.5 16.6 17.815.0 14.5 15.23.5 3.0 2.56.4 6.6 6.910.4 10.8 33.42.8 3.3 5.97.6 7.5 7.5
23.6 19.7 12.5 16.5 15.6 15.3 14.2 14.312.0 16.3 12.6 15.6 16.8 11.9 13.6 12.813.3 9.6 5.6 12.5 14.0 9.2 10.8 11.3
1/----------------- In Per Cent Per Year- ----- ---
13.2 13.7 9.2 12.1 11.4 10.9 10.5 11.39.6 11.9 9.7 12.0 12.1 9.9 10.3 11.0
10.7 10.4 8.0 11.3 12.6 9.8 10.3 10.6
12.2 7.612.4 6.012.0 9.6
7.8 10.2 10.9 10.2 9.81.2 9.5 11.0 9.9 9.8
16.2 11.1 10.8 10.5 9.9
55.5 38.6 8.0 18.6 12.3 20.1 13.7 14.024.2 57.9 10.8 28.4 24.1 14.1 11.6 9.324.5 12.8 12.0 12.9 13.4 13.4 13.4 13.6
5.4 17.9 16.3 14.4 10.3 10.0 10.2 12.46.6 23.3 23.8 17.1 6.8 7.2 8.3 15.04.7 14.9 12.1 12.9 12.5 11.8 11.3 11.0
13.1 11.4 8.512.7 13.0 6.810.1 13.4 9.0
13.4 9.8 10.2 12.0 11.211.8 11.4 9.6 10.0 11.113.5 11.6 9.5 9.7 10.3
19.1 34.1 -6.3 38.6 -6.3 13.6 7.8 12.8
4.3 4.9 3.2 2.7 3.0 2.6 2.9 2.75.3 6.4 1.1 1.6 4.5 4.8 3.5 3.6
4.8 .711.4 7.56.3 6.8
10.637.722.5
2.6170.5
3.57.43.7
4.834.8
-24.1-18.4-43.9
2.211.2
9.0
7.59.65.5
11.3-18.5
2.27.85.6
7.4-17.0
1.82.1.0
2.07.95.9
6.3-9.4
.0
.0
.0
1/ Percentage rates are annual rates compounded quarterly.2/ Excluding Federal pay increases rates of change are: 1977-1, 5.3 per cent;
cent; 1978-IV, 6.2 per cent.3/ Using expenditures in 1972 as weights.
1977-IV, 6.1 per cent; 1978-I, 6.4 per
-- -

November 9, 1977
CONFIDENTIAL - FRCLASS II FOMC GROSS NATIONAL PRODUCT AND RELATED ITEMS
(Expenditures and income figures are billions of dollars)
1971 1972 1973 1974 1975 1976 1977 1978
Gross National ProductFinal purchases
PrivateExcluding net exports
Personal consumption expendituresGoodsServices
Gross private domestic investmentResidential constructionBusiness fixed investmentChange in business inventories
Nonfarm
Net exports of goods and servicesExportsImports
Gov't. purchases of goods and servicesFederalState and local
1063.41057.1823.4821.8
668.2374.8293.4
160.049.6
104.16.45.1
1171.11161.7908.6911.9
733.0410.5322.4
188.362.0
116.89.48.8
1306.6
1288.6
1019.1
1012.0
809.9
457.5
352.3
220.0
66.1
136.017.9
14.7
1412.91404.01101.31095.3
889.6498.3391.3
214.655.1
150.68.9
10.8
1528.8
1540.3
1201.4
1181.0
980.4542.2
438.2
189.151.5
149.1-11.5
-15.1
1706.51693.11331.71323.9
1093.9601.6492.3
243.368.0
161.913.314.9
1889.71870.61473.01483.6
1207.4655.4552.1
295.391.0185.219.119.1
2100.82077.11630.61645.7
1326.8712.7614.1
342.6109.3209.523.723.7
1.6 -3.3 7.1 6.0 20.4 7.8 -10.7 -15.165.6 72.7 101.6 137.9 147.3 162.9 174.3 195.464.0 75.9 94.4 131.9 126.9 155.1 185.0 210.5
233.796.2
137.5
Gross national product in constant (1972) dollars
Personal incomeWage and salary disbursements
Disposable incomeSaving rate (per cent)
253.1102.1151.0
269.5102.2
167.3
302.7111.1191.5
338.9123.3215.6
361.4130.1231.2
397.7147.2250.4
446.4165.4281.0
1107.5 1171.1 1235.0 1217.8 1202.1 1274.7 1336.1 1397.5
859.1579.4742.8
7.7
942.5633.8801.36.2
1052.4701.3
901.77.8
1154.9764.6984.6
7.3
1253.4
805.7
1084.47.4
1382.7891.8
1185.85.6
1535.0988.7
1307.15.3
1701.41092.01451.2
6.2
Corporate profits with I.V.A. and C.C. Adj. 77.2Corporate profits before tax 82.0
Federal government surplus or deficit (-)(N.I.A. basis) -22.0
High employment surplus or deficit (-) -5.3
State and local government surplus ordeficit (-) (N.I.A. basis) 3.7
Excluding social insurance funds -3.8
Civilian labor force (millions) 84.1Unemployment rate (per cent) 6.0
Nonfarm payroll employment (millions) 71.2Manufacturing 18.6
Industrial production (1967=100) 109.6Capacity utilization: all manufacturing (per cent) 78.0
Materials (per cent) 83.1
Housing starts, private (millions, A.R.)Sales new autos (millions, A.R.)
Domestic modelsForeign models
2.0510.248.681.56
92.1 99.1 83.6 99.3 128.1 141.6 158.096.2 115.8 126.9 123.5 156.9 173.2 190.4
-17.3 -6.7 -10.7 -70.2 -54.0 -49.5 -47.0-5.9 -. 7 17.1 -20.3 -10.4 -7.4 -5.7
13.7 13.0 7.5 5.9 18.4 27.8 24.15.6 4.1 -2.9 -6.2 3.9 12.0 5.8
86.5 88.7 91.0 92.6 94.8 97.3 99.65.6 4.9 5.6 8.5 7.7 7.1 6.6
73.7 76.9 78.4 77.1 79.4 82.1 84.619.1 20.1 20.0 18.3 19.0 19.6 20.2
119.783.188.0
2.3610.939.321.61
129.8
87.592.4
129.384.287.7
117.873.673.6
129.880.280.4
2.05 1.34 1.16 1.5411.42 8.91 8.66 10.129.65 7.49 7.08 8.631.77 1.42 1.58 1.50
137.382.582.2
1.9711.249.182.06
146.284.685.0
2.0911.399.491.90
I -9

November 9, 1977
CONFIDENTIAL - FRCLASS II FOMC
CHANGES IN GROSS NATIONAL PRODUCTAND RELATED ITEMS
1971 1972 1973 1974 1975 1976 1977 1978
------------------ Billions of Dollars----------- -----
Gross National ProductInventory changeFinal purchases
PrivateNet exportsExcluding net exports
Personal consumption expendituresGoodsServices
Residential fixed investmentBusiness fixed investment
GovernmentFederalState and local
GNP in constant (1972) dollarsFinal purchasesPrivate
81.0 107.7 135.5 106.3 115.9 177.7 183.2 211.12.6 3.0 8.5 -9.0 -20.4 24.8 5.8 4.7
78.5 104.6 126.9 115.4 136.3 152.8 177.5 206.463.7 85.2 110.5 82.2 100.1 130.3 141.3 157.6-2.3 -4.9 10.4 -1.1 14.4 -12.6 -18.5 -4.466.0 90.1 100.1 83.3 85.7 142.9 159.7 162.149.4 64.8 76.9 79.7 90.8 113.5 113.5 119.425.2 35.7 47.0 40.8 43.9 59.4 53.8 57.324.3 29.0 29.9 39.0 46.9 54.1 59.8 62.013.0 12.4 4.1 -11.0 -3.6 16.5 23.0 18.33.6 12.7 19.2 14.6 -1.5 12.8 23.3 24.4
14.8 19.4 16.4 33.2 36.2 22.5 36.3 48.7.6 5.9 .1 8.9 12.2 6.8 17.1 18.2
14.3 13.5 16.3 24.2 24.1 15.6 19.2 30.6
32.2 63.6 63.9 -17.2 -15.7 72.6 61.4 61.329.9 60.8 56.8 -8.6 2.1 54.2 57.4 57.730.7 57.1 57.4 -13.8 -3.2 52.8 49.3 43.6
----------------In Per Cent Per Year----------------------
Gross National ProductFinal purchasesPrivate
8.2 10.1 11.68.0 9.9 10.98.4 10.3 12.2
Personal consumption expendituresGoodsServices
Gross private domestic investmentResidential structuresBusiness fixed investment
Gov't. purchases of goods and servicesFederalState and local
8.1 8.28.9 9.78.1 9.1
9.7 10.5 9.8 10.29.5 11.4 8.9 8.89.9 9.3 11.1 12.0
13.6 17.7 16.8 -2.5 -11.935.5 25.1 6.6 -16.7 -6.53.6 12.3 16.4 10.8 -1.0
6.8 8.3 6.5 12.3 12.0.6 6.1 .1 8.7 11.0
11.6 9.8 10.8 14.5 12.6
11.6 10.7 11.29.9 10.5 11.0
10.8 10.6 10.7
11.6 10.4 9.911.0 8.9 8.712.4 12.1 11.2
28.7 21.4 16.032.2 33.8 20.28.6 14.4 13.1
6.6 10.0 12.25.5 13.1 12.37.2 8.3 12.2
GNP in constant (1972) dollars 3.0Final purchases 2.8Private 3.7
GNP implicit deflator 5.1Gross business product fixed-weighted price index- 4.4
Personal income 7.2Wage and salary disbursements 6.0
Disposable income 8.3
5.5 -1.4 -1.34.9 -.7 .26.3 -1.4 -.35.8 9.7 9.65.7 10.4 9.5
9.7 11.79.4 10.77.9 12.5
9.7 8.5 10.3 11.0 10.89.0 5.4 10.7 10.9 10.49.2 10.1 9.4 10.2 11.0
Corporate profits before tax
Nonfarm payroll employmentManufacturing
Nonfarm business sectorOutput per hourCompensation per hourUnit labor costs
Industrial productionHousing startsSales new autos
Domestic modelsForeign models
14.7 17.3 20.4 9.6 -2.7 27.0 10.4
.4 3.5 4.3 2.0 -1.7 3.1 3.4 3.0-4.0 2.8 5.1 -.1 -8.5 3.3 3.2 3.5
2.9 3.0 1.7 -2.9 1.66.6 5.8 7.8 9.4 9.63.5 2.7 6.0 12.7 7.9
1.7 9.2 8.4 -.4 -8.943.1 14.9 -13.2 -34.6 -13.321.9 6.8 -4.7 -14.5 -2.821.9 7.4 3.5 -22.4 -5.521.8 3.1 9.7 -19.9 11.4
10.2 5.8 6.532.6 27.8 6.316.9 11.0 1.421.9 6.4 3.4-5.1 37.6 -7.8
- Using expenditures in 1972 as weights.
I - 10

FEDERAL SECTOR ACCOUNTS
(billions of dollars)
I F.R.B. staff estimatesFiscal FY 1978 e/ CY CY 1977 e/ Calendar quarters; unadiusted dataYear Admin. F.R. Cong. 1976 F.R. 1977 19781977* est. i/ Board est. 2/ * Board I* II* III* IV I II III
Unified budget receipts 356.9 401.4 397.0 397.0 317.6 367.2 79.0 110.5 91.3 86.4 86.4 119.8 104.4Unified budget outlays 401.9 462.9 455.5 458.3 374.2 411.7 97.6 101.8 103.4 108.9 109.3 115.3 122.0
Surplus(+)/Deficit(-), unified budget -45.0 -61.5 -58.5 -61.3 -56.6 -44.5 -18.7 8.6 -12.2 -22.5 -22.9 4.5 -17.6
Surplus(+)/Deficit(-), off-budget
agencies 3/ -8.7 -7.7 -10.9 n.a. -5.7 -11.4 -4.3 .1 -4.9 -2.3 -3.0 -0.9 -4.7
Means of financing combined deficits: 8/ 8Net borrowing from public 53.5 n.a. 62.4 n.a. 69.0 54.1 17.6 -1.1 19.6' 18.0- 23.5 -2.1 23.0
Decrease in cash operating balance -1.7 n.a. 7.1 n.a. -3.2 -0.3 2.6 -7.2 -2.8- 7.1- 0 0 0
Other 4/ 1.9 n.a. -0.2 n.a. -3.5 2.4 2.7 -.4 0.4 -0.3 2.3 -1.5 -0.78/
Cash operating balance, end of period 19.1 n.a. 12.0 n.a. 11.7 12.0 9.0 16.3 19.1- 12.0 12.0 12.0 12.0
Memo: Sponsored agency borrowing 5/ 6.1 n.a. n.e. n.a. 2.9 7.2 .7 3.0 2.0 1.5 2.8 n.e. n.e.
NIA Budget Seasonally adjusted annual rates6/ 6/
Receipts 362.7/ 415.3 409.3-6
n.a. 332.3 374.9 364.9 371.2 374.6e 388.9 402.7 415.7 434.2
Outlays 412.4p 469.3 462.1 n.a. 386.3 424.5 403.7 411,5 434.0p 448.6 457.3 465.0 477.5
Purchases (total) 141.4p 163.5 161.8 n.a. 130.1 147.3 136.3 143.6 151.5p 157.6 160.2 163.0 166.3
Defense 92.2p 105.2 103.6 n.a. 86.8 95.4 89.7 93.4 97.3p 101.1 102.8 104.5 106.1
Non-defense 49.2p 58.3 58.2 n.a. 43.3 51.9 46.7 50.2 54.2p 56.5 57.4 58.5 60.2
All other outlays 271.Op 305.8 300.36/ n.a. 256.2 277.2 267.4 267.9 282.5p 291.0 297.1 302.0 311.2
Surplus(+)/Deficit(-) -49.7/ -54.0 -52.8- n.a. -54.0 -49.5 -38.8 -40.3 -59.4e -59.6 -54.6 -49.3 -43.3
High Employment Surplus(+)/Deficit(NIA basis) 7/ -4.3 n.a. -10.7 n.a. -10.4 -7.4 9.5 -0.5 -18.5 -19.9 -12.7 -7.7 -2.3
*actual e--estimated r--revised n.e.--not estimated n.a.--not available p--preliminary1/ OMB Mid-Session Review of the 1978 Budget, (July 1, 1977).2/ Congress' Second Concurrent Resolution on the Budget (September 15, 1977).3/ Includes Federal Financing Bank, Postal Service, U.S.. Railway Association, Rural Electrification and Telephone Revolving fund, Housing for the
Elderly or Handicapped Fund, and Pension Benefit Guaranty Corporation.4/ Checks issued less checks paid, accrued items and other transactions.5/ Includes Federal Home Loan Banks, FNMA, Federal Land Banks, Federal Intermediate Credit Banks, and Banks for Cooperatives.6/ Quarterly average exceeds fiscal year total by $1.1 billion for FY 1977 and FY 1978 due to spreading of wage base effect over calendar year.7/ Estimated by F.R.B. staff.8/ Includes $2.5 billion of borrowing from the Federal Reserve on September 30 which was repaid October 4.

I - 12
Comments on the Federal Sector Outlook
The fiscal policy outlook continues to incorporate key
assumptions about energy policy and social security tax changes, each
of which currently are being reviewed by Congressional Conference
Committees. Our energy assumptions continue to conform to the House
bill which includes a crude oil equalization tax taking effect in
early 1978. The added revenues from this tax--$4.5 billion in calendar
year 19781/--are assumed to be fully returned to individuals and corpora-
tions in the form of per capita rebates and energy conservation tax
credits.
With respect to social security taxes, we are still assuming
only the currently scheduled increases (on January 1, 1978) in both the
wage base ceiling--from $16,500 to $17,700--and the combined payroll
tax rate--from 11.7 per cent to 12.1 per cent. These changes are ex-
pected to raise around $7.0 billion in new revenues during calendar
year 1978. The staff has assumed that any additional increases in
the wage base and tax rate--currently under consideration by a
Conference Committee--will be delayed until January 1, 1979, as
recommended by the Senate.
Given the above assumptions, the staff projects that unified
budget receipts for fiscal year 1978 will be $397 billion and that
1/ This estimate is on a calendar year 1978 liability basis and is therelevant figure for the NIA forecast.

I - 13
outlays will be $455.5 billion, both about unchanged from last month.
The unified budget deficit for fiscal year 1978 is thus projected by
the staff to be $58-1/2 billion, and the total amount that needs to be
financed (unified plus off-budget) is estimated at around $69 billion.
About three-fourths of these borrowing needs are expected to occur in
the current quarter and in the first quarter of 1978. After allowing
for a rundown in the end of September cash balance of $7 billion and
2/for anticipated sales of nonmarketable issues totalling $6 billion,2/
marketable borrowing by the Treasury during this period is projected to
be $37-$39 billion, at least $10 billion more than in the same period
last year. Borrowing requirements of this magnitude probably will
necessitate the issuance of Treasury bills--either late in this quarter
or early in the next--in order to augment the new cash raised through
the regular note cycles and mid-quarter refundings.
The high employment budget, after registering a modest
surplus in the first half of calendar year 1977, continues to show a
swing to deficit in 1977 H:2 ($19 billion) and 1978 H:1 ($10 billion).
This movement reflects the faster pace of public employment and public
works spending and the higher refunds resulting from the 1977 Tax Act.
With no new fiscal initiatives and continued growth in receipts, the
high employment deficit is projected to decline to $5 billion in the
last half of 1978.
2/ Excludes repayment of $2.5 billion of special borrowing from theFederal Reserve.

I - 14
DOMESTIC FINANCIAL DEVELOPMENTS
Summary. Growth in the major monetary aggregates picked up
further in October as the rate of expansion in M1 surged to an estimated
12.3 per cent annual rate. The rate of increase in the time and savings
deposit compoment of M2 changed little, while thrift institution deposit
flows slowed from their advanced pace of the last few months.
Short-term interest rates have moved downward, on balance,
since the last FOMC meeting, as market participants revised their expecta-
tions in the light of the recent relative stability in the Federal funds
rate. Intermediate- and long-term rates, though, have moved upward by as
much as 15 basis points, partly in response to the Treasury's announcement
of plans to continue debt lengthening and of larger than generally expected
financing requirements through the first quarter of 1978. Most major
stock prices indexes, in addition, have retreated around one per cent
since the last FOMC meeting.
Aggregate credit flows, meanwhile, continued at close to the
very high levels of recent months. Total funds raised by nonfinancial
businesses in October may have picked up moderately as short- and
intermediate-term borrowings accelerated, while public bond offerings
moved somewhat lower. Household borrowing showed no appreciable
slackening, with mortgage flows evidently remaining around the advanced
third quarter pace and growth in consumer instalment credit probably re-
bounding from a slower September rate.

I - 15
In the public sector, security offerings by the Treasury rose
somewhat in October, particularly toward the end of the month, and on
into November in conjunction with the mid-quarter refunding. The
Treasury at the refunding raised $4.1 billion in cash through auctions
of 3- and 10-year notes, and thirty year bonds.1/ State and local
debt issues were somewhat lower in October, as short-term offerings
declined and a swollen calendar of long-term issues was trimmed when
tax-exempt yields backed up temporarily.
Outlook. Aggregate credit flows over the next few months
are expected to remain around their current strong pace. Although
Treasury borrowing is likely to pick up moderately, State and local
debt offerings should abate somewhat from their recent exceptional
volume, as the attractiveness of advance refundings diminishes.
Private credit flows in total are expected to remain rela-
tively robust into early next year. Demands for funds by households,
given current economic projections, will probably decline somewhat
from the advanced pace in the third quarter. But the gap between
business capital outlays and internally generated funds is expected
to widen in response to increased capital spending.
Longer-term bond issues of corporations and governments
are likely to be absorbed at around current interest rate levels by
1/ These figures exclude $700 million sold to foreign officialinstitutions.

I - 16
continued, sizable supplies of funds from insurance companies, pension
funds, and trust accounts. Demands on banks for credit probably will
exceed inflows of funds from demand and small-denomination time and
saving deposits, given short-term market rates at least as high as
those currently prevailing. Thus, commercial banks can be expected
not only to continue to liquidate Treasury securities but also, as
in recent weeks, to rely more heavily on managed liabilities such as
large denomination CD's.
Deposit inflows to thrift institutions are projected to be
slower in the months ahead than during the summer and early fall,
when the expansion in deposits had been exceptionally rapid for a
period of rising interest rates. Inflows, of course, would tend to
slow more if interest rates increase further as a result of stronger
credit demands or restraints on bank reserve growth in the face of
large demands for money. As thrift institution liquidity declines,
increased reliance will be placed on Federal financial support of
thrift institutions and the mortgage market. Consequently, Federal
agency issues--particularly of those of the FHLBanks and FNMA--are
expected to rise significantly. Mortgage lending conditions generally
are likely to tighten, and the increase in mortgage debt outstanding
may begin to decelerate by early next year.

I - 17
INTERNATIONAL DEVELOPMENTS
Summary. On a trade-weighted basis the average value of the
dollar has declined about 1-1/4 per cent against leading currencies since
the last green book, main'y reflecting upward movements of the Japanese
yen, the Swiss franc, and the U.K. pound. The Canadian dollar, however,
declined further against the U.S. dollar and other currencies. Continued
weakness of the U.S. dollar reflects heightened awareness of the size of
the prospective U.S. deficit on current account and the unsettling effects
of attitudes about the dollar and other currencies expressed by various
official sources.
On October 31 the pound sterling was allowed to float upward
. Since floating, the pound
has appreciated a net 2-1/2 per cent against the dollar,
. The Japanese yen appreciated a further 4 per cent
during the past four weeks, following a 4 per cent appreciation in the
preceding two weeks,
The U.S. trade balance in September improved somewhat to a
$24 billion deficit, at an annual rate, resulting in a $30 billion
deficit rate for the third quarter. A sharp rise in exports in September
to a considerable extent reflected temporary factors such as anticipation
of the longshoremen's strike on the East and Gulf Coasts which began
I - 18
October 1, and a rebound of coal and other exports from an unusually low
August rate. Imports in September were up a little, mainly because of
large petroleum imports as stocks here were raised further. The current
account deficit in the third quarter is estimated at about an $18
billion annual rate -- about the same as in the second quarter.
Reported capital flows (private and official) in the third
quarter were a net inflow of about $11.7 billion, more than double the
net inflow in the second quarter. However, the bank-reported inflow in
September seems to have been exaggerated by end-of-month discrepancies,
so that the actual net inflow was probably c oser to $10 billion. This
smaller figure about equals the estimated amount needed to finance the
current account deficit and other capital flows not yet reported, so the
large net receipts in the errors and omissions that have characterized
the U.S. international accounts since the end of 1974 may have disappeared,
at least temporarily.
The bulk of the reported capital inflow in the third quarter,
as in the first half of the year, was accounted for by large increases
in U.S. assets held by foreign official accounts --
U.S. banking offices
also registered a net inflow in the third quarter, the recorded net

I - 19
inflow in September was over $4 billion but, as noted above, there is
evidence that about half of this was associated with month-end
discrepancies in accounting.
Net inflows of capital to the U.S. through banks since early
in the year are consistent with the relative rise in interest rates on
dollar-denominated assets.
Activity in international capital markets slowed a bit in the
third quarter. Total borrowing of $13.3 billion was recorded in the
Euro-credit, Euro-bond, and foreign bond markets -- about 15 per cent
under the rate in the second quarter and under the quarterly average of
1976. Borrowing in the Euro-credit market by non-oil developing countries
appears to be down considerably from last year's rate. As usual,
interest rates in these markets have tended to rise in sympathy with
U.S. rates, but spreads in the Euro-credit market have been reduced by
intense competition.
With economic activity still lagging in industrial countries,
monetary policy abroad has generally been aimed at accommodating any
strengthening of demand, while fiscal policy, at least in the major
economies, has been gradually and cautiously shifted to stimulate growth.
Such fiscal policy initiatives have recently been taken in Canada, France,
Germany, Japan, and the United Kingdom. Smaller countries have combined

I - 20
attempts to raise employment with efforts to minimize budget deficits,
make the tax system more progressive, and reduce imports.
Outlook. Though economic policies abroad are increasingly aimed
at raising growth rates, the measures taken so far are not expected to
achieve more than a moderate year-over-year gain in foreign economic
activity from the unexpectedly depressed level of this year. In the
absence of significant change in the outlook for economic activity in
the U.S. and abroad the projection of the U.S. current-account deficit
for 1978 has been changed only marginally -- to about $24 billion from
last month's estimate of about $26 billion. For 1977 the deficit has
been scaled down a little to $18 billion. For both years projected
imports were reduced somewhat.
Financing of the current-account deficit is likely to shift
increasingly to private flows through banking markets if official market
intervention is now reduced because floating has become more general.
Depending on relative conditions in credit markets, and also on the
host of other factors that color expectations about exchange rates, such
inflows could occur without much further change in the average exchange
value of the dollar. However, some further small depreciation is
expected by the staff over the next year, with continued gains by the
German mark, Japanese yen, and Swiss franc more than matching declines
of some other currencies against the dollar.

CONFIDENTIAL (FR)CLASS II FOMC
U.S. Net Exports and Related Items
(billions of dollars, seasonally adjusted annual rates)
November 9, 1977
1976 1 9 7 7 1 9 7 8p
1976 1977p
1978P III IV I II IIIP IVP
I II III IV
I. GNP NE1 EXPORTS - Intl P(ct. data 7.7 --$.6 -11.8 7.8 2.9 -7.4 -8.7 -8.4 -9.9 -8.3 -12.6 -13.2 -13.42. (;.'? net exports - CG1i Acct. data) 1/ (7.E) (-10.7)(-15.1) (7.9) (3.C) (-8.2) (-9.7) (-11.6) -13.11 (-11.5) (-15.7) (-16.4) (-16.6)
3. a) Merchandise Trade Balance -9.3 -30.5 -36.6 -11.2 -14.4 -28.4 -31.4 -30.3* -31.8 -31.9 -36.9 -38.6 -39.1
4. Exports (excl. military) 114.7 120.8 136.3 118.4 118.8 117.8 122.0 122.9* 120.5 129.6 133.5 138.6 143.45. Agricultural 23.4 24.2 22.7 25.0 23.5 24.5 26.8 23.9* 21.6 22.1 22.3 23.0 23.46. Nonagricultural 91.3 96.6 113.6 93.5 95.3 93.4 95.2 99.1* 98.9 107.5 111.2 115.6 120.0
7. Imports 124.0 151.3 172.9 129.6 133.2 146.2 153.4 153.2* 152.3 161.5 170.4 177.2 182.58. Petroleum and petrol, products 34.6 45.9 49.0 37.6 37.4 44.1 47.7 45.8* 45.8 44.9 49.4 51.0 50.79. Nonpetroleum 89.4 105.4 123.9 92.0 95.9 102.1 105.7 107.4* 106.5 116.6 121.0 126.2 131.8
10. b) Military transactions, net 2/ -- 1.6 1.6 .6 .5 1.7 1.5 1.6 1.5 1.6 1.6 1.6 1.6
11. c) Investment income, net 3/ 14.3 18.5 21.2 15.3 14.4 17.9 18.7 18.5 18.7 20.2 20.9 21.8 21.9
12. d) Other services, net 4/ 2.7 1.8 2.0 3.1 2.4 1.4 2.5 1.8 1.7 1.8 1.8 2.0 2.2
13. U.S. CURRENT ACCOUNT BALANCE 2/ -1.0 -18.2 -24.3 -1.6 -6.0 -16.5 -17.8 -18.1 -20.3 -20.3 -25.0 -25.8 -26.014. a) GNP net exports (line 1.) 7.7 -8.6 -11.8 7.8 2.9 -7.4 -8.7 -8.4 -9.9 -8.3 -12.6 -13.2 -13.415. b) U.S. Govt & private transfers 5/ -8.7 -9.6 -12.5 -9.3 -8.9 -9.0 -9.1 -9.7 -10.4 -12.0 -12.4 -12.6 -12.6
Constant (1972) dollars16. Merchandise exports (excl. military)17. (% change, annual rates)
18. Merchandise imports19. (% change, annual rates)
Foreign Outlook - Major Industrial Countries a/20. Real GNP, % change, annual rate"21. Wholesale Prices, % change, A.R. 7/
56.7 67.3 72.6
(3.4) (0.8) (7.8)
62.8 70.9 76.0(22.5) (13.0) (7.2)
5.2 3.2 4.5
9.5 8.8 6.0
68.4(13.0)
64.9(29.1)
1.611.7
1/ Lags Intl. Acct. data (line 1) in the incl: slon of revisions andnew data.
2/ Excludes grants to Israel under military assistance acts and exportsfinanced by those grants.3/ Excludes U.S. Govt. interest payments to foreigners, which are in-
cluded in line 15.4/ Includes travel, transportation, fees and royalties, and mis-
cellaneous other service transactions.5/ Includes U.S. Govt grants, U.S. Govt interest payments to
foreigners, and remittances and pensions.
67.3(-6.6)
66.1(7.4)
2.98.7
66.1
(-7.4)
70.2(27.2)
5.310.4
67.4(8.2)
72.0
(10.4)
68.4(5.7)
71.1(-5.3)
67.0(-8.2)
70.1(-5.7)
-. 8 2.9 5.37.1 3.9 5.7
6/ Weighted by the shares of Canada, France, GiUnited Kingdom in the sum of the real GNP of the
7/ Data are largely manufactured goods prices.p/ Projected.e/ Estimated.*/ Published data.
71.0(25.8)
72.9
(17.0)
71.7
(4.1)
75.4
(14.3)
73.1
(8.2)
77.3
(10.4)
74.4
(7.4)
78.5
(6.6)
5.3 5.3 4.9
6.1 6.6 7.0
ermany,six coui
Italy, Japan and thentries in dollar terms.
Recommended