Prefatory Note The attached document represents the most complete and accurate version available based on original files from the FOMC Secretariat at the Board of Governors of the Federal Reserve System. Please note that some material may have been redacted from this document if that material was received on a confidential basis. Redacted material is indicated by occasional gaps in the text or by gray boxes around non-text content. All redacted passages are exempt from disclosure under applicable provisions of the Freedom of Information Act.
Content last modified 03/07/2014.
CLASS I FOMC - RESTRICTED CONTROLLED (FR)
MONETARY POLICY ALTERNATIVES
PREPARED FOR THE FEDERAL OPEN MARKET COMMITTEE BY THE STAFF OF THE BOARD OF GOVERNORS OF THE FEDERAL RESERVE SYSTEM
OCTOBER 23, 2008
Class I FOMC – Restricted Controlled (FR) October 23, 2008
MONETARY POLICY ALTERNATIVES
Recent Developments
Summary
(1) Financial markets came under extraordinary stress over the intermeeting
period. Markets were roiled by the bankruptcy of Lehman Brothers (which occurred
just before the September FOMC meeting), the difficulties at AIG, the closing of
Washington Mutual, and the forced sale of Wachovia. Those events intensified
already heightened concerns about the condition of other U.S. financial institutions
and about the impact of financial developments on the broader economy. Against
this backdrop, investors pulled back further from risk taking; as a consequence,
funding markets for terms beyond overnight essentially ceased to function for a time
and still remain severely impaired, yields and spreads on money market instruments
and corporate bonds shot up, secondary market prices for leveraged syndicated loans
plunged, and equity prices registered steep declines amid extremely high volatility.
Financial markets abroad experienced similar swings.
(2) In response, the Federal Reserve, the Department of the Treasury, the
Federal Deposit Insurance Corporation (FDIC), the Securities and Exchange
Commission, and many foreign central banks and governments took an
unprecedented series of policy initiatives over the intermeeting period. Sentiment in
credit markets seemed to improve somewhat late in the period, and there was a
modest recovery in liquidity in bank funding markets after the U.S. and foreign
governments announced they would inject capital into their banking systems and
guarantee selected liabilities of banking organizations in their jurisdictions. However,
markets generally remain extremely illiquid and volatile, and investors are still quite
skittish.
(3) On net over the intermeeting period, market participants marked down
substantially the expected path of monetary policy, with some of the decline occurring
after the intermeeting cut in the target federal funds rate on October 8, and they now
foresee an additional rate cut at the October 28-29 meeting. Short-term nominal
Treasury yields fell amid heavy flight-to-quality flows, while longer-term yields rose,
reportedly in response to expectations of increased Treasury issuance to finance
various government initiatives. Issuance of corporate debt slowed further amid the
unfavorable market conditions, and nonfinancial businesses drew heavily on existing
lines of credit at banks. The dollar appreciated against all major foreign currencies
except the yen.
Financial Institutions
(4) Investor sentiment deteriorated early in the intermeeting period in reaction
to the bankruptcy of Lehman Brothers and the rapid deterioration in the financial
condition of AIG.1 These developments precipitated losses at other financial entities,
including prime money market mutual funds (MMMFs). Prominently, one of these—
the Reserve Primary Fund—“broke the buck” on September 16, triggering rapid and
widespread outflows from other prime MMMFs and inflows into those holding
predominantly Treasury securities (Chart 1). Prime funds responded to the surge in
redemptions by reducing their purchases of commercial paper and other short-term
assets, causing significant strains in these markets. Meanwhile short-term Treasury
bill yields plummeted amid sharp inflows into Treasury-only MMMFs. Intense
1 On September 16, the Federal Reserve announced the establishment of a liquidity facility that would provide up to $85 billion in credit to assist AIG in meeting its obligations as they come due. This facility has a 24-month term, with interest accruing on the outstanding balance at a rate of three-month Libor plus 850 basis points, and is collateralized by all the assets of AIG and of its primary non-regulated subsidiaries. On October 8, the Federal Reserve announced an additional program under which it will lend up to $37.8 billion to finance investment-grade, fixed-income securities held by AIG. These securities had been previously lent by AIG’s insurance company subsidiaries to third parties.
Class I FOMC - Restricted Controlled (FR) 2 of 45
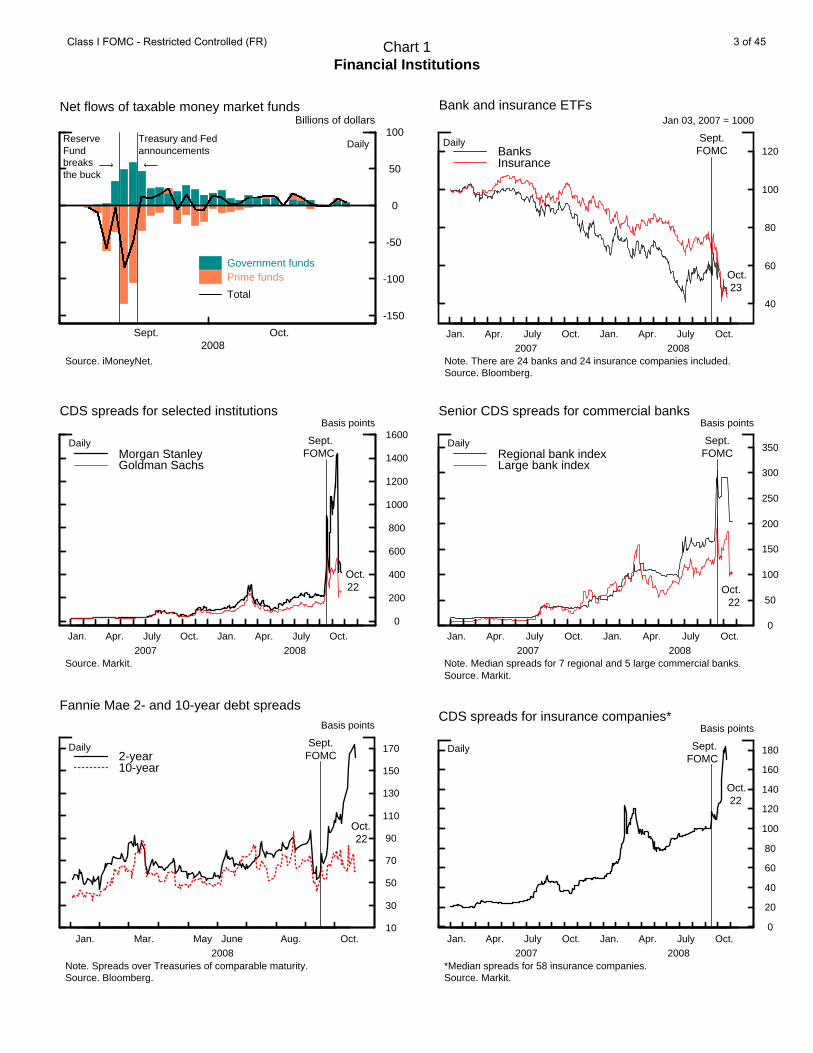
Chart 1Financial Institutions
-150
-100
-50
0
50
100Billions of dollars
Sept. Oct.2008
Government funds Prime funds
Total
Treasury and Fedannouncements
Reserve Fund breaks the buck
Daily
Net flows of taxable money market funds
Source. iMoneyNet.
Jan. Apr. July Oct. Jan. Apr. July Oct.2007 2008
40
60
80
100
120
Jan 03, 2007 = 1000
BanksInsurance
Daily
Bank and insurance ETFs
Note. There are 24 banks and 24 insurance companies included. Source. Bloomberg.
Sept.FOMC
Oct. 23
Jan. Apr. July Oct. Jan. Apr. July Oct.2007 2008
0
200
400
600
800
1000
1200
1400
1600Basis points
Morgan StanleyGoldman Sachs
Daily
CDS spreads for selected institutions
Source. Markit.
Sept.FOMC
Oct. 22
Jan. Apr. July Oct. Jan. Apr. July Oct.2007 2008
0
50
100
150
200
250
300
350
Basis points
Regional bank indexLarge bank index
Oct. 22
Daily
Senior CDS spreads for commercial banks
Note. Median spreads for 7 regional and 5 large commercial banks. Source. Markit.
Sept.FOMC
Jan. Mar. May June Aug. Oct.2008
10
30
50
70
90
110
130
150
170
Basis points
2-year10-year
Daily
Fannie Mae 2- and 10-year debt spreads
Note. Spreads over Treasuries of comparable maturity. Source. Bloomberg.
Sept.FOMC
Oct. 22
Jan. Apr. July Oct. Jan. Apr. July Oct.2007 2008
0
20
40
60
80
100
120
140
160
180
Basis points
Daily
CDS spreads for insurance companies*
*Median spreads for 58 insurance companies. Source. Markit.
Sept.FOMC
Oct. 22
Class I FOMC - Restricted Controlled (FR) 3 of 45
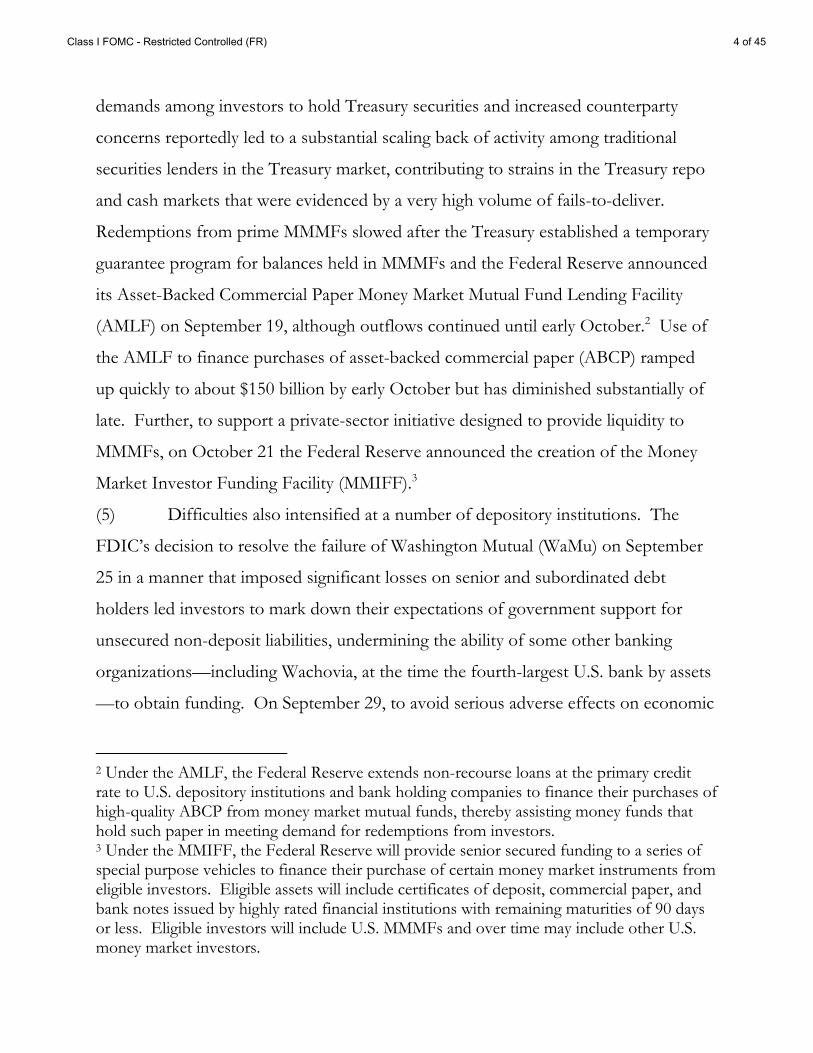
demands among investors to hold Treasury securities and increased counterparty
concerns reportedly led to a substantial scaling back of activity among traditional
securities lenders in the Treasury market, contributing to strains in the Treasury repo
and cash markets that were evidenced by a very high volume of fails-to-deliver.
Redemptions from prime MMMFs slowed after the Treasury established a temporary
guarantee program for balances held in MMMFs and the Federal Reserve announced
its Asset-Backed Commercial Paper Money Market Mutual Fund Lending Facility
(AMLF) on September 19, although outflows continued until early October.2 Use of
the AMLF to finance purchases of asset-backed commercial paper (ABCP) ramped
up quickly to about $150 billion by early October but has diminished substantially of
late. Further, to support a private-sector initiative designed to provide liquidity to
MMMFs, on October 21 the Federal Reserve announced the creation of the Money
Market Investor Funding Facility (MMIFF).3
(5) Difficulties also intensified at a number of depository institutions. The
FDIC’s decision to resolve the failure of Washington Mutual (WaMu) on September
25 in a manner that imposed significant losses on senior and subordinated debt
holders led investors to mark down their expectations of government support for
unsecured non-deposit liabilities, undermining the ability of some other banking
organizations—including Wachovia, at the time the fourth-largest U.S. bank by assets
—to obtain funding. On September 29, to avoid serious adverse effects on economic
2 Under the AMLF, the Federal Reserve extends non-recourse loans at the primary credit rate to U.S. depository institutions and bank holding companies to finance their purchases of high-quality ABCP from money market mutual funds, thereby assisting money funds that hold such paper in meeting demand for redemptions from investors. 3 Under the MMIFF, the Federal Reserve will provide senior secured funding to a series of special purpose vehicles to finance their purchase of certain money market instruments from eligible investors. Eligible assets will include certificates of deposit, commercial paper, and bank notes issued by highly rated financial institutions with remaining maturities of 90 days or less. Eligible investors will include U.S. MMMFs and over time may include other U.S. money market investors.
Class I FOMC - Restricted Controlled (FR) 4 of 45
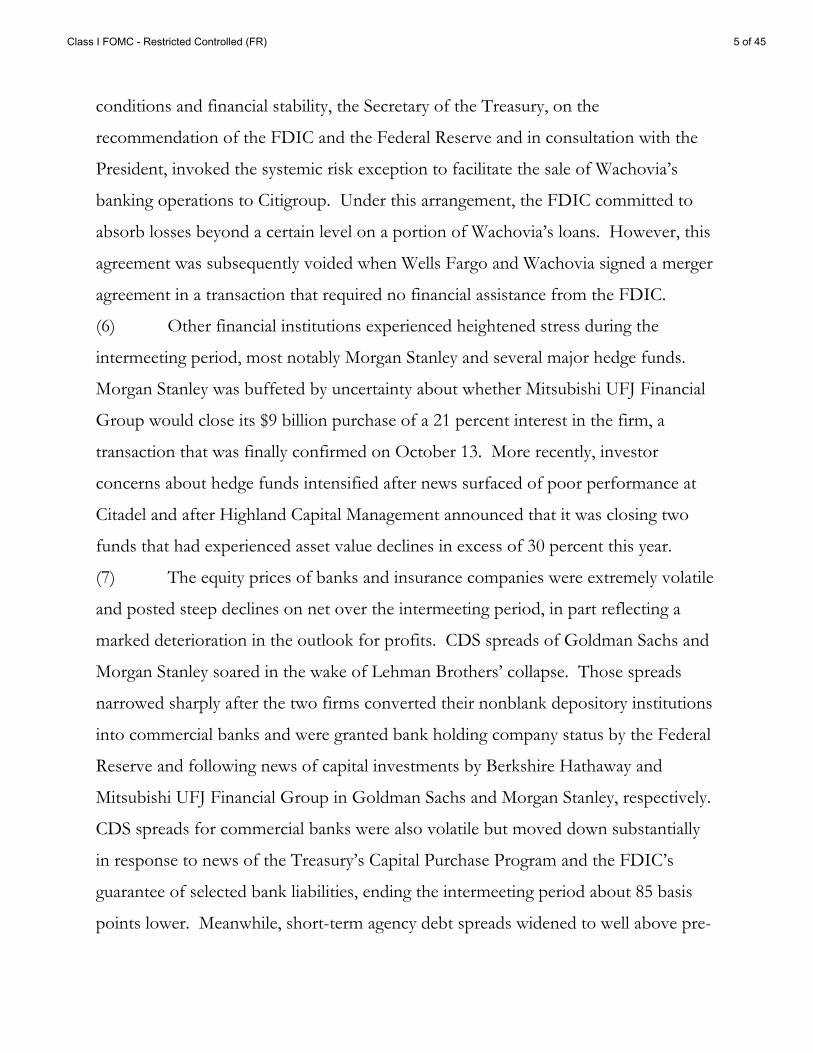
conditions and financial stability, the Secretary of the Treasury, on the
recommendation of the FDIC and the Federal Reserve and in consultation with the
President, invoked the systemic risk exception to facilitate the sale of Wachovia’s
banking operations to Citigroup. Under this arrangement, the FDIC committed to
absorb losses beyond a certain level on a portion of Wachovia’s loans. However, this
agreement was subsequently voided when Wells Fargo and Wachovia signed a merger
agreement in a transaction that required no financial assistance from the FDIC.
(6) Other financial institutions experienced heightened stress during the
intermeeting period, most notably Morgan Stanley and several major hedge funds.
Morgan Stanley was buffeted by uncertainty about whether Mitsubishi UFJ Financial
Group would close its $9 billion purchase of a 21 percent interest in the firm, a
transaction that was finally confirmed on October 13. More recently, investor
concerns about hedge funds intensified after news surfaced of poor performance at
Citadel and after Highland Capital Management announced that it was closing two
funds that had experienced asset value declines in excess of 30 percent this year.
(7) The equity prices of banks and insurance companies were extremely volatile
and posted steep declines on net over the intermeeting period, in part reflecting a
marked deterioration in the outlook for profits. CDS spreads of Goldman Sachs and
Morgan Stanley soared in the wake of Lehman Brothers’ collapse. Those spreads
narrowed sharply after the two firms converted their nonblank depository institutions
into commercial banks and were granted bank holding company status by the Federal
Reserve and following news of capital investments by Berkshire Hathaway and
Mitsubishi UFJ Financial Group in Goldman Sachs and Morgan Stanley, respectively.
CDS spreads for commercial banks were also volatile but moved down substantially
in response to news of the Treasury’s Capital Purchase Program and the FDIC’s
guarantee of selected bank liabilities, ending the intermeeting period about 85 basis
points lower. Meanwhile, short-term agency debt spreads widened to well above pre-
Class I FOMC - Restricted Controlled (FR) 5 of 45
conservatorship levels, reportedly because investors perceived the guarantee of agency
debt to be weaker than the FDIC’s guarantee of senior unsecured bank debt. In
addition, some market participants registered concerns that the credit quality of the
GSEs could be impaired if they were required to purchase large volumes of subprime
mortgage assets. CDS spreads for insurance companies also surged over the
intermeeting period.
Market Functioning
(8) Short-term funding markets came under considerable stress amid
heightened concerns about counterparty credit risk. Conditions in unsecured
interbank funding markets worsened, with spreads of Libor over comparable-maturity
overnight index swap (OIS) rates rising to unprecedented levels and with very little
trading taking place at terms beyond overnight (Chart 2). Strains increased even in
overnight funding markets, as overnight Libor rose to about 340 basis points above
the federal funds rate target in early October and overnight federal funds traded
within an unusually wide range, partly reflecting tiering across institutions. Conditions
in very short-term funding markets improved significantly after the European Central
Bank (ECB), the Bank of England (BoE), and the Swiss National Bank (SNB)
initiated a series of unlimited fixed-rate dollar auctions, and governments in a number
of countries, including the United States, announced plans to inject capital into
banking institutions and to guarantee some bank liabilities. Libor fixings declined
about 415, 230, and 100 basis points for overnight, one-week, and one-month
maturities, respectively, starting on October 9. Conditions in markets for unsecured
funding for longer terms also improved, but trading reportedly remains very sparse.
(9) Conditions in secured funding markets were also quite poor. The overnight
general collateral repo rate and short-dated Treasury bill yields traded near zero for
most of the period amid heavy demand for safe investments. Those low rates
Class I FOMC - Restricted Controlled (FR) 6 of 45
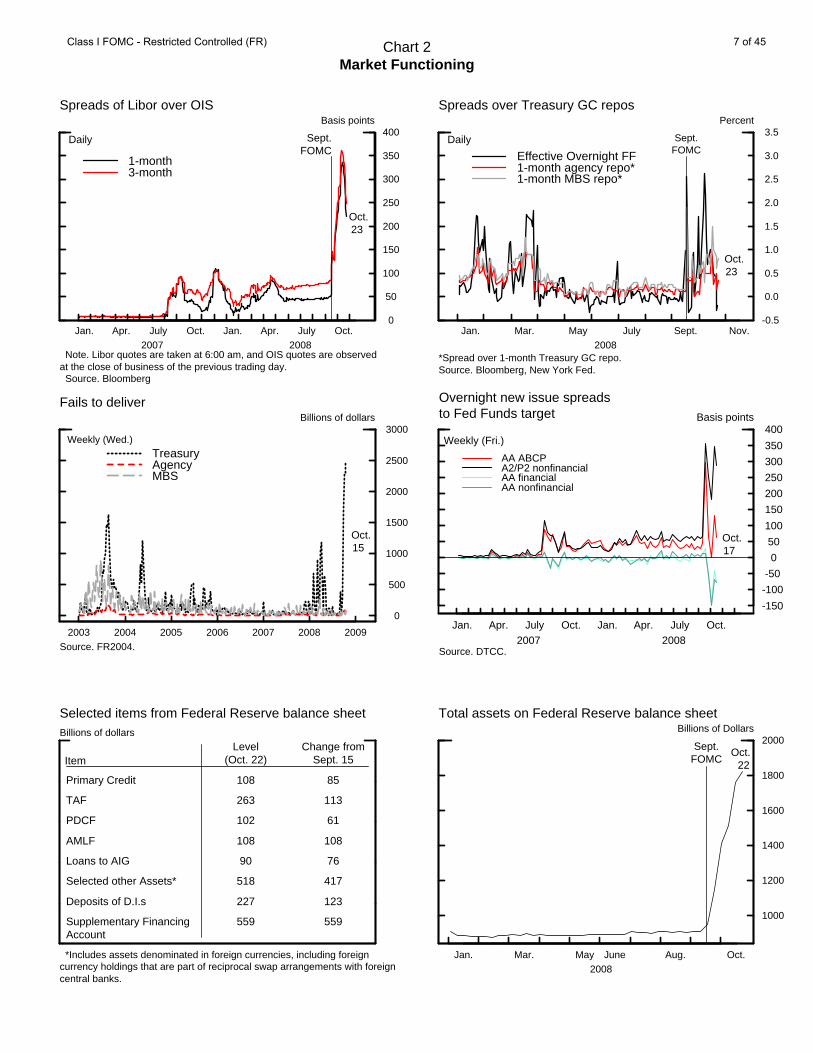
Chart 2Market Functioning
Jan. Apr. July Oct. Jan. Apr. July Oct.2007 2008
0
50
100
150
200
250
300
350
400Basis points
1-month3-month
Note. Libor quotes are taken at 6:00 am, and OIS quotes are observedat the close of business of the previous trading day. Source. Bloomberg
Spreads of Libor over OIS
Daily Sept.FOMC
Oct. 23
Jan. Mar. May July Sept. Nov.2008
-0.5
0.0
0.5
1.0
1.5
2.0
2.5
3.0
3.5Percent
Effective Overnight FF1-month agency repo*1-month MBS repo*
Sept.FOMC
Spreads over Treasury GC repos
Daily
*Spread over 1-month Treasury GC repo.Source. Bloomberg, New York Fed.
Oct. 23
2003 2004 2005 2006 2007 2008 2009
0
500
1000
1500
2000
2500
3000Billions of dollars
TreasuryAgencyMBS
Fails to deliver
Weekly (Wed.)
Source. FR2004.
Oct. 15
Jan. Apr. July Oct. Jan. Apr. July Oct.2007 2008
-150
-100
-50
0
50
100
150
200
250
300
350
400Basis points
AA ABCPA2/P2 nonfinancialAA financialAA nonfinancial
Oct. 17
Weekly (Fri.)
Overnight new issue spreadsto Fed Funds target
Source. DTCC.
Level(Oct. 22)
Change fromSept. 15
Primary Credit 108 85
TAF 263 113
PDCF 102 61
AMLF 108 108
Loans to AIG 90 76
Selected other Assets* 518 417
Deposits of D.I.s 227 123
Supplementary FinancingAccount
559 559
Item
Selected items from Federal Reserve balance sheetBillions of dollars
*Includes assets denominated in foreign currencies, including foreigncurrency holdings that are part of reciprocal swap arrangements with foreigncentral banks.
Jan. Mar. May June Aug. Oct.2008
1000
1200
1400
1600
1800
2000Billions of Dollars
Total assets on Federal Reserve balance sheet
Sept.FOMC
Oct. 22
Class I FOMC - Restricted Controlled (FR) 7 of 45
occurred despite issuance by the Treasury of over $500 billion in new bills under the
Supplementary Financing Program (SFP). Overnight lending of securities from the
System Open Market Account (SOMA) portfolio and fails-to-deliver soared to record
highs. To address strains in the Treasury market, the Federal Reserve introduced
temporary changes in its securities lending program, including a reduction in the fee
structure and an increase in per-dealer borrowing limits. In addition, the Treasury
increased its issuance by reopening several notes that were experiencing severe
demand imbalances in the market. These measures, however, had only a modest
effect on Treasury market trading conditions. Heightened strains were also evident in
the markets for repo transactions backed by collateral other than Treasury securities.
Rates on agency mortgage-backed security (MBS) repos were especially volatile, and
haircuts applied to a wide range of repo collateral reportedly increased over the past
few weeks from already elevated levels. Trading in these non-Treasury repo markets
remained essentially confined to overnight maturities.
(10) Conditions in the commercial paper (CP) market continued to be strained,
as net redemptions of shares in prime MMMFs and concerns among money managers
about credit quality and liquidity cut into the demand for CP, making issuance
difficult. As a result, spreads of ABCP and lower-rated CP rates to the target federal
funds rate widened sharply, and amounts outstanding in the financial sector continued
to trend down. In response to these developments, the Federal Reserve announced
the establishment of the AMLF, the Commercial Paper Funding Facility (CPFF), and
the MMIFF.4 Reportedly, some improvements in CP market functioning started to
4 On October 7, the Federal Reserve authorized the creation of the CPFF to provide a liquidity backstop to U.S. issuers of commercial paper through a special purpose vehicle (SPV) that will purchase three-month unsecured and asset-backed CP from eligible issuers through the primary dealers. The Federal Reserve will provide overnight financing to the SPV under the CPFF at the target federal funds rate and will be secured by all of the assets of the SPV. The Federal Reserve will also be secured by any excess spread and fees that
Class I FOMC - Restricted Controlled (FR) 8 of 45
surface in recent days, perhaps because investors gained comfort from the FDIC
guarantee of some CP issued by banking organizations and also from the
announcement of details of the CPFF, which will become operational on October 27.
(11) The functioning of the CDS market remained far from normal. Judging
from the wide range and declining frequency of dealer quotes, both liquidity and price
discovery was impaired over recent weeks, especially for contracts involving financial
firms. The bankruptcy of Lehman Brothers created another significant credit event in
the CDS market and added to stress generated by the placement of Fannie Mae and
Freddie Mac into conservatorship. Nonetheless, auctions held to determine the
settlement prices for CDS contracts written on the two GSEs and on Lehman
Brothers, which were conducted on October 6 and October 10, respectively, were
successful in facilitating the settlement of a significant number of credit derivative
trades on these institutions. The functioning of longer-term corporate debt markets
also deteriorated over the intermeeting period. Staff estimates of bid-asked spreads in
the bond market rose sharply, and in the secondary market for leveraged syndicated
loans, the average bid-asked spread surged nearly 200 basis points to an
unprecedented level of 373 basis points in mid-October.
(12) Depository institutions’ use of the primary credit facility was elevated over
the intermeeting period, with primary credit outstanding totaling $108 billion as of
October 22. The 28-day Term Auction Facility (TAF) auction held on September 22
was heavily bid, with a stop-out rate of 3.75 percent, more than 50 basis points above
one-month Libor. The first 84-day TAF auction that offered $150 billion was
announced and conducted on October 6; the auction was undersubscribed and
stopped out at the minimum bid rate of 1.39 percent, perhaps because banks did not
have sufficient time to post additional collateral ahead of the auction. The 28-day
accumulate in the SPV. Additional details regarding the CPFF were provided on October 14.
Class I FOMC - Restricted Controlled (FR) 9 of 45
TAF auction held on October 20, however, also was not fully subscribed and stopped
out at the minimum bid rate.5 The ten Term Securities Lending Facility (TSLF)
auctions conducted over the intermeeting period—three for Schedule 1 and seven for
Schedule 2 collateral—saw very high demand and stop-out rates that were well above
the corresponding minimum fee rates. Dealers mentioned challenging repo market
conditions and elevated spreads in collateralized markets as possible explanations for
the strong participation. On September 24, dealers exercised about $47 billion of the
nearly $50 billion of TOP options for TSLF loans spanning the September quarter-
end. The use of the Primary Dealer Credit Facility (PDCF) also surged over the
intermeeting period, and PDCF outstandings were $102 billion as of October 22—
nearly three times the level observed in March and April in the wake of the Bear
Stearns collapse. As of October 22, credit extensions under the AMLF totaled $108
billion, but little new net credit has been extended since October 1. Credit
outstanding to AIG stands at about $90 billion. All told, the sharp increase in
liquidity provision had a marked impact on the size and the composition of the
Federal Reserve balance sheet.
(13) Beginning with the reserve maintenance periods starting October 9, the
Federal Reserve has paid interest on required reserve and excess balances.
Nevertheless, partly because of the extremely high provision of liquidity through the
Federal Reserve’s liquidity facilities, the effective federal funds rate has been well
below the FOMC’s target, with a substantial amount of trading at rates below the
5 On October 6, the Federal Reserve boosted the sizes of both the 28-day and 84-day TAF auctions to $150 billion each. These increases will eventually bring the maximum amount outstanding under the regular TAF program to $600 billion. In addition, the sizes of the two forward TAF auctions—announced on September 29 and scheduled to be conducted in November to extend credit over year-end—were increased to $150 billion each, so that a maximum of $900 billion of TAF credit will potentially be outstanding over year-end.
Class I FOMC - Restricted Controlled (FR) 10 of 45
interest rate paid on excess balances.6 However, federal funds futures rates rose
following the announcement on October 22 that the Federal Reserve had increased
the rate it would pay on excess balances beginning the following day.7 (See the box
“Early Experience with Interest on Reserves.”)
Monetary Policy Expectations and Treasury Yields
(14) The intensification of the financial turmoil, the further impairment of the
functioning of funding markets, and a much weaker economic outlook led investors
to revise down their expected path for the federal funds rate in the near term and to
place considerable odds on at least a 25 basis point rate cut at the October 28-29
FOMC meeting (Chart 3). The FOMC’s decision to leave its policy rate unchanged
at 2 percent at the September meeting took some market participants by surprise and
led them to scale back their expectations of policy easing over the next year.
However, policy expectations shifted down in response to the 50 basis point
intermeeting cut by the FOMC in coordination with other foreign central banks on
October 8, as market participants were reportedly somewhat surprised by the decision
and interpreted the language of the accompanying statement as suggesting that further
easing was likely. The reaction to both policy actions was soon overshadowed,
however, by market concerns about the financial sector and the economic outlook.
(15) Options on federal funds futures suggest that investors currently place high
odds on the FOMC lowering the federal funds target at the October 28-29 meeting,
6 The effective federal funds rate averaged 1.28 percent over the intermeeting period. The intraday standard deviation of the funds rate, at about 75 basis points, was extremely elevated by historical standards and more than double the level observed in March. Over this intermeeting period, the volume of long-term repurchase agreements declined $10 billion, and on September 18 the Desk redeemed the full amount of maturing Treasury bill holdings, $3.3 billion, to draw reserve from the banking system. 7 Previously the rate on excess balances had been set at the lowest federal funds rate target established by the FOMC during the reserve maintenance period minus 75 basis points. Under the revised rule the rate will be set to the lowest target rate minus 35 basis points.
Class I FOMC - Restricted Controlled (FR) 11 of 45
Early Experience with Interest on Reserves The Emergency Economic Stabilization Act accelerated the Federal Reserve’s authority to pay interest on balances held by or on behalf of depository institutions at Reserve Banks. This interest began accruing on October 9. The payment of interest on excess balances should reduce depository institutions’ incentives to sell federal funds at rates below the rate paid on excess. To date, the results of this policy change have been mixed, although some evidence suggests that interest on reserves might become a more effective tool over time. The rate paid on excess balances has not established a hard floor to the federal funds rate. Initially, this rate was set equal to the lowest targeted federal funds rate for the maintenance period less 75 basis points, resulting in a rate of 75 basis points. From October 9 to October 22, an average of 35 percent of brokered federal funds trades transacted at rates below 75 basis points. However, the share of brokered trades at rates near zero has declined substantially. Fannie Mae and Freddie Mac, two large net sellers of funds in the market, are not eligible to receive interest on the balances they hold and are reportedly selling funds at rates below 75 basis points. In addition, some small depository institutions have also been selling funds at rates below 75 basis points. Some of these institutions may believe that their correspondent banks will not pass on interest earned on excess balances and thus are willing to sell federal funds at rates below the rate paid on excess balances. To foster trading at rates closer to the target rate, the Board narrowed the spread between the target federal funds rate and the rate paid on excess balances to 35 basis points effective October 23. Market participants may still be adapting to the new system. In principle, arbitrage should keep market rates close to the rate paid on excess balances if enough institutions that are eligible to receive interest were to bid for the funds of ineligible institutions. Indeed, a couple of large banks are apparently doing so now and in some volume, and this pattern may strengthen over time. In addition, correspondent banking agreements may be restructured in light of the payment of interest to respondent banks. Some respondent institutions are reportedly considering terminating their correspondent relationships and holding balances directly with the Reserve Banks. One potentially related development is a significant decline in the volume of brokered transactions in the federal funds market. With the extraordinary level of balances in the system, and the ability to earn significant interest on an essentially risk-free asset, the incentive for institutions to trade in the overnight market may have diminished.
Class I FOMC - Restricted Controlled (FR) 12 of 45
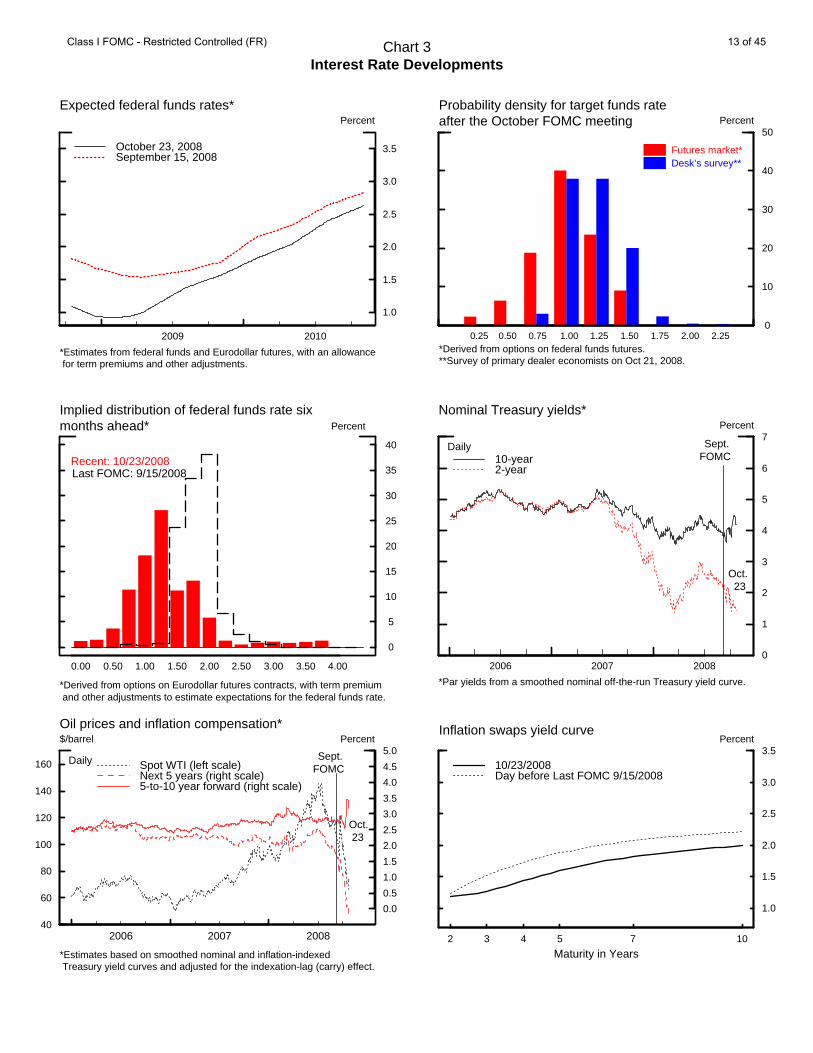
Chart 3Interest Rate Developments
2009 2010
1.0
1.5
2.0
2.5
3.0
3.5
Percent
October 23, 2008September 15, 2008
Expected federal funds rates*
*Estimates from federal funds and Eurodollar futures, with an allowance for term premiums and other adjustments.
0
10
20
30
40
50Percent
Futures market* Desk’s survey**
0.25 0.50 0.75 1.00 1.25 1.50 1.75 2.00 2.25
Probability density for target funds rateafter the October FOMC meeting
*Derived from options on federal funds futures.**Survey of primary dealer economists on Oct 21, 2008.
Implied distribution of federal funds rate six months ahead*
0.00 0.50 1.00 1.50 2.00 2.50 3.00 3.50 4.00
Recent: 10/23/2008Last FOMC: 9/15/2008
0
5
10
15
20
25
30
35
40
Percent
*Derived from options on Eurodollar futures contracts, with term premium and other adjustments to estimate expectations for the federal funds rate.
2006 2007 20080
1
2
3
4
5
6
7Percent
10-year2-year
Nominal Treasury yields*
Daily
*Par yields from a smoothed nominal off-the-run Treasury yield curve.
Sept.FOMC
Oct. 23
40
60
80
100
120
140
160
2006 2007 2008
0.0
0.5
1.0
1.5
2.0
2.5
3.0
3.5
4.0
4.5
5.0$/barrel Percent
Spot WTI (left scale)Next 5 years (right scale)5-to-10 year forward (right scale)
Oil prices and inflation compensation*
Daily
*Estimates based on smoothed nominal and inflation-indexed Treasury yield curves and adjusted for the indexation-lag (carry) effect.
Sept.FOMC
Oct. 23
2 3 4 5 7 10
1.0
1.5
2.0
2.5
3.0
3.5Percent
10/23/2008Day before Last FOMC 9/15/2008
Inflation swaps yield curve
Maturity in Years
Class I FOMC - Restricted Controlled (FR) 13 of 45
assigning odds of roughly 25, 40, and 20 percent, respectively to a 25, 50, and 75 basis
point rate cut, and about 10 percent odds to no change in the policy rate. However,
these probabilities may be distorted to some extent by expectations that the effective
funds rate will continue to trade below the target for a while. Responses to the Desk’s
primary dealer survey on October 20—which were not affected by this factor
although they may now be somewhat stale—indicate that dealers place 38 percent
probabilities on a 25 and 50 basis point rate cut, a 3 percent probability on a 75 basis
point rate cut, and a 20 percent probability on no change. Further ahead, futures
quotes suggest that investors expect the FOMC to begin tightening by the spring of
2009, with the federal funds rate returning to a level of about 1.5 percent by the end
of 2009 and 2.75 percent by the end of 2010. However, these estimates may also be
distorted; term premiums resulting from heightened market volatility and poor
functioning in other financial markets may be substantially higher than currently
assumed by the staff, which would imply a lower long-term trajectory for the expected
funds rate. Uncertainty about the federal funds rate six months ahead increased over
the intermeeting period, as indicated by the widening of the option-implied
probability distribution at this horizon.
(16) Two-year nominal Treasury yields declined 36 basis points on net over the
intermeeting period amid heavy safe-haven demand and in response to the downward
shift in policy expectations and the economic outlook. In contrast, ten-year nominal
yields rose 50 basis points, likely reflecting expectations for increased Treasury
issuance to finance federal government asset purchases and other activities, and
perhaps also increased uncertainty about the future course of interest rates, which may
have boosted term premiums. Standard measures of inflation compensation based on
differences between nominal and inflation-indexed Treasury yields were extremely
volatile over the intermeeting period. On net, inflation compensation over the next
five years fell about 147 basis points, while it rose 41 basis points five to ten years
Class I FOMC - Restricted Controlled (FR) 14 of 45
ahead. Inferences about inflation expectations from these figures should be made
cautiously, however, as market yields were likely heavily affected by large increases in
liquidity premiums in TIPS yields and by supply effects on nominal Treasury yields.
Measures of inflation compensation obtained from inflation swaps, by contrast,
posted modest declines across the term structure and appeared more consistent with
the mixed changes in inflation expectations in the Reuters/Michigan survey and the
roughly $25 per barrel decrease in the price of crude oil over the intermeeting period.
In addition, respondents to the Desk’s survey expect a lower rate of CPI inflation
from five to ten years ahead.
Capital Markets
(17) As the financial turmoil intensified and the economic outlook deteriorated
over the intermeeting period, broad equity price indexes dropped substantially on net
amid very high volatility (Chart 4). Stock price declines were widespread across
sectors. Financial firms notably underperformed for most of the period, although
they recently moved back more closely in line with broad indexes. With the earnings
reporting season just getting under way, analysts currently expect earnings per share
for the S&P 500 to be about 3 percent lower than year-ago levels, pulled down mostly
by decreases at financial firms. For the roughly 75 percent of publicly traded banking
organizations that have reported earnings to date (excluding three financial
institutions that will be acquired in the near term—Merrill Lynch, Wachovia, and
Sovereign), third-quarter earnings were slightly negative. Weak third-quarter results
were attributed to write-downs on security holdings and to continued loan loss
provisioning to offset increased credit losses on a variety of loans. In contrast,
earnings at nonfinancial firms are expected to come in about 12 percent above year-
ago levels, with gains largely accounted for by the oil and gas sectors. Looking ahead,
analysts marked down their projections for earnings over the coming year significantly
Class I FOMC - Restricted Controlled (FR) 15 of 45
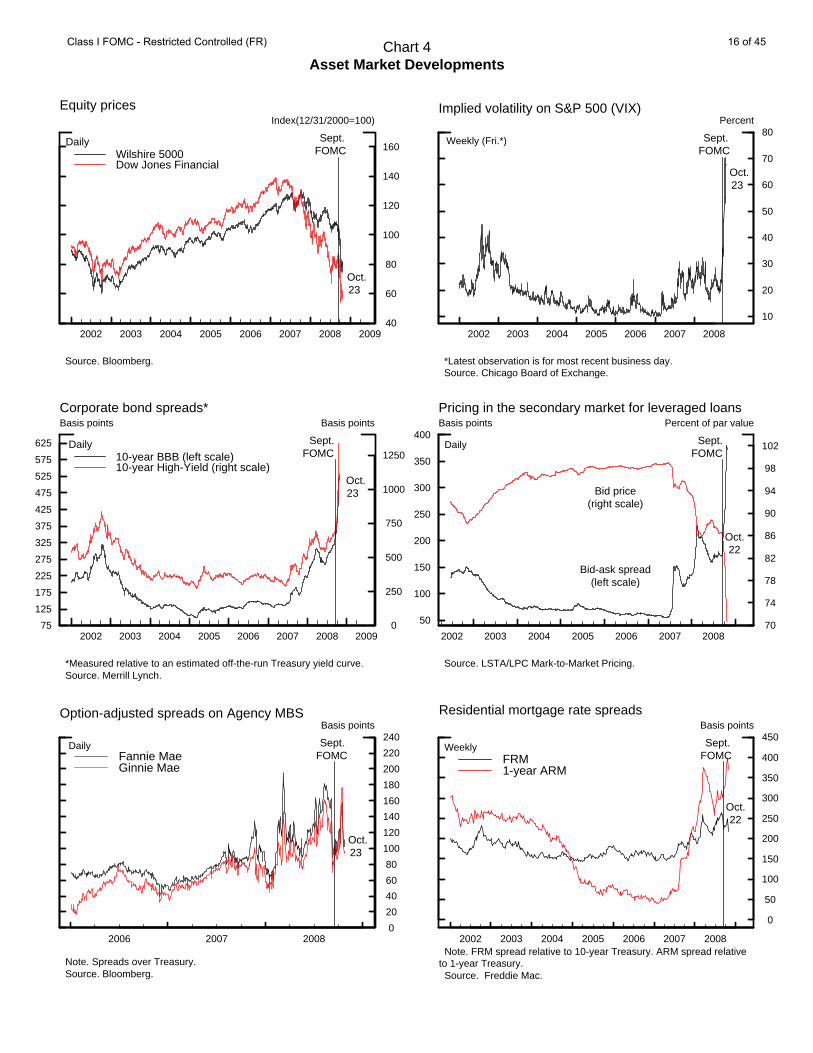
Chart 4Asset Market Developments
2002 2003 2004 2005 2006 2007 2008 2009 40
60
80
100
120
140
160
Index(12/31/2000=100)
Wilshire 5000Dow Jones Financial
Equity prices
Daily
Source. Bloomberg.
Sept.FOMC
Oct. 23
2002 2003 2004 2005 2006 2007 2008
10
20
30
40
50
60
70
80Percent
Implied volatility on S&P 500 (VIX)
Weekly (Fri.*)
*Latest observation is for most recent business day. Source. Chicago Board of Exchange.
Sept.FOMC
Oct. 23
75
125
175
225
275
325
375
425
475
525
575
625
2002 2003 2004 2005 2006 2007 2008 2009 0
250
500
750
1000
1250
Basis points Basis points
10-year BBB (left scale)10-year High-Yield (right scale)
Corporate bond spreads*
Daily
*Measured relative to an estimated off-the-run Treasury yield curve. Source. Merrill Lynch.
Sept.FOMC
Oct. 23
50
100
150
200
250
300
350
400
2002 2003 2004 2005 2006 2007 2008 70
74
78
82
86
90
94
98
102
Basis points Percent of par value
Daily
Source. LSTA/LPC Mark-to-Market Pricing.
Pricing in the secondary market for leveraged loans
Sept.FOMC
Bid price(right scale)
Bid-ask spread(left scale)
Oct. 22
2006 2007 2008 0
20
40
60
80
100
120
140
160
180
200
220
240Basis points
Fannie MaeGinnie Mae
Option-adjusted spreads on Agency MBS
Daily
Note. Spreads over Treasury. Source. Bloomberg.
Sept.FOMC
Oct. 23
2002 2003 2004 2005 2006 2007 2008
0
50
100
150
200
250
300
350
400
450Basis points
FRM1-year ARM
Residential mortgage rate spreads
Weekly
Note. FRM spread relative to 10-year Treasury. ARM spread relativeto 1-year Treasury. Source. Freddie Mac.
Sept.FOMC
Oct. 22
Class I FOMC - Restricted Controlled (FR) 16 of 45
for both financial and nonfinancial firms. Option-implied volatility on the S&P 500
surged to a record level, well above its previous high in 1998, and the spread between
the twelve-month forward trend earnings-price ratio for S&P 500 firms and the real
long-term Treasury yield—a rough gauge of the equity premium—reached the highest
level since the start of the series in 1982.
(18) Conditions in corporate debt markets tightened further over the
intermeeting period. Risk spreads on investment- and speculative-grade bonds soared
to historically high levels. The increases appeared to reflect upward revisions to
expected losses as well as a further widening of already elevated risk premiums. Gross
bond issuance by investment-grade nonfinancial firms has been moderate, and
issuance of speculative-grade bonds has been nil. Conditions in the leveraged
syndicated loan market also deteriorated sharply over the period. In particular, the
secondary market average bid price plunged an unprecedented 15 points, to nearly 70,
reportedly due to heavy sales by hedge funds and unwinds of total return swaps and
market-value collateralized loan obligations. The implied spread on an index of loan
credit default swaps (the LCDX) almost doubled, on net, to about 800 basis points
over the period. Finally, hedge fund performance continued to deteriorate over the
past few weeks, with the Global Hedge Fund Index tumbling more than 10 percent.
(19) The interest rate on 30-year fixed-rate conforming mortgages increased, on
net, about 50 basis points to almost 6.5 percent in mid-October. The mortgage rate
had nearly returned to the very elevated levels seen just before Fannie Mae and
Freddie Mac were taken into conservatorship in early September, but has reversed
most of that rise over the past week. MBS spreads were extremely volatile amid
reportedly poor trading conditions. Meanwhile, interest rates on nonconforming
jumbo mortgages remained extremely high. Delinquency rates for prime and
subprime mortgages increased further. Issuance of Fannie Mae and Freddie Mac
MBS in September increased slightly but remained below the pace seen in the first
Class I FOMC - Restricted Controlled (FR) 17 of 45
half of the year, while issuance by Ginnie Mae has stayed elevated; the Federal
Reserve purchased $14.5 billion in agency discount notes over the intermeeting
period. Issuance of asset-backed securities (ABS) collateralized by consumer credit
declined notably in the third quarter, at least partly as a result of historically high
spreads.
(20) Conditions in the municipal bond market deteriorated substantially in recent
weeks, although there appears to have been some improvement recently. Variable-
rate demand notes and tender option bonds reportedly were put back to liquidity
providers, who in turn sold the underlying long-term bonds in the secondary market,
putting pressure on prices and market functioning. Amid the resulting unfavorable
climate, issuance of longer-term municipal bonds slowed markedly in September and
early October. The credit quality of municipal bonds also deteriorated in the third
quarter, and the number of downgrades far outpaced the number of upgrades. Yield
ratios on municipal bonds spiked to record levels, although the short-term ratio
retraced somewhat in the last few days of the period.
Foreign Developments
(21) The unfolding financial crisis affected financial markets across the globe
over the intermeeting period, intensifying in Europe and spreading to markets in the
emerging market economies as well. Spreads over OIS rates of term sterling and term
euro rates rose sharply from their already elevated levels following the collapse of
Lehman Brothers and difficulties at AIG, although the increase was less pronounced
than in comparable dollar markets. To address the growing global strain in dollar
funding markets, the Federal Reserve progressively increased the sizes of its reciprocal
currency swap lines with foreign central banks and boosted the number of central
bank counterparties (Australia, Japan, Canada, United Kingdom, Sweden, Norway,
and Denmark were added). Late in the period, in connection with these swap
Class I FOMC - Restricted Controlled (FR) 18 of 45
arrangements, the European Central Bank, the Bank of England, the Swiss National
Bank, and the Bank of Japan began to conduct auctions of dollar liquidity with 7-day,
28-day, and 84-day maturities at pre-announced fixed interest rates, with funding
being made available to fully meet the quantities demanded by borrowers in
possession of eligible collateral. Additionally, the Swiss National Bank announced
plans to draw on its swap line to help finance up to $60 billion in purchases of assets
from a major Swiss bank.
(22) In early October, amid declines in confidence and increasingly constricted
access to funding, several high-profile banks in Europe were on the verge of failure,
prompting nationalizations and capital injections by their respective governments. A
pullback from risk in virtually all advanced and emerging market economies had
induced plunges in stock prices, sharp swings in exchange rates, large increases in risk
spreads, and an almost complete seizing-up of credit markets (Chart 5). Subsequently,
authorities in many foreign industrial countries, as well as in the United States,
announced a series of measures of unprecedented scale and scope designed to support
the banking system and restore the functioning of credit markets. Since these
announcements, conditions in short-term funding markets, as evidenced by Libor to
OIS spreads, have improved somewhat. Equity prices initially moved up in most
markets, but they continued to swing wildly thereafter as investors focused on the
risks of global recession. On net, over the intermeeting period, equity indexes in most
advanced and developing countries declined 20 percent or more. Interest rates on
sovereign bonds in industrial countries exhibited substantial volatility, and nominal
yield curves steepened as two-year yields declined while ten-year yields were mixed.
In developing countries, sovereign credit spreads rose sharply, leading several
countries to postpone scheduled sales of debt.
(23) The major currencies index of the dollar rose sharply over the period,
increasing 9 percent on net, as the dollar appeared to benefit from the global decrease
Class I FOMC - Restricted Controlled (FR) 19 of 45
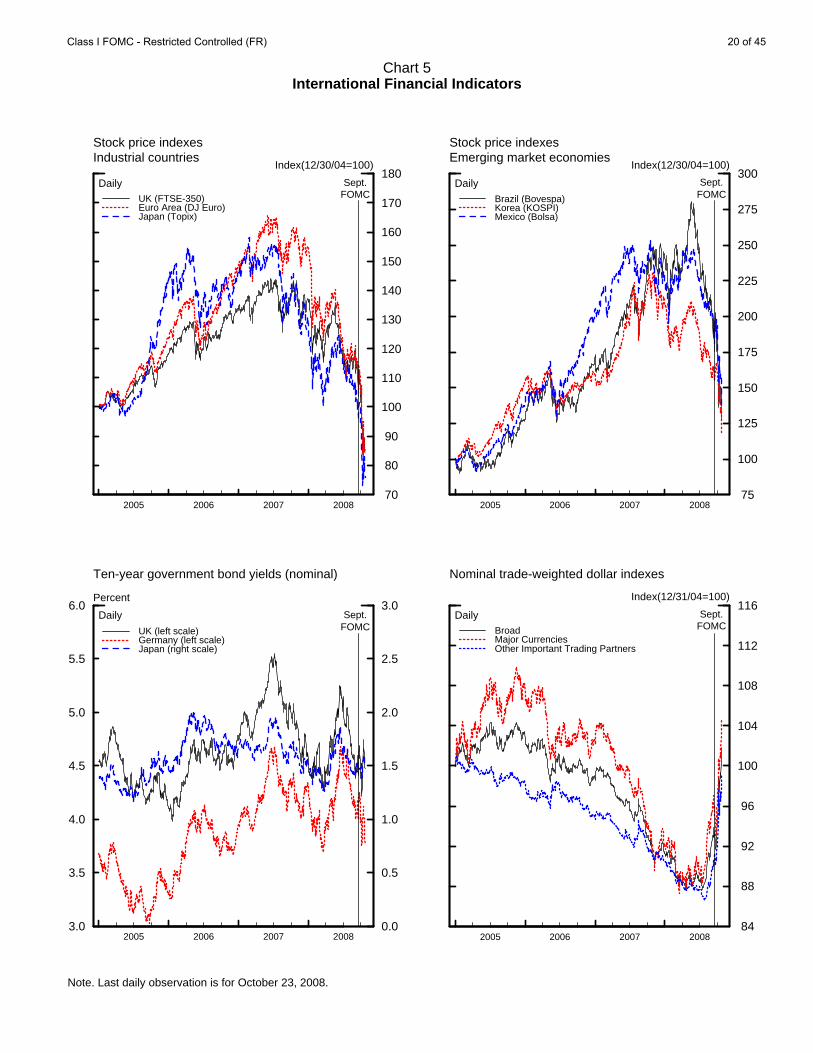
Chart 5International Financial Indicators
Note. Last daily observation is for October 23, 2008.
2005 2006 2007 2008 70
80
90
100
110
120
130
140
150
160
170
180
UK (FTSE-350)Euro Area (DJ Euro)Japan (Topix)
Stock price indexesIndustrial countries
Daily
Index(12/30/04=100)
Sept.FOMC
2005 2006 2007 2008 75
100
125
150
175
200
225
250
275
300
Brazil (Bovespa)Korea (KOSPI)Mexico (Bolsa)
Stock price indexesEmerging market economies
Daily
Index(12/30/04=100)
Sept.FOMC
3.0
3.5
4.0
4.5
5.0
5.5
6.0
2005 2006 2007 20080.0
0.5
1.0
1.5
2.0
2.5
3.0
UK (left scale)Germany (left scale)Japan (right scale)
Ten-year government bond yields (nominal)
Daily
Percent
Sept.FOMC
2005 2006 2007 2008 84
88
92
96
100
104
108
112
116
BroadMajor CurrenciesOther Important Trading Partners
Nominal trade-weighted dollar indexes
Daily
Index(12/31/04=100)
Sept.FOMC
Class I FOMC - Restricted Controlled (FR) 20 of 45
in risk appetite. An exception was the dollar’s 7 percent depreciation versus the yen,
which apparently reflected a rapid unwinding of yen carry-trade positions. Implied
volatilities in most currency pairs rose to multi-year highs, making hedging currency
risk far more costly. The dollar appreciated 9 percent against the currencies of our
other important trading partners over the period. Most notably, the dollar rose about
25 percent against the Brazilian real and the Mexican peso, and 21 percent versus the
Korean won, despite reports of heavy intervention sales of dollars by the monetary
authorities of these countries. The dollar’s especially sharp increase against the
currencies of emerging market economies likely reflected investors’ pulling back from
risk, although in some cases sharp declines in commodity prices likely also contributed
to the weakening of those currencies.
Debt and Money
(24) The debt of domestic nonfinancial sectors is projected to have expanded at
a 9 percent annual rate in the third quarter, almost twice as fast as the average pace in
the first half of the year and 5 percentage points greater than the pace reported in the
previous Bluebook (Chart 6). The pickup was attributable almost entirely to increased
borrowing by the federal government related to the Supplemental Financing Program
and the TARP. In contrast, the rate of debt growth in the business and household
sectors is estimated to have slowed. As already noted, in the nonfinancial business
sector, investment-grade bond issuance was moderate and speculative-grade bond
issuance was nil, perhaps due to extremely high interest rates and risk spreads. By
contrast, commercial paper outstanding rose despite the extremely impaired market
conditions. In the leveraged loan market, institutional issuance reportedly continued
to be very weak. Household debt continued to slow as falling house prices weighed
on mortgage borrowing and the weakness in consumption spending trimmed
consumer credit growth.
Class I FOMC - Restricted Controlled (FR) 21 of 45
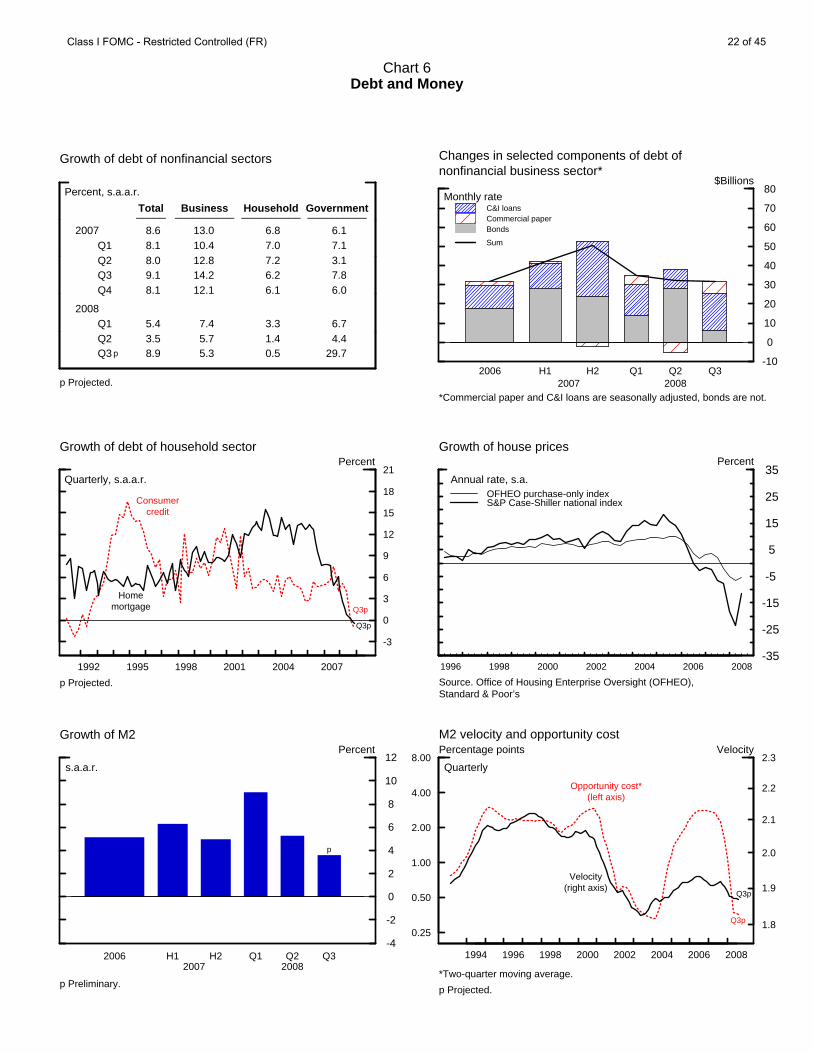
Chart 6Debt and Money
Growth of debt of nonfinancial sectors
Percent, s.a.a.r.
2007
2008
Q1Q2Q3Q4
Q1Q2Q3 p
Total_____
8.68.18.09.18.1
5.43.58.9
Business__________
13.010.412.814.212.1
7.45.75.3
Household__________
6.87.07.26.26.1
3.31.40.5
Government__________
6.17.13.17.86.0
6.74.4
29.7
p Projected.
-10
0
10
20
30
40
50
60
70
80
C&I loansCommercial paperBonds
Sum
Changes in selected components of debt ofnonfinancial business sector*
$Billions
2006 H1 H2 Q1 Q2 Q32007 2008
Monthly rate
*Commercial paper and C&I loans are seasonally adjusted, bonds are not.
1992 1995 1998 2001 2004 2007
-3
0
3
6
9
12
15
18
21
Growth of debt of household sectorPercent
Quarterly, s.a.a.r.
p Projected.
Q3p
Q3p
Consumercredit
Homemortgage
1996 1998 2000 2002 2004 2006 2008-35
-25
-15
-5
5
15
25
35
OFHEO purchase-only indexS&P Case-Shiller national index
Growth of house prices
Annual rate, s.a.
Percent
Source. Office of Housing Enterprise Oversight (OFHEO),Standard & Poor’s
-4
-2
0
2
4
6
8
10
12
Growth of M2
s.a.a.r.
Percent
p
2006 H1 H2 Q1 Q2 Q32007 2008
p Preliminary.
0.25
0.50
1.00
2.00
4.00
8.00
1994 1996 1998 2000 2002 2004 2006 2008
1.8
1.9
2.0
2.1
2.2
2.3
M2 velocity and opportunity costVelocityPercentage points
Quarterly
Opportunity cost*(left axis)
Velocity(right axis)
p Projected.
*Two-quarter moving average.
Q3p
Q3p
Class I FOMC - Restricted Controlled (FR) 22 of 45
(25) Commercial bank credit surged in mid-September, boosted by increases in
“other loans,” banks’ holdings of securities, and commercial and industrial (C&I)
loans. The “other loans” category saw a marked increase in unplanned overdrafts by
a wide range of customers, including money fund complexes, as well as draws on lines
of credit by financial firms, consistent with the stress in funding markets. Commercial
banks’ acquisition of a large volume of non-agency and non-Treasury securities likely
reflected in part purchases of CP stimulated by the AMLF program. The increase in
C&I loans was reportedly due mostly to draw downs on pre-existing lines of credit;
however, some respondents to the Senior Loan Officer Opinion Survey indicated that
they had also increased loans not made under previous commitment. Very large
fractions of the surveyed banks reported having tightened terms and standards on a
broad range of loan types for both businesses and households.
(26) M2 expanded at a rapid 15½ percent annual rate in September and is
estimated to have accelerated further to a 17 percent pace in October. Liquid
deposits surged in September reflecting, in part, robust expansions in the deposits of
broker-dealers, trusts, and corporate customers at a few large banks. Small time
deposits increased sharply in September and are set to post dramatic gains in October,
as banks and thrifts reportedly continued to bid aggressively for these deposits. By
contrast, liquid deposits slowed almost to a halt this month. Retail money funds were
about flat in September but appear to be expanding briskly in October. Currency
growth picked up in September and has risen further in October, apparently reflecting
increased domestic and foreign demand. Overall, money growth may be being
boosted by some reallocation of household assets toward safer instruments; stock and
bond mutual funds, for example, have registered substantial runoffs over recent
weeks.
Class I FOMC - Restricted Controlled (FR) 23 of 45
Economic Outlook
(27) The staff has marked down sharply its outlook for economic growth in the
second half of 2008 and in 2009. Consumer outlays, housing starts, and business
investment in equipment and structures all have been weaker than we projected in
September. Moreover, financial turmoil has intensified, and banks further tightened
credit terms and standards for households and businesses in the third quarter. As a
consequence, the forecast now assumes that the Committee will lower the target
federal funds rate 50 basis points at this meeting, 25 basis points at the December
meeting, and another 25 basis points at the January meeting. The target funds rate is
assumed to remain at ½ percent through mid-2010 and then begin a gradual ascent.
Long-term Treasury yields are projected to be flat over the next two years. Although
yields would tend to rise over time as the maturity window moves through the period
of low short-term rates prevailing over the next few years, we assume that this effect
will be offset as market participants revise down their policy expectations toward the
path incorporated in our baseline forecast. Fixed mortgage rates and corporate bond
yields are projected to decline as economic conditions gradually improve and the
extreme aversion to risk-taking recedes. Stock prices rise at a 12 percent annual rate
in 2009 and 2010 from a starting point that is 23 percent lower than in the previous
forecast; this path implies that the equity premium narrows significantly but remains
at historically high levels over the next two years. The real trade-weighted dollar is
projected to depreciate nearly 3 percent in 2009 and almost 4 percent in 2010. In line
with futures quotes, the price of West Texas intermediate crude oil is expected to rise
slowly from $74 per barrel in the current quarter to $83 per barrel by the end of 2010,
a level that is almost $25 per barrel lower than in the September forecast.
(28) Against this backdrop, the projected path for output follows a notably lower
trajectory than in the last forecast; real GDP is now estimated to have contracted at an
annual rate of 1 percent in the third quarter of 2008 and is projected to decline at
Class I FOMC - Restricted Controlled (FR) 24 of 45
average annual rates of about 1¼ percent in the current quarter and 1½ percent in the
first quarter of 2009. Over the remainder of 2009, GDP is projected to grow at an
annual rate of only ¼ percent, held down by tight lending standards and strained
financial conditions that improve only slowly. In 2010, as financial strains continue to
ebb, GDP expands at its potential growth rate of 2¼ percent. As a consequence of
the economic weakness through the end of next year, the unemployment rate rises to
7¼ percent by the end of 2009, about 2½ percentage points above the staff’s estimate
of the NAIRU. This substantial amount of slack, coupled with a lower path for
energy prices, leads to a marked deceleration in prices. Core PCE inflation, which is
projected at an annual rate of 2¼ percent in the current quarter, moderates to 1½
percent in 2009 and 1¼ percent in 2010. The recent drop in energy prices should
cause overall consumer prices to fall at an annual rate of 2¼ percent in the current
quarter; overall prices increase about 1½ percent on average.
Monetary Policy Strategies
(29) As shown in Chart 7, the Greenbook-consistent measure of short-run r* has
been revised down about 2¾ percentage points since the September Bluebook. It
now stands at about -3 percent, several percentage points below its value at the
previous cyclical trough in mid-2003. The magnitude of the downward shift since the
last Bluebook reflects the sharp deterioration in the staff’s outlook for aggregate
demand: The severity of strains in domestic financial markets has translated into a
marked fall in equity prices, higher corporate bonds rates, and tighter credit
conditions for households and businesses; and the intensification of global financial
market turmoil, a higher dollar and weaker foreign activity have led to less favorable
prospects for the demand for U.S. exports. The estimate of short-run r* from the
small structural model—which incorporates these financial pressures only through the
effects of a wider equity premium—has moved down about 110 basis points since the
Class I FOMC - Restricted Controlled (FR) 25 of 45
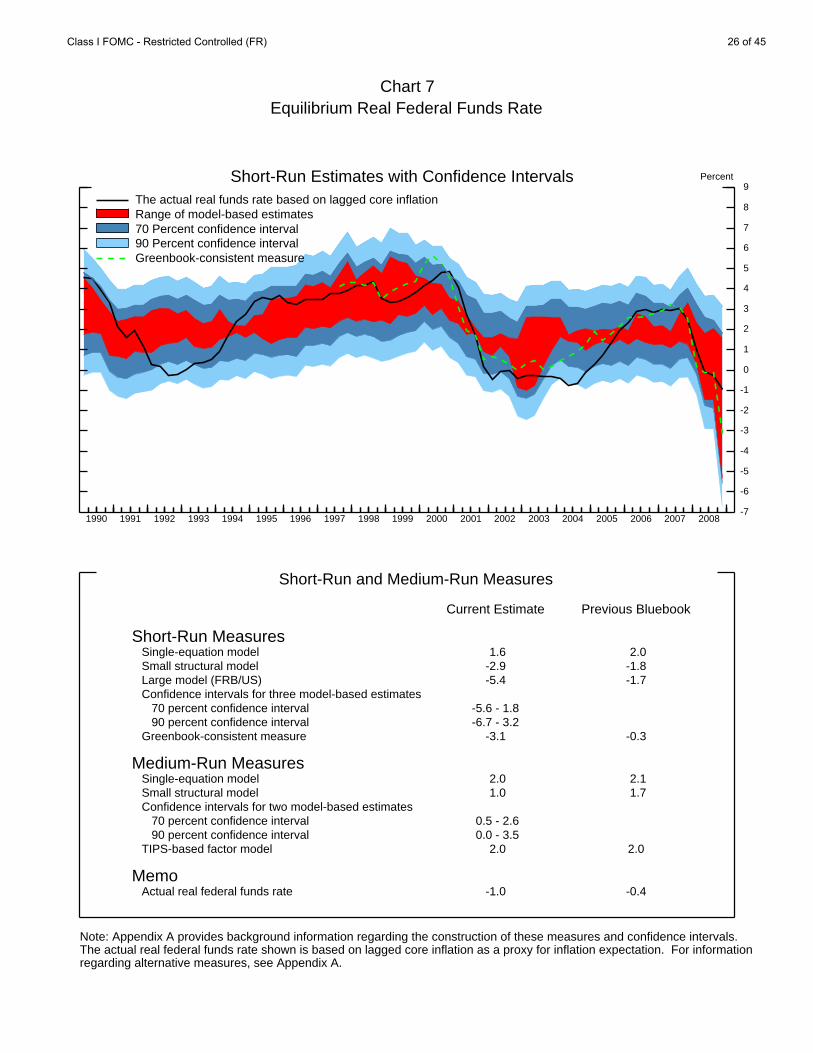
Chart 7Equilibrium Real Federal Funds Rate
1990 1991 1992 1993 1994 1995 1996 1997 1998 1999 2000 2001 2002 2003 2004 2005 2006 2007 2008-7
-6
-5
-4
-3
-2
-1
0
1
2
3
4
5
6
7
8
9
-7
-6
-5
-4
-3
-2
-1
0
1
2
3
4
5
6
7
8
9Percent
Note: Appendix A provides background information regarding the construction of these measures and confidence intervals. The actual real federal funds rate shown is based on lagged core inflation as a proxy for inflation expectation. For informationregarding alternative measures, see Appendix A.
Short-Run Estimates with Confidence IntervalsThe actual real funds rate based on lagged core inflationRange of model-based estimates70 Percent confidence interval90 Percent confidence intervalGreenbook-consistent measure
Short-Run and Medium-Run Measures
Current Estimate Previous Bluebook
Short-Run Measures
Single-equation model (1.6 (2.0
Small structural model -2.9 -1.8
Large model (FRB/US) -5.4 -1.7
Confidence intervals for three model-based estimates
70 percent confidence interval -5.6 - 1.8
90 percent confidence interval -6.7 - 3.2
Greenbook-consistent measure -3.1 -0.3
Medium-Run Measures
Single-equation model (2.0 (2.1
Small structural model (1.0 (1.7
Confidence intervals for two model-based estimates
70 percent confidence interval (0.5 - 2.6
90 percent confidence interval (0.0 - 3.5
TIPS-based factor model (2.0 2.0
Memo
Actual real federal funds rate -1.0 -0.4
Class I FOMC - Restricted Controlled (FR) 26 of 45
last Bluebook to around -3 percent. By comparison, the estimate of short-run r* from
the FRB/US model—which incorporates shifts in other risk premiums as well as the
effects of shocks to foreign demand—has fallen about 375 basis points since the
September Bluebook and is now at -5.4 percent. The actual real federal funds rate has
declined about ½ percentage point since the last meeting, reflecting the Committee’s
policy action on October 8, and now stands at -1 percent.
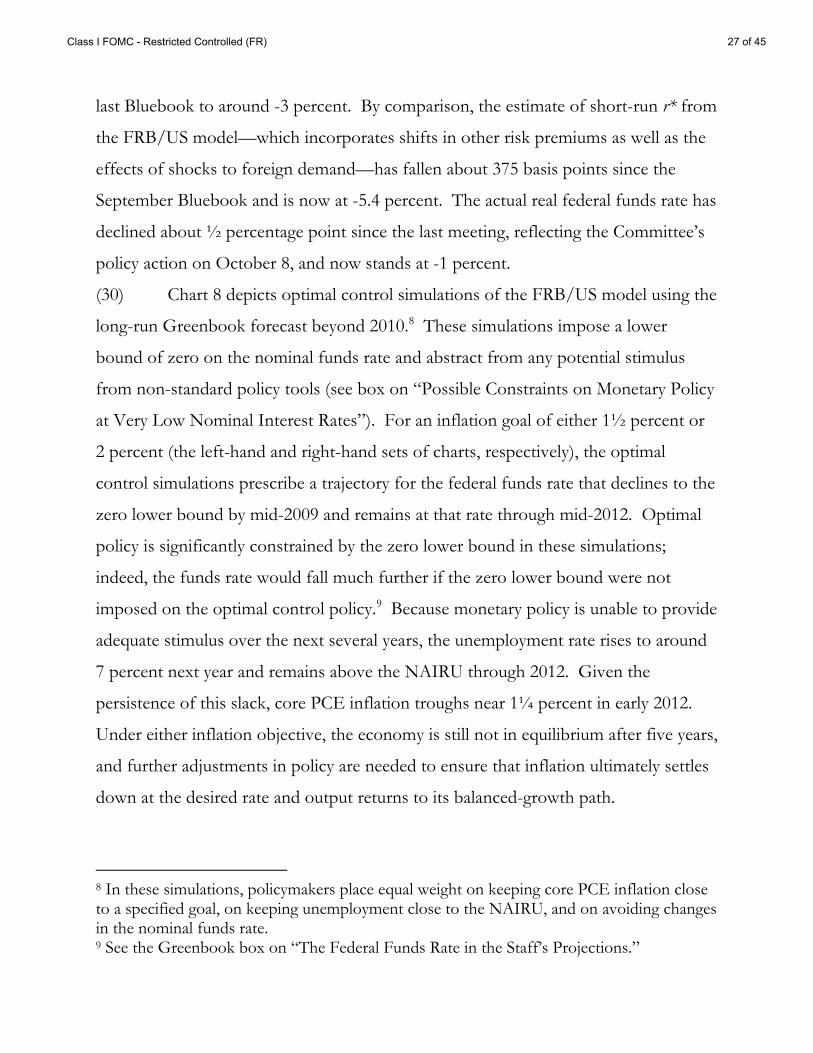
(30) Chart 8 depicts optimal control simulations of the FRB/US model using the
long-run Greenbook forecast beyond 2010.8 These simulations impose a lower
bound of zero on the nominal funds rate and abstract from any potential stimulus
from non-standard policy tools (see box on “Possible Constraints on Monetary Policy
at Very Low Nominal Interest Rates”). For an inflation goal of either 1½ percent or
2 percent (the left-hand and right-hand sets of charts, respectively), the optimal
control simulations prescribe a trajectory for the federal funds rate that declines to the
zero lower bound by mid-2009 and remains at that rate through mid-2012. Optimal
policy is significantly constrained by the zero lower bound in these simulations;
indeed, the funds rate would fall much further if the zero lower bound were not
imposed on the optimal control policy.9 Because monetary policy is unable to provide
adequate stimulus over the next several years, the unemployment rate rises to around
7 percent next year and remains above the NAIRU through 2012. Given the
persistence of this slack, core PCE inflation troughs near 1¼ percent in early 2012.
Under either inflation objective, the economy is still not in equilibrium after five years,
and further adjustments in policy are needed to ensure that inflation ultimately settles
down at the desired rate and output returns to its balanced-growth path.
8 In these simulations, policymakers place equal weight on keeping core PCE inflation close to a specified goal, on keeping unemployment close to the NAIRU, and on avoiding changes in the nominal funds rate. 9 See the Greenbook box on “The Federal Funds Rate in the Staff’s Projections.”
Class I FOMC - Restricted Controlled (FR) 27 of 45
Chart 8
Optimal Policy Under Alternative Inflation Goals
2008 2009 2010 2011 2012 2013
0
1
2
3
4
5
6
7
8
0
1
2
3
4
5
6
7
8Percent
1½ Percent Inflation GoalFederal funds rate
Current BluebookPrevious Bluebook
2008 2009 2010 2011 2012 20132.0
2.5
3.0
3.5
4.0
4.5
5.0
5.5
6.0
6.5
7.0
7.5
2.0
2.5
3.0
3.5
4.0
4.5
5.0
5.5
6.0
6.5
7.0
7.5Percent
Civilian unemployment rate
2008 2009 2010 2011 2012 20130.0
0.5
1.0
1.5
2.0
2.5
3.0
0.0
0.5
1.0
1.5
2.0
2.5
3.0Percent
Core PCE inflation
2008 2009 2010 2011 2012 2013
0
1
2
3
4
5
6
7
8
0
1
2
3
4
5
6
7
8Percent
2 Percent Inflation Goal
2008 2009 2010 2011 2012 20132.0
2.5
3.0
3.5
4.0
4.5
5.0
5.5
6.0
6.5
7.0
7.5
2.0
2.5
3.0
3.5
4.0
4.5
5.0
5.5
6.0
6.5
7.0
7.5Percent
2008 2009 2010 2011 2012 20130.0
0.5
1.0
1.5
2.0
2.5
3.0
0.0
0.5
1.0
1.5
2.0
2.5
3.0Percent
Class I FOMC - Restricted Controlled (FR) 28 of 45
2008 2009 2010 2011 2012-3
-2
-1
0
1
2
3
4
5
-3
-2
-1
0
1
2
3
4
5Percent
Federal funds rate
Recession Scenario
Taylor RuleFull PreemptionRisk Management
2008 2009 2010 2011 20124.00
4.25
4.50
4.75
5.00
5.25
5.50
5.75
6.00
6.25
6.50
4.00
4.25
4.50
4.75
5.00
5.25
5.50
5.75
6.00
6.25
6.50Percent
Civilian unemployment rate
2008 2009 2010 2011 20121.25
1.50
1.75
2.00
2.25
2.50
2.75
3.00
1.25
1.50
1.75
2.00
2.25
2.50
2.75
3.00Percent
Core PCE inflation
Possible Constraints on Monetary Policy at Very Low Nominal Interest Rates
Given the recent sharp deterioration in the economic outlook, the Committee may see a real possibility of substantial further easing of monetary policy in coming quarters, with the federal funds rate falling to record lows.1 For example, under the staff’s baseline outlook, optimal control simulations of the FRB/US model bring the funds rate to zero and maintain that rate into 2012 (Chart 8), while the empirical outcome-based rule prescribes a zero funds rate from mid-2009 to late 2010 (Chart 9); indeed, the funds rate would become negative in those simulations if a lower bound of zero were not imposed.
The lower bound on short-term nominal interest rates arises from the fact that investors can always choose to hold currency, which pays a zero interest rate, instead of other financial assets. In principle, this lower bound could be slightly negative, because holding large amounts of cash incurs storage and security costs that reduce its effective rate of return below zero. In practice, however, a target of zero percent for the federal funds rate might well be associated with slightly positive effective rates, reflecting compensation for risk in interbank lending. In Japan, for example, the one-week interbank rate was typically at a few basis points from March 2001 to July 2006—a period when the Bank of Japan kept the overnight call rate at zero—while the magnitude of occasional spikes was limited by the discount rate, which was maintained a notch higher at 10 basis points.
Reducing the funds rate to very low levels could have significant effects on the functioning of various financial markets and institutions and might well trigger substantial structural changes, especially if very low rates were maintained for a substantial period. Transactions volumes in money markets likely would diminish significantly. Yields on assets held in money market mutual funds might not be high enough to cover the overhead costs of managing those funds. In the short run, funds might have to waive those management fees, and over time the industry might need to move to an explicit fee structure analogous to that already in effect for some types of deposits at commercial banks. Given that overnight interest charges would not provide any incentive to deliver on promised Treasury securities, fails-to-deliver in the Treasury market would likely become increasingly pervasive. Such developments could initially prove disruptive but might eventually lead market participants to incorporate explicit penalties for failures to deliver.
Even when the setting of the nominal interest rate is constrained by the zero lower bound, a central bank can use other tools to provide monetary stimulus. One such approach, known as quantitative easing, involves the injection of additional liquidity into the banking system beyond that required for keeping the overnight interbank rate at zero. However, the evidence from the Japanese experience with quantitative easing—in which excess reserves expanded from a negligible quantity in early 2001 to about five times the level of required reserves by late 2003—suggests that this approach may have little or no effect on bank lending, although it may have provided some stimulus by exerting downward pressure on the yen. A more promising approach might be to aim at reducing term and risk premiums on various financial assets by purchasing those assets in sufficiently large quantities. Event studies suggest that large changes in the relative supply of securities have had economically significant effects on their yields. 1 The effective federal funds rate was about ¾ percent for a few months in 1954 and again in 1958.
Class I FOMC - Restricted Controlled (FR) 29 of 45
(31) As depicted in Chart 9, given the staff’s forecast the outcome-based policy
rule prescribes a funds rate that drops to the zero bound by mid-2009 and stays there
through 2010 before steadily rising to about 4¾ percent by the end of 2013. Over
much of the period, this trajectory is substantially lower than the one currently
embedded in financial market quotes, under which the funds rate declines to 0.75
percent in 2009Q1 before rising to a plateau of about 4 percent starting in 2011.
Stochastic simulations of the FRB/US model using the staff’s baseline outlook and
the outcome-based rule indicate a very high probability that the funds rate hits and
stays at the zero bound between mid-2009 and the end of 2010.10 In contrast,
information from interest rate caps indicates that investors see a relatively high
likelihood of substantial monetary policy tightening starting in the second half of
2009.11
(32) As shown in the bottom panel of Chart 9, the near-term prescriptions from
the Taylor (1993, 1999) rules are markedly lower than in the previous Bluebook,
reflecting the pronounced widening of the output gap and improved readings on core
inflation. While these rules depend solely on the current output gap and the rate of
core inflation that has occurred over the past year, the first-difference rule depends on
three-quarter-ahead forecasts for output growth and core inflation; hence, for either
inflation goal, this rule prescribes a declining funds rates trajectory that reaches the
zero bound by the first quarter of 2009.
10 The stochastic simulations of the FRB/US model also incorporate the zero bound constraint on the nominal funds rate, and hence the 70 and 90 percent confidence intervals are truncated at zero from the second half of 2009 through mid-2012. 11 The probability of low interest rates may be underestimated because the confidence intervals shown in the top right panel of Chart 9 are computed from interest rate caps with strike prices between 1 percent and 14 percent. Interest rate caps with a strike price below 1 percent are not currently traded.
Class I FOMC - Restricted Controlled (FR) 30 of 45
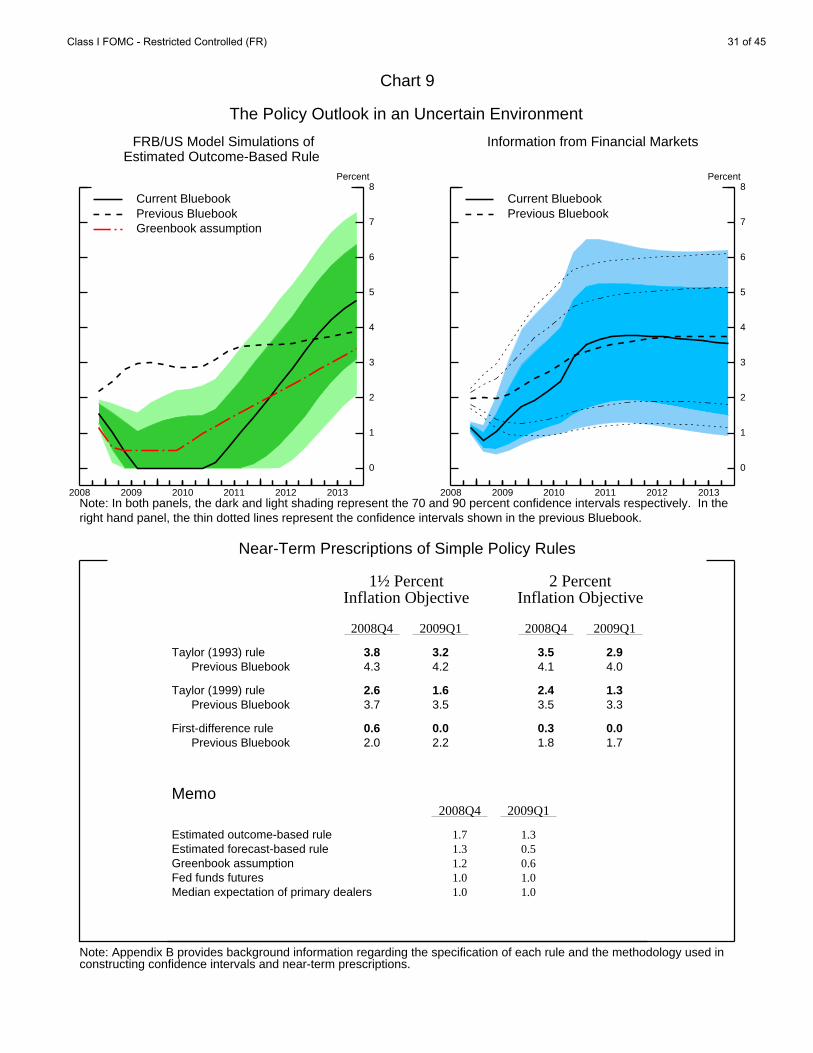
Chart 9
The Policy Outlook in an Uncertain Environment
2008 2009 2010 2011 2012 2013
0
1
2
3
4
5
6
7
8
0
1
2
3
4
5
6
7
8Percent
Note: Appendix B provides background information regarding the specification of each rule and the methodology used inconstructing confidence intervals and near-term prescriptions.
FRB/US Model Simulations ofEstimated Outcome-Based Rule
Note: In both panels, the dark and light shading represent the 70 and 90 percent confidence intervals respectively. In theright hand panel, the thin dotted lines represent the confidence intervals shown in the previous Bluebook.
Current BluebookPrevious BluebookGreenbook assumption
2008 2009 2010 2011 2012 2013
0
1
2
3
4
5
6
7
8
0
1
2
3
4
5
6
7
8Percent
Information from Financial Markets
Current BluebookPrevious Bluebook
Near-Term Prescriptions of Simple Policy Rules
1½ Percent 2 PercentInflation Objective Inflation Objective
2008Q4 2009Q1 2008Q4 2009Q1
Taylor (1993) rule 3.8 3.2 3.5 2.9
Previous Bluebook 4.3 4.2 4.1 4.0 Taylor (1999) rule 2.6 1.6 2.4 1.3
Previous Bluebook 3.7 3.5 3.5 3.3 First-difference rule 0.6 0.0 0.3 0.0
Previous Bluebook 2.0 2.2 1.8 1.7
Memo2008Q4 2009Q1
Estimated outcome-based rule 1.7 1.3
Estimated forecast-based rule 1.3 0.5
Greenbook assumption 1.2 0.6
Fed funds futures 1.0 1.0
Median expectation of primary dealers 1.0 1.0
Class I FOMC - Restricted Controlled (FR) 31 of 45
Policy Alternatives
(33) This Bluebook presents three alternatives for the Committee’s
consideration, summarized by the draft statements in Table 1. Under Alternative A
the federal funds rate target is cut 50 basis points to 1 percent; under Alternative B the
federal funds rate target is cut 25 basis points to 1¼ percent; and under Alternative C
the federal funds rate target is left unchanged at 1½ percent. All three alternatives
begin by noting the deterioration in financial conditions and the weakened economic
outlook. Alternatives B and C note the plethora of recent policy actions around the
world, suggesting that these actions will help to promote a return to moderate
economic growth; Alternative A includes no language to soften its negative view of
the outlook for economic activity. With respect to inflation, Alternatives A and B
express confidence that inflation will moderate in coming quarters to levels consistent
with price stability, whereas Alternative C retains the phrasing from the statement
following the intermeeting cut on October 8, which acknowledges reduced upside
risks to inflation without commenting on its likely future path.
(34) If the Committee believes that further monetary policy accommodation is
appropriate given the deterioration in the economic outlook, but wishes to adjust
policy relatively gradually, it may want to reduce the target federal funds rate 25 basis
points at this meeting as in Alternative B. Even if members have not revised down
their forecast for economic activity as much as the staff, they may still believe that
easing is called for. In view of the negative tone of the recent economic data, the
worsening of financial conditions since mid-September, and the reduction of
inflationary pressures implied by the large drop in energy prices and the outlook for
significant economic slack, members may view the 50 basis point intermeeting move
in early October as only a partial step toward suitably balancing the risks to the
outlook and think that that action should be augmented with a further policy
adjustment at this meeting. At the same time, members may be less pessimistic about
Class I FOMC - Restricted Controlled (FR) 32 of 45
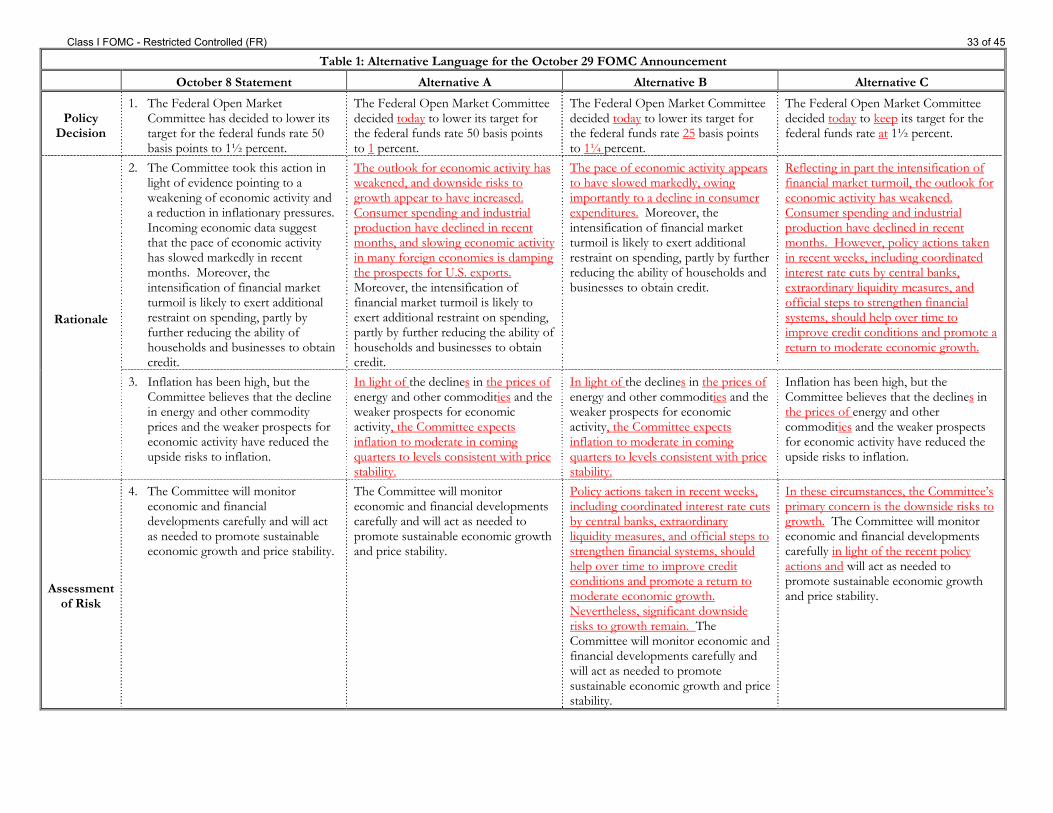
Table 1: Alternative Language for the October 29 FOMC Announcement
October 8 Statement Alternative A Alternative B Alternative C
Policy Decision
1. The Federal Open Market Committee has decided to lower its target for the federal funds rate 50 basis points to 1½ percent.
The Federal Open Market Committee decided today to lower its target for the federal funds rate 50 basis points to 1 percent.
The Federal Open Market Committee decided today to lower its target for the federal funds rate 25 basis points to 1¼ percent.
The Federal Open Market Committee decided today to keep its target for the federal funds rate at 1½ percent.
2. The Committee took this action in light of evidence pointing to a weakening of economic activity and a reduction in inflationary pressures. Incoming economic data suggest that the pace of economic activity has slowed markedly in recent months. Moreover, the intensification of financial market turmoil is likely to exert additional restraint on spending, partly by further reducing the ability of households and businesses to obtain credit.
The outlook for economic activity has weakened, and downside risks to growth appear to have increased. Consumer spending and industrial production have declined in recent months, and slowing economic activity in many foreign economies is damping the prospects for U.S. exports. Moreover, the intensification of financial market turmoil is likely to exert additional restraint on spending, partly by further reducing the ability of households and businesses to obtain credit.
The pace of economic activity appears to have slowed markedly, owing importantly to a decline in consumer expenditures. Moreover, the intensification of financial market turmoil is likely to exert additional restraint on spending, partly by further reducing the ability of households and businesses to obtain credit.
Reflecting in part the intensification of financial market turmoil, the outlook for economic activity has weakened. Consumer spending and industrial production have declined in recent months. However, policy actions taken in recent weeks, including coordinated interest rate cuts by central banks, extraordinary liquidity measures, and official steps to strengthen financial systems, should help over time to improve credit conditions and promote a return to moderate economic growth.
Rationale
3. Inflation has been high, but the Committee believes that the decline in energy and other commodity prices and the weaker prospects for economic activity have reduced the upside risks to inflation.
In light of the declines in the prices of energy and other commodities and the weaker prospects for economic activity, the Committee expects inflation to moderate in coming quarters to levels consistent with price stability.
In light of the declines in the prices of energy and other commodities and the weaker prospects for economic activity, the Committee expects inflation to moderate in coming quarters to levels consistent with price stability.
Inflation has been high, but the Committee believes that the declines in the prices of energy and other commodities and the weaker prospects for economic activity have reduced the upside risks to inflation.
Assessment of Risk
4. The Committee will monitor economic and financial developments carefully and will act as needed to promote sustainable economic growth and price stability.
The Committee will monitor economic and financial developments carefully and will act as needed to promote sustainable economic growth and price stability.
Policy actions taken in recent weeks, including coordinated interest rate cuts by central banks, extraordinary liquidity measures, and official steps to strengthen financial systems, should help over time to improve credit conditions and promote a return to moderate economic growth. Nevertheless, significant downside risks to growth remain. The Committee will monitor economic and financial developments carefully and will act as needed to promote sustainable economic growth and price stability.
In these circumstances, the Committee’s primary concern is the downside risks to growth. The Committee will monitor economic and financial developments carefully in light of the recent policy actions and will act as needed to promote sustainable economic growth and price stability.
Class I FOMC - Restricted Controlled (FR) 33 of 45
the outlook than the staff for several reasons and hence believe that more limited
policy action than assumed in the Greenbook is appropriate. For example, they may
believe that financial conditions will improve sooner than assumed by the staff, as in
the Greenbook’s “More Rapid Financial Recovery” scenario. Or, they may think that
passage of a second fiscal stimulus package is likely and perhaps that such a package
could be larger or more potent than those presented in the Greenbook’s “Fiscal
Stimulus” scenarios. Although these Greenbook alternative scenarios indicate that
more policy easing would still be desirable, they might suggest less urgency to take
further large steps. Alternatively, should the Committee share the staff’s downbeat
economic outlook but see a near-term reversal of policy as costly, members might
view a series of gradual steps as more prudent than one or two large moves because
there is considerable uncertainty surrounding the outlook, particularly concerning the
effects of the many official actions recently implemented.
(35) The rationale section of the statement accompanying Alternative B would
begin by noting the deterioration in the outlook for economic activity, pointing
specifically to the softening in consumer spending. The statement would also point
out that financial market strains have intensified and that the resulting tightening of
credit conditions is likely to impose additional restraint on spending. The paragraph
on inflation would note that recent declines in the prices of energy and other
commodities, along with greater prospective economic slack, should cause inflation to
moderate to levels consistent with price stability. (See the box “Likely Market
Interpretation of Price Stability Language.”) The change in wording, from reduced
upside risks in the October 8 statement to an expected moderation of inflation in the
language for Alternative B, suggests that Committee members have become much
more confident that inflation will decline. The final paragraph would note the
numerous policy steps already taken in recent weeks to increase liquidity in financial
markets, strengthen financial systems around the world, and promote economic
Class I FOMC - Restricted Controlled (FR) 34 of 45
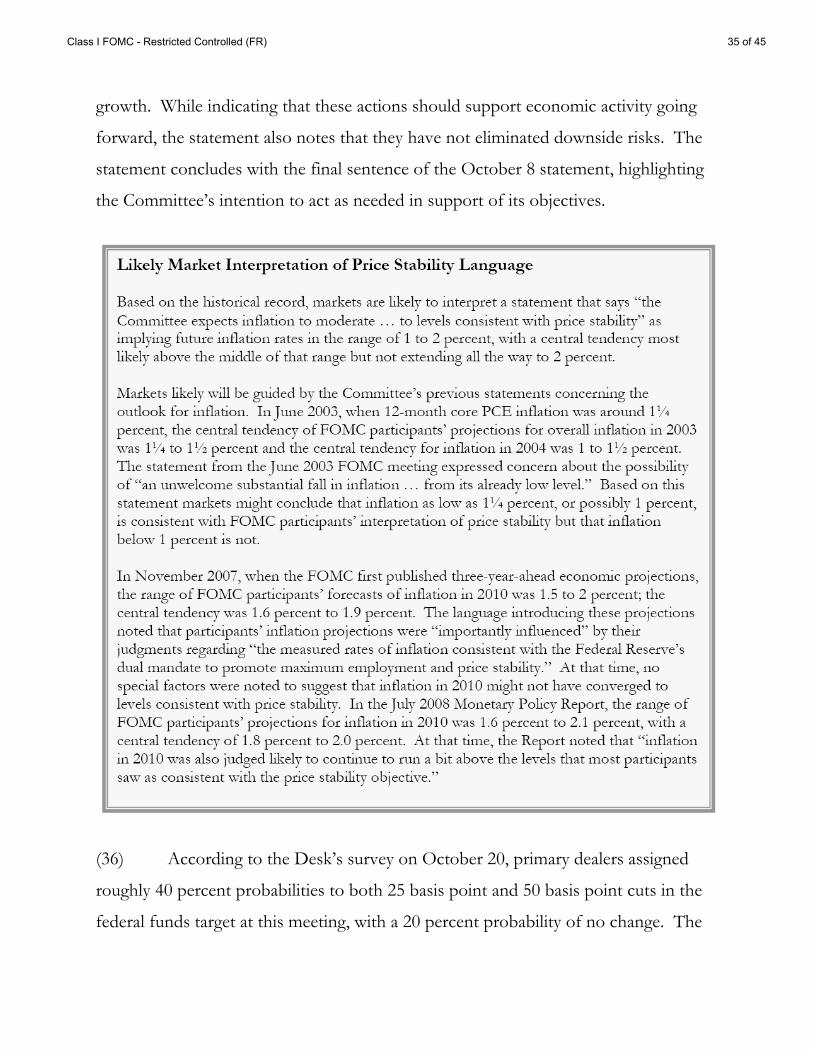
growth. While indicating that these actions should support economic activity going
forward, the statement also notes that they have not eliminated downside risks. The
statement concludes with the final sentence of the October 8 statement, highlighting
the Committee’s intention to act as needed in support of its objectives.
(36) According to the Desk’s survey on October 20, primary dealers assigned
roughly 40 percent probabilities to both 25 basis point and 50 basis point cuts in the
federal funds target at this meeting, with a 20 percent probability of no change. The
Class I FOMC - Restricted Controlled (FR) 35 of 45
mean of dealers’ expectations for the target funds rate was 1.2 percent, which is
slightly above the rate of 1.1 percent implied by federal funds futures contracts at the
time of the Desk’s survey. Because futures contracts refer to the effective funds rate
rather than the target rate, the difference between the dealer expectations and the
futures rate may reflect the possibility that federal funds will continue to trade below
the target in coming weeks; 12 it is likely that at the time of the Desk’s survey, both
dealers and futures market participants expected a cut in the target funds rate of about
30 basis points. However, over subsequent days, rates on federal funds futures
contracts closing after the October meeting have declined another 10 basis points
amid investor concerns about the economic outlook, and they now suggest
expectations of about 40 basis points of easing at the upcoming meeting. Thus, a 25
basis point cut to 1¼ percent would leave the target federal funds rate somewhat
above current market expectations. Nevertheless, the clear shift in the statement
language away from concern about inflation risks and toward an emphasis on growth
risks would likely lead investors to anticipate further rate cuts, and this alternative
appears broadly consistent with readings for the funds rate at the end of the year that
are implied by futures markets. As a result, our best estimate is that adoption of
Alternative B would have only small effects on prices of financial assets.
(37) If the Committee, like the staff, has marked down significantly its
assessment of economic prospects and now sees an immediate and substantial policy
response as appropriate, it may want to reduce the target federal funds rate 50 basis
points at this meeting, as in Alternative A. Recent economic data releases have been
almost all weaker than anticipated, with consumer outlays down sharply. Moreover,
financial conditions have deteriorated substantially since the September meeting:
Equity prices fell sharply over the intermeeting period; mortgage rates moved higher; 12 The October 22 announcement of a decrease in the spread between the target federal funds rate and the rate of interest paid on excess reserve balances had little apparent effect on futures rates.
Class I FOMC - Restricted Controlled (FR) 36 of 45
corporate bond yields jumped; and the October Senior Loan Officer Opinion Survey
shows that extraordinarily high percentages of banks tightened standards and terms
on loans to businesses and households over the past three months. With regard to
inflation, the latest news on commodity prices and inflation expectations, in
conjunction with the appreciation of the dollar in recent months and the likelihood of
a marked increase in economic slack, provides substantial assurance that inflation will
moderate. Even if the Committee has not marked down its outlook for the economy
as much as the staff, it may view the downside risks as having increased. Moreover,
with the Greenbook-consistent measure of the equilibrium real funds rate having
dropped about 2 percentage points below the level of the current real rate, even a less
pessimistic outlook than the Greenbook’s could be consistent with a considerable
further reduction in the target federal funds rate.
(38) The rationale section of the statement for Alternative A highlights the
recent deterioration in financial and economic conditions, with specific references to
weak consumer spending and industrial production and to the slowdown in foreign
economic growth. As under Alternative B, the section also points out the likely future
spending restraint implied by the further tightening of financial conditions. The
discussion of inflation would be identical to that under Alternative B, noting the
reasons to expect a moderation of inflation to levels consistent with price stability.
The assessment of risk would emphasize the Committee’s readiness to act as needed
to promote growth.
(39) A 50 basis point cut is near the high end of market expectations for policy
easing at this meeting. Moreover, the statement language suggests that the Committee
is prepared to reduce rates further, and thus market participants would presumably
lower their expected trajectory for the federal funds rate over the next few quarters.
Short- and intermediate-term interest rates would probably drop noticeably. Long-
term interest rates might decline modestly, though if market participants interpret the
Class I FOMC - Restricted Controlled (FR) 37 of 45
statement as a sign that the Committee is underestimating inflation risks, long-term
rates could rise. The effect on equity prices would depend on whether markets are
comforted by the prospect of more monetary ease or concerned by the gloomy
assessment of the outlook and risks.
(40) If the Committee believes that the economic outlook has not deteriorated as
much as in the staff forecast or that there is still a significant risk that inflation will not
moderate as expected, it might prefer to leave the stance of policy unchanged, as in
Alternative C. Although recent readings on real activity have been very weak, a wide
range of monetary and other policy measures have been implemented recently, and
members may feel that a gradual improvement of financial conditions could be in
train. Indeed, many yield spreads have been narrowing and liquidity measures have
been improving gradually in recent days, albeit from highly strained levels. If this
process continues in coming weeks, the cumulative improvement in financial
conditions could be substantial. Also, the Committee may place a high probability on
a major new fiscal stimulus package being enacted soon; no fiscal package was
factored into the staff’s projection. Moreover, members may be skeptical of the staff
projection of a sharp reduction in inflation, perhaps feeling that it is based on
assumptions that may prove to be overly optimistic. For example, the Committee
may not have confidence in the sharply lower trajectory for energy prices suggested by
futures markets; energy prices are highly volatile and futures market quotes over the
past few years have been unreliable guides to subsequent developments. And some
members may not put much stock in the notion that slack in labor and product
markets will restrain future price pressures, but may instead worry that a very low
funds rate will fuel rising inflation expectations, as illustrated in the Greenbook’s
“Faster Inflation” scenario. Indeed, members may want to see several months of
lower data on inflation and inflation expectations before they feel comfortable with
further reductions in the policy target.
Class I FOMC - Restricted Controlled (FR) 38 of 45
(41) The first part of the rationale portion of the statement associated with
Alternative C would acknowledge the recent deterioration in economic and financial
conditions. The second part would point to the wide range of recent policy actions,
noting that they should help to promote growth over time. The discussion of the
outlook for inflation would be essentially identical to that in the October 8 statement,
which focused on a reduction in upside risks rather than a material reduction in the
modal forecast. Finally, the risk assessment under Alternative C begins by stating that
the balance of risks has shifted toward downside risks to growth. The section
concludes with a modification of the risk assessment of the October 8 statement,
pointing to the possible effects of past policy actions as something the Committee will
be watching particularly closely.
(42) Given the high odds embedded in financial market prices of at least a 25
basis point cut at this meeting, a decision to adopt Alternative C would surprise
market participants, leading to an appreciable upward revision of their short-term
outlook for the path of policy and probably an increase in short-and intermediate-
term interest rates. Equity prices would likely fall, perhaps substantially. Financial
market strains would probably increase and private yields would rise.
Money and Debt Forecasts
(43) M2 is projected to grow at a 7½ percent annual rate this year, significantly
above the rate anticipated in September and faster than the projected growth rate of
nominal GDP. The major factor behind rapid growth of M2 this year is the decline in
short-term interest rates and the associated drop in the opportunity cost of holding
M2 assets. A portfolio shift toward safe and liquid assets may also be playing a role.
M2 is projected to decelerate to a pace of roughly 3 percent in 2009 and 2010,
reflecting weak growth in nominal GDP in 2009 and a rising opportunity cost in 2010.
Class I FOMC - Restricted Controlled (FR) 39 of 45
(44) Debt growth in the private sector is expected to be weak over the next two
years. Household debt is projected to be essentially flat in 2009 and to expand only a
little in 2010, held down by falling home prices and tighter bank lending terms and
standards. Nonfinancial business debt is projected to grow at a moderate rate, down
sharply from rapid growth rates in recent years, also restrained in part by tight credit
conditions. By contrast, debt is projected to grow rapidly in the government sectors,
as the economic slowdown damps revenues, and as financing needs related to the
TARP, Treasury’s assistance to the GSEs, and higher expected losses at the FDIC
boost federal debt substantially in 2009 and 2010. Overall, domestic nonfinancial
debt is projected to grow 2¾ percent in 2009 and 4¼ percent in 2010, a very subdued
pace by historical standards.
Class I FOMC - Restricted Controlled (FR) 40 of 45
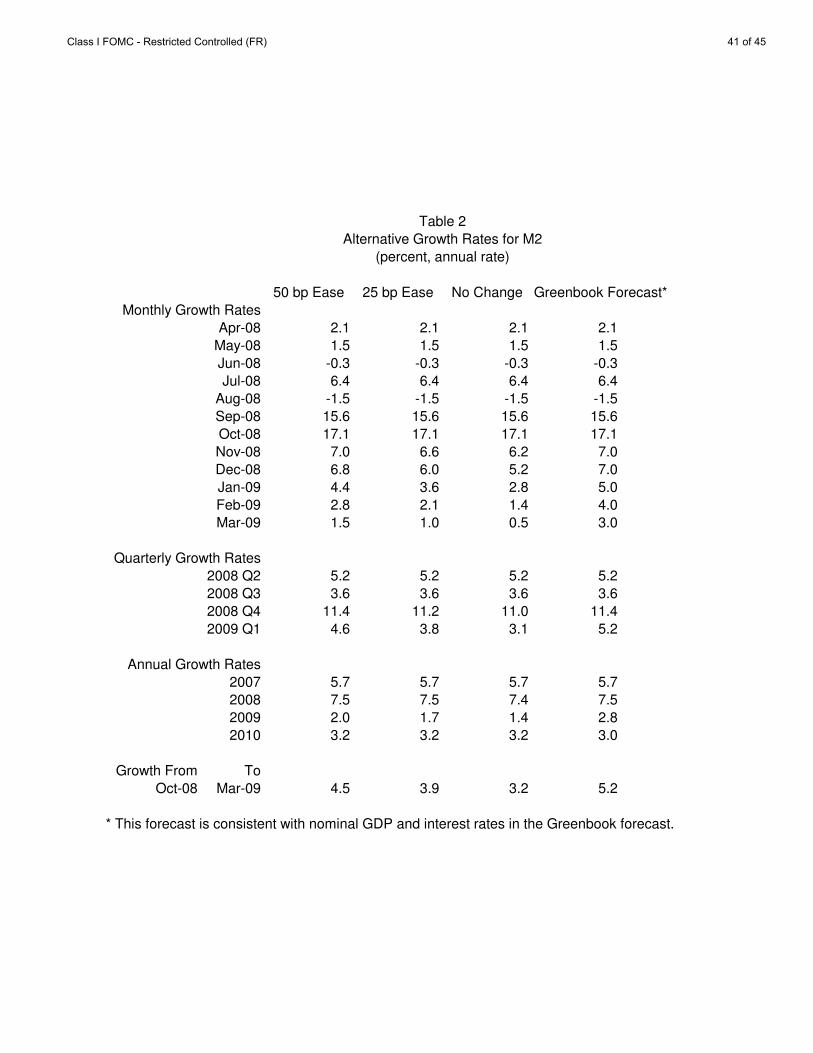
50 bp Ease 25 bp Ease No Change Greenbook Forecast*
Monthly Growth Rates
Apr-08 2.1 2.1 2.1 2.1
May-08 1.5 1.5 1.5 1.5
Jun-08 -0.3 -0.3 -0.3 -0.3
Jul-08 6.4 6.4 6.4 6.4
Aug-08 -1.5 -1.5 -1.5 -1.5
Sep-08 15.6 15.6 15.6 15.6
Oct-08 17.1 17.1 17.1 17.1
Nov-08 7.0 6.6 6.2 7.0
Dec-08 6.8 6.0 5.2 7.0
Jan-09 4.4 3.6 2.8 5.0
Feb-09 2.8 2.1 1.4 4.0
Mar-09 1.5 1.0 0.5 3.0
Quarterly Growth Rates
2008 Q2 5.2 5.2 5.2 5.2
2008 Q3 3.6 3.6 3.6 3.6
2008 Q4 11.4 11.2 11.0 11.4
2009 Q1 4.6 3.8 3.1 5.2
Annual Growth Rates
2007 5.7 5.7 5.7 5.7
2008 7.5 7.5 7.4 7.5
2009 2.0 1.7 1.4 2.8
2010 3.2 3.2 3.2 3.0
Growth From To
Oct-08 Mar-09 4.5 3.9 3.2 5.2
* This forecast is consistent with nominal GDP and interest rates in the Greenbook forecast.
Table 2
Alternative Growth Rates for M2
(percent, annual rate)
Class I FOMC - Restricted Controlled (FR) 41 of 45
Directive
(45) Draft language for the directive is provided below.
Directive Wording The Federal Open Market Committee seeks monetary and financial
conditions that will foster price stability and promote sustainable growth
in output. To further its long-run objectives, the Committee in the
immediate future seeks conditions in reserve markets consistent with
MAINTAINING/INCREASING/reducing the federal funds rate
AT/to an average of around ________ 1½ percent.
Class I FOMC - Restricted Controlled (FR) 42 of 45
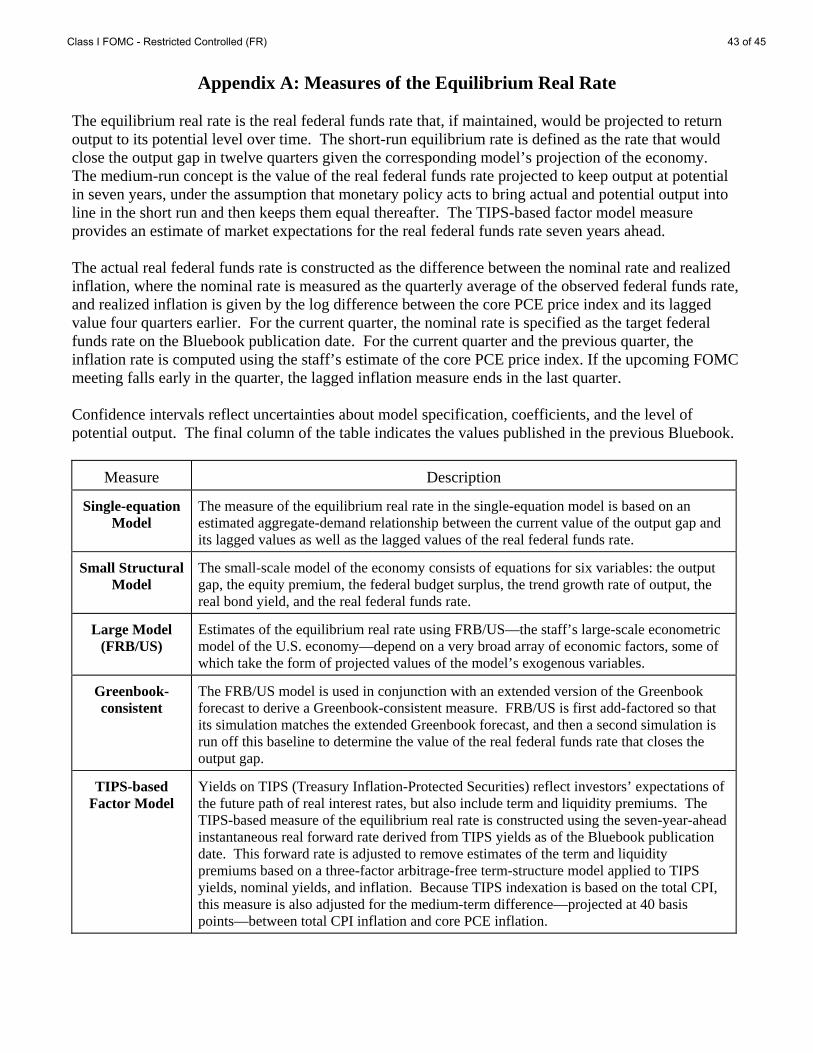
Appendix A: Measures of the Equilibrium Real Rate
The equilibrium real rate is the real federal funds rate that, if maintained, would be projected to return output to its potential level over time. The short-run equilibrium rate is defined as the rate that would close the output gap in twelve quarters given the corresponding model’s projection of the economy. The medium-run concept is the value of the real federal funds rate projected to keep output at potential in seven years, under the assumption that monetary policy acts to bring actual and potential output into line in the short run and then keeps them equal thereafter. The TIPS-based factor model measure provides an estimate of market expectations for the real federal funds rate seven years ahead. The actual real federal funds rate is constructed as the difference between the nominal rate and realized inflation, where the nominal rate is measured as the quarterly average of the observed federal funds rate, and realized inflation is given by the log difference between the core PCE price index and its lagged value four quarters earlier. For the current quarter, the nominal rate is specified as the target federal funds rate on the Bluebook publication date. For the current quarter and the previous quarter, the inflation rate is computed using the staff’s estimate of the core PCE price index. If the upcoming FOMC meeting falls early in the quarter, the lagged inflation measure ends in the last quarter. Confidence intervals reflect uncertainties about model specification, coefficients, and the level of potential output. The final column of the table indicates the values published in the previous Bluebook.
Measure Description
Single-equation Model
The measure of the equilibrium real rate in the single-equation model is based on an estimated aggregate-demand relationship between the current value of the output gap and its lagged values as well as the lagged values of the real federal funds rate.
Small Structural Model
The small-scale model of the economy consists of equations for six variables: the output gap, the equity premium, the federal budget surplus, the trend growth rate of output, the real bond yield, and the real federal funds rate.
Large Model (FRB/US)
Estimates of the equilibrium real rate using FRB/US—the staff’s large-scale econometric model of the U.S. economy—depend on a very broad array of economic factors, some of which take the form of projected values of the model’s exogenous variables.
Greenbook-consistent
The FRB/US model is used in conjunction with an extended version of the Greenbook forecast to derive a Greenbook-consistent measure. FRB/US is first add-factored so that its simulation matches the extended Greenbook forecast, and then a second simulation is run off this baseline to determine the value of the real federal funds rate that closes the output gap.
TIPS-based Factor Model
Yields on TIPS (Treasury Inflation-Protected Securities) reflect investors’ expectations of the future path of real interest rates, but also include term and liquidity premiums. The TIPS-based measure of the equilibrium real rate is constructed using the seven-year-ahead instantaneous real forward rate derived from TIPS yields as of the Bluebook publication date. This forward rate is adjusted to remove estimates of the term and liquidity premiums based on a three-factor arbitrage-free term-structure model applied to TIPS yields, nominal yields, and inflation. Because TIPS indexation is based on the total CPI, this measure is also adjusted for the medium-term difference—projected at 40 basis points—between total CPI inflation and core PCE inflation.
Class I FOMC - Restricted Controlled (FR) 43 of 45
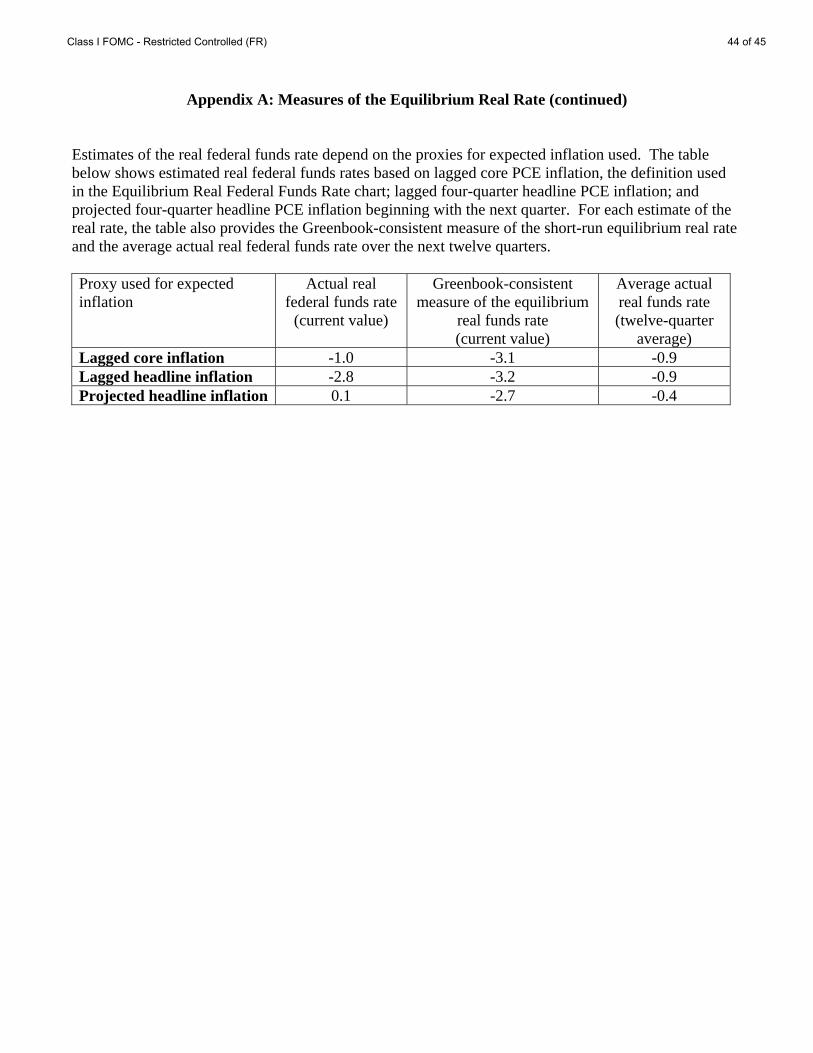
Appendix A: Measures of the Equilibrium Real Rate (continued)
Proxy used for expected inflation
Actual real federal funds rate
(current value)
Greenbook-consistent measure of the equilibrium
real funds rate (current value)
Average actual real funds rate (twelve-quarter
average) Lagged core inflation -1.0 -3.1 -0.9 Lagged headline inflation -2.8 -3.2 -0.9 Projected headline inflation 0.1 -2.7 -0.4
Estimates of the real federal funds rate depend on the proxies for expected inflation used. The table below shows estimated real federal funds rates based on lagged core PCE inflation, the definition used in the Equilibrium Real Federal Funds Rate chart; lagged four-quarter headline PCE inflation; and projected four-quarter headline PCE inflation beginning with the next quarter. For each estimate of the real rate, the table also provides the Greenbook-consistent measure of the short-run equilibrium real rate and the average actual real federal funds rate over the next twelve quarters.
Class I FOMC - Restricted Controlled (FR) 44 of 45
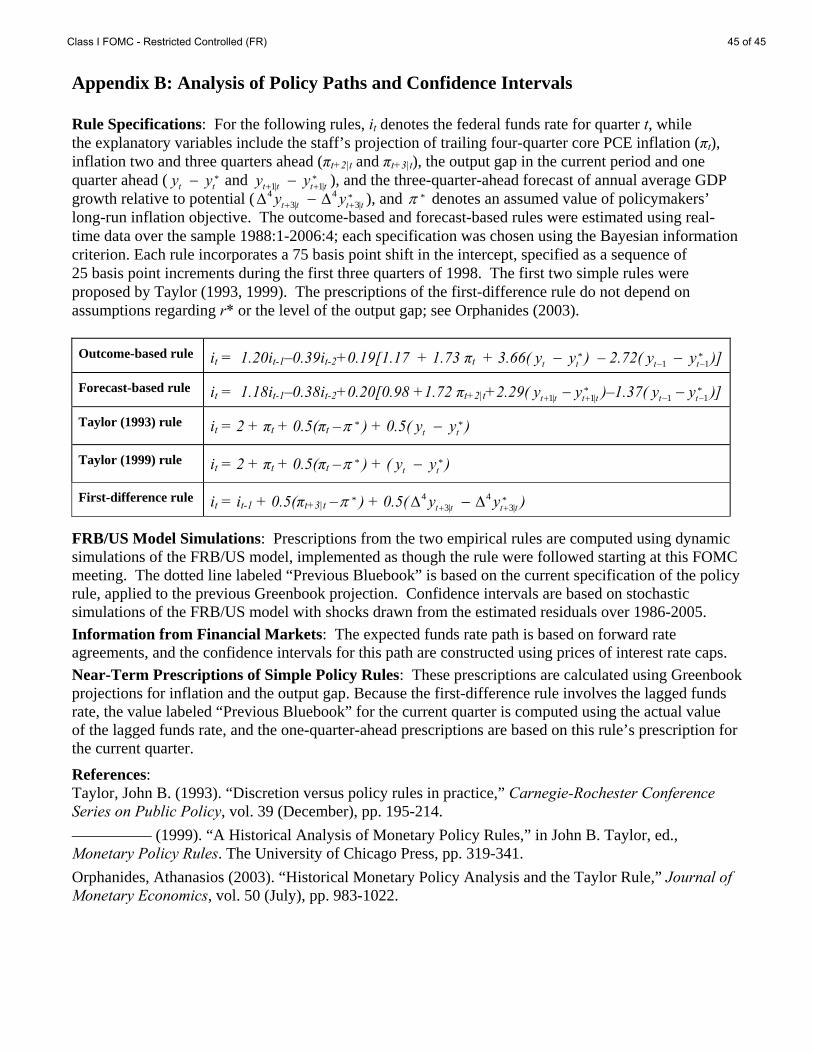
Appendix B: Analysis of Policy Paths and Confidence Intervals
Rule Specifications: For the following rules, it denotes the federal funds rate for quarter t, while the explanatory variables include the staff’s projection of trailing four-quarter core PCE inflation (πt), inflation two and three quarters ahead (πt+2|t and πt+3|t), the output gap in the current period and one quarter ahead ( y y *
t t− and y y *t t+ +1| − t 1|t ), and the three-quarter-ahead forecast of annual average GDP
growth relative to potential (Δ −4 4y y *t t+ +3| Δ t 3|t ), and π * denotes an assumed value of policymakers’
long-run inflation objective. The outcome-based and forecast-based rules were estimated using real-time data over the sample 1988:1-2006:4; each specification was chosen using the Bayesian information criterion. Each rule incorporates a 75 basis point shift in the intercept, specified as a sequence of 25 basis point increments during the first three quarters of 1998. The first two simple rules were proposed by Taylor (1993, 1999). The prescriptions of the first-difference rule do not depend on assumptions regarding r* or the level of the output gap; see Orphanides (2003).
Outcome-based rule it
= 1.20it-1–0.39it-2+0.19[1.17 + 1.73 πt + 3.66( *t ty y− ) – 2.72( *
1 1t ty y− −− )]
Forecast-based rule it = 1.18it-1–0.38it-2+0.20[0.98 +1.72 πt+2|t+2.29( *1| 1|t t t ty y+ +− )–1.37( *
1 1t ty y− −− )]
Taylor (1993) rule it = 2 + πt + 0.5(πt – *π ) + 0.5( *t ty y− )
Taylor (1999) rule it = 2 + πt + 0.5(πt – *π ) + ( *t ty y− )
First-difference rule it = it-1 + 0.5(πt+3|t – *π ) + 0.5( 4 4 *3| 3|t t t ty y+ +Δ − Δ )
FRB/US Model Simulations: Prescriptions from the two empirical rules are computed using dynamic simulations of the FRB/US model, implemented as though the rule were followed starting at this FOMC meeting. The dotted line labeled “Previous Bluebook” is based on the current specification of the policy rule, applied to the previous Greenbook projection. Confidence intervals are based on stochastic simulations of the FRB/US model with shocks drawn from the estimated residuals over 1986-2005. Information from Financial Markets: The expected funds rate path is based on forward rate agreements, and the confidence intervals for this path are constructed using prices of interest rate caps. Near-Term Prescriptions of Simple Policy Rules: These prescriptions are calculated using Greenbook projections for inflation and the output gap. Because the first-difference rule involves the lagged funds rate, the value labeled “Previous Bluebook” for the current quarter is computed using the actual value of the lagged funds rate, and the one-quarter-ahead prescriptions are based on this rule’s prescription for the current quarter.
References: Taylor, John B. (1993). “Discretion versus policy rules in practice,” Carnegie-Rochester Conference Series on Public Policy, vol. 39 (December), pp. 195-214. ————— (1999). “A Historical Analysis of Monetary Policy Rules,” in John B. Taylor, ed., Monetary Policy Rules. The University of Chicago Press, pp. 319-341. Orphanides, Athanasios (2003). “Historical Monetary Policy Analysis and the Taylor Rule,” Journal of Monetary Economics, vol. 50 (July), pp. 983-1022.
Class I FOMC - Restricted Controlled (FR) 45 of 45
Recommended