Unc
lass
ified
Unc
lass
ified
For Official Use DSTI/SU/SC(2006)43 Organisation de Coopération et de Développement Economiques Organisation for Economic Co-operation and Development 30-May-2006 ___________________________________________________________________________________________
English text only DIRECTORATE FOR SCIENCE, TECHNOLOGY AND INDUSTRY STEEL COMMITTEE
INDIA RAW MATERIALS OUTLOOK FOR INDIA
Joint India/OECD/IISI Workshop, New Delhi (India), 16-17 May 2006.
Presentation by Mr. A.D. Baijal, Vice President, Raw Materials, Tata Steel
Contact: Wolfgang Hübner, Head of Structural Policy Division and Steel Unit Tel: +33 1 45 24 91 32 Fax: +33 1 44 30 62 63 E-mail: [email protected]
JT03209761
Document complet disponible sur OLIS dans son format d'origine Complete document available on OLIS in its original format
DST
I/SU/SC
(2006)43 For O
fficial Use
English text only

DSTI/SU/SC(2006)43
2
1
Raw materials outlook for India- A Review
A D Baijal
VP (Raw Materials)
Tata Steel
IISI-OECD CONFERENCEDate: 17th May, 2006
2
Steel Industry
- Global
- Indian
Raw materials for Steel
Policy / Legislation
Infrastructure
Conclusion
Presentation OutlinePresentation Outline

DSTI/SU/SC(2006)43
3
3
Global steel demand poised for robust growthGlobal steel demand poised for robust growth
Crude Steel Production (Million Tonnes)
0
200
400
600
800
1,000
1,200
1900 1910 1920 1930 1940 1950 1960 1970 1980 1990 2000 2010 2020
Great Depression
WW 2 Oil CrisisFall of USSR
CAGR 7 %
CAGR 1 %
The Early Years
The 1st
Surge The 2nd
PlateauThe 2nd
Surge
Asian Financial
Crisis
The 1st
Plateau
CAGR 2 %CAGR
5 %
WW 1
CAGR 5 %
4
The Global Economic Forecast: Asia poised to be the The Global Economic Forecast: Asia poised to be the emerging power house of growthemerging power house of growth
• In 2020, the US and China will still be the two largest economies in the world (in PPP)
• India leaves Japan behind and moves up to 3rd place
• India, Malaysia and China will post the highest GDP growth rates (above 5%) over 2006-20
• Ireland, the US and Spain are the rich countries expected to grow the most

DSTI/SU/SC(2006)43
4
5
GDP per capita to increase from USD 2500 and USD 5000 in 2020.Poverty ratio dropped from 50% of population in 1950 to 26% in 2005.Economic growth rate ~ 8%Population growth rate of 1.3 - 1.5%33% population below 15 years and 5% above 65 yearsHouse hold savings rate go up from current 23% to 30%100,000 MW new capacity (90% of present) in next 7 years. The Fiscal Responsibility and Budget Management ActLiteracy standards increase from 18% in 1951 to 65% in 2002.
Indian EconomyIndian Economy
6
Steel Consumption Vs. GDPSteel Consumption Vs. GDP
Steel Consumption and GDP per Capita in 2004
10
100
1000
10000
0 5000 10000 15000 20000 25000 30000 35000 40000
GDP per capita (US$000 at PPP rates)
Stee
l con
sum
ptio
n (k
g/ca
pita
)
ChinaS.Korea
Taiwan
US
Other AfricaIndia
Japan
Bubble size represents the population
The growth in BRIC will double the steel demand by 2050Source: internal analysis

DSTI/SU/SC(2006)43
5
7
UAE
Taiwa n
Sou th Ko rea
Hong Kong
Japan
G ermany
Austr alia
USA
France
ChinaIndi a
0
200
400
600
800
1000
1200
1400K
gs p
er C
apita
Countries
UAE – 1252
World Avg. – 170 India – 33
> 150 MT, The > 150 MT, The present gap present gap
Apparent Steel consumptionof countries
Growth in key sectors will drive the steel demandGrowth in key sectors will drive the steel demand
We feel the growth trigger has been fired…..….. (Last 3 years GDP growth of + 7.5%)
8Low High
Deficit
Excess
Ava
il-ab
ility
of I
ron
Ore
Forecasted Growth rate 2005-15
CIS Latin America
USA / Canada
Eastern EuropeEU
Japan
India
China
Other emerging Asian countries
Raw Material basin
Growth basin
Mature basin
Production sites will move to regions with both RM Production sites will move to regions with both RM source and demand. source and demand.

DSTI/SU/SC(2006)43
6
National Steel PolicyProjectionsSteel Production
29 31 34 3650
70
110
0
25
50
75
100
125
150
2000-01 2001-02 2002-03 2003-04 2006-07 2011-12 2020
Year
Cru
de S
teel
: m
tpa
Planning Commission projections
Indian Steel production likely to triple in next 15 yearsIndian Steel production likely to triple in next 15 years
To realize the above projections, it would be necessary to put in place the right policies as well as alignment of the policies
10
Steel Industry
- Global
- Indian
Raw materials for Steel
Policy / Legislation
Infrastructure
Conclusion
Presentation OutlinePresentation Outline

DSTI/SU/SC(2006)43
7
11
Multifold increase in Raw Material Consumption Multifold increase in Raw Material Consumption
54
2713 13
190
70
2639
0
20
40
60
80
100
120
140
160
180
200
Iron Ore Coking coal Non coking coal Fluxes
2004-052019-20 (F)
12
**
* **
Indian Iron Ore Reserves: Five Zones
Kudremukh, Bababudan, Kudachadri
N Goa, S Goa, Redi
Donimalai, Ramandurg, Kumaraswamy, NEB Range, Ettinahatti, Tumti, Belagal
Bailadila, Dalli,Rajhara, Rowghat, Mahamaya, Aridongri, Surajgarh
Chiria, Noamundi, Joda, Kiriburu, Meghataburu, Thakurani, Bolani, Gua, Malangtoli, Gandhamardan, Daitari
Major Mines / Deposits
E-Karnataka
D-Goa
C-Karnataka
B-Chattisgarh, MP, Maharashtra
A-Orissa, Jharkhand
States
Magne
Haematite
Haematite
Haematite
Haematite
Ore
35-45
60-63
62-64
64-66
62-64
Fe Range (%age)
1.0
2.0-4.0
2.0-4.0
1.0-4.0
2-4
Alumina (%age)
E-Karnataka
D-Goa
C-Karnataka
B-Chattisgarh, MP, Maharashtra
A-Orissa, Jharkhand
States
-
0.04-0.07
0.04-0.09
0.04-0.15
0.04-0.1
PhosMax (%ag
e)
DSTI/SU/SC(2006)43
8
13
050
100150200250300350
'99-00 '00-01 '01-02 '02-03 '03-04 '04-05 2020
mill
ion
tonn
es
Production Consumption Exports
Iron Ore
10%
3%
10%
6%
39%14%
18%
Production Trend Indian Resources: 23 bt
Karnataka
OrissaChatti
sgar
hGoa
Jharkhand
OthersAP
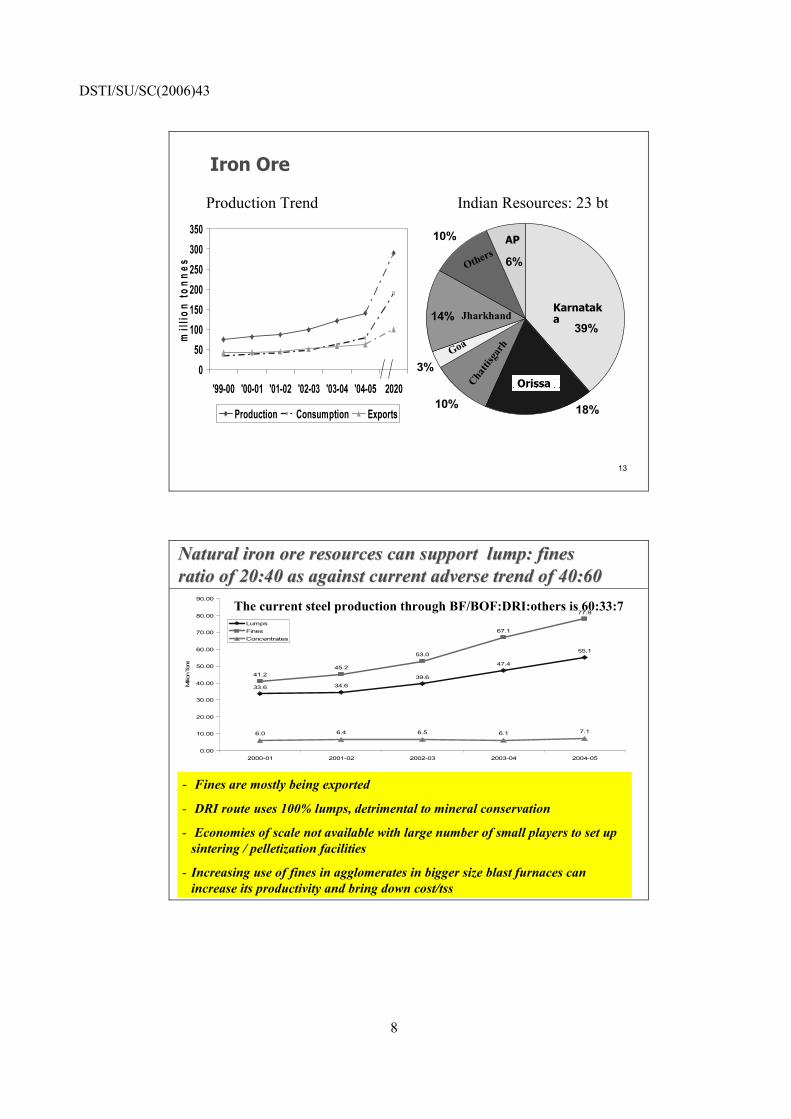
14
Natural iron ore resources can support lump: fines Natural iron ore resources can support lump: fines ratio of 20:40 as against current adverse trend of 40:60ratio of 20:40 as against current adverse trend of 40:60
33.6 34.639.6
47.4
55.1
41.245.2
53.0
67.1
77.9
6.0 6.4 6.5 6.1 7.1
0.00
10.00
20.00
30.00
40.00
50.00
60.00
70.00
80.00
90.00
2000-01 2001-02 2002-03 2003-04 2004-05
Million
Ton
s
LumpsFinesConcentrates
- Fines are mostly being exported
- DRI route uses 100% lumps, detrimental to mineral conservation
- Economies of scale not available with large number of small players to set up sintering / pelletization facilities
- Increasing use of fines in agglomerates in bigger size blast furnaces can increase its productivity and bring down cost/tss
The current steel production through BF/BOF:DRI:others is 60:33:7

DSTI/SU/SC(2006)43
9
15
Domestic DRI production : Trend and Forecast
Increasing DRI production may lead to faster depletion of high quality lumpy ore reserves
0
10
20
30
40
88 91 94 97 '00 '03 '04 '05 '06 '20
mill
ion
tonn
es
Capacity Production
Growing @~7%
Source: Tata Steel analysis
16
NATIONAL STEEL GROWTH
0
100
200
300
400
500
600
700
800
900
1000
2004
-05
2006
-07
2008
-09
2010
-11
2012
-13
2014
-15
2016
-17
2018
-19
2020
-21
2022
-23
2024
-25
2026
-27
2028
-29
2030
-31
2032
-33
2034
-35
2036
-37
2038
-39
2040
-41
2042
-43
2044
-45
2046
-47
2048
-49
2050
-51
Iron
Ore
Pro
duct
ion
MTP
A
-15000.00
-10000.00
-5000.00
0.00
5000.00
10000.00
15000.00
Min
eabl
eR
eser
ves
(Mt)
CAGR=3 CAGR=4 CAGR=5 CAGR=6 CAGR=7
Exports of iron ore =50 Mtpa
With expected CAGR of ~7% and exports at 50 With expected CAGR of ~7% and exports at 50 mtpamtpa, , India will become an importer of iron ore in next 40 years.India will become an importer of iron ore in next 40 years.
Reserves in MT
Iron Ore Production
in MT
Most of the iron ore reserves are in reserve forest and environment sensitive areas making the actual availability of reserves much less

DSTI/SU/SC(2006)43
10
17
Imperative Imperative –– Need for conservation and resource Need for conservation and resource enhancementenhancement
Challenges
- Selective mining of high grade lumpy ores (DRI).
- Many low volume producers
- Mismatch in agglomeration capacity and fines generation.
- Lower production (33%) routed through beneficiation.
- Increasing exports.
Conservation ….for futureo Scientific Miningo Agglomeration capacityo Use of pellets for DRIo Beneficiation. o Technology for using
Slimeso Restricting exports.
Enhancement …o Detailed / Scientific
Exploration
18
Proven: 8Indicated: 6Total : 14
Proven: 5Indicated: 2
Total : 7
Proven: 9Indicated: 25
Total : 34
Proven: 14Indicated: 30
Total : 44
Proven: 11Indicated: 12
Total : 23
Proven: 35Indicated: 30
Total : 65
Proven: 7Indicated: 8Total : 15
246Total46Inferred110Indicated90Proven
Billion tonnes
Indian Coal Reserves

DSTI/SU/SC(2006)43
11
19Geological Survey of India : As of 1.1.2001
86%
3%
14%11%
Non-Coking Prime Coking Med Coking
Coking
Domestic Coking Coal Domestic Coking Coal
The Indian Coal, both coking and non coking is characterized by high ash and low washability index.
Coal Reserves, BT
6Prime Coking
246Total212Non Coking
28 Semi-CokingCoking Coal Producers
0.5Others3.3Tata Steel5.8CIL
Washed Coal Ash
18%CCL13%Tata Steel
18%BCCL
8.3 8.2 8.18.18.18.2
15.1 16.8
21.020.020.018.4
0
5
10
15
20
25
2001-02 2002-03 2003-04 2004-05 2005-06 2006-07
MT
PA
Indigenous Coal Imported Coal
Imports of Coking Coal to increase due to low Imports of Coking Coal to increase due to low Indigenous availability Indigenous availability
Source: 10th Plan report
28
62
88
8 10 13
0
20
40
60
80
100
2005 2015 2025
MT
PA
Demand Domestic Supply
- The additional demand for coking coal will be 70 mt by 2020 for 110 mt steel demand as per national steel policy
- For coking coal, dependence on imports to continue
Coking Coal
DSTI/SU/SC(2006)43
12
21
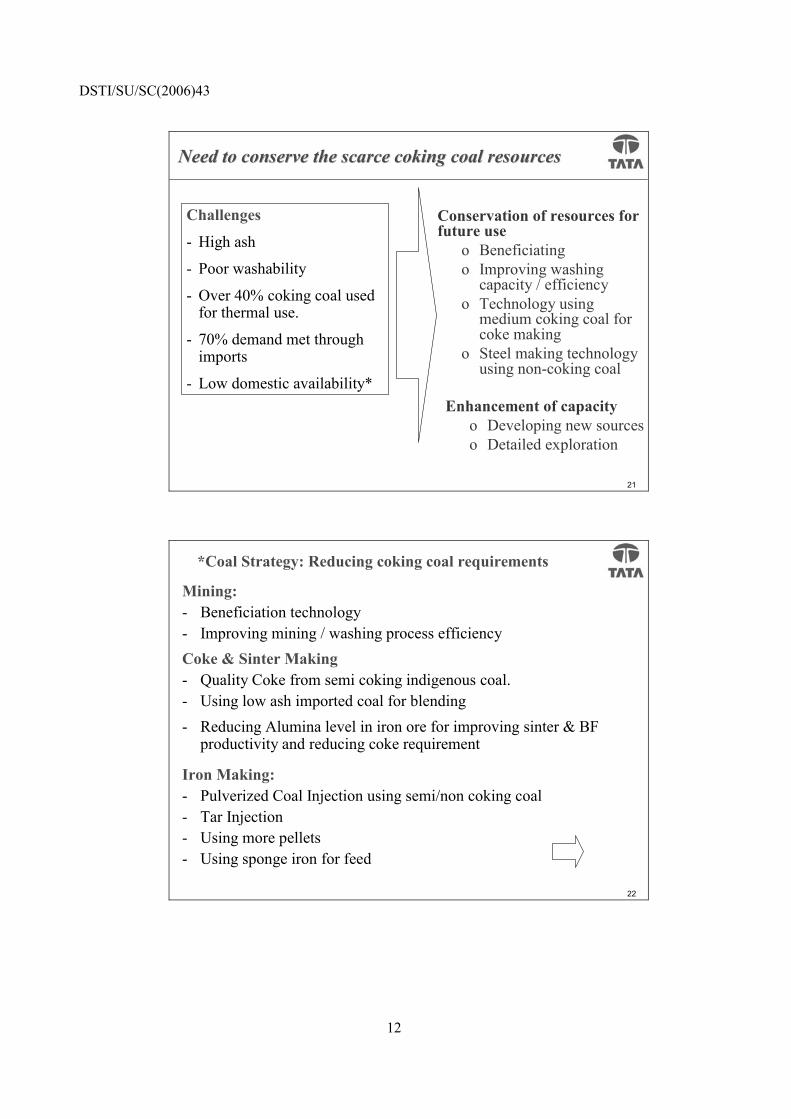
Need to conserve the scarce coking coal resourcesNeed to conserve the scarce coking coal resources
Challenges
- High ash
- Poor washability
- Over 40% coking coal used for thermal use.
- 70% demand met through imports
- Low domestic availability*
Conservation of resources for future use
o Beneficiating o Improving washing
capacity / efficiencyo Technology using
medium coking coal for coke making
o Steel making technology using non-coking coal
Enhancement of capacityo Developing new sourceso Detailed exploration
22
*Coal Strategy: Reducing coking coal requirements
Mining:- Beneficiation technology - Improving mining / washing process efficiencyCoke & Sinter Making- Quality Coke from semi coking indigenous coal.- Using low ash imported coal for blending- Reducing Alumina level in iron ore for improving sinter & BF
productivity and reducing coke requirement
Iron Making:- Pulverized Coal Injection using semi/non coking coal- Tar Injection- Using more pellets - Using sponge iron for feed

DSTI/SU/SC(2006)43
13
23
Limestone Limestone
• SMS Grade available in Rajasthan and Himalayan regions.
• While Environment and logistics constrains Himalyanexploitation, high freight from Rajasthan is adverse.
• Stringent quality requirement further restricts availability
Therefore, Dependence on imports for steel grade limestone to continue…
7 bt15 bt160 btIndiaAbundantWorld
SMS gradeBF gradeLimestone Reserves
22 mt7 mtSMS grade9.5 mt3.1 mtBF grade
Requirement in 2020Current Requirement
24
Chrome OreChrome Ore
• Ferro-Chrome industry in India is highly fragmented • >98% Chrome ore reserves in Orissa.• Chrome ore tons expected to ~ 10 mt by 2020.• High conversion cost to Ferro Chrome due to high power cost
Globally competitive power tariffs to avoid shift to countries where power is cheaper.
0.6 6
Production Fe Cr
3.2 115 India18 11068 World
Production OreCr Ore ReservesFigures in million tonnes

DSTI/SU/SC(2006)43
14
25
Manganese Manganese
• International market for Mn alloys have dipped in recent years• Manganese ore tons expected to grow to 4.5 mt by 2020 • The usage of Mn alloys for steel making is limited by
– Low Mn content and high phos in Mn Ores– High power cost for conversion
Therefore ….• Need to explore and develop more high grade Mn resources • Beneficiation to improve the lower grade coupled with sintering
0.7110.5
Production FeMn, SiMn
1.4 406India29 5000World
Production OreMn Ore/Reserves
Figures in million tonnes
Source: Mineral Commodities Summary: 2002, IBM
26
Steel Industry
- Global
- Indian
Raw materials for Steel
Policy / Legislation
Infrastructure
Conclusion
Presentation OutlinePresentation Outline
DSTI/SU/SC(2006)43
15
27
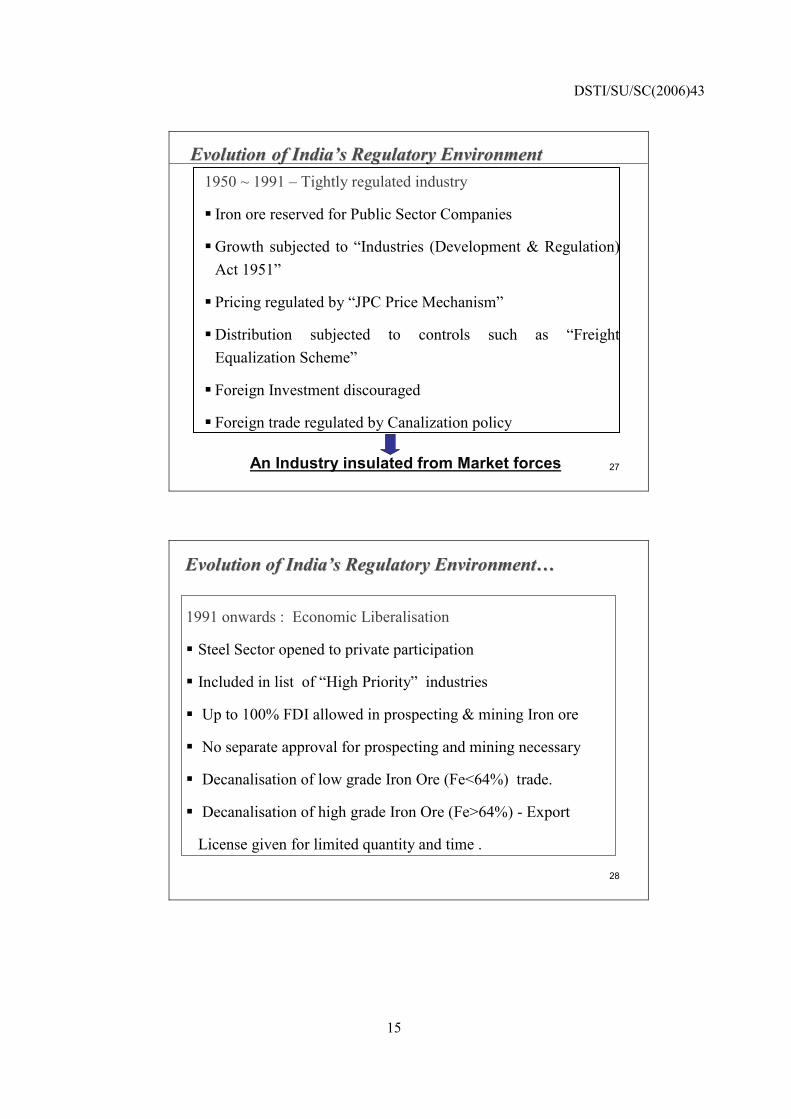
1950 ~ 1991 – Tightly regulated industry
Iron ore reserved for Public Sector Companies
Growth subjected to “Industries (Development & Regulation) Act 1951”
Pricing regulated by “JPC Price Mechanism”
Distribution subjected to controls such as “Freight Equalization Scheme”
Foreign Investment discouraged
Foreign trade regulated by Canalization policy
An Industry insulated from Market forces
EvolutionEvolution of Indiaof India’’s Regulatory Environments Regulatory Environment
28
Evolution of IndiaEvolution of India’’s Regulatory Environments Regulatory Environment……
1991 onwards : Economic Liberalisation
Steel Sector opened to private participation
Included in list of “High Priority” industries
Up to 100% FDI allowed in prospecting & mining Iron ore
No separate approval for prospecting and mining necessary
Decanalisation of low grade Iron Ore (Fe<64%) trade.
Decanalisation of high grade Iron Ore (Fe>64%) - Export
License given for limited quantity and time .

DSTI/SU/SC(2006)43
16
29
Challenges & Policies for meeting growth demandChallenges & Policies for meeting growth demand
Challenges
- Fragmented capacities
- Unscientific operations
- Inadequate power & transport infrastructure
- Delay in grant / renewal of mineral leases
Policy Reforms under consideration
o Minimum production levels for lease grant
o Scientific Mining and Mineral Beneficiation
o Lease grant solely on the basis of technical & financial capability
o FDI & private sector participation for infrastructure development
o Time bound grant/renewal process
30
Challenges & Policies for meeting the growth demandChallenges & Policies for meeting the growth demand
Challenges
- Long drawn process for land/forest/ environmental clearance
- Socio/political pressures
- Limited iron ore / coking coal reserves
Policies reforms under considerationo Creation of land bank / private
sector participation in afforestationo Social / Environment cost to be seen
in Long Term perspectiveo Transparent implementation of the
lawso Technology / private participation
for detailed explorationo Large area prospecting licenseo Linking iron ore resources to
integrated and other steel plantso De-nationalization of coal mineso De-reserving areas for private sector
for a level playing field
DSTI/SU/SC(2006)43
17
31
Steel Industry
- Global
- Indian
Raw materials for Steel
Policy / Legislation
Infrastructure
Conclusion
Presentation OutlinePresentation Outline
32
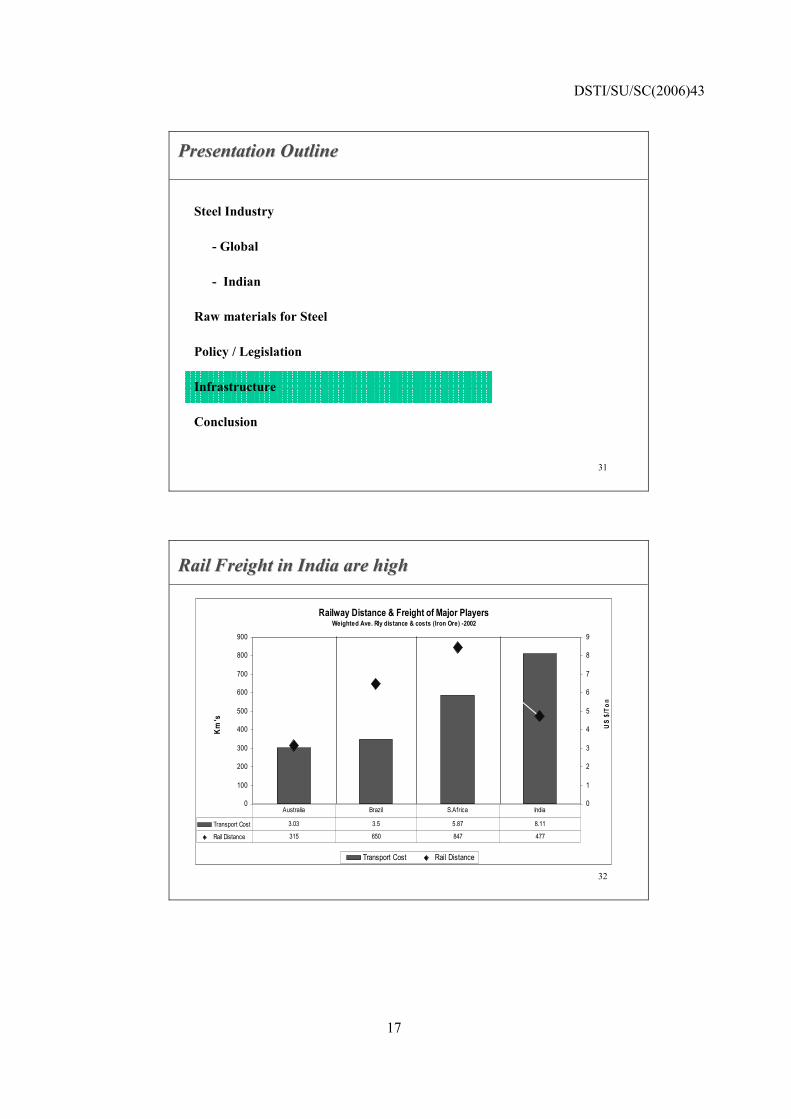
Railway Distance & Freight of Major PlayersWeighted Ave. Rly distance & costs (Iron Ore) -2002
0
100
200
300
400
500
600
700
800
900
Km's
US
$/To
n
0
1
2
3
4
5
6
7
8
9
Transport Cost Rail Distance
Transport Cost 3.03 3.5 5.87 8.11
Rail Distance 315 650 847 477
Australia Brazil S.Africa India
Rail Freight in India are highRail Freight in India are high
DSTI/SU/SC(2006)43
18
33
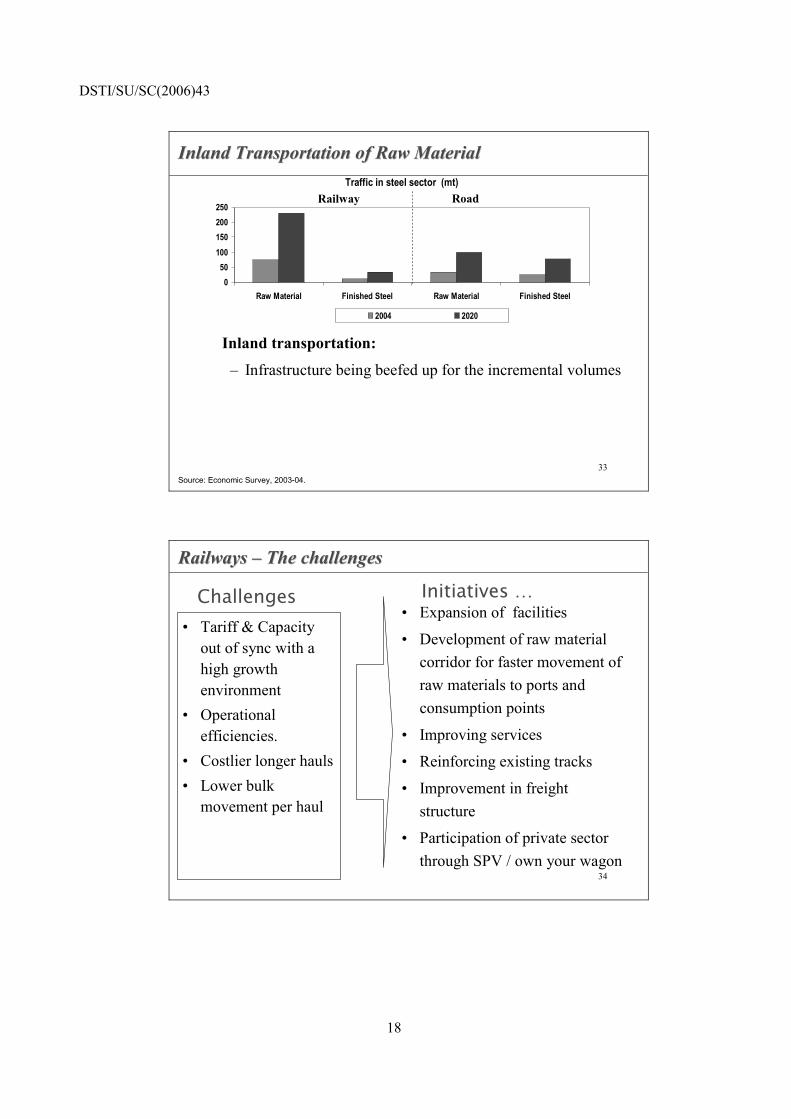
Inland Transportation of Raw MaterialInland Transportation of Raw Material
Inland transportation:
– Infrastructure being beefed up for the incremental volumes
Source: Economic Survey, 2003-04.
Traffic in steel sector (mt)
050
100150200250
Raw Material Finished Steel Raw Material Finished Steel
2004 2020
Railway Road
34
Railways Railways –– The challengesThe challenges
• Tariff & Capacity out of sync with a high growth environment
• Operational efficiencies.
• Costlier longer hauls• Lower bulk
movement per haul
• Expansion of facilities
• Development of raw material corridor for faster movement of raw materials to ports and consumption points
• Improving services
• Reinforcing existing tracks
• Improvement in freight structure
• Participation of private sector through SPV / own your wagon
Challenges Initiatives …
DSTI/SU/SC(2006)43
19
35
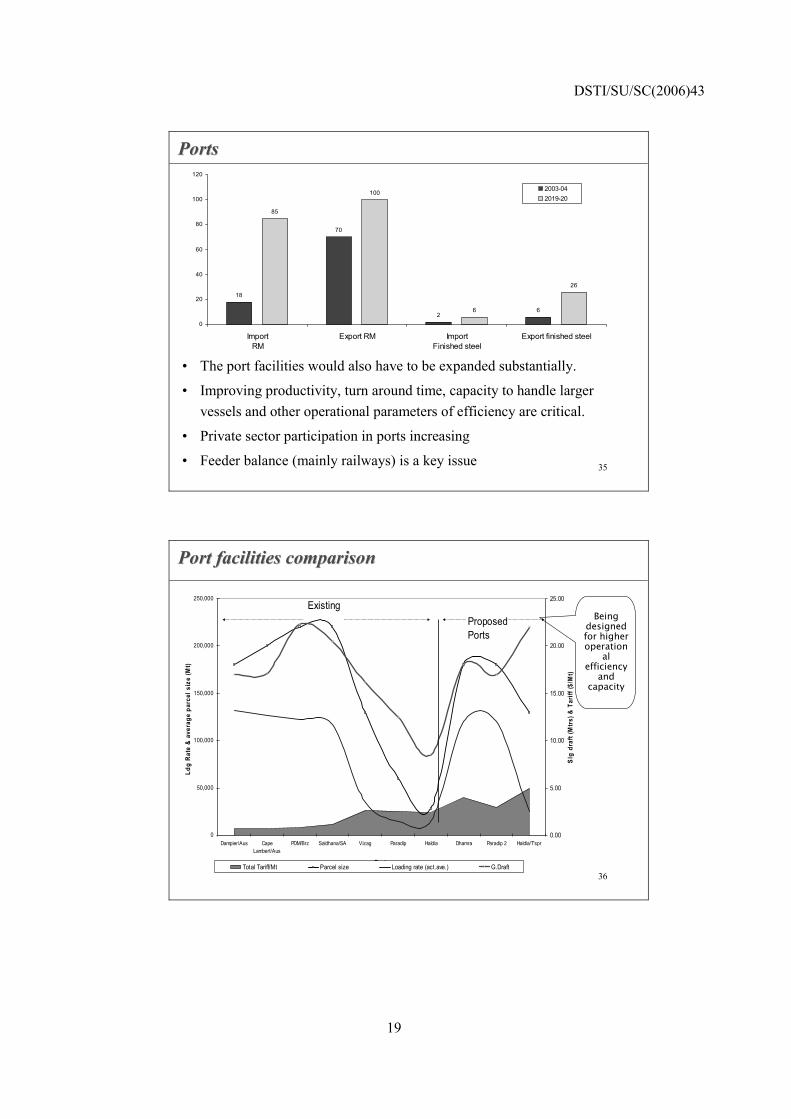
PortsPorts
• The port facilities would also have to be expanded substantially.
• Improving productivity, turn around time, capacity to handle larger vessels and other operational parameters of efficiency are critical.
• Private sector participation in ports increasing
• Feeder balance (mainly railways) is a key issue
18
70
26
85
100
6
26
0
20
40
60
80
100
120
ImportRM
Export RM ImportFinished steel
Export finished steel
2003-042019-20
36
Port facilities comparisonPort facilities comparison
0
50,000
100,000
150,000
200,000
250,000
Dampier/Aus CapeLambert/Aus
PDM/Brz Saldhana/SA Vizag Paradip Haldia Dhamra Paradip 2 Haldia/T'spr
Ports
Ldg
Rat
e &
ave
rage
par
cel s
ize
(Mt)
0.00
5.00
10.00
15.00
20.00
25.00
Slg
dra
ft (M
trs)
& T
ariff
($/M
t)
Total Tariff/Mt Parcel size Loading rate (act.ave.) G.Draft
Existing Proposed Ports
Being designed for higher operation
al efficiency
and capacity
DSTI/SU/SC(2006)43
20
37
Steel Industry
- Global
- Indian
Raw materials for Steel
Policy / Legislation
Infrastructure
Conclusion
Presentation OutlinePresentation Outline
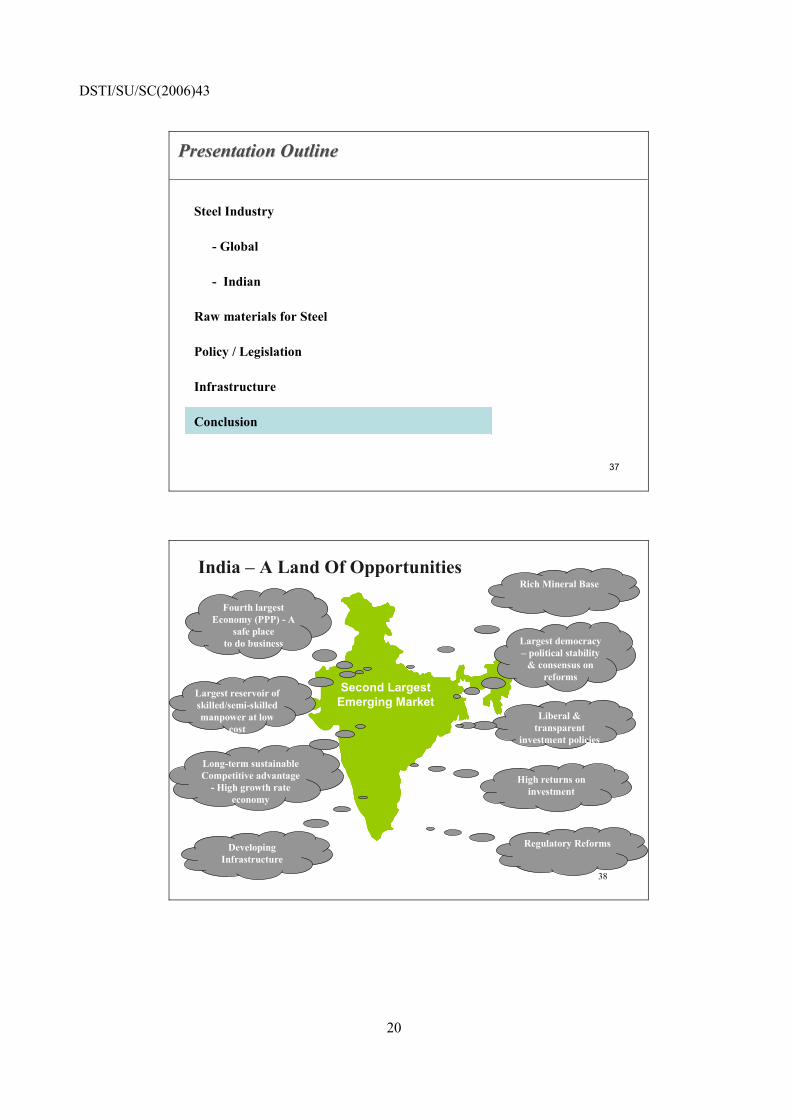
38
Second Largest Emerging Market
Largest democracy – political stability
& consensus on reforms
Liberal & transparent
investment policies
High returns on investment
Fourth largest Economy (PPP) - A
safe place to do business
Largest reservoir of skilled/semi-skilled manpower at low
cost
Long-term sustainableCompetitive advantage
- High growth rate economy
India – A Land Of OpportunitiesIndia – A Land Of OpportunitiesRich Mineral Base
Regulatory ReformsDeveloping Infrastructure
Recommended