
1PROPERTY OVERVIEW
FOREST HILL BUSINESS AIRPARK
Forest Hill Business Airpark
M E D I C A L / R E TA I L F O R L E A S E2200 COMMERCE ROAD, FOREST HILL, MD
Christopher Wright+1 443 914 2600

2PROPERTY OVERVIEW
FOREST HILL BUSINESS AIRPARK

FOREST HILL BUSINESS AIRPARK
1PROPERTYOVERVIEW
2HARFORD COUNTYQUICK FACTS
Table ofContents
3MARKETOVERVIEW
4FOREST HILLDEMOGRAPHICS
5BUILDINGRENDERINGS
6SITEPLANS

4PROPERTY OVERVIEW
FOREST HILL BUSINESS AIRPARK FOREST HILL BUSINESS AIRPARK
1PROPERTYOVERVIEW

5PROPERTY OVERVIEW
FOREST HILL BUSINESS AIRPARK FOREST HILL BUSINESS AIRPARK FOREST HILL BUSINESS AIRPARK
Medical/Retail Pad Site
AVAILABLE
10.1 Acre Site (Can be subdivided)
ZONING
CI Zoning
RENTAL RATE
Negotiable
TRAFFIC COUNT
11,251 AADT (East West Hwy)
5,262 AADT (E Jarrettsville Rd)
HIGHLIGHTS
800 feet of road visibility
Utilities on-site, regional storm water management off site
Easy access from MD Route 23
FOR LEASE

6PROPERTY OVERVIEW
FOREST HILL BUSINESS AIRPARK FOREST HILL BUSINESS AIRPARK
E. JARRETTSVILLE ROAD
INDUSTRY LANE
CO
MM
ER
CE
RO
AD
ROUTE 23
1 23 4
56 7
8
9
11
12
131415
16
17 18 19
20
21 22 23 24
25
26 27
28
29
30
31 32
Medical/Retail
Pad Site
MAP LOCATION BUILDING TOTAL SF
1 107 E. Jarrettsville Road 11,200 sf
2 109 E. Jarrettsville Road 17,525 sf
3 213 E. Jarrettsville Road 19,200 sf
4 217 E. Jarrettsville Road 19,200 sf
5 2201 Commerce Road 16,200 sf
6 2203 Commerce Road 20,640 sf
7 2203A Commerce Road 17,280 sf
8 2209 Commerce Road 24,000 sf
9 2211 Commerce Road 24,000 sf
10 2216 Commerce Road 16,000 sf
11 2217 Commerce Road 21,000 sf
12 2218 Commerce Road 15,000 sf
13 2220 Commerce Road 16,000 sf
14 2222 Commerce Road 16,000 sf
15 98 Industry Lane 11,200 sf
16 104 Industry Lane 14,400 sf
17 108 Industry Lane 5,000 sf
18 108A Industry Lane 11,200 sf
19 110 Industry Lane 13,780 sf
20 117 Industry Lane 11,000 sf
21 124 Industry Lane 18,000 sf
22 126 Industry Lane 18,000 sf
23 128 Industry Lane 12,850 sf
24 130 Industry Lane 11,000 sf
25 131 Industry Lane 16,200 sf
26 132B Industry Lane 15,000 sf
27 132A Industry Lane 16,000 sf
28 133 Industry Lane 16,200 sf
29 134 Industry Lane 15,000 sf
30 135 Industry Lane 16,200 sf
31 136 Industry Lane 15,000 sf
32 138 Industry Lane 15,000 sf
10

7HARFORD COUNTY QUICK FACTS
FOREST HILL BUSINESS AIRPARK FOREST HILL BUSINESS AIRPARK
2HARFORD COUNTYQUICK FACTS
8HARFORD COUNTY QUICK FACTS
FOREST HILL BUSINESS AIRPARK FOREST HILL BUSINESS AIRPARKHARFORD COUNTY
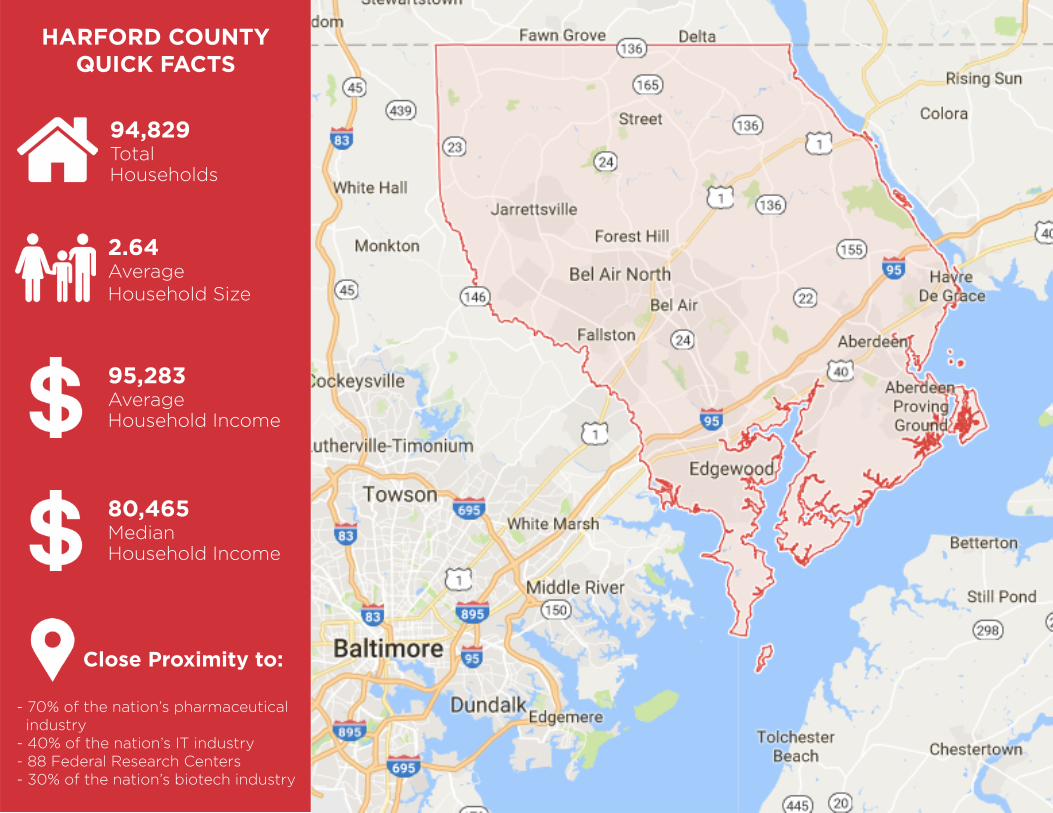
QUICK FACTS
94,829TotalHouseholds
2.64AverageHousehold Size
95,283AverageHousehold Income
Close Proximity to:
80,465MedianHousehold Income
- 70% of the nation’s pharmaceutical industry- 40% of the nation’s IT industry- 88 Federal Research Centers- 30% of the nation’s biotech industry

9MARKET OVERVIEW
FOREST HILL BUSINESS AIRPARK
3MARKETOVERVIEW

10MARKET OVERVIEW
FOREST HILL BUSINESS AIRPARK
Street View Map
Site

11MARKET OVERVIEW
FOREST HILL BUSINESS AIRPARK
36,112(2015 ADT)
28,692(2015 ADT)
29,66
2(20
15 AD
T)
Harford MallAnnex
MacPhailCrossing
Bel AirTown Center
TollgateMarketplace
Bel AirPlaza
HarfordMall
HarfordMall
23,86
2(20
15 ADT)
15,450(2015 ADT)
Rock SpringShopping Center
Bel AirNorth Village
AmyclaeBusiness Center
GreenbrierShopping Center
Del PlazaShopping Center
Site
Aerial View Map
12MARKET OVERVIEW
FOREST HILL BUSINESS AIRPARK
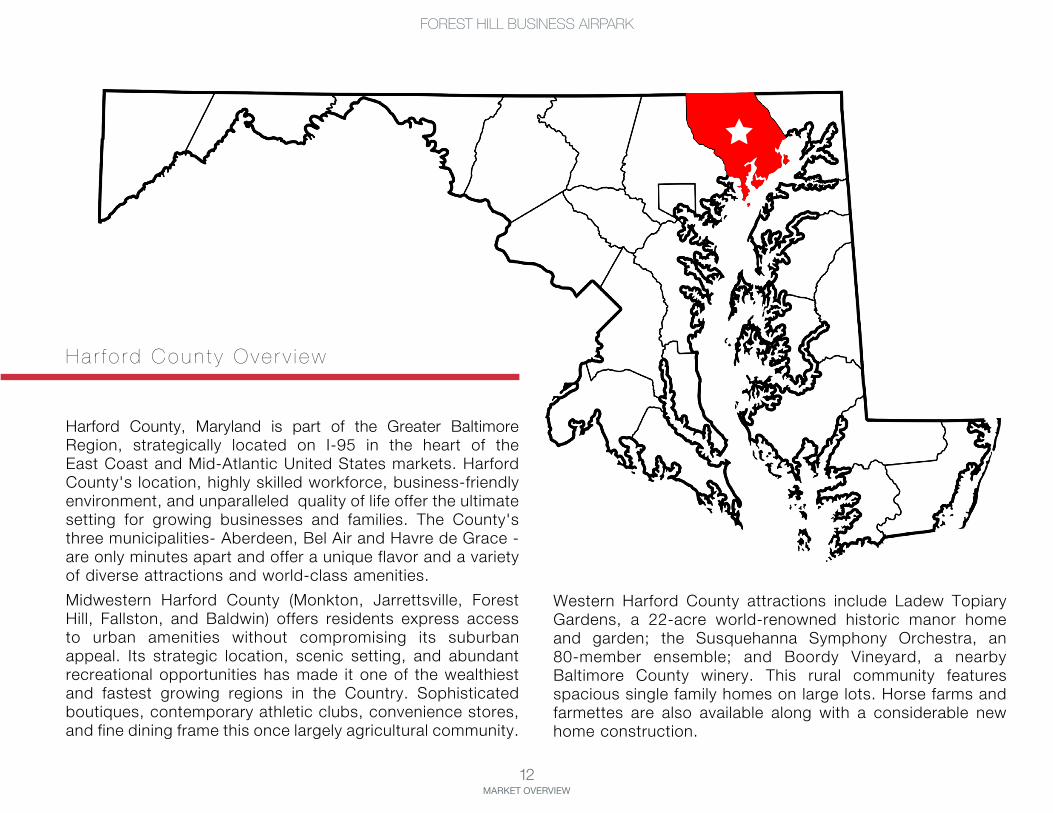
H a r f o r d C o u n t y O v e r v i e w
Harford County, Maryland is part of the Greater Baltimore Region, strategically located on I-95 in the heart of the East Coast and Mid-Atlantic United States markets. Harford County's location, highly skilled workforce, business-friendly environment, and unparalleled quality of life offer the ultimate setting for growing businesses and families. The County's three municipalities- Aberdeen, Bel Air and Havre de Grace - are only minutes apart and offer a unique flavor and a variety of diverse attractions and world-class amenities.Midwestern Harford County (Monkton, Jarrettsville, Forest Hill, Fallston, and Baldwin) offers residents express access to urban amenities without compromising its suburban appeal. Its strategic location, scenic setting, and abundant recreational opportunities has made it one of the wealthiest and fastest growing regions in the Country. Sophisticated boutiques, contemporary athletic clubs, convenience stores, and fine dining frame this once largely agricultural community.
Western Harford County attractions include Ladew Topiary Gardens, a 22-acre world-renowned historic manor home and garden; the Susquehanna Symphony Orchestra, an 80-member ensemble; and Boordy Vineyard, a nearby Baltimore County winery. This rural community features spacious single family homes on large lots. Horse farms and farmettes are also available along with a considerable new home construction.

13DEMOGRAPHICS
FOREST HILL BUSINESS AIRPARK
4FOREST HILLDEMOGRAPHICS

14DEMOGRAPHICS
FOREST HILL BUSINESS AIRPARK
Demographic and Income Profile21050 (Forest Hill) Prepared by Esri21050 (Forest Hill)Geography: ZIP Code
Summary Census 2010 2017 2022Population 18,586 19,085 19,471Households 6,526 6,655 6,768Families 5,068 5,150 5,230Average Household Size 2.81 2.83 2.84Owner Occupied Housing Units 5,794 5,823 5,942Renter Occupied Housing Units 732 832 826Median Age 41.2 43.0 44.3
Trends: 2017 - 2022 Annual Rate Area State NationalPopulation 0.40% 0.76% 0.83%Households 0.34% 0.68% 0.79%Families 0.31% 0.62% 0.71%Owner HHs 0.41% 0.71% 0.72%Median Household Income 1.33% 1.70% 2.12%
2017 2022 Households by Income Number Percent Number Percent
<$15,000 241 3.6% 246 3.6%$15,000 - $24,999 320 4.8% 307 4.5%$25,000 - $34,999 301 4.5% 280 4.1%$35,000 - $49,999 532 8.0% 486 7.2%$50,000 - $74,999 973 14.6% 890 13.2%$75,000 - $99,999 1,065 16.0% 1,002 14.8%$100,000 - $149,999 1,525 22.9% 1,592 23.5%$150,000 - $199,999 834 12.5% 949 14.0%$200,000+ 864 13.0% 1,016 15.0%
Median Household Income $96,836 $103,465Average Household Income $118,081 $131,806Per Capita Income $41,619 $46,250
Census 2010 2017 2022 Population by Age Number Percent Number Percent Number Percent
0 - 4 927 5.0% 862 4.5% 859 4.4%5 - 9 1,338 7.2% 1,108 5.8% 1,018 5.2%10 - 14 1,643 8.8% 1,400 7.3% 1,227 6.3%15 - 19 1,386 7.5% 1,347 7.1% 1,211 6.2%20 - 24 918 4.9% 1,042 5.5% 908 4.7%25 - 34 1,511 8.1% 2,071 10.9% 2,259 11.6%35 - 44 2,803 15.1% 2,173 11.4% 2,405 12.4%45 - 54 3,310 17.8% 3,118 16.3% 2,656 13.6%55 - 64 2,206 11.9% 2,780 14.6% 3,079 15.8%65 - 74 1,369 7.4% 1,801 9.4% 2,156 11.1%75 - 84 833 4.5% 956 5.0% 1,233 6.3%
85+ 344 1.9% 427 2.2% 460 2.4%Census 2010 2017 2022
Race and Ethnicity Number Percent Number Percent Number PercentWhite Alone 17,440 93.8% 17,627 92.4% 17,705 90.9%Black Alone 498 2.7% 579 3.0% 662 3.4%American Indian Alone 21 0.1% 23 0.1% 25 0.1%Asian Alone 301 1.6% 449 2.4% 585 3.0%Pacific Islander Alone 1 0.0% 1 0.0% 1 0.0%Some Other Race Alone 54 0.3% 70 0.4% 89 0.5%Two or More Races 270 1.5% 336 1.8% 404 2.1%
Hispanic Origin (Any Race) 351 1.9% 491 2.6% 643 3.3%Data Note: Income is expressed in current dollars.
Source: U.S. Census Bureau, Census 2010 Summary File 1. Esri forecasts for 2017 and 2022.
October 26, 2017
©2017 Esri Page 1 of 2
Demographic and Income Profile21050 (Forest Hill) Prepared by Esri21050 (Forest Hill)Geography: ZIP Code
AreaStateUSA
Trends 2017-2022Trends 2017-2022
Ann
ual R
ate
(in
perc
ent)
21.81.61.41.2
10.80.60.40.2
0Population Households Families Owner HHs Median HH Income
20172022
Population by AgePopulation by Age
Perc
ent
16
14
12
10
8
6
4
2
00-4 5-9 10-14 15-19 20-24 25-34 35-44 45-54 55-64 65-74 75-84 85+
2017 Household Income 2017 Household Income
<$15K3.6%
$15K - $24K4.8%
$25K - $34K4.5%
$35K - $49K8.0%
$50K - $74K14.6%
$75K - $99K16.0%
$100K - $149K22.9%
$150K - $199K12.5%
$200K+13.0%
2017 Population by Race2017 Population by Race
Perc
ent
90
80
70
60
50
40
30
20
10
0White Black Am. Ind. Asian Pacific Other Two+
2017 Percent Hispanic Origin: 2.6%
Source: U.S. Census Bureau, Census 2010 Summary File 1. Esri forecasts for 2017 and 2022.
October 26, 2017
©2017 Esri Page 2 of 2

15DEMOGRAPHICS
FOREST HILL BUSINESS AIRPARK
Executive Summary21050 (Forest Hill) Prepared by Esri21050 (Forest Hill)Geography: ZIP Code
21050 (Forest...Population
2000 Population 14,7962010 Population 18,5862017 Population 19,0852022 Population 19,4712000-2010 Annual Rate 2.31%2010-2017 Annual Rate 0.37%2017-2022 Annual Rate 0.40%2017 Male Population 48.4%2017 Female Population 51.6%2017 Median Age 43.0
In the identified area, the current year population is 19,085. In 2010, the Census count in the area was 18,586. The rate of change since 2010 was 0.37% annually. The five-year projection for the population in the area is 19,471 representing a change of 0.40% annually from 2017 to 2022. Currently, the population is 48.4% male and 51.6% female.
Median Age
The median age in this area is 43.0, compared to U.S. median age of 38.2.Race and Ethnicity
2017 White Alone 92.4%2017 Black Alone 3.0%2017 American Indian/Alaska Native Alone 0.1%2017 Asian Alone 2.4%2017 Pacific Islander Alone 0.0%2017 Other Race 0.4%2017 Two or More Races 1.8%2017 Hispanic Origin (Any Race) 2.6%
Persons of Hispanic origin represent 2.6% of the population in the identified area compared to 18.1% of the U.S. population. Persons of Hispanic Origin may be of any race. The Diversity Index, which measures the probability that two people from the same area will be from different race/ethnic groups, is 18.8 in the identified area, compared to 64.0 for the U.S. as a whole.
Households2000 Households 5,2102010 Households 6,5262017 Total Households 6,6552022 Total Households 6,7682000-2010 Annual Rate 2.28%2010-2017 Annual Rate 0.27%2017-2022 Annual Rate 0.34%2017 Average Household Size 2.83
The household count in this area has changed from 6,526 in 2010 to 6,655 in the current year, a change of 0.27% annually. The five-year projection of households is 6,768, a change of 0.34% annually from the current year total. Average household size is currently 2.83, compared to 2.81 in the year 2010. The number of families in the current year is 5,150 in the specified area.
Data Note: Income is expressed in current dollarsSource: U.S. Census Bureau, Census 2010 Summary File 1. Esri forecasts for 2017 and 2022. Esri converted Census 2000 data into 2010 geography.
October 26, 2017
©2017 Esri Page 1 of 2
Executive Summary21050 (Forest Hill) Prepared by Esri21050 (Forest Hill)Geography: ZIP Code
21050 (Forest...Median Household Income
2017 Median Household Income $96,8362022 Median Household Income $103,4652017-2022 Annual Rate 1.33%
Average Household Income
2017 Average Household Income $118,0812022 Average Household Income $131,8062017-2022 Annual Rate 2.22%
Per Capita Income2017 Per Capita Income $41,6192022 Per Capita Income $46,2502017-2022 Annual Rate 2.13%
Households by IncomeCurrent median household income is $96,836 in the area, compared to $56,124 for all U.S. households. Median household income is projected to be $103,465 in five years, compared to $62,316 for all U.S. households
Current average household income is $118,081 in this area, compared to $80,675 for all U.S. households. Average household income is projected to be $131,806 in five years, compared to $91,585 for all U.S. households
Current per capita income is $41,619 in the area, compared to the U.S. per capita income of $30,820. The per capita income is projected to be $46,250 in five years, compared to $34,828 for all U.S. households Housing
2000 Total Housing Units 5,3792000 Owner Occupied Housing Units 4,5282000 Renter Occupied Housing Units 6822000 Vacant Housing Units 169
2010 Total Housing Units 6,7532010 Owner Occupied Housing Units 5,7942010 Renter Occupied Housing Units 7322010 Vacant Housing Units 227
2017 Total Housing Units 6,9442017 Owner Occupied Housing Units 5,8232017 Renter Occupied Housing Units 8322017 Vacant Housing Units 289
2022 Total Housing Units 7,1062022 Owner Occupied Housing Units 5,9422022 Renter Occupied Housing Units 8262022 Vacant Housing Units 338
Currently, 83.9% of the 6,944 housing units in the area are owner occupied; 12.0%, renter occupied; and 4.2% are vacant. Currently, in the U.S., 55.6% of the housing units in the area are owner occupied; 33.1% are renter occupied; and 11.3% are vacant. In 2010, there were 6,753 housing units in the area - 85.8% owner occupied, 10.8% renter occupied, and 3.4% vacant. The annual rate of change in housing units since 2010 is 1.25%. Median home value in the area is $357,582, compared to a median home value of $207,344 for the U.S. In five years, median value is projected to change by 1.31% annually to $381,631.
Data Note: Income is expressed in current dollarsSource: U.S. Census Bureau, Census 2010 Summary File 1. Esri forecasts for 2017 and 2022. Esri converted Census 2000 data into 2010 geography.
October 26, 2017
©2017 Esri Page 2 of 2

16DEMOGRAPHICS
FOREST HILL BUSINESS AIRPARK
Business Summary21050 (Forest Hill) Prepared by Esri21050 (Forest Hill)Geography: ZIP Code
Data for all businesses in area 21050 (Forest...Total Businesses: 584Total Employees: 5,617Total Residential Population: 19,085Employee/Residential Population Ratio (per 100 Residents) 29
Businesses Employeesby SIC Codes Number Percent Number PercentAgriculture & Mining 26 4.5% 149 2.7%Construction 93 15.9% 830 14.8%Manufacturing 24 4.1% 169 3.0%Transportation 13 2.2% 112 2.0%Communication 0 0.0% 0 0.0%Utility 0 0.0% 0 0.0%Wholesale Trade 29 5.0% 218 3.9%
Retail Trade Summary 86 14.7% 1,025 18.2%Home Improvement 8 1.4% 108 1.9%General Merchandise Stores 4 0.7% 117 2.1%Food Stores 11 1.9% 240 4.3%Auto Dealers, Gas Stations, Auto Aftermarket 6 1.0% 52 0.9%Apparel & Accessory Stores 1 0.2% 2 0.0%Furniture & Home Furnishings 12 2.1% 60 1.1%Eating & Drinking Places 19 3.3% 328 5.8%Miscellaneous Retail 25 4.3% 118 2.1%
Finance, Insurance, Real Estate Summary 49 8.4% 477 8.5%Banks, Savings & Lending Institutions 13 2.2% 290 5.2%Securities Brokers 3 0.5% 9 0.2%Insurance Carriers & Agents 10 1.7% 45 0.8%Real Estate, Holding, Other Investment Offices 23 3.9% 133 2.4%
Services Summary 220 37.7% 2,464 43.9%Hotels & Lodging 1 0.2% 10 0.2%Automotive Services 16 2.7% 84 1.5%Motion Pictures & Amusements 22 3.8% 102 1.8%Health Services 27 4.6% 769 13.7%Legal Services 2 0.3% 7 0.1%Education Institutions & Libraries 7 1.2% 194 3.5%Other Services 145 24.8% 1,298 23.1%
Government 12 2.1% 158 2.8%
Unclassified Establishments 32 5.5% 15 0.3%
Totals 584 100.0% 5,617 100.0%
Source: Copyright 2017 Infogroup, Inc. All rights reserved. Esri Total Residential Population forecasts for 2017.Date Note: Data on the Business Summary report is calculated using Esri’s Data allocation method which uses census block groups to allocate business summary data to custom areas.
October 26, 2017
©2017 Esri Page 1 of 2

17BUILDING RENDERINGS
FOREST HILL BUSINESS AIRPARK
5BUILDINGRENDERINGS

18BUILDING RENDERINGS
FOREST HILL BUSINESS AIRPARK

19BUILDING RENDERINGS
FOREST HILL BUSINESS AIRPARK

20BUILDING RENDERINGS
FOREST HILL BUSINESS AIRPARK

21SITE PLANS
FOREST HILL BUSINESS AIRPARK
6SITEPLANS

22SITE PLANS
FOREST HILL BUSINESS AIRPARK
OPTION 1

23SITE PLANS
FOREST HILL BUSINESS AIRPARK
OPTION 2

24PROPERTY OVERVIEW
FOREST HILL BUSINESS AIRPARK
FOR MORE INFORMATION PLEASE CONTACT:
CHRISTOPHER WRIGHT443 914 [email protected]
www.naiklnb.com | 410 321 0100
Recommended


![CRM [E-Bsiness]](https://img.pdfslide.net/doc/110x75/5457483caf79594e128b4802/crm-e-bsiness.jpg)
