A9.10-1
Appendix 9.10: Analysis of retail supply profitability – ROCE
Contents
Page
Purpose of this appendix ............................................................................................ 1
Introduction ................................................................................................................ 1
Scope of analysis and principles of economic profitability .......................................... 2
Adjustments to firms’ financial information ............................................................... 10
Results of our analysis ............................................................................................. 50
Annex A: Managing collateral and business risks .................................................... 62
Supplement 1: Actual trading and collateral arrangements of the Six Large Energy
Firms ........................................................................................................................ 86
Supplement 2: Evidence on the trading arrangements and approaches to business
risk management of independent energy suppliers .................................................. 90
Purpose of this appendix
1. In this appendix, we set out our analysis of the profitability of the retail supply
of gas and electricity in GB. The profitability of electricity generation is
analysed separately. This analysis forms one part of our assessment of
whether the prices observed in the retail supply markets are above the level
that we would expect in a well-functioning market (ie one where competition
operates effectively so as to allow firms to earn limited, if any, profits in
excess of the cost of capital). We have had to make a number of assumptions
and judgements in coming to a view on the level of profits earned by the firms
that are active in this sector. As a result, we consider our results to be
indicative rather than precise estimates. This appendix should be read in
conjunction with the other analyses we have undertaken in order to assess
whether prices in retail energy are above the level that would be expected in a
well-functioning market.
Introduction
2. On 8 December 2014, we published, and consulted on, a working paper
setting out our proposed approach to assessing profitability at each stage of
the energy supply chain in GB, namely in power generation and retail supply.1
In that paper, we set out our intention to measure profitability using both
return on capital employed (ROCE) and profit margins for the retail supply
businesses. On 17 April 2015, we shared our preliminary analysis of the
1 Approach to financial and profitability analysis working paper.
A9.10-2
ROCE earned by the retail supply businesses of the Six Large Energy Firms
with those firms. We invited them to comment on our approach and the
interpretation of our preliminary results, and we requested some additional
financial information in order to refine our analysis. On 7 July 2015, we
published our provisional findings, in which we set out our updated profitability
analysis and on which we invited parties to make submissions. On 18 March
2016, we published our (further) updated profitability analysis as an appendix
to our provisional decision on remedies.
3. We have received responses on these four consultations from parties and we
have taken these into account, adapting and refining our approach as
appropriate. In this appendix we provide an explanation of the analysis we
have undertaken in order to come to a conclusion on the level of profitability in
the energy retail supply industry. In Appendix 9.9: Approach to profitability and
financial analysis, we set out the basic principles that have guided our
approach to analysing the economic profitability of both the electricity
generation and energy retail supply sectors. In this appendix, we focus on
how we have applied those general principles to the specific circumstances of
energy retail supply.
4. The structure of this paper is as follows:
(a) Scope of analysis and principles of economic profitability: briefly
recaps the proposed scope of our analysis of the profitability of the retail
supply businesses, as well as the basic principles that we have applied in
our analysis, including our approach to the recognition and valuation of
capital employed.
(b) Adjustments to firms’ financial information: provides an overview of
the data that we have received from the relevant firms and discusses the
adjustments we have made in order to ensure that our analysis is
economically meaningful.
(c) Results of analysis: sets out our estimates of the ROCE for the supply
businesses of the Six Large Energy Firms, including sensitivities where
we consider this to be appropriate.
Scope of analysis and principles of economic profitability
The scope of our analysis
5. We adopted the following scope for our profitability analysis:
A9.10-3
(a) The relevant geographic market was GB, in line with the markets
referred.2
(b) The relevant firms were Centrica, EDF Energy, E.ON, RWE, SSE and
Scottish Power.
(c) We collected data for the period from 2007 to 2014.
(d) The relevant activities for retail supply comprised all the activities that a
stand-alone supplier would need to undertake to compete in the markets.
These include forecasting energy demand, making decisions regarding
how and when to buy electricity and gas, managing customer
relationships, billing, marketing and so on. We note that a stand-alone
supplier may choose to employ staff directly to execute trades or it can
purchase these services from a third party. We have analysed the
profitability of the retailing of energy to both domestic and non-domestic
customers, including SMEs and large industrial and commercial (I&C)
customers on a combined basis. However in paragraphs 160 to 162, we
set out an indicative apportionment of profitability by customer type and
by fuel.
Principles of economic profitability analysis
6. The purpose of this analysis, in the context of the investigation, is to assess
the profitability of retail energy supply as a hypothetical distinct economic
activity. Three key objectives may be distinguished; firstly, to assess the
profitability of retail energy supply on a stand-alone basis; secondly, to identify
all relevant operating assets, liabilities, revenues and costs whether or not
shown in the accounts of the firms engaged in energy supply; and thirdly, to
ensure that amounts are reflected at an appropriate value. Through meeting
these objectives, we can be confident that the resulting analysis will provide
an economically meaningful measure of profitability for the activity in question.
Stand-alone basis
7. Since the Six Large Energy Firms were all vertically integrated over the period
of review,3 and we wish to understand the economic profitability of their
supply businesses, we need to separate the retail arms from the rest of the
integrated businesses. There are three steps to achieve this:
2 Terms of reference. 3 As of 1 January 2016, E.ON completed the division of its group into two separate entities, with its retail, grid and renewable generation activities being separated from its fossil fuel generation activities: E.ON announcement. RWE has announced plans to divide its activities along similar lines to E.ON: RWE announcement.
A9.10-4
(a) Separating out assets, liabilities and transactions that are attributable to
retail.
(b) Measuring transfer prices for services that flow between retail and the rest
of the group.
(c) Identifying any additional assets or liabilities that would be incurred by a
stand-alone retail business.
8. The first two of these steps can be substitutes. For example, the value of a
building to a firm can be reflected either as an (appropriately depreciated)
asset on the balance sheet of the retail business or as an internal transfer
charge in the profit and loss account (P&L) for the cost of renting the building
from another part of the business. In our analysis, we have generally used the
approach adopted by each of the Six Large Energy Firms, ie recognising
either assets or operating costs depending on the approach taken by the firm.
9. Our emphasis on ‘stand-alone’ costs implies that costs should be stated to
reflect ‘arm’s length’ trading between the retail supply business and the rest of
its parent group.
10. The approach that we have taken to estimating the ROCE for the supply
business is consistent with that set out in our Guidelines.4 We have used the
relevant firms’ accounting information as a starting point and made a number
of adjustments in order to provide economically meaningful estimates of
revenues and costs. In making these adjustments, we have been guided by
two broad principles described below.5
Identification of relevant operating items
11. In a competition analysis we are concerned with the profitability of the relevant
business activities as described in paragraph 5(d) above, independently of
how those activities are financed. As a result, we estimate the ROCE using
the operational profits and capital employed by the relevant businesses, which
will be compared with the pre-tax WACC.6 The general principle is that all
revenues, costs, assets and liabilities necessarily arising from the operation of
4 Market investigations guidelines (CC3) (Guidelines), paragraph 115. 5 These principles are set out in detail in Edwards, Kay & Mayer (1987), The Economic Analysis of Accounting Profitability. 6 This pre-tax nominal WACC takes into account the typical financing structure observed in the industry. As set out in Appendix 9.12, our view is that a stand-alone retail supply business would be likely to be wholly equity-financed, such that the pre-tax WACC was equal to the pre-tax cost of equity.
A9.10-5
the businesses should be included, whether or not these items are recorded
in the financial statements of the business.7
12. All financing costs associated with the operational capital employed in the
businesses whether that financing is provided by a third party, such as a
bank, or from another company within the same group, are excluded.
Similarly, corporation tax and any associated deferred tax charges, as well as
any pension deficit or surplus, are excluded.
Economic values
13. The level of profits earned and capital employed should reflect the economic
value of the resources involved, which may differ from the accounting costs.
The economic value is the cost of resources used at a price at which they
would be traded in a competitive market, where entry to and exit from the
market is easy. Accounting values are typically stated on an historic cost
basis and may not provide a relevant (ie up-to-date) measure of the value of
the asset, particularly where the asset was purchased some time ago.
14. For capital assets, the economic costs should reflect their current value to the
business (VTB), which is the loss the entity would suffer if it were deprived of
the asset involved. That measure, which is also referred to as the deprival
value, or value to the owner, will depend on the circumstances involved as set
out in Figure 1.
15. In most cases, as the entity will be putting the asset to profitable use, the
asset’s value in its most profitable use will exceed its replacement cost. In
such circumstances, the entity will, if deprived of the asset, replace it, and the
current value of the asset will be its current (depreciated) replacement cost.8
An asset will not be replaced if the cost of replacing it exceeds its recoverable
amount. In such circumstances, the asset’s current value is that recoverable
amount, which is the higher of the amount that can be obtained by selling it,
7 We note that only those operating costs incurred in relation to the relevant period should be included in our analysis or our estimates of the profitability of operators during the period will be distorted. Where firms are making payments to cover costs that were incurred prior to the relevant period, for example by reducing a pension deficit that was incurred previously, these should not be included in our analysis as they do not reflect the costs associated with the relevant period. 8 Where the asset would be replaced with a different asset, eg due to technological advances, the asset would be valued with reference to the modern equivalent asset (MEA). The MEA value is the cost of replacing an old asset with a new one with the same service capability allowing for any differences both in the quality of output and in operating costs. An integral requirement of the MEA approach is to adjust the profits of a business as well as the value of its capital employed to reflect the performance of the MEA. For example, a new piece of equipment may be more costly to acquire but may also have lower running costs. Both of these changes should be reflected under the MEA approach. In practice, it may be problematic to make such adjustments where there is limited evidence on the performance of MEAs.
A9.10-6
and the present value of the future cash flows obtainable from operating the
asset.
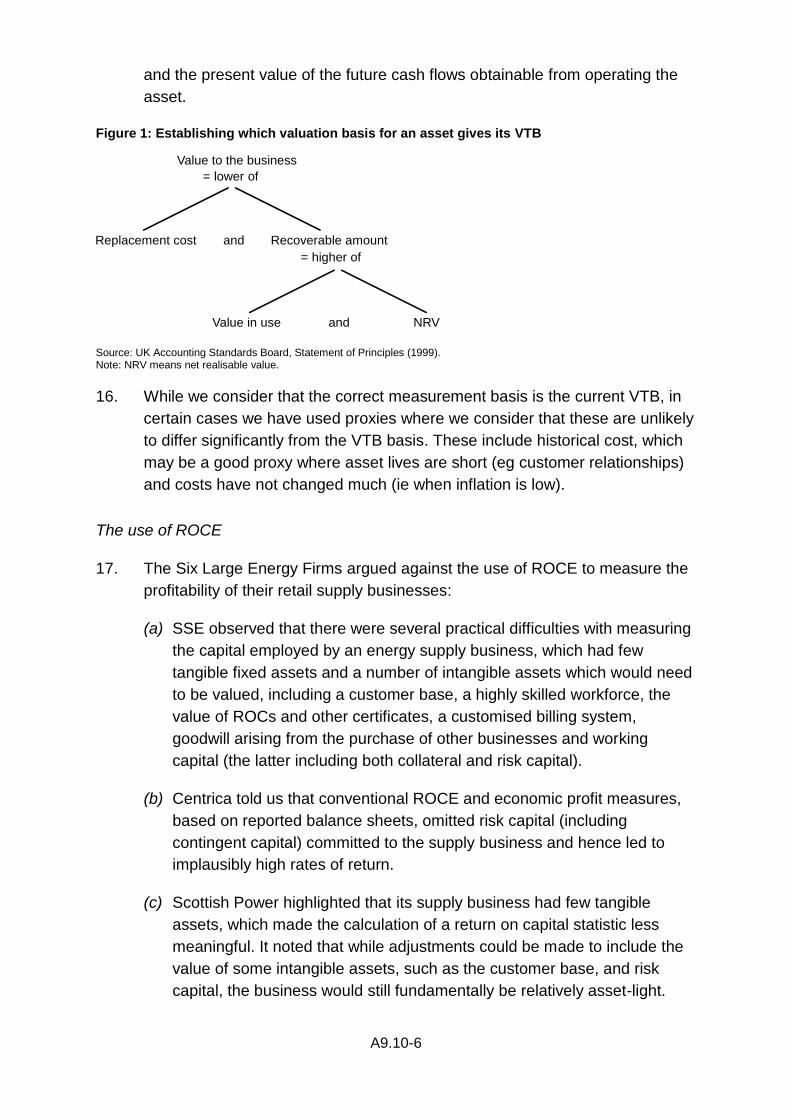
Figure 1: Establishing which valuation basis for an asset gives its VTB
Source: UK Accounting Standards Board, Statement of Principles (1999). Note: NRV means net realisable value.
16. While we consider that the correct measurement basis is the current VTB, in
certain cases we have used proxies where we consider that these are unlikely
to differ significantly from the VTB basis. These include historical cost, which
may be a good proxy where asset lives are short (eg customer relationships)
and costs have not changed much (ie when inflation is low).
The use of ROCE
17. The Six Large Energy Firms argued against the use of ROCE to measure the
profitability of their retail supply businesses:
(a) SSE observed that there were several practical difficulties with measuring
the capital employed by an energy supply business, which had few
tangible fixed assets and a number of intangible assets which would need
to be valued, including a customer base, a highly skilled workforce, the
value of ROCs and other certificates, a customised billing system,
goodwill arising from the purchase of other businesses and working
capital (the latter including both collateral and risk capital).
(b) Centrica told us that conventional ROCE and economic profit measures,
based on reported balance sheets, omitted risk capital (including
contingent capital) committed to the supply business and hence led to
implausibly high rates of return.
(c) Scottish Power highlighted that its supply business had few tangible
assets, which made the calculation of a return on capital statistic less
meaningful. It noted that while adjustments could be made to include the
value of some intangible assets, such as the customer base, and risk
capital, the business would still fundamentally be relatively asset-light.
Value to the business
= lower of
= higher of
Value in use and NRV
Replacement cost and Recoverable amount
A9.10-7
Additionally it said that the industry was characterised by high levels of
profit volatility and low levels of asset intensity, thus producing large
swings in ROCE. As a result, it argued that it was not possible to draw
any meaningful conclusions from the resulting ROCE statistics.
(d) E.ON said that the retail energy supply businesses had a low physical
asset base, relative to their operational costs – ie they were ‘asset-light’.
In other words most expenditures were not capitalised on the balance
sheet, and hence the capital employed element of ROCE appeared low
for such businesses. E.ON stated that low asset base industries were
more likely to have high levels of intangible assets, which were more
difficult to quantify in a robust manner.9 It referred to analysis that it had
undertaken which showed that asset-light firms in other industries, in
which there was no evidence to suggest the existence of competition
problems, had high ROCEs (based on publicly-available data). E.ON
suggested that this demonstrated that ROCE was not an appropriate
measure of returns for such businesses. E.ON noted that the CMA’s
analysis, while seeking to take into account all assets employed, including
those not recognised on the balance sheet, had actually reduced E.ON’s
reported balance sheet by around [] rather than increasing it.10
(e) RWE added that the considerable challenges inherent in estimating
ROCE for an asset-light supply business must be considered when
interpreting the results. It said that primary weight ought to be put on
margin analysis. It also said that investors sought a return on more than
just tangible fixed assets and intangible assets (eg customer base), noting
that, theoretically, a firm’s ROCE must recognise the potential
requirement that investors might need to make investments to cover
future liabilities, which might or might not materialise. For a consistent
comparison of the WACC to ROCE, RWE emphasised that it did not
matter whether these investments were actually made. The fact that risks
existed created the possibility that additional capital would be required. As
such, investors expected to earn a return that was commensurate with
these risks. Finally, it observed that between 2007 and 2013, the median
ROCE for asset-light FTSE 100 firms was 28%, which was substantially
above the typical cost of capital. RWE noted that this analysis included
large firms, operating in competitive markets, and, therefore, it considered
that this provided evidence that ROCE was not an appropriate measure
for asset-light firms. RWE also commented that regulatory precedent for
9 E.ON response to provisional findings, Annex A, paragraph 23. 10 E.ON response to provisional findings, Annex A, paragraphs 26–28.
A9.10-8
asset-light firms used ROCE analysis less frequently and secondarily to
the margin approach.
(f) EDF Energy said that profitability of retail supply was not driven by capital
investment in assets.
18. RWE, Scottish Power, and E.ON put forward the view that the volatility
observed in the ROCE results of our analysis demonstrated that ROCE was
an unreliable measure of profitability.11 KPMG (on behalf of E.ON) submitted
that the range of ROCEs observed (from negative 17% to positive 52%),12
was unrealistic for ROCE values that purported to reflect economic and
commercial reality. It stated that it was aware of no reason why estimates of
ROCE should vary so widely.13 Similarly, EDF Energy told us that the wide
swings in average ROCE from 7% in 2008 to 34% in 2010, as well as a wide
spread of results for different suppliers, called into question the
meaningfulness and reliability of ROCE for measuring retail energy suppliers’
profits.14
19. We considered each of these arguments in turn. First, we recognise the need
to ensure that all capital employed by firms is identified and included in our
analysis, regardless of the accounting treatment (ie whether it is included on
firms’ balance sheets or not). We have reviewed the Six Large Energy Firms’
submissions on the types and extent of intangible assets employed in their
businesses and have included those categories of assets that meet our
criteria for recognition.15 However, we do not agree that a low level of capital
employed, in itself, makes a ROCE analysis less meaningful. Investors expect
to earn a return on the actual capital they put at risk, which is limited to their
equity or debt holding in a firm with limited liability. We do not agree that they
should earn a return on the potential future capital they might choose to put at
risk, as RWE suggests.16 We note that the analysis of the ROCE of asset-light
firms in the FTSE100, performed by RWE (and the similar analysis
undertaken by E.ON), does not seek to adjust the capital employed figures for
the various types of intangible assets that we have sought to identify and
11 RWE response to provisional findings, Schedule 2, paragraph 9.4. Scottish Power response to provisional findings, paragraphs 5.1–5.6. E.ON response to provisional findings, Annex A, paragraphs 24 & 25. 12 These figures were based on a CMA assumed customer life of 8 years. 13 KPMG, CR report, on behalf of E.ON, paragraph 4.3.3. 14 EDF Energy response to the PDR, paragraph 1.8. 15 As set out in our Guidelines, Annex A, paragraph 14, these criteria are that expenditure on the intangible: (i) must comprise a cost that has been incurred primarily to obtain earnings in the future; (ii) this cost must be additional to costs necessarily incurred at the time in running the business; and (iii) it must be identifiable as creating such an asset separate from any arising from the general running of the business. 16 Our analysis of the level of return that an investor would require in order to be willing to invest in a retail energy supply business, ie the cost of capital, is set out in Appendix 9.12.
A9.10-9
recognise in our analysis. Hence, we do not consider that this provides
evidence that a ROCE analysis, properly conducted, is unreliable.
20. In relation to E.ON’s observation that our approach has reduced the size of its
balance sheet by around [], we note the following points. First, between
2011 and 2014, E.ON had a large intercompany debtor on its supply balance
sheet, equivalent to over [] of total net assets in 2013 and 2014. This has
been excluded from our analysis on the basis that it does not represent an
operating balance of the business; rather it indicates that another part of the
E.ON group has borrowed funds from the retail part of the business. It has no
connection with the operation of the retail business on a stand-alone basis. As
a result, such balances will generally not be shown in the consolidated
financial statements of listed firms, hence we do not consider that E.ON’s
comparison of listed firms’ consolidated balance sheets with its own retail
balance sheet are valid. Second, E.ON’s supply balance sheet contains a
large purchased goodwill balance, which we have not recognised as an asset
(see paragraphs 58 to 63 for our approach to purchased goodwill). Rather we
have separately identified certain assets (such as customer relationships)
which may be contained within this balance.17 While we note that a proportion
of comparable firms will also have purchased goodwill on their balance
sheets, many will not. For those that do, the relative importance of purchased
goodwill in their asset bases is likely to be lesser than for E.ON (where
purchased goodwill accounts for more than [] of its total net assets and a
higher proportion of such assets when intercompany debtors are excluded).
For these reasons, we do not agree with E.ON’s argument that a comparison
with the ROCE of other listed firms demonstrates the unreliability of our
ROCE analysis.
21. We agree that in a relatively asset-light business, such as energy retail
supply, the level of ROCE can fluctuate significantly year on year and across
firms in response to movements in working capital (and therefore, total capital
employed). In addition, we note that demand for energy and, as a
consequence the profitability of energy firms, can fluctuate significantly year
on year in response to changes in the weather. For example, in 2010, we
observe that ROCE was significantly higher than in other years due to a
particularly cold winter.18 Since the reasons for these swings in profitability are
17 Our estimate of the net capital employed by E.ON over the period is greater than the remaining net assets (excluding intercompany debtors) on E.ON’s balance sheet, which reflects our recognition of assets such as the customer base. We note that part of the purchased goodwill value may, in fact, reflect the value of E.ON’s customer base, albeit not specifically identified as such. 18 We do not, therefore, agree with KPMG’s view that there are no reasons for such a large range of ROCEs across the firms and over time. Moreover, as set out in Appendix 9.13, there are relatively large differences in EBIT margins between the Six Large Energy Firms over the period. These differences are a significant driver of the range of ROCE figures observed (with EDF making losses in most years, and Centrica making relatively high
A9.10-10
clear, we do not consider that this volatility undermines the reliability of ROCE
as a measure. However, for these reasons, we have considered the average
returns earned by the Six Large Energy Firms over the eight-year period,
rather than focusing on returns earned in particular years. In addition, we
have also calculated the (average) economic profits earned by the Six Large
Energy Firms. This shows the absolute level of returns above the cost of
capital. While economic profits are derived from the same inputs as ROCE, by
expressing profits as monetary amounts, rather than percentages, in relatively
asset-light industries, they can provide a clearer indication of the relative scale
of any profits in excess of the cost of capital earned by firms.
22. Finally, we note that in response to our EBIT margins analysis (see Appendix
9.13), several of the Six Large Energy Firms put forward the view that it was
not possible to make comparisons between the margins earned on domestic,
SME and I&C customers, for example, without making adjustments, as there
were differences in the capital required and/or risks incurred in serving these
different types of customer. In particular, they stated that higher margins
should be earned on SMEs as greater working capital was tied up in serving
them and such customers were associated with greater bad debt costs. We
agree with the basic premise of these views – that for meaningful
comparisons to be made, returns must be judged against the capital invested
– and note that they are addressed by considering ROCE, which takes into
account the capital employed by the firms, and comparing it to a WACC for
the industry, which reflects the risks assumed by investors. For this reason,
we consider ROCE to be the most reliable measure of profitability, although
we have also considered some (EBIT) margin benchmarks as a cross check.
Adjustments to firms’ financial information
23. In this section, we provide a brief overview of the financial information
provided by each of the Six Large Energy Firms and set out our consideration
of the appropriate approach to the recognition and valuation of income and
assets (as set out in the firms’ financial statements) based on the principles
set out in paragraphs 6 to 15 above.
Financial information provided by the Six Large Energy Firms
24. In response to our supply questionnaire, all of the Six Large Energy Firms
provided us with information on the financial performance and position of their
supply businesses. We observe that some of the firms were able to provide
EBIT margins), rather than these differences resulting primarily from differences in our estimates of the total level of capital employed.
A9.10-11
this information more easily than others. RWE and EDF Energy highlighted
that the information requested by the CMA was not readily available for the
whole of the relevant period and that, as a result, both firms had had to make
a number of assumptions in order to present financial statements for supply
as separate from their other operations.19
25. We reviewed the financial information provided and the submissions of the Six
Large Energy Firms and noted three broad issues that we considered would
require adjustments in order to come to a view on economic profitability.
26. The first issue is that some of the financial information provided was
incomplete or unsuitable for the purposes of our analysis. This was generally
due to difficulties with separating out the relevant supply activities (the scope
of which is set out in paragraph 5(d) above) from those of generation and/or
trading. As a result, certain assets/costs were either over- or under-stated for
the purposes of analysing the profitability of retail supply. For example:
(a) SSE told us that the supply business balance sheet provided included
both supply and trading activities [].
(b) EDF Energy told us that there were certain areas within its balance sheet
where it had been impossible, due to the general ledger structure, to
make any logical assumptions on the split between generation and
supply, including: cash balances, trade creditors, intercompany balances
and hedge derivative asset/liability.
(c) Centrica highlighted that its trading (mid-stream) business undertook
some activities on behalf of its retail supply business and therefore that an
analysis of its retail supply business on a stand-alone basis would need to
include in capital employed some working capital that currently sat within
its mid-stream business. [].
27. The second issue is similar to the first but arises for different reasons. Not all
of the economic assets employed in operating the business may be recorded
on the balance sheets of firms due to the prudent approach of accounting
standards. An economic profitability analysis needs to include these assets
even where accounting standards consider that it is more prudent to expense
the costs associated with developing them. In contrast, there may also be
certain assets recognised on the balance sheets of energy retailers that do
19 RWE operated a consolidated balance sheet across its supply and generation businesses and reported its business within the group of RWE as a single business segment up until FY12. After FY12, financial consolidation allowed for generation and supply and other businesses to be reported separately. Therefore, RWE performed some analysis to derive the accounting capital employed for FY07 to FY11 for its GB supply business.
A9.10-12
not represent separately identifiable economic assets for the purposes of
profitability analysis and therefore should not be reflected in the capital base.
28. The third issue is that the level at which costs and/or assets are recorded will
not reflect the VTB principles as set out in paragraphs 6 to 15 above in all
cases. For example, where a tangible asset such as a building is recorded at
its historic cost, this may not be representative of what it would cost to replace
that asset today (allowing for an appropriate level of depreciation). In such
cases, we have considered whether it would be appropriate to revalue such
assets to reflect their deprival value.
29. In the next section, we first set out how we have addressed the issue of
incomplete or unsuitable financial information before providing an overview of
the approach that we have taken to the recognition and valuation of each
category of assets employed by the businesses in turn.
30. Centrica submitted that our ROCE analysis was not comparable across
suppliers, due to differences in how suppliers had recognised / valued assets
and/or inconsistencies in the CMA’s approach. For example, Centrica pointed
to differences in the approach to valuing IT and billing systems, as well as the
use of EDF’s year-end working capital balance (rather than the average). As a
result, Centrica stated that publishing these figures at the supplier level in
their current form would be highly misleading and risk resulting in poor
consumer choices and a further erosion of trust in the market.20 As set out
below, we have sought to ensure that our treatment of revenues and costs
across the Six Large Energy Firms yields economically meaningful results, as
well as seeking consistency across the firms. We recognise that there will be
some differences between the firms and, as set out in paragraph 1, we
consider that the results of this analysis are indicative rather than precise
estimates. However, given our careful consideration of the Six Large Energy
Firms’ information and submissions, and the detailed adjustments that we
have made, we do not consider that any inconsistencies are sufficient in scale
as to undermine the broad results of this analysis.
Incomplete or unsuitable financial information
31. We observed that the issue of incomplete or unsuitable financial information
was most pronounced for []. During our consultations, [] provided
information on the carrying value of certain categories of fixed assets
employed by its supply business, including land and buildings, IT systems and
billing systems, software and ROCs. [] also provided further information on
20 Centrica response to the PDR, Appendix 1, paragraphs 59-60.
A9.10-13
its average debtor and creditor days. While we have included this information
in our analysis, we note that [] prepared this information on a best
endeavours basis but it faced considerable challenges in doing so (ie more
assumptions and adjustments were required than for other suppliers). Hence
we had less confidence in the reliability of [] information than that of other
suppliers.
32. In other cases, the extent to which information was unsuitable or incomplete
was less material. For example, RWE stated that it had not been able to
separate out the capital employed by activities that were out of scope, such as
boiler installation and servicing, or consultation and advisory services. RWE
observed that these out of scope activities formed a small part of the overall
RWE generation and supply segments and would not expect this to alter the
overall capital employed position materially. In these cases, we have not
sought to make adjustments to the firms’ financial information as our initial
view is that this is unlikely to have a material impact on the results of our
analysis.
33. Finally, we considered the two, related arguments that Centrica put forward.
First, that the balance sheet of a stand-alone retail supply business would
need to reflect the working capital currently employed by the trading business
on its behalf. Second, that its supply business P&L would need to reflect:
(a) the costs of long-term supply contracts, which currently reside in the
trading business, rather than recharges for those contracts, which are
currently reflected in the retail P&L;
(b) a higher level of balancing costs, as Centrica currently manages these
together with its generation business, with any off-setting positions
currently reducing balancing costs for the vertically integrated business;
and
(c) increased operational expenditure in relation to shared functions,
including trading (as staff costs would need to include, for example those
associated with implementing a 24-hour trading desk) tax and treasury.21
34. Centrica told us that, at the current time British Gas only paid its share of the
total costs incurred by Centrica for its trading, tax, head office and treasury
functions. However, if it were a stand-alone business, it would not benefit from
the economies of scale achieved by sharing these activities with the rest of
the group. Nor would British Gas benefit from the reduced balancing costs
21 We have not included this here as Centrica told us that a reduction in the contribution to group overheads would offset these costs.
A9.10-14
enabled by netting off imbalance positions between Centrica’s E&P, or Power
Generation businesses against those of British Gas. Centrica estimated that
the loss of these economies of scale would result in a [] million [] []
million adjustment to its P&L.
35. We agree with the principle that all the relevant costs and capital associated
with the retail supply of energy to customers should be reflected in the
financial statements of the supply business for the purposes of our profitability
analysis. As Centrica’s supply business P&L already reflects its share of the
costs associated with its trading, tax and treasury functions, we considered
the potential loss of economies of scale.22 First, we noted that the trading
costs that Centrica currently recharges to its supply business include services
that certain smaller suppliers source from trading intermediaries. As a result,
the costs of these services, as well as the working capital requirements of
trading (ie posting collateral) are reflected in the trading fee adjustment that
we have made (see paragraphs 102 to 122). By deducting a trading fee but
not adding back this central recharge, we consider that we are not only fully
allowing for any loss of economies of scale but that we are also double-
counting an element of Centrica’s cost base (thus causing any profits to be
overstated).
36. With respect to the tax and treasury functions, we noted that such services
are provided by a finance (and other professional) staff team, the size of
which can be flexed to fit the size of the company and the scope of its
activities. In addition, specialist services within these categories can be
sourced from third party advisers if required. Therefore, we would not expect
any material loss of economies of scale from these functions. Centrica did not
provide any detailed evidence to support its view on the loss of economies of
scale. Therefore, we have not made any adjustments to Centrica’s supply
business P&L for any such losses.
37. Finally, we considered Centrica’s argument about balancing costs. We
reviewed the balancing charges incurred by the Six Large Energy Firms (as
reported in their financial statements) over the relevant period and those
incurred by the Mid-tier Suppliers that are not vertically integrated, such as
Ovo Energy and First Utility. We observed that the level of balancing costs
varied significantly both from one year to the next and across the firms, with
several firms reporting balancing income (rather than costs) in a number of
years.23 While there is evidence that the Mid-tier Suppliers and smaller energy
22 For example, in addition to recharging the costs of long-term supply contracts, []. 23 The number of years in which firms earned income from balancing varied across the firms, as did the years in which such income was earned.
A9.10-15
suppliers incurred higher balancing costs on average than the Six Large
Energy Firms, there is also evidence from Cornwall Energy24 that this is driven
largely by these suppliers having more limited resources to dedicate to
avoiding imbalances, and/or scale to efficiently manage imbalance risk. In
particular, we observed that forecasting demand accurately for a smaller (and
recently acquired) customer base is more difficult than for a larger customer
base.25 On this basis, we have concluded that while a stand-alone energy
supply firm may have somewhat higher balancing costs than a vertically
integrated firm, the significant majority of the observed differences were likely
to be the result of scale rather than vertical integration, such that a large,
stand-alone energy retailer would not have significantly larger imbalance
costs than a vertically integrated one. Therefore, we have not adjusted
Centrica’s costs.
38. Given the vertically integrated nature of the Six Large Energy Firms and the
quality of the information that such firms could provide on the retail part of
their businesses, we have adopted a degree of estimation and judgement in
our analysis. Having carefully considered the parties’ submissions, alongside
evidence from a limited number of smaller stand-alone energy retailers, we
consider that we have made reasonable assumptions and judgements in our
analysis.
Recognition and valuation of assets
39. The main categories of assets recorded on the balance sheets of the retail
supply businesses of the Six Large Energy Firms are:
(a) tangible fixed assets, such as property, plant and equipment, land and
machinery, other equipment, and investments;
(b) intangible fixed assets, such as acquisition goodwill, software and billing
systems, customer lists, brand value, and other intangible assets;
(c) working capital, which comprises operating current assets such as stock,
trade debtors and other debtors and operating current liabilities such as
trade creditors and other creditors;
24 Cornwall Energy (2014), Credit and collateral in the GB energy markets, paragraph 1.1.2 highlights that smaller suppliers ‘have larger imbalance percentages as they are less able to balance well as a result of their smaller size’. This report also assumes that both vertically integrated suppliers and large (but not vertically integrated suppliers) incur the same level of balancing costs. 25 Firms forecast demand based on a combination of historic experience and expected factors, such as temperature, luminosity etc. Where a firm has had a longer experience of forecasting demand for its customer base, it has more data (years’ experience with varying weather and economic conditions) on which to base its forecasts. As a result, it will have an advantage in terms of the accuracy of its forecasts.
A9.10-16
(d) other current assets, such as cash, deferred tax assets, hedge derivative
assets, intercompany/treasury loans, and provisions; and
(e) other current liabilities, such as, tax liabilities, hedge derivative liabilities,
and intercompany loans.
40. In addition, as set out in paragraph 17 above, SSE put forward the view that
its retail supply business also employed the following intangible assets:
(a) A customer base.
(b) A highly skilled workforce.
(c) The value of ROCs and similar certificates.
41. Several of the other Six Large Energy Firms put forward similar views to those
of SSE on the existence of intangible assets. The Six Large Energy Firms (all)
also suggested that it would be necessary to measure the level of both
collateral and risk capital which were employed by their groups and made
available to their retail businesses and which would be needed by a stand-
alone retail supply business (see paragraphs 102 to 111).
42. In this section, we consider each of these categories of assets in turn, setting
out the approach that we have taken to recognition and valuation in our
analysis.
Tangible fixed assets
43. In general, tangible fixed assets for the supply businesses include land and
buildings (head offices and call centres), office equipment, motor vehicles and
similar assets. The value of these assets in the balance sheets are typically
based on their original cost less any depreciation made against the assets. All
tangible assets on the balance sheet of retail energy supply firms are
depreciated on a straight-line basis over the estimated useful life of the
assets.
44. Our approach has been to capitalise all property, plant and equipment
employed by the Six Large Energy Firms, irrespective of whether or not it was
originally recorded on their supply balance sheets, at its carrying value, ie its
net book value. Where firms have chosen an appropriate depreciation
schedule, we would not expect a material difference between the net book
value of these assets and their depreciated replacement cost. In certain other
cases, where the carrying value may be understated (eg due to inflation), we
considered that revaluing the assets would not have a material impact on the
A9.10-17
results of our analysis as these assets comprised a small proportion of total
capital employed, and inflation has been relatively low over the period.
45. E.ON highlighted that its retail supply business did not generally incur material
expenditure in respect of tangible fixed assets, although the E.ON UK group
businesses that provided services to the supply business did. As a result, it
was necessary to make adjustments to its balance sheet to reflect these
assets. Having received further information from E.ON in relation to these
assets, we have made these adjustments.
Intangible fixed assets
46. Our Guidelines set out the criteria that we consider when determining whether
or not it is appropriate to recognise intangible assets within the capital base of
a business for the purposes of profitability analysis. These state that we may
consider the inclusion of certain intangible assets where the following criteria
are met:
(a) It must comprise a cost that has been incurred primarily to obtain earnings
in the future.
(b) This cost must be additional to costs necessarily incurred at the time in
running the business.
(c) It must be identifiable as creating such an asset separate from any arising
from the general running of the business.26
47. We observed that there were three main categories of intangible assets
recorded on the balance sheets of the firms, namely:
(a) billing systems and software;
(b) goodwill and brand value; and
(c) customer relationships.
48. We consider each of these categories of assets in turn.
Billing systems and software
49. Energy suppliers require IT systems to process energy bills, record switches
and payments, and link to other businesses (eg distribution, trading and
generation). All of the Six Large Energy Firms have capitalised the costs of
26 Guidelines, Annex A, paragraph 14.
A9.10-18
developing their billing systems and software on their balance sheets and
chosen a depreciation schedule.
50. We consider that billing systems and software meet our criteria for recognition
in that they represent a significant investment by the Six Large Energy Firms
with the aim of generating revenues in the future, the costs of developing
them are additional to those necessarily incurred in running the business and
they form assets that are separable from any arising from the general running
of the business. For example, small entrants to the industry are able to
purchase off-the-shelf billing and IT systems as they would any other asset.
51. []. As a result, Centrica put forward the view that for the purposes of a
ROCE analysis, we would need to take into account the full replacement cost
of these assets which it considered to be the (unamortised) cost it had
incurred in acquiring these systems.
52. []. In addition, the costs of [] be incorporated as these would be
considered part of the necessary investment that any new entrant would need
to make.
53. In response to our ROCE analysis in our provisional findings, E.ON told us
that it had first developed its current billing system in [], with the result that it
was now heavily amortised on E.ON’s balance sheet, with a net book value
that was significantly below its value to the business. E.ON explained that it
had recently invested in a similar billing system in Germany at a cost of
approximately €[] million (£[] million) and suggested that the CMA should
include this as a proxy value over the period. It provided an illustration under
which the system was amortised over five years on a straight-line basis, with
the initial capital value being re-capitalised on the balance sheet every five
years but, in order to recognise the higher operating costs associated with an
older system, it suggested that the amortisation charge should not be
adjusted. E.ON told us that large-scale IT assets tended to have useful
economic lives of between seven and ten years. In response to the PDR,
KPMG (on behalf of E.ON) submitted that although E.ON’s IT systems have
been built on a modular basis (with various pieces developed at different
times), the billing systems and sales ledgers were renewed approximately 10
years ago. As a result, assuming a 10 year UEL for E.ON’s billing system
might be more appropriate.27
54. We considered that the arguments put forward by Centrica, SSE and E.ON
were essentially that the amortisation profile of their IT intangible assets over
the period has not matched the stream of economic benefits that they have
27 E.ON response to the PDR, paragraph 120.
A9.10-19
received from those assets, ie the assets have been, or are being, amortised
too quickly. We did not agree with Centrica’s argument that we should not
reflect the amortisation of the assets and use their full (ie undepreciated)
replacement cost since, in reality, such assets depreciate in value over time
due to the changing needs of the business and advances in billing systems
generally (making older systems obsolete). This is demonstrated by the fact
that []. Similarly, we did not think that E.ON’s suggestion of amortising the
asset over either five years (or seven to ten years), in spite of its significantly
longer useful economic life (15 or more years), made sense. SSE’s proposed
approach would be to adjust the amortisation profile of the intangible IT assets
over the full length of their useful economic life. We agree that this is the
correct approach to resolve this issue. However, we do not think that the cost
of replacing an old system with a new one is the appropriate benchmark in
this case. A new system could be expected to lower operating costs through
lower bad debts, improved customer service and other operational
efficiencies. Where a supplier’s P&L does not reflect such operational
efficiencies, we believe, therefore, that the appropriate benchmark would be
the depreciated historic cost of the existing billing system.
55. Therefore, in the case of SSE, we have recognised its billing system at
historic cost and adjusted the depreciation/amortisation schedules applied to
these assets to reflect their significantly longer lifespans. In the case of E.ON,
we noted that its two submissions would suggest different approaches. Where
a billing system was [] and fully depreciated, we considered that it would be
appropriate to adopt a similar approach as for SSE. However, where much of
the system had been replaced 10 years ago (as KPMG suggests), we would
expect the carrying value of the assets to better reflect their replacement
value, particularly at the beginning of the relevant period when these assets
were relatively ‘new’.28 Given this conflict, we decided to retain the approach
that we adopted in the PDR, which was to use the replacement cost of E.ON’s
billing system based on the German comparator, and amortise it over 20
years. We observe that this approach values E.ON’s billing system more
highly than other firms in a similar position, eg SSE. In the PDR, we made an
approximate adjustment for this by including a proportion of the costs that
E.ON had incurred in maintaining, adapting and upgrading its existing billing
system, as well as the amortisation of incremental investments in the system,
but not charging incremental amortisation of the IT system over its longer
lifespan.29 KPMG told us that [] of E.ON’s exceptional items are comprised
of IT repair and maintenance costs, which the CMA had excluded from the
28 The beginning of our period of analysis is 2007. Where a billing system had been replaced 10 years ago, it would have been more or less new in 2007. 29 E.ON was not able to provide us with the historic gross book value of its billing system.
A9.10-20
ROCE analysis. It submitted that if the CMA was assuming that ongoing IT
repair and maintenance was equivalent to the amortisation on the IT asset
then it must include the portion of exceptional costs that relate to IT repair and
maintenance within E.ON’s profit figure in its ROCE analysis. We did not
agree with this submission. As set out above, the approach we adopted for
E.ON valued its billing system significantly more highly than the system of
SSE, despite these being of a similar age and these firms having a similar
number of customers. If E.ON had, in fact, had such a (newer, higher value)
system over the relevant period, we would expect it to have had lower
operating costs than it did (increasing its profitability). On this basis, we
concluded that it was not appropriate to make further adjustments, either in
terms of including more maintenance or amortisation costs, in E.ON’s P&L.
We recognise that this approach is necessarily approximate.
56. In the case of Centrica, we observed that its investment in its billing system
was very recent (ie had taken place between 2008 and 2014). Therefore, we
did not consider it likely that its replacement cost would be significantly above
the ‘historic cost’ of the system, or that Centrica would have written down the
value to a level that was materially below its value in use. We observed that
Centrica’s billing system was still valued at a significantly higher level than
that of any of the other energy suppliers (including RWE, which had also
recently invested in its system). Therefore, for Centrica and the remaining
energy suppliers, we have used the net book value of their billing system
assets. In addition, where the Six Large Energy Firms have provided details of
IT assets that were employed by their supply businesses over the period but
were not included on their balance sheets, for example because they were
centrally held, we have included these in capital employed.
57. [].
Purchased goodwill and brand value
58. Purchased goodwill is an intangible asset that arises as a result of the
acquisition of one company by another for a price in excess of the fair value of
net assets. [].RWE told us that the goodwill that arose on the purchase of
npower by RWE AG in 2002 (being the difference between the purchase
consideration paid by RWE AG and the fair value of the assets and liabilities
of npower at the time of acquisition) has been allocated down into the
consolidated accounts of npower for the purposes of reporting to RWE AG.
Centrica reported goodwill arising from various acquisitions. E.ON reported
acquisition goodwill in the supply business balance sheet relating
predominantly to the acquisition of assets and business of TXU in 2002. EDF
A9.10-21
Energy reported goodwill relating to costs arising on the purchase value of
subsidiary companies.
59. Similarly, the brand value of a business is an asset that may be recognised in
the balance sheet of an acquiring firm. Firms are unable to capitalise the
value of their own (organically developed) brand. [].
60. We have not included either purchased goodwill or brand value in the capital
employed by the energy retailers. In the case of purchased goodwill, this is
because it is not a separately identified asset but rather is a balancing figure
between the purchase price and the fair value of assets acquired. It is the
remaining, unallocated element of an acquisition price once all tangible assets
and intangible assets have been identified, fair-valued and set against the
price paid.
61. In principle we agree that, when purchasing a business, at least some of the
goodwill balance may represent the value of intangible assets not capitalised
on the business’s balance sheet. It is also likely that it reflects expectations of
the future earning capacity of the business acquired. The approach that we
have taken is to recognise those intangible assets that meet our criteria for
recognition (as set out in paragraph 46), regardless of whether these have
been separately identified in the companies’ balance sheets or are included in
a balancing goodwill figure, but to exclude any remaining goodwill in line with
our approach in previous market investigations. This approach ensures that
only intangible assets that meet our criteria for recognition are included in the
estimate of the capital employed by the relevant firms. It also avoids the risk
of capitalising the value of any excess profits that the business is able to
generate, which may be reflected in the purchase price and hence the
purchased goodwill. This last issue is of particular concern in a market
investigation.30
62. We consider that there are similar risks of capitalising any excess profits
(circularity) associated with recognising the value of a brand, as separate from
the tangible and intangible assets (such as customer relationships), held by a
business.
63. We also considered whether we needed to take account of the start-up costs
that would, in theory, have been incurred by firms when entering the supply
market and on which they would be entitled to earn a return. Such costs
would in theory form part of the intangible asset base. We reviewed the EBIT
losses incurred by new entrants in the first few years of operation. [] made
EBIT losses of [] from its inception in [], before turning a profit in FY13.
30 OECD (2011), Policy Roundtables: Excessive Prices, p395.
A9.10-22
[] made EBIT losses of [] from its inception in FY11 to FY12, before
turning a profit in FY13. In view of the relatively limited size of these start-up
losses we do not consider that adjusting for start-up costs would make a
material difference to our calculations, and have therefore not sought to
capitalise them.
Customer relationships
64. Energy retailers incur significant costs in acquiring new customers in the
expectation that these customers will purchase energy from them over a
period of several years. Customer acquisition costs comprise doorstep/energy
advisers’ costs, telesales, commissions payable to brokers or PCWs, sales
support, proposition development and other similar costs. Both UK Generally
Accepted Accounting Principles and International Financial Reporting
Standards require that firms expense such costs as they are incurred, such
that the value of customer relationships is generally not reflected on the
balance sheet of a firm except insofar as the firm has acquired the customer
book from a third party. In this latter case, firms are permitted to recognise the
value of the intangible asset on their balance sheet, as part of the process of
allocating the purchase price to the fair value of purchased assets and the
residual amount to goodwill.
65. We consider that customer relationships meet our criteria for recognition (as
set out in paragraph 46), in that they represent a significant investment with
the aim of generating revenues in the future: the costs of developing them are
additional to those necessarily incurred in running the business and they form
assets that are separable from any arising from the general running of the
business. This latter point is demonstrated by the fact that customer
relationships can be sold by one firm to another.
66. The next issue that we considered was how to value the customer
relationships of the Six Large Energy Firms. In our provisional findings, we
proposed to use the deprival value principle, which indicates that customer
relationships should be valued at the depreciated cost of replacing them. We
observed that the basis on which customer relationships had been valued on
the balance sheets of the firms was both inconsistent due to the accounting
rules (see paragraph 64 above) and could – where customer relationships
had been purchased – include some element of capitalised excess profits (ie
if a firm were able to charge a customer a price that was above the
A9.10-23
competitive level, it could be expected to pay more to purchase that customer
relationship).31
67. RWE, E.ON and Scottish Power submitted that this approach (significantly)
undervalued their customer base. Scottish Power highlighted that the recent
Utility Warehouse transaction implied a per customer valuation of around
£280, and noted that the customers of the business were likely to be at the
more active end of the switching spectrum. Scottish Power explained that
even if this valuation was taken to cover all assets employed by the business
(and not just the value of the customer base), it would reduce ROCE
significantly.32 E.ON observed that the Utility Warehouse deal implied a value
per customer of around £270 and suggested that carrying out a net present
value of the average customer would provide a good indication of the cost to
acquire a new set of customers.33 34 RWE submitted that the CMA was wrong
to disregard market-based evidence for the value of intangible assets. It noted
that recent press reports indicated that First Utility, with a customer base of
approximately 800,000 may have an enterprise value of around £500 million.
It argued that this evidence demonstrated that the CMA’s estimates of the
value of total capital employed were understated.35
68. We observed that transaction values are generally based on the level of
profits that a purchaser expects to earn from the business that it acquires and,
as a result, the implied value per customer may be very different from the
costs that a firm might incur in acquiring customers organically, ie the
replacement cost of customers. This is demonstrated by significant
differences in customer valuations across different business transactions. For
example, Crius Energy recently acquired two small energy supply businesses
in the USA, with implied per customer valuations of around $100.36 While
there may be differences between the US and GB energy markets, we would
31 The accounting rules mean that some customers are attributed a value whilst others are not. 32 Scottish Power response to provisional findings, paragraph 5.11. 33 E.ON response to provisional findings, paragraph A.38. 34 E.ON provided a “sense-check” illustrative approach which it stated showed the impact of the CMA’s understatement of customer value within its ROCE calculations, based upon conservative assumptions. This approach involved: i) assuming that the Six Large Energy Firms earned on average an annual income for each customer, of £1,140. This is based on the average dual fuel bill of £1,200, from which £60 is deducted (the CMA’s estimate of the amount by which customers have over-paid compared to a well-functioning market, determined using its efficient prices and cost analysis); ii) assuming an EBIT margin of 3% and applying this to the annual income of £1,140; iii) assuming that the remaining UEL of the average customer is four years (i.e. half way through the eight year UEL); and iv) using the CMA’s calculated WACC estimate of 10% as the discount factor for the NPV analysis. E.ON told us that this approach gives an illustrative replacement cost of £108 per customer. E.ON response to ROCE analysis, 17 September 2015. 35 RWE response to provisional findings, Schedule 2, paragraphs 65–67. 36 Crius Q2 2015 results. In April 2015, Crius acquired TriEagle Energy LP, a Houston-based energy retailer with approximately 200,000 customers in New Jersey, Pennsylvania and Texas, for a purchase price of $19.3 million. In the same quarter, Crius acquired approximately 2,000 electricity customers in New Hampshire and Rhode Island from Gulf Oil, LP for $200,000.
A9.10-24
not expect such large differences in the costs of acquiring customers between
these two countries. As a result, we do not consider transaction values to
provide a reliable estimate of the value to the business of customer lists. We
observe that where firms expect to earn higher returns from customers, this is
likely to ‘bid-up’ the price paid for those customers. This can lead to the
capitalisation of excess profits.37 Similarly, we found E.ON’s net present value
approach to be circular, since it derived the value of a customer from an
assumed level of profitability (3% EBIT margin) for the energy suppliers,
rather than providing a genuinely independent cross check.
69. E.ON put forward the view that in valuing the customer base, we should also
take into account the costs of managing the specific sales channel activities,
the costs of onboarding, costs of administering early losses and ongoing
retention costs.38 RWE argued that we should include both the costs of
providing discounts to new customers and wider marketing expenses such as
sponsorship, that are not specifically targeted at new customers but whose
principle purpose is to build and maintain brand value for the purposes of
attracting new customers.39
70. We have estimated the value of customer relationships for each firm on a
consistent basis, using information on its expenditure on acquiring customers,
ie expenditures that are directly and solely attributable to acquiring customers.
We excluded any other customer relationship assets on their balance sheets
from capital employed. We did not include the costs of serving customers,
including the costs of onboarding and administering early losses, as we
considered that these were necessarily incurred in the day-to-day running of
the businesses and therefore did not meet our recognition criteria.40 Nor did
we include the cost of retaining customers as we concluded that these were
generally indistinguishable from the day-to-day costs of providing good
customer service and, as such, also did not meet our recognition criteria for
intangible assets (as set out in paragraph 46). While we have included the
direct marketing costs associated with customer acquisition, we considered
that sponsorship was too indirect as a means of customer acquisition to be
included in this asset valuation. Finally, we noted that ‘customer discounts’
could not be separated clearly from the ‘price’ of the tariff offered. For
example, a firm could offer a customer a one-year tariff at a price of £1,000
37 With respect to the particular transactions put forward by the parties, we have noted that the £500 million valuation noted by RWE, as referred to above in paragraph 67 has not been tested. As a result, there is only a single transaction value, that of the Utility Warehouse transaction. We note that this transaction includes an ongoing energy supply agreement between Utility Warehouse and RWE npower. 38 E.ON response to provisional findings, paragraph A.36. 39 RWE response to provisional findings, Schedule 2, paragraph 60. 40 We note that we have included the specific costs of signing up new customers provided to us by the Six Large Energy Firms.
A9.10-25
per year, with a £50 discount, or could offer the customer the same tariff at a
price of £950 per year. We considered that it would be arbitrary to capitalise
the value of the ‘discount’ in one case but not the other.
71. As we are looking at the profitability of the suppliers’ retail activities across all
customer types, we have included the costs of acquiring all types of
customers (ie domestic, SME and I&C customers).
72. The final consideration is the period over which the value of the customer
relationships should be depreciated. SSE told us that its average customer
lifetime was approximately [] and that the CMA should depreciate the value
of its customer base over this period. [] suggested that the CMA use the
same average life for all customers in retail supply, whether newly acquired or
existing customers. []. []. EDF Energy estimated a rate of customer churn
of between [] and [], which is on average [].Scottish Power gave a
range of between [], which is between four and seven years. [].
73. We also considered the evidence on switching rates in the industry. DECC
data shows industry average domestic switching rates of around 12% a year
for both gas and electricity.41 Since 12% of customers switch every year, then
the average life of a customer is eight years. This estimate is towards the
lower end of the churn rates provided by the Six Large Energy Firms. This
may be due to more frequent switching by SMEs and I&C customers, which is
captured in the Six Large Energy Firms’ reported churn rates but not in this
DECC dataset.
74. In our updated ROCE analysis, we have been able to include the acquisition
costs for all customer types (domestic, SME and I&C). On this basis, we
reasoned that the correct approach was to amortise these acquisition costs
over the average customer lifespans as reported by the Six Large Energy
Firms (as set out in paragraph 72), which are generally based on churn
across the whole supply business. We noted that these varied significantly
(from around four to ten years), but with a concentration of values around six
years. Therefore, in our ROCE estimates, we have used the actual customer
acquisition costs incurred by the firms and considered a range of customer
lifespans of between six years (for our base case) and eight years (in a
sensitivity) in order to estimate the value of the customer base of the firms.
75. KPMG (on behalf of E.ON) submitted that, although the Crius Energy
transaction figure (of $100) was significantly below the £280 figure that certain
of the Six Large Energy Firms had suggested, it was substantially above the
estimates used in our analysis, which suggested that the bottom-up cost
41 DECC, Quarterly domestic energy switching statistics, updated 18 December 2014.
A9.10-26
methodology was likely to substantially understate the value of suppliers’
customers. We observe that this transaction value was given to illustrate the
variation in values that could result from using transaction data. We do not
consider that it necessarily suggests that our bottom-up approach understates
the deprival value of customers, since it is also likely to reflect the expected
income streams from customers (as explained above).
76. KPMG also suggested that the lack of reliability in the CMA’s bottom-up cost
methodology was further illustrated by the large range of customer valuations
across suppliers which arise within the analysis, from [] per customer.
KPMG told us that it was unrealistic that there should be such a large range of
customer valuations across suppliers, given that margins by customer and
switching rates are likely to be similar across suppliers. It submitted that this
large range was an artefact of the narrow cost base used in the CMA’s
bottom-up cost approach, and of different cost allocations used by different
suppliers when providing the relevant costs to the CMA.
77. We observed that our estimates of customer valuation were broadly similar
across five of the Six Large Energy Firms (at around []). We recognise that
there may be some differences across firms in the treatment of customer
acquisition costs. However, we compared the Six Large Energy Firms’
descriptions of the cost types that they had included and noted that those
provided by Centrica did not suggest a systematically different approach. We
note that there are several potential reasons for Centrica’s lower customer
valuations, including the possibility that the firm has managed to exploit lower
cost acquisition channels and or leveraged some benefits of scale or brand in
attracting new customers.42 For example, Section 8 sets out details of the
relative importance of difference customer acquisition channels for the Six
Large Energy Firms, which shows significant differences across the firms with
[]. Therefore, we do not consider that there is any evidence that our
approach has been inconsistent across the Six Large Energy Firms in terms
of costs.
Other intangible assets
78. We considered SSE’s argument for the inclusion of an intangible asset to
reflect its skilled workforce, with the deprival value of this asset estimated via
the capitalisation of staff training costs. SSE stated that the costs of training
new staff represented a one-off investment which would be recouped over the
duration of their employment. It noted that these costs differed from the day-
to-day human resources costs associated with existing staff. Our view is that
42 As set out in Appendix 10.1, [].
A9.10-27
staff training costs do not create an asset that is separable from any arising
from the general running of the business. A skilled workforce cannot be sold
to another firm separate from the business as a whole, like an IT system or a
customer book can be. In addition, we note that most businesses provide their
staff with some ‘induction’ training when they start. In general, this will be
necessary to enable staff to carry out their day-to-day tasks effectively. We
have not, therefore, included an asset value for skilled workforce in the capital
employed by the Six Large Energy Firms.
ROCs
79. We observe that the Six Large Energy Firms all recorded ROC assets and
liabilities on their balance sheets, in one form or another. (SSE provided us
with information on the value of its ROC assets and liabilities separately).43
Centrica told us that ROCs arose due to purchases made from either external
parties or from joint venture wind farms. The accounting treatment for ROCs
is as follows:
Self-generated certificates are recorded at market value and
purchased certificates are recognised at cost, both within
intangible assets. The liability under the renewables obligation is
recognised based on electricity supplied to customers, the
percentages set by Ofgem and the prevailing market price. The
intangible asset is surrendered at the end of the compliance
period reflecting the consumption of economic benefit.44
80. We considered that ROCs purchased and held in order to meet the liabilities
of the firms represented operational capital employed and should, therefore,
be included within our estimates of the capital employed by the Six Large
Energy Firms, as should the provisions made for the ROC liability.45
Investments in subsidiaries and joint ventures
81. Another category of intangible assets recorded on the balance sheets of some
of the firms were investments in subsidiaries, joint ventures or minority stakes
in other businesses. We have excluded these assets on the basis that they do
43 SSE response to provisional findings, Annex 1. 44 SSE’s 2014 annual report. 45 As RWE explained, ‘the ROCs provision is the amount held to cover payment of the annual ROC obligation; this is based on the obligation level and buy-out rate as provided by OFGEM multiplied by supply volumes.’ We considered that this provision was similar in nature to a trade creditor to the business and therefore we have included provisions for ROCs in working capital.
A9.10-28
not represent operational capital employed but rather an equity stake in
another business activity.
Working capital and cash
82. Working capital comprises inventories, trade debtors and creditors, and other
short-term debtors and creditors of the business. As set out in Supplement 1
to Annex A below, the working capital balances of some of the Six Large
Energy Firms’ retail supply businesses also include some or all of the
collateral that they have had to post for trading and regulatory purposes (see
paragraphs 102 to 139 as well as Annex A for a separate discussion of
collateral). The most significant elements of working capital are trade debtors
and trade creditors.
83. There are three factors that we have considered in coming to a view on the
extent to which the working capital recorded on the firms’ balance sheets
should be included within capital employed for the purposes of our profitability
analysis. The first is the extent to which specific elements of working capital
represent operational capital employed in the business at the balance sheet
date. The second is the extent to which the balances reported at the year-end
are representative of average levels throughout the year. The third is whether
firms are able to finance their working capital needs via short-term credit
facilities, or if additional equity (cash) financing is needed for these purposes.
84. In the first instance, we note that there are several types of current assets and
liabilities that do not reflect an operational capital requirement at the balance
sheet date but rather comprise either financing or relate to the timing of tax
payments. For example, intercompany loans, whether borrowed by or lent to
the supply businesses, are financing balances, while deferred tax assets and
liabilities46 represent future adjustments in the level of tax payable due to
differences between capital allowances and a firm’s chosen depreciation
schedule. As our analysis is focused on the pre-tax profitability of the firms,
we determined that tax balances should be excluded. We have also excluded
hedge derivative assets and liabilities, which arise as the result of purchasing
energy forward. We reasoned that these assets/liabilities did not represent
capital employed by the group at the balance sheet date but future
commitments to receive and pay for energy (with movements in these values
46 A deferred tax liability occurs when taxable income is smaller than the income reported on the income statements. This is a result of the accounting difference of certain income and expense accounts. This is only a temporary difference. The most common reason behind deferred tax liability is the use of different depreciation methods for financial reporting and for tax accounting. A deferred tax asset is the opposite of a deferred tax liability. Deferred tax assets are reductions in future taxes payable, because the company has already paid the taxes on book income to be recognised in the future (like a prepaid tax).
A9.10-29
being passed through the P&L as holding gains/losses). We note that the
exclusion of these balances over the relevant period does not have a material
impact on the level of capital employed by the Six Large Energy Firms.47
85. Second, working capital figures that the parties gave fluctuate significantly not
only year on year, but also on a quarterly basis. We recognised that the
supply of electricity and gas is likely to result in working capital swings due to
the seasonality of demand. Over time, working capital balances may vary as
the result of operational changes such as credit control and payment policies.
86. In order to ensure that our measure of working capital gives a reasonable
reflection of the actual working capital that is required of the Six Large Energy
Firms, we took into account the average working capital position rather than
the year-end balance, with the exception of EDF Energy. EDF Energy told us
that the most significant movements in working capital were due to changes in
debtor profiles and provided monthly aged debt information for 2011 to 2013.
However, EDF Energy did not provide us with average working capital
information. Therefore, we have used year-end balances in estimating its
ROCE.48
87. Finally, we considered how working capital may be financed. Our analysis
seeks to reflect the operational capital employed by the businesses and we
consider that, in general, the use of the average working capital position of the
businesses should do this adequately. In this sense, any cash balances or
overdrafts represent means of funding the capital employed by the business,
rather than an operational balance. However, we recognise that to the extent
that firms are unable to obtain short-term credit to finance swings in working
capital, they may need to hold additional equity, in the form of cash, for these
purposes. In this case, we would include those cash balances in operational
capital employed. In our provisional findings, we included an additional cash
balance equal to 2% of the energy suppliers’ annual cost of sales, based on
evidence from RWE and Just Energy.49
47 For those firms that separated out these balances, their exclusion slightly increases the overall level of capital employed. We have also excluded any such holding gains or losses from the P&Ls of the Six Large Energy Firms. We have, however, taken into account the implications of these transactions in terms of capital employed (ie trading collateral requirements). 48 SSE could not produce a balance sheet for its supply business, however it provided average debtor days for the period of review and creditor days for the FY 2012/13 and 2013/14. We have used these numbers to calculate SSE’s working capital. 49 RWE held a cash balance, which averaged [] of the total cost of sales in each year, although this fluctuated from year to year. Just Energy Inc held a cash balance of 2.4% (FY 2015) and 0.7% (FY 2014). Just Energy group: Management's responsibility for financial reporting.
A9.10-30
Views of the parties
88. Centrica told us that, by using the reported creditor days of the Six Large
Energy Firms, our analysis will have overestimated the credit terms than could
be achieved by a stand-alone supplier when making payment for commodity
costs, and therefore, under-estimated the level of working capital that a large,
stand-alone energy supplier would need. Centrica suggested that it was likely
that the Six Large Energy Firms had longer credit terms with their internal
counterparties than would be achieved by a stand-alone supplier, noting that
this was the case for British Gas/Centrica. Centrica suggested that a more
appropriate means of estimating what the creditor days of a stand-alone
supplier would be was to consider the standard settlement arrangements
which were common to participants who used exchanges and broker assisted
trading. These are around 27 days for power, and around 35 days for gas.
Therefore, it proposed reducing creditor days to around 33 days and
increasing working capital accordingly.50
89. Centrica told us that the cash balances held by RWE and Just Energy were
not a relevant basis on which to estimate the working capital requirements of
a stand-alone entity, unable to rely on debt markets, since RWE has access
to wider group resources and Just Energy has access to a large (and
expensive) credit facility. It highlighted that, at their peak, its working capital
requirements were as much as [] above the cover provided by a working
capital balance equivalent to its actual debtors and a bottom up estimation of
the creditor days for a stand-alone supplier plus a cash balance equivalent to
[] of its cost of sales. Therefore, Centrica suggested that we should either
allow for a larger cash balance, or include its peak working capital
requirement in capital employed.51 In response to the PDR, Centrica
submitted that the payment terms included in the intermediary trading fee
were included in the calculation of working capital requirements and should
not be “double counted” as a separate source of credit when assessing how a
stand-alone energy supplier would meet peak working capital requirements.52
90. Centrica also told us that the working capital requirements associated with the
supply of gas were significantly more volatile than those for electricity, noting
that peak domestic gas debtors were [] above the average level, compared
with domestic electricity debtors which were [] above the average level. As
a result, Centrica stated that, by not allowing for peak working capital
requirements, our analysis not only understated the capital required by an
energy supplier but also that this understatement would be greater for gas
50 Centrica response to provisional findings, Appendix, paragraphs 119 & 120. 51 Centrica response to provisional findings, paragraphs 123–125. 52 Centrica response to the PDR, Appendix 1, paragraph 52.
A9.10-31
than for electricity. It noted that this problem would be exacerbated by the
2009 to 2013 time period considered by the CMA, which was colder than
normal, experienced a higher absolute value of commodity and would,
therefore, increase peak working capital requirements relative to average, as
well as increasing gas working capital requirement relative to electricity.
Finally, Centrica stated that it had a higher proportion of SME customers than
the other Six Large Energy Firms and this increased its average working
capital requirements and presents a greater (non-diversifiable) risk than
domestic customers.
91. SSE told us that the volatility in working capital requirements may be caused
by the needs of its supply business changing each year. As a result, the
supply business must have sufficient capital to ensure that it can manage
these variations. SSE stated that the CMA should use peak out-turn working
capital over the period, rather than average working capital in each year, to
give a ‘more robust measurement of [the] working capital requirement for an
energy supplier.’53
CMA assessment of parties’ views
92. We first considered Centrica’s argument that a stand-alone supplier would
have lower creditor days and a higher average working capital balance as a
result. We asked Centrica for information on the breakdown of its creditor
days between energy purchases and other creditors. This information showed
that when ROCs, ECO and certain other credit balances were excluded,
Centrica’s representative creditor days were between [] days (compared
with total creditor days across all balances of between []). In addition, this
pro-forma balance was an average of a number of creditor balances of
different lengths, comprising:
(a) [] days for commodity (energy) purchases;
(b) [] days for transport; and
(c) [] days for other costs (eg WHD, FIT, Cost Of Goods accruals etc).
93. The breakdown of creditor balances/days provided to us by SSE showed a
similar pattern of different input purchases having very different payment
terms, with average days increased significantly by the payment terms for
ROCs. The only one of these creditor balances that would be affected by the
different payment terms highlighted by Centrica were those for energy
purchases since all other balances were owed to third parties, which could be
53 SSE response to provisional findings, Annex 1, paragraphs 1.36–1.38.
A9.10-32
expected to offer similar payment terms to all large energy suppliers. We
observed that First Utility and Ovo Energy had [] with no [] for Ovo
Energy (up to []) or for First Utility (up to []) (see Supplement 2 to Annex
A below). These credit terms are very similar to those enjoyed by Centrica’s
retail business. Therefore, while such terms are longer than the market
standard terms, the cost of obtaining such credit (in this instance, from a
trading counterparty) has already been included in our analysis in the trading
fee (see paragraphs 116 to 122).54
94. Moreover, we noted that the average level of working capital employed by the
Six Large Energy Firms would also be affected by the firms’ efficiency in
collecting debtor balances. To the extent that some of the Six Large Energy
Firms have not been efficient in collecting these balances (for example, see
paragraph 154), our use of the (unadjusted) average level of working capital
will overstate the level of capital that an efficient firm would require (and
understate ROCE).
95. Next, we considered Centrica’s and SSE’s argument for using peak working
capital. First, we observed that a large, stand-alone supplier (Just Energy) did
have access to an overdraft facility which it used to manage its working capital
requirements concerning retail energy supply in North America. As of
September 2015, Just Energy had access to a credit facility of between
$277 million and $350 million. It explained that ‘[t]he new facility, combined
with strong earnings and cash flow generation, exceeds our working capital
liquidity needs and our expected growth investment requirements for the next
three years.’55 Similarly, []. Therefore, the assumption that Centrica makes,
that a large stand-alone supplier would not have access to such a facility, is
directly contradicted by the evidence. We reasoned that a stand-alone firm
which was of the scale of Centrica could expect to gain access to a
(proportionately) larger credit facility than Just Energy to manage its working
capital swings.56
96. We note, in response to Centrica’s submission in paragraph 89, that our
analysis does not “double count” the extended payment terms that are made
available to the Mid-tier Suppliers as part of the intermediary fee arrangement.
The evidence we have collected indicates that no additional working capital
facilities are required by the Mid-tier Suppliers to cover their peak working
54 In response to this analysis, Centrica submitted that the CMA should make adjustments to reflect the payment terms available in the market on an arm’s-length basis. (Centrica response to the PDR, Appendix 1, paragraph 42). However, as we set out here, the costs of extended payment terms are already reflected in the trading fee. 55 Just Energy press release. 56 Just Energy has approximately 2 million customers, which is equivalent to approximately 4.6 million customer equivalents. This is compared with Centrica’s 15 to 16 million customer accounts.
A9.10-33
capital requirements beyond these extended payment terms. As set out in
Supplement 2 to Annex B, First Utility’s trading arrangement allows it to have
[] and, therefore, allows First Utility [].57
97. Finally, we considered Centrica’s argument regarding a particular distortion in
its results, arising from its focus on the supply of gas. First, we noted that
movements in trade debtors are partially offset by movements in trade
creditors, as shown in the net working capital graph in Figure 2. Second, we
observed that we have used Centrica’s actual working capital balances over
the period on a quarterly basis, which means that the average balance
reflects any increased working capital requirements that result from the impact
of cold weather, or having a higher proportion of SME customers. To the
extent that colder than usual temperatures increased the size of the peak
working capital requirement, we noted that a firm (even if stand-alone) could
be expected to obtain short-term financing to manage this, particularly since
profits tend to increase during cold periods. However, we consider the
additional capital requirements that energy suppliers might require to manage
unexpected changes in demand etc in paragraphs 123 to 136. Finally, our
updated analysis covers the period 2007 to 2014, such that the impact of any
colder than average years over the period should be approximately balanced
by warmer than average years, for example 2014.
Figure 2: British Gas (residential) monthly working capital cycle
[]
Source: Centrica submission to the CMA, September 2015. Note: Centrica provided this information for its SME and I&C customers as well. This shows a similar pattern of trade debtors and trade creditors increasing and decreasing at a similar time.
98. We observed that interest payments on overdraft facilities were not reflected
in the EBIT figures of the Six Large Energy Firms.58 We considered, therefore,
what adjustments would be needed to take these costs into account. We
noted that Just Energy’s credit facility attracts interest rates of up to bank
prime plus 2.40%, depending on how the facility is used, and that as of 31
December 2015, Just Energy had incurred interest costs of $5 million on this
facility over the preceding 9 months, including for letters of credit. Just
Energy’s public statements indicate that it issues letters of credit to
counterparties to support its trading activities. 59 This interest charge is around
2.4% of the overall credit facility of $277.5 million (on an annualised basis), or
equivalent to around 0.2% of Just Energy’s total direct costs. However, we
57 []. 58 We note that interest on credit facilities which are used to manage working capital swings represent an operating cost of the business. 59 Just Energy Q3 FY16 interim results.
A9.10-34
note that Just Energy may also incur additional trading fees / costs which are
not transparent in its public accounts.
99. As set out in paragraph 93, several of the Mid-tier Suppliers in GB use the
credit terms in their intermediary trading arrangements to manage their
working capital swings without the need for additional working capital facilities
and/or the use of letters of credit. For the most part, the cost of this credit is
included in the basic fee for the trading arrangement, although [] incurs
[]. []. Similarly, [] told us that it had []. On this basis, we concluded
that the trading fee already reflected the costs of covering the usual swings in
working capital and, as a result, no further costs should be reflected in the
P&Ls of the Six Large Energy Firms.
100. In conclusion, we have found that both independent Mid-tier Suppliers in GB
and large stand-alone suppliers (in North America) are able to manage their
day-to-day working capital swings via access to short-term credit facilities, the
costs of which are captured in the trading fees of the GB Mid-tier Suppliers.
Therefore, we have concluded that the average working capital balances of
the Six Large Energy Firms’ retail businesses provided the most appropriate
measure of operational capital employed.
101. However, we observed that large stand-alone suppliers, such as Just Energy,
do hold additional cash balances. We consider that such balances are likely to
be needed by a retail energy supplier to manage its exposure to unexpected
working capital swings (as opposed to the usual seasonal swings) or losses
arising from the various business risks that it faces, eg a colder than expected
winter, a higher rate of customer churn or increased bad debts. We set out
our assessment of this capital requirement in paragraphs 123 to 136, where
we discuss ‘risk capital’.
Notional capital
Views of the Six Large Energy Firms
102. SSE told us that energy retailing in GB was an asset-light activity that entailed
considerable supply- and demand-side risks. It highlighted that much of the
capital employed in the business would be associated with managing this risk,
but that this capital was difficult to observe from company accounts given the
way in which (contingent) capital could be held and the different approaches
to risk that individual firms could adopt. SSE identified three main types of
capital that an energy firm required: trading collateral, regulatory collateral and
risk capital.
A9.10-35
(a) Trading collateral is used as security in wholesale energy markets to
protect market participants and exchanges from counterparty credit risk.
For example a retail energy supplier that wants to purchase energy may
be required to post collateral to protect the seller of energy in the event
that the retail supplier is unable to pay for the contracted energy. This
may take the form of initial margin (posted when the trade is agreed) or
variation margin (posted subsequently in response to movements in
wholesale market prices).
(b) Risk capital is capital that a firm can access at short notice to meet its
operating costs in the event that it makes a loss. SSE noted that the
primary sources of risk in this regard are associated with volumetric risks,
which comprised weather uncertainty, uncertainty around underlying
household consumption volumes, and customer churn. RWE also
highlighted counterparty credit risk, commodity cost disadvantage risk,
power shape and imbalance risks, regulatory risks, such as those arising
from green policies and other obligations, operational risks, such as
business disruption or IT system failure, bad debt risks, and various
network risks.
(c) SSE told us that regulatory collateral was required to cover indebtedness
to network companies and metering companies when network charges
were only paid after they were incurred.
103. We note that Centrica, RWE, Scottish Power and E.ON identified the same
basic categories of notional capital, although terminology varied across the
firms.
104. The Six Large Energy Firms argued for the inclusion of a notional capital
balance in capital employed for the purposes of our retail supply profitability
analysis in order to reflect the economic profitability of a financially
sustainable stand-alone supplier. For example, []. Similarly, Centrica told us
that such capital was held in the form of access to finance/lines of credit from
the group such as pooled group cash reserves and committed undrawn
facilities.60
105. SSE, [], EDF Energy, [] and [] argued that their supply businesses
benefited from being part of financially strong groups with investment grade
credit ratings; an important signal of credit worthiness for trading on the
wholesale energy markets and also for providers of debt finance. As a result:
60 Centrica response to provisional findings, paragraph 252.
A9.10-36
(a) in many cases, the Six Large Energy Firms are able to trade on a
‘collateral light’ basis, ie they are able either to not post collateral at all, or
to use non-cash forms of collateral, where security was required; and61
(b) the groups are able to absorb the cash flow and P&L impacts resulting
from the ‘business risks’ that the supply business faces and thus remain
solvent in the face of shocks. They are able to do so by accessing internal
and external sources of finance, including contingent lines of credit.
106. However, Centrica told us that if its retail supply business was stand-alone, it
would lose these benefits and, as a result, would have significant trading and
regulatory collateral requirements.62 In addition to holding capital to cover
trading collateral requirements, the Six Large Energy Firms argued that their
stand-alone retail supply businesses would require risk capital to manage
their ‘business risks’, as set out in paragraph 102.63 RWE told us that credit
lines were not an appropriate means of managing business risks due to their
short-term nature. It suggested that in order to ensure solvency for a
business, adverse shocks needed to be funded by long-term risk capital.
Given the low EBIT(DA) margins earned by energy suppliers, losses resulting
from negative shocks could not be solely funded through EBIT(DA).
107. SSE told us that, while a stand-alone supplier would not need to hold all
notional capital as cash, managing collateral and risk capital requirements via
options such as letters of credit and parent company guarantees (PCGs)
would incur costs and therefore should be included in an energy retailer’s
capital employed.
61 See details of the use of collateral in trading by each of the Six Large Energy Firms in Supplement 1. This includes both trading collateral and regulatory collateral. 62 Centrica response to CMA profitability approach paper, 23 December 2014, qu 6:
Where the credit quality of the generator or supply business is sufficiently strong, it may be possible to avoid posting cash collateral and to rely instead on arrangements such as Parent Company Guarantees (PCGs) or Letters of Credit for over-the-counter (OTC) and long form bilateral contracts. It is only possible to do so for as long as the business is sustaining the required quality of cashflows and profit performance to maintain its credit rating. Due to its limited fixed assets, a stand-alone retail supply business will not be regarded as having sufficient credit quality to be able to provide PCGs, so will instead rely upon exchange-based trading or cash margined trading where cash collateral is required. As the supply business increases in size, its expansion will not lead to any improvement in its credit quality as retail supply businesses do not utilise any significant fixed assets. We believe credit rating agencies would regard any stand-alone supply business in the UK as having extremely poor levels of business risk. Therefore the collateral requirements of a stand-alone retail supply business may be expected to be relatively expensive as cash reserves would be required to fund any variations in collateral requirements that could not otherwise be used to generate returns given the short notice on which such funds may need to be posted.
63 Please refer to Annex A of this appendix, paragraphs 9–12 for a full list of business risks listed by the parties.
A9.10-37
Estimates of notional capital
108. [] estimated that it would require notional capital of £[] to support its
supply business, of which []. [] estimated its total notional capital at £[].
SSE told us that its estimate of notional capital was determined on the basis
of the peak requirements that might have been required over the last decade,
even though this quantity of capital would not be needed most of the time.
This peak took place in September 2009, but SSE told us that capital required
to cover this contingent requirement must still be available to the firm at other
times. SSE provided a breakdown of its £[] notional capital estimate
between trading and regulatory collateral and risk capital (see Figure 3).
Figure 3: Estimate of the notional capital requirements of a stand-alone energy supplier with a similar size and hedging strategy to SSE
[]
Source: Frontier Economics, analysis on behalf of SSE, January 2015.
109. RWE estimated that it would require between [] million and [] million of
risk capital and around [] million of regulatory capital, in addition to trading
collateral. For the latter, it considered that the level of the fees paid by the
independents provided a reasonable estimate of the costs. RWE told us that
its estimate of the required risk capital was based on a probability of default of
approximately []%, which is consistent with the credit rating of RWE AG.
110. Centrica estimated that a stand-alone supply business of the scale of British
Gas would have required access to notional capital of [] billion to [] billion
in the period between 2008 and 2013. Centrica told us that the upper end of
this range was modelled based on the 2008/09 period, which was highly
volatile, with the 2009 to 2013 period estimate of notional capital being []
billion to [] billion. Centrica estimated that a stand-alone business of
equivalent size to British Gas would need to post [] to meet the collateral
requirements of its network and transmission obligations (ie as regulatory
capital).
111. Scottish Power did not model any numbers for notional capital and told us that
it would be speculative to assess the exact levels of collateral, although it
suggested that it would be of the order of hundreds of millions of pounds.
E.ON told us that due to the highly subjective nature of such calculations, and
its existing operating structure, it did not calculate a figure for notional capital.
Our assessment of notional capital
112. In our ROCE working paper (17 April 2015) and our provisional findings (7
July 2015), we observed that independent firms tended to avoid holding
A9.10-38
notional capital balances and instead used various trading arrangements in
order to cover their trading collateral requirements and to manage their
business risks (in conjunction with various other risk management tools). We
received extensive submissions from the Six Large Energy Firms on this
approach. These views are set out in detail in Annex A, together with the
evidence that we collected from stand-alone energy suppliers and trading
intermediaries, and our assessment of the arguments. In this section, we set
out a high-level summary of these views, our assessment of the arguments
and the approach we have taken to notional capital.
113. We agreed with the Six Large Energy Firms that a stand-alone energy
supplier active in GB would need to find a means of (a) purchasing energy
forward (and therefore of funding trading collateral), (b) of covering the
relevant regulatory capital requirements and (c) of managing/funding its
exposure to various business risks, such as (but not limited to) unexpected
weather conditions or customer churn rates. We observed that many of these
‘financial services’ are currently provided to the Six Large Energy Firms’ retail
supply businesses by other parts of their groups, with the value of these
services incompletely recognised in the supply businesses’ financial
statements. However, there were significant variations in the size and
composition of the estimates of ‘notional capital’ provided to us by the Six
Large Energy Firms and we noted that these estimates were based on a
number of assumptions (for example, in terms of the credit-worthiness of a
large stand-alone supplier and the level of collateral that such a firm would be
required to post). Therefore, we looked for external market benchmarks that
would give us a means of assessing the level of costs/capital that a large
stand-alone supplier would incur/employ in managing these risks. In this
context, we examined the arrangements used by independent firms,
predominantly in GB but also in North America (where we have been able to
obtain information).
114. In assessing the arguments put forward by the Six Large Energy Firms in
relation to notional capital, we have had reference to two important principles,
which underpin this type of analysis. The first, as set out in paragraph 11 is
that we are seeking to measure the return earned on the operating capital
employed in a business.64 Therefore, to the extent that a business must tie up
capital in order to undertake an activity, such as the forward-purchasing of
energy, we consider that the level of capital so-employed should be reflected
in the operating capital base. Where a firm does not have to employ capital to
64 All debt held by a business, whether long-term loans or short-term financing (eg overdraft facilities), is a means of financing those operations, with interest payments the return to debt financing (just as dividends are the return to equity financing).
A9.10-39
undertake an activity, for example, because security can be provided via a
letter of credit or a PCG, this does not form part of its capital base.65 However,
the full cost of the alternative form of security should be recognised in the
profits/capital of the firm, including any opportunity costs such as a restricted
ability to raise further finance. Similarly, where a firm is able to use an
overdraft facility to fund certain capital requirements, for example those
arising from unexpected swings in working capital, we include the average
level of working capital as capital employed, as well as the fee associated with
having access to the overdraft facility and the interest charged on the facility
(which will depend on the interest rate and the extent to which the facility is
used) in the P&L. It would be incorrect to include as capital employed the total
level of credit to which a firm has access under such a facility, since this is not
operational capital employed by the firm.
115. The second principle is that we are seeking to measure the return that a
(reasonably) efficient, stand-alone energy supplier would have earned over
the period. Therefore, where the level of capital such a supplier would have
needed to employ differs from that the Six Large Energy Firms actually did
employ, or what the Six Large Energy Firms’ balance sheets recorded them
as employing, we should make adjustments. For example, where a SLEF was
not required to post collateral but it is likely that a stand-alone supplier would
be required to do so, we consider such collateral should be included (subject
to the principle set out in paragraph 112).
Trading collateral
116. As set out in Supplement 2, we observed that several Mid-tier Suppliers in GB
have trading arrangements which allow them to both trade on an
uncollateralised basis and manage their working capital requirements (via
credit in the form of extended payment terms) in return for a fee. Their trading
partner ([]) executes trades up to [] seasons in advance of delivery, and
posts any collateral (initial or variation margin) required on the behalf of the
independents. As a result, the quantity of collateral their trading partner has to
post is determined by its balance sheet strength and perceived credit-
worthiness rather than that of the independents.
117. While RWE agreed that the level of the fee we used in our analysis was
sufficient to cover the costs of the trading collateral requirements of a large,
65 When a firm uses a letter of credit as collateral, it pays a bank a fee to provide a guarantee of the firms’ credit-worthiness. This fee is paid in lieu of the firm employing its own capital, eg in the form of a cash collateral. Therefore, for the purposes of our analysis, the fee should be recognised in the firms’ P&L but no adjustment needs to be made to capital employed.
A9.10-40
stand-alone firm, Centrica, EDF Energy and SSE argued that it understated
those costs. They put forward four main arguments:
(a) First, they argued that the fee arrangement was not scalable, ie could not
be used for firms of their size, without a significant increase in the level of
the fee due to:
(i) limited appetite from intermediaries in the UK to provide these
services, which meant that they were not available to the Six Large
Energy Firms over the relevant period; and
(ii) counterparties would be unwilling to tolerate the level of credit risk
that would arise from providing this type of service to a firm of the
scale of one of the Six Large Energy Firms. In order to accept this
level of risk, they would require greater returns.
(b) Second, they argued that the level of the fee used under-estimated that
which a large, stand-alone energy supplier would have to pay as:
(i) the trading partner [] had taken security over the assets of these
firms and the value of this alternative collateral should also be priced;
(ii) in the case of [], the trading partner [] had been granted warrants
over a portion of the firm’s equity, which entailed additional costs, that
would make the price higher to other firms;
(iii) Centrica argued that the trading partner [] was making additional
margin from (i) trading around the position of the independents, and
(ii) charging additional fees for other services, or making profits on the
bid-offer spread; and
(iv) EDF Energy noted that the fee had been set in an environment of low
volatility and low interest rates and that, in less benign conditions, it
would be higher.
(c) Third, Centrica argued that the trading intermediary model represented a
more risky model for the market as a whole, with a higher probability of a
system-wide exit. It suggested that the costs of this additional risk should
be taken into account.
(d) Fourth, Centrica noted Shell’s views that the level of the intermediary fee
would depend on an energy supplier’s customer, product and product mix.
Centrica suggested that the level of the intermediary fee would need to be
A9.10-41
higher for an energy supplier with a larger proportion of gas, SVT and
microbusiness supply.66
118. We considered the parties’ arguments regarding the scalability of the
intermediary trading arrangement and the level of the associated fee. Shell
told us that it was keen to grow its intermediary activities in the UK and that it
would be prepared to offer such services to an energy retail supplier of the
scale of one of the Six Large Energy Firms. In addition, we noted that there
were a number of other firms active in this area (including Morgan Stanley
and Macquarie), with others expressing an interest to enter this market (eg
BP). [].67 On this basis, we have concluded that it is likely that a large,
stand-alone supplier would be able to obtain a trading arrangement similar to
that of certain of the Mid-tier Suppliers and at a similar level of pricing.
However, we noted that such a supplier may choose to trade on its own
account for reasons of cost and/or flexibility. [].68 As a result, we concluded
that the fee arrangement provides a reasonable benchmark to assess the
costs of covering the trading collateral requirements of a large, stand-alone
energy supplier. These costs/risks have been priced by the market, with this
type of arrangement in use in the UK for the last few years, and for over 15
years in the USA. In addition, we saw no reason for trading fees to increase
with scale; rather we observed that the fees offered [].69
119. We did not consider that there was a higher probability of system-wide exit
under the intermediary model as this type of arrangement simply represents
an alternative means of financing certain activities, compared with the use of
standard bank credit (overdrafts, letters of credit and other loans) by the Six
Large Energy Firms.
o Adjustments to Six Large Energy Firms’ P&Ls
120. We next considered the extent to which the financial information provided by
the Six Large Energy Firms on their supply businesses already reflected the
costs that a large stand-alone supplier would incur in covering its trading
collateral requirements.
121. As set out in Supplement 1, several of the Six Large Energy Firms had either
included collateral balances within their supply business balance sheets, or
charged their supply businesses a fee to cover, at least in part, the services
provided. For example, Centrica told us that []. []. Scottish Power told us
66 Centrica response to the PDR, paragraphs 9, and 26 to 32. We address this submission in detail in paragraph 74 of Annex A. 67 See Annex A and Supplement 2 for further evidence and discussion of scalability and fee levels. 68 See Supplement 2 for further details. 69 See evidence in Supplement 2 which sets out the key terms of these trading arrangements.
A9.10-42
that some collateral balances were included in []. Similarly, we observed
that both Scottish Power and SSE charged risk premiums on their wholesale
energy costs to their supply businesses.
122. The level of these costs varied significantly across the Six Large Energy Firms
from around [] of wholesale energy costs in the case of Centrica to a risk
premium of 10% of gas costs for Scottish Power.70 In order to ensure
comparability across the firms analysed and to avoid double-counting of
costs, we have sought to remove all risk premia and recharges for interest on
collateral etc. We have then deducted a [] trading fee, benchmarked
against those paid by the independent suppliers. However, we note that we
have not sought to adjust the Six Large Energy Firms’ working capital
balances to remove cash collateral. As a result, there is some double counting
in relation to collateral balances on supply balance sheets as well as other
recharges of trading costs and administration fees, which will reduce our
estimates of ROCE.
Risk capital
123. As explained in paragraph 102, risk capital may be needed for an energy
supply business to meet the costs or losses associated with unexpected
‘shocks’ to the business, for example arising as a result of incorrect forecasts
of total customer demand, or due to changes in costs for political, regulatory
or other reasons.71
124. While we have noted that all firms face business risks and that investors are
compensated for these in the WACC, which includes a risk premium over the
risk-free rate that varies with the beta of the firm, we consider that the retail
supply of energy may entail a greater risk of incurring one-off losses as a
result of shocks to the business than many other industries.72 While we
thought that such losses could be funded by raising finance, we noted that
such a process may take time and/or be costly. As a result, we considered
70 Scottish Power charged a 10% risk premium on gas (5% on electricity) in 2007 to 2009, reduced it to 4% (2% for electricity) in 2010 and 2011 and then stopped charging a risk premium from 2012 onwards but charged the out-turn costs of the risks as they crystallised. 71 Such incorrect forecasts may arise due to unexpected weather conditions, higher or lower rates of customer churn or changes in customer demand patterns for other reasons. 72 For example, we note that several of the Six Large Energy Firms experienced losses on their energy retail supply activities during the 2007 to 2014 period (see Figure 4). This higher probability of losses is the result of customer demand fluctuating materially with the weather and the fact that energy suppliers are largely unable to change prices in response to near-term swings in demand and input costs. However, it should be noted that this volatility also means that certain years will also be characterised by significantly higher profits than usual, eg due to a cold winter.
A9.10-43
that an energy supplier would wish to ensure that it had a reasonable level of
resilience in the face of such shocks.
125. We observed that retail energy suppliers seek to manage their business risks
through a range of measures, including careful forecasting and trading,
purchasing insurance (including weather derivatives) and close control of their
working capital to give headroom in the case of an adverse shock. For
example, Centrica, E.ON and RWE told us that they used weather derivatives
to manage some of the risks associated with unexpected variations in the
weather.73 However, we reasoned that these various actions might not be
sufficient to manage a large stand-alone energy retailer’s exposure to all its
business risks across the economic cycle (as described by RWE, see Annex
A, paragraphs 47 to 51), while maintaining a reasonable level of resilience in
relation to adverse shocks. We have not sought, as Centrica proposed (see
Annex A, paragraph 45), to adjust the financial statements of the Six Large
Energy Firms to assume that they would buy weather derivatives or other
insurance to a greater extent than they currently do. We recognise that the Six
Large Energy Firms have chosen to mitigate some of the risks they face this
way and have chosen to assume the remaining risk for reasons of cost
efficiency. We reasoned that the correct approach was to examine how firms
actually sought to manage these remaining business risks.
126. As a result, we considered the level of cash held by independent energy firms
and the credit facilities to which they have access, in order to manage these
risks. In addition, we reviewed [] and [] trading agreements and
examined the financial covenants that the trading counterparty [] has put in
place in these agreements in order to protect itself against default by these
parties. This latter evidence gives the level of risk capital (in the form of cash)
that the trading counterparty [] considers it prudent for an independent
energy supplier to hold (in combination with its credit arrangements) in order
to avoid liquidity/solvency issues.
127. As detailed in paragraphs 87 and 95, Just Energy held a cash balance of
0.7% of its cost of sales in 2014 and 2.4% in 2015. In addition, the firm had
access to significant long-term and short-term debt facilities. In particular, it
has access to a large credit facility (around $277 million), which was undrawn
as of 30 September 2015.74 In 2015, First Utility held an average cash
balance that was approximately [], while Ovo Energy held an average cash
73 Similarly, firms are able to mitigate to a significant extent the risk arising from commodity cost disadvantage, by purchasing energy in blocks over time and seeking to match their purchases to the period of time over which their retail prices are fixed. While firms may be able to gain a competitive advantage by buying ahead further than their prices are fixed, and therefore choose to do so, this commercial decision will increase the exposure of the firm to commodity price changes. 74 Just Energy press release.
A9.10-44
balance of around []. These firms’ trading/credit arrangements are set out in
Supplement 2.
128. We considered that the most relevant covenant, in terms of risk capital []
(see Supplement 2 for details). For both [], this was set at [], which is
equivalent to [].
129. The evidence that we have collected indicates that stand-alone retailers seek
to protect themselves against business risks by a combination of holding cash
and having access to credit facilities. The Mid-tier Suppliers, which are active
in GB, hold cash balances of up to [] of their cost of sales and have access
to credit in the form of extended payment terms with their trading
counterparty. We observe that these cash balances are significantly above
the level that their trading counterparty [] considers necessary (as set out in
its covenants) to protect itself.75 Just Energy, a larger, stand-alone firm active
in North America holds a smaller cash balance of around 1 to 2% of its cost of
sales but has access to significant flexible working capital facilities as well as
long-term debt. As set out in paragraph 10 of Supplement 2, rapid growth in
customer numbers places substantial additional financing demands on
smaller energy suppliers. In our PDR, we provisionally concluded, therefore,
that the cash balance held by Just Energy was likely to be more relevant for a
large, stand-alone supplier which was not experiencing the rapid growth of the
GB mid-tier suppliers. Therefore, we included a cash balance of 2% of the Six
Large Energy Firms’ cost of sales to cover risk capital requirements.
130. FTI (on behalf of RWE) told us that this approach understated the level of
cash that a large stand-alone energy supplier would require. In particular, FTI
submitted that the level of cash held with respect to risk capital was not
consistent with the CMA’s application of [] and [] trading collateral
arrangements through an intermediary. FTI put forward the view that the cash
balances held by the Mid-tier Suppliers in relation to risk capital would need to
be in excess of the level set out in their covenants otherwise any negative
shock would result in a covenant breach. FTI stated that the CMA had not
provided any evidence that the Mid-tier Suppliers’ cash holdings are the result
of financing needs rather than held to absorb the costs of adverse shocks,
and that these holdings were likely to understate the amount for a large,
stand-alone supplier because they reflect a different risk strategy, which we
consider has a higher probability of default than that of any of the Six Large
Energy Firms. Finally FTI told us that we should not base our conclusion on a
single firm over only two years of operation, and that Just Energy cannot be
considered a relevant benchmark because it operates in the US and is subject
75 Global Agreements between [], as summarised in Supplement 2.
A9.10-45
to a fundamentally different market structure and regulatory pressures. FTI
stated that RWE’s bottom-up estimate of [] risk capital, which is equivalent
to a cash balance of around [] of sales was the most appropriate
benchmark. We have addressed these points below.
131. RWE submitted that the CMA should :
(a) establish an optimum probability of default for energy supply firms using
an evidence based approach, which recognises the costs for consumers
of a systemic default of energy suppliers; and
(b) calculate risk capital using the ‘bottom up’ approach as validated by
standard finance theory and used by the Six Large Energy Firms.76
132. First, we recognise that our analysis draws on various sources of evidence
rather than relying on a single model since we do not have a large, stand-
alone energy supplier in GB to use as a benchmark. Therefore, we do not
agree with FTI’s view that drawing on different sources of information creates
an inconsistency in our analysis.77 Evidence provided by Ovo Energy (see
Supplement 2) indicates that rapid growth in customer numbers places
substantial financing pressures on the business, which was one of the main
reasons for it choosing to enter into a trading arrangement with []. In
addition, we note that these Mid-tier Suppliers’ cash balances are also
required to cover their regulatory collateral requirements. We have made a
separate allowance for these costs for the Six Large Energy Firms (see
paragraph 139).78 We consider that Just Energy provides insight into how a
larger independent supplier would manage its risks. While there may be
differences in the market structure and/or regulatory environment in North
America, Just Energy faces the same fundamental challenges as GB energy
suppliers of purchasing energy in advance and selling it to customers, with
volatility in demand (and wholesale prices) arising from factors such as
fluctuations in weather conditions and customer churn. Finally, while we agree
that the Mid-tier Suppliers may wish to hold cash balances which are above
76 RWE response to PDR, Schedule 1, paragraph 4.27. 77 Our analysis is consistent in seeking to identify the costs incurred / capital employed, by a large, stand-alone energy supplier in GB. 78 We have assumed that each of the Six Large Energy Firms incurred costs of £6 million per year to cover letters of credit against regulatory capital requirements. This is equivalent to assuming that each firm employed £60 million of capital for these purposes. The Six Large Energy Firms had an average of approximately 7.4 million customer accounts, compared with an average of 0.8 million customer accounts for Ovo in 2015 and 1.5 million for First Utility in 2015. Adjusting this £60 million capital balance in proportion to customer numbers would give a cash balance of [] for Ovo and [] for First Utility. These balances equate to [] and [] of the firms’ costs of sales, respectively. We note that these Mid-tier Suppliers have to cover these regulatory requirements via cash holdings as they do not use letters of credit. Deducting these regulatory collateral balances from their cash balances would leave Ovo with a cash balance of around [] of its cost of sales to cover risk capital and any further financing pressures (eg arising from rapid customer acquisition), and First Utility with a [] cash balance for these purposes.
A9.10-46
the level set out in their covenants since they would, otherwise, be put into a
position of breach following a negative shock, we consider it more relevant
that [] since it is this latter balance that provides the protection against the
business running into liquidity issues. Therefore, we consider that a 2% cash
balance represents a reasonable level of risk capital.
133. We note RWE’s argument that the independent suppliers operate a higher
risk business model but do not consider that there is any evidence to support
this view, or the (related) argument that the level of risks assumed by the Mid-
tier Suppliers are “inefficiently high”. The Mid-tier Suppliers that we have used
as benchmarks undertake a range of risk management activities that are
sufficient to satisfy an informed counterparty ([]) as to their
creditworthiness. We consider that this indicates that their business model(s)
is not inefficiently risky. (We recognise that a business could insure itself
against default by holding a very large cash balance; however, we do not
consider that it would not necessarily be efficient for customers to pay a price
which allowed a firm to earn its cost of capital on such a balance).
134. This level of risk capital is similar to that estimated by SSE (£[]) but is
significantly below the estimates provided by [] (of £[] to £[], with a
best estimate of £[]).79 [] estimates indicate the level of capital that would
be required to cover shocks at the 99.5% level, ie in 199 out of 200 cases, the
level of risk capital held would at least cover the impact of the shocks. We
considered its approach to be extremely conservative. For example, a large
proportion of the [] estimate ([]) was attributed to capital that [] stated
should be held against customers defaulting on their debts. [], between
2007 and 2014, [] had an average annual bad debt expense (plus
associated costs) of [], equivalent to [] of revenues. In [], the year with
the highest bad debt expense, [] incurred a total cost of [] (equivalent to
[] of revenues). The average level of bad debts experienced by a firm can
be expected to be reflected in its pricing, with only shocks to this level creating
unexpected losses or gains. [].80
135. In addition, we observed that firms also use their profits as a form of insulation
against cost shocks. For example, when faced with a higher bad debt cost or
a hedging loss, a firm will reduce or stop dividend payments to shareholders
for a period of time in order to manage their cash requirements.81 As a result,
79 The £460 million figure is based on [] view of the realistic level of correlation between the various risks. 80 When compared against the other Six Large Energy Firms, RWE had the highest average bad debt expense (as a proportion of revenue) and experienced a significantly higher peak bad debt expense during the period. This may be indicative of firm-specific inefficiencies in preventing/collecting bad debts and we would not expect an efficient entrant to seek to insure itself against such an elevated level of costs. 81 Our assessment of the ROCE for the Six Large Energy Firms averages out the lower EBIT earned (or losses made) during the recession with the higher returns earned in better economic periods. As a result, it reflects the
A9.10-47
we concluded that RWE’s suggested approach was excessively conservative
and that a cash balance of around 2% of the cost of sales would provide a
reasonable buffer against the various business risks faced by a large, stand-
alone energy supplier.
136. Finally, we considered whether we should make a greater allowance for risk
capital for Centrica given its focus on the retail supply of gas, which exhibits
greater fluctuations in demand in response to (unexpected) weather
conditions than electricity. We agreed that the retail supply of gas was more
exposed to unexpected swings in the weather than the supply of electricity
and that it was, therefore, appropriate to adjust the level of risk capital
accordingly. Given that around 80% of the volume of energy supplied by
Centrica to its customers is gas, compared with around 50% for the other Six
Large Energy Firms, we have increased Centrica’s cash balance (for risk
capital purposes) proportionately to 3% of its cost of sales.
Regulatory capital
137. Centrica told us that, although it was currently able to use letters of credit to
meet the collateral requirements of its network and transmission obligations, a
stand-alone retail supply business without a credit rating would be unable to
access such alternative means of financing. It would therefore need to fund
these through cash payments. RWE estimated that it required an average
balance of [] of regulatory collateral, of which [] was in the form of [],
and [] in the form of []. FTI Consulting told us that RWE estimated that if
it was a stand-alone retail energy supply firm, it could obtain this collateral in
the form of [].
138. We have observed that the Six Large Energy Firms and the Mid-tier Suppliers
do post some collateral in cash form, although this is minimal. Ovo Energy
and First Utility told us that they were able to [] due to their sound payment
history and financial management. Evidence from Just Energy shows that it
uses letters of credit, as part of its credit facility, to manage its regulatory
collateral requirements.82
139. The evidence indicates that a large, stand-alone energy supplier would
manage its regulatory collateral requirements largely via the use of letters of
credit, with a relatively small quantity of cash collateral held in some cases.
We consider that the correct means of reflecting the costs of such collateral is
returns earned from the businesses over the period once all bad debt (and other costs) have been taken into account. 82 See Supplement 2 for Ovo Energy and First Utility evidence. Just Energy group: Management's responsibility for financial reporting.
A9.10-48
to take into account the likely interest/fees that a large, stand-alone energy
supplier would incur on these letters of credit (LoCs). As regards the level of
these fees, we took into account both FTI Consulting’s submission (on behalf
of RWE), which was 1%, and the costs incurred by Just Energy for letters of
credit (of 3.4%). We used the mid-point of this range, ie 2% as an
approximate cost for letters of credit. Finally, we observed that Centrica, EDF
Energy, RWE and SSE provided differing estimates of the level of regulatory
collateral that they would need to post (ranging from [] for Centrica to []
for EDF Energy, with RWE and SSE providing estimates of just over []). As
the size of the estimates did not appear to be correlated with the volume of
business undertaken by each of the Six Large Energy Firms, we have taken a
mid-point estimate of around £300 million and used this for all of the Six Large
Energy Firms, giving an annual cost of £6 million for letters of credit to cover
regulatory collateral.
140. SSE told us that our assumption materially underestimated the fees that
would apply to these LoCs. It submitted that a fee rate of 2% was implausible
for a stand-alone supplier of scale given the thinly capitalised business model
that the CMA envisaged could have applied over the Relevant Period. SSE
told us that given the lower credit rating that such a supplier would sustain as
a result of its weak balance sheet, it is unlikely that any bank would be willing
to provide access to sufficient LoCs to allow it to meet regulatory capital
requirements – even in return for a higher fee.83
141. We do not agree with SSE. The evidence we have relied on is the cost of
covering LoCs for large, vertically integrated suppliers, on the one hand, and
a mid-sized stand-alone supplier on the other. We consider it reasonable to
assume that a large, stand-alone energy supplier would incur a cost
approximately between these two levels. Furthermore, we note that, contrary
to SSE’s assertion, a mid-sized, stand-alone supplier (Just Energy) was able
to obtain this type of funding from banks.
Recognition of income and costs
142. Several of the Six Large Energy Firms put it to us that we should include
various costs that they had incurred over the relevant period. We consider
each of these costs in turn.
83 SSE response to the PDR, paragraph 3.3.9.
A9.10-49
Exceptional expenses
143. E.ON explained that, included within its ‘exceptional costs’, were a number of
ongoing expenses, such as rationalisation and restructuring costs (eg project
costs, redundancy costs and site closure costs) and IT costs. E.ON argued
that these costs should be deducted from its total EBIT over the period.
144. We do not agree with E.ON that costs relating to redundancies, site closures
and IT rationalisation could be considered to be ongoing costs. Fluctuations in
the level of these costs categories, together with their nature (relating to
rationalisation and restructuring of operations) indicated that these were one-
off costs, rather than ongoing costs that an efficient entrant would need to
incur. As a result, we have not deducted these expenses from the EBIT of
E.ON.
Pension deficit repair costs
145. RWE told us that it required an additional allowance to cover its pension
deficit repair costs, noting that regulators have accepted that such costs must
be recovered by firms in the past.
146. We observe that the costs of repairing a pension deficit relate to a liability
incurred by RWE prior to the beginning of the relevant period (ie when the firm
agreed to pay staff a certain level of pension). They do not reflect the profits
earned from operations during the relevant period, nor do they represent
costs that an efficient entrant would need to incur in order to operate in the
industry. As a result, we have not deducted these costs from RWE’s EBIT for
the purposes of our profitability analysis.
147. EDF Energy told us that the costs of running a legacy company (including
pension deficit repair costs and essential costs for creating efficiency savings
(e.g. IT rationalisation)) were significant and legitimate costs of running a
legacy business. While EDF agreed that new entrants would not face such
costs, it considered that an investor in any of the Six Large Energy Firms
would expect to see their return over and above such costs.84
148. We disagree with EDF that a firm or its investors could expect to recover
legacy costs in a well-functioning market as these are effectively sunk, ie they
arise from decisions that were made in the past. At the time that it becomes
known that previous decisions will result in a higher cost base and lower
returns in the future, we would expect a one-off adjustment in the value of a
firm’s equity to a level where future investors could expect to see a return that
84 EDF response to PDR, paragraph 1.8 (e).
A9.10-50
is in line with the WACC in spite of any legacy costs that the firm might face.
However, the impact of this is that shareholders at the time that the impact of
legacy costs becomes clear suffer a one-off loss.
Wholesale energy purchase costs
149. SSE told us that it recorded its cost of sales on half-hourly customers85 at the
wholesale market price and recorded the differential between the wholesale
market price and the actual cost it incurred purchasing energy (WACOE) as a
balancing figure in the EBIT of its trading business. However, SSE explained
that an alternative approach to transfer pricing could have resulted in the
electricity supplied to these half-hourly customers being charged on the same
basis as that supplied to all the other customers, ie the weighted average
purchase cost of energy. Over the relevant period, the balancing figure to the
EBIT of SSE’s trading business averaged between £[] and £[] per year.
SSE estimated that incorporating this cost would reduce the resulting ROCE
by around [] percentage points.
150. The theoretically correct benchmark for energy costs is the level that an
efficient entrant would have incurred over the relevant period. We consider
that this is approximated by the wholesale market cost at the point where a
supply contract is agreed, which is the basis on which SSE has transferred
the costs of the energy that it has procured for its half-hourly customers. In
contrast, we have observed that the alternative approach taken by SSE for its
non-half-hourly customers, []. Adjusting for this approach would increase,
rather than decrease SSE’s ROCE. We have not sought to make this
adjustment as part of our ROCE analysis.
Results of our analysis
151. In this section, we set out the results of our analysis for the Six Large Energy
Firms, based on the approach to measuring capital employed set out above.
The significant adjustments to the reported EBIT relate to the deduction of the
trading fee and customer relationships (reversal of related costs and
deduction of amortisation over six to eight years). In addition, we have
reversed the significant risk premia for SSE and Scottish Power, as well as
some recharges made by Centrica. The significant adjustments to reported
balance sheet items include the capitalisation of customer relationships, the
inclusion of a 2% cash balance for risk capital purposes (3% for Centrica) and
taking the average working capital during the financial year.
85 These customers are predominantly I&C, with a small number of SME customers.
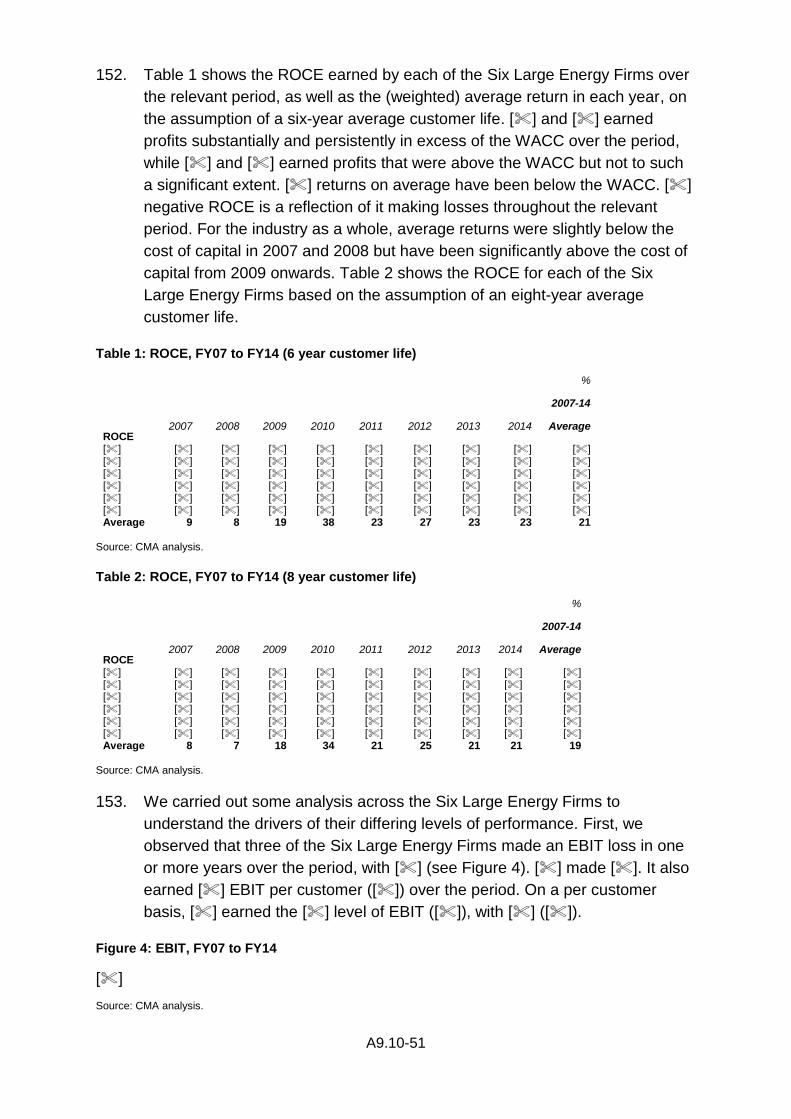
A9.10-51
152. Table 1 shows the ROCE earned by each of the Six Large Energy Firms over
the relevant period, as well as the (weighted) average return in each year, on
the assumption of a six-year average customer life. [] and [] earned
profits substantially and persistently in excess of the WACC over the period,
while [] and [] earned profits that were above the WACC but not to such
a significant extent. [] returns on average have been below the WACC. []
negative ROCE is a reflection of it making losses throughout the relevant
period. For the industry as a whole, average returns were slightly below the
cost of capital in 2007 and 2008 but have been significantly above the cost of
capital from 2009 onwards. Table 2 shows the ROCE for each of the Six
Large Energy Firms based on the assumption of an eight-year average
customer life.
Table 1: ROCE, FY07 to FY14 (6 year customer life)
%
2007-14
ROCE 2007 2008 2009 2010 2011 2012 2013 2014 Average
[] [] [] [] [] [] [] [] [] [] [] [] [] [] [] [] [] [] [] [] [] [] [] [] [] [] [] [] [] [] [] [] [] [] [] [] [] [] [] [] [] [] [] [] [] [] [] [] [] [] [] [] [] [] [] [] [] [] [] [] Average 9 8 19 38 23 27 23 23 21
Source: CMA analysis.
Table 2: ROCE, FY07 to FY14 (8 year customer life)
%
2007-14
ROCE 2007 2008 2009 2010 2011 2012 2013 2014 Average
[] [] [] [] [] [] [] [] [] [] [] [] [] [] [] [] [] [] [] [] [] [] [] [] [] [] [] [] [] [] [] [] [] [] [] [] [] [] [] [] [] [] [] [] [] [] [] [] [] [] [] [] [] [] [] [] [] [] [] [] Average 8 7 18 34 21 25 21 21 19
Source: CMA analysis.
153. We carried out some analysis across the Six Large Energy Firms to
understand the drivers of their differing levels of performance. First, we
observed that three of the Six Large Energy Firms made an EBIT loss in one
or more years over the period, with [] (see Figure 4). [] made []. It also
earned [] EBIT per customer ([]) over the period. On a per customer
basis, [] earned the [] level of EBIT ([]), with [] ([]).
Figure 4: EBIT, FY07 to FY14
[] Source: CMA analysis.
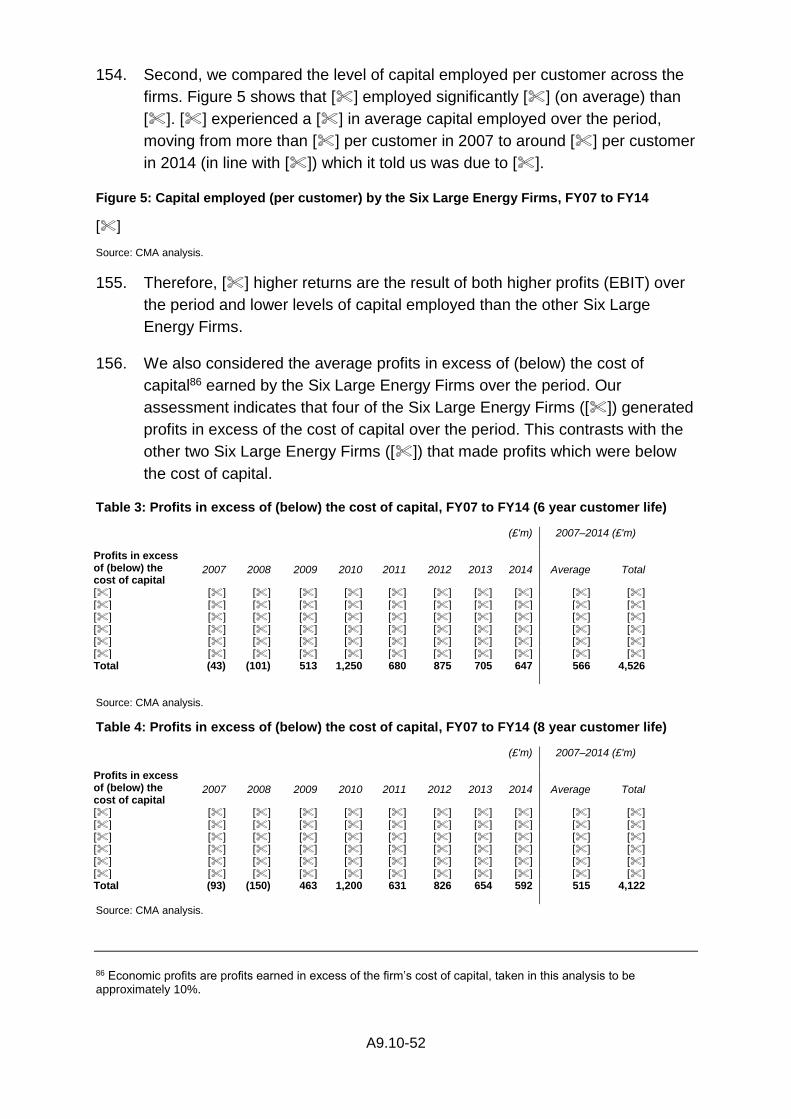
A9.10-52
154. Second, we compared the level of capital employed per customer across the
firms. Figure 5 shows that [] employed significantly [] (on average) than
[]. [] experienced a [] in average capital employed over the period,
moving from more than [] per customer in 2007 to around [] per customer
in 2014 (in line with []) which it told us was due to [].
Figure 5: Capital employed (per customer) by the Six Large Energy Firms, FY07 to FY14
[] Source: CMA analysis.
155. Therefore, [] higher returns are the result of both higher profits (EBIT) over
the period and lower levels of capital employed than the other Six Large
Energy Firms.
156. We also considered the average profits in excess of (below) the cost of
capital86 earned by the Six Large Energy Firms over the period. Our
assessment indicates that four of the Six Large Energy Firms ([]) generated
profits in excess of the cost of capital over the period. This contrasts with the
other two Six Large Energy Firms ([]) that made profits which were below
the cost of capital.
Table 3: Profits in excess of (below) the cost of capital, FY07 to FY14 (6 year customer life)
(£'m) 2007–2014 (£'m)
Profits in excess of (below) the cost of capital
2007 2008 2009 2010 2011 2012 2013 2014 Average Total
[] [] [] [] [] [] [] [] [] [] [] [] [] [] [] [] [] [] [] [] [] [] [] [] [] [] [] [] [] [] [] [] [] [] [] [] [] [] [] [] [] [] [] [] [] [] [] [] [] [] [] [] [] [] [] [] [] [] [] [] [] [] [] [] [] [] Total (43) (101) 513 1,250 680 875 705 647 566 4,526 Source: CMA analysis.
Table 4: Profits in excess of (below) the cost of capital, FY07 to FY14 (8 year customer life)
(£'m) 2007–2014 (£'m)
Profits in excess of (below) the cost of capital
2007 2008 2009 2010 2011 2012 2013 2014 Average Total
[] [] [] [] [] [] [] [] [] [] [] [] [] [] [] [] [] [] [] [] [] [] [] [] [] [] [] [] [] [] [] [] [] [] [] [] [] [] [] [] [] [] [] [] [] [] [] [] [] [] [] [] [] [] [] [] [] [] [] [] [] [] [] [] [] [] Total (93) (150) 463 1,200 631 826 654 592 515 4,122 Source: CMA analysis.
86 Economic profits are profits earned in excess of the firm’s cost of capital, taken in this analysis to be approximately 10%.
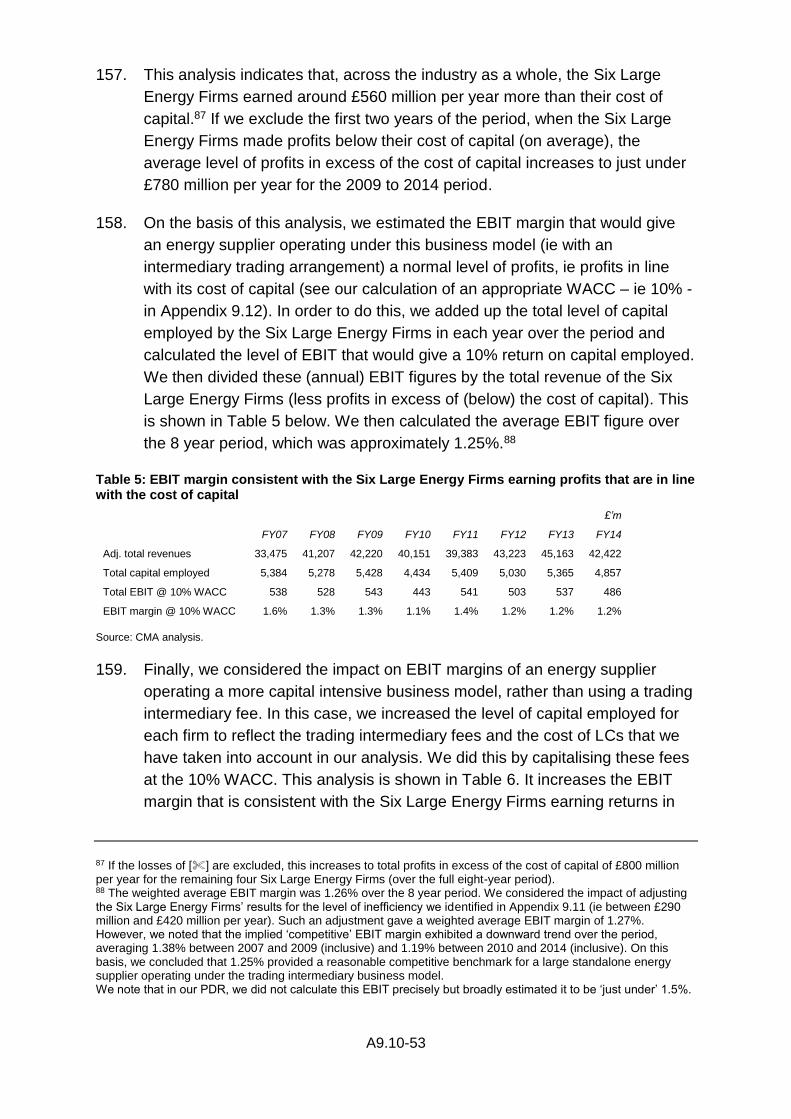
A9.10-53
157. This analysis indicates that, across the industry as a whole, the Six Large
Energy Firms earned around £560 million per year more than their cost of
capital.87 If we exclude the first two years of the period, when the Six Large
Energy Firms made profits below their cost of capital (on average), the
average level of profits in excess of the cost of capital increases to just under
£780 million per year for the 2009 to 2014 period.
158. On the basis of this analysis, we estimated the EBIT margin that would give
an energy supplier operating under this business model (ie with an
intermediary trading arrangement) a normal level of profits, ie profits in line
with its cost of capital (see our calculation of an appropriate WACC – ie 10% -
in Appendix 9.12). In order to do this, we added up the total level of capital
employed by the Six Large Energy Firms in each year over the period and
calculated the level of EBIT that would give a 10% return on capital employed.
We then divided these (annual) EBIT figures by the total revenue of the Six
Large Energy Firms (less profits in excess of (below) the cost of capital). This
is shown in Table 5 below. We then calculated the average EBIT figure over
the 8 year period, which was approximately 1.25%.88
Table 5: EBIT margin consistent with the Six Large Energy Firms earning profits that are in line with the cost of capital
£’m
FY07 FY08 FY09 FY10 FY11 FY12 FY13 FY14
Adj. total revenues 33,475 41,207 42,220 40,151 39,383 43,223 45,163 42,422
Total capital employed 5,384 5,278 5,428 4,434 5,409 5,030 5,365 4,857
Total EBIT @ 10% WACC 538 528 543 443 541 503 537 486
EBIT margin @ 10% WACC 1.6% 1.3% 1.3% 1.1% 1.4% 1.2% 1.2% 1.2%
Source: CMA analysis.
159. Finally, we considered the impact on EBIT margins of an energy supplier
operating a more capital intensive business model, rather than using a trading
intermediary fee. In this case, we increased the level of capital employed for
each firm to reflect the trading intermediary fees and the cost of LCs that we
have taken into account in our analysis. We did this by capitalising these fees
at the 10% WACC. This analysis is shown in Table 6. It increases the EBIT
margin that is consistent with the Six Large Energy Firms earning returns in
87 If the losses of [] are excluded, this increases to total profits in excess of the cost of capital of £800 million per year for the remaining four Six Large Energy Firms (over the full eight-year period). 88 The weighted average EBIT margin was 1.26% over the 8 year period. We considered the impact of adjusting the Six Large Energy Firms’ results for the level of inefficiency we identified in Appendix 9.11 (ie between £290 million and £420 million per year). Such an adjustment gave a weighted average EBIT margin of 1.27%. However, we noted that the implied ‘competitive’ EBIT margin exhibited a downward trend over the period, averaging 1.38% between 2007 and 2009 (inclusive) and 1.19% between 2010 and 2014 (inclusive). On this basis, we concluded that 1.25% provided a reasonable competitive benchmark for a large standalone energy supplier operating under the trading intermediary business model. We note that in our PDR, we did not calculate this EBIT precisely but broadly estimated it to be ‘just under’ 1.5%.
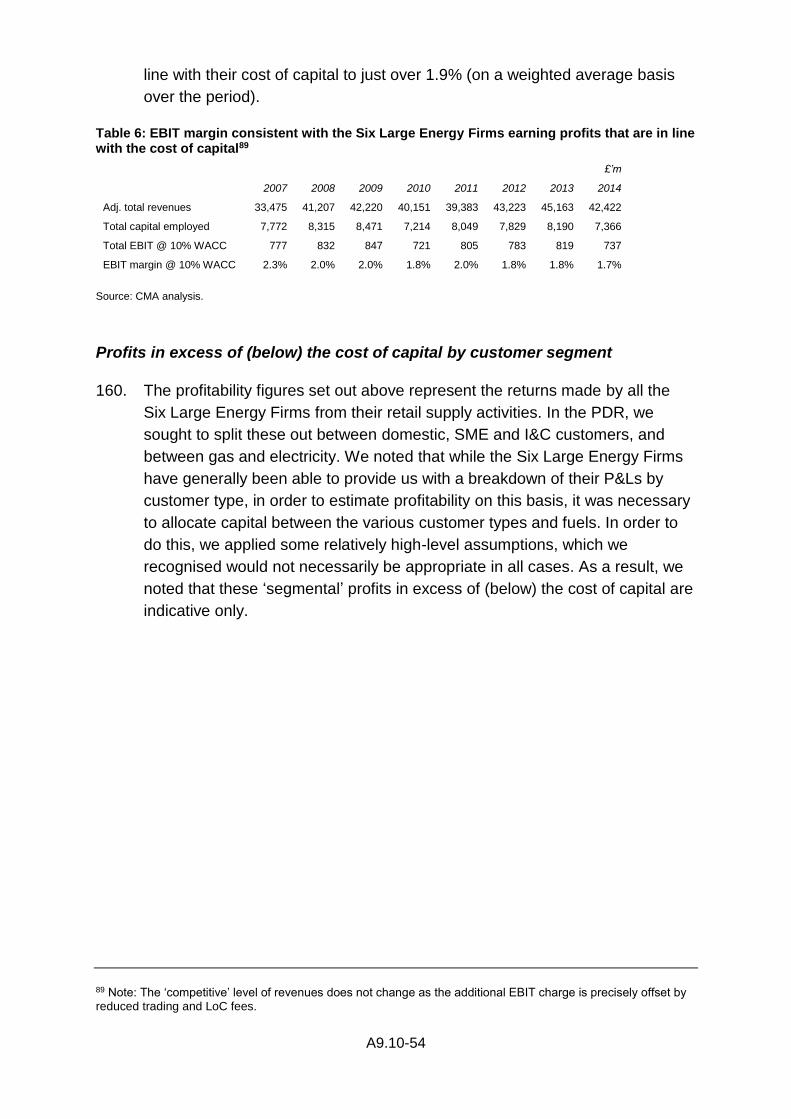
A9.10-54
line with their cost of capital to just over 1.9% (on a weighted average basis
over the period).
Table 6: EBIT margin consistent with the Six Large Energy Firms earning profits that are in line with the cost of capital89
£’m
2007 2008 2009 2010 2011 2012 2013 2014
Adj. total revenues 33,475 41,207 42,220 40,151 39,383 43,223 45,163 42,422
Total capital employed 7,772 8,315 8,471 7,214 8,049 7,829 8,190 7,366
Total EBIT @ 10% WACC 777 832 847 721 805 783 819 737
EBIT margin @ 10% WACC 2.3% 2.0% 2.0% 1.8% 2.0% 1.8% 1.8% 1.7%
Source: CMA analysis.
Profits in excess of (below) the cost of capital by customer segment
160. The profitability figures set out above represent the returns made by all the
Six Large Energy Firms from their retail supply activities. In the PDR, we
sought to split these out between domestic, SME and I&C customers, and
between gas and electricity. We noted that while the Six Large Energy Firms
have generally been able to provide us with a breakdown of their P&Ls by
customer type, in order to estimate profitability on this basis, it was necessary
to allocate capital between the various customer types and fuels. In order to
do this, we applied some relatively high-level assumptions, which we
recognised would not necessarily be appropriate in all cases. As a result, we
noted that these ‘segmental’ profits in excess of (below) the cost of capital are
indicative only.
89 Note: The ‘competitive’ level of revenues does not change as the additional EBIT charge is precisely offset by reduced trading and LoC fees.
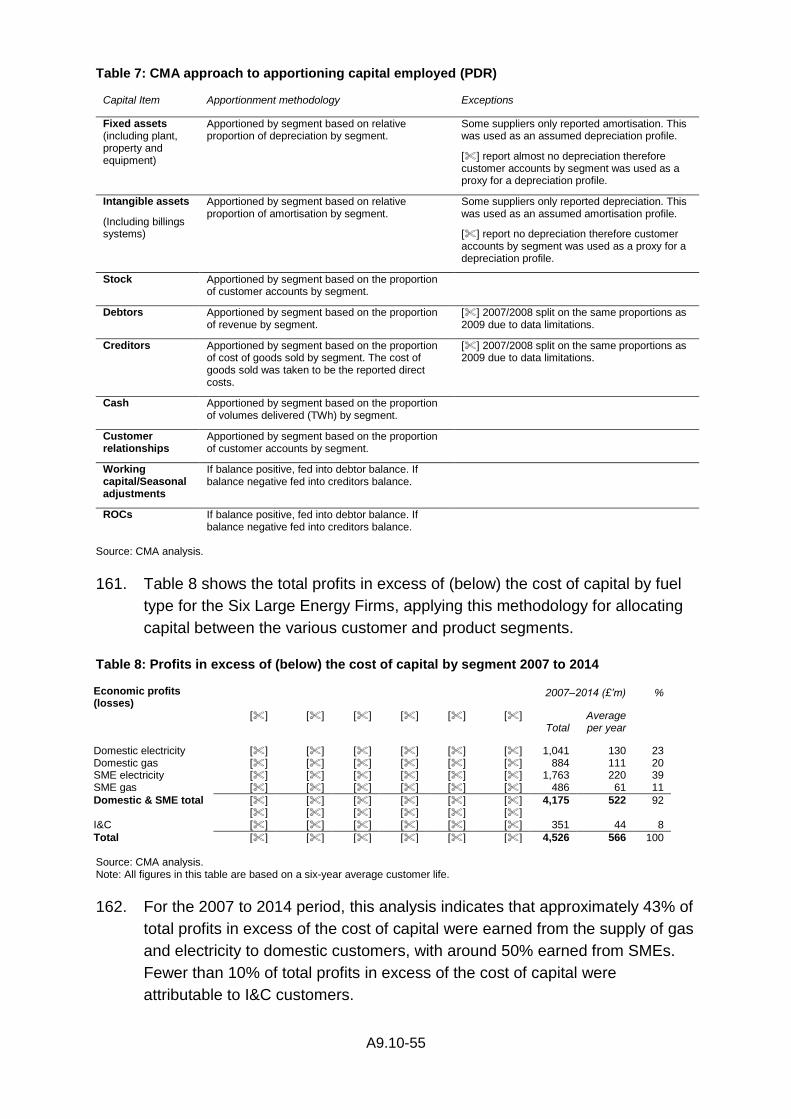
A9.10-55
Table 7: CMA approach to apportioning capital employed (PDR)
Capital Item Apportionment methodology Exceptions
Fixed assets (including plant, property and equipment)
Apportioned by segment based on relative proportion of depreciation by segment.
Some suppliers only reported amortisation. This was used as an assumed depreciation profile.
[] report almost no depreciation therefore customer accounts by segment was used as a proxy for a depreciation profile.
Intangible assets
(Including billings systems)
Apportioned by segment based on relative proportion of amortisation by segment.
Some suppliers only reported depreciation. This was used as an assumed amortisation profile.
[] report no depreciation therefore customer accounts by segment was used as a proxy for a depreciation profile.
Stock Apportioned by segment based on the proportion of customer accounts by segment.
Debtors Apportioned by segment based on the proportion of revenue by segment.
[] 2007/2008 split on the same proportions as 2009 due to data limitations.
Creditors Apportioned by segment based on the proportion of cost of goods sold by segment. The cost of goods sold was taken to be the reported direct costs.
[] 2007/2008 split on the same proportions as 2009 due to data limitations.
Cash Apportioned by segment based on the proportion of volumes delivered (TWh) by segment.
Customer relationships
Apportioned by segment based on the proportion of customer accounts by segment.
Working capital/Seasonal adjustments
If balance positive, fed into debtor balance. If balance negative fed into creditors balance.
ROCs If balance positive, fed into debtor balance. If balance negative fed into creditors balance.
Source: CMA analysis.
161. Table 8 shows the total profits in excess of (below) the cost of capital by fuel
type for the Six Large Energy Firms, applying this methodology for allocating
capital between the various customer and product segments.
Table 8: Profits in excess of (below) the cost of capital by segment 2007 to 2014
Economic profits (losses)
2007–2014 (£’m) %
[] [] [] [] [] [] Total
Average per year
Domestic electricity [] [] [] [] [] [] 1,041 130 23 Domestic gas [] [] [] [] [] [] 884 111 20 SME electricity [] [] [] [] [] [] 1,763 220 39 SME gas [] [] [] [] [] [] 486 61 11
Domestic & SME total [] [] [] [] [] [] 4,175 522 92 [] [] [] [] [] [] I&C [] [] [] [] [] [] 351 44 8
Total [] [] [] [] [] [] 4,526 566 100 Source: CMA analysis. Note: All figures in this table are based on a six-year average customer life.
162. For the 2007 to 2014 period, this analysis indicates that approximately 43% of
total profits in excess of the cost of capital were earned from the supply of gas
and electricity to domestic customers, with around 50% earned from SMEs.
Fewer than 10% of total profits in excess of the cost of capital were
attributable to I&C customers.
A9.10-56
163. In response to the PDR, CRA (on behalf of Centrica) told us that we should
make a number of adjustments to our analysis, including:
(a) Splitting out ROCs costs from the total intangible assets figure as these
relate to Electricity only and, for Centrica these all relate to Domestic
Electricity;
(b) Apportioning all BGB stock to SME Electricity and I&C (based on their
respective electricity volumes) as these balances are largely Levy
Exemption Certificates.
(c) Various creditor items are related to Electricity instead of Gas (e.g.
TNUoS, BSUoS, DUOS, FIT, etc.).
(d) As cash is directly linked to revenue less costs, using the same
apportionment as debtors would appear reasonable i.e. apportioning by
segment based on the proportion of revenue by segment.
164. CRA told us that the impact of these adjustments was that the calculated
profits in excess of the cost of capital decrease by about 9% for domestic
electricity (10% when using an 8 year customer life), while they go up by 10%
for I&C, with relatively smaller changes for domestic gas and SME gas and
electricity.90
165. As set out in Appendix 9.13, (in response to our PFs) Centrica told us that
more working capital was employed in serving business customers than
domestic customers, while E.ON told us that more working capital was
required to serve SME customers, as compared with I&C customers. Centrica
provided a comparison of debtor days between domestic and business
customers, while E.ON made a comparison between the level of working
capital employed as a percentage of turnover for SME and I&C customers.
166. We observed that the specific proposals made by the various parties in their
responses either were not possible to incorporate across all the Six Large
Energy Firms, due to limitations in the data provided91, or could not be
combined to provide a coherent view on the extent of working capital
differences (since the firms made different comparisons). We noted that
Centrica’s proposed adjustments, as set out in paragraph 163, did not result
90 CRA noted, however, that the resulting figures would still be unreliable due to the ‘false input assumptions’ driving the overall level of detriment, and the ‘crude nature’ of a “top down” allocation of capital to segments. 91 For example, several of the Six Large Energy Firms did not split out ROCs assets and liabilities from other debtor / creditor balances to allow for separate apportionment.
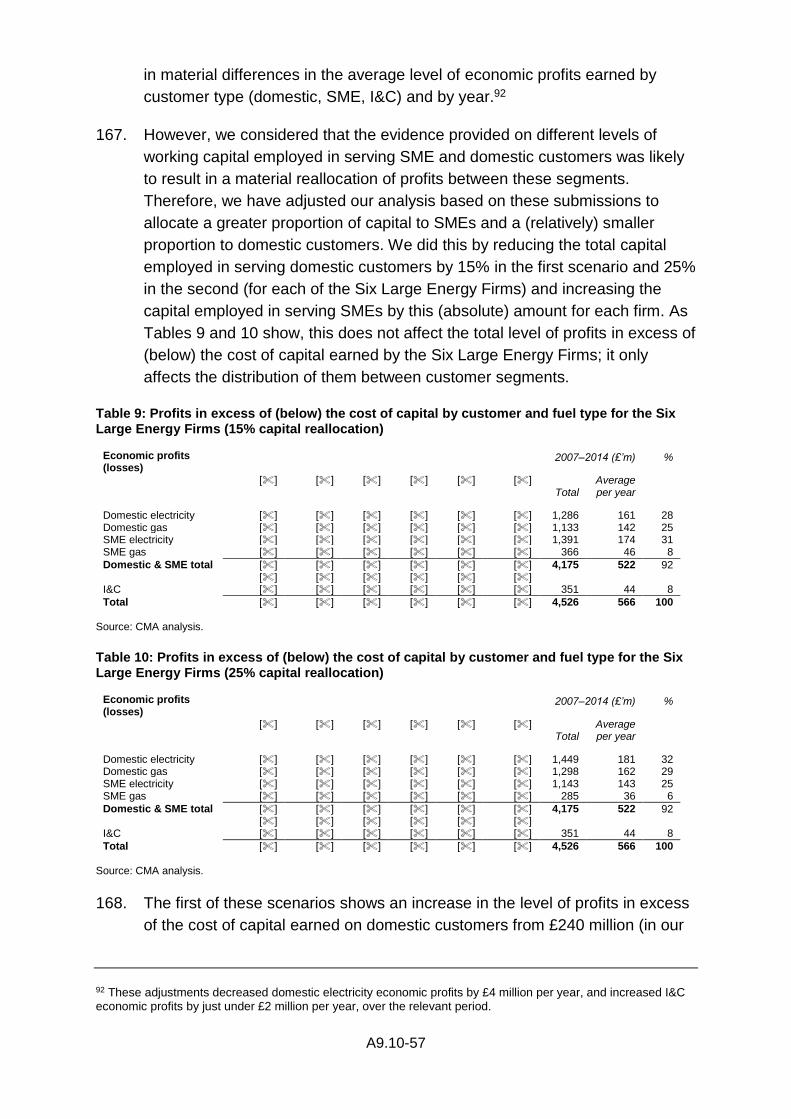
A9.10-57
in material differences in the average level of economic profits earned by
customer type (domestic, SME, I&C) and by year.92
167. However, we considered that the evidence provided on different levels of
working capital employed in serving SME and domestic customers was likely
to result in a material reallocation of profits between these segments.
Therefore, we have adjusted our analysis based on these submissions to
allocate a greater proportion of capital to SMEs and a (relatively) smaller
proportion to domestic customers. We did this by reducing the total capital
employed in serving domestic customers by 15% in the first scenario and 25%
in the second (for each of the Six Large Energy Firms) and increasing the
capital employed in serving SMEs by this (absolute) amount for each firm. As
Tables 9 and 10 show, this does not affect the total level of profits in excess of
(below) the cost of capital earned by the Six Large Energy Firms; it only
affects the distribution of them between customer segments.
Table 9: Profits in excess of (below) the cost of capital by customer and fuel type for the Six Large Energy Firms (15% capital reallocation)
Economic profits (losses)
2007–2014 (£’m) %
[] [] [] [] [] [] Total
Average per year
Domestic electricity [] [] [] [] [] [] 1,286 161 28 Domestic gas [] [] [] [] [] [] 1,133 142 25 SME electricity [] [] [] [] [] [] 1,391 174 31 SME gas [] [] [] [] [] [] 366 46 8
Domestic & SME total [] [] [] [] [] [] 4,175 522 92 [] [] [] [] [] [] I&C [] [] [] [] [] [] 351 44 8
Total [] [] [] [] [] [] 4,526 566 100
Source: CMA analysis.
Table 10: Profits in excess of (below) the cost of capital by customer and fuel type for the Six Large Energy Firms (25% capital reallocation)
Economic profits (losses)
2007–2014 (£’m) %
[] [] [] [] [] [] Total
Average per year
Domestic electricity [] [] [] [] [] [] 1,449 181 32 Domestic gas [] [] [] [] [] [] 1,298 162 29 SME electricity [] [] [] [] [] [] 1,143 143 25 SME gas [] [] [] [] [] [] 285 36 6
Domestic & SME total [] [] [] [] [] [] 4,175 522 92 [] [] [] [] [] [] I&C [] [] [] [] [] [] 351 44 8
Total [] [] [] [] [] [] 4,526 566 100
Source: CMA analysis.
168. The first of these scenarios shows an increase in the level of profits in excess
of the cost of capital earned on domestic customers from £240 million (in our
92 These adjustments decreased domestic electricity economic profits by £4 million per year, and increased I&C economic profits by just under £2 million per year, over the relevant period.
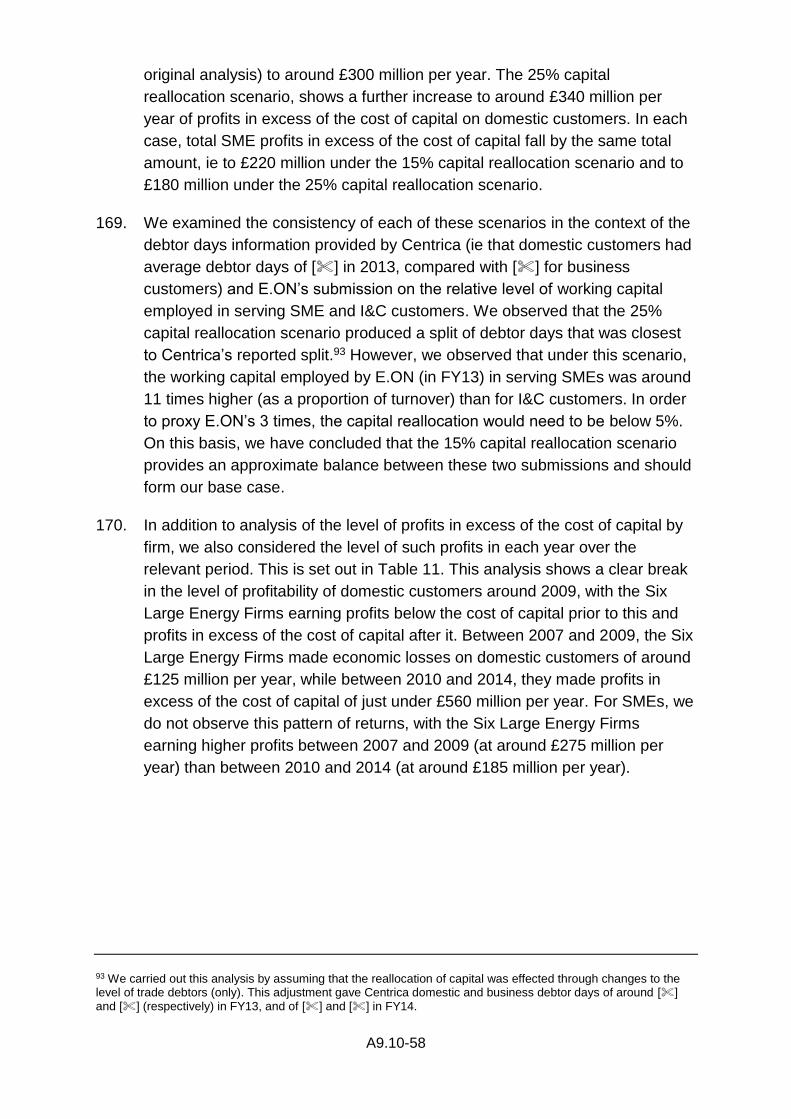
A9.10-58
original analysis) to around £300 million per year. The 25% capital
reallocation scenario, shows a further increase to around £340 million per
year of profits in excess of the cost of capital on domestic customers. In each
case, total SME profits in excess of the cost of capital fall by the same total
amount, ie to £220 million under the 15% capital reallocation scenario and to
£180 million under the 25% capital reallocation scenario.
169. We examined the consistency of each of these scenarios in the context of the
debtor days information provided by Centrica (ie that domestic customers had
average debtor days of [] in 2013, compared with [] for business
customers) and E.ON’s submission on the relative level of working capital
employed in serving SME and I&C customers. We observed that the 25%
capital reallocation scenario produced a split of debtor days that was closest
to Centrica’s reported split.93 However, we observed that under this scenario,
the working capital employed by E.ON (in FY13) in serving SMEs was around
11 times higher (as a proportion of turnover) than for I&C customers. In order
to proxy E.ON’s 3 times, the capital reallocation would need to be below 5%.
On this basis, we have concluded that the 15% capital reallocation scenario
provides an approximate balance between these two submissions and should
form our base case.
170. In addition to analysis of the level of profits in excess of the cost of capital by
firm, we also considered the level of such profits in each year over the
relevant period. This is set out in Table 11. This analysis shows a clear break
in the level of profitability of domestic customers around 2009, with the Six
Large Energy Firms earning profits below the cost of capital prior to this and
profits in excess of the cost of capital after it. Between 2007 and 2009, the Six
Large Energy Firms made economic losses on domestic customers of around
£125 million per year, while between 2010 and 2014, they made profits in
excess of the cost of capital of just under £560 million per year. For SMEs, we
do not observe this pattern of returns, with the Six Large Energy Firms
earning higher profits between 2007 and 2009 (at around £275 million per
year) than between 2010 and 2014 (at around £185 million per year).
93 We carried out this analysis by assuming that the reallocation of capital was effected through changes to the level of trade debtors (only). This adjustment gave Centrica domestic and business debtor days of around [] and [] (respectively) in FY13, and of [] and [] in FY14.
A9.10-59
Table 11: Annual level of profits in excess of (below) the cost of capital by customer and fuel type for the Six Large Energy Firms (15% capital reallocation)
£’m
2007 2008 2009 2010 2011 2012 2013 2014
Total 2007-14
Avg 2007-09
Avg 2010-14
Domestic electricity 349 226 265 (73) (29) 41 248 259 1,286
Domestic gas (523) (511) (183) 608 346 692 346 357 1,133
Domestic total (174) (285) 82 535 317 733 594 616 2,418 (126) 559
SME electricity
282 179 320 230 169 72 100 38 1,391 SME gas
(15) 32 32 105 31 72 70 37 366 SME total
267 211 352 336 201 145 170 76 1,757 277 185 I&C
(137) (27) 79 379 163 (3) (59) (45) 351 (28) 87 Total
(43) (101) 513 1,250 680 875 705 647 4,526
Source: CMA analysis
171. EDF Energy told us that this analysis, which attempts to split retail supply
balance sheets into segmented fuel-based balance sheets, was highly
subjective. EDF stated that it had previously outlined the challenges it had
faced in presenting accurate balances for its full retail supply business without
making assumptions. It told us that our analysis applied further significant
assumptions to create an economic balance sheet and that then a third layer
of high level assumptions in producing the segmentation. While this may
provide some very high level indicative results, they are not calculated with
sufficient rigour to be relied upon as a basis for conclusions.94
172. We agree with EDF that the results of this segmental analysis can only be
considered to be indicative given the number of assumptions that it has been
necessary to make in order to come to a view. This is illustrated by, among
other issues, the difficulties faced in reconciling Centrica’s and E.ON’s
observed capital differences, as set out in paragraph 169. However, in our
view, these assumptions do not mean that this analysis cannot be relied upon
as a basis for conclusions and support for our overall findings concerning
detriment and appropriate remedies. We consider that reallocating capital
towards SMEs is consistent with the evidence that has been submitted to us
by Centrica and others and, therefore, serves to improve the reliability of our
estimates. On this basis, we have concluded that our base case estimate of
the level of profits in excess of the cost of capital by segment should be the
15% capital reallocation, as set out in Tables 9 and 11. This gives average
profits in excess of the cost of capital of £300 million per year for domestic
customers and £220 million per year for SMEs.
94 EDF response to the PDR, paragraph 1.8 (f).
A9.10-60
Discussion
173. Centrica told us that our estimates of ROCE were inconsistent with a range of
other evidence, including Centrica’s group performance, financial analysts’
views and the behaviour of potential entrants. Centrica noted that its British
Gas supply business accounted for approximately 33% of its group EBIT, with
group ROCE of between 9% and 15% over the relevant period (excluding risk
capital). In addition, it stated that the very high ROCEs implied by the CMA’s
analysis had not attracted other sophisticated participants (including those
with large consumer brands and familiarity with the energy industry) into a
theoretically lucrative market with limited barriers to entry.
174. We have considered Centrica’s arguments. In the first instance, we have
observed that a large number of energy suppliers have entered the market
over the last few years, and have taken market share from the Six Large
Energy Firms.95 This is consistent with there being an opportunity to earn
significant profits in excess of the cost of capital in the industry. Second, as
set out in our assessment of the profitability of energy generation,96 we found
that Centrica made returns that were consistently below its cost of capital on
its CCGT generation assets over the period (using balance sheet carrying
values). Therefore, to the extent that group earnings are in line with the cost
of capital, this suggests that Centrica has made high returns on its retail
business. This view is supported by Centrica’s internal documents, which
show that (as of 2012) it earned significantly higher returns on its retail
activities than on its generation, upstream and North American retail activities.
175. RWE told us that we should calculate economic profit excluding [], since it
is a material outlier and its inclusion implies economic profit for the industry
which is out of line with the other five firms’ economic profits. RWE stated
that, on this basis, the industry made economic losses on domestic
customers.
176. We agree that our analysis shows a broad range of profitability across the Six
Large Energy Firms, with [] results accounting for a large proportion of the
total. However, we do not agree that it is appropriate to exclude certain firms
simply because their results are not in line with those of other operators.97
Each of the Six Large Energy Firms accounts for a material share of the GB
95 There are now more than 35 suppliers serving the domestic energy retail markets in GB. Cornwall Energy market share survey, Q1 2016. 96 See Appendix 4.2: Generation return on capital employed. 97 If we were to follow this approach, we could also exclude [] results, since the firm was heavily loss-making over the relevant period. In this case, the profits in excess of the cost of capital of the firm would be significantly higher than the average figures we have identified.
A9.10-61
market, such that we consider it important to take into account all of their
results.
177. EDF Energy told us that our ROCE calculation was highly sensitive to the
estimation of the capital employed by the Six Large Energy Firms. In
particular, EDF stated that the CMA’s exclusion of collateral from the Six
Large Energy Firms’ balance sheets has the effect of substantially lowering
the estimated capital at risk of a standalone energy supply business and
therefore contributing to high and volatile combined ROCE values across the
Six Large Energy Firms. EDF Energy provided analysis, showing the effect on
ROCE of increasing the levels of capital employed in the Six Large Energy
Firms’ retail supply businesses to reflect the value of collateral that certain of
the Six Large Energy Firms told us that they would need in order to trade and
manage their risks in wholesale markets if they were stand-alone suppliers.
This analysis showed that if the industry maximum estimate (of £4.5 billion)
was used, the average ROCE would reduce to around 5%, while if EDF
Energy’s estimate of [] was used, average ROCE would approximately
halve to around 14%. EDF Energy told us that it was misleading to assert that
the intermediary trading arrangement was both scalable, and at the price set
out in the CMA’s analysis, without also presenting sensitivity analysis.98
178. We did not agree with EDF that it was misleading to present the results of our
analysis without including sensitivities around notional capital based on the
figures provided by the Six Large Energy Firms. As EDF recognises in its
submission, the Six Large Energy Firms provided a broad range of estimates
of notional capital, which were based on several assumptions that are not
supported by the evidence we have collected.99 These estimates also imply
that larger energy suppliers face material diseconomies of scale with respect
to purchasing wholesale energy, as they imply a higher cost than is actually
incurred by the Mid-tier Suppliers. Where we find that the evidence does not
support parties’ submissions, we do not consider it appropriate to include
such submissions as sensitivity in our analysis. Therefore, we have not
included sensitivities using the parties’ estimates of notional capital.
98 EDF Energy response to the PDR, paragraph 1.8 (b). 99 For example, we note that smaller suppliers, both in GB and in North America, do have access to credit facilities (including letters of credit) which enable them to trade without holding cash (or equity) against adverse margin calls. (See paragraph 95).
A9.10-62
Annex A: Managing collateral and business risks
1. This annex sets out our assessment of the capital that a large stand-alone
energy supplier would need to employ to manage the risks of operating its
business.
Business risks faced by energy suppliers
2. The basic business model of an energy retailer is to purchase gas and
electricity on the wholesale markets and resell this energy to domestic and
microbusiness customers in smaller quantities. The large majority of contracts
currently offered to domestic and microbusiness customers are structured as
fixed-term, fixed-price contracts, or variable-price, evergreen contracts
(SVTs).
3. In both of these contract types, energy retailers commit to supplying
customers with as much energy as the customers choose to consume at a
price that is fixed, either for the term of the contract, or for a period of at least
30 days.100 In practice, energy retailers may require longer than 30 days to
change the price of their SVTs. For example, SSE told us that it could take up
to [] months to change the price of its SVT. Retail energy suppliers
generally cannot prevent domestic and SME customers from leaving during
the term of their contracts. However, energy suppliers can impose exit fees for
customers who leave a fixed-term contract before the end of the contract.
4. Under these contract types, therefore, energy retailers assume the risk that
the wholesale price of energy moves between the time that the contract is
agreed and the time that the energy must be delivered. Such movements can
create gains or losses for the supplier.
5. In order to manage these risks, energy retailers typically undertake forward
purchasing or hedging. This involves:
(a) Forecasting the level of energy that customers are expected to demand.
This is generally based on expected weather conditions, expected
customer numbers and historic patterns of demand.
(b) Purchasing the expected quantity of energy in advance at a known price.
100 Energy retailers are required to provide customers on standard variable contracts with 30 days’ notice of any upwards change in price.
A9.10-63
(c) Adjusting the quantity of energy purchased in the period leading up to
delivery in order to reflect:
(i) shaping requirements; and
(ii) changes in the expected level of demand due to changing weather
conditions, customer churn, economic conditions etc.
6. While forward purchasing allows energy suppliers to fix the input price of
energy for their customers’ expected level of demand, it is not costless.
Suppliers may need to post collateral in order to reduce counterparties’
exposure to them in the case in which wholesale prices move against the
firm.101 There is an opportunity cost to tying capital up in the form of collateral.
7. In addition, even where a firm has sought to hedge its exposure to
movements in wholesale energy prices, it remains exposed to a number of
business risks. These include:
(a) Volumetric risk, which is the risk that customers demand more or less
than was forecast due to unexpected weather conditions, unexpected
levels of customer churn, changes in underlying demand patterns etc.
(b) Residual price risk, which arises from movements in the gap between
wholesale and retail prices. This is generally correlated with volumetric
risk. For example, if an unexpected period of cold weather increases
customer demand for gas, an energy retailer will need to purchase more
gas at a higher price (but will have to sell it at a pre-agreed retail price).
(c) Other business risks, including those arising from operational leverage,
imbalance, shape, counterparty credit, non-energy input cost changes (eg
network charge fluctuations), competition, settlement, regulatory changes,
industry transformation (systems upgrades, smart meters and digital
platforms), political and changes in government policy.
8. To the extent that an energy supplier purchases energy for a longer period
than it has fixed its retail prices, this activity is (strictly) speculation rather than
hedging. For example, if a supplier sells a customer a one-year fixed tariff but
then buys energy for that customer’s expected demand for the next two years,
perhaps in the expectation that it will retain the customer, the second year’s
purchases do not provide a hedge as the retail price charged to that customer
may change. By undertaking this type of activity, an energy retailer may gain
101 Collateral offers a counterparty some protection against a situation in which a purchaser/vendor is not able to meet its obligation to purchase/sell energy and the vendor/purchaser must resell/rebuy the energy in the market at a lower/higher price.
A9.10-64
a cost advantage or disadvantage in relation to its competitors but it will also
increase the risk faced by the supplier.
Definitions
9. Trading collateral is used as security in wholesale energy markets to protect
market participants and exchanges from counterparty credit risk. For example
an energy supplier that wants to purchase energy may be required to post
collateral to protect the seller of energy in the event that the supplier is unable
to pay for the contracted energy.
10. Collateral can be in either a cash or non-cash form. Non-cash collateral refers
to security in the form of guarantees or funding arrangements such as PCGs
and letters of credit. The former is ‘on balance sheet’, and the latter is usually
‘off balance sheet’, unless a credit facility is drawn down on the balance sheet
date.
11. Wholesale market trading can be done over-the-counter (OTC) or on
exchanges. However most trading in the GB wholesale energy markets is
done OTC, compared to on exchanges. In OTC trading, the credit risk lies
directly with the counterparty. However on exchanges, credit risk resides with
the exchange. We note that OTC trades have bespoke contractual terms,
which gives the counterparties the flexibility to agree on the calculations of
initial and variation margin and margin call rules. In contrast, exchanges tend
to have uniform rules on the management of margined trades. For example,
N2EX sets out clear rules on its margining methodology and collateral
requirements.102
12. Energy supply firms also have collateral requirements relating to balancing,
transmission, distribution, and the SEC.103 We term these requirements
collectively as regulatory collateral.
Views of the Six Large Energy Firms on the intermediary fee arrangement
13. In this section, we set out the views of the Six Large Energy Firms on the
intermediary fee arrangement used by the CMA in the ROCE working paper
(17 April 2015), our provisional findings (7 July 2015) and our provisional
decision on remedies (18 March 2016) as a benchmark against which to
assess the Six Large Energy Firms’ estimates of notional capital.
102 N2EX (2014), Clearing Rules – General Terms, Section 8. 103 Cornwall Energy (2014), Credit and collateral in the GB Energy Markets, Phase 1 Volume 1: Main Report,
pp10–11.
A9.10-65
Centrica
14. Centrica told us that our approach, assuming that a large stand-alone supplier
could sub-contract the risk-management function to a third party intermediary
in return for a fee, was based on an entirely different business model from the
one that actually generated British Gas profits. It told us that it believed that
the Six Large Energy Firms already incorporated a scaled intermediary model
and were doing so for returns below those that Shell or BP would expect,
which would explain why the market has not evolved to incorporate fee
arrangements at scale. Centrica highlighted that the intermediary business
model still entailed capital being held: it only changed who held the capital
(the intermediary rather than the supplier). It stated that intermediaries earned
a return through a combination of trading around positions they took on and
the fee charged and that our assessment of profitability should recognise the
returns earned by intermediaries in trading around positions and recognise
the capital employed by intermediaries in earning a return on those positions.
15. Centrica put forward the view that the number of participants who would be
willing to enter into this type of relationship was very limited and that a more
significant market change (over and above there being demand for the
model), would be required for the arrangement to be offered at scale.
According to Centrica, this was because the firms offering the intermediary
fee services had significant trading portfolios with diversified risks which
benefited from the addition of the ‘short’ supply position in the UK. These
portfolio benefits to the intermediary allowed them to offer a fee arrangement
that appeared cost effective to the supply business, but the fee alone was not
the sole source of margin for the intermediary who would use that supply
position in their portfolio to provide a position to trade around and provide
further margin.
16. Centrica suggested that the intermediary fee model was not scalable to cover
the entire GB retail supply market at the very low fee assumed by the CMA,
highlighting that an intermediary might be able to absorb relatively small
supplier requirements in the context of a larger portfolio on a marginal cost
basis, but once the requirement becomes a significant proportion of the
trading intermediary’s activity, the basis for pricing ‘will by necessity increase
to reflect the need to compete with other uses for the capital to support the
product’.104 Centrica submitted that at larger scale, the supplier’s position
would add to the risk of the intermediary rather than reducing it, thus
increasing the cost of managing the risk. In particular, Centrica argued that:
104 Centrica response to PDR, Appendix 1, paragraph 16.
A9.10-66
(a) Even a large intermediary would not be able to tolerate the degree of
credit risk from a single counterparty that it would face if it provided
trading services to a stand-alone energy firm of the size of the Six Large
Energy Firms. It noted that this was the result of the size of the exposure
and the lack of credit ratings of such a supplier. It argued that such a
degree of credit risk, without access to customers or assets, had not been
priced.
(b) There were also limits to the exposure an intermediary would be willing to
take to a particular market or commodity price exposure, and this was
compounded in the energy markets by the strong price correlation
between gas and power. Centrica highlighted that for the purposes of a
trading intermediary, the UK supply market would be considered to be a
single book and that there were limits to how much of this any
intermediary would be prepared to take on.
(c) In order for an intermediary to dramatically increase the proportion of its
capital at risk it dedicated to the UK retail supply markets, those markets
would have to offer disproportionately high incentives to attract the capital
away from other activities. This would mean that the fees would have to
rise significantly, limiting the scalability of the intermediary activity.
17. Centrica stated that in the USA, once stand-alone energy suppliers reached a
moderate scale, they tended to seek to manage their hedging through their
own means, rather than using an intermediary. It stated that a stand-alone
energy supplier could not have trading arrangements of the type proposed
with multiple intermediaries concurrently as this was incompatible with the
intermediaries having a lien over the assets of the energy supplier. Centrica
told us that its US business, Direct Energy, had to contract with multiple
counterparties in the US in order to arrange uncollateralised trading on [] of
its deals, showing the unwillingness of trading counterparties in the US to
offer collateral-free trading arrangements at scale. It submitted that this
provided good evidence of the implausibility of scaling up the ‘collateral free’
model to cover the entire GB supply sector.105 Moreover, Centrica submitted
that the US market has quite different characteristics, including greater market
liquidity and a much larger number of small-scale stand-alone generators and
suppliers.106
18. Centrica noted that there were additional costs to an arrangement that were
not captured by the fee including:
105 Centrica response to PDR, Appendix 1, paragraph 23. 106 Centrica response to PDR, Appendix 1, paragraph 21.
A9.10-67
(a) the value of the lien held over assets or receivables, which it considered
to be a form of collateral;
(b) any additional fees for other services provided by the intermediary, or
profits earned by the intermediary on a bid-offer spread, for example; and
(c) the value of the warrants that Shell held in First Utility, which Centrica
estimated to be worth around £40 million as of July 2015.107
19. In addition, Centrica told us that its customer base was comparatively more
risky than that of other suppliers meaning that applying a uniform fee across
all suppliers for risk management services would overstate its profitability.
This was because Centrica’s customer base included:
(a) a greater proportion of SME customers that hedged over a longer period
of time (up to three years) and represented a higher bad debt risk; and
(b) a greater proportion of gas customers, which exposed the firm to the
greater risk of both weather sensitive demand (as a result of temperature
variation) and commodity price volatility.
20. Centrica suggested that the intermediary fee model would not support British
Gas’ product offering, which was characterised by a longer term hedging
strategy when compared to independent suppliers, and a higher proportion of
customers on smoothed price SVT products. As a result, if the market
adopted this model, the inevitable consequence would be that more smoothed
or longer hedged products, which require a higher capital support, would no
longer be offered, or would require a higher fee. Centrica submitted that
Shell’s evidence supported its view that a firm with its customer profile
(substantial focus on gas, SVT and microbusiness customers) would be
charged a higher intermediary fee.108
21. Centrica submitted that Shell’s evidence did not make reference to the
possibility of providing an intermediary service to the entire supply sector, but
just to a single large supplier. Moreover, it did not say that it could be provided
at the same cost. Centrica suggested that Shell’s reference to “stable growth”
and a “growing customer base” may suggest that these factors have an
impact on pricing due to the potential effect on managing risk (from the
intermediary’s perspective) and the value of the warrants held.109 Centrica
107 This valuation was based on 10% of the value between the £110 million ‘entry valuation’ and the £500 million estimated value of First Utility, which was quoted in a Financial Times article. Centrica response to the PDR, Appendix 1, paragraph 37. 108 Centrica response to PDR, Appendix 1, paragraphs 26 to 32. 109 Centrica response to PDR, Appendix 1, paragraph 17.
A9.10-68
further submitted that the CMA had not been able to cite ‘a significant slate of
alternative intermediaries who have stated themselves willing and able to offer
this service as this price level for even one major supplier.’110
22. Centrica told us that a stand-alone British Gas would pay a fee of at least []
for a simple route to market service, plus around [] for shaping risk, and
additional fees if it needed access to additional credit or services, such as
weather risk management. As a result, it estimated that a total intermediary
fee would be between [] of commodity costs.111 It added that its experience
in the US market also suggested that such an agreement might also incur
additional costs through a widening in the bid/offer spread. Centrica also
commissioned [] to create a framework to assess the virtual capital required
if it were a UK bank or an investment firm. [] used the Capital Requirements
Directive and Capital Requirements Regulation framework, which form part of
the Basel capital requirements.
23. Centrica’s advisers (CRA) stated that the CMA should not have used a fee of
[] which was below the level currently paid by Ovo Energy (of []), since
this was not supported by the evidence. CRA submitted that, based on the
structure and level of fees paid by First Utility, the firm would pay more than
[] of gas and electricity costs []. In addition, CRA noted that the CMA
should consider whether the covenants in the First Utility and Ovo Energy
trading agreements would have been met over the period in the hypothetical
case that they were stand-alone suppliers earning the CMA’s view of a
competitive EBIT.
24. Centrica put forward the view that a market based on an intermediary trading
fee would be inherently unstable with a material risk of a system-wide exit,
with potentially highly costly and inefficient consequences.
EDF Energy
25. EDF Energy stated that the fee-based comparison was taken from a period of
very low volatility and low interest cost of debt as a result of the recent
financial crisis. With low risk and a low cost of capital, the fee-based approach
would give a very low cost, which arguably should be taken as the lower
bound for the trading fee. EDF Energy suggested that when volatility returned
to the wholesale market and the cost of debt increased again, the fees
payable to intermediaries were likely to rise. It argued, therefore, that at the
very least, any future view of the cost of collateral should be based on the
110 Centrica response to PDR, Appendix 1, paragraph 18. 111 Centrica response to PDR, Appendix 1, paragraph 12.
A9.10-69
long-run volatility and cost of debt/capital rather than the recent, minimum,
cost.
26. EDF Energy questioned the scalability of the intermediary fee model, noting
that while theoretically it could be assumed there was a sufficient supply of
capital in the economy to deliver intermediary services for the UK energy
industry, the appetite of counterparties, particularly financial institutions, to re-
enter the energy markets was unclear, as was their ability to remain in the
market during periods of volatility. It observed that it was also unclear whether
intermediary services would want to support the entire industry on a fee
arrangement basis rather than just a portion of it. Furthermore, it suggested
that we should consider whether there would be undesirable knock on
impacts of all suppliers operating this way on the efficiency of the wholesale
market.
E.ON
27. E.ON told us that as Shell held warrants that would give it a stake in First
Utility of up to [], it was uncertain whether the trading and collateral
arrangements set out in our provisional findings report represented a fully
arm’s length deal.112
RWE
28. RWE told us that the fee-arrangement approach only provided the
independents with a route to market by avoiding their need to post trading
collateral. This approach only accounted for a very small minority of business
risk factors to which an energy supply business was exposed.
29. [].
30. FTI (on behalf of RWE) submitted that the trading fee estimate used by the
CMA was significantly under-valued as it failed to take into account the value
of the charge over assets and warrants granted by First Utility, which should
be added to the fee paid to trading intermediaries. In addition, FTI stated that
the CMA could not consider the [] to be an upper bound, as Shell had
indicated []. As a result, FTI considered that the CMA’s [] fee was
towards the lower end of the range and that a fee of [] should be used. FTI
noted that [] had not granted warrants.
31. RWE told us that our analysis should take into account the value of the
charge held by the trading intermediary over the assets of their
112 E.ON response to provisional findings, Appendix A, paragraph A42.
A9.10-70
counterparties. In particular, RWE submitted that “standard finance theory
would suggest that the Trading Intermediary’s assessment of the economic
value of the commercial arrangement will take account of both the value of the
expected cash inflows from the fee and the expected value of the assets
pledged as security which it will receive in the event of a default.”113
Scottish Power
32. Scottish Power questioned whether the trading fee covered all of the risks to
which an integrated energy firm was exposed. In addition, it noted that
whether the trading fee was included as a cost in the P&L, or capitalised on
the balance sheet made a difference to the estimates of ROCE given the low
observed capital intensity of the business. Scottish Power estimated that
translating the trading fee into a notional capital balance reduced the industry
ROCE from 28% to 20%.114
33. Oxera (on behalf of Scottish Power) also told us that it was necessary to take
into account the value of collateral provided to trading intermediaries via the
charge held over the independent energy suppliers’ assets when estimating
the level of the fee.115 It suggested that this should be proxied by doubling the
level of capital employed by the Six Large Energy Firms.
SSE
34. SSE told us that only a minority of stand-alone suppliers used a trading fee
arrangement, while the CMA’s assessment of barriers to entry indicated that
five suppliers (Co-operative Energy, Extra Energy, Utilita, Ecotricity, and
Haven Power) relied directly on wholesale markets rather than an
arrangement with a third party, whilst others relied either on PCGs or working
capital from their parent company.
35. SSE stated that there were likely to be a number of additional costs of using a
trading intermediary that would not be captured in the explicit fees charged. In
particular, these costs related to:
(a) allowing a charge on the company’s assets;
(b) providing warrants over a share of the company’s equity; and
113 RWE response to the PDR, Schedule 1, paragraph 4.6. 114 Scottish Power response to provisional findings, paragraphs 5.16–5.21. 115 Scottish Power response to provisional findings.
A9.10-71
(c) ensuring that financial covenants underpinning the arrangement were
consistently met.
36. SSE argued that the intermediary fee arrangement would not be scalable:
(a) To the extent that intermediaries could offer a cost-effective service to
some small stand-alone suppliers, this was likely to reflect the fact that –
when serving small suppliers – these intermediaries might be able to
manage the risk cost effectively by finding opposite trades to offset the
positions of these suppliers, thanks to a relatively well diversified portfolio.
(b) However, if intermediaries were to provide services to all suppliers (ie
large suppliers as well as smaller ones), they would hold correlated
positions and expose themselves to risks that would be too large to
diversify. In the event of a market-wide shock, all the intermediaries would
be left facing exposures in the same direction without a clear place to find
offsetting trades. As a result, some of the intermediaries might face the
possibility of default.
(c) If it were possible to provide a lower cost means of managing market risks
on a scale applicable to large suppliers then there would be an active
market to provide this service. SSE regarded the absence of such a
market as important evidence that called into question the assertion that
such arrangements could be provided at a large scale.
37. SSE argued that, for these reasons, it was not clear that intermediaries would
be prepared to offer these services to a large stand-alone supplier and that, if
they were prepared to, they would charge a substantially higher fee. SSE told
us that ‘the only available evidence’ suggested that Shell remained uncertain
about providing these services to larger suppliers and that this fell far short of
the kind of clear and convincing probative evidence that is required.116
38. SSE stated that the CMA’s analysis relied heavily on the assumption that an
intermediary taking different positions in generation and retail supply would be
able to diversify risk such that it could operate at greater scale. It observed
that Shell would be able to take a balanced position (in that it buys energy
from generators in quantities approximately equal to that which it will need to
sell) but that it would still be exposed to negative shocks affecting the ability of
the party on one side of the transaction to pay. In addition, it noted that
generators and retailers faced different types of risk which were not well
116 SSE response to the PDR, paragraph 3.3.8 (d).
A9.10-72
correlated with one another and therefore could not perfectly offset each
other.117
39. SSE put forward the view that our use of the intermediary fee arrangement
assumed certain characteristics of the market that may possibly apply in the
future but that did not exist over the relevant period. It highlighted that the
market over that period did not lend itself to the development of those
services, but rather that energy suppliers faced ‘very significant risks that
required significant notional capital’.118 In response to the PDR, SSE
submitted that [] only started providing these arrangements as of 2013,
which demonstrated that they were not available over the relevant period.119
40. SSE stated that there was material doubt as to whether an independent
supplier could draw on its credit facility at times of high volatility. It explained
that a credit facility was a short-term loan which, in the absence of reserve
equity funding (to which the supplier would need to have quick access in order
to repay these loans sufficiently quickly), would need to be replaced by long-
term debt. It highlighted that to the extent that an intermediary chose to use its
balance sheet to support an energy supplier, this should be valued by the
CMA.120 SSE told us that Shell’s evidence was explicit that the fee it charges
parties will be influenced by the level of market volatility, as well as the risk
exposure of the party in question (which, SSE submitted would be particularly
high for firms adopting the thinly capitalised business model that the CMA
envisages could have applied over the Relevant Period). Therefore, SSE
considered that the evidence did not support the contention that suppliers
would be able to access the facility on reasonable terms in times of high
market volatility.121
41. SSE argued that the CMA should take into account the cost to an energy
supplier of giving a charge over its assets to an intermediary. It suggested that
this cost was the opportunity cost of not being able to take on other debt, or
that the charge over the assets would increase the risk that an investor took
on, either raising the firm’s WACC, for a given level of capital employed, or
require additional capital to be made available.122
42. SSE told us it was concerned that profitability analysis should consider the
adequacy of the Supplier of Last Resort (SoLR) and the Energy Supply
117 SSE response to provisional findings, Annex 1, paragraph 1.29. 118 SSE response to provisional findings, Annex 1, paragraph 1.13. 119 SSE response to the PDR, paragraph 3.3.8 (a). 120 SSE response to provisional findings, Annex 1, paragraph 1.26. 121 SSE response to the PDR, paragraph 3.3.8 (b). 122 SSE response to provisional findings, Annex 1, paragraph 1.26.
A9.10-73
Company Administration arrangements in the context of events such as
systemic failure.
43. SSE told us that the CMA had interpreted the evidence from Just Energy
incorrectly, and had failed to take into account the letters of credit and surety
bonds issued by the firm. SSE argued that these should be considered in an
assessment of collateral requirements. SSE also said that the CMA did not
explore the similarities and differences of the GB and Canadian markets and
did not properly explain the relevance of Just Energy as a comparator.123
Views of the Six Large Energy Firms on risk capital
44. In this section, we set out the views of the Six Large Energy Firms on the risk
capital that a large stand-alone supplier would need to hold.
Centrica
45. Centrica noted that, in the absence of risk capital, it would be necessary to
recognise the costs of purchasing weather derivatives to mitigate the risk of a
one in twenty year winter. It explained that, although it used such products
they only provided cover for between [] of Centrica’s demand. As a result, it
argued that its EBIT should be adjusted by [] million per year.124
46. Centrica argued that it was necessary to obtain a derogation from Ofgem in
order to offer products where customers were asked to pay in advance (rather
than in arrears) and that it was not clear that such a derogation would be
provided to a larger supplier. Furthermore, if it were possible for this approach
to be used more widely, the CMA should take into account the additional risks
that this implied for customers who might lose credit balances in the case
where a supplier failed.
RWE
47. In addition to conventional risks comprising market, volume and operational
risks, RWE explained that it was operating in a market that was undergoing
significant transformation (eg systems upgrades, smart meters and digital
platforms), subject to increasing output based regulations (CERT, CESP,
ECO and smart deployment) and, furthermore, was exposed to significant
123 SSE response to provisional findings, Annex 1, paragraph 1.27. 124 Centrica did not believe there was sufficient depth in the market for weather derivatives to actually provide this level of cover.
A9.10-74
political risks – all of which increased the likelihood of a significant shock
event. As a result, the level of the fee was significantly understated.
48. In particular, RWE highlighted the following risks:
(a) Price risks: counterparty credit risk and commodity cost disadvantage.
(b) Volumetric risks: gas swing, power swing, power shape, power
imbalance, short-term pricing risk, medium-term pricing risk and customer
number forecasts.
(c) Network risks: Distribution Network Use of System (DUoS), Transmission
Network Use of System (TNUoS), Balancing Services Use of Systems
(BSUoS) and gas transportation risk.
(d) Regulatory risk: ECO, FIT, RO, CfDs, Capacity Mechanism and SMART.
There are also wider regulatory risks that may result from new schemes
or compliance risks resulting from a variety of existing obligations.
(e) Operational risk: business disruption, IT system failure and IT project
risks.
(f) Customer credit risk: bad debt and mark-to-market equivalent risk.
49. RWE told us that, due to their nature, retail energy supply businesses were
exposed to high operational leverage and carried significant risks, such that a
small deviation to operating costs or revenue could quickly cause material
financial distress (ie margins were small in absolute terms and provided a
very limited buffer for shocks). It argued that notional capital needed to be
held to manage these risks, which could not be managed through effective
hedging in the capital markets because either: (i) products did not exist; or (ii)
products provided an imperfect hedge against the risk factors. RWE
disagreed with the CMA’s suggestion that firms could efficiently use working
capital and credit lines to mitigate this risk, arguing that such an approach was
not commercially feasible because cash flows were unpredictable. As a result,
an adverse shock could cause long run solvency challenges for a firm
because the competitive industry limited the extent to which costs could be
recovered in later periods.
50. RWE put forward the view that a firm’s ROCE should recognise the potential
requirement to make investments to cover future liabilities, which may or may
not materialise. For a consistent comparison of the WACC to ROCE, RWE
asserted that it did not matter if these investments were actually made. The
fact that risks existed created the possibility that additional capital would be
A9.10-75
required. As such, investors expected to earn a return that was
commensurate with these risks.
51. RWE argued that the fact that independent suppliers held a limited amount of
notional capital led them to have a higher probability of default. RWE pointed
out that the CMA had not considered this risk and had not determined
whether the independents’ approach was economically efficient.
52. RWE further argued that the CMA must consider the wider implications for
consumers if the independents’ risk management model, which has a higher
risk of default, was forced upon other firms in the industry. RWE stated that, if
a supply business the size of the retail arms of one of the Six Large Energy
Firms defaulted, the ultimate costs to consumers could be significant. RWE
did not consider the level of notional capital held by independents to be
sufficient.
SSE
53. SSE said that the stand-alone supplier would have to hold enough risk capital
to cover EBIT losses. Therefore its proposed method to quantify risk capital
was to:
(a) quantify the short-run volumetric risks to a stand-alone supplier’s
domestic retail profits over a [] period;
(b) calculate a supplier’s expected EBIT profits; and
(c) calculate the worst case scenario EBIT loss that a supplier could make
over a four- to six-month period.
54. [] (for example, as a result of an unexpectedly mild winter). SSE described
this estimate as conservative.
Our assessment on notional capital
Trading collateral
55. We considered each of the arguments put forward by the parties in turn,
drawing on the evidence provided by the independent energy suppliers and
trading intermediaries (see Supplement 2).
56. First, we agree with Centrica that an intermediary would need to hold capital
in order to provide the trading services to energy suppliers. Shell’s
explanation of how it prices its services confirms this (see paragraph 32 of
Supplement 2). However, the level of the trading fee paid by two of the mid-
A9.10-76
tier suppliers indicates that Shell does not have to employ as much capital
(proportionately) as Centrica, SSE and EDF Energy estimated a large, stand-
alone supplier would need to employ for trading purposes. RWE agreed that
the level of the trading fee was a reasonable estimate of the cost of covering a
large, stand-alone energy supplier’s trading collateral requirements (see
paragraph 109).
57. We observe that the estimates of the collateral requirements of a large, stand-
alone energy supplier provided by Centrica, SSE and EDF Energy were
based on the assumption that such a supplier would not have an investment-
grade credit rating and would, therefore, have to post more collateral (in both
cash and non-cash forms) than the Six Large Energy Firms are currently
required to post. However, Shell (as well as a number of the other
intermediaries that are active in this market)125 also has investment-grade
credit-ratings, which would allow it to post less collateral on the trades that it
undertakes on behalf of the independents than was assumed in these
estimates. For this reason, we do not agree with Centrica that the use of the
trading fee benchmark entails the assumption of a less capital intensive
market model than is currently used. As set out in Supplement 1, the Six
Large Energy Firms carry out a significant proportion of their trades on an
uncollateralised basis.
58. We do not agree with Centrica that we should recognise the capital employed
by an intermediary in the balance sheet of an energy supplier, as this would
result in double-counting where we have already deducted a trading fee (as
the fee includes an allowance for the intermediary to earn a return on its
capital employed). Similarly, while an intermediary may be able to generate
other income streams from trading around the positions taken in providing
independents with a route to market (or retaining bid-offer spreads), we did
not consider that this provided a reason to adjust the level of the price
benchmark.126 Finally, we note that Shell’s description of its pricing (see
paragraph 32 of Supplement 2) indicates that, at the current level of the fee, it
expects to earn a reasonable return on the capital it employs in providing this
service. This contradicts Centrica’s assertion that Shell’s pricing only reflects
125 Evidence from the other intermediaries active in this sector is set out in Supplement 2. Eg Shell credit rating, Morgan Stanley credit rating, Macquarie credit rating, BP credit rating. 126 Many products/services can be produced jointly with others. Provided that the ability to ‘co-produce’ is not restricted to a particular firm in a market, we would expect the market price to be determined taking into account such alternative revenue streams. In relation to Centrica’s argument on Shell retaining the bid-offer spread on traded products, we noted that any energy retailer would have to purchase at the prices offered in the market (ie would not be able to avoid the bid-offer spread) such that Shell’s ability to keep the spread would only be relevant to the extent that it offered higher prices to its counterparties because of the agreement. [].
A9.10-77
some ‘marginal cost’ and not the need to earn a normal return on the capital
employed.
Scalability
59. Next, we considered the various arguments that were put to us regarding the
extent to which the trading fee model was scalable.
60. In the first instance, we observed that for this model to provide a reliable
benchmark of the costs of meeting an energy supplier’s trading collateral
requirements, does not require that it is used by the whole of the GB retail
energy supply industry or that such agreements were in use throughout the
relevant period. The aim of this analysis is to benchmark the “price” of the
services that were provided within the vertically integrated Six Large Energy
Firms over the relevant period. The fact that certain independent energy
suppliers may seek alternative means of funding their trading collateral
requirements once they reach a moderate size suggests that intermediary
trading arrangements may be either more costly or less flexible than
alternatives that are available to larger stand-alone energy suppliers (but not
to smaller ones). []. Similarly, [] told us that it had provided trading
services to Just Energy when the latter was relatively small in scale. However,
as Just Energy grew in scale, it went through a successful initial public
offering and was now able to draw on alternative sources of finance from
equity and debt capital markets and trade on its own account. It has chosen
however to continue to obtain intermediary trading services from [].127
61. We reasoned that for this model to provide a reliable benchmark of costs, it
would be necessary for an intermediary to be prepared to offer this type of
service to our hypothetical large, stand-alone supplier at a similar fee level to
that offered to smaller counterparties. In order to test this hypothesis, we
collected evidence from both the GB and the US energy markets.
62. Shell told us that it would have the appetite to provide intermediary services to
a firm of the scale of one of the Six Large Energy Firms. []. This view is
supported by the evidence provided by the terms of Shell’s current trading
agreements, which cover suppliers with a combined domestic market share of
around 6%128 and which offer substantial scope for its counterparties to grow
further in size.129 On the basis of this evidence, we consider that exposure to
127 Just Energy annual report 2014. The Shell evidence is set out in Supplement 2. 128 Cornwall Energy market share data, as of January 2016. 129 [].
A9.10-78
the credit risk associated with a large, stand-alone supplier is unlikely to
prevent the intermediary trading model from being scaled up.
63. Next, we considered whether there would be sufficient appetite from Shell
together with other trading intermediaries to provide these services to a
substantial proportion of the GB energy retail markets. We noted that in 2014
Shell undertook around 10 times the level of trading intermediary business in
the USA as it did in the UK, it had signed agreements that allowed
for/encouraged its counterparties to grow significantly, without requiring
contracts to be renegotiated, [] (see Supplement 2). Shell told us that the
demand for the types of intermediary services it offered had been limited in
GB by the predominantly vertically integrated structure of the generation and
retail supply markets. It highlighted that the North American electricity market
was more liquid than in the UK, in part due to a higher number of independent
generators and suppliers.130 Shell pointed to the important role independent
generators played in enabling greater access to non-standard electricity
products at more competitive prices.
64. This view was supported by the evidence provided by BP, which indicated
that it had an interest in expanding its presence in this market but that growth
to date had been limited by a lack of demand (see paragraph 47 of
Supplement 2).131 In addition to these two firms, we noted that Morgan
Stanley and Macquarie are both active in this market and were considered as
potential providers of these services by [].132 This evidence indicates that
there is appetite from intermediaries to provide these services in GB at a
significantly larger scale than is currently the case. We noted Centrica’s
submission that the CMA had not provided evidence of a significant number of
alternative suppliers who were prepared to offer this service at a similar scale
and level of pricing as Shell. However, we observe that both Shell and BP
highlighted that their activities have been limited by the level of demand,
rather than by their willingness to provide such services. In this context of
limited demand, we would not necessarily expect to see a large number of
suppliers active in the market. However, we observe the prevalence of these
agreements has increased rapidly in the last few years as smaller suppliers
have entered the GB retail energy markets and grown their customer bases,
ie supply has responded elastically to growing demand. On this basis, we
consider it likely that more suppliers of such services may seek to enter the
market as it develops, particularly if existing suppliers sought to raise their
130 These independent generators and suppliers are diverse in terms of size, and also collectively account for far greater market share (in the respective markets) than in the UK. 131 Utilita told us that it had an intermediary trading agreement with BP. 132 Supplement 2 sets out the activities of each of these firms in the UK. We note that Ovo Energy also considered other potential suppliers, including Mercuria, DONG Energy and ESB.
A9.10-79
prices. Finally, as set out in the following paragraph, Shell told us that
competition tended to be stronger for larger deals, such that a larger
counterparty may obtain lower prices than a smaller one.
65. We also considered Centrica’s evidence on the experience of Direct Energy in
the US, as well as its submissions on the different characteristics of the US
market. We observed that, unlike Direct Energy, several of the UK Mid-tier
Suppliers had been able to access fully uncollateralised trading
arrangements. In addition, we noted that while there may be differences
between the UK and US markets, the intermediary trading model has grown
rapidly in the UK in spite of lower market liquidity and a more concentrated
generation sector and both Shell and BP have expressed a desire to extend
their activities further. We consider this to be strong evidence on the
scalability of the model.
66. In terms of the impact of scaling up the intermediary arrangements on price,
we observed that under the terms of Shell’s current agreements, there are
automatic provisions for []. Shell indicated that, while its pricing depended
on the specific terms of any agreement and the riskiness of the counterparty,
there were some reasons to believe that a larger counterparty might obtain
lower prices. First, Shell noted that competition tended to be stronger for
larger deals. Second, it explained that certain costs, such as those associated
with negotiating terms for these structured trading services, did not vary
significantly with the size of the counterparty, such that a larger counterparty
may be able to obtain more attractive terms (as a unit rate). []. This
evidence directly contradicted the views of Centrica and SSE that the level of
the fee would need to rise in order to attract more supply (of intermediary
services into the market).133
67. Therefore we do not agree with Centrica’s, EDF Energy’s and SSE’s
arguments that this intermediary model is not sufficiently scalable to provide a
reliable benchmark of the costs of providing trading collateral for a large,
stand-alone firm. Moreover, we have concluded that the evidence was
consistent with fee levels remaining at around [] even where these services
were offered at a significantly larger scale. We noted RWE’s submission that
133 In the hypothetical case in which a large retail supply business were operating on a stand-alone basis, by implication there would be additional stand-alone generation (the other element of the currently vertically integrated Six Large Energy Firms). This situation of a more fragmented market is more similar to the current conditions in the US energy market, with trading intermediaries well placed to provide trading services to both independent suppliers and generators. Compared to the current market structure (of six large, vertically integrated energy firms), in the disaggregated situation trading intermediaries would be able to hedge their positions to minimise overall net exposure to one side of the market to a greater extent than they are able to do under the existing market structure. Therefore, under the intermediary model they would be able to significantly reduce their net commodity exposure, even at scale. As a result, we would not necessarily expect the level of fees to rise were the market to move towards a model of independent energy suppliers and generators trading via intermediaries.
A9.10-80
this figure was towards the lower end of the range provided by Shell for its
existing agreements and its proposal that a fee equivalent to the mid-point of
the range of fees paid by [] should be used. We do not agree that this
would be appropriate and consider that the [] estimate is a conservative
assumption for the fee that a large stand-alone energy supplier would face.
This is due to the clear pattern of [] (set out in the agreements) and the
significant difference in size between the Six Large Energy Firms and [].
68. Finally, we considered Centrica’s submission that we should consider whether
the Six Large Energy Firms would have been able to meet the covenants set
out in the mid-tier suppliers’ trading agreements. We noted that covenants are
included within such agreements to provide protection to the creditor (in this
case, Shell) against default by a counterparty. Therefore, we would expect
such covenants to be tailored to the specific circumstances of the
counterparties and not necessarily relevant to any / all counterparties with a
similar agreement. For example, we consider that the covenant in First
Utility’s agreement (that []) would not be relevant for a larger business with
a stable customer base. As a result, we did not agree that the reliability of the
trading fee depended on the Six Large Energy Firms being able to meet the
covenants set by Shell for the mid-tier suppliers. As set out in Appendix 9.13,
the Six Large Energy Firms generally earned significantly higher gross and
EBIT margins over the relevant period than the mid-tier suppliers (and would
have done so even if they had paid the trading fee we have applied in our
analysis). On this basis, we consider it reasonable to assume that they would
have paid a similar level of trading fees if they had been stand-alone energy
suppliers (or, at least, that such fees would have been available to a well-
managed large stand-alone energy retail supplier).
Pricing of the trading fee
69. Next, we have considered the arguments put forward regarding the pricing of
the intermediary fee. First, we do not agree with parties’ submissions that the
charge that certain Mid-tier Suppliers have granted over their assets means
that an adjustment should be made to the level of the fee to reflect this
alternative form of capital. The value of the security provided is already
reflected in the assets on the balance sheet of these energy suppliers. The
trading arrangement functions as a form of financing for the Mid-tier Suppliers,
with the charge over the assets and shares providing the lender (in this case
Shell) with protection from a disorderly insolvency process.134 Adjusting the
134 A disorderly insolvency process can significantly reduce the value realised for creditors, particularly where the value in a business resides in its trade (eg customer debts) rather than fixed assets, such as buildings.
A9.10-81
level of the fee charged (or the capital employed) to reflect the value of the
collateral provided would, therefore, result in the double-counting of this
capital. We have made the assumption that a large, stand-alone energy
supplier would be funded entirely by equity.135 As a result, such a firm would
also be able to grant a charge over its assets in return for a fee of a similar
level to that paid by the independent suppliers. We agree with SSE that there
is an opportunity cost to the business of doing this but we consider that this is
already reflected in the cost of capital that we have estimated (ie as a result of
the 100% equity assumption). Therefore, no adjustments should be made to
the fee on this basis.
70. []. We examined Centrica’s estimate of the value of the warrants provided
by First Utility (of [], or [] of 2014 wholesale energy costs). This approach
assumed that as of July 2015, First Utility was worth around £500 million.
However, we observed that First Utility generated EBITDA of [] in FY15. On
the assumption that First Utility were valued at around 8 to 9 times its
EBITDA, this would give the business a value of around [].136 []. We
compared the fees paid by [], which has not granted warrants to Shell as
part of its trading arrangement, and those paid by []. We observed that the
level of the trading fee paid [] was very similar both in terms of the current
level and in terms of the discounts provided for growing overall volumes. On
this basis, we concluded that the impact of the warrants on the level of the fee
was unlikely to be substantial.
71. Third, in order to assess Centrica’s submission that Shell was earning
additional income from its counterparties, ie other than the trading fee, we
have reviewed Shell’s trading agreements with [] and []. We found that
there were no other fees or costs included in these agreements. [].
72. Fourth, we have considered whether a higher trading fee would apply to a firm
such as Centrica, due to either its longer hedging profile or its greater focus
on gas, which is more sensitive to fluctuations in the weather, or SVT
customers. The evidence from [] (see paragraphs 1 and 14 of Supplement
2) indicated that the level of the fee did not vary according to the period over
which forward purchases were made and that the existing trading
arrangements allowed energy suppliers to purchase up to [] seasons in
advance. []. We compared this with the evidence we had on the hedging
strategy of the Six Large Energy Firms (see Figure 1).
135 See Appendix 10.4 to Provisional Findings: Cost of Capital. 136 We have based this valuation range on the approximate valuation of Just Energy, which has an enterprise value of around $1.8 billion (as of June 2016) and FY16 EBITDA of $208 million. Just Energy FY16 Annual Report
A9.10-82
Figure 1: Median contracted volume as a percentage of final demand, by firm
[] Source: CMA analysis.
73. This shows that the Six Large Energy Firms generally purchase less than []
of their final demand more than two years in advance. As around [] of
demand up to 12 months out, and around [] of demand for between one
and two years out, is contracted, purchases further in advance will generally
account for no more than around [] of total contracted volumes. Therefore,
we concluded that the terms of these agreements would not constrain the Six
Large Energy Firms’ ability to pursue their existing hedging strategies
materially (if at all), and therefore, the level of fee the Six Large Energy Firms
might have to pay would not be expected to differ from that paid by the Mid-
tier Suppliers as a result of their hedging strategy.
74. Next, we note that Shell indicated that all its counterparties needed to have a
defined hedging policy but Shell did not indicate that hedging to cover SVT
contracts was more risky.137 Similarly, Shell indicated that the pricing of its fee
would be affected by the overall riskiness of the customer base of an energy
supplier but noted that this was not necessarily in direct relation to the
riskiness of particular customer types (such as SMEs), since a supplier could
ensure that no individual commercial customer accounted for more than a
certain percentage of its business. Therefore, while a firm such as Centrica
may have a greater proportion of SME customers than the Mid-tier Suppliers,
with higher average bad debt costs, we do not consider that this would make
it a more risky counterparty than one of the Mid-tier Suppliers given its
significantly larger domestic customer base and, therefore, its reduced
exposure to any given customer. Finally, with respect to differences between
gas and electricity, Shell told us that the gas wholesale market was both more
liquid and less complex to trade than power. This indicates that having a
higher proportion of gas supply would not increase the average fee, as
Centrica submitted.
75. Next, as the trading fees are quoted as a price per unit traded rather than a
percentage, we examined whether the level of the fee would have varied
significantly over the period of review. We collected evidence on electricity
and gas prices over the relevant period (see Figure 2 and Figure 3 below) and
compared these with the schedule of fees set out in the intermediary trading
agreements (see Supplement 2). We noted Centrica’s submission that at
137 During its hearing with the CMA, Shell was asked about the hedging policy that it might wish to see an energy retail supplier adopt for SVT customers. Shell did not express a view on what such a hedging policy should be but did indicate that it would want to see that any counterparty had defined such a policy in the broader context of risk management.
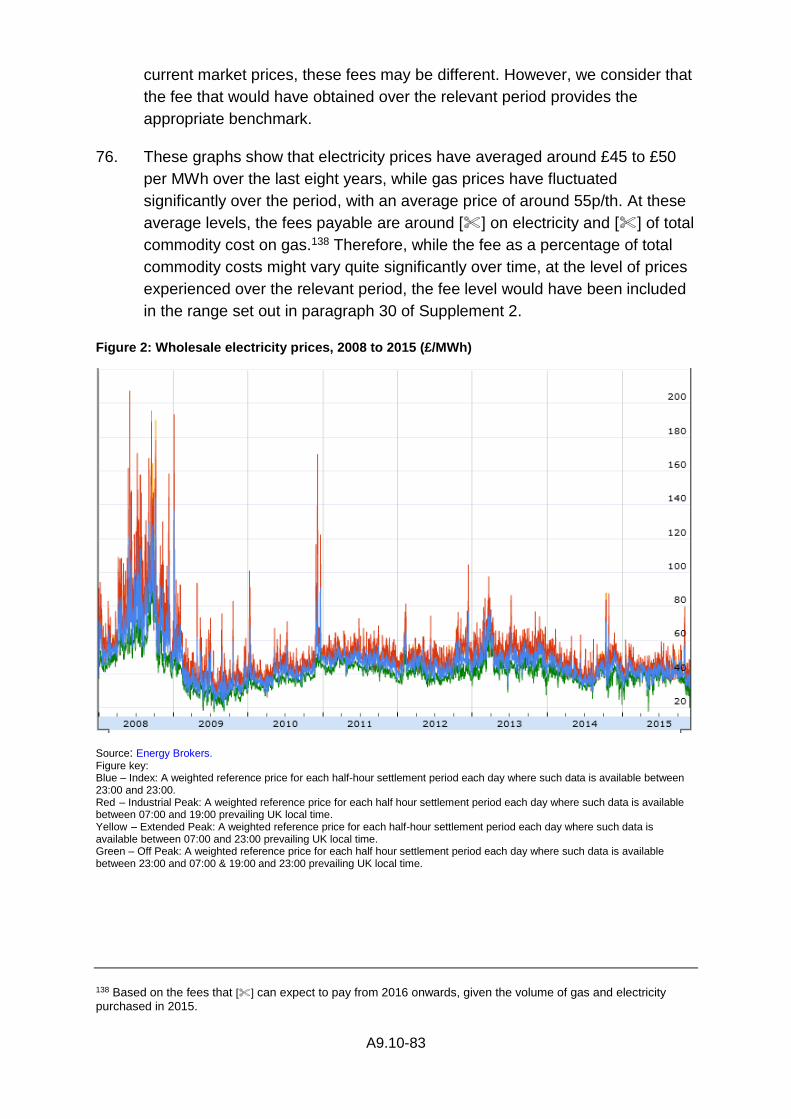
A9.10-83
current market prices, these fees may be different. However, we consider that
the fee that would have obtained over the relevant period provides the
appropriate benchmark.
76. These graphs show that electricity prices have averaged around £45 to £50
per MWh over the last eight years, while gas prices have fluctuated
significantly over the period, with an average price of around 55p/th. At these
average levels, the fees payable are around [] on electricity and [] of total
commodity cost on gas.138 Therefore, while the fee as a percentage of total
commodity costs might vary quite significantly over time, at the level of prices
experienced over the relevant period, the fee level would have been included
in the range set out in paragraph 30 of Supplement 2.
Figure 2: Wholesale electricity prices, 2008 to 2015 (£/MWh)
Source: Energy Brokers. Figure key: Blue – Index: A weighted reference price for each half-hour settlement period each day where such data is available between 23:00 and 23:00. Red – Industrial Peak: A weighted reference price for each half hour settlement period each day where such data is available between 07:00 and 19:00 prevailing UK local time. Yellow – Extended Peak: A weighted reference price for each half-hour settlement period each day where such data is available between 07:00 and 23:00 prevailing UK local time. Green – Off Peak: A weighted reference price for each half hour settlement period each day where such data is available between 23:00 and 07:00 & 19:00 and 23:00 prevailing UK local time.
138 Based on the fees that [] can expect to pay from 2016 onwards, given the volume of gas and electricity purchased in 2015.
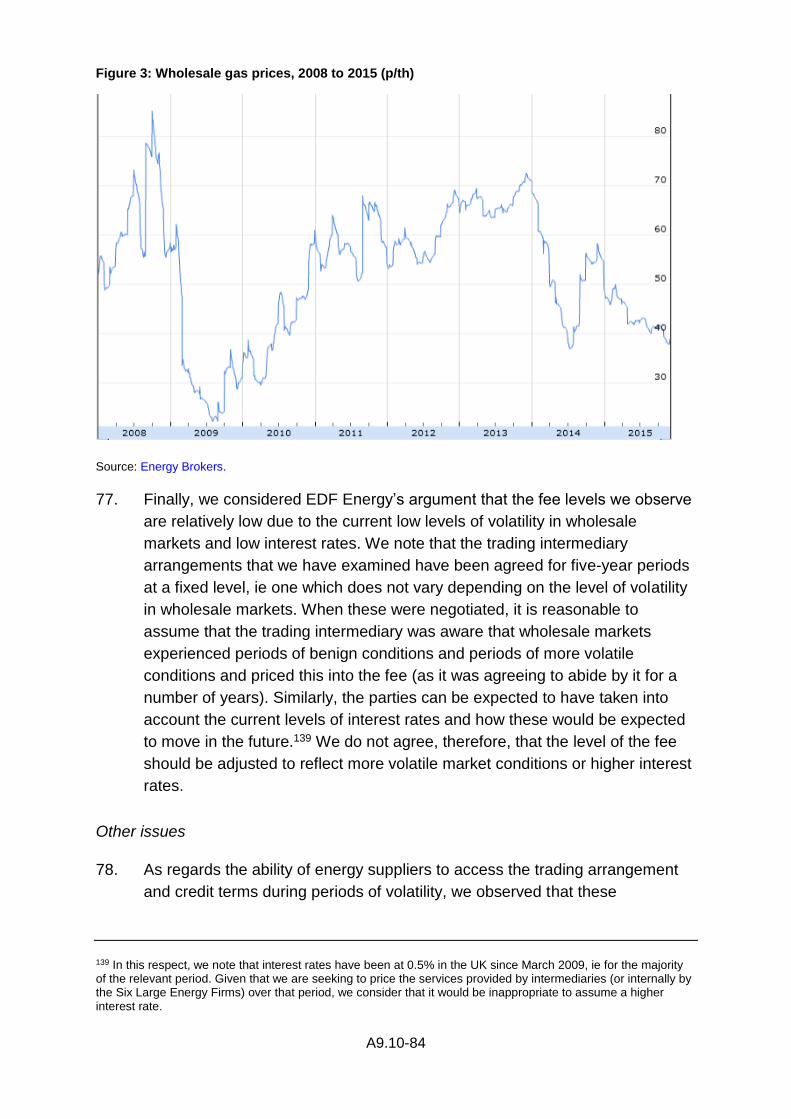
A9.10-84
Figure 3: Wholesale gas prices, 2008 to 2015 (p/th)
Source: Energy Brokers.
77. Finally, we considered EDF Energy’s argument that the fee levels we observe
are relatively low due to the current low levels of volatility in wholesale
markets and low interest rates. We note that the trading intermediary
arrangements that we have examined have been agreed for five-year periods
at a fixed level, ie one which does not vary depending on the level of volatility
in wholesale markets. When these were negotiated, it is reasonable to
assume that the trading intermediary was aware that wholesale markets
experienced periods of benign conditions and periods of more volatile
conditions and priced this into the fee (as it was agreeing to abide by it for a
number of years). Similarly, the parties can be expected to have taken into
account the current levels of interest rates and how these would be expected
to move in the future.139 We do not agree, therefore, that the level of the fee
should be adjusted to reflect more volatile market conditions or higher interest
rates.
Other issues
78. As regards the ability of energy suppliers to access the trading arrangement
and credit terms during periods of volatility, we observed that these
139 In this respect, we note that interest rates have been at 0.5% in the UK since March 2009, ie for the majority of the relevant period. Given that we are seeking to price the services provided by intermediaries (or internally by the Six Large Energy Firms) over that period, we consider that it would be inappropriate to assume a higher interest rate.
A9.10-85
agreements did not allow Shell to revoke the facility unless there was a
breach of the terms (including covenants). Moreover, Shell told us that []
(see paragraphs 43 and 44 of Supplement 2). Therefore, while there remains
the risk that an energy supplier may breach its covenants due to poor financial
performance, market volatility itself should not result in the withdrawal of the
trading arrangement. With respect to SSE’s submission that Shell’s evidence
indicated that pricing would reflect market volatility and the risk exposure of
the party in question, we agreed that this was what Shell had told us.
However, we considered, therefore, that the fees paid by the two Mid-tier
Suppliers already reflected these factors (expected market volatility and
counterparty risk) and did not, in consequence, require any further
adjustment.
79. We next considered SSE’s submission that this type of trading arrangement
was not, in fact, available to the Six Large Energy Firms over the relevant
period. We agreed that this type of service was not common in the GB market
over the period of review, being used by a few smaller suppliers and
predominantly in the later years. However, the purpose of our assessment of
this model is to understand what costs a firm would be likely to have incurred
in purchasing such services in the market on an arm’s length basis, in order to
understand the value of the services that were actually provided to the Six
Large Energy Firms’ retail businesses by the rest of their groups over the
relevant period. We can then reflect such costs in the P&Ls of the Six Large
Energy Firms when calculating the returns they earned over this period.
80. Finally, we considered SSE’s submission relating to the SoLR issue. We do
not consider that it is necessary to incorporate additional capital in relation to
potential liabilities under the SoLR and/or special administration regimes
because we understand that these would generally be voluntary
arrangements under which the SoLR is able to recover its additional costs
through mechanisms such as the ability to raise prices and/or recover
additional costs from other industry participants.140
140 Ofgem (2008), Supplier of Last Resort: Revised Guidance.
A9.10-86
Supplement 1: Actual trading and collateral arrangements of the
Six Large Energy Firms
SSE
1. [].
2. [].141 [].
3. [].
4. [].
Figure 1: SSE cash collateral []
[]
Source: SSE.
5. [].
6. [].
7. []. [].
Centrica
8. Centrica told us that []. In addition, [].
9. []:
(a) [].
(b) [].
(c) [].
10. [].
11. [].
Figure 2: Centrica cash collateral
[]
Source: Centrica.
141 The growth of collateral backed trades in power from 2012 onwards represents the day-ahead auction trading that requires collateral posting.

A9.10-87
12. [].
13. [].
14. []:
(a) [].
(b) [].
(c) [].
15. [].
16. []:
(a) [];
(b) [];
(c) [];
(d) []; and
(e) [].
17. [].
Scottish Power
18. [].
19. Scottish Power provided total net cash collateral held by the group and
supply. Collateral has been allocated to supply on the following basis:
(a) [].
(b) [].
Figure 3: Scottish Power cash collateral
[]
Source: Scottish Power.
20. The average total cash collateral figure and that relating to UK supply as
disclosed in Figure 3 between FY 2007 and 2013 amounted to £[] and £[]
respectively. In relation to UK supply, [].
A9.10-88
21. Scottish Power said that cash collateral was ‘on-balance sheet’, with a
receivable recognised and cash derecognised. [].
22. [].
23. []:
(a) []; and
(b) [].
24. [].
25. [].
EDF Energy
26. [].
27. [].
28. [].
29. [].
30. [].
31. [].
32. []. [].
33. EDF Energy told us that its supply business did not pay the trading
businesses (EDF Energy or EDF Trading) any premiums to cover market,
credit, liquidity or volume risk.
RWE
34. RWE estimated that [] of its UK power wholesale trades were fully
unsecured; []. All uncollateralised trades were conducted OTC.
35. [].
36. [].
37. [].
38. [].

A9.10-89
39. [].
E.ON
40. [].
41. [].
Figure 4: Supply cash collateral (quarterly)
[]
Source: E.ON.
42. [].
43. [].
44. [].
45. [].
A9.10-90
Supplement 2: Evidence on the trading arrangements and
approaches to business risk management of independent energy
suppliers
Ovo Energy
1. []:
(a) [];
(b) [];142
(c) [];
(d) []; and
(e) [].
2. [].
3. [].
4. [].
5. [].
6. []:
(a) [];
(b) [];
(c) []; and
(d) [].
7. Ovo Energy also carried out a cold winter stress test, wherein it modelled a
15% increase in winter consumption levels (October to March). It told us that
its business was found to be robust to these stress tests on the basis of the
working capital terms provided within the agreement (and without any
additional financing).
8. [] []:
142 However, Ovo Energy does [].
A9.10-91
(a) [].
(b) [].
(c) [].
(d) [].
(e) [].
9. [].
10. Ovo Energy told us that smaller, independent suppliers, particularly those
which were growing rapidly, had higher collateral costs than the Six Large
Energy Firms. This was the result of smaller firms being perceived to be a
greater credit risk due to their size and the fact that rapid growth meant that
such firms required proportionately more collateral than a larger firm with a
stable customer base. Rapid growth tended to increase collateral
requirements relative to the existing size of the firm, as it was necessary to
purchase forward for significantly more customers than were currently
supplied. Moreover, by growing rapidly a firm incurred significant customer
acquisition costs up-front, which it expected to recover over the lifetime of the
customers. However, such costs weakened a firm’s balance sheet (as profits
were used for customer acquisition rather than being retained), increasing the
perceived riskiness of the supplier and, therefore, the quantity of collateral
that trading counterparties required from the firm. [].
[].
11. [].
First Utility
12. First Utility told us that until August 2010, it traded with Morgan Stanley on a
[] basis. This required []. However, as the business grew, the need to
[]. As a result, First Utility and Morgan Stanley negotiated [], whereby
First Utility purchased all its electricity and gas needs from Morgan Stanley,
under a [] bespoke trading arrangement. First Utility explained that []
under the bespoke [] terms. Instead a form of [] was provided in the form
of a debenture over the business, with ‘credit risk mitigation rights’ that would
be triggered if First Utility were to breach specified business covenants.
13. [] the Morgan Stanley deal helped First Utility to grow, by December 2013
First Utility had []. At this point, First Utility agreed a new deal with Shell, the
terms of which [].
A9.10-92
14. First Utility told us that it had obtained an uncollateralised trading route via an
agreement with Shell. Under the terms of that agreement:
(a) [].
(b) [].
(c) [].
(d) [].143
(e) [].
15. While payment is due to Shell [], First Utility has []. In the early stages of
the agreement, these were []. First Utility told us that this [].
16. First Utility told us that the structure of the trading agreement was designed to
[]. It commenced in December 2013 [].
17. The trading agreement contains a number of [], including [].
18. We carried out a detailed review of First Utility’s Global Trading agreement
with Shell. This summary covers the key commercial terms of the agreement.
19. [].
20. The stress tests that First Utility conducted in 2015 included:
(a) extreme cold weather – [];
(b) warm weather – [];
(c) [];
[];
(d) [];
(e) []; and
(f) [].
21. First Utility told us [].
22. First Utility told us that it posted a minimal amount of cash collateral with
Elexon, Xoserve and Smart DCC. For electricity distribution, balancing and
143 [].
A9.10-93
transmission costs, it was not required to post collateral because of its good
payment history for the last two years. For gas distribution and capacity
charges, it did not post collateral based on its credit score. It had not posted
any collateral in relation to CfDs or the Capacity Market as this had not yet
started.
Just Energy
23. We observed that Just Energy Inc is a large, North American stand-alone
supplier of energy. We reasoned that, while there may be certain differences
between the GB and North American markets, it could provide insight into
how such a firm might operate if it were active in GB.
24. Just Energy was founded in 1997 and has approximately 4.7 million
‘customers’144 (both residential and commercial), located predominantly in the
USA and Canada, with a small number of customers (around 202,000) in
GB.145 It had revenues of $3.9 billion in FY15, gross margins of $600 million,
and ‘base’ EBITDA of $180 million. The firm has a dual listing on the Toronto
and New York Stock Exchanges.
25. Just Energy sells customers electricity and gas under a range of different
tariffs, from ones with month-to-month variable-price offerings to five-year
fixed-price contracts. The firm uses historical customer usage, normalised to
average weather conditions, to forecast customer demand. However, to the
extent that balancing requirements are outside the forecast purchase, Just
Energy bears the financial responsibility caused by fluctuations in customer
usage.146 The firm uses options, such as weather derivatives, to manage its
exposure to weather fluctuations.
26. Just Energy has access to a credit facility of between $277 million and
$350 million. It explained that ‘[t]he new facility, combined with strong
earnings and cash flow generation, exceeds our working capital liquidity
needs and our expected growth investment requirements for the next three
years.’147 As of 31 March 2015, Just Energy had issued letters of credit
totalling $134.8 million in accordance with its credit facility. In addition, it had
issued surety bonds to various counterparties totalling $54.8 million. Under
the terms of the credit facility, Just Energy is able to make use of banker’s
acceptances and LIBOR advances at a stamping fee of 3.40%, prime rate
144 Just Energy has over [] individual customers, which it explains consume the equivalent energy of [] residential customers. 145 Just Energy 2015 annual report. 146 Just Energy 2015 annual report, p26. 147 Just Energy press release.
A9.10-94
advances at rates of interest of bank prime plus 2.40%, and letters of credit
are at 3.40%. Interest rates are adjusted quarterly based on certain financial
performance indicators. The facility is secured against Just Energy’s assets.
There are financial covenants associated with this credit agreement that, as of
30 September 2015, Just Energy met.148 In addition to this credit facility, Just
Energy held a cash balance of 0.7% (FY2014) to 2.4% (FY2015) of its cost of
sales.149
27. Just Energy has several tranches of longer term debt, including a $105 million
senior unsecured note, $330 million of convertible unsecured debentures,
$100 million of convertible subordinated debentures, and $150 million
convertible bond. The interest rates on these are 9.75%, 6%, 5.75% and 6.5%
per year, respectively.150
28. Just Energy currently sources its wholesale energy supply from commodity
partners such as BP, Bruce Power, Constellation Energy, EDF Energy, Shell
and three financial institutions.151
Shell
29. Shell provides trading intermediary services to four energy suppliers in GB,
including First Utility, [], Flow Energy152 and Hudson Energy Supply UK
Limited. An energy supplier can directly contact Shell’s natural gas and power
trading desks [].
Pricing
30. [].
31. [].
32. Shell said that it priced the fee based on its return aspirations, as appropriate
for the product offered and the risk taken, []
(a) [].
(b) [].
(c) [].
148 Just Energy 2015 annual report, pp 41 & 42. All figures are Canadian dollars. Just Energy 2016 Q2 results. 149 Just Energy’s 2015 financial statements. 150 Just Energy 2016 Q2 results 151 Just Energy’s 2014 financial statements. 152 Flowgroup (2015), Five year contract with Shell for the provision of wholesale energy (gas and electricity).
A9.10-95
33. []. [].
34. [].
Scalability
35. Shell told us that it had agreed its existing counterparty agreements in the
anticipation that the energy suppliers could grow their customer bases
materially. It emphasised that it remained interested to grow this activity
further [].
36. Shell noted that its appetite for future exposure to its counterparties was not
currently capped but that it kept risks under ongoing review. Two particular
risks identified by Shell were the level of liquidity in the market, particularly in
relation to shaped power products, and volatility in counterparties’ customer
demand.
37. Shell stated that it would be able to provide trading services to firms of the
size of the Six Large Energy Firms and that, while the level of the fees would
depend on the specific terms agreed and the riskiness of the counterparty,
certain costs, such as those associated with negotiating terms for these
structured trading services, did not vary significantly with the size of the
counterparty, such that a larger counterparty may be able to obtain more
attractive terms (as a unit rate).
38. Shell told us that firms which were not growing materially would be unlikely to
need the type of services that it offered its counterparties as the collateral and
other working capital requirements could be managed by alternative means.
39. Shell told us that it had provided structured trading and credit services in
North America for 15 years, []. Its total level of activity in the USA in 2014
was approximately 10 times larger than it was in the UK. It indicated that it had
decided to enter the GB market to provide intermediary services in response
to the growth in the number of independent energy retailers, which it believed
would find such services attractive. In markets without such independent
firms, ie which are largely vertically integrated, Shell noted that it did not see
demand for its services.
40. Shell stated that the North American electricity market was more liquid than
that in GB, in part due to a higher number of independent generators and
suppliers. It noted that independent producers played an important role in
enabling greater access to non-standard electricity products at competitive
prices.
A9.10-96
41. Shell told us that its experience in this sector showed that scale tended to
increase the balance sheet size and strength of energy suppliers.
Managing risks
42. Shell manages its exposure to its (energy supplier) counterparties via:
(a) [];
(b) [];
(c) debentures (a fixed and floating charge) over an energy supplier’s assets
([]); and
(d) security over shares agreements ([]).
43. Shell recognised that given the nature of retail supply, firms might face short-
term shocks arising from external factors such as adverse weather. These
could, in some cases, be significant shocks such as those experienced in
2008/09, a period that included extreme weather, global financial crises and
highly volatile wholesale energy prices. In such circumstances, Shell said that
it differentiated between external factors and internal factors.153 Therefore,
Shell would seek to work with its clients to try and find mutually acceptable
solutions to achieve a recovery as follows:
(a) Shell said that it took on well-managed clients (suppliers) which it
monitored closely []. Therefore liquidity/funding shortfall scenarios that
had arisen in North America, tended to be the result of external factors,
such as extreme weather.
(b) Shell told us that if a well-managed supplier was hit by an unforeseen
circumstance (negative shock), Shell would aim to amend its structured
trading agreements to address a funding shortfall, as long as any
additional exposure could be recouped later from the supplier and Shell
could negotiate acceptable terms with its client. The objective would be to
provide solutions to achieve a recovery, subject to it being beneficial to
Shell and its clients.
(c) Shell highlighted that it may earn additional interest or fees for the period
of any additional liquidity support but that it did not seek to exacerbate the
153 Energy suppliers have no control over external factors such as adverse weather or financial crises. However, internal factors are those that relate specifically to an energy firm’s ability to manage risk by means of good management of working capital, cash generation, efficiency and commercial judgement.
A9.10-97
cash flow issues that the supplier might be going through during that short
interval.
(d) Shell told us that in advance of entering into structured trading
agreements and, as required, it stress-tested the supplier’s [].
44. Shell noted that the USA experienced very cold weather in 2014. In addition
the UK also had a few cold snaps since 2013. []. None of the independent
suppliers in Europe and North America that had had the structured trading
arrangement with Shell had gone into insolvency (ie Chapter 11 insolvency)
during the highly volatile period of 2008/09 or during the cold weather periods
since 2013.
Competitors
45. Shell told us that [].
Morgan Stanley
46. [] provides uncollateralised trading arrangements in relation to shaped
products to []. It previously provided such services to []. These
arrangements include:
(a) The energy supplier buys shaped gas and power from [] not only to
protect itself from seasonal base and peak price movements but also
hourly and daily price movements.
(b) The energy supplier is not required to submit cash collateral to cover its
mark-to-market risk on trades executed with [].
(c) [] takes a [] senior secured position over the assets of the energy
supplier.
(d) The energy supplier agrees to operate within defined financial covenants
in order to protect the value of its assets given as security to [].
(e) [] charges a fee per MWh to cover its market and credit risk.
BP
47. BP told us that, both currently and historically, it only provided limited trading
services (eg providing shape and taking on collateral risk for third parties).
This applies to both independent energy suppliers and generators, and large
vertically integrated entities. As a commercial entity, it sought to actively trade
with all eligible counterparties. However, in BP’s experience, the demand for
A9.10-98
market access services had historically been low, which it considered may
have been due to reasonable levels of liquidity allowing participants to access
the markets themselves. In addition, BP told us that there were a range of
other providers of these services.
48. Notwithstanding the above, BP told us that it was currently exploring the
possibility of increasing the range of services that it provided in this area in the
future, in response to increasing interest from market participants. Given that
such a product offering was still being developed, BP could not provide
information on specific terms, such as pricing.
Macquarie
49. Macquarie told us that it provided market access services (including trading,
shaping and within-month position management) to Corona Energy, an
independent energy supplier with a focus on I&C customers. For gas and
electricity, Macquarie provides Corona with a forward curve with a suitable
mark-up to cover within-day fluctuations, which Corona can use to price
business on a fixed-term, fixed-price basis.
50. Macquarie told us that there was no minimum or maximum scale of client, in
terms of their volume of gas or power requirements, that it would be willing to
trade with. It considered the market to be competitive with other banks,
trading houses and vertically integrated energy firms all providing similar
services.
Recommended