NZ Sustainability Dashboard Research Report 13/09-v1
Published by ARGOS (Agricultural Research Group on Sustainability)
ISSN 2324-5751 (Print)
ISSN 2324-5700 (Online)
Framework and indicators for ‘The New Zealand Sustainability
Dashboard’: reflecting New Zealand’s economic, social,
environmental and management values
Version 1
(Note: this report will be updated in the future to incorporate findings from the project)
Lesley Hunt1, Catriona MacLeod2, Henrik Moller3, John Reid4, Chris Rosin3
1. Lincoln University
2. Landcare Research
3. University of Otago
4. Ngāi Tahu Research Centre
June 2014
Synthesis Sustainability Framework and KPI
ii
Reviewed by:
Dr Michaela Balzarova, Lincoln University – Senior Lecturer
Cerasela Stancu, Landcare – Sustainable Business Manager
Professor Paul Dalziel, AERU, Lincoln University – Professor of Economics
Approved for release by:
Jon Manhire, Program Leader, The Agribusiness Group
Isabelle Le Quellec, Project Manager, The Agribusiness Group
Suggested citation for this report
Hunt L., MacLeod C., Moller H., Reid J., Rosin C.. Framework and KPIs for ‘The New Zealand
Sustainability Dashboard’: reflecting New Zealand’s economic, social, environmental and
management values. (2014). The NZ Sustainability Dashboard Research Report 13/09. Published
by ARGOS. (Online at: www.nzdashboard.org.nz)
Acknowledgements
This work was funded by the Ministry of Business, Innovation and Employment (Contract Number
AGRB1201).
The information in this report is accurate to the best of the knowledge and belief of the author(s)
acting on behalf of the ARGOS Team. While the author(s) has exercised all reasonable skill and
care in the preparation of information in this report, neither the author nor the ARGOS Team accept
any liability in contract, tort, or otherwise, for any loss, damage, injury or expense, whether direct,
indirect or consequential, arising out of the provision of information in this report.
Primary authorship of certain chapters falls on certain people: Lesley Hunt for chapters 1, 2, 3 and
4; Catriona MacLeod and Henrik Moller for Chapter 5; Chris Rosin for Chapter 6 ;and Catriona
MaLeod for Chapter 7. Thank you goes to Katherine McKusker for her early work on Chapter 3 and
the farm management chapter which ended up not being included; and to John Reid and Isabelle
le Quellec for their important contributions.
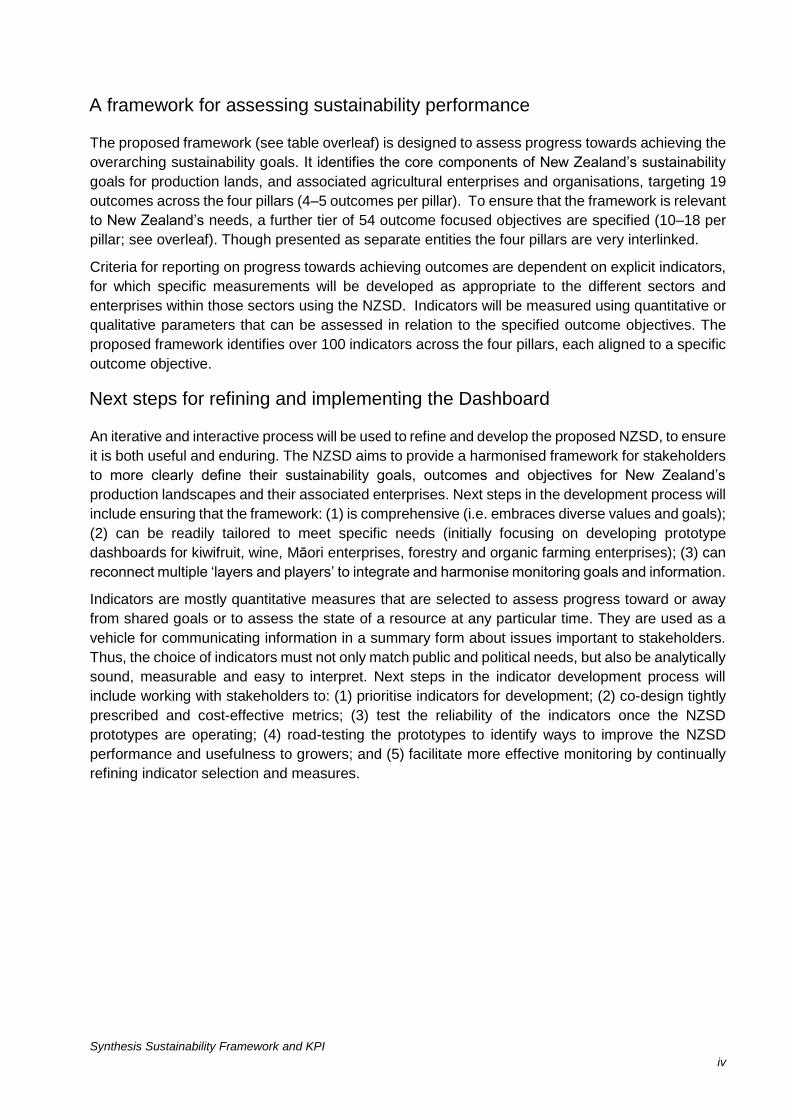
About this report series
The New Zealand Sustainability Dashboard Report series is a publication of the
ARGOS Group (www.argos.org.nz) – as part of the New Zealand Sustainability
Dashboard project. All publications can be found on the website
nzdashboard.org.nz.
The New Zealand Sustainability Dashboard project Research Partners
Synthesis Sustainability Framework and KPI
iii
Executive Summary
This report supports the development of a sustainability assessment and reporting tool, the New
Zealand Sustainability Dashboard (NZSD), for the country’s production landscapes and associated
businesses and organisations. More specifically, it documents the design of the NZSD assessment
framework and indicators.
The New Zealand Sustainability Dashboard aims and design
The NZSD is primarily being developed to assist agricultural producers (farmers, orchardists,
viticulturists, silviculturists and others), and agricultural businesses and organisations with the
rational management of large amounts of available information and with their subsequent
management decisions. It will also support them in complying with the ever increasing demands for
market and regulatory reporting. It is anticipated that the use of the tool and enhanced information
flows resulting from it will help to optimise overall performance including productivity/profitability
while protecting environmental and social values. It will reduce monitoring and regulatory costs,
build consumer trust, secure market access and garner support from wider New Zealand society by
verification and regular reporting of standardised sustainability criteria.
The NZSD provides a framework for sustainability assessment developed to make explicit the
sustainability outcomes being targeted, using aligned indicators for assessing performance. The
framework design is locally grounded (to guide best practices of special relevance to New Zealand
society, ecology and land care) but also internationally relevant (taking into account theoretical
concepts, sustainability frameworks, and indicators used internationally) to ensure that overseas
consumers can benchmark and verify the sustainability credentials of New Zealand exported
products.
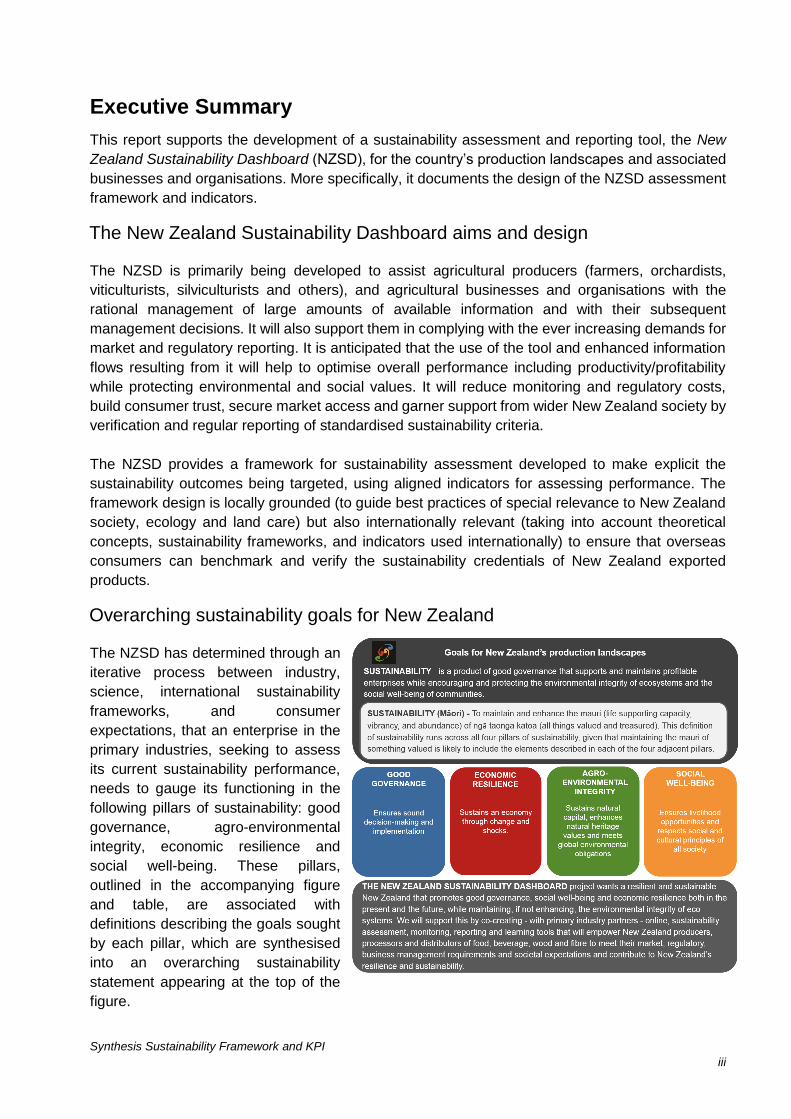
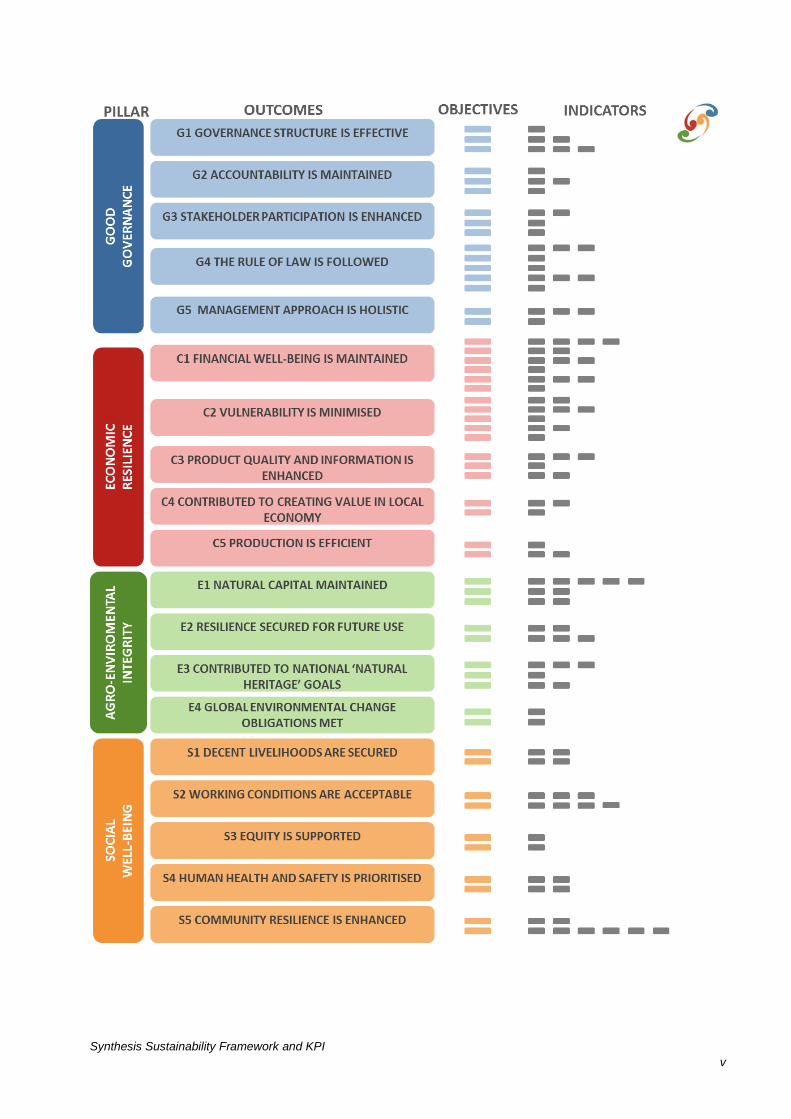
Overarching sustainability goals for New Zealand
The NZSD has determined through an
iterative process between industry,
science, international sustainability
frameworks, and consumer
expectations, that an enterprise in the
primary industries, seeking to assess
its current sustainability performance,
needs to gauge its functioning in the
following pillars of sustainability: good
governance, agro-environmental
integrity, economic resilience and
social well-being. These pillars,
outlined in the accompanying figure
and table, are associated with
definitions describing the goals sought
by each pillar, which are synthesised
into an overarching sustainability
statement appearing at the top of the
figure.
Synthesis Sustainability Framework and KPI
iv
A framework for assessing sustainability performance
The proposed framework (see table overleaf) is designed to assess progress towards achieving the
overarching sustainability goals. It identifies the core components of New Zealand’s sustainability
goals for production lands, and associated agricultural enterprises and organisations, targeting 19
outcomes across the four pillars (4–5 outcomes per pillar). To ensure that the framework is relevant
to New Zealand’s needs, a further tier of 54 outcome focused objectives are specified (10–18 per
pillar; see overleaf). Though presented as separate entities the four pillars are very interlinked.
Criteria for reporting on progress towards achieving outcomes are dependent on explicit indicators,
for which specific measurements will be developed as appropriate to the different sectors and
enterprises within those sectors using the NZSD. Indicators will be measured using quantitative or
qualitative parameters that can be assessed in relation to the specified outcome objectives. The
proposed framework identifies over 100 indicators across the four pillars, each aligned to a specific
outcome objective.
Next steps for refining and implementing the Dashboard
An iterative and interactive process will be used to refine and develop the proposed NZSD, to ensure
it is both useful and enduring. The NZSD aims to provide a harmonised framework for stakeholders
to more clearly define their sustainability goals, outcomes and objectives for New Zealand’s
production landscapes and their associated enterprises. Next steps in the development process will
include ensuring that the framework: (1) is comprehensive (i.e. embraces diverse values and goals);
(2) can be readily tailored to meet specific needs (initially focusing on developing prototype
dashboards for kiwifruit, wine, Māori enterprises, forestry and organic farming enterprises); (3) can
reconnect multiple ‘layers and players’ to integrate and harmonise monitoring goals and information.
Indicators are mostly quantitative measures that are selected to assess progress toward or away
from shared goals or to assess the state of a resource at any particular time. They are used as a
vehicle for communicating information in a summary form about issues important to stakeholders.
Thus, the choice of indicators must not only match public and political needs, but also be analytically
sound, measurable and easy to interpret. Next steps in the indicator development process will
include working with stakeholders to: (1) prioritise indicators for development; (2) co-design tightly
prescribed and cost-effective metrics; (3) test the reliability of the indicators once the NZSD
prototypes are operating; (4) road-testing the prototypes to identify ways to improve the NZSD
performance and usefulness to growers; and (5) facilitate more effective monitoring by continually
refining indicator selection and measures.
Synthesis Sustainability Framework and KPI
v
Synthesis Sustainability Framework and KPI
vi
Table of Contents
Executive Summary .............................................................................................................. iii
The New Zealand Sustainability Dashboard aims and design ......................................... iii
Overarching sustainability goals for New Zealand ............................................................ iii
A framework for assessing sustainability performance ....................................................iv
Next steps for refining and implementing the Dashboard ...............................................iv
Chapter 1 : The New Zealand Sustainability Dashboard aims and design ...... 10
Report aims and structure ................................................................................................... 10
Why develop a sustainability assessment and reporting tool? ..................................... 11
The need for the New Zealand Sustainability Dashboard ............................................... 11
Delivering a unified assessment and reporting tool for sustainability learning ...... 12
Best-practice criteria for sustainability monitoring designs .......................................... 12
Core design principles ................................................................................................................... 12
Definitions of agricultural sustainability ................................................................................. 13
The measurement of sustainability .......................................................................................... 15
NZSD framework and indicator design process ............................................................... 15
Literature reviews ........................................................................................................................... 15
The NZSD framework development ......................................................................................... 16
The development of indicators ................................................................................................... 17
Chapter 2 : Overarching goals of the New Zealand Sustainability Dashboard
.................................................................................................................................................... 22
The overarching sustainability goals ................................................................................. 22
Demonstrating goals are locally grounded ....................................................................... 23
Alignment of NZSD with Government strategies ................................................................ 23
Alignment with Māori cultural values ...................................................................................... 25
Alignment to international sustainability assessment systems .................................... 25
Chapter 3 : Measuring the governance of New Zealand’s primary-based
industries ................................................................................................................................ 34
Governance ............................................................................................................................ 34
Governance and sustainability ................................................................................................... 35
Governance and social well-being ............................................................................................ 36
The role of good governance in farm management .......................................................... 36
Governance of Māori-owned land ............................................................................................. 37
Firm structure and governance: Lessons from the kiwifruit sector ............................. 38
Governance framework for the NZSD ............................................................................... 39
Outcome G1: Governance structure is effective ............................................................. 44
Objective G1.1: Maintaining transparent decision-making processes ....................... 45
Objective G1.2: Enacting corporate ethics/mission statement ..................................... 47
Objective G1.3: Practicing due diligence ............................................................................... 48
Outcome G2: Accountability is maintained ...................................................................... 49
Objective G2.1: Maintaining regular and transparent reporting processes ............. 50
Objective G2.2: Management actions are responsible ..................................................... 52
Objective G2.3: Management actions are transparent .................................................... 52
Synthesis Sustainability Framework and KPI
vii
Outcome G3: Stakeholder participation is enhanced ..................................................... 53
Objective G3.1: Maintaining effective stakeholder dialogue .......................................... 55
Objectives G3.2 and G3.3: Grievance and conflict resolution procedures are in
place ..................................................................................................................................................... 56
Outcome G4: The Rule of Law is followed ........................................................................ 57
Objective G4.1: Maintaining commitment to fairness, legitimacy and transparency
............................................................................................................................................................... 61
Objective G4.2: Procedures for remedy, restoration and prevention are effective
............................................................................................................................................................... 62
Objective G4.3: Meeting civic responsibilities ..................................................................... 62
Objective G4.4: Resources are not misappropriated ........................................................ 63
Objective G4.5: Maintaining compliance with animal welfare legislation ................. 64
Outcome G5: Management approach is holistic .............................................................. 66
Objective G5.1: Implementing a sustainability management plan ............................. 66
Objective G5.2: Practicing full cost accounting ................................................................... 68
Conclusion .............................................................................................................................. 69
Chapter 4 : Measuring the economic resilience of New Zealand’s primary-
based industries ................................................................................................................... 70
Economic resilience .............................................................................................................. 70
Farm management and economic resilience .................................................................... 71
Measuring the sustainability of management practices ................................................... 72
Placing sustainability in context ......................................................................................... 73
Collecting national statistics ....................................................................................................... 73
The size of a business as an indicator .................................................................................... 73
Indicators using financial data ................................................................................................... 74
Indicators of sustainability to do with work and employment....................................... 74
Fitting a framework to the NZSD ....................................................................................... 74
Outcome C1: Financial well-being is maintained ............................................................ 79
Objective C1.1: Managing investment wisely ...................................................................... 79
Objective C1.2: Balancing expenditure between efficiency and contribution to
economy ............................................................................................................................................. 83
Objective C1.3: Creating wealth ............................................................................................... 84
Objective C1.4: Performing efficiently .................................................................................... 85
Objective C1.5: Enhancing profitability .................................................................................. 86
Objective C1.6: Balancing liabilities and assets .................................................................. 87
Outcome C2: Vulnerability in minimised .......................................................................... 87
Objective C2.1: Ensuring stability of production ................................................................ 87
Objective C2.2: Ensuring stability of supply ........................................................................ 90
Objective C2.3: Ensuring stability of market ....................................................................... 90
Objective C2.3: Managing liquidity .......................................................................................... 91
Objective C2.5: Managing risk ................................................................................................... 92
Outcome C3: Product quality and information is enhanced .......................................... 92
Objective C3.1: Managing food safety .................................................................................... 93
Objective C3.2: Enhancing food quality ................................................................................. 93
Synthesis Sustainability Framework and KPI
viii
Objective C3.3: Providing reliable product information ................................................... 95
Outcome C4: Contributed to creating value in local economy ..................................... 95
Objective C4.1: Enhancing local economy ........................................................................... 95
Objective C4.2: Investing in community ............................................................................... 97
Outcome C5: Production is efficient .................................................................................. 98
Objective C5.1: Enhancing production ................................................................................... 98
Objective C5.2: Enhancing productivity ................................................................................. 98
Conclusion ............................................................................................................................ 101
Chapter 5 : Measuring to secure agro-environmental integrity in New Zealand
.................................................................................................................................................. 103
Agro-environmental integrity: a national outcome for New Zealand’s production lands
103
Meeting the needs of New Zealand’s agro-ecosystems ................................................. 103
Ecological integrity within natural ecosystems .................................................................. 104
Integration to achieve agro-environmental integrity within production landscapes
............................................................................................................................................................. 104
An additional focus on agro-biodiversity, including common and introduced biota
............................................................................................................................................................. 106
Land-sparing and land-sharing: integrating biodiversity conservation and
agriculture ........................................................................................................................................ 106
Agricultural intensification: a mounting threat to agro-ecosystem integrity? ...... 107
Definition of agro-environmental integrity .......................................................................... 107
Environmental outcomes for the NZSD .......................................................................... 108
Outcome E1: Natural capital for production is maintained ......................................... 112
Objective E1.1: Maintaining ecosystem processes .......................................................... 112
Objective E1.2: Reducing agricultural pest threats ......................................................... 113
Objective E1.3: Limiting environmental pollutants.......................................................... 115
Outcome E2: Resilience is secured for future productive use..................................... 115
Objective E2.1: Minimising material and energy subsidies .......................................... 116
Objective E2.2: Maintaining agro-biodiversity................................................................... 116
Outcome E3: Contributed to national ‘natural heritage’ goals.................................... 117
Objective E3.1: Improving ecosystem representation and composition ................. 117
Objective E3.2: Preventing extinctions and declines ...................................................... 119
Objective E3.3: Reducing conservation pest threats ...................................................... 119
Outcome E4: Global environmental change obligations met ...................................... 121
Objective E4.1: Reducing emissions...................................................................................... 122
Objective E4.2: Increasing carbon sequestration ............................................................ 122
Conclusion ............................................................................................................................ 124
Chapter 6 : Measuring the contribution of primary-based industries to social
well-being ............................................................................................................................. 125
Introduction ......................................................................................................................... 125
Categorising indicators of social well-being ........................................................................ 126
Relevance considerations ........................................................................................................... 127
Synthesis Sustainability Framework and KPI
ix
Creating the structure of the framework ........................................................................ 128
Outcome S1: Decent livelihoods are secured ................................................................ 132
Objective S1.1: Improving livelihood assets ...................................................................... 134
Objective 1.2: Limiting livelihood constraints .................................................................... 134
Outcome S2: Working conditions are acceptable.......................................................... 135
Objective 2.1: Maintaining fully compliant employment processes .......................... 137
Objective 2.2: Maintaining high quality working conditions ........................................ 137
Outcome S3: Equity is supported .................................................................................... 139
Objective 3.1: Maintaining equity processes ..................................................................... 141
Objective 3.2: Improving support for vulnerable groups .............................................. 141
Outcome S4: Human health and safety is prioritised ................................................... 141
Objective 4.1: maintaining safe, hygienic and healthy environments ..................... 142
Objective 4.2: improving facilities to meet basic human needs ................................. 142
Outcome S5: Community resilience is enhanced .......................................................... 144
Objective 5.1: Respecting cultural use rights and worldviews .................................... 145
Objective 5.2: Recognising stakeholder values and choices ........................................ 148
Conclusions .......................................................................................................................... 149
Chapter 7 : Next steps to refine and implement the NZSD: meeting stakeholder
needs ...................................................................................................................................... 151
Iterative and interactive process of refinement ............................................................ 151
Clarifying and harmonising sustainability goals ............................................................ 152
Indicator selection, development and implementation ................................................ 153
Prioritising indicators for deployment ................................................................................... 153
Co-designing tightly prescribed and cost-effective metrics.......................................... 155
Reliability checks once NZSD prototypes are operating ................................................ 155
Thresholds and benchmarks ..................................................................................................... 156
Refining indicator selection and measures .......................................................................... 158
Abbreviations ...................................................................................................................... 160
References ............................................................................................................................ 162
Tables ..................................................................................................................................... 176
Figures ................................................................................................................................... 178
Chapter 1: The New Zealand Sustainability Dashboard aims and design
Synthesis Sustainability Framework and KPI
10
Report aims and structure
This report supports the development of a sustainability assessment and reporting tool, the
New Zealand Sustainability Dashboard (NZSD), for the country’s production landscapes and
associated businesses and organisations. More specifically, it documents the design of the
NZSD monitoring framework and indicators. Internationally recognised frameworks and their
key generic sustainability performance indicators (KPIs) are co-opted into the design to ensure
that overseas consumers can benchmark and verify the sustainability credentials of New
Zealand’s exported products. In a sense this report could also be treated like a toolbox – it
provides a generic sustainability framework and indicators which can be picked up by different
sectors at different levels (farm/orchard business, associated agribusiness, sector
organisation) to design a Sustainability Dashboard appropriate to their interests and present
needs while at the same time providing an aspirational goal for growing that Dashboard in the
future. Ultimately New Zealand and sector-specific KPIs will be designed to guide farmers,
growers, agricultural businesses and organisations to the best practices of special relevance
to New Zealand society, ecology and land care.
The report consists of four sections:
The New Zealand Sustainability Dashboard aims and design: Background information
on why this tool is needed, what it aims to deliver, as well as the design criteria and
processes used to develop the NZSD framework and indicators.
Overarching sustainability goals for NZ: The overarching goal of the NZSD and each of
the four pillars of sustainability (good governance, economic resilience, agro-
environmental integrity, social well-being) are defined based society’s need and values.
A framework for assessing sustainability performance: A four pillar framework is outlined
for assessing progress towards achieving the overarching sustainability goals. It
identifies the core components of New Zealand’s sustainability goals for production
lands, along with a further tier of outcome focused objectives and aligned indicators. A
rationale and overview is provided for each pillar:
Measuring the governance of New Zealand’s primary-based industries
Measuring the economic resilience of New Zealand’s primary-based industries
Measuring to secure agro-environmental integrity in New Zealand
Measuring the contribution of primary-based industries to social well-being In
New Zealand
Chapter 1: The New Zealand Sustainability Dashboard
aims and design
Chapter 1: The New Zealand Sustainability Dashboard aims and design
Synthesis Sustainability Framework and KPI
11
Next steps for refining and implementing the Dashboard. The NZSD framework and
indicators are being built in partnership with several primary industry sectors in New
Zealand. It will be incorporated into multifunctional web applications, which are under
development to facilitate uploading of regular monitoring results and instantly summarise
and report back trends to the growers, to industry representatives, and to agriculture
regulators and policy makers at regional and national government levels.
Why develop a sustainability assessment and reporting tool?
The need for the New Zealand Sustainability Dashboard
The primary sector dominates the New Zealand economy. Total primary sector export revenue
was $32,393 million for the year ended 30 June 2013, accounting for 73 per cent of the total
merchandise export revenue (MPI, 2013). “New Zealand farmers now operate in a fully
deregulated environment and need to be very responsive to demanding consumers and
markets” (Martin et al., 2005: 3). Consumers are increasingly aware of issues of food safety
and environmental impacts and corporate responsibility reporting is becoming more
widespread and expected (KPMG, 2011). In response to this, New Zealand farmers and
agribusinesses have to monitor and measure their management practices. New Zealand
farmers and agribusiness people also have to rapidly respond to variable weather and, over a
longer timeframe, a changing climate, and to do this they need better information to make well
informed decisions.
The NZSD design recognises three drivers of sustainability in New Zealand’s production
landscapes:
Overseas markets: Key influences on the marketing of New Zealand’s primary products
(Saunders et al., 2013), include: the development of agri-environmental policies in the
EU and the U.S.; the move towards sustainability in markets driven by the private sector
and retailers (e.g., GlobalG.A.P and the Red Tractor Scheme); the change in consumer
attitudes and behaviours towards accountability for environmental and social impacts of
the products consumers are purchasing and the promotion of sustainable practices;
climate change (carbon footprinting); water quality and quantity (water footprinting);
protection of biodiversity and wildlife; animal welfare; and the emphasis on local food.
This report includes specific indicators which have been operationalised by various
product and company schemes internationally to measure economic, social,
environmental and governance-based regulation, best practice and market assurance
principles. Currently, the database includes 41 assurance schemes.
Regulatory requirements: Many frameworks have been developed by regulatory bodies
(The Agribusiness Group, 2013). These are designed to protect the environment and so
fit well under the dimension of sustainability which concentrates on “agro-environmental
integrity”. In addition, there are many regulations such as those to do with human rights,
Chapter 1: The New Zealand Sustainability Dashboard aims and design
Synthesis Sustainability Framework and KPI
12
employment, animal welfare, company reporting and food quality and safety that cross
the economic, social and environmental sustainability dimensions.
Business Improvement: A recent review (Hunt, 2013a) considers the development of the
definitions given to sustainability, in particular business sustainability and how this has
been measured in the development of different business improvement models and
generic frameworks which include some aspect of business. From these different
indicators were drawn from a wide variety of organisations covering both New Zealand
and overseas, and also the understanding of what measurements were important from
the ARGOS programme, the predecessor of the NZSD project.
Delivering a unified assessment and reporting tool for sustainability learning
The NZSD will be more than just an assessment and reporting tool – it will also provide a hub
for learning to become more sustainable. It will create an information ‘clearing house’ for linking
past data sources to existing decision support software applications so that growers can
discover optimal choices for improved farming practice, should the NZSD alert them that their
KPIs are approaching amber or red alert thresholds.
The NZSD is primarily being developed to assist farmers/growers with the rational
management of the large amounts of available information and with their subsequent
management decisions. It will also support them in complying with the ever increasing
demands for market and regulatory reporting. It is anticipated that the use of the tool and
enhanced information flows resulting from it will help farmers/growers to optimise their overall
farm performance including productivity/profitability while protecting environmental and social
values. It will reduce monitoring and regulatory costs, build consumer trust, secure market
access and garner support from wider New Zealand society by verification and regular
reporting of standardised sustainability criteria.
Best-practice criteria for sustainability monitoring designs
Core design principles
The NZSD will comply with five of the Bellagio Principles which were developed in 1996 to
articulate core methodological principles in the development of sustainability reporting (Bell
and Morse, 2008: 22; SAFA, 2013a).
Progress towards sustainable development should be based on a measurement of ‘a
limited number’ of indicators based on ‘standardized measurement’.
Methods and data employed for assessment of progress should be open and
accessible to all.
Progress should be effectively communicated to all.
Broad participation is required.
Allowance should be made for repeated measurement in order to determine trends and
to incorporate the results of experience.
Chapter 1: The New Zealand Sustainability Dashboard aims and design
Synthesis Sustainability Framework and KPI
13
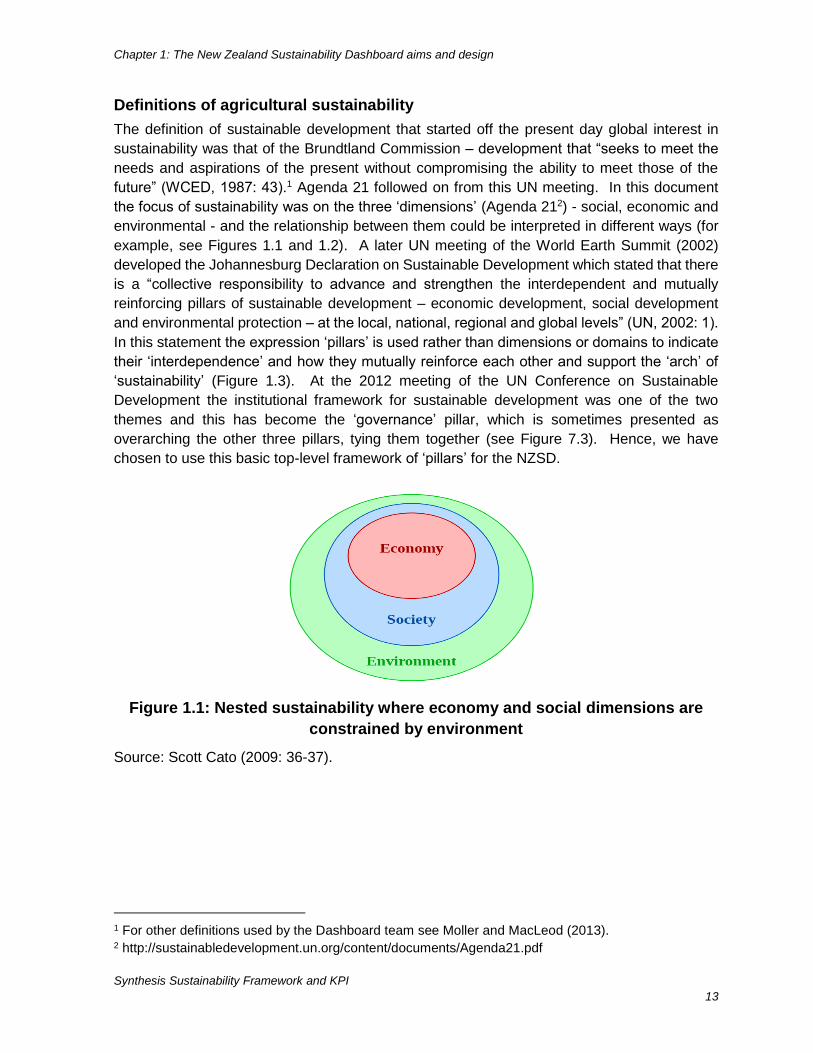
Definitions of agricultural sustainability
The definition of sustainable development that started off the present day global interest in
sustainability was that of the Brundtland Commission – development that “seeks to meet the
needs and aspirations of the present without compromising the ability to meet those of the
future” (WCED, 1987: 43).1 Agenda 21 followed on from this UN meeting. In this document
the focus of sustainability was on the three ‘dimensions’ (Agenda 212) - social, economic and
environmental - and the relationship between them could be interpreted in different ways (for
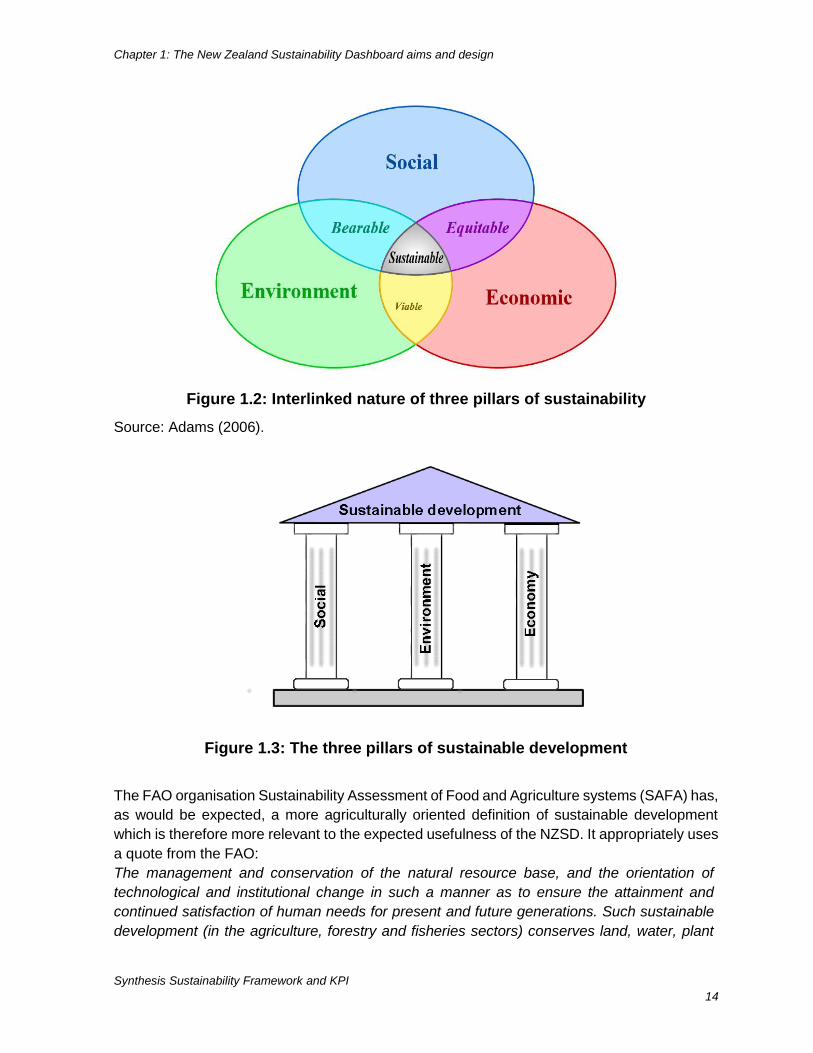
example, see Figures 1.1 and 1.2). A later UN meeting of the World Earth Summit (2002)
developed the Johannesburg Declaration on Sustainable Development which stated that there
is a “collective responsibility to advance and strengthen the interdependent and mutually
reinforcing pillars of sustainable development – economic development, social development
and environmental protection – at the local, national, regional and global levels” (UN, 2002: 1).
In this statement the expression ‘pillars’ is used rather than dimensions or domains to indicate
their ‘interdependence’ and how they mutually reinforce each other and support the ‘arch’ of
‘sustainability’ (Figure 1.3). At the 2012 meeting of the UN Conference on Sustainable
Development the institutional framework for sustainable development was one of the two
themes and this has become the ‘governance’ pillar, which is sometimes presented as
overarching the other three pillars, tying them together (see Figure 7.3). Hence, we have
chosen to use this basic top-level framework of ‘pillars’ for the NZSD.
Figure 1.1: Nested sustainability where economy and social dimensions are
constrained by environment
Source: Scott Cato (2009: 36-37).
1 For other definitions used by the Dashboard team see Moller and MacLeod (2013). 2 http://sustainabledevelopment.un.org/content/documents/Agenda21.pdf
Chapter 1: The New Zealand Sustainability Dashboard aims and design
Synthesis Sustainability Framework and KPI
14
Figure 1.2: Interlinked nature of three pillars of sustainability
Source: Adams (2006).
Figure 1.3: The three pillars of sustainable development
The FAO organisation Sustainability Assessment of Food and Agriculture systems (SAFA) has,
as would be expected, a more agriculturally oriented definition of sustainable development
which is therefore more relevant to the expected usefulness of the NZSD. It appropriately uses
a quote from the FAO:
The management and conservation of the natural resource base, and the orientation of
technological and institutional change in such a manner as to ensure the attainment and
continued satisfaction of human needs for present and future generations. Such sustainable
development (in the agriculture, forestry and fisheries sectors) conserves land, water, plant
Chapter 1: The New Zealand Sustainability Dashboard aims and design
Synthesis Sustainability Framework and KPI
15
and animal genetic resources, is environmentally non-degrading, technically appropriate,
economically viable and socially acceptable (FAO, 1989).
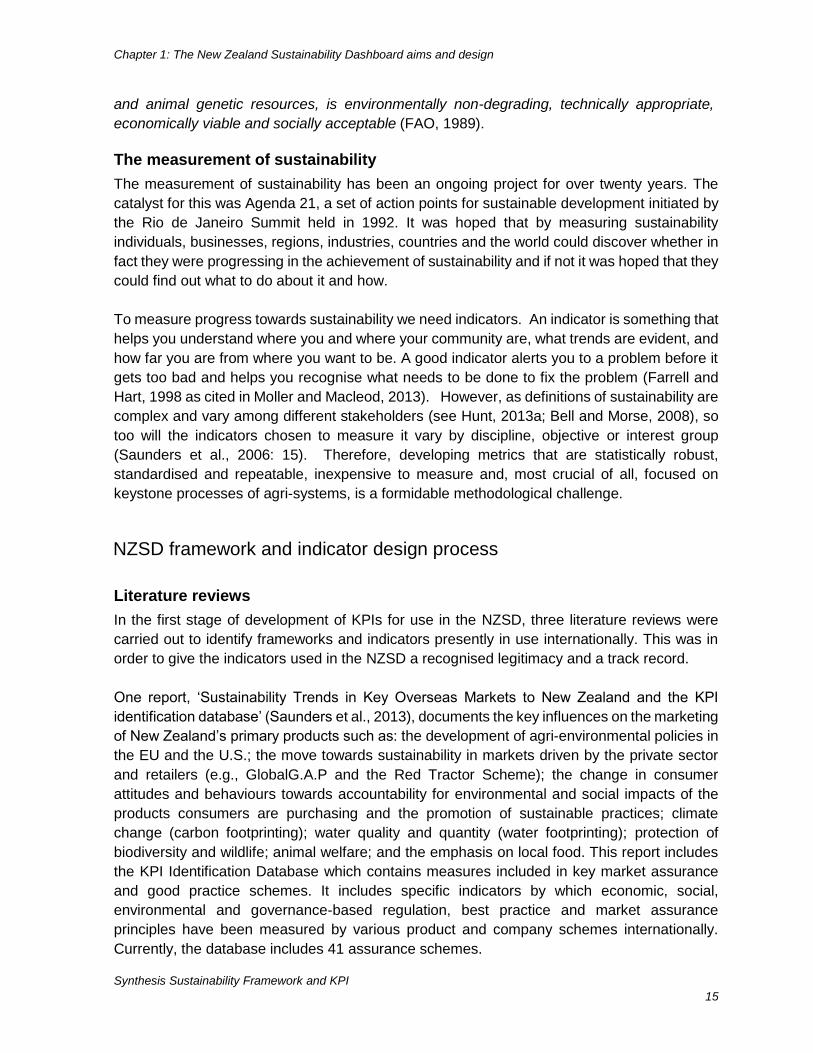
The measurement of sustainability
The measurement of sustainability has been an ongoing project for over twenty years. The
catalyst for this was Agenda 21, a set of action points for sustainable development initiated by
the Rio de Janeiro Summit held in 1992. It was hoped that by measuring sustainability
individuals, businesses, regions, industries, countries and the world could discover whether in
fact they were progressing in the achievement of sustainability and if not it was hoped that they
could find out what to do about it and how.
To measure progress towards sustainability we need indicators. An indicator is something that
helps you understand where you and where your community are, what trends are evident, and
how far you are from where you want to be. A good indicator alerts you to a problem before it
gets too bad and helps you recognise what needs to be done to fix the problem (Farrell and
Hart, 1998 as cited in Moller and Macleod, 2013). However, as definitions of sustainability are
complex and vary among different stakeholders (see Hunt, 2013a; Bell and Morse, 2008), so
too will the indicators chosen to measure it vary by discipline, objective or interest group
(Saunders et al., 2006: 15). Therefore, developing metrics that are statistically robust,
standardised and repeatable, inexpensive to measure and, most crucial of all, focused on
keystone processes of agri-systems, is a formidable methodological challenge.
NZSD framework and indicator design process
Literature reviews
In the first stage of development of KPIs for use in the NZSD, three literature reviews were
carried out to identify frameworks and indicators presently in use internationally. This was in
order to give the indicators used in the NZSD a recognised legitimacy and a track record.
One report, ‘Sustainability Trends in Key Overseas Markets to New Zealand and the KPI
identification database’ (Saunders et al., 2013), documents the key influences on the marketing
of New Zealand’s primary products such as: the development of agri-environmental policies in
the EU and the U.S.; the move towards sustainability in markets driven by the private sector
and retailers (e.g., GlobalG.A.P and the Red Tractor Scheme); the change in consumer
attitudes and behaviours towards accountability for environmental and social impacts of the
products consumers are purchasing and the promotion of sustainable practices; climate
change (carbon footprinting); water quality and quantity (water footprinting); protection of
biodiversity and wildlife; animal welfare; and the emphasis on local food. This report includes
the KPI Identification Database which contains measures included in key market assurance
and good practice schemes. It includes specific indicators by which economic, social,
environmental and governance-based regulation, best practice and market assurance
principles have been measured by various product and company schemes internationally.
Currently, the database includes 41 assurance schemes.
Chapter 1: The New Zealand Sustainability Dashboard aims and design
Synthesis Sustainability Framework and KPI
16
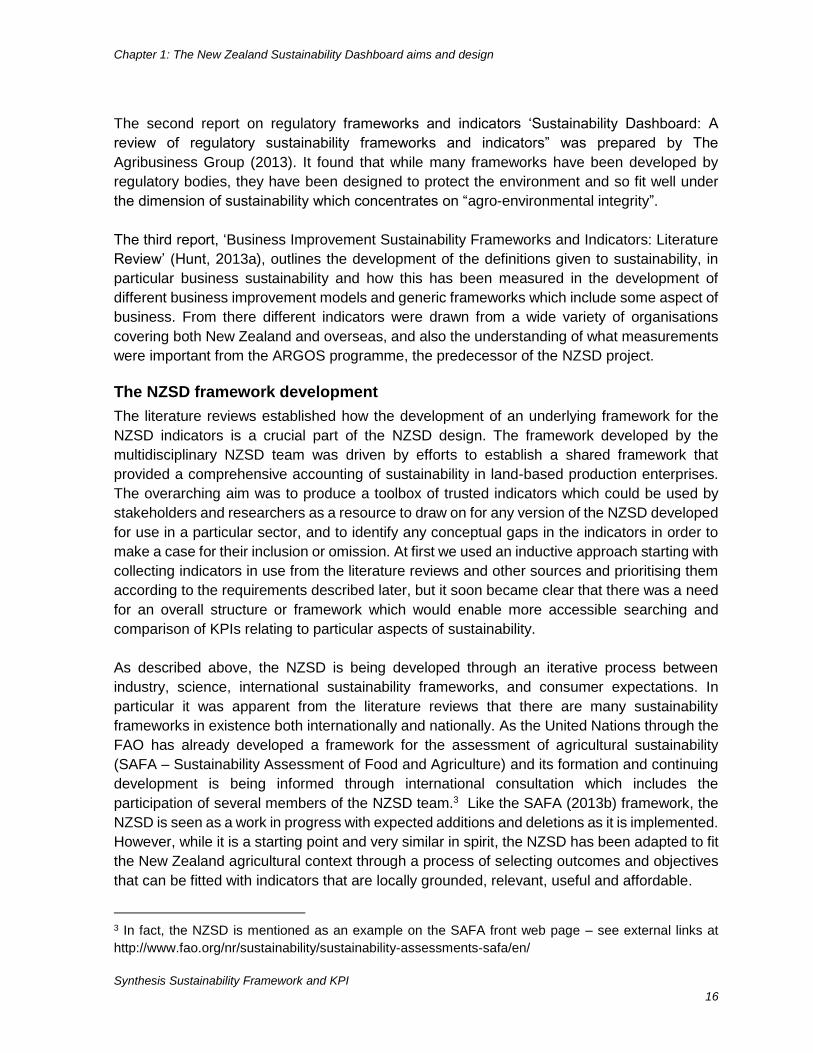
The second report on regulatory frameworks and indicators ‘Sustainability Dashboard: A
review of regulatory sustainability frameworks and indicators” was prepared by The
Agribusiness Group (2013). It found that while many frameworks have been developed by
regulatory bodies, they have been designed to protect the environment and so fit well under
the dimension of sustainability which concentrates on “agro-environmental integrity”.
The third report, ‘Business Improvement Sustainability Frameworks and Indicators: Literature
Review’ (Hunt, 2013a), outlines the development of the definitions given to sustainability, in
particular business sustainability and how this has been measured in the development of
different business improvement models and generic frameworks which include some aspect of
business. From there different indicators were drawn from a wide variety of organisations
covering both New Zealand and overseas, and also the understanding of what measurements
were important from the ARGOS programme, the predecessor of the NZSD project.
The NZSD framework development
The literature reviews established how the development of an underlying framework for the
NZSD indicators is a crucial part of the NZSD design. The framework developed by the
multidisciplinary NZSD team was driven by efforts to establish a shared framework that
provided a comprehensive accounting of sustainability in land-based production enterprises.
The overarching aim was to produce a toolbox of trusted indicators which could be used by
stakeholders and researchers as a resource to draw on for any version of the NZSD developed
for use in a particular sector, and to identify any conceptual gaps in the indicators in order to
make a case for their inclusion or omission. At first we used an inductive approach starting with
collecting indicators in use from the literature reviews and other sources and prioritising them
according to the requirements described later, but it soon became clear that there was a need
for an overall structure or framework which would enable more accessible searching and
comparison of KPIs relating to particular aspects of sustainability.
As described above, the NZSD is being developed through an iterative process between
industry, science, international sustainability frameworks, and consumer expectations. In
particular it was apparent from the literature reviews that there are many sustainability
frameworks in existence both internationally and nationally. As the United Nations through the
FAO has already developed a framework for the assessment of agricultural sustainability
(SAFA – Sustainability Assessment of Food and Agriculture) and its formation and continuing
development is being informed through international consultation which includes the
participation of several members of the NZSD team.3 Like the SAFA (2013b) framework, the
NZSD is seen as a work in progress with expected additions and deletions as it is implemented.
However, while it is a starting point and very similar in spirit, the NZSD has been adapted to fit
the New Zealand agricultural context through a process of selecting outcomes and objectives
that can be fitted with indicators that are locally grounded, relevant, useful and affordable.
3 In fact, the NZSD is mentioned as an example on the SAFA front web page – see external links at
http://www.fao.org/nr/sustainability/sustainability-assessments-safa/en/
Chapter 1: The New Zealand Sustainability Dashboard aims and design
Synthesis Sustainability Framework and KPI
17
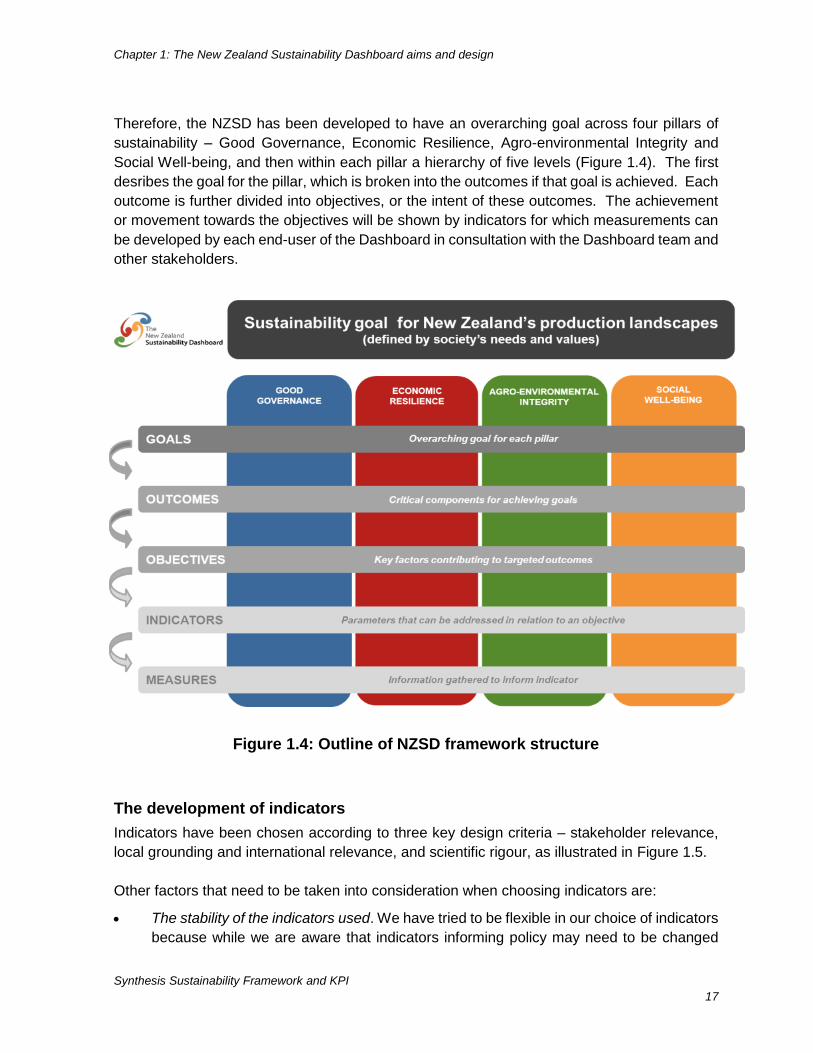
Therefore, the NZSD has been developed to have an overarching goal across four pillars of
sustainability – Good Governance, Economic Resilience, Agro-environmental Integrity and
Social Well-being, and then within each pillar a hierarchy of five levels (Figure 1.4). The first
desribes the goal for the pillar, which is broken into the outcomes if that goal is achieved. Each
outcome is further divided into objectives, or the intent of these outcomes. The achievement
or movement towards the objectives will be shown by indicators for which measurements can
be developed by each end-user of the Dashboard in consultation with the Dashboard team and
other stakeholders.
Figure 1.4: Outline of NZSD framework structure
The development of indicators
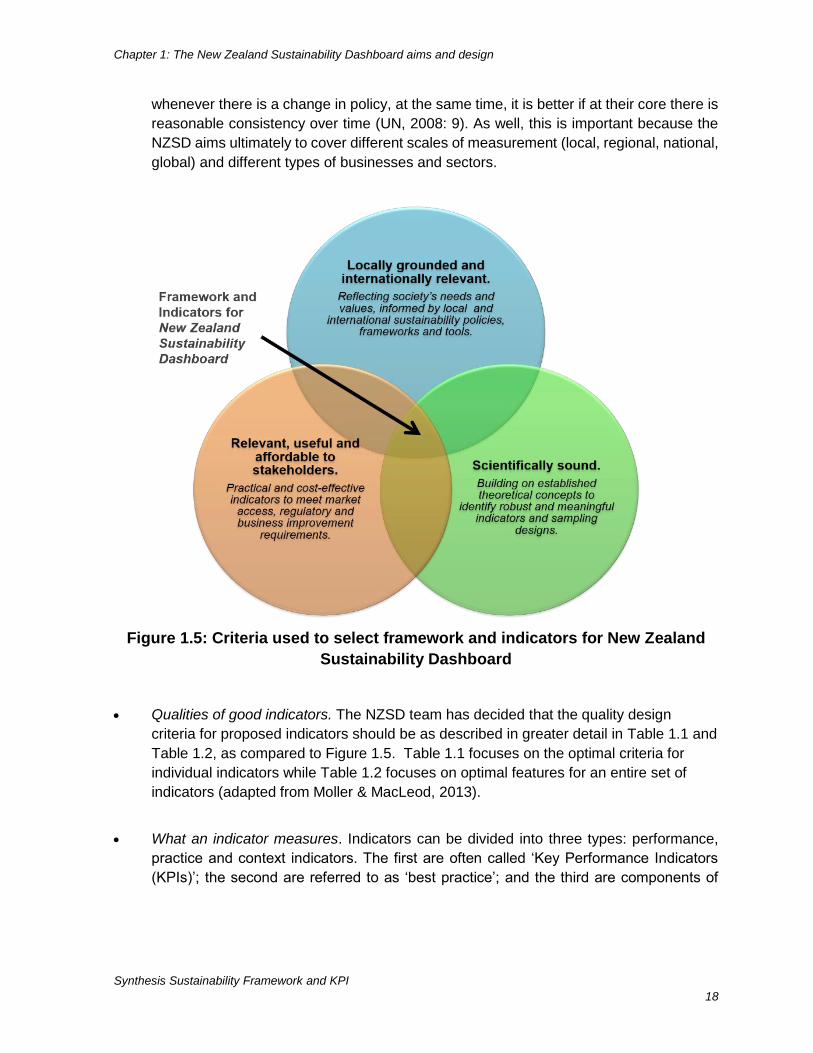
Indicators have been chosen according to three key design criteria – stakeholder relevance,
local grounding and international relevance, and scientific rigour, as illustrated in Figure 1.5.
Other factors that need to be taken into consideration when choosing indicators are:
The stability of the indicators used. We have tried to be flexible in our choice of indicators
because while we are aware that indicators informing policy may need to be changed
Chapter 1: The New Zealand Sustainability Dashboard aims and design
Synthesis Sustainability Framework and KPI
18
whenever there is a change in policy, at the same time, it is better if at their core there is
reasonable consistency over time (UN, 2008: 9). As well, this is important because the
NZSD aims ultimately to cover different scales of measurement (local, regional, national,
global) and different types of businesses and sectors.
Figure 1.5: Criteria used to select framework and indicators for New Zealand
Sustainability Dashboard
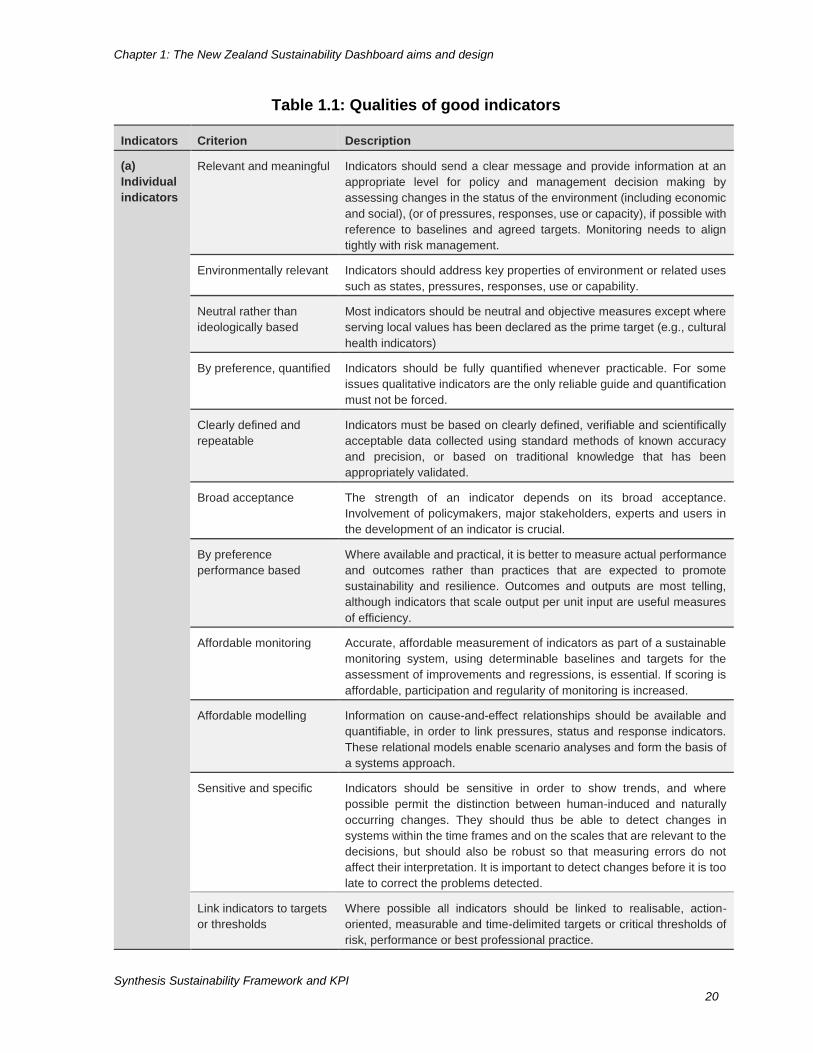
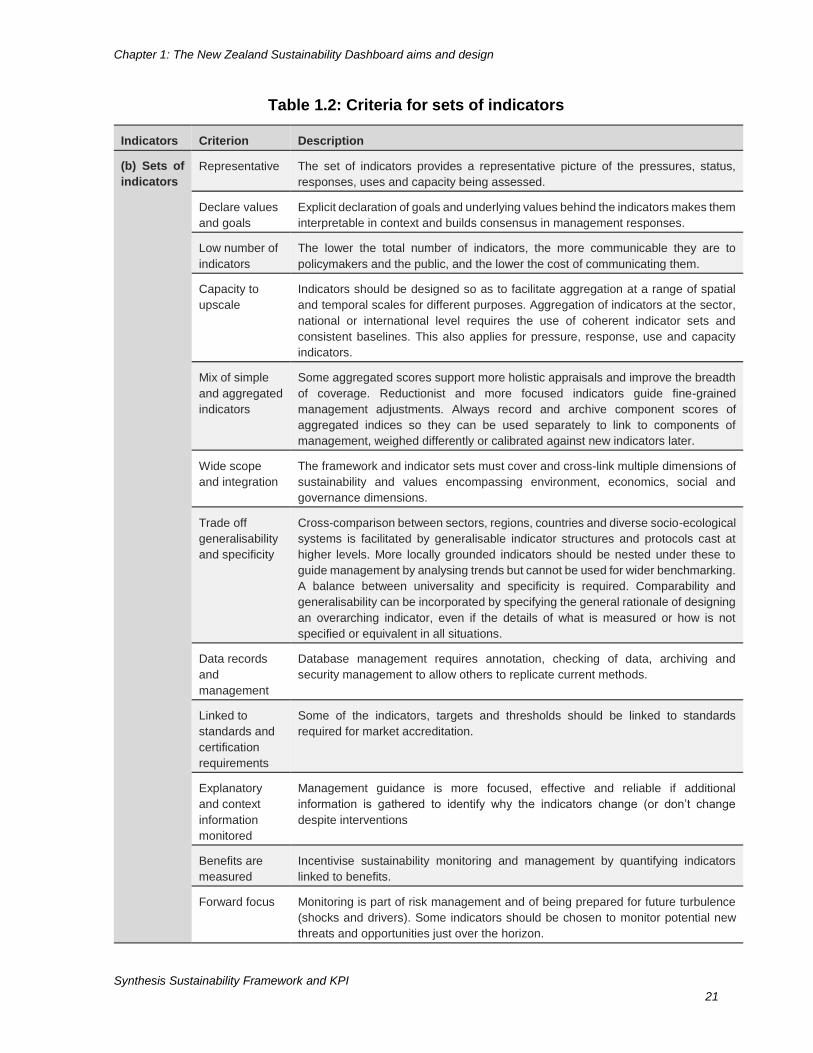
Qualities of good indicators. The NZSD team has decided that the quality design
criteria for proposed indicators should be as described in greater detail in Table 1.1 and
Table 1.2, as compared to Figure 1.5. Table 1.1 focuses on the optimal criteria for
individual indicators while Table 1.2 focuses on optimal features for an entire set of
indicators (adapted from Moller & MacLeod, 2013).
What an indicator measures. Indicators can be divided into three types: performance,
practice and context indicators. The first are often called ‘Key Performance Indicators
(KPIs)’; the second are referred to as ‘best practice’; and the third are components of
Chapter 1: The New Zealand Sustainability Dashboard aims and design
Synthesis Sustainability Framework and KPI
19
‘benchmarking’ or ‘standards’ that help define targets and drive improved performance
and practice.4
Several context indicators will be gathered to help interpret the monitoring results, but they will
be considered in the next phase of operationalising the NZSDs. In the meantime we make
some general suggestions of potential examples of performance- and practice-based
‘measures’ for each proposed indicator to illustrate a range of forms for discussion. More
specific measures and their sustainability thresholds must be developed later in collaboration
with each agricultural sector that hosts its own NZSD if they are to be fully locally grounded,
practical and measurable by the viticulturists, farmers, orchardists, foresters, and kaitiaki
themselves.
This introductory chapter has introduced the purpose of this report, the development of the
NZSD, indicated the best practice to follow in developing such a tool, and the design process
followed. The next chapter describes how the goals of the NZSD are aligned locally, nationally
and internationally.
4 See Moller and MacLeod (2013) for a discussion of their relative strengths and uses. The NZSD will
try to use performance-based indicators whenever possible, but practice-based indicators are less
expensive, can be scored quickly by farmers and can extend the coverage of the issues monitored by
being naturally integrative and grounded in farming practice.
Chapter 1: The New Zealand Sustainability Dashboard aims and design
Synthesis Sustainability Framework and KPI
20
Table 1.1: Qualities of good indicators
Indicators Criterion Description
(a)
Individual
indicators
Relevant and meaningful Indicators should send a clear message and provide information at an
appropriate level for policy and management decision making by
assessing changes in the status of the environment (including economic
and social), (or of pressures, responses, use or capacity), if possible with
reference to baselines and agreed targets. Monitoring needs to align
tightly with risk management.
Environmentally relevant Indicators should address key properties of environment or related uses
such as states, pressures, responses, use or capability.
Neutral rather than
ideologically based
Most indicators should be neutral and objective measures except where
serving local values has been declared as the prime target (e.g., cultural
health indicators)
By preference, quantified Indicators should be fully quantified whenever practicable. For some
issues qualitative indicators are the only reliable guide and quantification
must not be forced.
Clearly defined and
repeatable
Indicators must be based on clearly defined, verifiable and scientifically
acceptable data collected using standard methods of known accuracy
and precision, or based on traditional knowledge that has been
appropriately validated.
Broad acceptance The strength of an indicator depends on its broad acceptance.
Involvement of policymakers, major stakeholders, experts and users in
the development of an indicator is crucial.
By preference
performance based
Where available and practical, it is better to measure actual performance
and outcomes rather than practices that are expected to promote
sustainability and resilience. Outcomes and outputs are most telling,
although indicators that scale output per unit input are useful measures
of efficiency.
Affordable monitoring Accurate, affordable measurement of indicators as part of a sustainable
monitoring system, using determinable baselines and targets for the
assessment of improvements and regressions, is essential. If scoring is
affordable, participation and regularity of monitoring is increased.
Affordable modelling Information on cause-and-effect relationships should be available and
quantifiable, in order to link pressures, status and response indicators.
These relational models enable scenario analyses and form the basis of
a systems approach.
Sensitive and specific Indicators should be sensitive in order to show trends, and where
possible permit the distinction between human-induced and naturally
occurring changes. They should thus be able to detect changes in
systems within the time frames and on the scales that are relevant to the
decisions, but should also be robust so that measuring errors do not
affect their interpretation. It is important to detect changes before it is too
late to correct the problems detected.
Link indicators to targets
or thresholds
Where possible all indicators should be linked to realisable, action-
oriented, measurable and time-delimited targets or critical thresholds of
risk, performance or best professional practice.
Chapter 1: The New Zealand Sustainability Dashboard aims and design
Synthesis Sustainability Framework and KPI
21
Table 1.2: Criteria for sets of indicators
Indicators Criterion Description
(b) Sets of
indicators
Representative The set of indicators provides a representative picture of the pressures, status,
responses, uses and capacity being assessed.
Declare values
and goals
Explicit declaration of goals and underlying values behind the indicators makes them
interpretable in context and builds consensus in management responses.
Low number of
indicators
The lower the total number of indicators, the more communicable they are to
policymakers and the public, and the lower the cost of communicating them.
Capacity to
upscale
Indicators should be designed so as to facilitate aggregation at a range of spatial
and temporal scales for different purposes. Aggregation of indicators at the sector,
national or international level requires the use of coherent indicator sets and
consistent baselines. This also applies for pressure, response, use and capacity
indicators.
Mix of simple
and aggregated
indicators
Some aggregated scores support more holistic appraisals and improve the breadth
of coverage. Reductionist and more focused indicators guide fine-grained
management adjustments. Always record and archive component scores of
aggregated indices so they can be used separately to link to components of
management, weighed differently or calibrated against new indicators later.
Wide scope
and integration
The framework and indicator sets must cover and cross-link multiple dimensions of
sustainability and values encompassing environment, economics, social and
governance dimensions.
Trade off
generalisability
and specificity
Cross-comparison between sectors, regions, countries and diverse socio-ecological
systems is facilitated by generalisable indicator structures and protocols cast at
higher levels. More locally grounded indicators should be nested under these to
guide management by analysing trends but cannot be used for wider benchmarking.
A balance between universality and specificity is required. Comparability and
generalisability can be incorporated by specifying the general rationale of designing
an overarching indicator, even if the details of what is measured or how is not
specified or equivalent in all situations.
Data records
and
management
Database management requires annotation, checking of data, archiving and
security management to allow others to replicate current methods.
Linked to
standards and
certification
requirements
Some of the indicators, targets and thresholds should be linked to standards
required for market accreditation.
Explanatory
and context
information
monitored
Management guidance is more focused, effective and reliable if additional
information is gathered to identify why the indicators change (or don’t change
despite interventions
Benefits are
measured
Incentivise sustainability monitoring and management by quantifying indicators
linked to benefits.
Forward focus Monitoring is part of risk management and of being prepared for future turbulence
(shocks and drivers). Some indicators should be chosen to monitor potential new
threats and opportunities just over the horizon.
Chapter 2: Overarching goals of the New Zealand Sustainability Dashboard
Synthesis Sustainability Framework and KPI
22
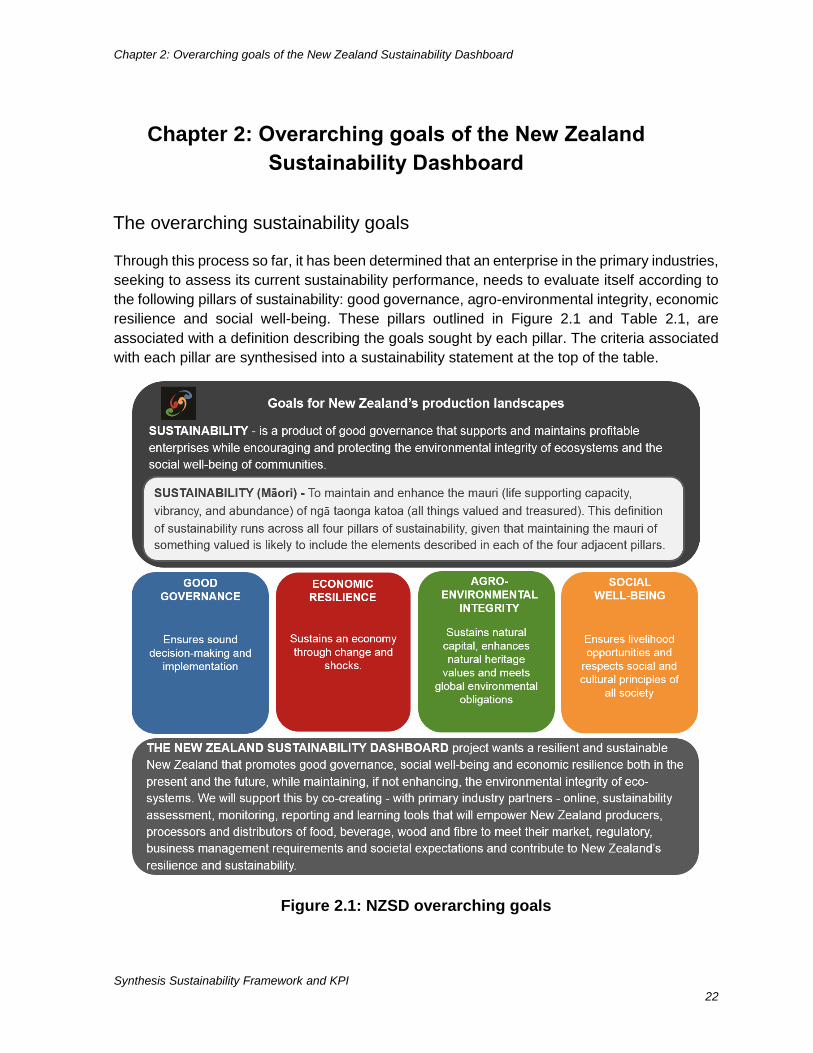
The overarching sustainability goals
Through this process so far, it has been determined that an enterprise in the primary industries,
seeking to assess its current sustainability performance, needs to evaluate itself according to
the following pillars of sustainability: good governance, agro-environmental integrity, economic
resilience and social well-being. These pillars outlined in Figure 2.1 and Table 2.1, are
associated with a definition describing the goals sought by each pillar. The criteria associated
with each pillar are synthesised into a sustainability statement at the top of the table.
Figure 2.1: NZSD overarching goals
Chapter 2: Overarching goals of the New Zealand
Sustainability Dashboard
Chapter 2: Overarching goals of the New Zealand Sustainability Dashboard
Synthesis Sustainability Framework and KPI
23
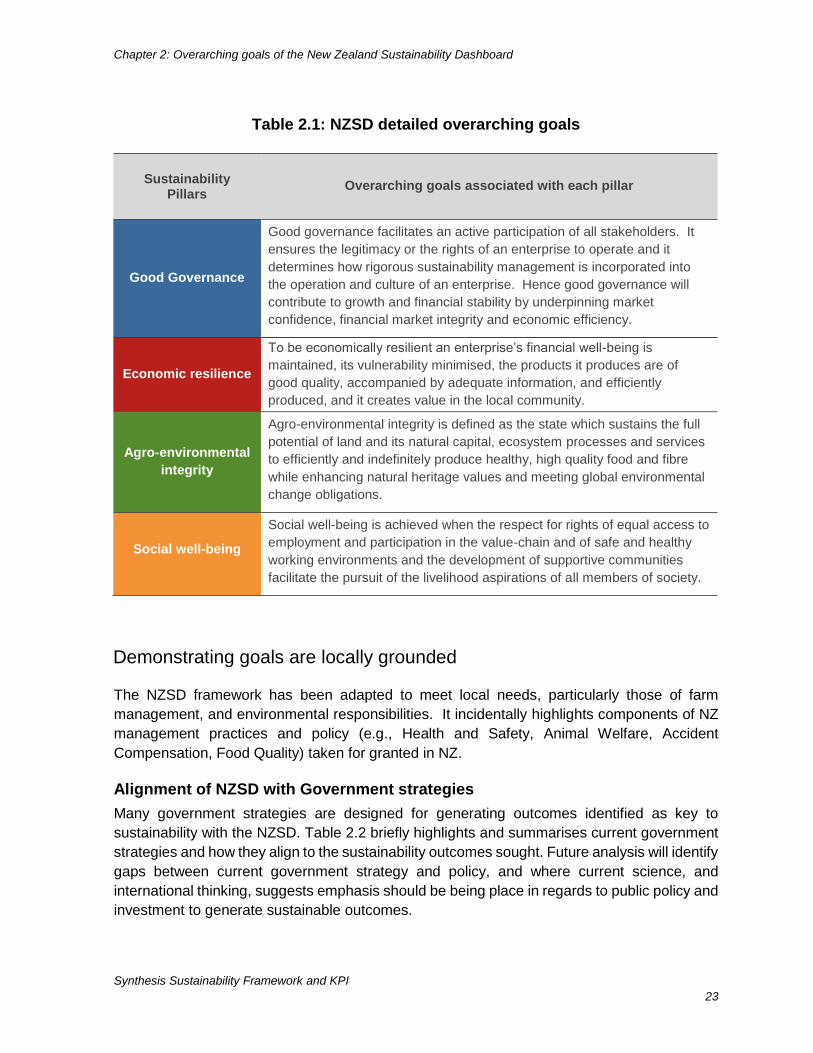
Table 2.1: NZSD detailed overarching goals
Demonstrating goals are locally grounded
The NZSD framework has been adapted to meet local needs, particularly those of farm
management, and environmental responsibilities. It incidentally highlights components of NZ
management practices and policy (e.g., Health and Safety, Animal Welfare, Accident
Compensation, Food Quality) taken for granted in NZ.
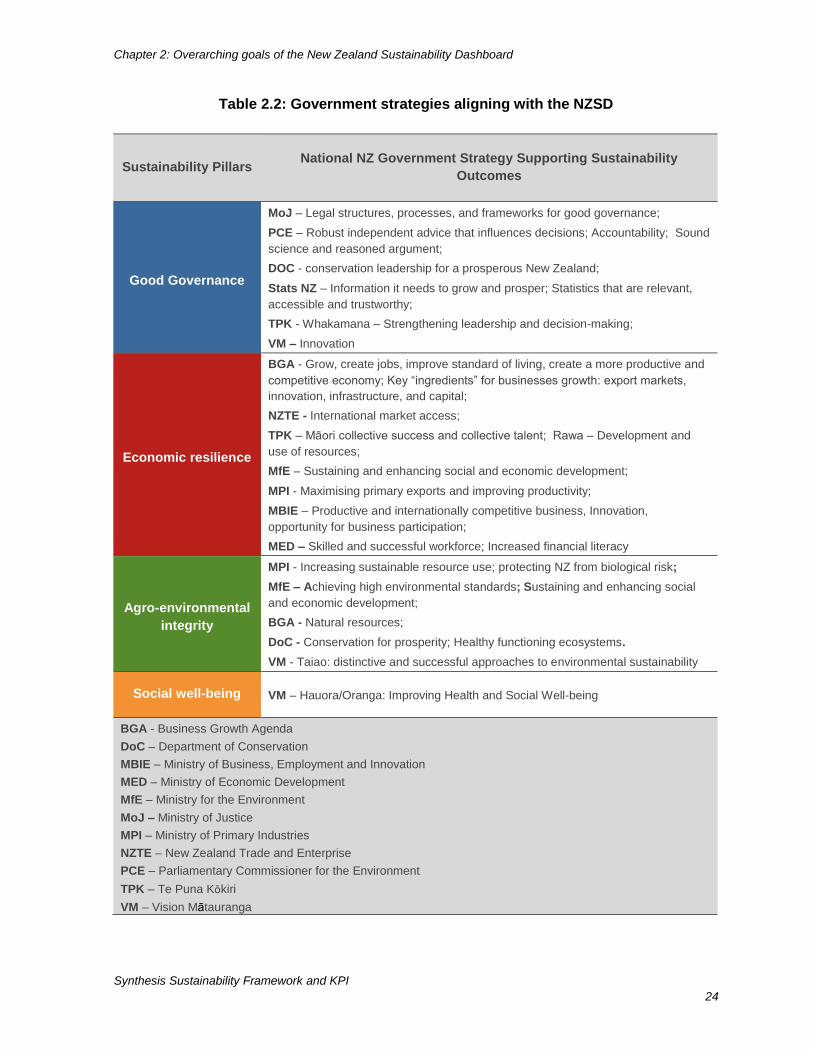
Alignment of NZSD with Government strategies
Many government strategies are designed for generating outcomes identified as key to
sustainability with the NZSD. Table 2.2 briefly highlights and summarises current government
strategies and how they align to the sustainability outcomes sought. Future analysis will identify
gaps between current government strategy and policy, and where current science, and
international thinking, suggests emphasis should be being place in regards to public policy and
investment to generate sustainable outcomes.
Sustainability Pillars
Overarching goals associated with each pillar
Good Governance
Good governance facilitates an active participation of all stakeholders. It
ensures the legitimacy or the rights of an enterprise to operate and it
determines how rigorous sustainability management is incorporated into
the operation and culture of an enterprise. Hence good governance will
contribute to growth and financial stability by underpinning market
confidence, financial market integrity and economic efficiency.
Economic resilience
To be economically resilient an enterprise’s financial well-being is
maintained, its vulnerability minimised, the products it produces are of
good quality, accompanied by adequate information, and efficiently
produced, and it creates value in the local community.
Agro-environmental
integrity
Agro-environmental integrity is defined as the state which sustains the full
potential of land and its natural capital, ecosystem processes and services
to efficiently and indefinitely produce healthy, high quality food and fibre
while enhancing natural heritage values and meeting global environmental
change obligations.
Social well-being
Social well-being is achieved when the respect for rights of equal access to
employment and participation in the value-chain and of safe and healthy
working environments and the development of supportive communities
facilitate the pursuit of the livelihood aspirations of all members of society.
Chapter 2: Overarching goals of the New Zealand Sustainability Dashboard
Synthesis Sustainability Framework and KPI
24
Table 2.2: Government strategies aligning with the NZSD
Sustainability Pillars National NZ Government Strategy Supporting Sustainability
Outcomes
Good Governance
MoJ – Legal structures, processes, and frameworks for good governance;
PCE – Robust independent advice that influences decisions; Accountability; Sound
science and reasoned argument;
DOC - conservation leadership for a prosperous New Zealand;
Stats NZ – Information it needs to grow and prosper; Statistics that are relevant,
accessible and trustworthy;
TPK - Whakamana – Strengthening leadership and decision-making;
VM – Innovation
Economic resilience
BGA - Grow, create jobs, improve standard of living, create a more productive and
competitive economy; Key “ingredients” for businesses growth: export markets,
innovation, infrastructure, and capital;
NZTE - International market access;
TPK – Māori collective success and collective talent; Rawa – Development and
use of resources;
MfE – Sustaining and enhancing social and economic development;
MPI - Maximising primary exports and improving productivity;
MBIE – Productive and internationally competitive business, Innovation,
opportunity for business participation;
MED – Skilled and successful workforce; Increased financial literacy
Agro-environmental
integrity
MPI - Increasing sustainable resource use; protecting NZ from biological risk;
MfE – Achieving high environmental standards; Sustaining and enhancing social
and economic development;
BGA - Natural resources;
DoC - Conservation for prosperity; Healthy functioning ecosystems.
VM - Taiao: distinctive and successful approaches to environmental sustainability
Social well-being VM – Hauora/Oranga: Improving Health and Social Well-being
BGA - Business Growth Agenda
DoC – Department of Conservation
MBIE – Ministry of Business, Employment and Innovation
MED – Ministry of Economic Development
MfE – Ministry for the Environment
MoJ – Ministry of Justice
MPI – Ministry of Primary Industries
NZTE – New Zealand Trade and Enterprise
PCE – Parliamentary Commissioner for the Environment
TPK – Te Puna Kōkiri
VM – Vision Mātauranga
Chapter 2: Overarching goals of the New Zealand Sustainability Dashboard
Synthesis Sustainability Framework and KPI
25
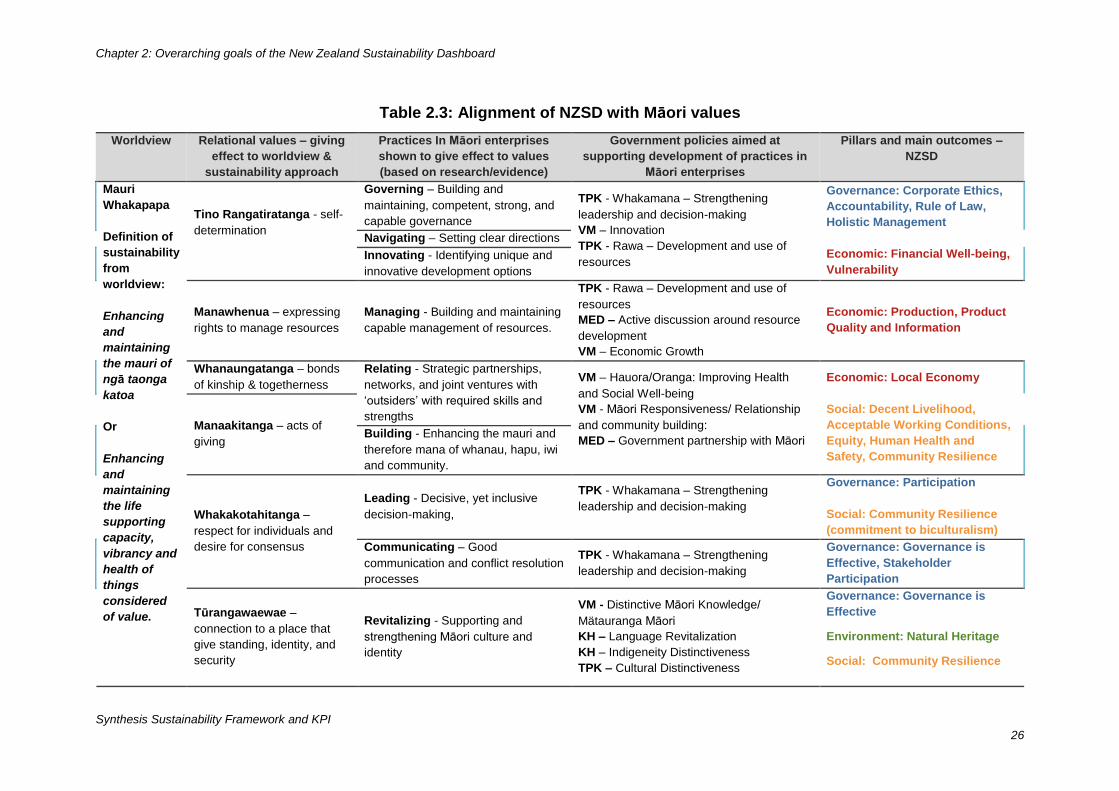
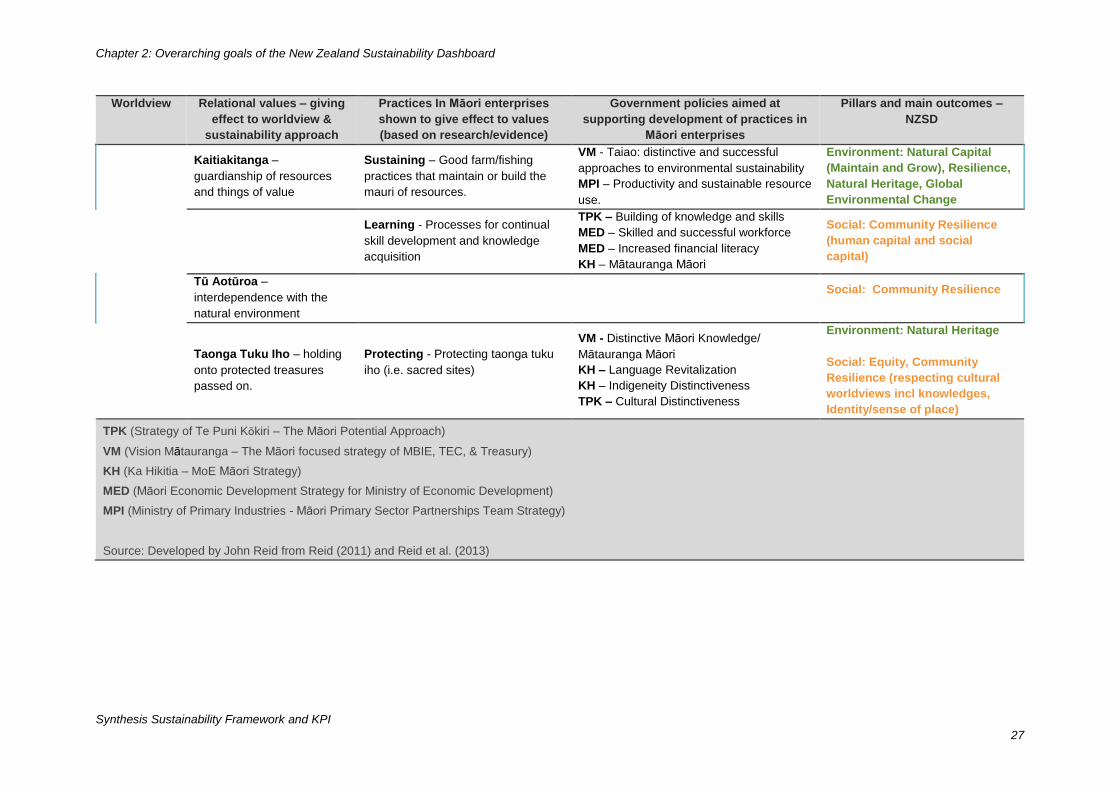
Alignment with Māori cultural values
The recognition of the Te Tiriti o Waitangi within the NZSD brings with it a responsibility to align
with Māori cultural values. Table 2.3 indicates the hierarchy from the Māori world view - its
emphasis on maintaining and enhancing relationships between the past present and future, all
living things and the land, and their connection to practice, through to Government policies that
support Māori, to the alignment with components of the NZSD.
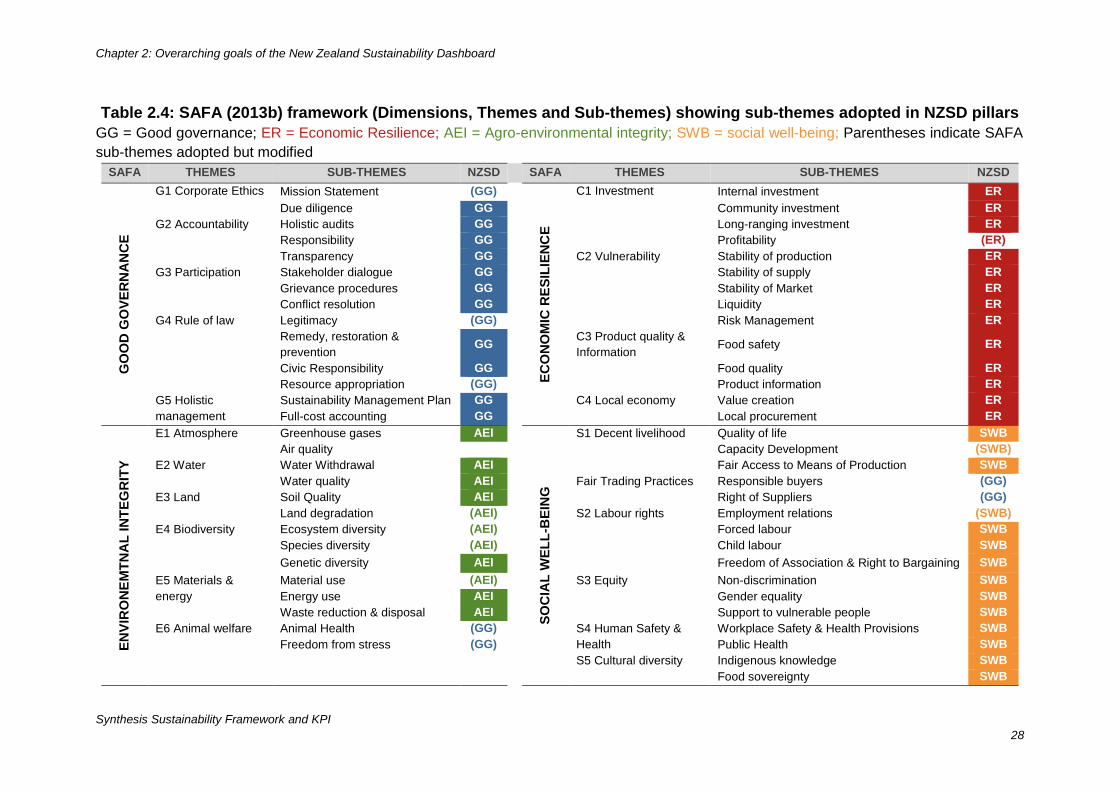
Alignment to international sustainability assessment systems
As stated earlier, the development of the NZSD framework and indicators has been informed
by an interactional process through the development by FAO of the Sustainability Assessment
of Food and Agriculture Systems (SAFA). Table 2.4 shows which themes and sub-themes of
the SAFA framework were adopted and/or adapted to fit into the NZSD framework. As
described in Chapter 1 the NZSD has also been informed by reviews of the international
literature and international and national sustainability assessment tools, by environmental
science, economics and social science, and by industry needs within New Zealand. These
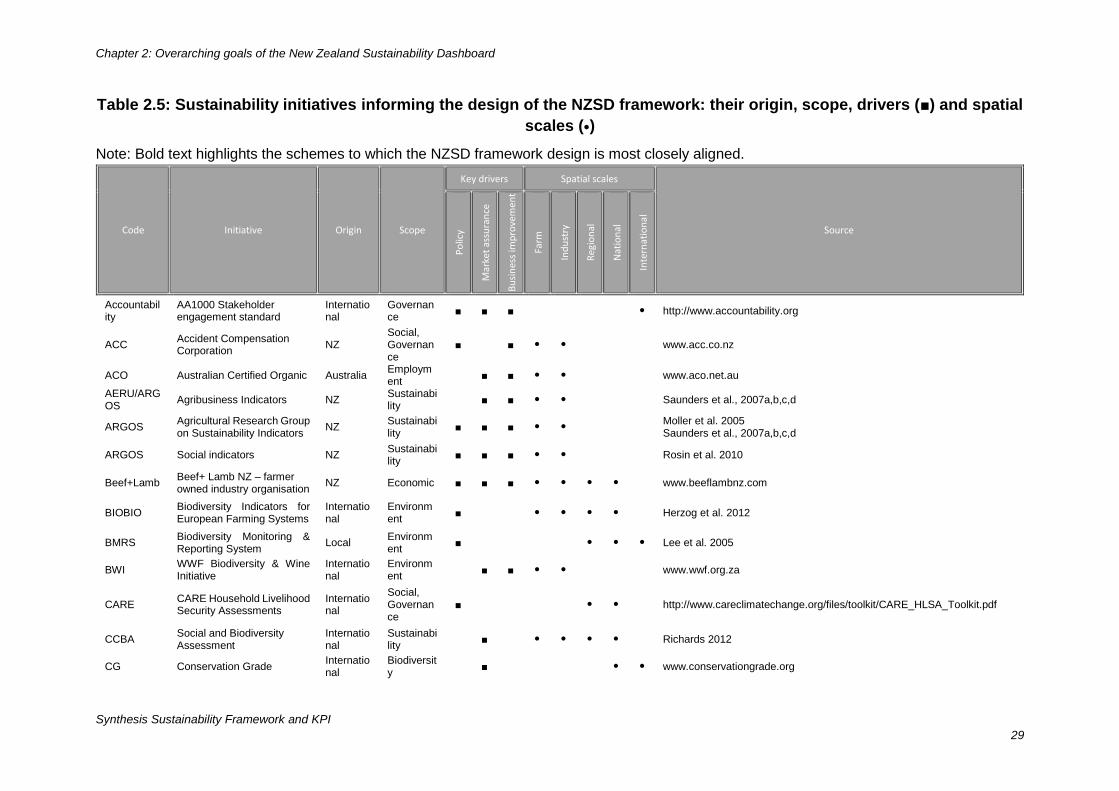
sources are listed in Table 2.5 to show not only their origin but also their scope, key drivers
(policy, market, business) and spatial scale (farm, industry, regional, national, international).
The following chapters describe the different pillars, their outcomes and objectives along with
the corresponding indicators given the highest priority for inclusion on the criteria described
earlier. While the process was relatively straightforward in most cases, it did require some
negotiation over the assignment of some outcomes to pillars and objectives to outcomes. In
other words, not all indicators were exclusive to one of the outcomes with, for example,
economic indicators having both financial and social implications. In the end, decisions on
where to position specific indicators generally reflected the disciplinary understanding and
training of members of the research team.5
Within each of the outcomes, indicators were organised according to objectives and indicators
identified through a further negotiated process. This categorisation largely represents those
included in existing frameworks or assessments. The research team has applied their
knowledge and experience in the analysis of agricultural sustainability in each of the four pillars
to create frameworks that incorporate the range of relevant practices and dynamics from the
governance, environmental, economic, social, farm management and Māori perspectives. The
resulting suite of recommended indicators is intended to provide sufficient breadth to account
for the range of concerns from production to consumption and across diverse scales and
scopes subject to the specific concerns and market orientations of producers and processors
in New Zealand.
5 This situation is not unexpected as the literature on the development of assessment frameworks and
indicators commonly notes that the structure of sustainability assessments varies according to the
political and power positions of those who create them as well as the target population to be assessed
(Colantonio 2009a; Littig and Griessler 2005).
Chapter 2: Overarching goals of the New Zealand Sustainability Dashboard
Synthesis Sustainability Framework and KPI
26
Table 2.3: Alignment of NZSD with Māori values
Worldview Relational values – giving
effect to worldview &
sustainability approach
Practices In Māori enterprises
shown to give effect to values
(based on research/evidence)
Government policies aimed at
supporting development of practices in
Māori enterprises
Pillars and main outcomes –
NZSD
Mauri
Whakapapa
Definition of
sustainability
from
worldview:
Enhancing
and
maintaining
the mauri of
ngā taonga
katoa
Or
Enhancing
and
maintaining
the life
supporting
capacity,
vibrancy and
health of
things
considered
of value.
Tino Rangatiratanga - self-
determination
Governing – Building and
maintaining, competent, strong, and
capable governance
TPK - Whakamana – Strengthening
leadership and decision-making
VM – Innovation
TPK - Rawa – Development and use of
resources
Governance: Corporate Ethics,
Accountability, Rule of Law,
Holistic Management
Economic: Financial Well-being,
Vulnerability
Navigating – Setting clear directions
Innovating - Identifying unique and
innovative development options
Manawhenua – expressing
rights to manage resources
Managing - Building and maintaining
capable management of resources.
TPK - Rawa – Development and use of
resources
MED – Active discussion around resource
development
VM – Economic Growth
Economic: Production, Product
Quality and Information
Whanaungatanga – bonds
of kinship & togetherness
Relating - Strategic partnerships,
networks, and joint ventures with
‘outsiders’ with required skills and
strengths
VM – Hauora/Oranga: Improving Health
and Social Well-being
VM - Māori Responsiveness/ Relationship
and community building:
MED – Government partnership with Māori
Economic: Local Economy
Social: Decent Livelihood,
Acceptable Working Conditions,
Equity, Human Health and
Safety, Community Resilience
Manaakitanga – acts of
giving Building - Enhancing the mauri and
therefore mana of whanau, hapu, iwi
and community.
Whakakotahitanga –
respect for individuals and
desire for consensus
Leading - Decisive, yet inclusive
decision-making,
TPK - Whakamana – Strengthening
leadership and decision-making
Governance: Participation
Social: Community Resilience
(commitment to biculturalism)
Communicating – Good
communication and conflict resolution
processes
TPK - Whakamana – Strengthening
leadership and decision-making
Governance: Governance is
Effective, Stakeholder
Participation
Tūrangawaewae –
connection to a place that
give standing, identity, and
security
Revitalizing - Supporting and
strengthening Māori culture and
identity
VM - Distinctive Māori Knowledge/
Mätauranga Māori
KH – Language Revitalization
KH – Indigeneity Distinctiveness
TPK – Cultural Distinctiveness
Governance: Governance is
Effective
Environment: Natural Heritage
Social: Community Resilience
Chapter 2: Overarching goals of the New Zealand Sustainability Dashboard
Synthesis Sustainability Framework and KPI
27
Worldview Relational values – giving
effect to worldview &
sustainability approach
Practices In Māori enterprises
shown to give effect to values
(based on research/evidence)
Government policies aimed at
supporting development of practices in
Māori enterprises
Pillars and main outcomes –
NZSD
Kaitiakitanga –
guardianship of resources
and things of value
Sustaining – Good farm/fishing
practices that maintain or build the
mauri of resources.
VM - Taiao: distinctive and successful
approaches to environmental sustainability
MPI – Productivity and sustainable resource
use.
Environment: Natural Capital
(Maintain and Grow), Resilience,
Natural Heritage, Global
Environmental Change
Learning - Processes for continual
skill development and knowledge
acquisition
TPK – Building of knowledge and skills
MED – Skilled and successful workforce
MED – Increased financial literacy
KH – Mātauranga Māori
Social: Community Resilience
(human capital and social
capital)
Tū Aotūroa –
interdependence with the
natural environment
Social: Community Resilience
Taonga Tuku Iho – holding
onto protected treasures
passed on.
Protecting - Protecting taonga tuku
iho (i.e. sacred sites)
VM - Distinctive Māori Knowledge/
Mātauranga Māori
KH – Language Revitalization
KH – Indigeneity Distinctiveness
TPK – Cultural Distinctiveness
Environment: Natural Heritage
Social: Equity, Community
Resilience (respecting cultural
worldviews incl knowledges,
Identity/sense of place)
TPK (Strategy of Te Puni Kōkiri – The Māori Potential Approach)
VM (Vision Mātauranga – The Māori focused strategy of MBIE, TEC, & Treasury)
KH (Ka Hikitia – MoE Māori Strategy)
MED (Māori Economic Development Strategy for Ministry of Economic Development)
MPI (Ministry of Primary Industries - Māori Primary Sector Partnerships Team Strategy)
Source: Developed by John Reid from Reid (2011) and Reid et al. (2013)
Chapter 2: Overarching goals of the New Zealand Sustainability Dashboard
Synthesis Sustainability Framework and KPI
28
Table 2.4: SAFA (2013b) framework (Dimensions, Themes and Sub-themes) showing sub-themes adopted in NZSD pillars
GG = Good governance; ER = Economic Resilience; AEI = Agro-environmental integrity; SWB = social well-being; Parentheses indicate SAFA
sub-themes adopted but modified
SAFA THEMES SUB-THEMES NZSD SAFA THEMES SUB-THEMES NZSD
GO
OD
GO
VE
RN
AN
CE
G1 Corporate Ethics Mission Statement (GG)
EC
ON
OM
IC R
ES
ILIE
NC
E
C1 Investment Internal investment ER
Due diligence GG Community investment ER
G2 Accountability Holistic audits GG Long-ranging investment ER
Responsibility GG Profitability (ER)
Transparency GG C2 Vulnerability Stability of production ER
G3 Participation Stakeholder dialogue GG Stability of supply ER
Grievance procedures GG Stability of Market ER
Conflict resolution GG Liquidity ER
G4 Rule of law Legitimacy (GG) Risk Management ER
Remedy, restoration &
prevention GG
C3 Product quality &
Information Food safety ER
Civic Responsibility GG Food quality ER
Resource appropriation (GG) Product information ER
G5 Holistic
management
Sustainability Management Plan GG C4 Local economy Value creation ER
Full-cost accounting GG Local procurement ER
EN
VIR
ON
EM
TN
AL
IN
TE
GR
ITY
E1 Atmosphere Greenhouse gases AEI
SO
CIA
L W
EL
L-B
EIN
G
S1 Decent livelihood Quality of life SWB
Air quality Capacity Development (SWB)
E2 Water Water Withdrawal AEI Fair Access to Means of Production SWB
Water quality AEI Fair Trading Practices Responsible buyers (GG)
E3 Land Soil Quality AEI Right of Suppliers (GG)
Land degradation (AEI) S2 Labour rights Employment relations (SWB)
E4 Biodiversity Ecosystem diversity (AEI) Forced labour SWB
Species diversity (AEI) Child labour SWB
Genetic diversity AEI Freedom of Association & Right to Bargaining SWB
E5 Materials &
energy
Material use (AEI) S3 Equity Non-discrimination SWB
Energy use AEI Gender equality SWB
Waste reduction & disposal AEI Support to vulnerable people SWB
E6 Animal welfare Animal Health (GG) S4 Human Safety &
Health
Workplace Safety & Health Provisions SWB
Freedom from stress (GG) Public Health SWB
S5 Cultural diversity Indigenous knowledge SWB
Food sovereignty SWB
Chapter 2: Overarching goals of the New Zealand Sustainability Dashboard
Synthesis Sustainability Framework and KPI
29
Table 2.5: Sustainability initiatives informing the design of the NZSD framework: their origin, scope, drivers (■) and spatial
scales ()
Note: Bold text highlights the schemes to which the NZSD framework design is most closely aligned.
Code Initiative Origin Scope
Key drivers Spatial scales
Source
Po
licy
Mar
ket
assu
ran
ce
Bu
sin
ess
imp
rove
men
t
Farm
Ind
ust
ry
Reg
ion
al
Nat
ion
al
Inte
rnat
ion
al
Accountability
AA1000 Stakeholder engagement standard
International
Governance
■ ■ ■ http://www.accountability.org
ACC Accident Compensation Corporation
NZ Social, Governance
■ ■ www.acc.co.nz
ACO Australian Certified Organic Australia Employment
■ ■ www.aco.net.au
AERU/ARGOS
Agribusiness Indicators NZ Sustainability
■ ■ Saunders et al., 2007a,b,c,d
ARGOS Agricultural Research Group on Sustainability Indicators
NZ Sustainability
■ ■ ■ Moller et al. 2005 Saunders et al., 2007a,b,c,d
ARGOS Social indicators NZ Sustainability
■ ■ ■ Rosin et al. 2010
Beef+Lamb Beef+ Lamb NZ – farmer owned industry organisation
NZ Economic ■ ■ ■ www.beeflambnz.com
BIOBIO Biodiversity Indicators for European Farming Systems
International
Environment
■ Herzog et al. 2012
BMRS Biodiversity Monitoring & Reporting System
Local Environment
■ Lee et al. 2005
BWI WWF Biodiversity & Wine Initiative
International
Environment
■ ■ www.wwf.org.za
CARE CARE Household Livelihood Security Assessments
International
Social, Governance
■ http://www.careclimatechange.org/files/toolkit/CARE_HLSA_Toolkit.pdf
CCBA Social and Biodiversity Assessment
International
Sustainability
■ Richards 2012
CG Conservation Grade International
Biodiversity
■ www.conservationgrade.org
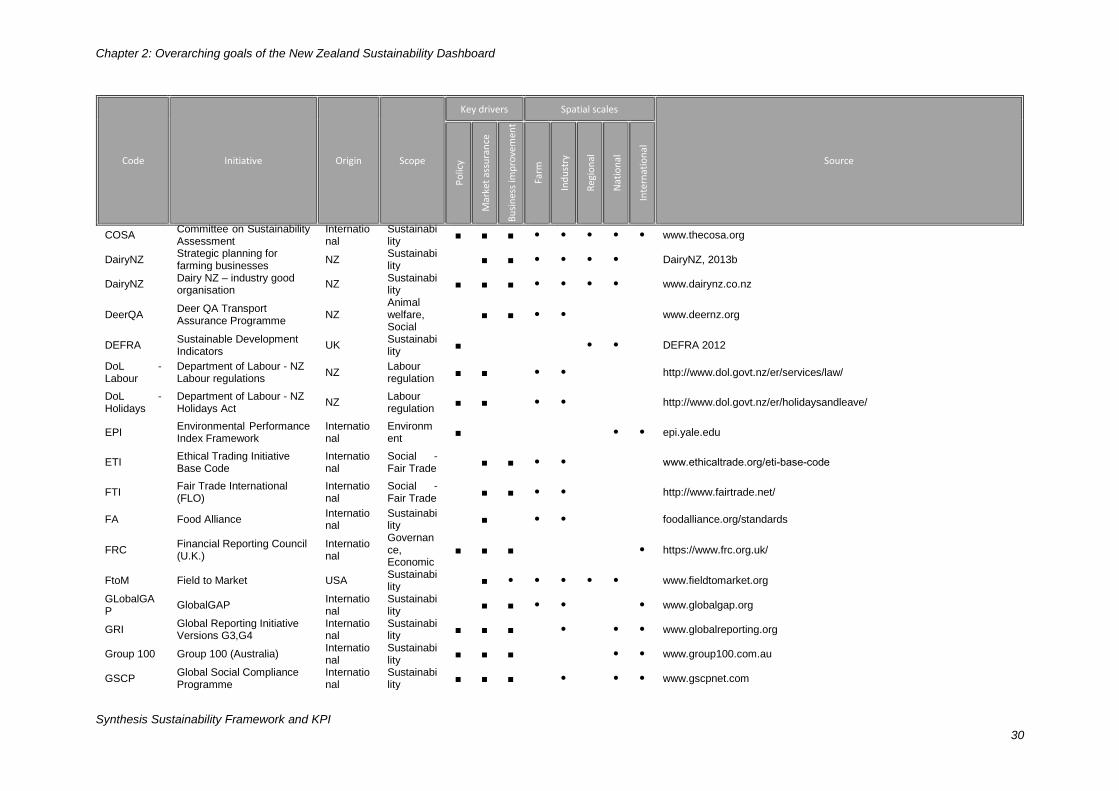
Chapter 2: Overarching goals of the New Zealand Sustainability Dashboard
Synthesis Sustainability Framework and KPI
30
Code Initiative Origin Scope
Key drivers Spatial scales
Source
Po
licy
Mar
ket
assu
ran
ce
Bu
sin
ess
imp
rove
men
t
Farm
Ind
ust
ry
Reg
ion
al
Nat
ion
al
Inte
rnat
ion
al
COSA Committee on Sustainability Assessment
International
Sustainability
■ ■ ■ www.thecosa.org
DairyNZ Strategic planning for farming businesses
NZ Sustainability
■ ■ DairyNZ, 2013b
DairyNZ Dairy NZ – industry good organisation
NZ Sustainability
■ ■ ■ www.dairynz.co.nz
DeerQA Deer QA Transport Assurance Programme
NZ Animal welfare, Social
■ ■ www.deernz.org
DEFRA Sustainable Development Indicators
UK Sustainability
■ DEFRA 2012
DoL - Labour
Department of Labour - NZ Labour regulations
NZ Labour regulation
■ ■ http://www.dol.govt.nz/er/services/law/
DoL - Holidays
Department of Labour - NZ Holidays Act
NZ Labour regulation
■ ■ http://www.dol.govt.nz/er/holidaysandleave/
EPI Environmental Performance Index Framework
International
Environment
■ epi.yale.edu
ETI Ethical Trading Initiative Base Code
International
Social - Fair Trade
■ ■ www.ethicaltrade.org/eti-base-code
FTI Fair Trade International (FLO)
International
Social - Fair Trade
■ ■ http://www.fairtrade.net/
FA Food Alliance International
Sustainability
■ foodalliance.org/standards
FRC Financial Reporting Council (U.K.)
International
Governance, Economic
■ ■ ■ https://www.frc.org.uk/
FtoM Field to Market USA Sustainability
■ www.fieldtomarket.org
GLobalGAP
GlobalGAP International
Sustainability
■ ■ www.globalgap.org
GRI Global Reporting Initiative Versions G3,G4
International
Sustainability
■ ■ ■ www.globalreporting.org
Group 100 Group 100 (Australia) International
Sustainability
■ ■ ■ www.group100.com.au
GSCP Global Social Compliance Programme
International
Sustainability
■ ■ ■ www.gscpnet.com
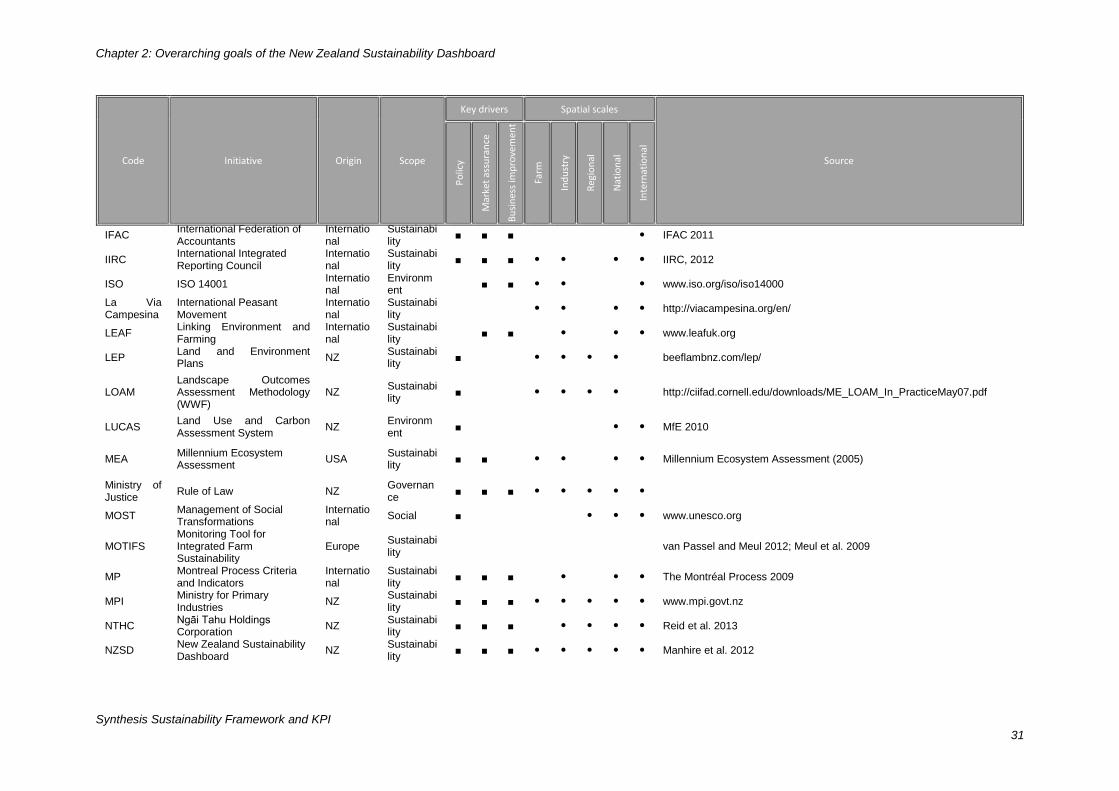
Chapter 2: Overarching goals of the New Zealand Sustainability Dashboard
Synthesis Sustainability Framework and KPI
31
Code Initiative Origin Scope
Key drivers Spatial scales
Source
Po
licy
Mar
ket
assu
ran
ce
Bu
sin
ess
imp
rove
men
t
Farm
Ind
ust
ry
Reg
ion
al
Nat
ion
al
Inte
rnat
ion
al
IFAC International Federation of Accountants
International
Sustainability
■ ■ ■ IFAC 2011
IIRC International Integrated Reporting Council
International
Sustainability
■ ■ ■ IIRC, 2012
ISO ISO 14001 International
Environment
■ ■ www.iso.org/iso/iso14000
La Via Campesina
International Peasant Movement
International
Sustainability
http://viacampesina.org/en/
LEAF Linking Environment and Farming
International
Sustainability
■ ■ www.leafuk.org
LEP Land and Environment Plans
NZ Sustainability
■ beeflambnz.com/lep/
LOAM Landscape Outcomes Assessment Methodology (WWF)
NZ Sustainability
■ http://ciifad.cornell.edu/downloads/ME_LOAM_In_PracticeMay07.pdf
LUCAS Land Use and Carbon Assessment System
NZ Environment
■ MfE 2010
MEA Millennium Ecosystem Assessment
USA Sustainability
■ ■ Millennium Ecosystem Assessment (2005)
Ministry of Justice
Rule of Law NZ Governance
■ ■ ■
MOST Management of Social Transformations
International
Social ■ www.unesco.org
MOTIFS Monitoring Tool for Integrated Farm Sustainability
Europe Sustainability
van Passel and Meul 2012; Meul et al. 2009
MP Montreal Process Criteria and Indicators
International
Sustainability
■ ■ ■ The Montréal Process 2009
MPI Ministry for Primary Industries
NZ Sustainability
■ ■ ■ www.mpi.govt.nz
NTHC Ngāi Tahu Holdings Corporation
NZ Sustainability
■ ■ ■ Reid et al. 2013
NZSD New Zealand Sustainability Dashboard
NZ Sustainability
■ ■ ■ Manhire et al. 2012
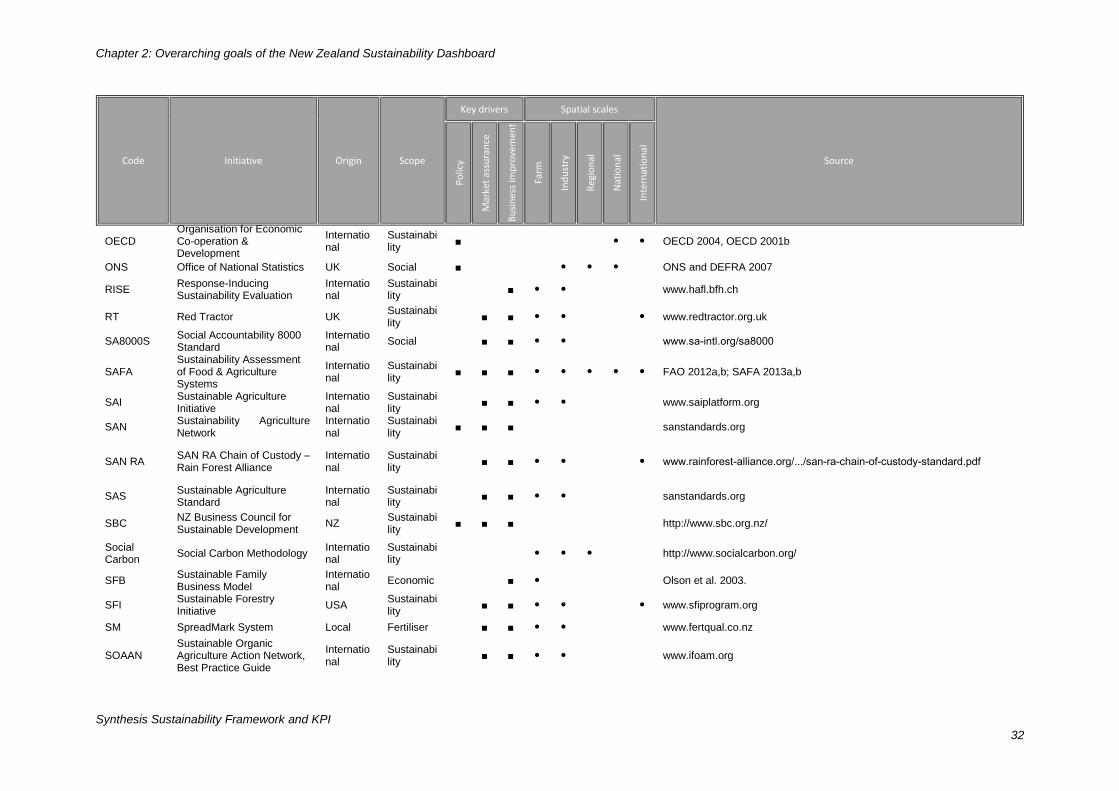
Chapter 2: Overarching goals of the New Zealand Sustainability Dashboard
Synthesis Sustainability Framework and KPI
32
Code Initiative Origin Scope
Key drivers Spatial scales
Source
Po
licy
Mar
ket
assu
ran
ce
Bu
sin
ess
imp
rove
men
t
Farm
Ind
ust
ry
Reg
ion
al
Nat
ion
al
Inte
rnat
ion
al
OECD Organisation for Economic Co-operation & Development
International
Sustainability
■ OECD 2004, OECD 2001b
ONS Office of National Statistics UK Social ■ ONS and DEFRA 2007
RISE Response-Inducing Sustainability Evaluation
International
Sustainability
■ www.hafl.bfh.ch
RT Red Tractor UK Sustainability
■ ■ www.redtractor.org.uk
SA8000S Social Accountability 8000 Standard
International
Social ■ ■ www.sa-intl.org/sa8000
SAFA Sustainability Assessment of Food & Agriculture Systems
International
Sustainability
■ ■ ■ FAO 2012a,b; SAFA 2013a,b
SAI Sustainable Agriculture Initiative
International
Sustainability
■ ■ www.saiplatform.org
SAN Sustainability Agriculture Network
International
Sustainability
■ ■ ■ sanstandards.org
SAN RA SAN RA Chain of Custody – Rain Forest Alliance
International
Sustainability
■ ■ www.rainforest-alliance.org/.../san-ra-chain-of-custody-standard.pdf
SAS Sustainable Agriculture Standard
International
Sustainability
■ ■ sanstandards.org
SBC NZ Business Council for Sustainable Development
NZ Sustainability
■ ■ ■ http://www.sbc.org.nz/
Social Carbon
Social Carbon Methodology International
Sustainability
http://www.socialcarbon.org/
SFB Sustainable Family Business Model
International
Economic ■ Olson et al. 2003.
SFI Sustainable Forestry Initiative
USA Sustainability
■ ■ www.sfiprogram.org
SM SpreadMark System Local Fertiliser ■ ■ www.fertqual.co.nz
SOAAN Sustainable Organic Agriculture Action Network, Best Practice Guide
International
Sustainability
■ ■ www.ifoam.org
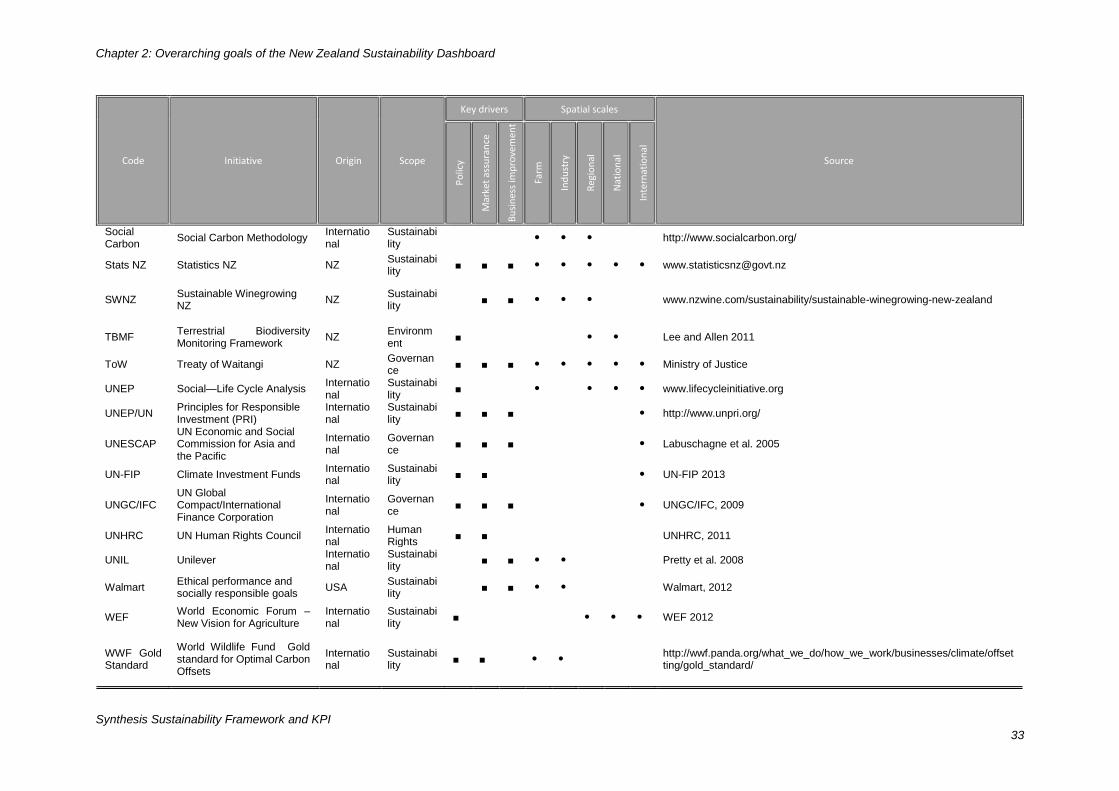
Chapter 2: Overarching goals of the New Zealand Sustainability Dashboard
Synthesis Sustainability Framework and KPI
33
Code Initiative Origin Scope
Key drivers Spatial scales
Source
Po
licy
Mar
ket
assu
ran
ce
Bu
sin
ess
imp
rove
men
t
Farm
Ind
ust
ry
Reg
ion
al
Nat
ion
al
Inte
rnat
ion
al
Social Carbon
Social Carbon Methodology International
Sustainability
http://www.socialcarbon.org/
Stats NZ Statistics NZ NZ Sustainability
■ ■ ■ [email protected]
SWNZ Sustainable Winegrowing NZ
NZ Sustainability
■ ■ www.nzwine.com/sustainability/sustainable-winegrowing-new-zealand
TBMF Terrestrial Biodiversity Monitoring Framework
NZ Environment
■ Lee and Allen 2011
ToW Treaty of Waitangi NZ Governance
■ ■ ■ Ministry of Justice
UNEP Social—Life Cycle Analysis International
Sustainability
■ www.lifecycleinitiative.org
UNEP/UN Principles for Responsible Investment (PRI)
International
Sustainability
■ ■ ■ http://www.unpri.org/
UNESCAP UN Economic and Social Commission for Asia and the Pacific
International
Governance
■ ■ ■ Labuschagne et al. 2005
UN-FIP Climate Investment Funds International
Sustainability
■ ■ UN-FIP 2013
UNGC/IFC UN Global Compact/International Finance Corporation
International
Governance
■ ■ ■ UNGC/IFC, 2009
UNHRC UN Human Rights Council International
Human Rights
■ ■ UNHRC, 2011
UNIL Unilever International
Sustainability
■ ■ Pretty et al. 2008
Walmart Ethical performance and socially responsible goals
USA Sustainability
■ ■ Walmart, 2012
WEF World Economic Forum – New Vision for Agriculture
International
Sustainability
■ WEF 2012
WWF Gold Standard
World Wildlife Fund Gold standard for Optimal Carbon Offsets
International
Sustainability
■ ■ http://wwf.panda.org/what_we_do/how_we_work/businesses/climate/offsetting/gold_standard/
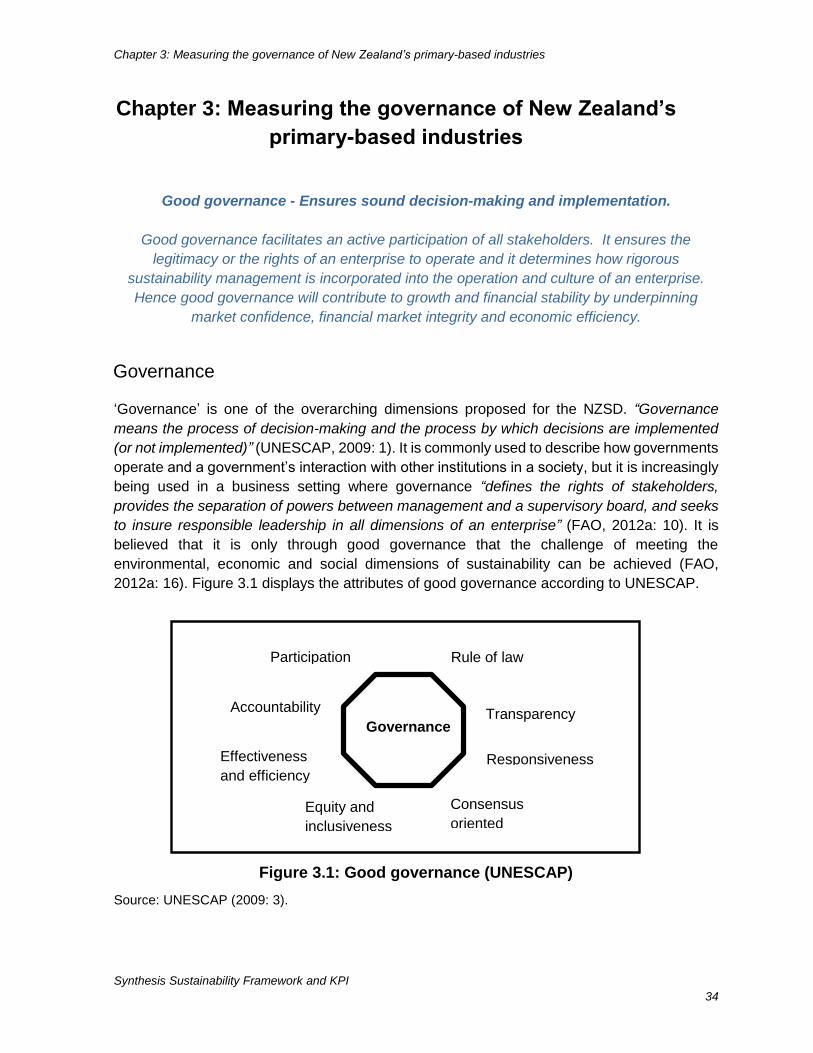
Chapter 3: Measuring the governance of New Zealand’s primary-based industries
Synthesis Sustainability Framework and KPI
34
Good governance - Ensures sound decision-making and implementation.
Good governance facilitates an active participation of all stakeholders. It ensures the
legitimacy or the rights of an enterprise to operate and it determines how rigorous
sustainability management is incorporated into the operation and culture of an enterprise.
Hence good governance will contribute to growth and financial stability by underpinning
market confidence, financial market integrity and economic efficiency.
Governance
‘Governance’ is one of the overarching dimensions proposed for the NZSD. “Governance
means the process of decision-making and the process by which decisions are implemented
(or not implemented)” (UNESCAP, 2009: 1). It is commonly used to describe how governments
operate and a government’s interaction with other institutions in a society, but it is increasingly
being used in a business setting where governance “defines the rights of stakeholders,
provides the separation of powers between management and a supervisory board, and seeks
to insure responsible leadership in all dimensions of an enterprise” (FAO, 2012a: 10). It is
believed that it is only through good governance that the challenge of meeting the
environmental, economic and social dimensions of sustainability can be achieved (FAO,
2012a: 16). Figure 3.1 displays the attributes of good governance according to UNESCAP.
Figure 3.1: Good governance (UNESCAP)
Source: UNESCAP (2009: 3).
Chapter 3: Measuring the governance of New Zealand’s
primary-based industries
Rule of law Participation
Accountability
Effectiveness
and efficiency
Equity and
inclusiveness
Transparency
Responsiveness
Consensus
oriented
Governance
Chapter 3: Measuring the governance of New Zealand’s primary-based industries
Synthesis Sustainability Framework and KPI
35
Originally sustainability was expressed in terms of the three pillars - environmental, economic
and social. In 2001 the UN introduced the fourth dimension of institutional sustainability
(Spangenberg, 2002), using the sociological meaning given to the word ‘institutions’ as the
socially accepted rules or norms that can govern ‘good’ behaviour in any given society
(Abercrombie et al., 1988). Institutional sustainability was seen as providing the means of
integrating the three pillars. While this wording is still used in some sustainability frameworks
it has often been replaced by the word ‘governance’ which has greater implications for the
processes of politics and rule-making not only within a society but within organisations.
According to Keeble et al. (2003: 149):
Investors are looking for evidence of good corporate governance, particularly sound
business strategy and effective management of risk.
Customers are asking about the origins of products, who made them and what they
contain.
Employees are looking to work for companies that visibly account for their
responsibilities to society and the environment.
Governments and civil society are increasingly placing pressure on businesses to
report on social and environmental performance.
Good governance links all these aspects and makes sure systems and capabilities are in
place to ensure that they happen.
Governance and sustainability
An enterprise committed to sustainable development needs a sustainability-oriented
governance structure, in which content, values and responsibilities of the company are clearly
stated and through which transparency and accountability are ensured (SAFA, 2013b: 80).
Good governance facilitates an active participation of all stakeholders. It ensures legitimacy
or the rights of an enterprise to operate and it determines how rigorous sustainability
management is incorporated into the operation and culture of an enterprise. Hence good
governance will contribute to growth and financial stability by underpinning market confidence,
financial market integrity and economic efficiency (OECD, 2004), and therefore is an important
component of sustainability. The inclusion of governance alongside the other key pillars of
social, environmental and economic sustainability in the NZSD framework is in line with SAFA
and other business approaches, such as the UN Principles for Responsible Investment, the
UN Global Compact (UNGC/IFC, 2009) and the GRI G4 Guidelines (GRI, 2013a, b) (SAFA,
2013a: 56).
For Spangenberg et al. (2002) the dimension of institutional sustainability associated with
governance can be divided into two components: institutional framework and institutional
capacity. In another vein, the United Nations takes an approach more to do with making
sustainability more visible. It suggests companies can address institutional sustainability
strategically by:
Chapter 3: Measuring the governance of New Zealand’s primary-based industries
Synthesis Sustainability Framework and KPI
36
“Mentioning and incorporating sustainability principles within business strategies (i.e.,
vision, mission, business goals, etc.) in line with those of national and international
government.
Openly acknowledging support for global agreements.
Including external sustainable development objectives in internal research and
development.
Allocating funds to address sustainability issues beyond the immediate control of the
company” (Labuschagne et al., 2005: 376).
This is also known as a ‘corporate responsibility strategy’ and “it implies that a prerequisite for
all sustainability is a strategy that accepts the company’s responsibility and its vital role in every
society it operates in and also in the global environment” (Labuschagne et al., 2005: 376).
All large-scale businesses today face an enormous challenge to ensure their governance
evolves fast enough to meet the challenges of a rapidly changing environment. According to
Vallance (2002: 22), “Governance and leadership quality is one of the greatest challenges
facing New Zealand corporations of all shapes and sizes today”. Table 2.5 presents the
information used in formulating the governance framework of the NZSD.
Governance and social well-being
The ‘social’ and governance/institutional pillars have a considerable overlap when the
sustainability of a nation state is under the microscope. In this context the social dimension is
about the sustainability of a society in terms of the individual operating in a society, whereas
governance is to do with the laws and policies associated with the provision of social well-being
within that society. However, they have less overlap in the NZSD which is to be associated
with enterprises in the primary sector in NZ and therefore governance is concerned with the
processes within an enterprise that ensure it meets the expectations of stakeholders and the
market and the rules of the nation in which it operates.
In the NZ context, governance is only beginning to be paid attention, for example in the Māori
domain (see later) and in the academic world6. Three situations in New Zealand which reflect
on the importance of good governance follow.
The role of good governance in farm management
There are a variety of governance structures within New Zealand’s primary based industries.
In 2005, it was estimated that 97 per cent of farms were family owned and managed businesses
(Shadbolt and Bywater, 2005: 27). They may be sole traders, partnerships, companies or trusts
and in some cases they have multiple business structures. For example, a family trust owns
the land and a partnership provides the management business and stock. These businesses
6 In 2012 Victoria University of Wellington established the Institute for Governance and Policy Studies
as part of its School of Government.
Chapter 3: Measuring the governance of New Zealand’s primary-based industries
Synthesis Sustainability Framework and KPI
37
are usually based on the family unit and involve the owners providing the combined roles of
directors, managers and labour. Due to long working hours and personal involvement,
decisions may be made without relevant information and time given to the implications of these
decisions.
There are a growing number of family businesses that own more than one property or have
more than one family as owners. There are also a small number of corporate owned farms,
orchards and vineyards. As the size of the business increases, the management is less and
less hands-on and more delegation occurs. These businesses require performance indicators
for leadership, including the ability to delegate.
Governance of Māori-owned land
Governance of Māori owned land is becoming an important issue in New Zealand. Today Māori
own some 1.5 million hectares of land with a value of around $4 billion. This land is usually in
blocks, most of which have a large number of owners, due to ownership passing from the
original owners to their many heirs, over successive generations. Therefore, it is necessary to
create some form of governance structure to enable the successful management of a land
block. Many writers and researchers (see McLean (2002), Thorpe (1976), Steele and Kanawa,
(2009), Baynham (2009) and Reid (2011)) have established that having capable and
accountable governance to make decisions on behalf of all owners was one of the key practices
that determined success in Māori-owned land incorporations. As well studies funded by MAF
and MPI have identified that improving the economic performance and governance of Māori
owned land that is under-performing relative to industry benchmarks or is under utilised could
potentially bring a further 1.2 million hectares into greater production
(PricewaterhouseCoopers, 2013). In line with this concern, Reid et al. (2013: 13) have defined
governance as the need to have “a strong, confident and accountable governance team with
capable directors/trustees both internal and external to the institution to direct land
development”.
Reid (2011) talks of ‘culturally matched’ governance. Successful management of Māori land
is broader than generating utility and financial surpluses. It is likely to be crucial that governors
of Māori land achieve the other factors of success for an incorporation to function effectively,
as failing to do so would cause political instability which then undermines the incorporation’s
ability to generate utility and financial surpluses in the first place. In other words, as theoretical
studies suggest, development practices need to be guided by relational values, by ensuring
that the land stays in whānau or hapū control (tino rangatiratanga), ensuring balance between
production and environmental imperatives (kaitiakitanga), and providing employment and
community contributions (manaakitanga).
Harmsworth (2002, 2005) had similar findings. He worked over a number of years with
governors operating on behalf of landowner ‘beneficiaries’, to help create development
strategies that are matched to cultural expectations. He found a common set of strong
relational values emerging through this process which demonstrated a common commitment
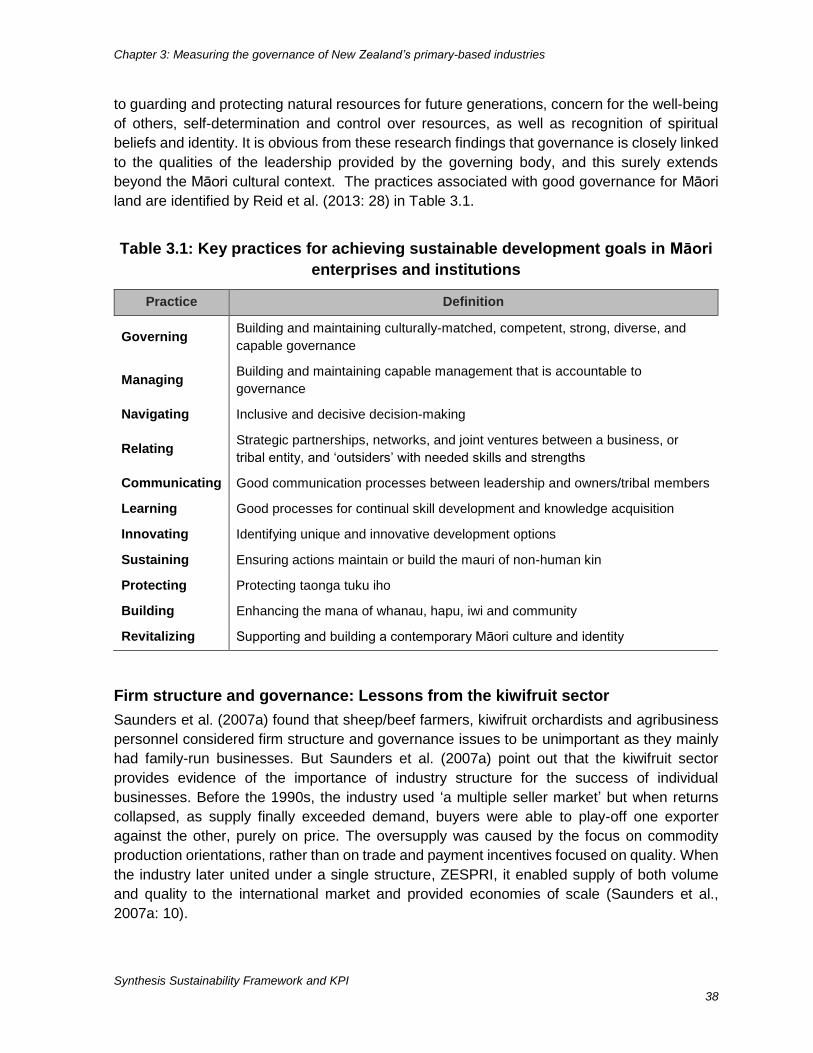
Chapter 3: Measuring the governance of New Zealand’s primary-based industries
Synthesis Sustainability Framework and KPI
38
to guarding and protecting natural resources for future generations, concern for the well-being
of others, self-determination and control over resources, as well as recognition of spiritual
beliefs and identity. It is obvious from these research findings that governance is closely linked
to the qualities of the leadership provided by the governing body, and this surely extends
beyond the Māori cultural context. The practices associated with good governance for Māori
land are identified by Reid et al. (2013: 28) in Table 3.1.
Table 3.1: Key practices for achieving sustainable development goals in Māori
enterprises and institutions
Practice Definition
Governing Building and maintaining culturally-matched, competent, strong, diverse, and
capable governance
Managing Building and maintaining capable management that is accountable to
governance
Navigating Inclusive and decisive decision-making
Relating Strategic partnerships, networks, and joint ventures between a business, or
tribal entity, and ‘outsiders’ with needed skills and strengths
Communicating Good communication processes between leadership and owners/tribal members
Learning Good processes for continual skill development and knowledge acquisition
Innovating Identifying unique and innovative development options
Sustaining Ensuring actions maintain or build the mauri of non-human kin
Protecting Protecting taonga tuku iho
Building Enhancing the mana of whanau, hapu, iwi and community
Revitalizing Supporting and building a contemporary Māori culture and identity
Firm structure and governance: Lessons from the kiwifruit sector
Saunders et al. (2007a) found that sheep/beef farmers, kiwifruit orchardists and agribusiness
personnel considered firm structure and governance issues to be unimportant as they mainly
had family-run businesses. But Saunders et al. (2007a) point out that the kiwifruit sector
provides evidence of the importance of industry structure for the success of individual
businesses. Before the 1990s, the industry used ‘a multiple seller market’ but when returns
collapsed, as supply finally exceeded demand, buyers were able to play-off one exporter
against the other, purely on price. The oversupply was caused by the focus on commodity
production orientations, rather than on trade and payment incentives focused on quality. When
the industry later united under a single structure, ZESPRI, it enabled supply of both volume
and quality to the international market and provided economies of scale (Saunders et al.,
2007a: 10).
Chapter 3: Measuring the governance of New Zealand’s primary-based industries
Synthesis Sustainability Framework and KPI
39
Governance framework for the NZSD
In the NZSD governance is covered by five outcomes, as shown schematically in Figure 3.2.:
‘Governance structure is effective’,
‘Accountability is maintained’,
‘Stakeholder participation is enhanced’,
‘The Rule of Law is followed’ and the
‘Management approach is holistic’
Except for ‘governance structure’ which replaces ‘corporate ethics’, these outcomes are closely
aligned to the themes used in SAFA (2013b), except that they have been re-worded as
outcomes. They are applicable at any level of development, for instance, national level,
commodity specific or farm. The five governance outcomes are divided into further objectives
(Figure 3.2 and Table 3.2). The objectives, tailored to the food and agriculture value chain, are
mostly drawn from SAFA sub-themes, however, the NZSD has merged and re-named some
to take into account the needs of New Zealand farm management and primary production. Also
some SAFA sub-themes have not been seen as applicable in New Zealand because they are
already part of legislation or regulation. However, as Moller and MacLeod (2013: 51) state:
“SAFA is particularly innovative in including several dimensions of governance that are usually
not included in sustainability assessments in New Zealand because they are embedded in
wider society and our way of doing things (e.g., rule of law, equity, transparency, lack of
corruption)”. By incorporating these into the NZSD framework the NZSD team has taken the
opportunity “to explicitly demonstrate these advantages that are usually taken for granted in
New Zealand”.
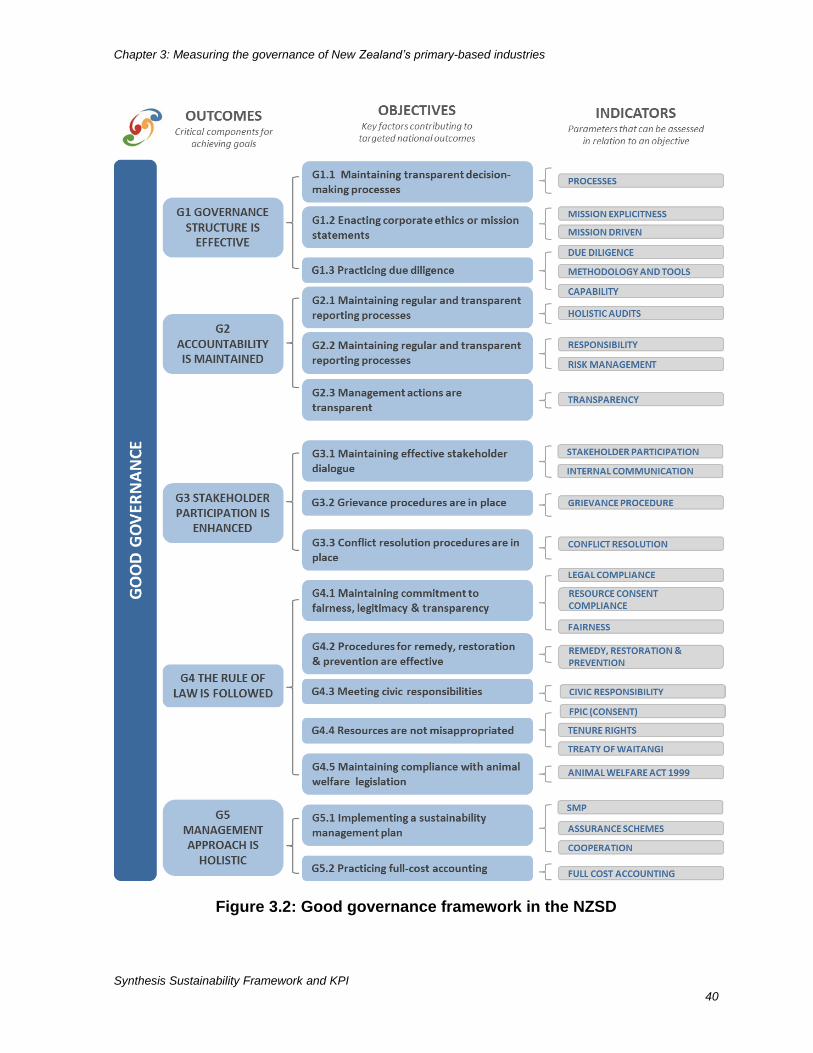
Chapter 3: Measuring the governance of New Zealand’s primary-based industries
Synthesis Sustainability Framework and KPI
40
Figure 3.2: Good governance framework in the NZSD
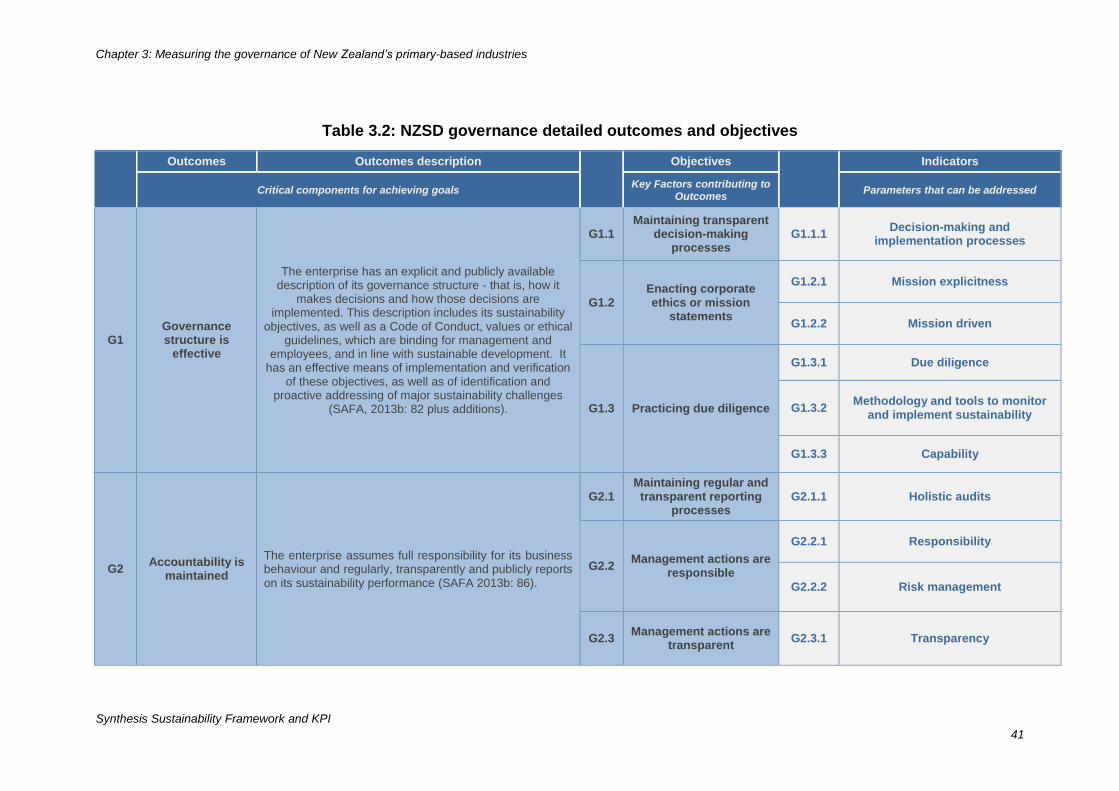
Chapter 3: Measuring the governance of New Zealand’s primary-based industries
Synthesis Sustainability Framework and KPI
41
Table 3.2: NZSD governance detailed outcomes and objectives
Outcomes Outcomes description
Objectives
Indicators
Critical components for achieving goals Key Factors contributing to
Outcomes Parameters that can be addressed
G1 Governance structure is
effective
The enterprise has an explicit and publicly available description of its governance structure - that is, how it
makes decisions and how those decisions are implemented. This description includes its sustainability
objectives, as well as a Code of Conduct, values or ethical guidelines, which are binding for management and
employees, and in line with sustainable development. It has an effective means of implementation and verification
of these objectives, as well as of identification and proactive addressing of major sustainability challenges
(SAFA, 2013b: 82 plus additions).
G1.1 Maintaining transparent
decision-making processes
G1.1.1 Decision-making and
implementation processes
G1.2 Enacting corporate ethics or mission
statements
G1.2.1 Mission explicitness
G1.2.2 Mission driven
G1.3 Practicing due diligence
G1.3.1 Due diligence
G1.3.2 Methodology and tools to monitor
and implement sustainability
G1.3.3 Capability
G2 Accountability is
maintained
The enterprise assumes full responsibility for its business behaviour and regularly, transparently and publicly reports on its sustainability performance (SAFA 2013b: 86).
G2.1 Maintaining regular and
transparent reporting processes
G2.1.1 Holistic audits
G2.2 Management actions are
responsible
G2.2.1 Responsibility
G2.2.2 Risk management
G2.3 Management actions are
transparent G2.3.1 Transparency
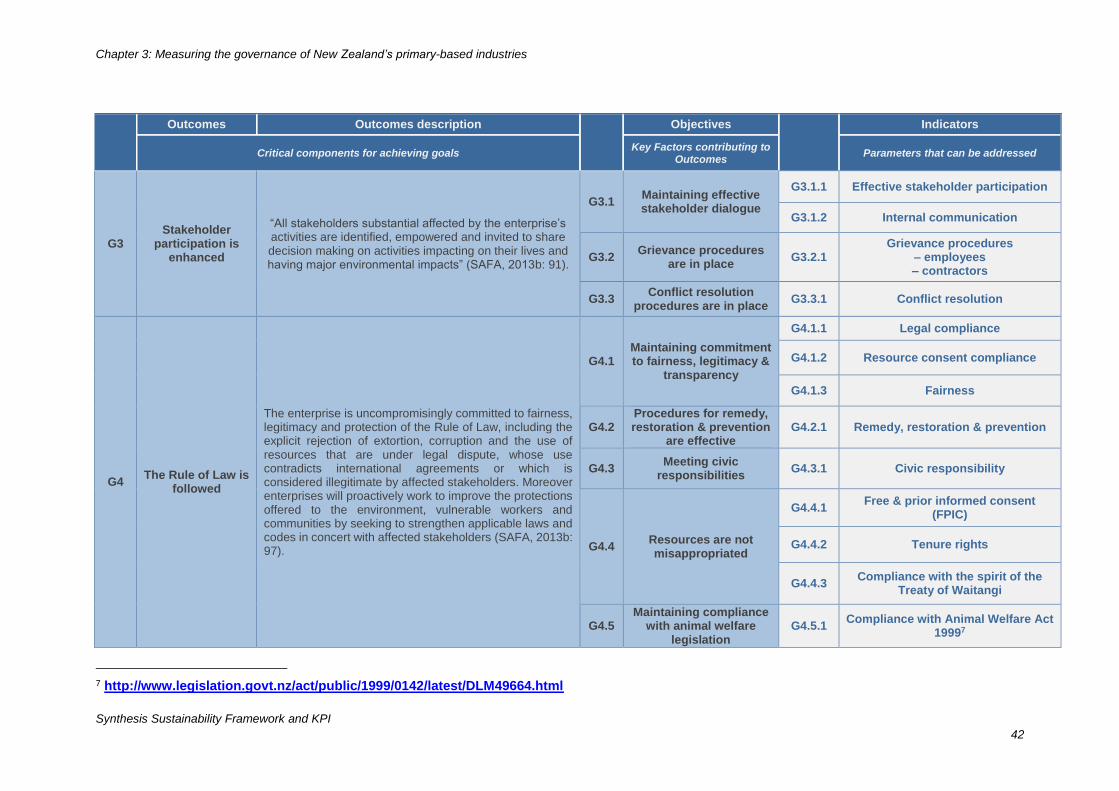
Chapter 3: Measuring the governance of New Zealand’s primary-based industries
Synthesis Sustainability Framework and KPI
42
Outcomes Outcomes description
Objectives
Indicators
Critical components for achieving goals Key Factors contributing to
Outcomes Parameters that can be addressed
G3 Stakeholder
participation is enhanced
“All stakeholders substantial affected by the enterprise’s activities are identified, empowered and invited to share decision making on activities impacting on their lives and having major environmental impacts” (SAFA, 2013b: 91).
G3.1 Maintaining effective stakeholder dialogue
G3.1.1 Effective stakeholder participation
G3.1.2 Internal communication
G3.2 Grievance procedures
are in place G3.2.1
Grievance procedures – employees – contractors
G3.3 Conflict resolution
procedures are in place G3.3.1 Conflict resolution
G4 The Rule of Law is
followed
The enterprise is uncompromisingly committed to fairness, legitimacy and protection of the Rule of Law, including the explicit rejection of extortion, corruption and the use of resources that are under legal dispute, whose use contradicts international agreements or which is considered illegitimate by affected stakeholders. Moreover enterprises will proactively work to improve the protections offered to the environment, vulnerable workers and communities by seeking to strengthen applicable laws and codes in concert with affected stakeholders (SAFA, 2013b: 97).
G4.1 Maintaining commitment to fairness, legitimacy &
transparency
G4.1.1 Legal compliance
G4.1.2 Resource consent compliance
G4.1.3 Fairness
G4.2 Procedures for remedy, restoration & prevention
are effective G4.2.1 Remedy, restoration & prevention
G4.3 Meeting civic
responsibilities G4.3.1 Civic responsibility
G4.4 Resources are not misappropriated
G4.4.1 Free & prior informed consent
(FPIC)
G4.4.2 Tenure rights
G4.4.3 Compliance with the spirit of the
Treaty of Waitangi
G4.5 Maintaining compliance
with animal welfare legislation
G4.5.1 Compliance with Animal Welfare Act
19997
7 http://www.legislation.govt.nz/act/public/1999/0142/latest/DLM49664.html
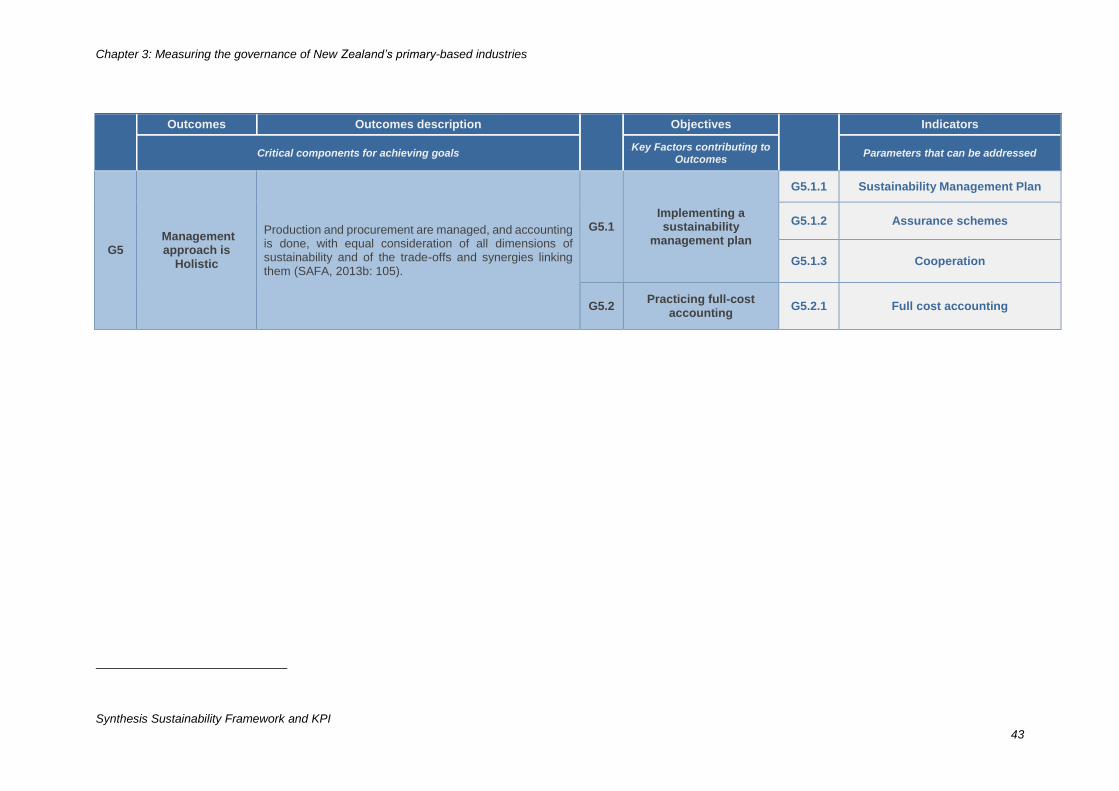
Chapter 3: Measuring the governance of New Zealand’s primary-based industries
Synthesis Sustainability Framework and KPI
43
Outcomes Outcomes description
Objectives
Indicators
Critical components for achieving goals Key Factors contributing to
Outcomes Parameters that can be addressed
G5 Management approach is
Holistic
Production and procurement are managed, and accounting is done, with equal consideration of all dimensions of sustainability and of the trade-offs and synergies linking them (SAFA, 2013b: 105).
G5.1 Implementing a sustainability
management plan
G5.1.1 Sustainability Management Plan
G5.1.2 Assurance schemes
G5.1.3 Cooperation
G5.2 Practicing full-cost
accounting G5.2.1 Full cost accounting
Chapter 3: Measuring the governance of New Zealand’s primary-based industries
Synthesis Sustainability Framework and KPI
44
Outcome G1: Governance structure is effective
Goal
The enterprise has an explicit and publicly available description of its governance structure -
that is, how it makes decisions and how those decisions are implemented. This description
includes its sustainability objectives, as well as a Code of Conduct, values or ethical guidelines,
which are binding for management and employees, and in line with sustainable development.
It has an “effective means of implementation and verification of these objectives, as well as of
identification and proactive addressing of major sustainability challenges” (SAFA, 2013a: 60).
Definition
In formulating this outcome the NZSD has merged the two definitions provided by SAFA for
the theme ‘governance structure’ used in the 2012 versions of SAFA (FAO, 2012a, b) and the
theme ‘corporate ethics’ used in the SAFA 2013 version 3 (SAFA, 2013b).8 An addition has
been the first statement which simply asks for some detail on the governance structure. This
does not appear to have been included in the SAFA framework though it is obviously an
underlying component of this dimension.
As in SAFA, the NZSD would like to see “the sustainability principle is embedded in the fabric
of the enterprise” (SAFA, 2013a: 59).
In the NZSD the objectives covered include ‘maintain transparent decision-making processes’,
‘enact corporate ethics/mission statements’ and ‘practice due diligence’ - all of which have their
roots in SAFA (2013b). Table 3.3 presents these objectives and their associated indicators.
Relevance of governance structure to sustainability
“A good governance structure is the foundation of a successful, sustainability- and integrity-
oriented enterprise culture” (Loew and Braun, 2006; Erwin, 2010 as cited in SAFA, 2013a: 59).
As the SAFA guidelines remark: ”Enterprises in the agriculture and food sector have a wide
range of governance structures, from a virtual absence of governance to highly sophisticated
systems … Size and market power of enterprises in the same sector, region or value chain are
equally variable. This often results in major imbalances and disadvantages, particularly where
small enterprises depend on large firms that are better organized, but lack a business purpose
going beyond profit. Larger size implies a larger sphere of impact and influence and thus also
of responsibility” (SAFA, 2013a: 59).
8 They are:
“The enterprise has an explicitly and publicly stated business purpose, as well as a Code of
Conduct, both of which are binding for management and employees, and the values and ethical
guidelines of which are in line with sustainable development” (FAO, 2012b: 38).
“The enterprise has explicit, publicly available sustainability objectives and effective means of
implementation and verification, as well as of identification and proactive addressing of major
sustainability challenges” (SAFA, 2013a: 60).
Chapter 3: Measuring the governance of New Zealand’s primary-based industries
Synthesis Sustainability Framework and KPI
45
In essence the indicator of an effective governance structure is that ‘the enterprise has a
structure in place which satisfies all the objectives of good governance’. In order to refine this
three objectives are proposed.
Objective G1.1: Maintaining transparent decision-making processes
The first objective of the ‘governance structure is effective’ outcome is that the enterprise has
an explicit and publicly available description of its governance structure - that is, how it makes
decisions and how those decisions are implemented.
The earlier descriptions of what ‘good governance’ means indicate that it should be important
for an enterprise to articulate and have a record of its decision-making processes, in particular
which body of the enterprise makes which decisions such that the governance and operational
areas are kept separate. This of course, may not be possible in a small enterprise where the
owners and the operators may be one and the same.
This objective is an addition to the NZSD that is not contained in SAFA where it seems to be
missing in an explicit form.
The indicator of transparence of the decision-making processes or governance structure of the
enterprise could be measured by: Has the enterprise an explicit and publicly available
description of its governance structure, i.e., its decision making and implementation
processes?
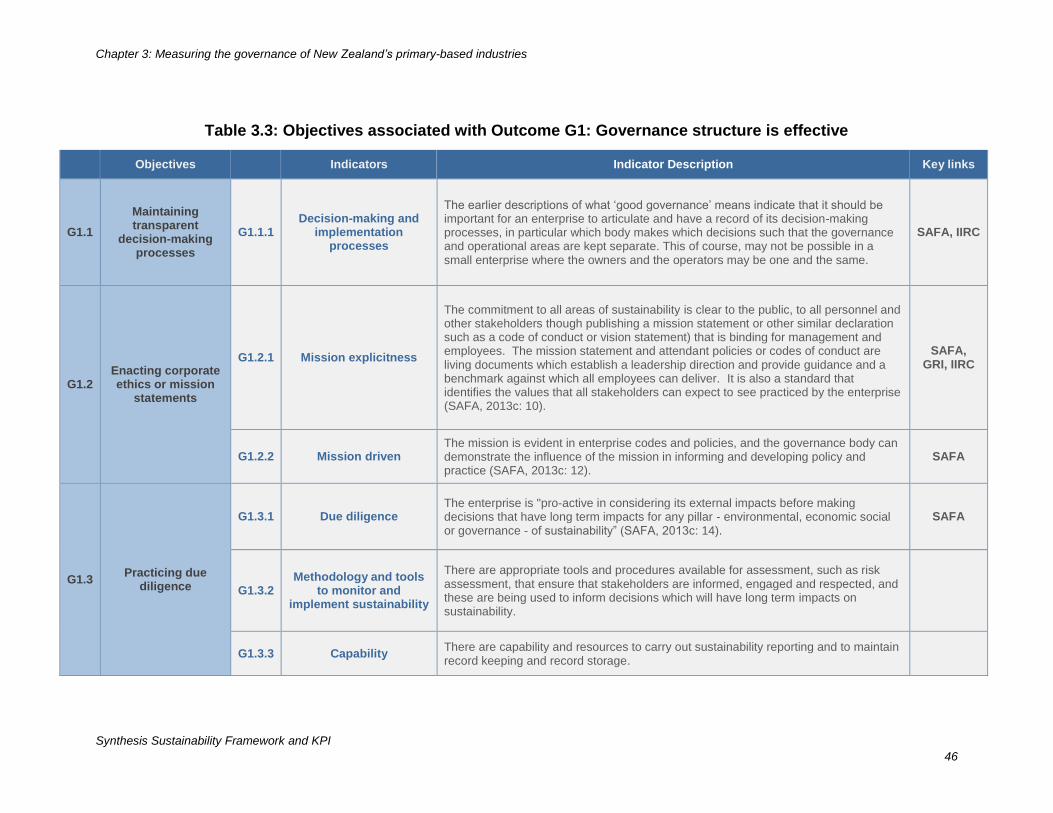
Chapter 3: Measuring the governance of New Zealand’s primary-based industries
Synthesis Sustainability Framework and KPI
46
Table 3.3: Objectives associated with Outcome G1: Governance structure is effective
Objectives Indicators Indicator Description Key links
G1.1
Maintaining transparent
decision-making processes
G1.1.1 Decision-making and
implementation processes
The earlier descriptions of what ‘good governance’ means indicate that it should be important for an enterprise to articulate and have a record of its decision-making processes, in particular which body makes which decisions such that the governance and operational areas are kept separate. This of course, may not be possible in a small enterprise where the owners and the operators may be one and the same.
SAFA, IIRC
G1.2 Enacting corporate ethics or mission
statements
G1.2.1 Mission explicitness
The commitment to all areas of sustainability is clear to the public, to all personnel and other stakeholders though publishing a mission statement or other similar declaration such as a code of conduct or vision statement) that is binding for management and employees. The mission statement and attendant policies or codes of conduct are living documents which establish a leadership direction and provide guidance and a benchmark against which all employees can deliver. It is also a standard that identifies the values that all stakeholders can expect to see practiced by the enterprise (SAFA, 2013c: 10).
SAFA, GRI, IIRC
G1.2.2 Mission driven The mission is evident in enterprise codes and policies, and the governance body can demonstrate the influence of the mission in informing and developing policy and practice (SAFA, 2013c: 12).
SAFA
G1.3 Practicing due
diligence
G1.3.1 Due diligence The enterprise is "pro-active in considering its external impacts before making decisions that have long term impacts for any pillar - environmental, economic social or governance - of sustainability” (SAFA, 2013c: 14).
SAFA
G1.3.2 Methodology and tools
to monitor and implement sustainability
There are appropriate tools and procedures available for assessment, such as risk assessment, that ensure that stakeholders are informed, engaged and respected, and these are being used to inform decisions which will have long term impacts on sustainability.
G1.3.3 Capability There are capability and resources to carry out sustainability reporting and to maintain record keeping and record storage.
Chapter 3: Measuring the governance of New Zealand’s primary-based industries
Synthesis Sustainability Framework and KPI
47
Objective G1.2: Enacting corporate ethics/mission statement
This objective asks that “"The enterprise will have made its commitment to all areas of
sustainability clear to the public, to all personnel and other stakeholders though publishing a
mission statement or other similar declaration such as a code of conduct or vision statement)
that is binding for management and employees. The mission statement and attendant policies
or codes of conduct should be living documents which establish a leadership direction and
provide guidance and a benchmark against which all employees can deliver. It is also a
standard that identifies the values that all stakeholders can expect to see practiced by the
enterprise" (SAFA, 2013c: 10).
Within New Zealand there is the acknowledgement that though New Zealand prides itself on
having very low levels of corruption across government and business, there is still a need for
vigilance. As the Ministry of Justice (2012) stated, “The Controller and Auditor-General
attributed the lack of systemic corruption to “the integrity of our standards and controls,
underpinned by strong and shared common values within a small and cohesive society” …
given changes in New Zealand society, we cannot afford to be complacent” (Ministry of Justice,
2012). Therefore it is generally accepted that “good governance includes the formulation of a
statement that goes beyond profit to embrace ethics and sustainability and based on a vision
of a sustainable future that is attractive to all stakeholders” (Maak and Ulrich, 2007, as cited in
SAFA 2013a: 59). An example of this in New Zealand appears in the DairyNZ guidelines that
are designed to help farmers develop a strategic plan: “In addition to a clear idea of where they
are heading, successful people and businesses also have a strong set of guidelines or
principles which guide and direct them” (DairyNZ, n.d.a).
A mission statement should state clearly how the enterprise intends to contribute to a
sustainable development. As SAFA (2013a: 107) states, “Through publishing a mission
statement or other similar declaration (such as a code of conduct or vision statement) that is
binding for management and employees” an enterprise makes “its commitment to all areas of
sustainability clear to the public, to all personnel, and other stakeholders”. This can be done
through a Code of Conduct which “provides clear guidance in concrete situations, is
authoritative, without limiting scopes of action too much, and fosters desirable behavior. It
provides management guidance and priorities for decision making in situations where trade-
offs between the dimensions of sustainable development are encountered” (SAFA, 2012a: 59).
Leadership by an individual or as stressed by an enterprise as a whole, is important in the
values and practices of an enterprise and in how it relates to those individuals and enterprises
it deals with, as is expressed in this excerpt from the International Federation of Accountants
(IFAC): ”Effective leadership complements a values-based program and code of ethics or
conduct to promote an organization’s (a) underlying values, (b) commitment to employees, (c)
standards for doing business, and (d) relationship with wider society. Values are extremely
important, and many companies have demonstrated leadership and positive change through
developing and implementing these values- based programs and codes of conduct or ethics.
Chapter 3: Measuring the governance of New Zealand’s primary-based industries
Synthesis Sustainability Framework and KPI
48
Setting out and embedding a values-based code of conduct is critical in helping employees
deal with the complexity of decisions an organization faces, and can help organizations to
effectively manage supply chains to expand globally” (IFAC, 2011: 31). SAFA (2013a: 59) is of
the opinion that in “small enterprises typical of agriculture and fisheries, operating culture
depends on the personal integrity and values of the entrepreneur, who is personally liable and
responsible for the enterprise”.
Businesses producing food have to be aware that ethical standards in production are a growing
requirement of food retailers internationally. While ethical standards are required to be
enforced by law, many key food retailers in developed markets are making steps to uphold
ethical standards beyond compliance. For example, US-based retailer Walmart has outlined
its ethical performance and corporate social responsibility goals (see Walmart, 2012).
There is also a concern that an enterprise ’walks the talk’. “The enterprise must prove the
mission evident in enterprise codes and policies, and the governance body can demonstrate
the influence of the mission in informing and developing policy and practice” (SAFA, 2013c:
12). The indicators ‘mission explicitness’ and ‘mission driven’ can be measured by looking at
the responses to the following questions:
“Is the mission of the enterprise articulated in all enterprise reporting and understood by all
staff?” (SAFA, 2013a: 60).
“Is the enterprise’s mission evident in codes and policies, and can the governance body
demonstrate the impact of its mission on developing policy and practice?” (SAFA, 2013a: 60).
Objective G1.3: Practicing due diligence
The objective ‘practice due diligence’ is articulated as whether the enterprise is “pro-active in
considering its external impacts before making decisions that have long term impacts for any
pillar - environmental, economic social or governance - of sustainability” (SAFA, 2013c: 14).
In this context the process of ‘due diligence’ involves as assessment by an enterprise of the
impact of its business on sustainability, or the consequences for sustainability more generally
of dealing with other enterprises both in terms of supply and resourcing. It may also involve as
assessment or audit of the sustainability of other enterprises it deals with. Therefore, “due
diligence procedures can help anticipate and prevent negative impacts on environment and
people, thus protecting the enterprise’s image” (SAFA, 2013a: 59).
The indicators of whether ‘due diligence’ is being practiced can be assessed by asking the
question, “Does the enterprise have a clear policy for impact assessment, appropriate tools for
assessment and is it able to show that these are being used to inform decisions which will have
long term impacts on area of sustainability?” (SAFA, 2013a: 60).
In order for an enterprise to be able to practice due diligence it has to have available
appropriate ways of measuring, collecting and analysing data on its own sustainability
progression. It also requires the enterprise to have the capability to carry out compliance and
Chapter 3: Measuring the governance of New Zealand’s primary-based industries
Synthesis Sustainability Framework and KPI
49
assessment of its own sustainability and to assess the sustainability of enterprises from which
it obtains resources and which it supplies.
This objective is not mentioned specifically within the SAFA framework even though it is
specified and understood in the SAFA due diligence sub-theme as having ‘appropriate tools
for assessment’. This is not to do with particular attributes, capabilities of staff, or to do with
the capital resources but more to do with the emphasis on the availability of these resources
and the training provided by the enterprise for such skills.
If an enterprise is going to report on its sustainability it needs the wherewithal to do it. It needs
to have staff who know how and what to measure and when, and how to analyse this data and
format it into the required compliance. This involves having trusted, transparent and respected
methodologies and tools or protocols. Also, increasingly primary sector businesses have to
keep more and more records for compliance for IRD, resource consents, staff Health and
Safety and other labour compliance requirements. In addition assurance schemes and
traceability of products has also increased record keeping requirements. An example of
recording of day-to-day management is grower spray diaries that record all chemical
treatments. In this situation, the objective theme would be that these records were kept and
that there was the capability to keep them.
Hence the measurement of the indicators ‘appropriate methodologies and tools’ and ‘capability’
is obtained by the questions:
Has the enterprise the capability and resources to carry out its own sustainability
reporting?
Has the enterprise the capability and resources to maintain its own record keeping and
record storage?
Outcome G2: Accountability is maintained
Goal
“The enterprise assumes full responsibility for its business behavior and regularly,
transparently and publicly reports on its sustainability performance” (SAFA, 2013a: 62).
Definition
In the NZSD (as in SAFA), “accountability is disclosure of credible information about strategy,
goals, standards and performance to those who base their actions and decisions on this
information” (SAFA, 2013a: 61). Objectives include maintaining regular and transparent
reporting processes, and management actions are responsible and transparent. Table 3.4
presents these objectives and their associated indicators.
Relevance of accountability to sustainability
Paying attention to accountability entails an enterprise revealing information about its
governance, environmental and social performance as well as its financial performance (SAFA,
2013a, b; Group 100, 2003; GRI, 2013a, b; FRC, 2013). Therefore, an enterprise needs to
Chapter 3: Measuring the governance of New Zealand’s primary-based industries
Synthesis Sustainability Framework and KPI
50
practice processes that enable it to be accountable to anyone and any other enterprise (local,
national, government, NGO etc.) it may impact on by its operation or which may wish to interact
with it in some way or other – such as through supplying it or buying products from it. Not only
should an enterprise do this but there is a growing pressure to do this as is apparent from the
growth of international agencies providing advice and assistance on business reporting, for
example, FAO via SAFA, the Global Reporting Initiative (GRI), the International Integrated
Reporting Council (IIRC), the Financial Reporting Council (FRC), and the International
Federation of Accountants (IFAC). Within New Zealand there is also an increasing emphasis
on this in business as demonstrated by the Sustainable Business Council of New Zealand and
the New Zealand Business Council for Sustainable Development.
Objective G2.1: Maintaining regular and transparent reporting processes
The objective ‘maintain regular and transparent reporting processes’ ensures that all areas of
sustainability (environmental, economic, social and governance) pertaining to “the enterprise
are monitored internally in an appropriate manner, and wherever possible are reviewed
according to recognized sustainability reporting systems” (SAFA, 2013a: 62).
Simply expressed, this objective is included to ensure that an enterprise carries out appropriate
internal audits and preferably uses a sustainability reporting system that has widely recognised
credibility. It is hopes that this objective will allow an enterprise to demonstrate how
sustainability values are embedded in the enterprise (SAFA, 2013a: 113).
Examples of indicators of acceptable practices for an enterprise to demonstrate its compliance
with this objective include:
1. The enterprise has a regular sustainability/holistic audit using a recognized tool and
evidence that this is reviewed by governance body and peer reviewed.
2. Or, the enterprise is a small-scale operation that has used a systematic approach of
their own or with the assistance of an outside partner to regularly review their
sustainability performance.
3. The existence of publicly available information about regularly updated economic,
social and environmental performance (e.g., Corporate Social Responsibility (CSR),
triple bottom line reporting).
4. The existence and accessibility to independent auditors of complete, correct data and
records required for sustainability auditing and reporting (drawn from FAO, 2012a, b;
SAFA, 2013a, b and others).
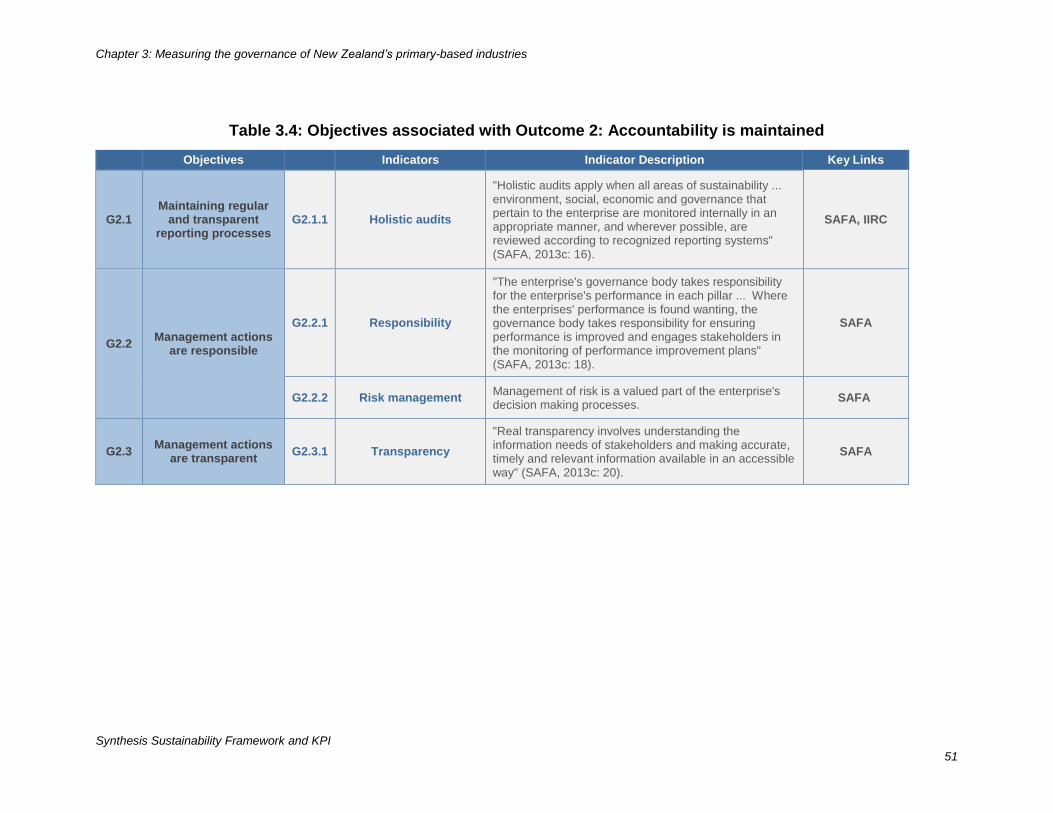
Chapter 3: Measuring the governance of New Zealand’s primary-based industries
Synthesis Sustainability Framework and KPI
51
Table 3.4: Objectives associated with Outcome 2: Accountability is maintained
Objectives Indicators Indicator Description Key Links
G2.1 Maintaining regular
and transparent reporting processes
G2.1.1 Holistic audits
"Holistic audits apply when all areas of sustainability ... environment, social, economic and governance that pertain to the enterprise are monitored internally in an appropriate manner, and wherever possible, are reviewed according to recognized reporting systems" (SAFA, 2013c: 16).
SAFA, IIRC
G2.2 Management actions
are responsible
G2.2.1 Responsibility
"The enterprise's governance body takes responsibility for the enterprise's performance in each pillar ... Where the enterprises' performance is found wanting, the governance body takes responsibility for ensuring performance is improved and engages stakeholders in the monitoring of performance improvement plans" (SAFA, 2013c: 18).
SAFA
G2.2.2 Risk management Management of risk is a valued part of the enterprise's decision making processes.
SAFA
G2.3 Management actions
are transparent G2.3.1 Transparency
"Real transparency involves understanding the information needs of stakeholders and making accurate, timely and relevant information available in an accessible way" (SAFA, 2013c: 20).
SAFA
Chapter 3: Measuring the governance of New Zealand’s primary-based industries
Synthesis Sustainability Framework and KPI
52
Objective G2.2: Management actions are responsible
The objective ‘management actions are responsible’ aims for "the enterprise's governance
body takes responsibility for the enterprise's performance in each pillar ... Where the
enterprises' performance is found wanting, the governance body takes responsibility for
ensuring performance is improved and engages stakeholders in the monitoring of performance
improvement plans" (SAFA, 2013c: 18).
In New Zealand there is a growing acknowledgement that farmers should take more
responsibility for the impact of their farming practices beyond the farm gate. Four key areas of
responsibility are: sustainable management of natural resources; care for farmed animals; care
for the people employed on and around the farm; and taking a role in the local community
(DairyNZ, 2013b: 25). In addition dairy farmers are expected to contribute to New Zealand’s
economic welfare and to be part of the nation’s business agenda (DairyNZ, 2013b).
Responsibility also extends to risk management – where an enterprise takes responsibility for
identifying and managing risks (SAFA, 2013a: 61) and how well risk management is
incorporated and valued within the enterprise’s decision making. Consumers and investors
may be more supporting of enterprises which do this well
Measures of the indicators ‘responsibility’ and risk management within the management
context could be:
Clear definitions of mandates, responsibilities and accountability regarding sustainable
performance applied at all levels of management and clearly incorporated into job
descriptions and regular evaluations of employee and department performance.
Existence of procedures and/or instruments to evaluate the Code of Conduct or mission
statement and improve its implementation, including resolving areas of deviation from
the mission.
Demonstrated regular assessment of corporate ethics amongst the most senior level
of management at the enterprise.
Evidence that responsibility is taken for mistakes, and appropriate actions are taken to
resolve conflicts in case of a deviation from corporate ethics (taken from FAO, 2012a,
b; SAFA, 2013a, b and other sources).
Objective G2.3: Management actions are transparent
The objective ‘management actions are transparent’ aims to have “all procedures, policies,
decisions or decision-making processes” publicly accessible where appropriate, “and made
available to stakeholders including personnel and others affected by the enterprise's activities”
(SAFA, 2013a: 62). The later version of SAFA expresses this slightly differently by emphasising
the understanding of stakeholders required to achieve transparency: "Real transparency
involves understanding the information needs of stakeholders and making accurate, timely and
relevant information available in an accessible way" (SAFA, 2013c: 20).
Chapter 3: Measuring the governance of New Zealand’s primary-based industries
Synthesis Sustainability Framework and KPI
53
The meaning of ‘transparency’ has three aspects. It implies that there is public access to
information which contains:
1. A clear articulation of the roles and separation of roles in the enterprise’s decision
making processes;
2. Information and processes for the response to requests for information;
3. Compliance assessments or audits – both internal and external (SAFA, 2013; OECD,
2004).
Measurement of the ‘transparency’ indicator could be: “Does the enterprise have a policy which
requires management to report on how policies, procedures, decisions and decision making
processes are made accessible to stakeholders?” (SAFA, 2013a: 62).
Outcome G3: Stakeholder participation is enhanced
Goal
“All stakeholders substantial affected by the enterprise’s activities are identified, empowered
and invited to share decision making on activities impacting on their lives and having major
environmental impacts” (SAFA, 2013a: 64).
Definition
“Participation refers to the need for outreach to, and ensuring the potential for involvement of,
interested parties, in particular those who are materially affected. This includes the ability to
actively take part in decision-making” (SAFA: 2013a: 63).
This outcome includes the objectives ‘maintain effective stakeholder dialogue’, and ‘grievance
and conflict resolution procedures are in place’. Table 3.5 presents these objectives and their
associated indicators.
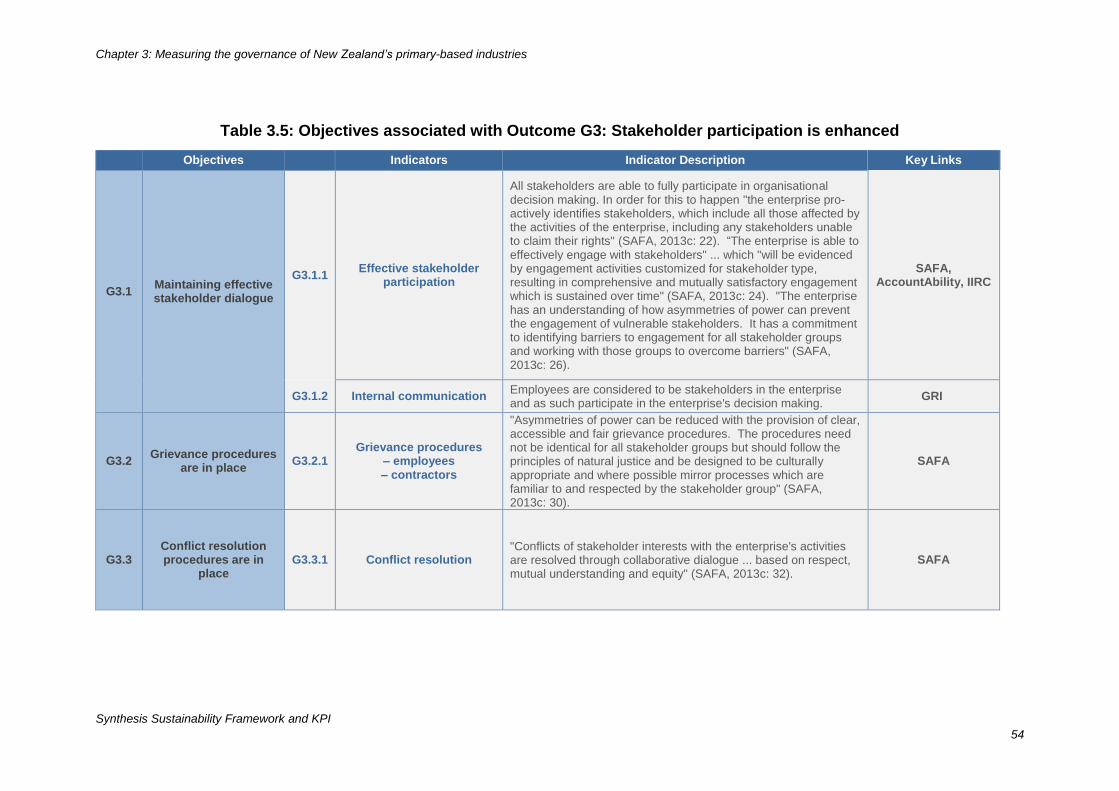
Chapter 3: Measuring the governance of New Zealand’s primary-based industries
Synthesis Sustainability Framework and KPI
54
Table 3.5: Objectives associated with Outcome G3: Stakeholder participation is enhanced
Objectives Indicators Indicator Description Key Links
G3.1 Maintaining effective stakeholder dialogue
G3.1.1 Effective stakeholder
participation
All stakeholders are able to fully participate in organisational decision making. In order for this to happen "the enterprise pro-actively identifies stakeholders, which include all those affected by the activities of the enterprise, including any stakeholders unable to claim their rights" (SAFA, 2013c: 22). “The enterprise is able to effectively engage with stakeholders" ... which "will be evidenced by engagement activities customized for stakeholder type, resulting in comprehensive and mutually satisfactory engagement which is sustained over time" (SAFA, 2013c: 24). "The enterprise has an understanding of how asymmetries of power can prevent the engagement of vulnerable stakeholders. It has a commitment to identifying barriers to engagement for all stakeholder groups and working with those groups to overcome barriers" (SAFA, 2013c: 26).
SAFA, AccountAbility, IIRC
G3.1.2 Internal communication Employees are considered to be stakeholders in the enterprise and as such participate in the enterprise's decision making.
GRI
G3.2 Grievance procedures
are in place G3.2.1
Grievance procedures – employees – contractors
"Asymmetries of power can be reduced with the provision of clear, accessible and fair grievance procedures. The procedures need not be identical for all stakeholder groups but should follow the principles of natural justice and be designed to be culturally appropriate and where possible mirror processes which are familiar to and respected by the stakeholder group" (SAFA, 2013c: 30).
SAFA
G3.3 Conflict resolution procedures are in
place G3.3.1 Conflict resolution
"Conflicts of stakeholder interests with the enterprise's activities are resolved through collaborative dialogue ... based on respect, mutual understanding and equity" (SAFA, 2013c: 32).
SAFA
Chapter 3: Measuring the governance of New Zealand’s primary-based industries
Synthesis Sustainability Framework and KPI
55
Objective G3.1: Maintaining effective stakeholder dialogue
This objective seeks to ensure stakeholder dialogue by emphasising the importance of:
identifying stakeholders in the first place in order to ensure they receive information and can
therefore potentially be contacted, informed and motivated to engage in ways that allow them
to participate in dialogue and decision making; identification and overcoming of barriers to
engagement; and evidence of effective participation.
Communication and relationship building with stakeholders in the widest sense, is key for good
business. Freeman (1984) identifies a stakeholder as “any group or individual who can affect,
or is affected by, the actions of the enterprise” (as cited in SAFA, 2013a: 63). As SAFA points
out it is important to distinguish between stakeholders who are influential in decision making
and those who are impacted on by an enterprise’s decisions. It insists that a broad description
be used to identify the latter group which should include “local communities, consumers,
farmers & growers, future generations and the living environment” (SAFA, 2013: 63). In other
words, stakeholders may include: owners, directors, employees, contractors, suppliers, clients,
rural lenders, rural professionals, neighbours, and members of the local community.
According to (IFAC, 2011: 34), “Stakeholder engagement has emerged as a vital tool to
develop an understanding of what sustainability means for organizations, and how it can
contribute to value creation and the viability of their operations. Failure to identify and engage
with stakeholders is likely to lead to poor performance by (a) hurting customer satisfaction and
perceptions, (b) adversely affecting employee motivation and morale, (c) damaging
relationships in the supply chain, and (d) possibly compromising an organization’s reputation
with the wider community. The quality of sustainability reporting also depends on constructive
stakeholder engagement”.
AccountAbility, an international organisation providing advice on corporate responsibility and
sustainable development, has produced a principles-based, open-source framework to help
enterprises engage with stakeholders. Its systematic approach covers: identification of
stakeholders and issues; determination and definition of the engagement strategy, objective,
and scope; establishment of a plan and implementation; ways of engagement that increase
understanding, learning, and improvement; ensuring capability; communication of results;
assessment of the process; and incorporation of what was learnt into the next engagement
(AccountAbility, 2011).
The first indicator for maintaining effective stakeholder dialogue is ‘effective stakeholder
participation’ which shows how the enterprise endeavours to ensure all stakeholders are able
to fully participate in organisation decision making. It should include:
Stakeholder identification: "The enterprise pro-actively identifies stakeholders, which
include all those affected by the activities of the enterprise, including any stakeholders
unable to claim their rights" SAFA, 2013c: 22).
Stakeholder engagement: "The enterprise is able to effectively engage with
stakeholders" ... which "will be evidenced by engagement activities customized for
Chapter 3: Measuring the governance of New Zealand’s primary-based industries
Synthesis Sustainability Framework and KPI
56
stakeholder type, resulting in comprehensive and mutually satisfactory engagement
which is sustained over time" (SAFA, 2013c: 24).
Identification and amelioration of barriers to stakeholder engagement: "The enterprise
has an understanding of how asymmetries of power can prevent the engagement of
vulnerable stakeholders. It has a commitment to identifying barriers to engagement for
all stakeholder groups and working with those groups to overcome barriers" (SAFA,
2013c: 26).
The second indicator is ‘internal communication’. The NZSD considers that employees are
stakeholders in the enterprise and as such should participate in the enterprise's decision
making.
Some measures of stakeholder dialogue which could be used are those suggested by the FAO
(2012a:
Percentage of identified stakeholders with access to information that is sufficient to
empower them to effectively participate in stake-holder dialogue.
Percentage of identified stakeholders who are actively informed.
Percentage of decisions on disputed subjects, which are thoroughly justified and
explained to affected stakeholders.
The more recent SAFA guidelines (2013a: 118, 120) suggest the following measures:
Percentage of stakeholders identified versus the number engaged.
Percentage of stakeholders unable to claim their rights identified.
Number of stakeholders identified versus the number engaged.
Number of stakeholders unable to claim their rights identified and engaged.
Diversity of approaches identified.
Objectives G3.2 and G3.3: Grievance and conflict resolution procedures are in
place
Within the outcome of stakeholder participation, the objectives ‘grievance procedures’ and
‘conflict resolution’ require that such processes are incorporated into an enterprise’s
governance to ensure that any stakeholder has “access to appropriate grievance procedures
without risk of negative consequences” and that these grievances or conflicts can be “resolved
through collaborative dialogue … based on respect, mutual understanding and equal power”
(SAFA, 2013a: 64). SAFA (2013a: 64) provides descriptors of collaborative dialogue as
“arbitrated, mediated, facilitated, conciliated or negotiated”. In the NZSD these two objectives
have been grouped together as it is hoped they are linked in practice.
Three common types of grievances in the primary industries are between buyers and sellers
of goods and services, between employers and employees, and conflict within families or
business partners. In family businesses there may be conflict between business and family
visions and purpose (Saunders et al. 2006: 10). Olson et al. (2003: 645-8) made an extensive
Chapter 3: Measuring the governance of New Zealand’s primary-based industries
Synthesis Sustainability Framework and KPI
57
review of literature that could be related to family businesses. They found destructive conflict
between family and business goals can affect the sustainability of family businesses.
Mutually recognized grievance procedures and the existence and use of procedures or
instruments that ensure the integrity of complainants reduce the negative impacts of
grievances. Such procedures are often included in employee contracts and contracts between
suppliers and purchaser, and are enforceable by law. In the NZSD they are covered under the
Rule of Law theme, and the Economic and Social dimensions.
Indicators associated with these objectives are therefore to do with the existence and the
effectiveness of grievance procedures and conflict resolution processes. Hence measures may
be:
Percentage of disputed subjects that are addressed in a dialogue-based solution-
finding process led by an independent, commonly agreed party.
Existence and utilisation of procedures or instruments (e.g., mediators) ensuring that
conflict solution is dialogue-based (not power-based).
Existence and utilisation of contracts that have a set dispute resolution process (FAO,
2012a: 47).
Outcome G4: The Rule of Law is followed
Goal
“The enterprise is uncompromisingly committed to fairness, legitimacy and protection of the
Rule of Law, including the explicit rejection of extortion, corruption and the use of resources
that are under legal dispute, whose use contradicts international agreements or which is
considered illegitimate by affected stakeholders. Moreover enterprises will proactively work to
improve the protections offered to the environment, vulnerable workers and communities by
seeking to strengthen applicable laws and codes in concert with affected stakeholders” (SAFA,
2013a: 66).
Definition
“The United Nations defines the Rule of Law as a principle of governance by which all persons
and entities are “accountable to laws that are publicly promulgated, equally enforced and
independently adjudicated”. In the simplest terms, it is compliance with legislation. In SAFA the
Rule of Law is considered in a business context, its main central aim being the protection of
the individual and group rights of all (Ehm, 2010: 5)” (as cited in SAFA, 2013a: 65).
As for the SAFA (2013a, b) sub-themes, the objectives for the NZSD within this outcome are
to do with maintaining fairness, legitimacy and transparency, practicing procedures for remedy,
restoration and prevention, meeting civic responsibilities, and making sure resource are not
appropriated, with the addition of animal welfare compliance which has been moved out of the
environmental outcome into governance. The NZSD team felt animal welfare compliance fitted
better in the Rule of Law outcome due to New Zealand having legislation and a number of code
Chapter 3: Measuring the governance of New Zealand’s primary-based industries
Synthesis Sustainability Framework and KPI
58
of practices to protect animal welfare, unlike some countries. Table 3.6 presents these
objectives and their associated indicators.
Description
The Ministry of Justice states that the Rule of Law is an important part of New Zealand’s
constitution but that the concept is not easily defined and is better described as encompassing
certain ideas to do with freedom and the control of the exercise of power of individuals,
institutions or organisations, such as:
“There are minimum standards of justice to which the law must conform, e.g., laws
affecting human liberty should be reasonably certain and clear;”
“The law should have safeguards against the abuse of wide discretionary powers;”
“A person should not be deprived of his or her liberty, status or other substantial interest
without the opportunity of a fair hearing before and impartial court or tribunal” (Ministry
of Justice, n.d.: 5).
Relevance of Rule of Law to sustainability
In seeking to have a compliance system that has international recognition and integrity it is
important that the NZSD also follows the Rule of Law (ROL) as it is crucial in international
agreements. It implies the existence of some universal understanding common to all countries
of the most important components of a legal system to do with human rights. Key elements
are “accountability before the law, legal certainty and legal transparency” SAFA (2013a: 65).
What is more, according to SAFA (2013a: 65), “an enterprise committed to the ROL will only
conduct business with other businesses that follow the rule of law”.
There are aspects of the ‘Rule of Law’ specific to agriculture over such issues as access and
certainty of access to resources, processes over disputes and the legality of stakeholders
claims (SAFA, 2013a: 65).
In New Zealand there are a number of acts and regulations to ensure fairness in business and
to protect human and animal rights and resources. Key legislation includes: the Fair Trading
Act 19869, The Treaty of Waitangi; Resource Management Act 1991 (RMA)10; Employment
Relations Act 200011 and other laws that affect the employment relationship, and Animal
Welfare Act 199912.
9 http://www.legislation.govt.nz/act/public/1986/0121/latest/DLM96439.html 10 http://www.legislation.govt.nz/act/public/1991/0069/latest/DLM230265.html 11 http://www.legislation.govt.nz/act/public/2000/0024/latest/DLM58317.html 12 http://www.legislation.govt.nz/act/public/1999/0142/latest/DLM49664.html
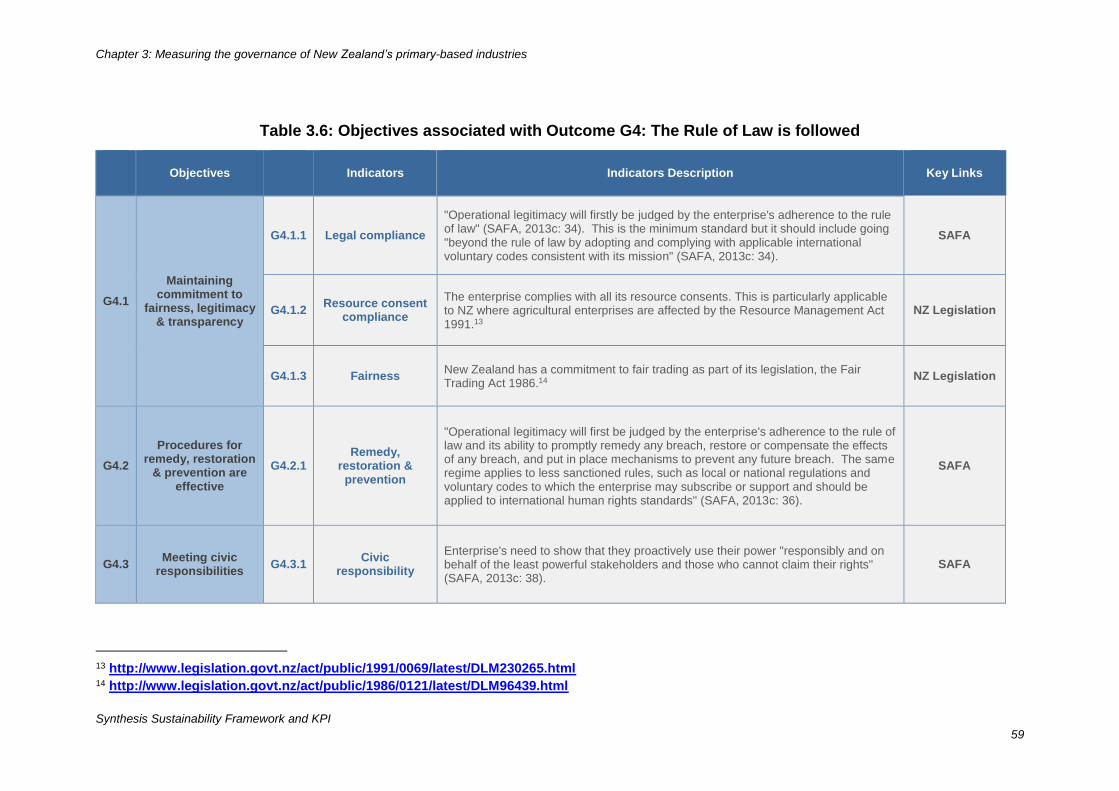
Chapter 3: Measuring the governance of New Zealand’s primary-based industries
Synthesis Sustainability Framework and KPI
59
Table 3.6: Objectives associated with Outcome G4: The Rule of Law is followed
Objectives Indicators Indicators Description Key Links
G4.1
Maintaining commitment to
fairness, legitimacy & transparency
G4.1.1 Legal compliance
"Operational legitimacy will firstly be judged by the enterprise's adherence to the rule of law" (SAFA, 2013c: 34). This is the minimum standard but it should include going "beyond the rule of law by adopting and complying with applicable international voluntary codes consistent with its mission" (SAFA, 2013c: 34).
SAFA
G4.1.2 Resource consent
compliance
The enterprise complies with all its resource consents. This is particularly applicable to NZ where agricultural enterprises are affected by the Resource Management Act 1991.13
NZ Legislation
G4.1.3 Fairness New Zealand has a commitment to fair trading as part of its legislation, the Fair Trading Act 1986.14
NZ Legislation
G4.2
Procedures for remedy, restoration
& prevention are effective
G4.2.1 Remedy,
restoration & prevention
"Operational legitimacy will first be judged by the enterprise's adherence to the rule of law and its ability to promptly remedy any breach, restore or compensate the effects of any breach, and put in place mechanisms to prevent any future breach. The same regime applies to less sanctioned rules, such as local or national regulations and voluntary codes to which the enterprise may subscribe or support and should be applied to international human rights standards" (SAFA, 2013c: 36).
SAFA
G4.3 Meeting civic
responsibilities G4.3.1
Civic responsibility
Enterprise's need to show that they proactively use their power "responsibly and on behalf of the least powerful stakeholders and those who cannot claim their rights" (SAFA, 2013c: 38).
SAFA
13 http://www.legislation.govt.nz/act/public/1991/0069/latest/DLM230265.html 14 http://www.legislation.govt.nz/act/public/1986/0121/latest/DLM96439.html
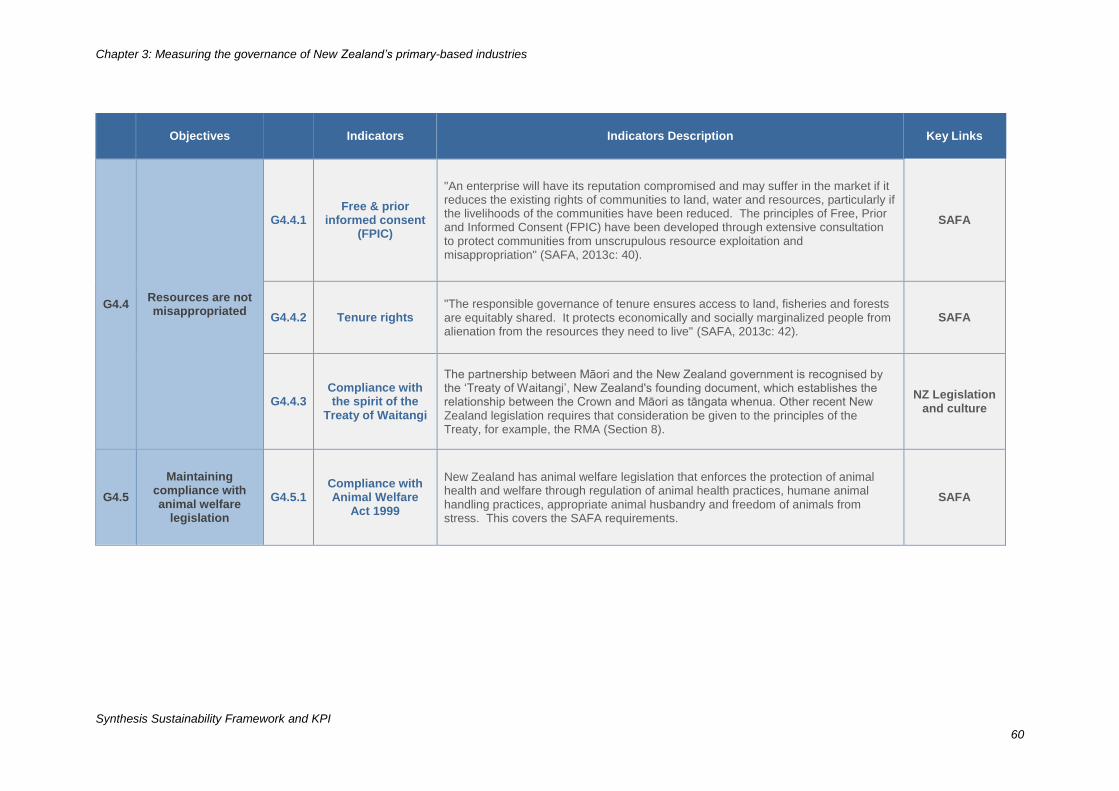
Chapter 3: Measuring the governance of New Zealand’s primary-based industries
Synthesis Sustainability Framework and KPI
60
Objectives Indicators Indicators Description Key Links
G4.4 Resources are not misappropriated
G4.4.1 Free & prior
informed consent (FPIC)
"An enterprise will have its reputation compromised and may suffer in the market if it reduces the existing rights of communities to land, water and resources, particularly if the livelihoods of the communities have been reduced. The principles of Free, Prior and Informed Consent (FPIC) have been developed through extensive consultation to protect communities from unscrupulous resource exploitation and misappropriation" (SAFA, 2013c: 40).
SAFA
G4.4.2 Tenure rights "The responsible governance of tenure ensures access to land, fisheries and forests are equitably shared. It protects economically and socially marginalized people from alienation from the resources they need to live" (SAFA, 2013c: 42).
SAFA
G4.4.3 Compliance with the spirit of the
Treaty of Waitangi
The partnership between Māori and the New Zealand government is recognised by the ‘Treaty of Waitangi’, New Zealand's founding document, which establishes the relationship between the Crown and Māori as tāngata whenua. Other recent New Zealand legislation requires that consideration be given to the principles of the Treaty, for example, the RMA (Section 8).
NZ Legislation and culture
G4.5
Maintaining compliance with animal welfare
legislation
G4.5.1 Compliance with Animal Welfare
Act 1999
New Zealand has animal welfare legislation that enforces the protection of animal health and welfare through regulation of animal health practices, humane animal handling practices, appropriate animal husbandry and freedom of animals from stress. This covers the SAFA requirements.
SAFA
Chapter 3: Measuring the governance of New Zealand’s primary-based industries
Synthesis Sustainability Framework and KPI
61
Objective G4.1: Maintaining commitment to fairness, legitimacy and
transparency
This objective aims for an enterprise to demonstrate fairness and legitimacy thereby gaining
the recognition that it has the moral authority to exist and transact business and other
relationships with other enterprises. This means that it is “compliant with all applicable laws,
regulations and standards voluntarily entered into by the enterprise … and international human
rights standards” (SAFA, 2013a: 66). For the NZSD this has been extended to specify, as part
of that legitimisation, a commitment to fairness.
Employment law in New Zealand is covered by a number of different acts to ensure workers’
rights. Key acts are: Employment Relations Act 2000; the Holidays Act 2000; the Minimum
Wage Act 198315; Equal Pay Act 197216 and the Health and Safety in Employment Act 199217.
There are financial penalties for not complying (MBIE, 2013). Details associated with these
laws can be found on the MBIE website (www.mbie.govt.nz).
Compliance with the Fair Trading Act 1986 ensures fairness in trading, underpinning New
Zealand business transactions, making it illegal for traders to mislead consumers, give them
false information, or use unfair trading practices. Therefore, such compliance backs up the
growing demands of consumers, particularly amongst premium segments of the market, for
the things that they buy to come from countries and companies that adhere to sustainable
practices socially as well as environmentally (Saunders et al., 2007a).
The principle of fairness, is not just to do with the present but also the future. There is a need
to balance the needs of both current and future generations, as is included in the Brundtland
definition (WCED, 1987: 43) of sustainable development as development that “seeks to meet
the needs … of the present without compromising the ability” of future generations to meet
their own needs. Future generations should have the same options as the present generation,
and should not be limited by the consequences of actions of the present generation.
The indicators, ‘legal compliance’, ‘resource consent compliance’ and ‘fairness’ are measured
by whether or not an enterprise adheres to laws that give it the rights to operate, whether these
are well incorporated into the mission and culture of the enterprise, and that it at least aspires
to meet fair trade requirements in its sourcing of resources and in the sale of its products
(SAFA, 2013a: 130). Legal compliance is described by SAFA (2013c: 34) as "Operational
legitimacy will firstly be judged by the enterprise's adherence to the rule of law". This is the
minimum standard but it should include going "beyond the rule of law by adopting and
complying with applicable international voluntary codes consistent with its mission" (SAFA,
2013c: 34). Compliance with resource consents is particularly applicable to NZ where
agricultural enterprises are affected by the Resource Management Act 1991. In New Zealand
‘fairness’ is covered by compliance with the Fair Trading Act 1996.
15 http://www.legislation.govt.nz/act/public/1983/0115/latest/DLM74093.html 16 http://www.legislation.govt.nz/act/public/1972/0118/latest/DLM407770.html 17 http://www.legislation.govt.nz/act/public/1992/0096/latest/DLM278829.html
Chapter 3: Measuring the governance of New Zealand’s primary-based industries
Synthesis Sustainability Framework and KPI
62
Objective G4.2: Procedures for remedy, restoration and prevention are effective
This objective aims for an enterprise to have effective mechanisms to remedy and restore
situations in which here have been infringements of laws, regulations or standards and also
procedures to prevent any recurrence of such infringements. This goes beyond the SAFA
requirements which specify that this just happens when there is an infringement, but like SAFA,
it requires that there is a useful response to such infringements as implied by using the word
‘effective’.
The United Nations Human Rights Council (UNHRC, 2011) has produced a document ‘Guiding
Principles on Business and Human Rights’ with the aim of promoting and protecting all human
rights - civil, political, economic, social and cultural, including the right to development. This
framework describes what companies are required to do and how companies can know and
show that they respect human rights in practice (Shift and Mazars, 2013). However, the Human
Rights Resource Centre (2013) of the University of Indonesia claims that “there is yet no global
and widely accepted process for companies to demonstrate whether their policies and
processes are indeed aligned with the UN Guiding Principles”.
The indicator ‘remedy, restoration and prevention’ can be described as: "Operational legitimacy
will first be judged by the enterprise's adherence to the rule of law and its ability to promptly
remedy any breach, restore or compensate the effects of any breach, and put in place
mechanisms to prevent any future breach. The same regime applies to less sanctioned rules,
such as local or national regulations and voluntary codes to which the enterprise may subscribe
or support and should be applied to international human rights standards" (SAFA, 2013c: 36).
It could be measured by the reporting of infringements, the consequent process and its results
(SAFA, 2013a: 132).
Objective G4.3: Meeting civic responsibilities
The objective ‘civic responsibility’ seeks to ensure that the enterprise does not try to escape
strict laws on social and environmental aspects within its sphere of influence (e.g., by relocating
facilities), but “supports the improvement of the … regulatory framework on all dimensions of
sustainability” (SAFA, 2013a: 65).
As SAFA (2013a) points out, enterprises to do with food can be very powerful at both a national
and a global level, and to meet this objective, enterprise's need to show that they proactively
use their power "responsibly and on behalf of the least powerful stakeholders and those who
cannot claim their rights" (SAFA, 2013c: 38). “A sustainable food supply chain will be achieved
when all parts of the supply chain are free from exploitation of individuals, communities and
the environment across all four dimensions of sustainability” (SAFA, 2013a: 134).
Where an enterprise operates in different locations (particularly different countries) it is
important that it has a common statement, such as a Code of Conduct, which is not location
dependent and therefore applies to the enterprises wherever they operate. An aim of an
enterprise could also be to engage in activities and initiatives which improve the regulatory
Chapter 3: Measuring the governance of New Zealand’s primary-based industries
Synthesis Sustainability Framework and KPI
63
framework on sustainability at the local, national and/or international level (SAFA, 2013a: 65,
134).
The following measures of the indicator ‘civic responsibility’ will primarily apply to larger
enterprises and those with a strong commitment to sustainability principles.
From “board agendas, minutes or other governance records … establish:
A register of all peak bodies or lobbying groups to which the organization belongs.
Records of any lobbying direct or indirect in which the organization seeks to influence
laws, regulations, international human rights codes or other voluntary codes.
Testing these activities against mission and against the interests of the least powerful
and those who cannot claim their rights.
Where evidence of lobbying is found, the impact of this is tested by seeking the views
of affected stakeholders” (SAFA, 2013a: 134).
Objective G4.4: Resources are not misappropriated
The objective ‘resources are not misappropriated’ seeks to ensure that “enterprises do not
reduce the existing rights of communities to land, water and resources and operations are
carried out after informing affected communities by providing information, independent advice
and building capacity to self-organize for the purposes of representation” (SAFA, 2013a: 66).
The first indicator of this objective ensures that decisions are made with ‘free and prior informed
consent’. This is described by SAFA (2013c: 40) as "An enterprise will have its reputation
compromised and may suffer in the market if it reduces the existing rights of communities to
land, water and resources, particularly if the livelihoods of the communities have been reduced.
The principles of Free, Prior and Informed Consent (FPIC) have been developed through
extensive consultation to protect communities from unscrupulous resource exploitation and
misappropriation".
The second indicator is to do with tenure rights. "The responsible governance of tenure
ensures access to land, fisheries and forests are equitably shared. It protects economically
and socially marginalized people from alienation from the resources they need to live" (SAFA,
2013c: 42). The two key documents that guide resource appropriation in New Zealand are the
Resource Management Act 1991 (RMA) and The Treaty of Waitangi. The RMA set out to create
a more streamlined, integrated and comprehensive approach to the management of parts of
the environment which are considered to be of national importance. In the RMA, sustainable
management means:
Managing the use, development, and protection of natural and physical resources in a way, or
at a rate, which enables people and communities to provide for their social, economic, and
cultural well-being and for their health and safety while:
a. sustaining the potential of natural and physical resources (excluding minerals) to meet
the reasonably foreseeable needs of future generations; and
b. safeguarding the life-supporting capacity of air, water, soil, and ecosystems; and
c. avoiding, remedying, or mitigating any adverse effects of activities on the environment
(RMA, 2013).
Chapter 3: Measuring the governance of New Zealand’s primary-based industries
Synthesis Sustainability Framework and KPI
64
In the RMA natural and physical resources include land, water, air, soil, minerals, energy, all
forms of plants and animals, and all structures. The environment includes people and
communities as well as what is usually thought of as 'natural' ecosystems.
The third indicator is to do with compliance with the spirit of the Treaty of Waitangi. The
partnership between Māori and the New Zealand government is recognised by the ‘Treaty of
Waitangi’, New Zealand's founding document, which establishes the relationship between the
Crown and Māori as tāngata whenua. Other recent New Zealand legislation requires that
consideration be given to the principles of the Treaty, for example, the RMA (Section 8). The
principles of the Treaty of Waitangi are an interpretation of the Treaty's text which continues to
evolve. In the broadest sense the principles of the Treaty, to date, have been interpreted as:
the principle of active protection
the tribal right to self-regulation
the right of redress for past breaches
the duty to consult (Waitangi Tribunal, n.d.).
Objective G4.5: Maintaining compliance with animal welfare legislation
The ‘animal welfare’ objective aims to protect the physical and psychological well-being of
animals (SAFA, 2013a, b). Animal welfare legislation and regulations require animals to be
kept in ways that mean they live lives that are free from stress and that they live in species-
appropriate conditions.
Internationally, the food service and retail sectors have played a major role in animal welfare,
creating standards that their suppliers are required to meet. This has also been caused by
public shift in perceptions towards animals with demands for standards and safeguards for the
care and use of animals in research, trade and production.
Animal welfare cuts across economic, good governance and social themes. Poor animal
welfare reduces farm productivity and profitability and is socially unacceptable. As New
Zealand has explicit animal welfare standards contained in both regulations and laws it has
been placed as an objective in the ‘Rule of Law is followed’ outcome under good governance
rather than as an outcome in the Environmental integrity pillar as it is in the SAFA (2013b)
assessment system.
New Zealand’s pastoral farming is dependent on animals and this is well recognised in
legislation. Animal health has a significant impact on farm productivity and profit, affecting
animal growth rates, death rates, reproductive rates and farm costs. The primary legislation is
the Animal Welfare Act 1999 which sets out obligations for people who own or are in charge of
animals, and requires them to meet the animal’s physical, health and behavioural needs and
to alleviate their pain and distress. In the Codes of Welfare issued by the Minister for Primary
Industries (under the Animal Welfare Act 1999), each of the main farmed animal species has
a separate code.
Chapter 3: Measuring the governance of New Zealand’s primary-based industries
Synthesis Sustainability Framework and KPI
65
Although New Zealand does not have serious infectious diseases such as foot-and-mouth or
mad cow disease, there are some that can seriously affect animal health and production.
Several may be passed on to humans and are known as zoonotic diseases so have the
potential to affect food quality and public health. These include tuberculosis (Mycobacterium
bovis), leptospirosis (Leptospira pomona) and E.coli. Tuberculosis and residues of antibiotics
in milk or meat are a food safety issue, leptospirosis a workplace health issue and E.coli an
environmental issue affecting water quality and downstream water users.
The New Zealand farmer is always on the lookout for animal health problems, including
contagious illnesses, diseases of reproduction and the nervous system, internal and external
parasites, poisoning and metabolic illnesses caused by nutrient deficiencies. Many of these
occur only sporadically and are easy to cure, but two – tuberculosis (TB) and internal parasites
of sheep and cattle – may threaten farming in the future. Tuberculosis is difficult to control
because it is endemic in wild possums and ferrets, which can re-infect domestic stock. Internal
parasites of sheep and cattle can become resistant to the anthelmintic used to control them.
Measurements of animal welfare and health are to do with the implementation of practices that
effectively promote the health of animals while reducing the use of veterinary drugs and
preventing animal losses due to disease and injuries. Hence and overarching measurement
of animal welfare is:
”Animals are kept under species-appropriate conditions and free from hunger and thirst,
discomfort, pain, injury and disease and distress” (SAFA, 2013a: 81).
The minimum threshold is compliance with the codes of welfare (under the Animal Welfare Act
1999).
Chapter 3: Measuring the governance of New Zealand’s primary-based industries
Synthesis Sustainability Framework and KPI
66
Outcome G5: Management approach is holistic
Definition of holistic management
“Holistic management (often termed sustainability management) is defined as management
that aims at the continuous improvement of environmental integrity, economic resilience, social
well-being and good governance, with the ultimate goal of operations being fully in line with a
sustainable development of society” (SAFA, 2013a: 67).
Description
The outcome, ‘management approach is holistic’, ideally flows on from that of ‘governance
structure is effective’ as a governance structure is set up to enable holistic management to
happen. If sustainability is to become a core part of an enterprise’s culture and practice, then
the governing body and the management must lead by example. For this to happen it is better
that sustainability ideas are integrated into the “mission/vision, goals and objectives, values,
strategy, operations, and reporting” (IFAC, 2011: 31) as drivers of a business rather than just
as a compliance function because it is then more likely to become an accepted part of an
enterprise and it will generate added value for the enterprise (IFAC, 2011: 31). As DairyNZ
(2007) states, this starts out with a vision: “Having extreme clarity of vision for what [you] want
to achieve is the single most motivating factor in obtaining the life or business [you] want”.
The objectives in the NZSD translate directly from the SAFA (2013b) sub-themes, to become
‘implement a sustainability management plan’ and ‘practice full cost accounting’. Table 3.7
presents these objectives and their associated indicators. In the NZSD we could have added
‘marketing plan’ and ‘methodologies and tools’ to meet the needs of New Zealand primary
producers and farm management but these are already incorporated into the economic
resilience dimension and governance structure theme respectively.
Objective G5.1: Implementing a sustainability management plan
Sustainability management plans are used by an enterprise with the objective of providing
“good governance guidance for its sustainability efforts and to assist in incorporating the values
and aspirations for sustainability to be formally included in business planning” (SAFA, 2013a:
139). Therefore, once incorporated, governance bodies have the power “to hold management
accountable for implementing the direction and targets set for the organization” (SAFA, 2013a:
139).
As evidenced by the proliferation of advice and guidelines on sustainability planning and
reporting, having a sustainability management plan is becoming the ‘right thing to do’ for
business enterprises in the western world (e.g., SAFA, GRI, FRC, IFAC, IIRC etc.).
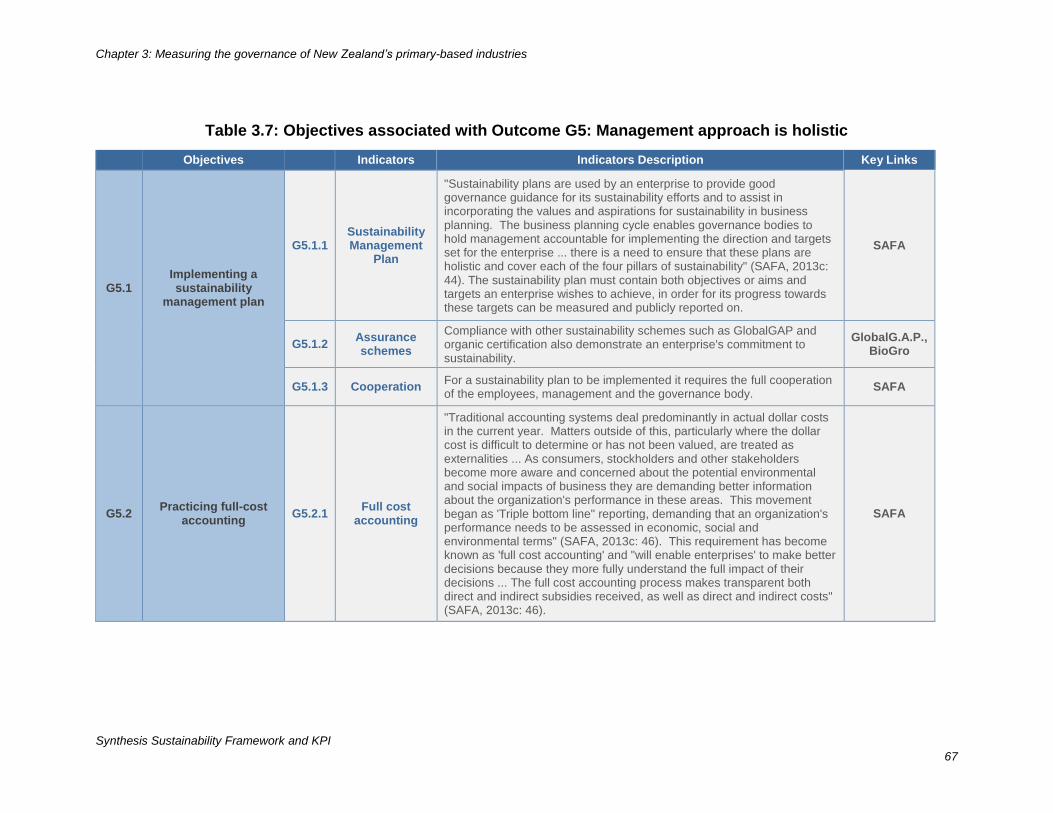
Chapter 3: Measuring the governance of New Zealand’s primary-based industries
Synthesis Sustainability Framework and KPI
67
Table 3.7: Objectives associated with Outcome G5: Management approach is holistic
Objectives Indicators Indicators Description Key Links
G5.1 Implementing a sustainability
management plan
G5.1.1 Sustainability Management
Plan
"Sustainability plans are used by an enterprise to provide good governance guidance for its sustainability efforts and to assist in incorporating the values and aspirations for sustainability in business planning. The business planning cycle enables governance bodies to hold management accountable for implementing the direction and targets set for the enterprise ... there is a need to ensure that these plans are holistic and cover each of the four pillars of sustainability" (SAFA, 2013c: 44). The sustainability plan must contain both objectives or aims and targets an enterprise wishes to achieve, in order for its progress towards these targets can be measured and publicly reported on.
SAFA
G5.1.2 Assurance schemes
Compliance with other sustainability schemes such as GlobalGAP and organic certification also demonstrate an enterprise's commitment to sustainability.
GlobalG.A.P., BioGro
G5.1.3 Cooperation For a sustainability plan to be implemented it requires the full cooperation of the employees, management and the governance body.
SAFA
G5.2 Practicing full-cost
accounting G5.2.1
Full cost accounting
"Traditional accounting systems deal predominantly in actual dollar costs in the current year. Matters outside of this, particularly where the dollar cost is difficult to determine or has not been valued, are treated as externalities ... As consumers, stockholders and other stakeholders become more aware and concerned about the potential environmental and social impacts of business they are demanding better information about the organization's performance in these areas. This movement began as 'Triple bottom line" reporting, demanding that an organization's performance needs to be assessed in economic, social and environmental terms" (SAFA, 2013c: 46). This requirement has become known as 'full cost accounting' and "will enable enterprises' to make better decisions because they more fully understand the full impact of their decisions ... The full cost accounting process makes transparent both direct and indirect subsidies received, as well as direct and indirect costs" (SAFA, 2013c: 46).
SAFA

Chapter 3: Measuring the governance of New Zealand’s primary-based industries
Synthesis Sustainability Framework and KPI
68
A plan is “simply a systematic plan of action” (DairyNZ, 2007). According to IFAC (2011: 44-45),
a plan should establish goals, targets, and performance measures, identify outcomes where
possible, engage employees involved in executing strategy, and establish a baseline against
which progress can be monitored.
An enterprise is likely to increase its sustainability if it includes in its management plan,
cooperation with and participation in research projects, industry extension events, exchange with
peers and contribution to industry good. Through involvement in research, discussion groups,
field days and other industry extension, those who work in or own agricultural enterprises increase
or add to their skills and knowledge on how to carry out current and future requirements of the
enterprise to compete in the global business arena (DairyNZ, n.d.b).
Those who use the NZSD may already be involved in some form of compliance with an
established market assurance plan. The vision of the NZSD is for it to be used throughout product
supply chains by market assurance programmes and to provide regular feedback to enterprises
for learning.
(
The first indicator of the objective ‘implementation of a sustainability management plan’ is the
existence of such a plan which should include the four pillars of sustainability, objectives directed
towards sustainability performance and targets to measure the direction of the attainment of
sustainability, and whether or not the plan is used in decision making (SAFA, 2013a: 139). A
second indicator shows if the enterprise is enrolled in assurance schemes and complies with
them. A final indicator is the degree of cooperation of employees, managers and the governance
body in ensuring the sustainability plan is implemented.
Objective G5.2: Practicing full cost accounting
The objective ‘practice full cost accounting’ is included to demonstrate that “the business success
of the enterprise is measured and reported taking into account direct and indirect impacts on the
economy, society and physical environment (e.g., triple bottom line reporting), and the accounting
process makes transparent both direct and indirect subsidies received, as well as direct and
indirect costs externalized” (SAFA, 2013a: 68).
Traditionally, reporting on enterprise’s performance has been through the presentation of financial
accounts but this process has been under challenge for some time. One of the substitutes for
traditional practice is that of ‘triple bottom line’ reporting, which is a method of accounting that
assesses an enterprises performance in economic, social and environmental terms (SAFA,
2013a; Group 100, 2013). In this way the environmental and social risks that have the capacity to
affect financial performance can be identified and taken into account (Group 100, 2013: 6). Other
substitutes for traditional accounting methods have been called social auditing and environmental
accounting, and these can be incorporated under the name of ‘full-cost accounting’ (SAFA, 2013a:
141).
Chapter 3: Measuring the governance of New Zealand’s primary-based industries
Synthesis Sustainability Framework and KPI
69
Examples of externalities are greenhouse gases and nutrient losses to water, which have a cost
to the wider community but the cost is not always put against the business/emitter. As SAFA
states, “As consumers, stockholders and other stakeholders become more aware and concerned
about the potential environmental and social impacts of business they are demanding better
information about the organizations performance in these areas” (SAFA, 2013a: 141).
Measurements of the indicator ‘full-cost accounting’ could be based on whether or not the
enterprise has evidence that it collects, analyses and reports to its stakeholders on its economic,
social and environmental impacts and performance (SAFA, 2013a: 142).
Conclusion
This chapter has set out and justified the framework for the NZSD’s ‘good governance’ pillar and
suggested some KPIs which may be used to measure progression towards such good
governance. It draws heavily on the SAFA (2013a, b) guidelines, and is backed up by many other
international business reporting organisations which support the inclusion of governance in their
sustainability assessments. Little support has been drawn from New Zealand because there has
been little emphasis to date on good governance, except in the Māori cultural context, and the
NZSD will help to address this gap. Overall it indicates how the factors which demonstrate good
governance are also strongly related to economic resilience and social well-being, demonstrating
the interlinked nature of sustainability.
Chapter 4: Measuring the economic resilience of New Zealand’s primary-based industries
Synthesis Sustainability Framework and KPI
70
Economic resilience – sustains an economy through change and shocks
To be economically resilient an enterprise’s financial well-being is maintained,
its vulnerability minimised, the products it produces are of good quality,
accompanied by adequate information, and efficiently produced, and it creates
value in the local community.
Economic resilience
Economics is about maximising social welfare subject to resource constraints. Thus,
if, as is generally assumed, we want more than we have, then limited resources are in
demand to meet unlimited 'wants'. ‘Resource’ is an all-encompassing expression
which is why economics can be so broad within its context. Hence economics is to do
with the allocation and choice given to scarce resources, which is measured by the
opportunity cost of the next best alternative to that action - or to put it more simply,
"What you would have done if you didn't make the choice that you did". Economic
resilience considers the resilience of resources. For example, climate change may alter
the frequency of droughts and therefore the risk profile of available resources.18
The NZSD is attempting to serve enterprises at many levels – owner-operated farm
business, agribusinesses such as wineries and packhouses, to provide audit and
quality oversight, and to possibly generate sector, regional and national information.
Therefore, while there is a focus on the ‘enterprise’ level in this report there is a need
to keep in mind that there is an overall generic quality to the NZSD framework. Hence,
it must be emphasised that the economic pillar is about resilience, and not just about
financial performance. Financial performance is one of the indicators of resilience.
The NZSD is not seeking to duplicate the work of a financial auditor to express an
opinion on the financial accounts but to assess economic sustainability. Most business
enterprises will produce an annual report with a set of accounts as part of their
accountability (see the chapter on Good Governance) which will have information
relating to an enterprise’s economic performance. Therefore, to be economically
resilient not only is an enterprise’s financial well-being maintained, but also its
vulnerability is minimised, the products it produces are of good quality, accompanied
by adequate information, and efficiently produced, and it creates value in the local
community. Or, to be more specific, “To be considered economically sustainable an
enterprise should be capable of paying all its debts, generating a positive cash flow
and adequately renumerating workers and shareholders. In addition it should have
buffer mechanisms (savings, assets) to cope with changes and shocks out of its
control, for example, economic downturns, damaging weather. In essence it must be
economically resilient” (SAFA, 2013a: 56).
18 Personal communication with Caroline Saunders.
Chapter 4: Measuring the economic resilience of New
Zealand’s primary-based industries
Chapter 4: Measuring the economic resilience of New Zealand’s primary-based industries
Synthesis Sustainability Framework and KPI
71
According to SAFA (2013a:56) “economic activity involves the use of labour, land and
capital to produce goods and services to satisfy people’s needs” and “sustainability is
directly linked with the fulfilment of needs, a pillar of sustainable development as
defined by the World Commission on Environment and Development (WCED, 1987).
Sustainability in the social and environmental domains is supported by functioning
businesses.” This indicates how closely the three pillars of sustainability are closely
aligned and inter-related.
With reference to the distinction made above, some tend to confuse financial indicators
with economic ones. The former usually only include those which are market oriented
and are only a subset of our resources.19 Historically, in anything to do with the primary
industries in New Zealand, this - with production statistics - was all that was measured
– usually in the form of ratios such as production/ha, efficiency (costs/revenue). This
is probably because these measures would be free of units and so comparable across
different industries, businesses, sectors etc. However, it has been found that these
ratios differ by industry grouping, size of firm, and location (Stats NZ, 2013). Also, it
appears that the use of aggregate level data has declined, meaning that it has been
found that several areas of an enterprise need to be assessed rather than producing
one overall index of economic sustainability. More recently there has been an
increasing focus on intangibles such as branding and staff training, rather than physical
resources such as plant and machinery (Saunders et al. 2006:16-17). (Ironically, it is
suggested that in evaluating intangibles they must be operationalised, benchmarked,
assessed and improved on.)
Error! Reference source not found.2.5, in Chapter 2, presented the sources which
ere used to inform the development of the economic resilience pillar of the NZSD.
Farm management and economic resilience
Farm Management deals with decisions on the use of scarce farm resources, to obtain
maximum profit and family satisfaction on a continuous basis from the farm (Martin et
al., 2005). It integrates the four dimensions of governance, agro-environmental
integrity, economic resilience and social well–being. In business, successful
management of sustainability performance is achieved if the management of
environmental, social and governance issues are in line with increased
competitiveness and economic performance. One particular challenge to sustainability
management is finding appropriate ways of dealing with trade-offs between
sustainability goals. Holistic farm management is about striking a balance between
short and long-term interests, economic, social and environmental concerns,
stakeholders and shareholders (Kelly and Bywater, 2005).
The introduction of something new (e.g., a piece of technology) or a change to an
existing part of the system is likely to impact on other parts of the farm system.
Therefore, understanding the wider impacts on the system is fundamental to effective
farm management. An example of this is the introduction of irrigation onto a property.
19 Personal communication with Caroline Saunders.
Chapter 4: Measuring the economic resilience of New Zealand’s primary-based industries
Synthesis Sustainability Framework and KPI
72
Irrigation is usually installed to increase production, improve product quality and
reliability, and reduce risk of drought. However, irrigation development often involves
increasing business debt and all of these impact on economic resilience. The use of
irrigation has other impacts in the environmental and social spheres which are
described elsewhere.
Measuring the sustainability of management practices
The use of physical and financial performance indicators and benchmarking for the
financial analysis of businesses is a widespread practice throughout the New Zealand
primary sector. Benchmarking involves the comparison of a performance indicator
derived for one business with the same performance indicator derived for one or more
other businesses (Shadbolt and Bywater, 2005). Benchmarking therefore focuses on
the key variables influencing productivity, profitability, liquidity and solvency. Through
‘benchmarking’ a farm business manager would:
Measure current physical, ecosystem, social and financial performance;
Identify areas of performance where improvement needs to be made;
Identify changes which can be made to current husbandry and business
management processes and practices in order to improve enterprise and/or
whole farm performance.
“A manager may use a range of key performance indicators that are an index of a set
of performance measures to provide an indication of the overall performance of the
business. These measures must be tightly linked to the farmer’s goals” (Gray, 2005:
51). Factors can be measured objectively using some form of instrument (e.g., scales,
refractometer for fruit sugar) or subjectively using visual assessment. Monitoring
frequency is an important consideration. “Factors must be monitored at a frequency
that allows the farmer time to take effective corrective action. The frequency for any
particular factor will be dependent on the factor and the nature of the production cycle”
(Gray, 2005: 51). Too frequent monitoring can become costly.
Increasingly, information has to be collected to meet compliance requirements and
quality assurance for products. Farm managers also find they can use this information
for benchmarking to achieve continuous improvement in their business management
systems (Shadbolt and Bywater, 2005). All properties have annual accounts with
additional information on production inputs and outputs. Some vineyards/wineries
have adopted enterprise budgeting which tracks all expenditure and production down
to a block level. Precision viticulture and agriculture can take it to a smaller scale.
Financial information in farm businesses is available from a number of sources: bank
statements, cashbooks, annual tax accounts, discussion group analysis and various
financial benchmarking services (e.g., Dairybase, Redskies). The key is to use this
information to make better financial decisions. Sound financial management involves
targeting and monitoring three critical outcomes of liquidity, wealth creation and
profitability (Shadbolt and Gardner, 2005).
Chapter 4: Measuring the economic resilience of New Zealand’s primary-based industries
Synthesis Sustainability Framework and KPI
73
Placing sustainability in context
Before decisions can be made about the level of sustainability of an enterprise through
the use of the NZSD, the context of the enterprise needs to be known in order for like
to be compared with like. In terms of economic resilience and sustainability this
information is often required:
Sector
Size and structure of enterprise, age – years trading,
Ownership: publicly listed company, private company, owner operated
Family business (yes/no).
As many of the enterprises that will be using the NZSD will be family businesses other
aspects which are unique to such a business type may be useful, such as:
Is the Manager the sole decision maker?
Is the manager employed elsewhere?
Is family income used for the business? Is family labour used?
Is time transferred from work to the family and vice versa?
It is likely that when a person logs onto the NZSD, it immediately identifies what is
already known about them and their business and anything they enter is placed into a
context without them needing to enter any further information.
Collecting national statistics
Statistics NZ uses economic statistics to measure economic resilience at a national
level and often reports them as ‘per person’. According to Stats NZ (2009) these are
the variables that are important nationally:
Real net stock of total assets per person
Real net stock of infrastructure per person
Real investment in fixed capital per person
Ratio of debt services to export earnings
Diversity of exports
Government debt
The size of a business as an indicator
The measure of economic value generated by a business should be included in the
NZSD because it is a context variable indicating the size of the business. When
measured as an absolute value it is unlikely to be included in the NZSD’s output but it
is needed in other important calculations. This variable can be expressed as:
Revenue/income/turnover/Gross Business Revenue/GFR/GOR – measured in dollars ($), $/ha, $/FTE, $/SU, $/tray, $/litre, $/kg.
This variable needs to be related to something else as total revenue on its own is a
context variable. As indicated above, some units could be $/ha and $/production unit.
Both these measures are dependent on sector, location, and ‘crop’.
Other measures of business size are:
Chapter 4: Measuring the economic resilience of New Zealand’s primary-based industries
Synthesis Sustainability Framework and KPI
74
Production area in hectares – if a farm/orchard/vineyard of some sort – effective ha (cash crop area, new grass area, canopy area)
No. of employees/total labour units (family, other, working owners).
Indicators using financial data
The financial data which can be collected about the economic well-being of a business
enterprise can be classified in three basic ways - what comes in (A), what goes out
(B), and what is left over (A-B). As is evident already from this description, only two of
these variables are needed to obtain the third. Each of these is meaningless however,
because businesses can vary so much in size, therefore, useful indicators are usually
measured in terms of a ratio of some sort that enables comparisons across businesses
of different sizes. Hence a measure is likely to be expressed in terms of dollars (e.g.,
profit) per hectare (ha), per FTE, per stock unit (SU), per production unit (tray of fruit,
litre of wine, kg of meat/milk solids) or in percentage terms such as expenses to total
revenue.
Indicators of sustainability to do with work and employment
To be sustainable an enterprise would wish to employ the most suitable people it can
obtain to do the work it requires and to maintain good relationships and conditions for
these employees so that they will continue to work for the enterprise. In other words,
a business is dependent on the people it employs and the work that they do. Therefore,
the ‘people’ side of sustainability and resilience is a theme which could appear in both
the economic and social dimensions. It should be noted that the place of seasonal
work is a challenge for sustainability measures. SAFA (2013b) and GRI (G4) place this
aspect – employee working environment - in the social dimension. As a result it is only
touched on here to draw attention to the links between the social and economic pillars.
The chapter on social well-being will delve into this more fully. It is not represented in
the economic resilience framework.
If an enterprise wants to have motivated, skilled, capable, productive employees it will
often provide or support employees continuing education and skills training and reward
employees according to their capabilities and performance. An enterprise may wish to
have a social diversity of employees and have measures in place to ensure that it has
equity and non-discriminatory practices in the employment of men and women, and
people of differing ethnic and religious backgrounds, for example. Hence, an enterprise
may wish to keep information related to the skills, qualifications and experience of their
employees, the amount spent on training provision/skills enhancement, employee’s
productivity, and gender diversity.
Fitting a framework to the NZSD
The indicators described in this chapter fall into two groups. Firstly, financial data to do
with the economic value generated by products produced by an enterprise, the costs
and expenses associated with that production, the profit made and the efficiency of
production. Other indicators associated with the ‘business’ of an enterprise relate to
Chapter 4: Measuring the economic resilience of New Zealand’s primary-based industries
Synthesis Sustainability Framework and KPI
75
topics of interest to management, shareholders and the market in general. Secondly,
there is a group of indicators that relate to more broad economic themes –
procurement, investment, risk/vulnerability, employment and compliance.
It was decided that there are several other ways in which these indicators can be
grouped so in order to match with international frameworks it was better to go with the
SAFA (2013b) framework for Economic Resilience (shown in Error! Reference
ource not found.) for the NZSD. However, in planning the NZSD framework for this
pillar it was noted the importance placed on indicators to do with financial management
and production in many frameworks from New Zealand organisations (see Hunt,
2013a), therefore, outcomes relating to these topics were added to the NZSD and
named accordingly. The ‘Financial well-being of enterprise’ outcome incorporated the
SAFA theme of ‘Investment’ and some of the SAFA sub-themes (Figure 4.1 and Table
4.1). The original SAFA (2013b) theme has 4 sub-themes, whereas the NZSD
‘Financial well-being’ outcome has six objectives. The other SAFA themes of
‘Vulnerability’, ‘Product quality and information’ and ‘Local economy’ were kept, though
it was felt that ‘Product quality and information’ could equally have been fitted into
Governance. The ‘Vulnerability’ theme had five sub-themes in SAFA and those have
been incorporated into three objectives. Hence the NZSD framework has five
outcomes compared with SAFA’s four themes.
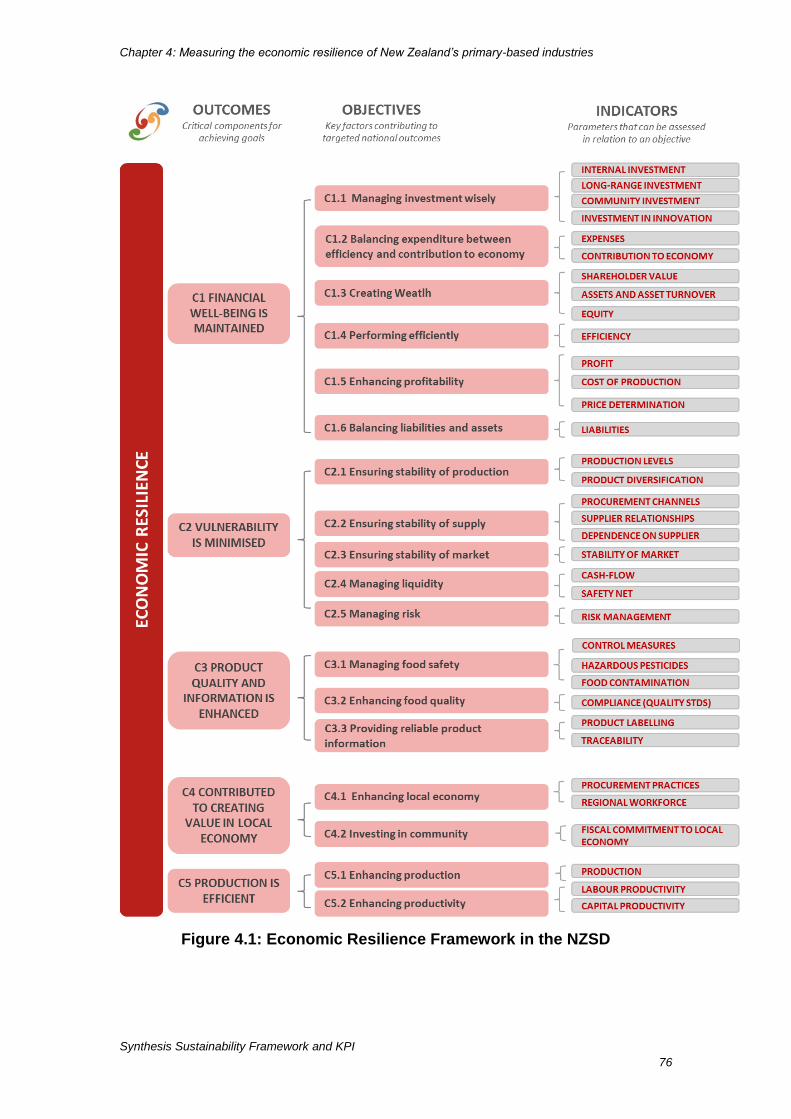
Chapter 4: Measuring the economic resilience of New Zealand’s primary-based industries
Synthesis Sustainability Framework and KPI
76
Figure 4.1: Economic Resilience Framework in the NZSD
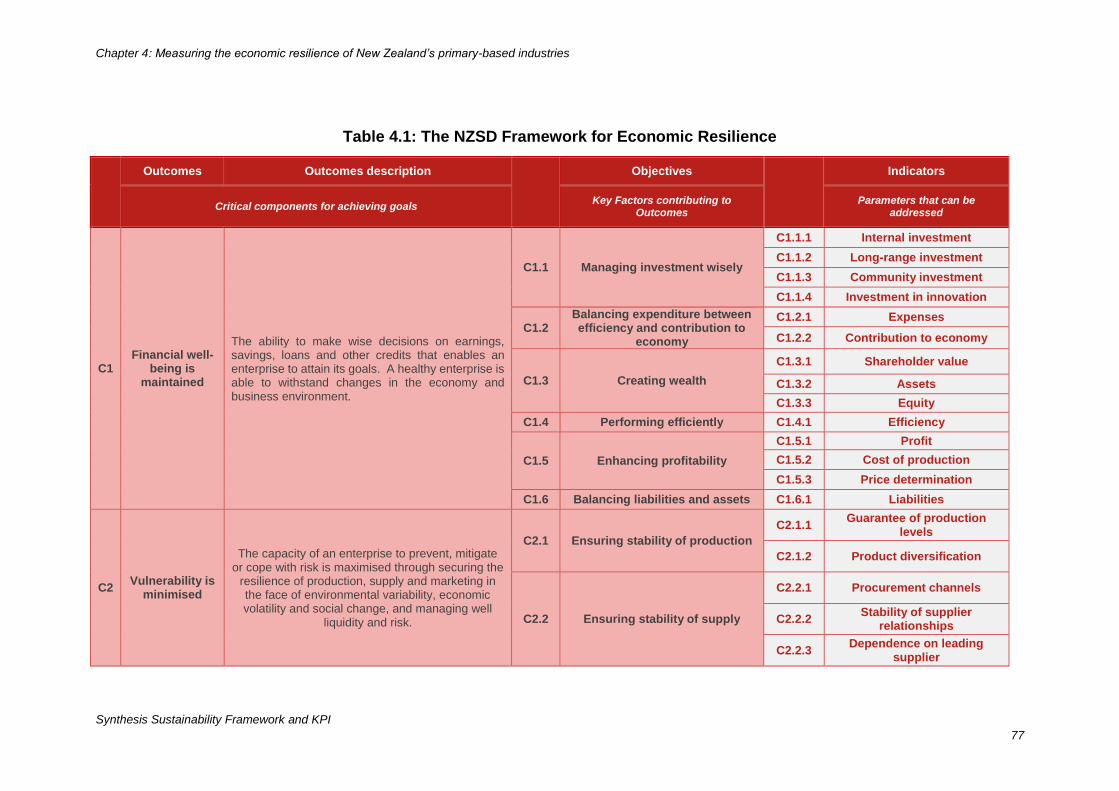
Chapter 4: Measuring the economic resilience of New Zealand’s primary-based industries
Synthesis Sustainability Framework and KPI
77
Table 4.1: The NZSD Framework for Economic Resilience
Outcomes Outcomes description
Objectives
Indicators
Critical components for achieving goals Key Factors contributing to
Outcomes Parameters that can be
addressed
C1 Financial well-
being is maintained
The ability to make wise decisions on earnings, savings, loans and other credits that enables an enterprise to attain its goals. A healthy enterprise is able to withstand changes in the economy and business environment.
C1.1 Managing investment wisely
C1.1.1 Internal investment
C1.1.2 Long-range investment
C1.1.3 Community investment
C1.1.4 Investment in innovation
C1.2 Balancing expenditure between efficiency and contribution to
economy
C1.2.1 Expenses
C1.2.2 Contribution to economy
C1.3 Creating wealth
C1.3.1 Shareholder value
C1.3.2 Assets
C1.3.3 Equity
C1.4 Performing efficiently C1.4.1 Efficiency
C1.5 Enhancing profitability
C1.5.1 Profit
C1.5.2 Cost of production
C1.5.3 Price determination
C1.6 Balancing liabilities and assets C1.6.1 Liabilities
C2 Vulnerability is
minimised
The capacity of an enterprise to prevent, mitigate or cope with risk is maximised through securing the
resilience of production, supply and marketing in the face of environmental variability, economic volatility and social change, and managing well
liquidity and risk.
C2.1 Ensuring stability of production
C2.1.1 Guarantee of production
levels
C2.1.2 Product diversification
C2.2 Ensuring stability of supply
C2.2.1 Procurement channels
C2.2.2 Stability of supplier
relationships
C2.2.3 Dependence on leading
supplier
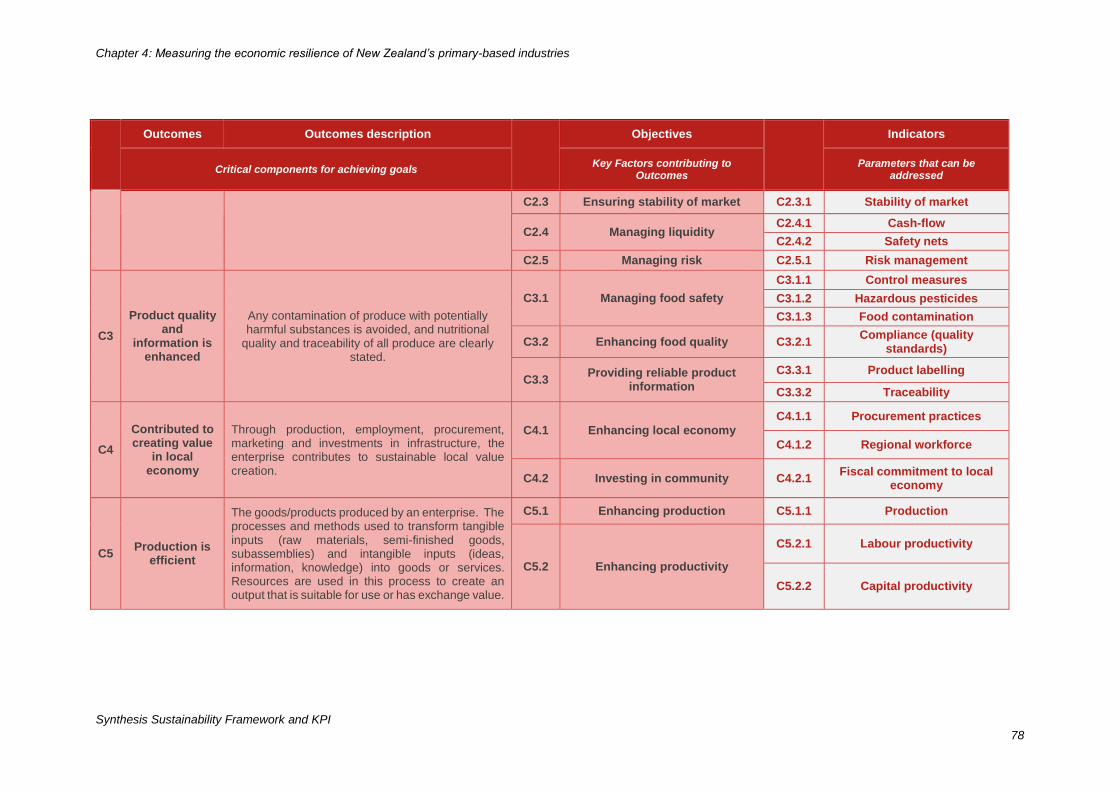
Chapter 4: Measuring the economic resilience of New Zealand’s primary-based industries
Synthesis Sustainability Framework and KPI
78
Outcomes Outcomes description
Objectives
Indicators
Critical components for achieving goals Key Factors contributing to
Outcomes Parameters that can be
addressed
C2.3 Ensuring stability of market C2.3.1 Stability of market
C2.4 Managing liquidity C2.4.1 Cash-flow
C2.4.2 Safety nets
C2.5 Managing risk C2.5.1 Risk management
C3
Product quality and
information is enhanced
Any contamination of produce with potentially harmful substances is avoided, and nutritional
quality and traceability of all produce are clearly stated.
C3.1 Managing food safety
C3.1.1 Control measures
C3.1.2 Hazardous pesticides
C3.1.3 Food contamination
C3.2 Enhancing food quality C3.2.1 Compliance (quality
standards)
C3.3 Providing reliable product
information
C3.3.1 Product labelling
C3.3.2 Traceability
C4
Contributed to creating value
in local economy
Through production, employment, procurement, marketing and investments in infrastructure, the enterprise contributes to sustainable local value creation.
C4.1 Enhancing local economy
C4.1.1 Procurement practices
C4.1.2 Regional workforce
C4.2 Investing in community C4.2.1 Fiscal commitment to local
economy
C5 Production is
efficient
The goods/products produced by an enterprise. The processes and methods used to transform tangible inputs (raw materials, semi-finished goods, subassemblies) and intangible inputs (ideas, information, knowledge) into goods or services. Resources are used in this process to create an output that is suitable for use or has exchange value.
C5.1 Enhancing production C5.1.1 Production
C5.2 Enhancing productivity
C5.2.1 Labour productivity
C5.2.2 Capital productivity
Chapter 4: Measuring the economic resilience of New Zealand’s primary-based industries
Synthesis Sustainability Framework and KPI
79
Outcome C1: Financial well-being is maintained
An enterprise will achieve financial well-being if it has the ability to make wise decisions
on earnings, savings, loans and other credits that enable it to attain its goals. A healthy
enterprise is able to withstand changes in the economy and business environment.
Financial well-being in maintained by managing investment wisely, balancing
expenditure between being efficient and the contribution such expenditure makes to
the economy, creating wealth, performing efficiently, enhancing profitability, and
balancing liabilities and assets. As part of this balancing act, the enterprise has to
manage credit – the ability to borrow money, and to purchase or sell goods with
payment delayed beyond delivery. It is important for an economy to have a steady
flow of credit.20 These objectives and their indicators are described in the next sub-
sections (Table 4.2).
Objective C1.1: Managing investment wisely
According to SAFA (2013a: 82) investment is seen from the microeconomic
perspective. “It is putting money into something … with a view to gain”. This is relevant
to sustainability because “improved production and marketing and transfer of financial
resource and knowledge are critical to ensure that economic growth leads to social
development while preserving or enhancing the natural resource base”. Where an
organisation puts its investments indicates its aims. Investments into the community
declare the wish of the organisation to be seen as being a good citizen. SAFA adds
that investment in PR does not fit into this theme!
Investment is usually measured in a quantitative fashion but SAFA (2013a) takes an
alternative approach from that used in earlier versions of SAFA (FAO, 2012a, b) and
asks for information or else a yes/no response. The contrast between these two
approaches is apparent in the indicators and their possible measures shown next.
Internal investment: To demonstrate what this might mean this indicator could
have measures such as:
Percentage of revenue that is invested into research/innovation,
capacity-building and infrastructure that improves sustainability
performance (FAO, 2012a). 21
20 http://financial-dictionary.thefreedictionary.com/credit 21 The perspective of looking at investment as a percentage of revenue seems to be a change
in thinking. However, the investment in R&D seems often to be part of a company’s annual
report and might be compared to a particular year as a baseline. For example, GE invested
$2 billion in R&D in 2012 and generated some $25 billion in revenue (8%), gave $219 million
to community and educational organisations (0.9%). See
http://www.sustainablebrands.com/news_and_views/articles/ge-generates-25-billion-
revenues-sustainability-investments
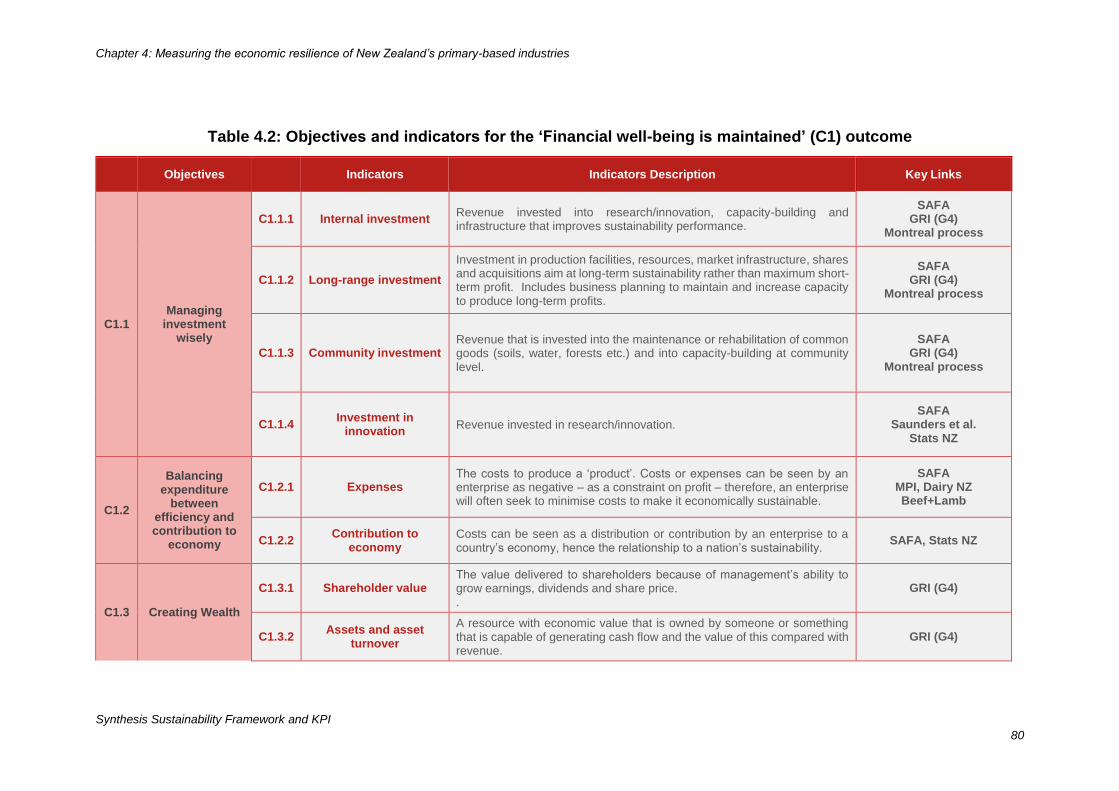
Chapter 4: Measuring the economic resilience of New Zealand’s primary-based industries
Synthesis Sustainability Framework and KPI
80
Table 4.2: Objectives and indicators for the ‘Financial well-being is maintained’ (C1) outcome
Objectives Indicators Indicators Description Key Links
C1.1 Managing
investment wisely
C1.1.1 Internal investment Revenue invested into research/innovation, capacity-building and infrastructure that improves sustainability performance.
SAFA GRI (G4)
Montreal process
C1.1.2 Long-range investment
Investment in production facilities, resources, market infrastructure, shares and acquisitions aim at long-term sustainability rather than maximum short-term profit. Includes business planning to maintain and increase capacity to produce long-term profits.
SAFA GRI (G4)
Montreal process
C1.1.3 Community investment Revenue that is invested into the maintenance or rehabilitation of common goods (soils, water, forests etc.) and into capacity-building at community level.
SAFA GRI (G4)
Montreal process
C1.1.4 Investment in
innovation Revenue invested in research/innovation.
SAFA Saunders et al.
Stats NZ
C1.2
Balancing expenditure
between efficiency and contribution to
economy
C1.2.1 Expenses The costs to produce a ‘product’. Costs or expenses can be seen by an enterprise as negative – as a constraint on profit – therefore, an enterprise will often seek to minimise costs to make it economically sustainable.
SAFA MPI, Dairy NZ Beef+Lamb
C1.2.2 Contribution to
economy Costs can be seen as a distribution or contribution by an enterprise to a country’s economy, hence the relationship to a nation’s sustainability.
SAFA, Stats NZ
C1.3 Creating Wealth
C1.3.1 Shareholder value The value delivered to shareholders because of management’s ability to grow earnings, dividends and share price. .
GRI (G4)
C1.3.2 Assets and asset
turnover
A resource with economic value that is owned by someone or something that is capable of generating cash flow and the value of this compared with revenue.
GRI (G4)
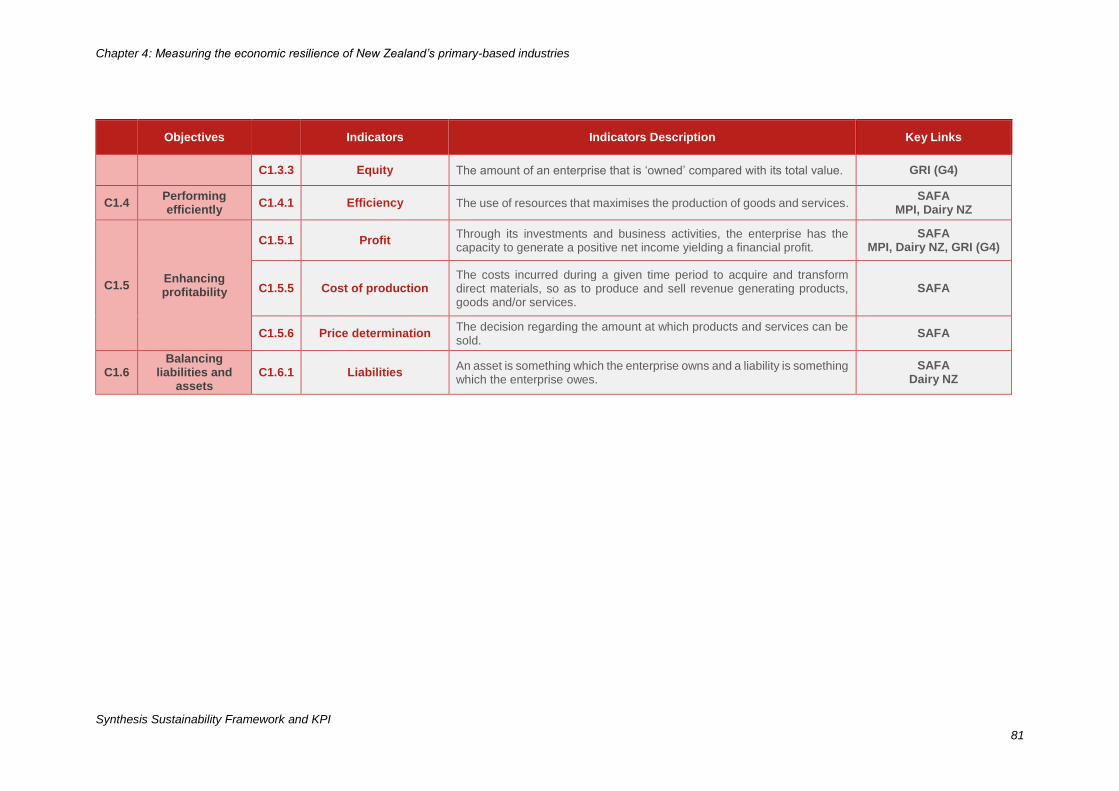
Chapter 4: Measuring the economic resilience of New Zealand’s primary-based industries
Synthesis Sustainability Framework and KPI
81
Objectives Indicators Indicators Description Key Links
C1.3.3 Equity The amount of an enterprise that is ‘owned’ compared with its total value. GRI (G4)
C1.4 Performing efficiently
C1.4.1 Efficiency The use of resources that maximises the production of goods and services. SAFA
MPI, Dairy NZ
C1.5 Enhancing profitability
C1.5.1 Profit Through its investments and business activities, the enterprise has the capacity to generate a positive net income yielding a financial profit.
SAFA MPI, Dairy NZ, GRI (G4)
C1.5.5 Cost of production The costs incurred during a given time period to acquire and transform direct materials, so as to produce and sell revenue generating products, goods and/or services.
SAFA
C1.5.6 Price determination The decision regarding the amount at which products and services can be sold.
SAFA
C1.6 Balancing
liabilities and assets
C1.6.1 Liabilities An asset is something which the enterprise owns and a liability is something which the enterprise owes.
SAFA Dairy NZ
Chapter 4: Measuring the economic resilience of New Zealand’s primary-based industries
Synthesis Sustainability Framework and KPI
82
“In which activities have you invested during the last 5 years to improve
and monitor your social, economic, environmental and governance
performance?” (SAFA, 2013a: 83).
One aspect of investment particularly associated with farm management is to do
with infrastructure. On many New Zealand farms, the investment in machinery and
plant is relatively small but on arable farms, wineries, irrigated or intensive dairy
farms the investment can be substantial. When plant and machinery are a
significant part of the total asset, it is logical to revalue them for analytical purposes.
There needs to be measures that show if the plant and machinery are serving the
business’s needs or, at the other end of the spectrum, whether there is over-
capitalisation of plant and machinery. It may be that the farm manager is enjoying
the machinery aspect of farming to the detriment of the business operation. He
may have what is known in farming circles as ‘heavy metal disease’!
Community investment: To demonstrate what this might mean this indicator
could have measures such as:
Percentage of total revenue that is invested into the maintenance or
rehabilitation of common goods (soils, water, forests etc.) and into
capacity-building at community level (FAO, 2012a).
“How have your investments contributed to address and meet
community needs, with an efficient use of resources and maintaining an
environmental balance” (SAFA, 2013a).
Long-ranging investment: To demonstrate what this might mean this indicator
could have measures such as:
Investment into production facilities, resources, market infrastructure,
shares and acquisitions aim at long-term sustainability rather than
maximum short-term profit. Includes business planning to maintain and
increase capacity to produce long-term profits.
Ratio between actual and necessary investment into maintenance of
production facilities (taking into account capital availability) (FAO,
2012a).
Do the enterprise investments aim to establish and reinforce the
conditions that maintain, generate and increase the enterprise profits in
the long-term? (SAFA, 2013a).
Do you have a business plan or an up-to-date document articulating
revenue streams, growth plan, and an operational action plan that
projects the generation of financial resources for the future? (SAFA,
2013a).
SAFA (2013c: 164) includes long-term profitability as an indicator in the long-ranging
investment theme and measures it by whether or not the organisation/business is
breaking even. In the NZSD this indicator could be a measure in the ‘profitability’
indicator because of the emphasis on this in New Zealand sustainability schemes.
Chapter 4: Measuring the economic resilience of New Zealand’s primary-based industries
Synthesis Sustainability Framework and KPI
83
Investment in innovation: According to a prominent American businessman,
“Innovation and new technology provide a counterweight to business as usual
… Innovation and new technology provide a way to improve our social progress
through smarter ways of conducting our activities”.22 Incidentally, participation
in sustainability initiatives is also seen as a driving force of innovation and as
commercially advantageous (Nidumolu et al., 2009). The expenditure on
innovation is sometimes contained within the investment theme and sometimes
regarded as a theme in itself. SAFA does not refer to it directly. Some would
call it investment in Research and Development (R & D). It could be positioned
and measured in several ways:
As part of internal investment – see above
Change of investment on innovation over time
Research and development expenditure as a proportion of
GDP/Revenue
Research and development expenditure by purpose
Personnel involved in research and development
Rate of innovation by type.
Saunders at al. (2007c) propose that measurements of innovation include:
Number of new products trialled or sold
Number of new processes or techniques attempted or adopted
Use of ICT
Investment capital/change in capital.
Objective C1.2: Balancing expenditure between efficiency and
contribution to economy
The costs to produce a ‘product’ also should be measured. Costs or expenses can be
seen by an enterprise as negative – as a constraint on profit – therefore, an enterprise
will often seek to minimise costs to make it economically sustainable. However, this
attitude can be reframed so that costs are seen as a distribution or contribution by an
enterprise to a country’s economy, hence the relationship to a nation’s sustainability.
For example, indicators could be:
Expenses/costs (economic value distributed).
Direct contribution to New Zealand’s economy through wages, salaries,
benefits, taxes, NZ-based supplier contracts.
Costs/expenses can be broken into many different components that may be of
particular interest. It is important for enterprises to find out where their expenditure is
and what proportion one expense is in relation to another or to the total expenditure.
Expenses/costs which are commonly measured in an agricultural enterprise are:
22 From an interview between the president of the World Council for Sustainable Development
and the Dow Corning vice president. See:
http://www.dowcorning.com/content/publishedlit/solarticles/How_Innovation_Supports_Sustai
nability.pdf
Chapter 4: Measuring the economic resilience of New Zealand’s primary-based industries
Synthesis Sustainability Framework and KPI
84
Wages (divided up depending on industry)
Animal health
Weed and Pest
Fertiliser
Lime
Vehicles and fuel
Electricity
Feed and grazing
Cash crop
Repairs and Maintenance (R&M)
Insurance & ACC
Rates
Interest
Rent.
In the particular example of dairy farming, expenses are broadly to do with (details
available in Hunt, 2013b):
Stock
Feed
Supplements
Grazing and Run-off
Other – fertiliser, nitrogen, irrigation, re-grassing, weed & pest, vehicles, fuel,
R&M, freight
Overheads
Objective C1.3: Creating wealth
Wealth creation is one of the key goals for most primary based businesses. It provides
a pathway into property ownership and managing succession between generations.
According to Shadbolt and Gardner (2005: 155), “Equity is a measure of wealth, the
capacity of a business to withstand adversity and to cope with risk”. Wealth creation
requires a range of skills including strategic management, planning, financial
management and successful relationships with people. The value of an enterprise -
the total wealth of a company can be measured in many ways and usually several of
these variables are used:
Total assets at close.
Liabilities at close.
Total equity.
Growth in equity.
Growth from profit.
Growth from capital.
Debt to Assets.
Indicators
Shareholder value. Shareholders in a business usually invest to get a return,
to make some money from their money. A sustainable business needs to be
Chapter 4: Measuring the economic resilience of New Zealand’s primary-based industries
Synthesis Sustainability Framework and KPI
85
attractive to investors. Shareholder value is the value delivered to shareholders
because of management’s ability to grow earnings, dividends and share price.23
(This may be irrelevant to some enterprises in the industries involved in a NZSD
case study because many will be owner operated.) There are many ways of
measuring the value of an enterprise and therefore of the wealth it is creating.
One is Economic Value Added (EVA), which is a measure of capital on which
the IIRC value creating model is based (see Hunt, 2013: 29). It is centred on
inputs, value adding activities and outputs. Another measure is Return on
Capital (ROC) – the return to an enterprise on the capital value of the
enterprise, or, return on invested capital - the return to an enterprise or an
investor on the amount the enterprise or investor has invested. The actual
return to an investor is the dividend – the sum of money paid regularly by a
company to its shareholders out of its profits. This may not be applicable to
the small family businesses involved in the NZSD but it will be applicable to the
larger organisations.
Assets – a resource with economic value that is owned by someone or
something that is capable of generating cash flow. Apart from its importance
in itself it is also used to calculate other useful data such as Return on Assets
(ROA) which measures how profitable an enterprise is relative to its total assets
and asset turnover, a comparison between an enterprise’s revenue and its
assets, which is a useful way for companies to find out whether they are
growing revenue in proportion to sales.
Equity – the amount of an enterprise that is ‘owned’ compared with its total
value (the difference between the two being the amount that is mortgaged or
borrowed – the liability). When measured, this indicator can be used to produce
other useful information such as return on equity which, like return on capital,
shows the return a business is making on what it owns.24
Objective C1.4: Performing efficiently
An efficient enterprise is one that maximises the production of goods and services from
its resources. In other words, it makes the most it can from what it has.
Indicator
Efficiency - efficiency can be measured by the proportion of income that has
been spent on producing an enterprise’s products. If this is too high then the
business will not be sustainable as it will go into debt, or else not produce
enough to provide a living for those dependent on it.
23 http://www.investopedia.com/terms/s/shareholder-value.asp 24 If the return on equity averages 10-15% then that is good. A value higher than this is likely
to be unsustainable. See
http://beginnersinvest.about.com/od/incomestatementanalysis/a/understanding-return-on-
equity.htm.
Chapter 4: Measuring the economic resilience of New Zealand’s primary-based industries
Synthesis Sustainability Framework and KPI
86
Objective C1.5: Enhancing profitability
Through its investments and business activities, the enterprise has the capacity to
generate a positive net income yielding a financial profit. In other words, profitability is
the degree to which the enterprise is breaking even, or it is what is left over from the
total revenue when the costs have been accounted for. Hence the profit is dependent
on the cost of production and the price paid for the products produced by the enterprise
in the marketplace.
All businesses measure their success in terms of their profit. This measures the
sustainability of a business because it is out of this profit the business may provide for
its future investment and encourage its shareholders to continue their support. In a
family agribusiness it is the profit that provides income for the family to live.
The usual measure of profitability is the simple rate of return or the payback period of
an investment. According to a farm accountancy firm, “the more relevant factors driving
profitability are scale of the farm business, land productivity (operating surplus divided
by land value), labour productivity, crop/livestock productivity and marketing
relationships” (Boyce Charted Accountants, 2000, as cited in Wilson et al., 2005: 49).
If the NZSD project ventures into enterprise analysis a useful indicator could be Net
Present Value (NPV) which uses the productivity concept and is therefore a more
accurate KPI of profitability. It not only considers cash flows over the entire life of the
project but also the time value of money. The NPV for an investment is determined by
discounting the cash flows for each year then summing across all the years. For
example, you would use it for an irrigation development or to evaluate whether to
change a grape variety across a block.
Indicators:
Profit (economic value retained) –can be measured in many different ways. For example there is: profit before tax (e.g., Farm Profit Before Tax (FPBT)), Earnings Before Interest and Tax (EBIT), economic surplus (e.g., Economic Farm Surplus (EFS)), gross margin, profit after tax, the operating profit margin which shows how efficiently management uses labour and raw material in the production process, and net income – an enterprise’s total earnings or profit, which is an important measure of how profitable an enterprise is over time and is often referred to as “the bottom line”.
Cost of production - an economic or accounting indicator that refers to the costs
incurred … during a given time period to acquire and transform direct materials,
so as to produce and sell revenue generating products, good and/or services
(SAFA, 2013c: 171).
Price determination - the decision regarding the amount at which products and
services can be sold (SAFA, 2013c: 174). This clearly has to be balanced
between what the market will pay, what the products cost to be produced and
what profit the enterprise wants or needs to make.
Chapter 4: Measuring the economic resilience of New Zealand’s primary-based industries
Synthesis Sustainability Framework and KPI
87
Objective C1.6: Balancing liabilities and assets
Obviously a major part of financial management is balancing the liabilities of an
enterprise with its assets. That is balancing what an enterprise owns and what it owes.
Note that assets are also part of the ‘create wealth’ outcome and would be used again
here to balance against liabilities.
Outcome C2: Vulnerability in minimised
The capacity of an enterprise to “prevent, mitigate or cope with risk” is maximised
(SAFA, 2013b: 155) through securing the resilience of production, supply and
marketing in the face of environmental variability, economic volatility and social change
(SAFA, 2013a: 85), and managing well liquidity and risk.
According to SAFA (2013b: 155) “vulnerability is the degree of exposure to risk
(hazard, shock) and uncertainty, and the capacity of households or individuals to
prevent, mitigate or cope with risk”. Even so, the SAFA rationale includes enterprises
as well as households and individuals.
One of the major risks of a business enterprise is the stability of the context in which it
operates. It is dependent on its supplies of the resource from which its product is
produced, the stability of the market it supplies and the market conditions, and the
supply and capability of its employees (see next section). An enterprise also has to
manage its cash flow and have strategies in place to manage risk. Hence objectives
of the ‘vulnerability is minimised’ outcome are: stability of production, supply and
market, and manage liquidity and risk (Table 4.3).
Objective C2.1: Ensuring stability of production
The quantity and quality of production of an enterprise’s products can be under threat
from environmental, social and economic shocks (SAFA, 2013a: 85). There are two
aspects to this. The first is to do with having mechanisms in place that guarantee the
resilience of production levels and the second is to have a process in place to make
an enterprise more resilient through producing a greater diversity of products by
expanding its product range by modifying existing products, or adding new products.
Stability of production can be indicated by:
Guarantee of production levels: What are the actions and mechanisms that the
enterprise has put in place to reduce the negative impact of the risks that could
affect meeting the target volume of production and quality standards? (SAFA,
2013a: 85).
Product diversification - dependence on a single species or variety of crop, fish,
tree, livestock; diversity of revenue sources.
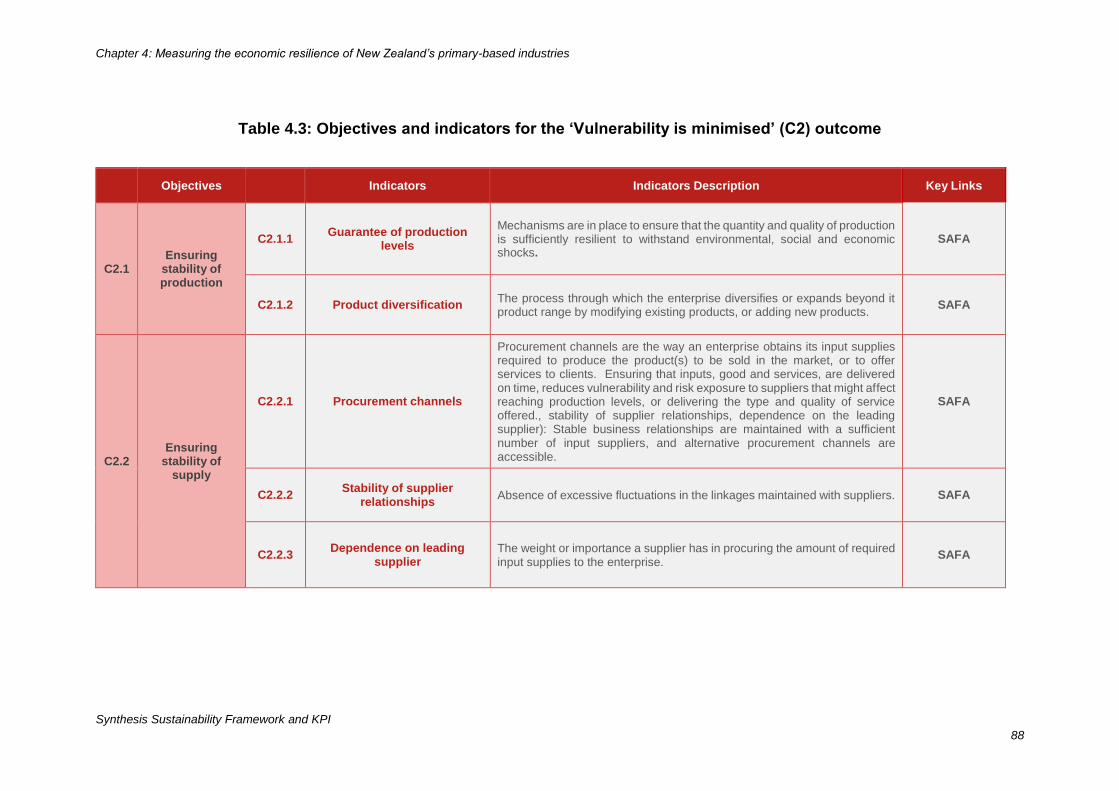
Chapter 4: Measuring the economic resilience of New Zealand’s primary-based industries
Synthesis Sustainability Framework and KPI
88
Table 4.3: Objectives and indicators for the ‘Vulnerability is minimised’ (C2) outcome
Objectives Indicators Indicators Description Key Links
C2.1 Ensuring
stability of production
C2.1.1 Guarantee of production
levels
Mechanisms are in place to ensure that the quantity and quality of production is sufficiently resilient to withstand environmental, social and economic shocks.
SAFA
C2.1.2 Product diversification The process through which the enterprise diversifies or expands beyond it product range by modifying existing products, or adding new products.
SAFA
C2.2 Ensuring
stability of supply
C2.2.1 Procurement channels
Procurement channels are the way an enterprise obtains its input supplies required to produce the product(s) to be sold in the market, or to offer services to clients. Ensuring that inputs, good and services, are delivered on time, reduces vulnerability and risk exposure to suppliers that might affect reaching production levels, or delivering the type and quality of service offered., stability of supplier relationships, dependence on the leading supplier): Stable business relationships are maintained with a sufficient number of input suppliers, and alternative procurement channels are accessible.
SAFA
C2.2.2 Stability of supplier
relationships Absence of excessive fluctuations in the linkages maintained with suppliers. SAFA
C2.2.3 Dependence on leading
supplier The weight or importance a supplier has in procuring the amount of required input supplies to the enterprise.
SAFA
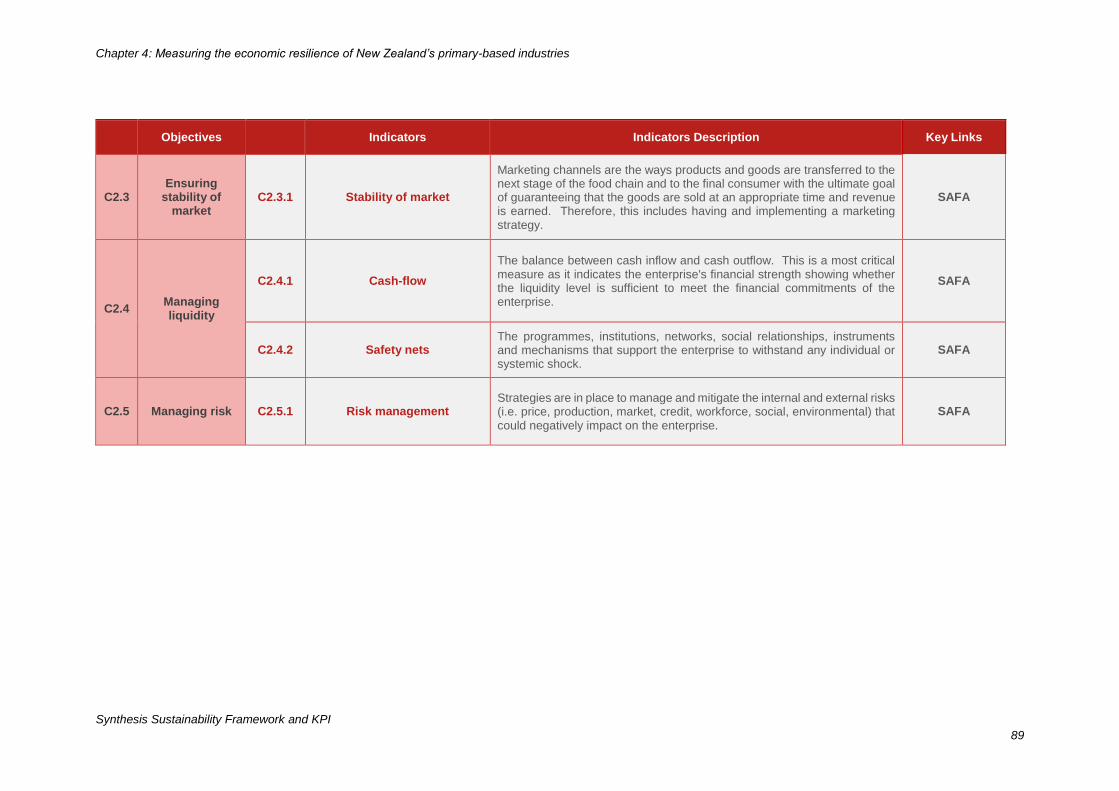
Chapter 4: Measuring the economic resilience of New Zealand’s primary-based industries
Synthesis Sustainability Framework and KPI
89
Objectives Indicators Indicators Description Key Links
C2.3 Ensuring
stability of market
C2.3.1 Stability of market
Marketing channels are the ways products and goods are transferred to the next stage of the food chain and to the final consumer with the ultimate goal of guaranteeing that the goods are sold at an appropriate time and revenue is earned. Therefore, this includes having and implementing a marketing strategy.
SAFA
C2.4 Managing liquidity
C2.4.1 Cash-flow
The balance between cash inflow and cash outflow. This is a most critical measure as it indicates the enterprise's financial strength showing whether the liquidity level is sufficient to meet the financial commitments of the enterprise.
SAFA
C2.4.2 Safety nets The programmes, institutions, networks, social relationships, instruments and mechanisms that support the enterprise to withstand any individual or systemic shock.
SAFA
C2.5 Managing risk C2.5.1 Risk management Strategies are in place to manage and mitigate the internal and external risks (i.e. price, production, market, credit, workforce, social, environmental) that could negatively impact on the enterprise.
SAFA
Chapter 4: Measuring the economic resilience of New Zealand’s primary-based industries
Synthesis Sustainability Framework and KPI
90
Objective C2.2: Ensuring stability of supply
The SAFA definition of the ‘stability of supply’ is that “stable business relationships are
maintained with a sufficient number of input suppliers, and alternative procurement
channels are accessible” (SAFA, 2013a: 85).
Indicators are:
Procurement channels: the way an enterprise obtains its input supplies
required to produce the product(s) to be sold in the market, or to offer services
to clients. Ensuring that inputs, good and services, are delivered on time,
reduces vulnerability and risk exposure to suppliers that might affect and
enterprise reaching production levels, or delivering the type and quality of
service offered. SAFA (2013a: 85) suggests measuring this by asking the
question: “Which actions and mechanisms have you put in place to reduce the
risk [of] input supply shortages, including maintaining ongoing business
relationships with suppliers?”
Stability of supplier relationships: the presence or absence of excessive
fluctuations in the linkages maintained with suppliers. This could be related to
past problems. SAFA (2013a: 85) suggests asking the question: “What share
of supplier contracts/business relationship has remained ongoing over the last
5 years?”
Dependence on the leading supplier: places importance on having multiple
ways available to procure input supplies to the enterprise. SAFA (2013a: 85)
suggests the question, “What share of your inputs comes from the leading
supplier?” as a way of measuring this. Contractual arrangements could also
be rated by duration, conditions, volume.
Objective C2.3: Ensuring stability of market
Marketing channels are the ways products and goods are transferred to the next stage
of the food chain and to the final consumer with the ultimate goal of guaranteeing that
the goods are sold at an appropriate time and revenue is earned. Therefore this
includes an enterprise having and implementing a marketing strategy. SAFA is also
concerned about the stability of the market for the products produced by an enterprise.
This is expressed as: “Stable business relationships are maintained with a sufficient
number of buyers, income structure is diversified, and alternative marketing channels
are accessible” (SAFA, 2013a: 85).
The indicator ‘stability of the market’ could be measured by the dependence on the
biggest source of income, say the percentage of the market share for five years. This
may be irrelevant in the NZSD industry case studies, except at the highest level – such
as ZESPRI. It is a measure of risk or vulnerability, but it could be of more interest to
compare the change over five years. As part of market stability many businesses
survey their customers to measure ‘customer satisfaction’ by measuring the
percentage of satisfied customers out of total customers. It would be hoped that market
share would be increasing or being maintained over the years.
Chapter 4: Measuring the economic resilience of New Zealand’s primary-based industries
Synthesis Sustainability Framework and KPI
91
Objective C2.3: Managing liquidity
An enterprise is also at risk when it does not have sufficient liquidity to pay for its costs
in a timely way. “Financial liquidity, access to credits and insurance (formal and
informal) against economic, environmental and social risk [which] enable the
enterprise to withstand shortfalls in payment” (SAFA, 2013a: 85). Hence, managing
liquidity is a component of financial sustainability.
Liquidity in a business means having sufficient cash available to meet commitments
as they arise and ensure that over a year cash outflows are not greater than cash
inflows. The higher the returns, the greater the level of debt a property or enterprise
might carry. The KPI measurements in farm management for this are: change in
working capital and cash surplus/deficit. Cash flow budgeting and comparing actual
income and expenditure with that budgeted are the two most commonly used tools to
maintain liquidity. The ratio of current assets to current liabilities is used to measure
liquidity, as well as operating costs as a percentage of sales after purchases (Shadbolt
and Gardner, 2005: 153).
Using the dairy sector as an example, “the average dairy farm has increased its
production of milk solids by 65 per cent over the last 10 years, while term liabilities
have increased three-fold from $0.9 million to $2.8 million over the same period”
(DairyNZ, 2013a). Therefore, term liabilities have increased considerably faster than
milk production for the average farm, increasing liquidity pressure on many farms.
Indicators
Cash flow - the balance between cash inflow and cash outflow. This is most
critical as it indicates the enterprise's financial strength showing whether the
liquidity level is sufficient to meet the financial commitments of the enterprise.
Cashflow turnover, the ability of an enterprise to generate cash from its sales,
may be useful as a measure.
Safety nets - the programmes, institutions, networks, social relationships,
instruments and mechanisms that support the enterprise to withstand any
individual or systemic shock.
Other variables that also measure vulnerability are:
Existence of stocks of inputs, food etc. that are sufficient to withstand crop
shortfalls and supply bottlenecks.
Pasture as a percentage of feed consumed (dairy).
Proximity to consumers (Saunders et al., 2007a).
Many other indicators mentioned elsewhere in this chapter also could be used as
indicators of vulnerability and risk, such as:
Employment - fluctuation rate of personnel (annual percentage of total
personnel leaving the enterprise).
Operating profit margin.
Solvency – equity.
Efficiency.
Chapter 4: Measuring the economic resilience of New Zealand’s primary-based industries
Synthesis Sustainability Framework and KPI
92
Objective C2.5: Managing risk
The NZSD and other such tools are concerned that an enterprise actively manages
risk. Part of this is to have a risk management plan. According to SAFA (2013c: 192),
“A risk adaptation and mitigation plan is a structured set of actions and mechanisms to
implement to prevent, manage and reduce the extent to which the enterprise is
exposed to internal and external risk(s), its (Their) likelihood of occurrence, and to
minimise its (their) possible negative impact”. The risks that an enterprise faces
include “price, production, market and credit risk, unstable employment relations,
unavailability of workforce, conflicts with the community and other stakeholders,
natural disasters, disease and climate change” (SAFA 2013c: 192). There are external
and internal risks.
Indicators
Risk management – the strategies are in place to manage and mitigate the
internal and external risks that could negatively impact on the enterprise.
An example of a measurement of risk that is commonly used is the debt to equity ratio
(risk ratio or leverage ratio), which shows the proportion of a company’s activities that
are funded by debt or equity.25
Outcome C3: Product quality and information is enhanced
Any contamination of produce with potentially harmful substances is avoided, and
nutritional quality and traceability of all produce are clearly stated.
According to SAFA (2013a: 86), “all people have the right to expect the products they
consume, in particular their food, to be safe and suitable for consumption (FAO/WHO,
2003)”. Similarly, “producers, processors, retailers and consumers have the right to be
informed by their suppliers about all the attributes of a product relevant for its
utilization”.
Product quality is defined as “the totality of features and characteristics of a product
that bear on its ability to satisfy stated or implied needs” (ISO as quoted in SAFA,
2013a: 86). As product safety in New Zealand is covered by legislation it has been
placed in the Good Governance dimension of the NZSD. Legislation covers
compliance with indicators to do with:
Product information.
Traceability.
Food safety.
Food quality - quality management.
25 A low ratio of about 0.30 is generally considered good, 2 is considered “worrisome”. See
http://www.wikihow.com/Analyze-Debt-to-Equity-Ratio
Chapter 4: Measuring the economic resilience of New Zealand’s primary-based industries
Synthesis Sustainability Framework and KPI
93
Membership of certification schemes.
Food quality can also have quantitative measures to do with:
Quality grades of products.
Productivity.
Waste.
Returns as a proportion of total sales or total productivity.
The NZSD has the objectives manage food safety, enhance food quality and provide
reliable product information with the expectation that these objectives will achieve the
outcome of enhancing product quality and information provided with those products
(Table 4.4).
Objective C3.1: Managing food safety
Food safety is well managed when “food hazards are systematically controlled and any
contamination of food with potentially harmful substances is avoided” (SAFA, 2013b:
166). For an enterprise to manage the safety of the products they produce they need
to account for how they will control the possibilities for food contamination throughout
their production and delivery chain and how successful these controls have been.
Indicators are:
Control measures - actions taken to reduce chance of exposure to food
hazards.
Hazardous pesticides - highly hazardous pesticides should be avoided in all
the stages of the production, storage, processing, transport and distribution of
an enterprise's products.
Food contamination - cases in which adulteration of food has been reported
due to negligence, accident or involuntary misconduct.
Objective C3.2: Enhancing food quality
Similarly an enterprise is expected to meet certain standards of quality for its products.
SAFA (2013b: 168) defines it more explicitly as: “the quality of food products meets
the highest nutritional standards applicable to the respective type of product”. Hence,
the usual indicators are associated with compliance with these standards and an
enterprise hopefully achieves even higher standards than those required.
Indicator
Compliance with quality standards - the set of rules defined to guarantee
product quality (and to meet the highest nutritional standards respective to the
type of product).
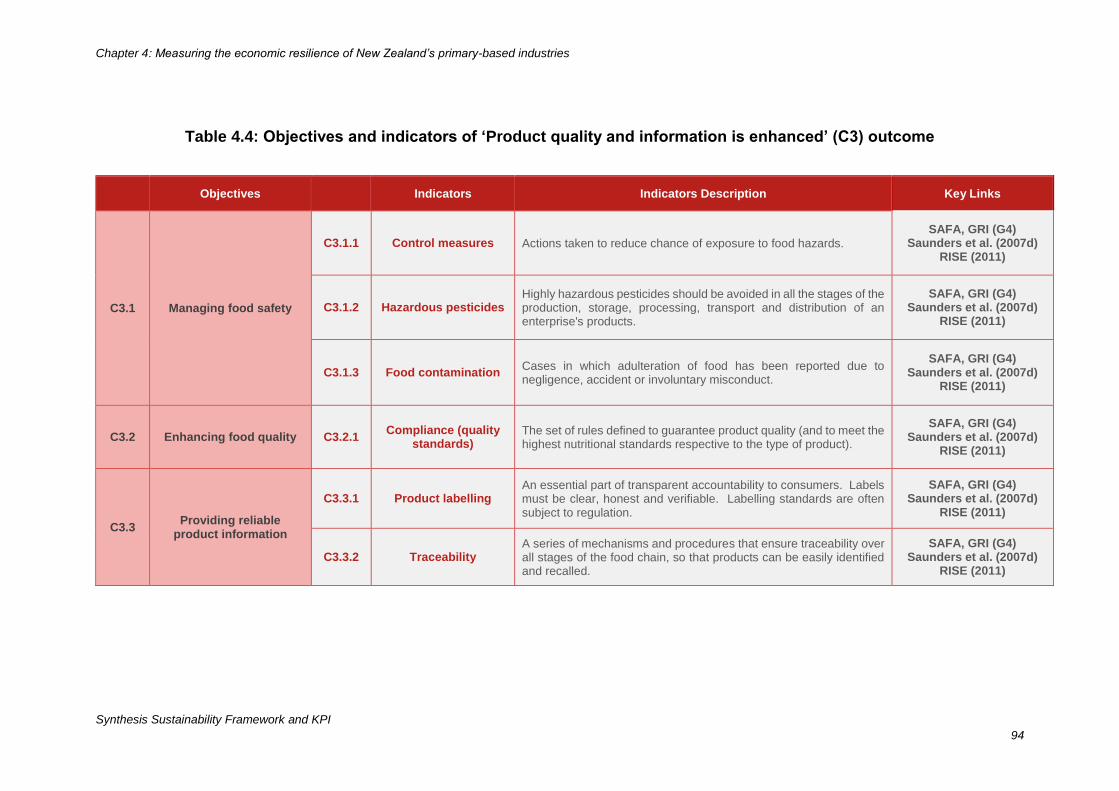
Chapter 4: Measuring the economic resilience of New Zealand’s primary-based industries
Synthesis Sustainability Framework and KPI
94
Table 4.4: Objectives and indicators of ‘Product quality and information is enhanced’ (C3) outcome
Objectives Indicators Indicators Description Key Links
C3.1 Managing food safety
C3.1.1 Control measures Actions taken to reduce chance of exposure to food hazards.
SAFA, GRI (G4) Saunders et al. (2007d)
RISE (2011)
C3.1.2 Hazardous pesticides Highly hazardous pesticides should be avoided in all the stages of the production, storage, processing, transport and distribution of an enterprise's products.
SAFA, GRI (G4) Saunders et al. (2007d)
RISE (2011)
C3.1.3 Food contamination Cases in which adulteration of food has been reported due to negligence, accident or involuntary misconduct.
SAFA, GRI (G4) Saunders et al. (2007d)
RISE (2011)
C3.2 Enhancing food quality C3.2.1 Compliance (quality
standards) The set of rules defined to guarantee product quality (and to meet the highest nutritional standards respective to the type of product).
SAFA, GRI (G4) Saunders et al. (2007d)
RISE (2011)
C3.3 Providing reliable
product information
C3.3.1 Product labelling An essential part of transparent accountability to consumers. Labels must be clear, honest and verifiable. Labelling standards are often subject to regulation.
SAFA, GRI (G4) Saunders et al. (2007d)
RISE (2011)
C3.3.2 Traceability A series of mechanisms and procedures that ensure traceability over all stages of the food chain, so that products can be easily identified and recalled.
SAFA, GRI (G4) Saunders et al. (2007d)
RISE (2011)
Chapter 4: Measuring the economic resilience of New Zealand’s primary-based industries
Synthesis Sustainability Framework and KPI
95
Objective C3.3: Providing reliable product information
Any products produced by an enterprise should have labels that provide consumers
with trustworthy information about qualities of the product and assurance of its
traceability across the production and supply chain.
Indicators
Product labelling - an essential part of transparent accountability to consumers.
Labels must be clear, honest and verifiable. Labelling standards are often
subject to regulation.
Traceability - a series of mechanisms and procedures ensuring traceability over
all stages of the food chain, so products can be easily identified and recalled.
Outcome C4: Contributed to creating value in local economy
Through production, employment, procurement, marketing and investments in
infrastructure, the enterprise contributes to sustainable local value creation. It can do
this employing local people whose pay will then promote greater business activity
where they live, and by sourcing as much of its raw products and things required in
their production within the local community as is economically feasible. By paying such
things as taxes and rates and enterprise also contributes to the local economy where
these monies will be spent.
The objectives which aim to achieve this are enhance local economy and invest in the
community (Table 4.5).
Objective C4.1: Enhancing local economy
An enterprise can enhance the local economy by contributing to local economic
development (SAFA, 2013b: 172).
There has been an increasing emphasis on procurement practices in the recent history
of sustainability measurement with a growing concern about the need for businesses
to support both the local communities of which they are part and the nation as a whole.
This may well be part of an international push to ‘buy local’. SAFA, for example, has
decided to use a micro-economic approach “that focuses on the enterprise and the
local community resilience” rather than “the macro-economic issue of growth rates”
(SAFA, 2013a: 57). The most recent versions of the SAFA (2013b) and GRI (G4)
(2013a, b) guidelines have given greater prominence to this aspect of sustainability
than they had in their previous versions (FAO, 2012a; GRI, 2011a, 2006). A report,
‘Procurement matters: the economic impact of local suppliers’, compares two
companies which circulate 19 per cent and 12 per cent respectively, of their revenue
in the local economy, with the result that the first company had a 64 per cent greater
local impact than the other.26
26 Retrieved from:
www.civiceconomics.com/app/download/.../Procurement+Matters.pdf
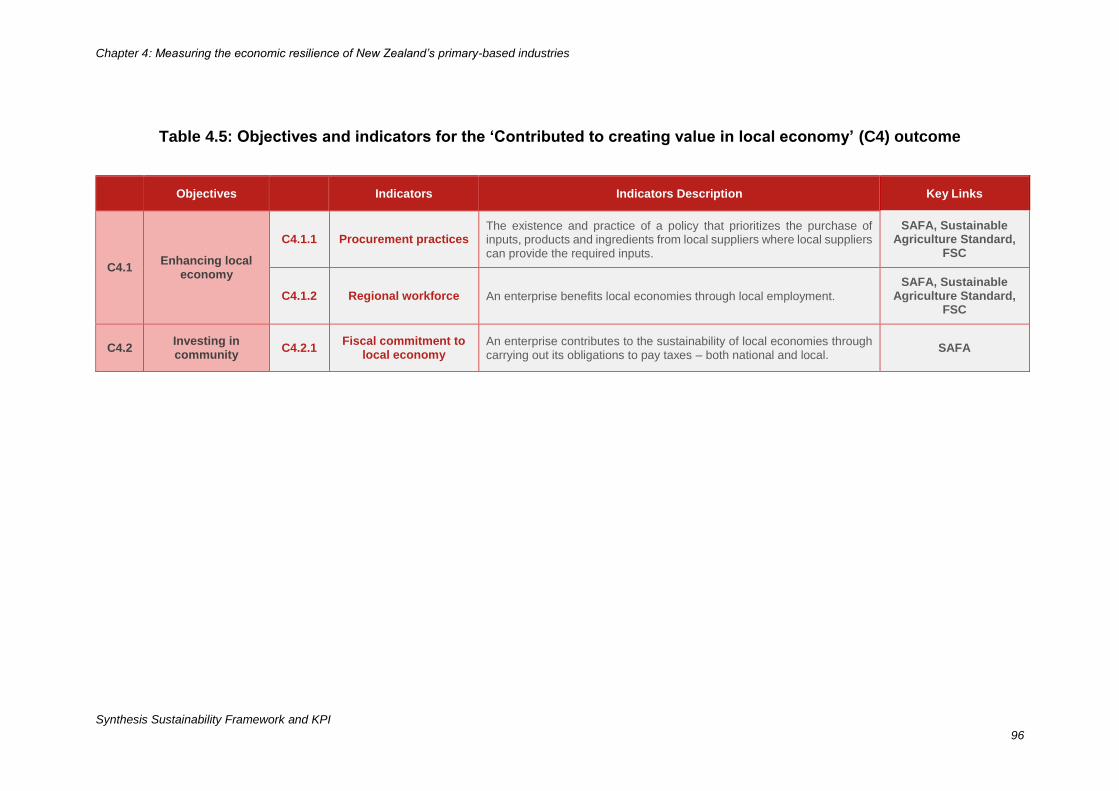
Chapter 4: Measuring the economic resilience of New Zealand’s primary-based industries
Synthesis Sustainability Framework and KPI
96
Table 4.5: Objectives and indicators for the ‘Contributed to creating value in local economy’ (C4) outcome
Objectives Indicators Indicators Description Key Links
C4.1 Enhancing local
economy
C4.1.1 Procurement practices The existence and practice of a policy that prioritizes the purchase of inputs, products and ingredients from local suppliers where local suppliers can provide the required inputs.
SAFA, Sustainable Agriculture Standard,
FSC
C4.1.2 Regional workforce An enterprise benefits local economies through local employment.
SAFA, Sustainable Agriculture Standard,
FSC
C4.2 Investing in community
C4.2.1 Fiscal commitment to
local economy An enterprise contributes to the sustainability of local economies through carrying out its obligations to pay taxes – both national and local.
SAFA
Chapter 4: Measuring the economic resilience of New Zealand’s primary-based industries
Synthesis Sustainability Framework and KPI
97
However, this seems a double-edged sword for sectors that are likely to use the NZSD,
as New Zealand relies so heavily on exporting. Therefore, before local procurement
is agreed upon there would need to be an analysis of comparative costs of
procurement between local suppliers and others for input sourcing.
Indicators
Procurement practices – which could be measured by finding the expenditure
on local supplies at significant locations of operations (GRI, 2013a, b). When
procurement is mentioned as an indicator an enterprise’s needs to supply
geographical definitions for ‘local’ and for ‘significant locations of operation’.
Such definitions could be standardised in some way for a New Zealand context.
SAFA, on the other hand, suggests a compliance measure: Has “the enterprise
purchased its inputs/ingredients/products from local suppliers when equal or
similar conditions exist in comparison to non-local suppliers” (SAFA 2013a:
299)? This could be more applicable to the NZ situation described above. In
other words, this way of articulating the measure requires the existence and
practice of a policy that “prioritizes the purchase of inputs, products and
ingredients from local suppliers … where local suppliers can provide the
required inputs …” (SAFA 2013a: 299).
Regional workforce – enterprises benefit local economies through local
employment.
Enhancing the local economy may be an aspirational goal or it may be something
primary industries do anyway and so it could be a good point for them to emphasise.
Rather than having quantitative measures related to the involvement of an enterprise
in the community in which it operates, there may be associated policies that are
checked for compliance, such as:
Local community involvement/development - the enterprise must have policies
and procedures for prioritizing the hiring and training of a local labour force and
for contracting and acquiring local services and products.
Objective C4.2: Investing in community
An enterprises contributes to the sustainability of local economies through carrying out
its obligation to pay taxes – both national and local (through rates, for example). This
can be seen as satisfying a fiscal commitment and responsibility to the community in
which an enterprise operates. Earlier in this chapter, an enterprise’s investment in the
community was also described in other more direct ways.
Indicator
Fiscal commitment to local economy - through its payment of taxes the
enterprise contributes to the sustainable development of a community.
Chapter 4: Measuring the economic resilience of New Zealand’s primary-based industries
Synthesis Sustainability Framework and KPI
98
Outcome C5: Production is efficient
Production efficiency measures whether the economy is producing as much as
possible without wasting precious resources ... Because resources are limited,
being able to make products efficiently allows for higher levels of production. If the
economy can't make more of a good without sacrificing the production of another,
then a maximum level of production has been reached.27
Production can be defined as the processes and methods used to transform tangible
inputs (raw materials, semi-finished goods, subassemblies) and intangible inputs
(ideas, information, knowledge) into goods or services. Resources are used in this
process to create an output that is suitable for use or has exchange value.28
The ‘production is efficient’ outcome has the objectives ‘enhancing production’ and
‘enhancing productivity’ (Table 4.6).
Objective C5.1: Enhancing production
In the primary production sector a performance indicator is “a measure of physical
and/or financial whole farm or individual enterprise performance. Physical performance
indicators usually relate to production outcomes or yields, or physical inputs. Physical
scale and performance, for example, total areas, grazed area, cropped area, improved
pasture area, stocking rate and rainfall, are clearly focused on the production system
and may not provide much information on the longer-term farm sustainability” (Wilson
et al., 2005). However, they are important as they provide context on the scale of the
operation and the biophysical resources (climate, contour, location, physical
characteristics of the soil and altitude) (Martin et al., 2005: 11) and such resources will
need to be accounted for as context variables in the NZSD.
Indicator
Production - physical outputs / production volumes.
Objective C5.2: Enhancing productivity
“Productivity is defined as the output of valued product per unit of resource input either
in physical or monetary terms” (Kelly and Bywater 2005: 69). The Oxford dictionary29
defines productivity as the “effectiveness of productive effort, especially in industry, as
measured in terms of the rate of output per unit of input”. In other words, productivity
is a measure of physical farm efficiency or how well a business converts input
resources into production and could be described by the equation:
Productivity = physical outputs (production) - physical Inputs (resources used)
(DairyNZ Economic Survey, 2011-12: 15).
27 http://www.investopedia.com/terms/p/production_efficiency.asp 28 http://www.businessdictionary.com/definition/production.html 29 http://oxforddictionaries.com/definition/english/productivity
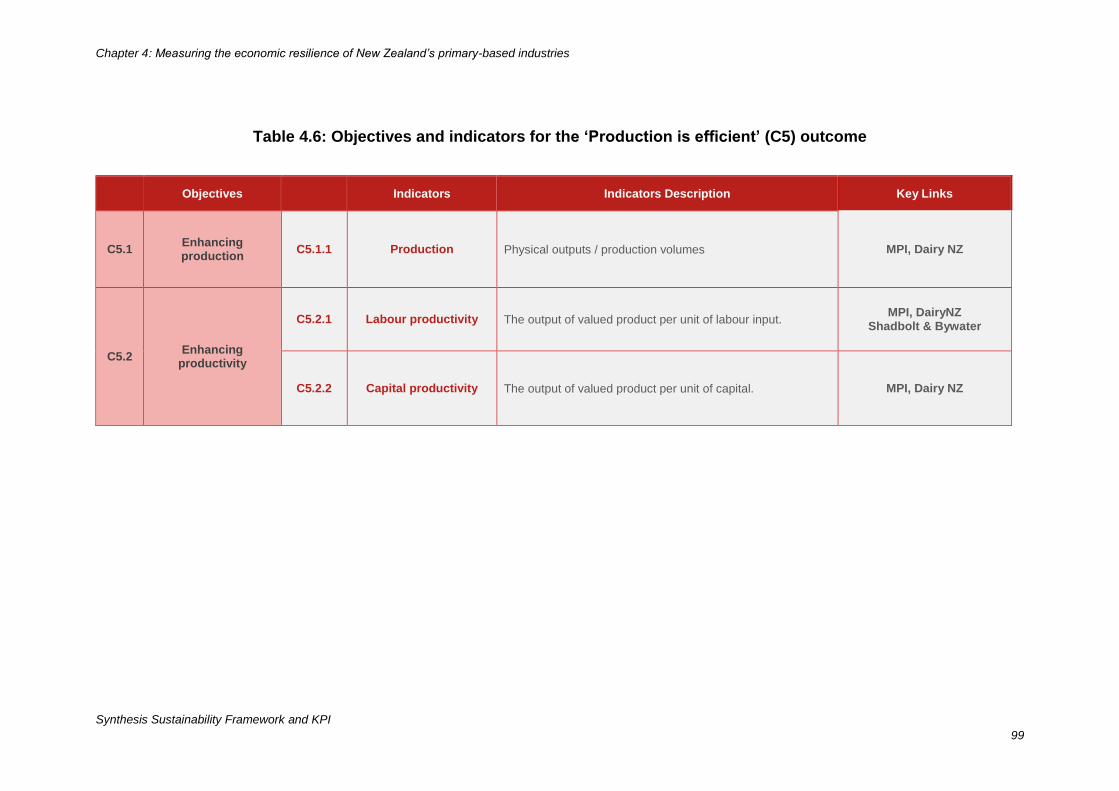
Chapter 4: Measuring the economic resilience of New Zealand’s primary-based industries
Synthesis Sustainability Framework and KPI
99
Table 4.6: Objectives and indicators for the ‘Production is efficient’ (C5) outcome
Objectives Indicators Indicators Description Key Links
C5.1 Enhancing production
C5.1.1 Production Physical outputs / production volumes MPI, Dairy NZ
C5.2 Enhancing
productivity
C5.2.1 Labour productivity The output of valued product per unit of labour input. MPI, DairyNZ
Shadbolt & Bywater
C5.2.2 Capital productivity The output of valued product per unit of capital. MPI, Dairy NZ
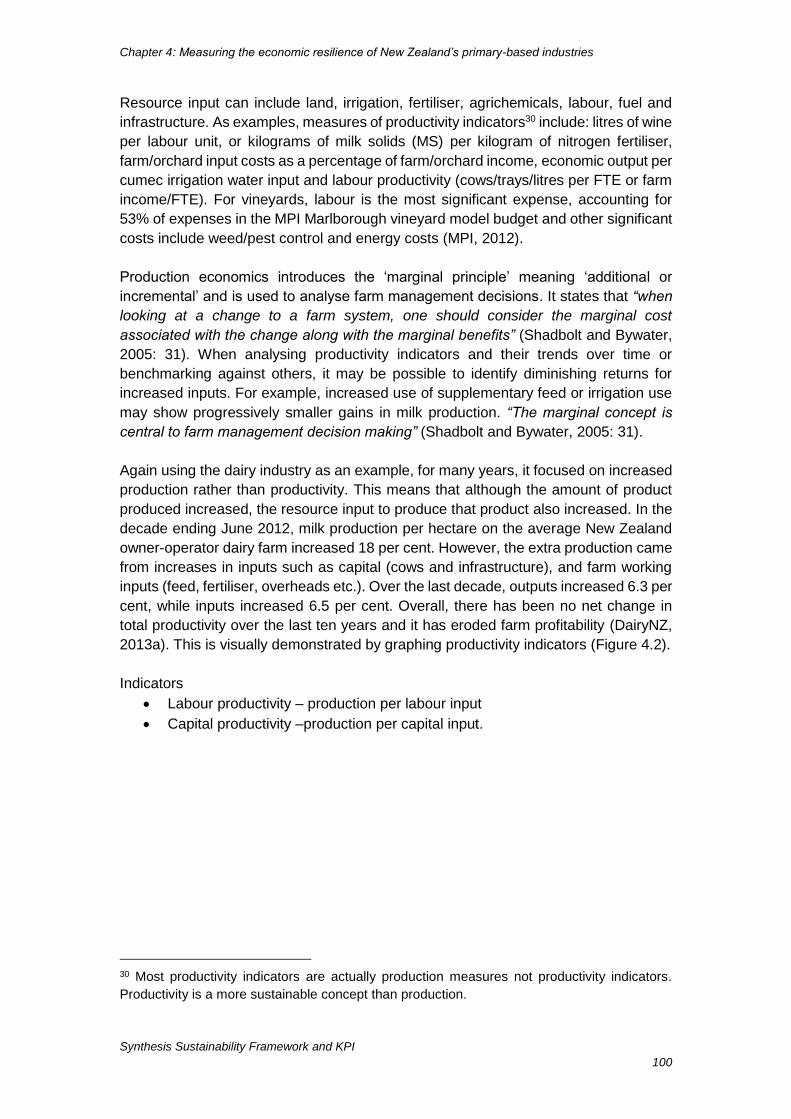
Chapter 4: Measuring the economic resilience of New Zealand’s primary-based industries
Synthesis Sustainability Framework and KPI
100
Resource input can include land, irrigation, fertiliser, agrichemicals, labour, fuel and
infrastructure. As examples, measures of productivity indicators30 include: litres of wine
per labour unit, or kilograms of milk solids (MS) per kilogram of nitrogen fertiliser,
farm/orchard input costs as a percentage of farm/orchard income, economic output per
cumec irrigation water input and labour productivity (cows/trays/litres per FTE or farm
income/FTE). For vineyards, labour is the most significant expense, accounting for
53% of expenses in the MPI Marlborough vineyard model budget and other significant
costs include weed/pest control and energy costs (MPI, 2012).
Production economics introduces the ‘marginal principle’ meaning ‘additional or
incremental’ and is used to analyse farm management decisions. It states that “when
looking at a change to a farm system, one should consider the marginal cost
associated with the change along with the marginal benefits” (Shadbolt and Bywater,
2005: 31). When analysing productivity indicators and their trends over time or
benchmarking against others, it may be possible to identify diminishing returns for
increased inputs. For example, increased use of supplementary feed or irrigation use
may show progressively smaller gains in milk production. “The marginal concept is
central to farm management decision making” (Shadbolt and Bywater, 2005: 31).
Again using the dairy industry as an example, for many years, it focused on increased
production rather than productivity. This means that although the amount of product
produced increased, the resource input to produce that product also increased. In the
decade ending June 2012, milk production per hectare on the average New Zealand
owner-operator dairy farm increased 18 per cent. However, the extra production came
from increases in inputs such as capital (cows and infrastructure), and farm working
inputs (feed, fertiliser, overheads etc.). Over the last decade, outputs increased 6.3 per
cent, while inputs increased 6.5 per cent. Overall, there has been no net change in
total productivity over the last ten years and it has eroded farm profitability (DairyNZ,
2013a). This is visually demonstrated by graphing productivity indicators (Figure 4.2).
Indicators
Labour productivity – production per labour input
Capital productivity –production per capital input.
30 Most productivity indicators are actually production measures not productivity indicators.
Productivity is a more sustainable concept than production.
Chapter 4: Measuring the economic resilience of New Zealand’s primary-based industries
Synthesis Sustainability Framework and KPI
101
Figure 4.2: Dairy farm output, input and productivity movements
Source: DairyNZ Economic Survey 2011-12 (DairyNZ, 2013a)
Conclusion
Indicators associated with economic resilience that should be used in the NZSD fall into two
broad categories – those that provide context and those that will lead to measures of
sustainability. In the latter group there is a division between those indicators that measure
compliance with audit schemes, policies, regulations etc. and indicators that have measures
that go beyond compliance. In the second group, the indicators can be further grouped to focus
on different areas of economic resilience.
The most basic group is that of indicators which consist of financial data to do with the economic
value generated by products produced by an enterprise, the costs and expenses associated
with that production and the profit made. (The NZSD should only need to collect two of these
indicators to calculate the other one.) Each of these indicators can be calculated in different
ways to suit the industry or sector developing its own NZSD. Another basic financial
sustainability indicator is the enterprise’s efficiency which can also be calculated in many ways.
Outside this basic financial data there are other financial variables that are of interest to
management, shareholders and the market in general. Indicators that arise from an examination
of different expenditure items can also be of interest and worthy of investigation if an enterprise
wished to further examine its sustainability.
Chapter 4: Measuring the economic resilience of New Zealand’s primary-based industries
Synthesis Sustainability Framework and KPI
102
Other groupings of indicators relate to economic resilience beyond the collection of basic
financial data. These groupings are practices related to:
Procurement – management of the input resources
Investment including investment in innovation – management of the profit resource
Risk or vulnerability – management of threats to the enterprise
Employment – management of employees as a resource.
Compliance with regulations and policies associated with working conditions, product
safety and quality, business planning and community engagement.
The indicators described in this chapter fit quite readily into a framework (Table 4.1) which is
slightly amended from the SAFA (2013b) framework (Error! Reference source not found.2.4),
ow including two new outcomes - ‘Financial well-being is maintained ’ (which actually
incorporates some of the original SAFA theme of ‘Investment’) and ‘Production is efficient’. Both
of these outcomes are widely used in existing New Zealand frameworks.
Chapter 5: Measuring to secure agro-environmental integrity in New Zealand
Synthesis Sustainability Framework and KPI
103
Agro-environmental integrity - Sustains natural capital, enhances natural heritage values
and meets global environmental obligations.
Agro-environmental integrity is defined as the state which sustains the full potential of land and
its natural capital, ecosystem processes and services to efficiently and indefinitely produce
healthy, high quality food and fibre while enhancing natural heritage values and meeting global
environmental change obligations.
Agro-environmental integrity: a national outcome for New Zealand’s
production lands
The first step in developing an effective environmental monitoring design is to clearly define the
goals and vision of the framework in order to identify and target the priority components (Yoccoz
et al., 2001; Jones et al., 2013a). New Zealand currently lacks environmental goals for production
landscapes. Hence we begin by briefly reviewing the special features of New Zealand’s ecology
and agriculture in order to define an appropriate concept of ‘agro-environmental integrity’
(MacLeod and Moller, 2013).
Meeting the needs of New Zealand’s agro-ecosystems
Definitions for agro-environmental integrity, and the design of a monitoring framework to attain it,
must be locally relevant if they are to be used to inspire and assess local environmental care.
This means that the target outcomes, objectives and indicators should closely match local
ecological, social and economic risks and benefits while simultaneously meeting international
opportunities and threats.31
Several special features of New Zealand ecology should be considered, particularly the need to:
safeguard threatened indigenous species
control introduced small mammals for reducing disease risk and conservation of native
biota
maintain biosecurity for production and conservation systems
enrich for agriculture relatively new soils derived recently from forests
prevent erosion
31 See Moller and MacLeod (2013) for a discussion of the value of mapping these links to Responses,
Pressures, State and Benefits (RPSB) models.
Chapter 5: Measuring to secure agro-environmental
integrity in New Zealand
Chapter 5: Measuring to secure agro-environmental integrity in New Zealand
Synthesis Sustainability Framework and KPI
104
restore indigenous habitat (especially rare ecosystems, wetlands and woody vegetation)
manage keystone introduced species that provide ecosystem services
build motivation and capacity for implementing environmental care amongst farmers,
industry and communities, especially in low-lying fertile landscapes.
In addition, special features of New Zealand’s society and economy need to be recognised if
these ecological challenges and opportunities are to be achieved, especially the:
highly intensive form of agriculture that is already very efficient
reliance on imports of large quantities of ‘ecological subsidies’ (fertilisers, supplementary
feeds, cheap energy sources)
overt subsidisation or payment for ecosystem services from public funds
little regulation of what happens (or doesn’t happen) on private land
inclusion of Māori dimensions of sustainable land management governance, goals and
knowledge.
Ecological integrity within natural ecosystems
Recognition of the distinctive and important indigenous biodiversity in New Zealand has a long
history and the goals for its protection were most recently articulated in the New Zealand
Biodiversity Strategy. In an attempt to operationalise these goals, Lee et al. (2005) used the
concept of ‘ecological integrity’, which requires that the ‘full potential of indigenous biotic and
abiotic features and natural processes are functioning in sustainable communities, habitats, and
landscapes’. It encompasses all levels and components of biodiversity, and enable assessment
at multiple scales, up to and including the whole of New Zealand. At larger scales, ecological
integrity will be achieved ‘when all the indigenous organisms (native plants, animals, fungi, etc.)
typical of a region are present, together with the key processes that sustain functional
relationships between all these components, across all of the ecosystems represented in
New Zealand ‘ (Lee et al. 2005).
The ‘ecological integrity’ concept is the basis for a nationally coordinated system currently being
developed and implemented for biodiversity monitoring and reporting by the Department of
Conservation and the regional councils (Lee et al., 2005; Allen et al., 2009; Lee and Allen, 2011;
MacLeod et al., 2012a, c; MacLeod and Moller, 2013). The close alignment of the NZSD to this
local system is valuable because it will facilitate cross-scale linkages and integrated management
throughout New Zealand. It also provides an opportunity for the NZSD to better support national
environmental policy, state of environment reporting and coordinated advocacy for sustainable
land management.
Integration to achieve agro-environmental integrity within production landscapes
Ecological integrity is deconstructed into three primary components – environmental
representation, species occupancy and indigenous dominance, to allow for the complex character
of biodiversity. It is defined as a goal mainly for ‘natural’ or ‘semi-natural’ environments on public
Chapter 5: Measuring to secure agro-environmental integrity in New Zealand
Synthesis Sustainability Framework and KPI
105
conservation land (Lee et al., 2005)32 and as such, it is not directly and wholly transferable to
guide an environmental monitoring framework for New Zealand’s production landscapes where
introduced species (e.g., grass and fodder crops, fruit, grapes, cattle and sheep) underpin primary
production of food and fibre. Nevertheless, if production landscapes are going to contribute to
conserving and restoring New Zealand’s heritage at local, regional, national and global levels,
many of the elements of ecological integrity promoted (Lee et al., 2005) must be integrated with
delivery of ‘provisioning services’ (see Moller and MacLeod, 2013, Box 3).
The need for integrating environmental care with efficient and productive agriculture has been
well recognised in New Zealand for decades in both international and national policy instruments
(Table 2.5). For example, key targets of the Convention on Biological Diversity (2011) include:
“improve the status of biodiversity by safeguarding ecosystems, species and genetic diversity”
and “areas under agriculture … are to be managed sustainably, ensuring conservation of
biodiversity”. Similarly, the New Zealand Biodiversity Strategy (2000) states a need for
New Zealand to “sustain the more modified ecosystems in production and urban environment’’
(MfE and DOC, 2000).
Our framework is designed to align with the Sustainability Assessment of Food and Agriculture
systems (SAFA) protocols launched by the United Nations’ Food & Agriculture Organisation
(FAO, 2012a). The SAFA framework is the most comprehensive, practical and flexible of the 14
international frameworks and sustainability tools that we reviewed for the environmental pillar
(Table 2.5) to ensure that the NZSD framework and indicators complement and match
international aspirations (Moller and MacLeod, 2013). The SAFA protocols collect most of the
environmental components of sustainable food and fibre production under an ‘Environmental
Integrity’ dimension (FAO, 2012). There is no formal definition of the ‘integrity’ of ecosystems in
the SAFA (2013b) context, but it focuses on biophysical elements of agro-ecosystems and the
continuance of ecological flows between them.33 The water and biodiversity themes are the main
intersections with New Zealand’s ecological integrity concept, but most of SAFA’s monitoring is
directed towards the provisioning, regulating and supporting components of ecosystems services,
and thereby primarily underwriting human needs and values. Natural ecosystems and protection
of threatened species are included in most food and fibre production standards (UNEP-WCMC,
2011). However, there is relatively little attention to restoration or protection of highly modified
fragments or restoration within production landscapes and none of agricultural standards that
prevent habitat conversion for agriculture.
32 Lee et al. (2005: 99) emphasised that biodiversity on private land was increasingly important, but that
their framework “at certain levels has been designed specifically to meet DOC’s requirements as derived
from the Statement of Intent”. 33 We speculate that the word ‘integrity’ has been incorporated by SAFA (2013b) partly because of its
resonance with the values and ethical imperatives for farmers, foresters and fishers to behave kindly to the
environment. The wider context of the whole SAFA programme aims to define and monitor their actions, so
the primary focus is on linkages between governance, social, economic and ecological dimensions.
Chapter 5: Measuring to secure agro-environmental integrity in New Zealand
Synthesis Sustainability Framework and KPI
106
An additional focus on agro-biodiversity, including common and introduced biota
Much of the thrust of the Convention on Biological Diversity (CBD) stemmed from ‘Agenda 21’, a
policy statement upheld by the 1992 Rio Conference. Chapter 14 of Agenda 21 concerns
Agricultural Biodiversity, which it defines as:
“…the variability among living organisms associated with cultivating crops and rearing
animals and the ecological complexes of which they are part; this includes diversity
within species, between species, and of ecosystems. The unique feature of
agricultural biological diversity is the emphasis on its utility to human beings”
(UNEP/CBD/COP/3/14, 1996: 2).
Introduced plants and animals provide most of the food and fibre produced by New Zealand’s
agriculture, and key services to keep the ecosystem functioning (e.g., honey bees for crop
pollination and earthworms for soil quality and function). As agro-environmental integrity must
include care for a whole suite of animals and plants not normally considered in ecological integrity,
the NZSD will monitor and guide management of introduced biodiversity for its own sake, and will
not have a goal to reduce ‘exotic dominance’ in the landscape as a whole. The NZSD also
recognises that New Zealand’s agro-ecosystems may be contingent on the retention of both
introduced and indigenous species on production lands (MfE and DOC, 2000; Moller et al.,
2008a). Today’s seemingly redundant species may be tomorrow’s agricultural biodiversity, and
affect the abundance of agricultural biodiversity through a myriad of ‘indirect ecological
interactions’ within the food web (Yodzis, 1988), and contribute to important ecological flows
among reserves, the surrounding matrix of production land, margins of production landscapes
and large reserves in national parks.
Land-sparing and land-sharing: integrating biodiversity conservation and
agriculture
The need for better integration of production and conservation outcomes was highlighted by
New Zealand’s Biodiversity Strategy. Two major strategies are promulgated to combat agricultural
impacts on biodiversity: ‘land-sparing’ and ‘land-sharing’ (Green et al., 2005; Fischer et al., 2008;
Phalan et al., 2011; Balmford et al., 2012).
Land-sparing is based on the presumption that by intensively developing some areas, other areas
can be spared from any development and biota sustained within those reserved areas (Rowarth
2008; Didham et al. 2012; Lindenmayer et al. 2012). New Zealand has already developed most
of the fertile lowland areas and hence, at a national and even a landscape scale, remaining land
available for agricultural development is predominantly marginal land and is already well
represented in public conservation lands (Craig et al., 2013).
Conversely, land-sharing suggests that sympathetic land management (also called wildlife-
friendly farming) can result in high biodiversity in ecosystems that are also tuned to efficient and
intensive production; this approach is widely advocated for and applied in international
Chapter 5: Measuring to secure agro-environmental integrity in New Zealand
Synthesis Sustainability Framework and KPI
107
environmental certification schemes. Land-sharing is obviously the main strategy left for
New Zealand at a broad scale now that most of the indigenous forest ecosystems have been
removed to make way for farming (Meadows et al., 2008; Moller et al., 2008a, b; Norton and Reid,
2013). It is also a matter of practical reality that New Zealand’s Resource Management Act
severely constrains removal of large tracts of indigenous vegetation, so the predominating
philosophy for New Zealand farmers and conservation advocates must now be land-sharing or
restoration of unfarmed habitats back into the production landscapes.
The NZSD design and emphasis sits squarely on the premise that both land-sharing and land-
sparing will be needed within farm boundaries if intensive agriculture is to be ecologically
sustainable in New Zealand. This will require a matrix of ecological refuges and production spaces
that function collectively to support agro-ecosystems and natural habitats at landscape levels.
Indicators should target land cover and connectivity metrics within farms to track progress and
consequences for all sustainability indicators (including production, profit, animal welfare and
biodiversity) but not neglect to measure biodiversity, especially but not exclusively agro-
biodiversity, within the production spaces of the farms as well.
Agricultural intensification: a mounting threat to agro-ecosystem integrity?
Recent reviews have highlighted an accelerating rate of agricultural intensification in New Zealand
that may threaten both the environment and the sustainability of food production (PCE, 2004;
MacLeod and Moller, 2006). Understanding the associated extent and nature of environmental
impacts is one of the most pressing issues facing New Zealand’s public, agricultural sectors,
government agencies and conservation scientists. Although farming in New Zealand is based on
introduced species, it still relies on the services provided by natural capital, which it can also
impact, to sustain production: “Agricultural activities can generate a range of environmental
benefits. These include aesthetic value, recreation, water accumulation and supply, nutrient
recycling and fixation, soil formation, wildlife protection and flood control, and carbon
sequestration by trees and soil. However, major changes in farming practices in the past forty
years have brought new pressures to bear on natural resources” (PCE, 2004 quoting OECD).
Definition of agro-environmental integrity
We propose that the following definition of agro-environmental integrity as the overarching
outcome of environmental monitoring within the NZSDs:
Agro-environmental integrity is defined as the state which sustains the full potential of
land and its natural capital, ecosystem processes and services to efficiently and
indefinitely produce healthy, high quality food and fibre while enhancing natural
heritage values and meeting global environmental change obligations.
It recognises the need for an integrated management approach implemented across multiple
spatial scales and governance jurisdictions to maintain livelihoods, social well-being and restore
Chapter 5: Measuring to secure agro-environmental integrity in New Zealand
Synthesis Sustainability Framework and KPI
108
ecological integrity in New Zealand. The NZSD ‘agro-environmental integrity’ framework will,
therefore, be structured around achieving four outcomes (Fig. 5.1; MacLeod and Moller, 2013):
Natural capital of production landscapes is maintained
Resilience of New Zealand agriculture is secured for future productive use
Production landscapes contribute to national ‘natural heritage’ goals
New Zealand meets global environmental change obligations.
Environmental outcomes for the NZSD
Four environmental outcomes in the NZSD will result from achieving 10 objectives. Twenty
indicators will be used to monitor progress towards those objectives (Fig. 5.1; MacLeod and
Moller, 2013), some of which may be supported by multiple measures. All the indicators included
in the framework are important for agro-environmental integrity and driving sustainable practice.
However, we recognise that implementation must be phased depending on what is required to
obtain the necessary information and industry priorities (MacLeod and Moller, 2013).
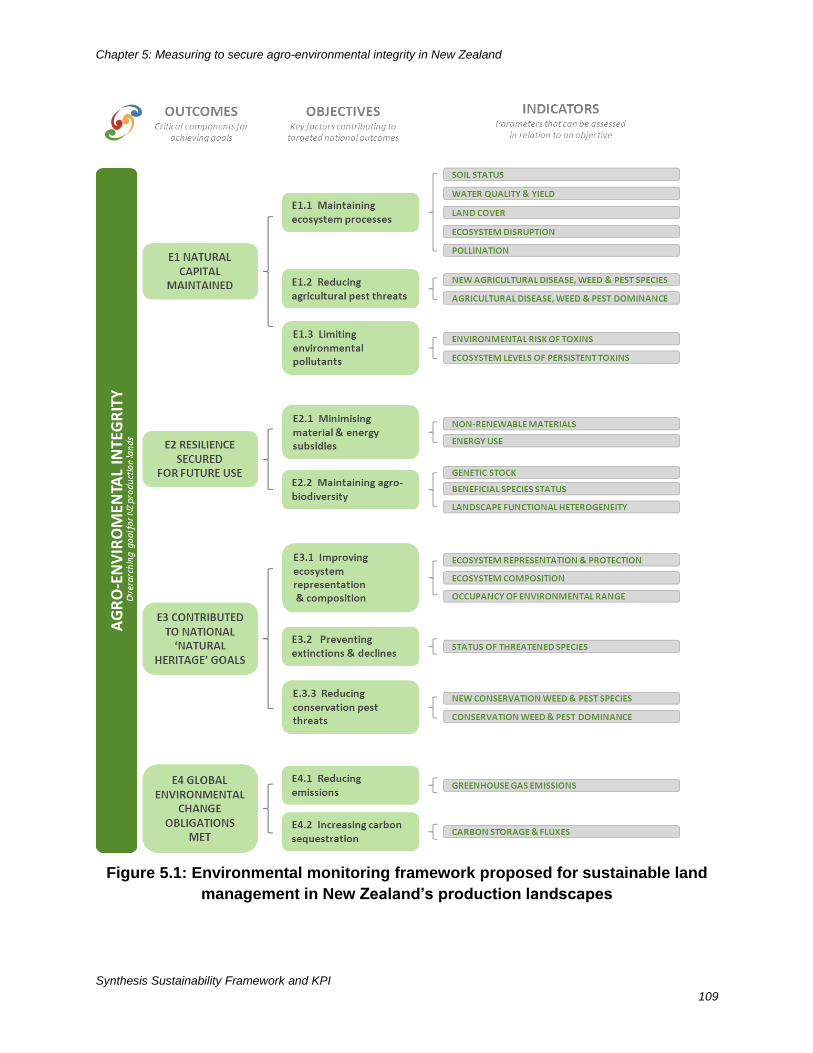
Chapter 5: Measuring to secure agro-environmental integrity in New Zealand
Synthesis Sustainability Framework and KPI
109
Figure 5.1: Environmental monitoring framework proposed for sustainable land
management in New Zealand’s production landscapes
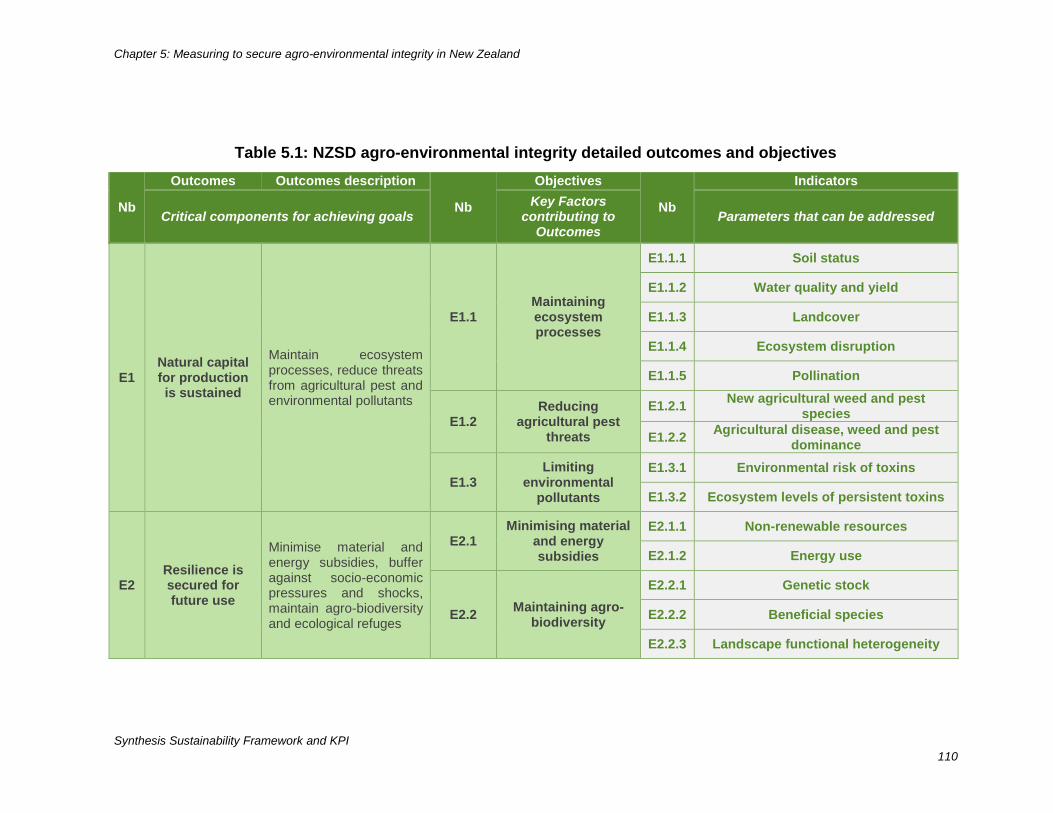
Chapter 5: Measuring to secure agro-environmental integrity in New Zealand
Synthesis Sustainability Framework and KPI
110
Table 5.1: NZSD agro-environmental integrity detailed outcomes and objectives
Nb
Outcomes Outcomes description
Nb
Objectives
Nb
Indicators
Critical components for achieving goals Key Factors
contributing to Outcomes
Parameters that can be addressed
E1 Natural capital for production is sustained
Maintain ecosystem processes, reduce threats from agricultural pest and environmental pollutants
E1.1 Maintaining ecosystem processes
E1.1.1 Soil status
E1.1.2 Water quality and yield
E1.1.3 Landcover
E1.1.4 Ecosystem disruption
E1.1.5 Pollination
E1.2 Reducing
agricultural pest threats
E1.2.1 New agricultural weed and pest
species
E1.2.2 Agricultural disease, weed and pest
dominance
E1.3 Limiting
environmental pollutants
E1.3.1 Environmental risk of toxins
E1.3.2 Ecosystem levels of persistent toxins
E2 Resilience is secured for future use
Minimise material and energy subsidies, buffer against socio-economic pressures and shocks, maintain agro-biodiversity and ecological refuges
E2.1 Minimising material
and energy subsidies
E2.1.1 Non-renewable resources
E2.1.2 Energy use
E2.2 Maintaining agro-
biodiversity
E2.2.1 Genetic stock
E2.2.2 Beneficial species
E2.2.3 Landscape functional heterogeneity
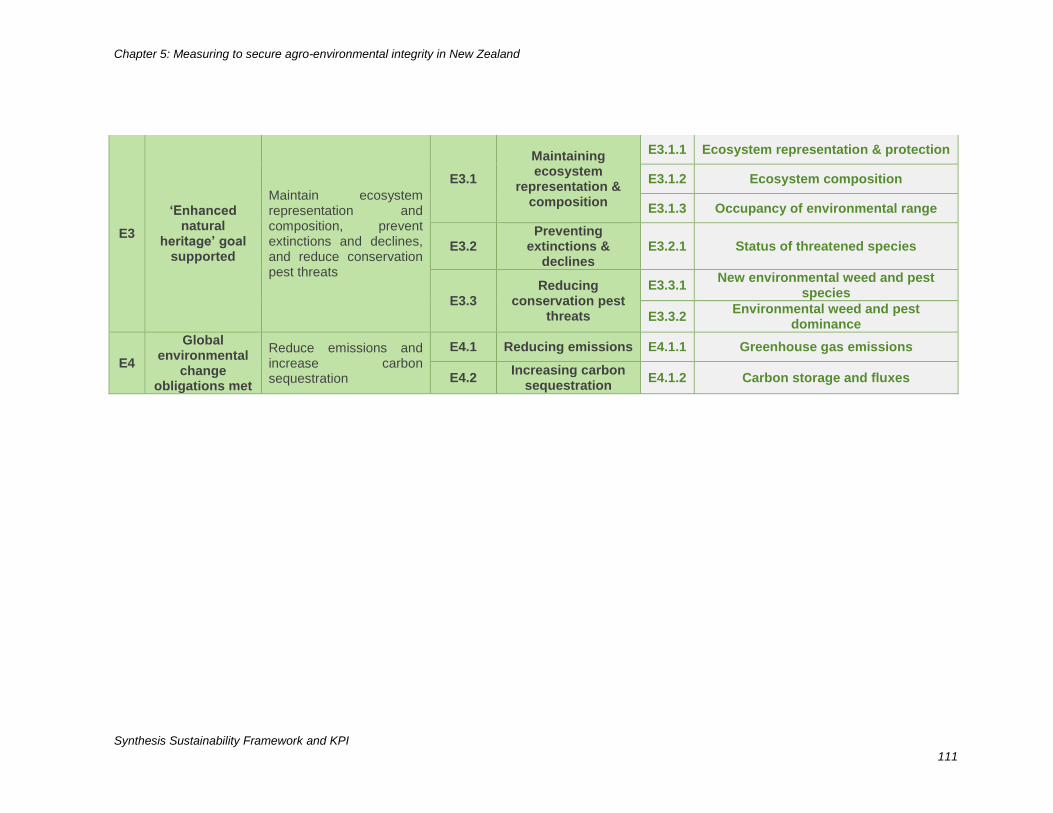
Chapter 5: Measuring to secure agro-environmental integrity in New Zealand
Synthesis Sustainability Framework and KPI
111
E3
‘Enhanced natural
heritage’ goal supported
Maintain ecosystem representation and composition, prevent extinctions and declines, and reduce conservation pest threats
E3.1
Maintaining ecosystem
representation & composition
E3.1.1 Ecosystem representation & protection
E3.1.2 Ecosystem composition
E3.1.3 Occupancy of environmental range
E3.2 Preventing
extinctions & declines
E3.2.1 Status of threatened species
E3.3 Reducing
conservation pest threats
E3.3.1 New environmental weed and pest
species
E3.3.2 Environmental weed and pest
dominance
E4
Global environmental
change obligations met
Reduce emissions and increase carbon sequestration
E4.1 Reducing emissions E4.1.1 Greenhouse gas emissions
E4.2 Increasing carbon
sequestration E4.1.2 Carbon storage and fluxes
Chapter 5: Measuring to secure agro-environmental integrity in New Zealand
Synthesis Sustainability Framework and KPI
112
Outcome E1: Natural capital for production is maintained
This outcome (E1) focuses on sustaining natural capital for production, while also recognising its
importance for maintaining livelihoods and ecological components associated with New Zealand’s
agro-ecosystem. It addresses three key objectives: (1) maintaining ecosystem processes, (2)
reducing agricultural pest threats and (3) limiting environmental pollutants within New Zealand’s
agro-ecosystems (Table 5.2).
Natural capital is considered essential to the sustainability of intensive farming in New Zealand
(PCE 2004), with capital-based indicators recently being proposed as a potential means for
measuring agricultural sustainability (Saunders et al., 2010). Natural capital stock takes different
identifiable forms (e.g., trees, minerals, ecosystems or atmosphere) or intangible forms (e.g.,
stored in species or ecosystems; Costanza et al., 1997; PCE, 2004). Ecosystem services consist
of flows of materials, energy and information from natural capital stocks which combine with
manufactured and human capital services to produce human welfare (see Box 3 in Moller and
MacLeod, 2013). The human use of this flow of services may or may not leave the original capital
stock intact. At a global level, the Millennium Ecosystem Assessment highlighted that over 60%
of ecosystem services were deteriorating or already overused (MEA, 2005). A number of global
initiatives have recently been established to support monitoring and management of natural
capital and ecosystem services at different spatial scales (e.g., MEA, 2005; TEEB, 2010; Tallis
et al., 2012).
Objective E1.1: Maintaining ecosystem processes
Maintaining ecosystem processes is a key factor contributing to the natural capital outcome (E1).
This means maintaining the stocks and/or flows of materials (natural capital) in an ecosystem,
resulting from interactions among organisms and with their physical-chemical environment (Mace
et al., 2012). Ecosystem processes change and have their own characteristic rates and tipping
points when thresholds are exceeded. As the physical, chemical and biological features and
components of ecosystems change, so will the processes and, consequently, the ecosystem
services. The complexity of these interactions is poorly understood, making it difficult to predict
how they will change in response to changes in stressors such as agricultural intensification and
climate change.
Five indicators are recommended for determining whether ecosystem processes in
New Zealand’s agro-ecosystems are being maintained (Table 5.2): (1) Soil provides the ‘central
engine room’ for New Zealand agriculture and is a driver of land use decisions (PCE, 2004;
Statistics NZ, 2009). (2) Fresh water is among New Zealand’s most valuable assets and is a vital
part of the country’s economy (Statistics NZ et al., 2013); the impact and dependence of
agricultural production on this resource is also one of New Zealand’s most important
environmental concerns. (3) Monitoring and understanding New Zealand’s land cover and use
patterns in agricultural landscapes is important for determining the drivers of change and whether
production, natural and cultural components are being maintained (Statistics NZ et al., 2013). (4)
Chapter 5: Measuring to secure agro-environmental integrity in New Zealand
Synthesis Sustainability Framework and KPI
113
Extreme disturbance events (e.g., disease, drought) can adversely impact production either
directly (e.g., resulting in crop loss) or indirectly (e.g., increasing reliance on supplementary
animal feed); ecosystems play an important role in modulating the effects of such events (MEA,
2005). (5) Maintenance of pollination processes is crucial for crop production in some sectors,
hence global declines in pollinator species are a major concern for agro-ecosystems (Power,
2010; Garibaldi et al., 2013; Tylianakis, 2013).
Objective E1.2: Reducing agricultural pest threats
Reducing agricultural pest threats is another key factor contributing to the natural capital outcome
(E1). Agro-ecosystems are increasingly recognised as both sources and sinks of disease, weed
and animal pest species, which can have significant effects on agricultural biosecurity,
biodiversity, global economies, and human health. Changes in the emergence, prevalence and
abundance of such pests are driven largely by socioeconomic, environmental, and ecological
factors (Blaustein and Johnson, 2010).
Zoonotic disease emergence at the wildlife–livestock–human interface, for example, is often
associated with varying combinations of agricultural intensification and environmental change
(Jones et al., 2013b). Some introduced species have become reservoirs for disease in livestock
and humans. In New Zealand, for example, tuberculosis in cattle and deer is an on-going endemic
disease issue requiring significant investment in wildlife reservoir control to manage (Ryan et al.,
2006). Other wildlife species impact agricultural production (Porter et al., 1994), with native and
introduced birds, for example, causing significant damage to grape crops in vineyards (Boyce
et al., 1999; Kross et al., 2011).
Two indicators for monitoring threats posed by agricultural pests are recommended (Table 5.2).
One focuses on detecting and managing new pest threats, thus meeting the regulatory
requirements set out in the Hazardous Substance and New Organisms Act 199634. The other
assesses changes in the dominance of established agricultural pests posing a risk to agricultural
production and the wider environment.
34 http://www.legislation.govt.nz/act/public/1996/0030/latest/DLM381222.html
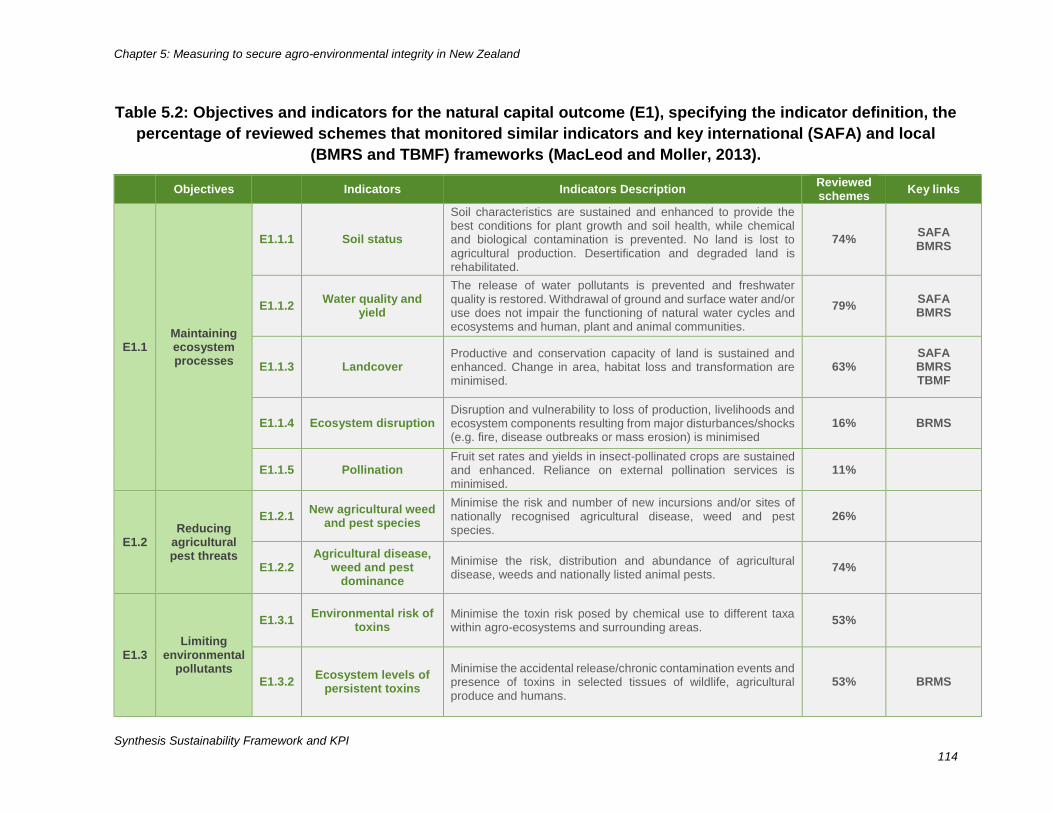
Chapter 5: Measuring to secure agro-environmental integrity in New Zealand
Synthesis Sustainability Framework and KPI
114
Table 5.2: Objectives and indicators for the natural capital outcome (E1), specifying the indicator definition, the
percentage of reviewed schemes that monitored similar indicators and key international (SAFA) and local
(BMRS and TBMF) frameworks (MacLeod and Moller, 2013).
Objectives Indicators Indicators Description Reviewed schemes
Key links
E1.1 Maintaining ecosystem processes
E1.1.1 Soil status
Soil characteristics are sustained and enhanced to provide the best conditions for plant growth and soil health, while chemical and biological contamination is prevented. No land is lost to agricultural production. Desertification and degraded land is rehabilitated.
74% SAFA BMRS
E1.1.2 Water quality and
yield
The release of water pollutants is prevented and freshwater quality is restored. Withdrawal of ground and surface water and/or use does not impair the functioning of natural water cycles and ecosystems and human, plant and animal communities.
79% SAFA BMRS
E1.1.3 Landcover Productive and conservation capacity of land is sustained and enhanced. Change in area, habitat loss and transformation are minimised.
63% SAFA BMRS TBMF
E1.1.4 Ecosystem disruption Disruption and vulnerability to loss of production, livelihoods and ecosystem components resulting from major disturbances/shocks (e.g. fire, disease outbreaks or mass erosion) is minimised
16% BRMS
E1.1.5 Pollination Fruit set rates and yields in insect-pollinated crops are sustained and enhanced. Reliance on external pollination services is minimised.
11%
E1.2 Reducing
agricultural pest threats
E1.2.1 New agricultural weed
and pest species
Minimise the risk and number of new incursions and/or sites of nationally recognised agricultural disease, weed and pest species.
26%
E1.2.2 Agricultural disease,
weed and pest dominance
Minimise the risk, distribution and abundance of agricultural disease, weeds and nationally listed animal pests.
74%
E1.3 Limiting
environmental pollutants
E1.3.1 Environmental risk of
toxins Minimise the toxin risk posed by chemical use to different taxa within agro-ecosystems and surrounding areas.
53%
E1.3.2 Ecosystem levels of
persistent toxins
Minimise the accidental release/chronic contamination events and presence of toxins in selected tissues of wildlife, agricultural produce and humans.
53% BRMS
Chapter 5: Measuring to secure agro-environmental integrity in New Zealand
Synthesis Sustainability Framework and KPI
115
Objective E1.3: Limiting environmental pollutants
Limiting environmental pollutants is the third key factor contributing to the natural capital outcome
(E1). Conventional agriculture is based on high levels of chemical inputs, resulting in serious
environmental impacts, health risks and loss of biodiversity in agro-ecosystems (Simons et al.,
2010). Environmental impacts include their aerial dissemination and the contamination of soil and
water, with largely underestimated negative effects on biodiversity directly or indirectly exposed
to these chemicals (Kelly et al., 2010; MacLeod et al., 2012b; Tscharntke et al., 2012).
In addition to meeting the regulatory requirements set out in the Hazardous Substance and New
Organisms Act 1996, New Zealand’s agricultural sectors need to address increasing consumer
concern about pesticide residues in food, and the impact of crop protection practices on the
environment. This requires the development and application of strategies to minimise pesticide
use through greater adoption of integrated pest and disease management systems (Walker et al.,
1997). Such systems aim to minimise pesticide use by avoiding unnecessary applications,
optimising pesticide timing and making greater use of selective and more benign pesticides.
Demonstrating the environmental benefits of lower pesticide use and safer crop protection
practices is also important.
Two indicators are recommended for assessing the environmental risk of toxins and ecosystem
levels of persistent toxins (Table 5.2).
Outcome E2: Resilience is secured for future productive use
This outcome focuses on securing environmental resilience for future use of the production
landscape. This will require integrated monitoring, investment and management by multiple actors
(individual farming families, sectors, regional councils etc.). It sets out to address two key
objectives: (1) minimising material and energy subsidies; and (2) maintaining agro-biodiversity.
Resilience is “the capacity of a system to absorb disturbance and reorganise while undergoing
change so as to still retain essentially the same function, structure, identity and feedbacks”
(Walker et al., 2004). Making socio-ecological systems strong enough to withstand perturbations
by new threats means learning how to deal with uncertainty and adapt to changing conditions,
rather than understanding ecosystem vulnerability (Olsson et al., 2004). The four crucial aspects
of resilience are (Walker et al., 2004): (1) Latitude: maximum amount a system can be changed
before losing its ability to recover; (2) Resistance: ease or difficulty of changing the system; (3)
Precariousness: how close the current state of the system is to a limit or ‘threshold’; and (4)
Panarchy: resilience of a system at a particular focal scale depends on the influences from states
and dynamics at other scales due to cross-scale interactions.
Chapter 5: Measuring to secure agro-environmental integrity in New Zealand
Synthesis Sustainability Framework and KPI
116
Adaptability is the capacity of stakeholders in a system to influence resilience and avoid crossing
into an undesirable system regime (Walker et al., 2004; Nelson et al., 2007). Transformability is
the capacity to create a fundamentally new system when ecological, economic or social conditions
make the existing system untenable.
Objective E2.1: Minimising material and energy subsidies
Minimising material and energy subsidies is a key factor contributing to the ‘resilience for future
use’ outcome (E2). Intensification of agriculture both globally and locally is largely dependent on
increased use of external inputs (PCE, 2004; MacLeod and Moller, 2006; Moller et al., 2008a;
Wood et al., 2010). As such, inputs (e.g., fertiliser, fossil fuels) are often costly, with significant
risks to future farming and yields associated with increasing and increasingly volatile fossil fuel
prices (Wood, et al. 2010). They also often rely on non-renewable resources, make up a
significant component of the energy footprint for food production (Norton et al., 2010) and/or
increase the risk of environmental impacts both on and off the farm (e.g., nutrient runoff;
biodiversity loss; Power, 2010; Lenzen et al., 2012). From an ecosystem perspective, however,
increased inputs are not wholly a threat, as intensively managed agro-ecosystems are only
sustainable in the long term if the nutrients and energy extracted as produce are balanced by
equivalent amounts of appropriate nutrient and material inputs (Moller et al., 2008a; Pretty et al.,
2010). A key challenge is to optimise energy inputs, while reducing greenhouse gas emissions
and improving yields to meet the anticipated requirements to provide food, fuel, chemicals and
materials for a growing global population (Wood et al., 2010). Two indicators are recommended
for monitoring use of non-renewable resources and energy (Table 5.3).
Objective E2.2: Maintaining agro-biodiversity
Maintaining agro-biodiversity is another key factor contributing to the ‘resilience for future use’
outcome (E2). Diverse agro-ecosystems, characterised by high natural insurance, function
against changing environments because they decrease variance in crop yields and, thereby, the
uncertainty in the provision of public-good ecosystem services (Tscharntke et al., 2012).
Agricultural biodiversity may enhance a system’s capacity to absorb and recover from
perturbation, or build resilience (Fischer et al., 2006), which in turn potentially reduces reliance
on external inputs to maintain production (Milestad and Darnhofer, 2003). The unique feature of
agro-biodiversity (microbes, plants, and animals that provide ecosystem services) is the emphasis
on its utility to human beings (Matson et al., 1997).
Maintaining genetic diversity of crop-cultivars and livestock breeds is important for producing
commercial products, as well as pest and disease management, pollination services and soil
processes (OECD, 2001b; PCE, 2004; MEA, 2005; Hajjar et al., 2008; Herzog et al., 2012). The
monitoring of beneficial species representing different ecological functions (primary production,
herbivory, pollination, predators) and a range of sensitivities to management activities at
varyingspatial scales is required, to ensure these important components of the system are being
maintained (Herzog et al., 2012; Tallis et al., 2012). Agricultural intensification replaces
Chapter 5: Measuring to secure agro-environmental integrity in New Zealand
Synthesis Sustainability Framework and KPI
117
heterogeneity in habitat structure, in time and space, with homogeneity (Benton et al., 2003),
resulting in declines in agro-biodiversity at local and global scales (e.g., Krebs et al., 1999;
Chamberlain et al., 2000; Donald et al., 2001; Butchart et al., 2010; Jeanneret et al., 2012;
Lindenmayer et al., 2012). The extent, structure, composition and management of non-crop
habitats is of particular interest, because these habitats can provide important refuges for
beneficial species on farms (Haslem and Bennett, 2008; Lee et al., 2008; Moller et al., 2008a).
Three indicators are recommended for monitoring agro-biodiversity - genetic stock, beneficial
species, and landscape functional heterogeneity (Table 5.3).
Outcome E3: Contributed to national ‘natural heritage’ goals
This outcome (E3) focuses on New Zealand’s national goal to enhance its natural heritage. It aims
to address three key objectives within production landscapes: (1) maintaining ecosystem
representation and composition; (2) preventing extinctions and declines; and (3) reducing
conservation pest threats.
A high proportion of New Zealand’s species are endemic (i.e., found nowhere else in the world)
– making these species both valuable and vulnerable. Although common threats of habitat loss,
introduced competitors and predators are well known, more information about drivers of change
and the extent to which New Zealand’s native biodiversity is being protected and sustained will
help prioritise investments and farm management changes (Statistics NZ et al., 2013). In the past,
biodiversity indicators employed in New Zealand focused on recording management activity
inputs, as these are often easily and accurately measured (e.g., area of possum control, number
of litres of herbicide used over a given area). However, these do not directly measure the actual
biodiversity outcomes achieved from the management activities (Green and Clarkson, 2005;
Jones, 2009; Lee and Allen, 2011). This makes it difficult to demonstrate whether biodiversity
representation or persistence is improving or not.
Objective E3.1: Improving ecosystem representation and composition
Improving ecosystem representation and composition is a key factor contributing to ‘natural
heritage’ outcome (E3). Ecosystems can be defined by abiotic and biotic factors (Lee et al., 2005);
they occupy a range of environments (defined at different scales by climate, soils, topography
and disturbance regimes factors) and their composition can vary according to species, functional
groups, life-history stages, trophic diversity and structural complexity.
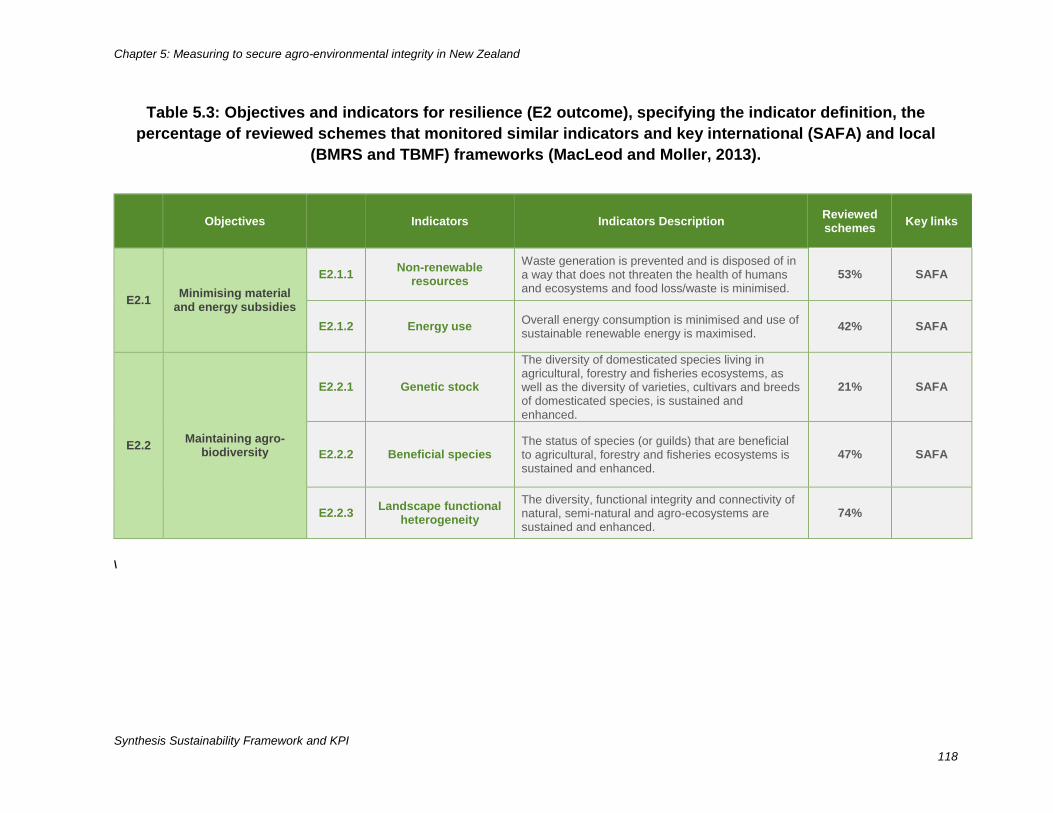
Chapter 5: Measuring to secure agro-environmental integrity in New Zealand
Synthesis Sustainability Framework and KPI
118
Table 5.3: Objectives and indicators for resilience (E2 outcome), specifying the indicator definition, the
percentage of reviewed schemes that monitored similar indicators and key international (SAFA) and local
(BMRS and TBMF) frameworks (MacLeod and Moller, 2013).
Objectives Indicators Indicators Description Reviewed schemes
Key links
E2.1 Minimising material
and energy subsidies
E2.1.1 Non-renewable
resources
Waste generation is prevented and is disposed of in a way that does not threaten the health of humans and ecosystems and food loss/waste is minimised.
53% SAFA
E2.1.2 Energy use Overall energy consumption is minimised and use of sustainable renewable energy is maximised.
42% SAFA
E2.2 Maintaining agro-
biodiversity
E2.2.1 Genetic stock
The diversity of domesticated species living in agricultural, forestry and fisheries ecosystems, as well as the diversity of varieties, cultivars and breeds of domesticated species, is sustained and enhanced.
21% SAFA
E2.2.2 Beneficial species The status of species (or guilds) that are beneficial to agricultural, forestry and fisheries ecosystems is sustained and enhanced.
47% SAFA
E2.2.3 Landscape functional
heterogeneity
The diversity, functional integrity and connectivity of natural, semi-natural and agro-ecosystems are sustained and enhanced.
74%
\
Chapter 5: Measuring to secure agro-environmental integrity in New Zealand
Synthesis Sustainability Framework and KPI
119
Focusing on higher levels of biological organisation (e.g., the ecosystem rather than species) may
provide a pragmatic and cost-effective means of conserving multiple levels of biological diversity.
A key challenge for biodiversity conservation is to identify and conserve areas of natural habitat
that contain unique and diverse biological assemblages (UNEP-WCMC, 2011) and to ensure their
local representation (Lee et al., 2005). New Zealand’s rare ecosystems, for example, frequently
occur outside existing conservation areas, with opportunities for improvements in their protection
and management recently being highlighted using an international threat classification system
(MfE and DOC, 2007; Williams et al., 2007; Wiser and Buxton, 2008; Rodriguez et al., 2011;
Holdaway et al., 2012). Moreover, the greatest potential to restore the most significant and
vulnerable indigenous ecosystems are in lowland and montane areas where production activities
are also located.
Three indicators are recommended for monitoring whether ecosystem representation and
composition is improving (Table 5.4). These focus on (1) environmental representation and
protected status; (2) ecosystem composition; and (3) focal species occupancy of environmental
range.
Objective E3.2: Preventing extinctions and declines
Preventing extinctions and declines is another key factor contributing to the natural heritage
outcome (E3). Preventing extinctions and population reductions is fundamental for maintaining
biodiversity (Lee et al. 2005). Indicators reporting on conservation status of threatened taxa attract
high public interest not only in New Zealand, where many endemic species are highly threatened,
but also internationally (Butchart et al., 2005; IUCN, 2008). Many small natural habitat remnants
across a large geographical area protect more species than a single large remnant of the same
area (Tscharntke et al., 2012). However, fragmented populations experience high extinction rates,
and many of the most endangered plants and animals need very large areas to survive. One
indicator is recommended for reporting on the status of threatened species in New Zealand agro-
ecosystems (Table 5.4).
Objective E3.3: Reducing conservation pest threats
Reducing conservation pest threats is the third key factor contributing to the natural heritage
outcome. Biological invasions are a major cause of indigenous biodiversity loss in New Zealand
(Lee et al., 2005). Mammal predators have caused extinction and reductions in many indigenous
animal species, while mammalian herbivores have caused shifts in vegetation composition and
structure. Invasive species alter disturbance regimes, displace native species and vegetation, and
modify ecosystem processes.
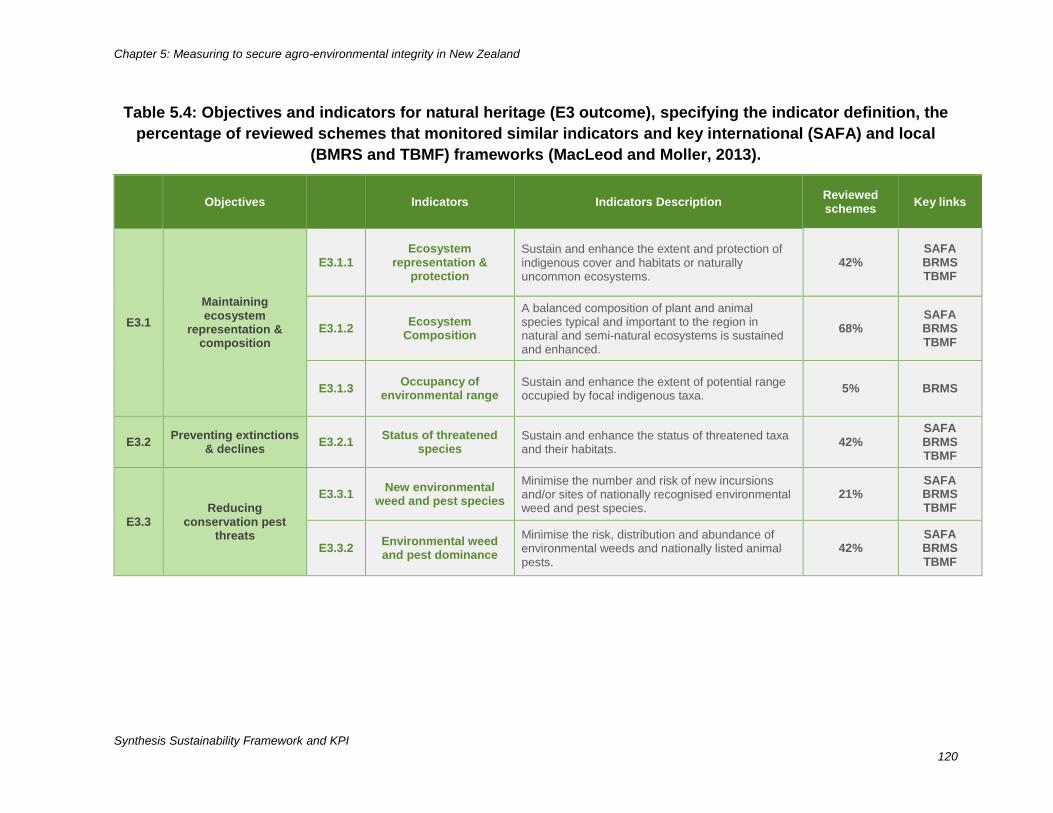
Chapter 5: Measuring to secure agro-environmental integrity in New Zealand
Synthesis Sustainability Framework and KPI
120
Table 5.4: Objectives and indicators for natural heritage (E3 outcome), specifying the indicator definition, the
percentage of reviewed schemes that monitored similar indicators and key international (SAFA) and local
(BMRS and TBMF) frameworks (MacLeod and Moller, 2013).
Objectives Indicators Indicators Description Reviewed schemes
Key links
E3.1
Maintaining ecosystem
representation & composition
E3.1.1 Ecosystem
representation & protection
Sustain and enhance the extent and protection of indigenous cover and habitats or naturally uncommon ecosystems.
42% SAFA BRMS TBMF
E3.1.2 Ecosystem
Composition
A balanced composition of plant and animal species typical and important to the region in natural and semi-natural ecosystems is sustained and enhanced.
68% SAFA BRMS TBMF
E3.1.3 Occupancy of
environmental range Sustain and enhance the extent of potential range occupied by focal indigenous taxa.
5% BRMS
E3.2 Preventing extinctions
& declines E3.2.1
Status of threatened species
Sustain and enhance the status of threatened taxa and their habitats.
42% SAFA BRMS TBMF
E3.3 Reducing
conservation pest threats
E3.3.1 New environmental
weed and pest species
Minimise the number and risk of new incursions and/or sites of nationally recognised environmental weed and pest species.
21% SAFA BRMS TBMF
E3.3.2 Environmental weed and pest dominance
Minimise the risk, distribution and abundance of environmental weeds and nationally listed animal pests.
42% SAFA BRMS TBMF
Chapter 5: Measuring to secure agro-environmental integrity in New Zealand
Synthesis Sustainability Framework and KPI
121
Agro-ecosystems and neighbouring vegetation can be a source of environmental invasive weeds
and pests. In New Zealand, about 80% of environmental weed species that are managed by
government agencies arise from garden dumping in marginal habitats, or through the
naturalisation of economic plant species outside of cultivation (Sullivan et al., 2004, 2005;
Williams and Cameron, 2006; Pyšek et al., 2009). Naturalised populations of wild kiwifruit, for
example, emerged in native and exotic forest patches near orchards; this spread was likely
facilitated by birds dispersing seed after feeding on waste fruit and growers dumping vines or fruit
into surrounding bush patches (Sullivan and Williams, 2002; Logan and Xu, 2006). Improvements
in the industry’s waste management practices, coupled with proactive control of wild kiwifruit
populations by the regional council, are required to significantly reduce the risk posed by this
invasive species (Sullivan and Williams, 2002).
Two indicators are recommended for monitoring the status of conservation pests (Table 5.4). One
focuses on new pest species incursions, the other on distribution and abundance of established
pest species.
Outcome E4: Global environmental change obligations met
This outcome (E4) sets out to address two key objectives for New Zealand to meet its global
environmental change obligations: (1) reducing emissions; and (2) increasing carbon
sequestration.
Agriculture releases significant amounts of greenhouse gas emissions to the atmosphere, which
are driving global warming (i.e., rising average surface temperatures) with large scale
consequences (Smith et al., 2008; FAO, 2012a). Carbon dioxide is released largely from microbial
decay or burning of plant litter and soil organic matter. Methane is produced when organic
materials decompose in oxygen-deprived conditions (particularly from fermentative digestion by
ruminant livestock, and stored manures). Nitrous oxide is generated by the microbial
transformation of nitrogen in soils and manures, and is often enhanced where available nitrogen
exceeds plant requirements, especially under wet conditions. Land-use change associated with
agriculture is also a significant but indirect driver of emissions. Agriculture will also likely be
adversely affected by global warming, due to changes in temperatures, rainfall patterns and
dramatic weather events. Indirect impacts on agriculture via increases in the range and
abundance of pest species are also likely to occur.
The 1997 Kyoto Protocol to the United Nations Framework Convention on Climate Change
established an international policy context for the reduction of carbon emissions and increases in
carbon sinks in order to address the global challenge of anthropogenic interference with the
climate system (Pretty, 2008). New Zealand’s Land Use and Carbon Analysis System (LUCAS),
administered by the Ministry for the Environment, was established in 2005 to support international
reporting requirements (MfE, 2010). It is envisaged the recommended indicators will closely align
Chapter 5: Measuring to secure agro-environmental integrity in New Zealand
Synthesis Sustainability Framework and KPI
122
to those being used or considered for LUCAS, hence supporting national and international
reporting initiatives.
Objective E4.1: Reducing emissions
Reducing emissions is a key factor contributing to the global environmental change outcome (E4).
Agricultural greenhouse gas fluxes are complex and heterogeneous (Smith et al., 2008). In
New Zealand, for example, there are large year-to-year fluctuations in emissions, which are partly
driven by changes in agricultural productivity and livestock numbers associated with droughts
(MfE, 2010). However, active management of agricultural systems offers possibilities for
mitigation, using current technologies to manage more efficiently the flows of carbon and nitrogen
in agro-ecosystems (Smith et al., 2008). For example, managing livestock to make most efficient
use of feeds often suppresses the amount of methane produced. Approaches that best reduce
emissions depend on local conditions and therefore vary from region to region. Emissions of
greenhouse gases, in particular carbon dioxide, can be avoided by implementing agricultural
practices that prevent the cultivation of new lands now under forest, grassland or other non-
agricultural vegetation (Foley et al., 2005). The net benefit of a particular action will depend on
the combined effects on all gases, as that practice will often affect more than one gas, by more
than one mechanism and sometimes in opposite ways (Smith et al., 2008). One indicator is
recommended focusing on monitoring industry efforts to mitigate greenhouse gas emissions and
actual trends in emissions (Table 5.5).
Objective E4.2: Increasing carbon sequestration
Increasing carbon sequestration is another key factor to the global environmental change
outcome (E4). Carbon sequestration is defined as the capture and secure storage of carbon that
would otherwise be emitted to or remain in the atmosphere (Pretty, 2008). Agriculture can
contribute to carbon storage, when organic matter is accumulated in the soil, and when above-
ground biomass acts as either a permanent sink or is used as an energy source that substitutes
for fossil fuels and avoids carbon emissions. Changes in land use and management can facilitate
increases in carbon storage. One indicator is recommended focusing on measuring total carbon
pools and fluxes in agro-ecosystems (Table 5.5).
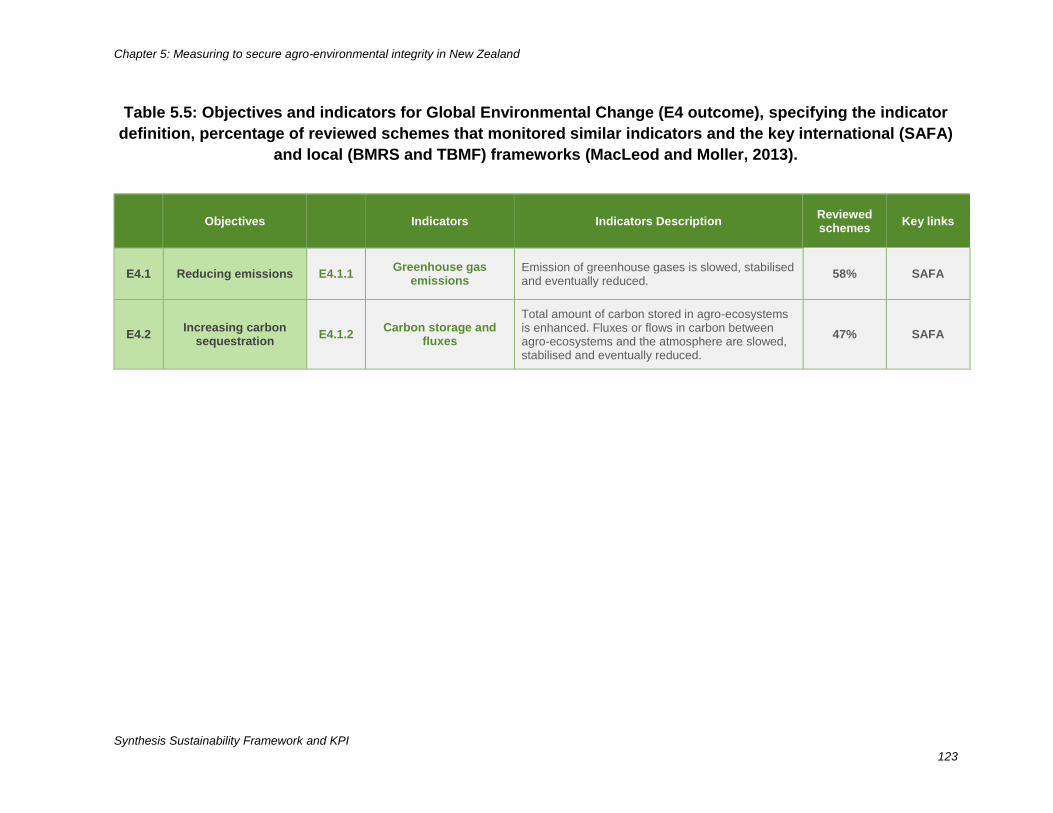
Chapter 5: Measuring to secure agro-environmental integrity in New Zealand
Synthesis Sustainability Framework and KPI
123
Table 5.5: Objectives and indicators for Global Environmental Change (E4 outcome), specifying the indicator
definition, percentage of reviewed schemes that monitored similar indicators and the key international (SAFA)
and local (BMRS and TBMF) frameworks (MacLeod and Moller, 2013).
Objectives Indicators Indicators Description Reviewed schemes
Key links
E4.1 Reducing emissions E4.1.1 Greenhouse gas
emissions Emission of greenhouse gases is slowed, stabilised and eventually reduced.
58% SAFA
E4.2 Increasing carbon
sequestration E4.1.2
Carbon storage and fluxes
Total amount of carbon stored in agro-ecosystems is enhanced. Fluxes or flows in carbon between agro-ecosystems and the atmosphere are slowed, stabilised and eventually reduced.
47% SAFA
Chapter 5: Measuring to secure agro-environmental integrity in New Zealand
Synthesis Sustainability Framework and KPI
124
Conclusion
The NZSD environmental framework proposed here is designed monitoring progress towards the
overarching goal of agro-environmental integrity in New Zealand’s production landscapes. It
recognises the need for an integrated management approach and must be implemented across
multiple spatial scales and governance jurisdictions to maintain livelihoods, social well-being and
restore ecological integrity to New Zealand. The framework design aims to be sufficiently
complete and flexible for confronting both global and local needs. The indicators are practical,
locally grounded and universally acceptable, in particular being closely matched to systems
current being designed and tested internationally (in particular SAFA, 2013b) and locally (by the
Department of Conservation and regional councils)
To meet local and national requirements the NZSD team will have to carry out further work with
stakeholders to co-design tightly prescribed metrics for the indicators proposed in this chapter
(and the others). They will also have to serve the practical needs, opportunities and challenges
that confront New Zealand’s orchardists, wine growers and makers, foresters and farmers.
Chapter 6: Measuring the contribution of primary-based industries to social well-being
Social Well-being: Ensures livelihood opportunities and respects social and
cultural principles of all society.
Social well-being is achieved when the respect for rights of equal access to
employment and participation in the value-chain and of safe and healthy working
environments and the development of supportive communities facilitate the pursuit of
the livelihood aspirations of all members of society.
Introduction
There is very little consensus on how to define ‘social sustainability’, beyond the fact that it
varies with the social and cultural context of within which it is being defined (Shove, 2010;
Thompson and Scoones, 2009; Wilder et al., 2010). This has obviously led to many issues
regarding its measurement and therefore its usefulness to enterprises and governments,
especially in international and cross-cultural situations (Boström, 2012; Vallance et al., 2011;
Omann and Spangenberg, 2002). The pillar of social sustainability, or social well-being as it is
called in the SAFA (2013b) framework, only emerged with the so-called Brundtland definition of
sustainability in the late 1990s (Colantonio, 2011) and has therefore come to be associated with
the need for a country or an enterprise to ensure that basic human needs are met and that
people have the right and the freedom to pursue and achieve their own aspirations for a better
life (WCED, 1987). However, this pursuit is constrained to the extent that it does not impinge on
the ability of others, both in the present and the future, to do the same.
The concepts of quality of life and social well-being have more recently emerged as common
aspects of sustainability, leading to even further debate regarding the realisation and
measurement of such goals.35 The World Health Organization (WHO) has this definition: An
individual’s perception of their position in life, in the context of the culture and values in which
they live and in relation to their goals, expectations, standards and concerns (WHOQOL Group,
1995). The expression ‘quality of life’ has often been replaced with the word ‘well-being’ (see
OECD, 2001a). This is another aspect which is very difficult to assess. Many components of
social life have been suggested as indicators such as employment, income, crime and house
prices. While these factors are easily measured, it is more difficult to determine if they should
be treated as if they are of equal value or if, for example, crime should be given greater weighting
than house prices!
This chapter follows an inductive process which determined the way in which indicators of social
well-being were arranged into categories. The selected indicators are then compared to those
35 Indeed there is a journal devoted to this called ‘Quality of Life Research’.
Chapter 6: Measuring the contribution of primary-based
industries to social well-being
Chapter 6: Measuring the contribution of primary-based industries to social well-being
Synthesis Sustainability Framework and KPI
126
included in the SAFA (2013b) framework, with evidence of significant overlap in all but one
outcome/theme. Additional explanation of those aspects of social well-being not included in the
SAFA framework is provided in order to justify a set of social KPIs that are more appropriate to
the New Zealand context and that attempt to assess a broader range of community resilience
factors identified as important to sustainability in the international literature.
Categorising indicators of social well-being
Social sustainability indicators are found in a diverse set of assessment frameworks and policy
and academic literature on social sustainability as summarised in Error! Reference source not
ound.2.4 (in Chapter 2). They can be divided into those that document factors with strong ethical
justifications (e.g., non-discrimination in the workplace), those that are more directly associated
with definitions of social sustainability or resilience (e.g., social cohesion or connectivity) and
those that have the potential to predict broader sustainability of systems or value chains (e.g.,
breadth of view). While the first category does not directly correlate with sustainability outcomes,
their importance from the perspective of customer concerns regarding the social impacts of
consumption makes them an essential element of a sustainability dashboard that is expected to
translate into a labelling or certification scheme. Many of these indicators are already regulated
through New Zealand employment law as is discussed below. The second set of indicators is
extremely diverse, reflecting the tendency for the development of indicators that are unique to
specific assessment frameworks. The selection of KPIs from this set involves both an analysis
of their relevance to the New Zealand context and their capacity to adequately indicate
conditions and trends that are of relevance to participants in the value chain. The final category
is more limited and generally includes measures suggested within the academic literature. The
capacity for these to accurately predict ‘sustainability’ is context dependent. The inclusion of
such measures is less likely to meet existing expectations from consumers, but may provide
additional sources of information for stakeholders operating at the production end of the value
chains. This latter group was also commonly distinguished by poorly defined, expensive or non-
replicable measures – a factor which likely contributed to their absence in the assessment
frameworks.
The recommended indicators should not be understood as providing a fully comprehensive
assessment of social well-being. Rather they provide an initial suite of indicators that assess
recognised ethical standards or features of social sustainability. The intent is to retain a set of
measures that is sufficiently comprehensive in light of available literature and existing
assessment frameworks. It is also highly likely that these indicators will need to be amended to
account for shifting public awareness of what defines sustainable and acceptable practice in
agriculture and for emerging measurement capabilities and methods.
The selected KPIs are not necessarily comprehensive in regards to social aspects of production
and consumption within the value chain. The framework does, however, enable a focus on more
commonly recognised aspects of value chain operation and ones that are more readily
associated with practices under the control of stakeholders. As noted elsewhere, the included
objectives largely reflect the social well-being sub-themes in the SAFA framework, with the
exception that several objective definitions and indicators were altered to account for household
and farm level practice (in addition to that of firms). In addition, the framework presented in this
Chapter 6: Measuring the contribution of primary-based industries to social well-being
Synthesis Sustainability Framework and KPI
127
document has added the Community Resilience outcome (which facilitated greater inclusion of
indicators related to social capital and cohesion, attachment to place, etc.).
A more practical consideration in prioritising the indicators (and one that, as noted above, may
be most relevant in selecting between indicators under the same objective of the framework)
involves the availability of relevant data. Where a range of indicators is listed, in most cases the
most appropriate one would require data that is already collected for other reporting by the farm
or enterprise. In other cases, data that can be readily accessed either through improved record
keeping or via secondary sources will increase the appropriateness and the acceptability of a
given indicator. Many of the indicators listed within the cultural and community resilience
outcomes will, however, require the creation of new data, some of which will involve self-
assessment by means of a small suite of questions. Where these are not directly related to
factors of production, it will be necessary to clearly explain their relevance to the assessment in
order to avoid non-participation.
In order to provide a more streamlined assessment, a further means of prioritising the indicators
reflects the extent to which a social KPI is likely to be directly relevant to the information collected
for indicators listed under the governance, economic and environmental pillars. For example,
indicators of labour rights in the social pillar may draw on a similar set of data to that required
for indicators of participation in the governance pillar. Where this is the case, indicators from the
respective objectives that require less data collection will be prioritised. The extent to which the
linkages between the pillars is apparent at the indicator level is also expected to enhance the
comprehensiveness of the assessment.
Relevance considerations
Many of the indicators of social sustainability identified in existing assessments or the broader
literature reflect their application to conditions of labour and social relations in the Global South.
As such, they largely lack relevance to the New Zealand context where they are factors
regulated by labour law or common features of standard practice. For example, regulation of
forced labour is an element of both the New Zealand Labour Code and the country’s
commitments as a participant in international labour and human rights conventions. Child labour,
a significant concern with regard to internationally traded agricultural commodities such as
cocoa and cotton, poses a more complicated situation. In New Zealand, there are accepted
standards of best practice governing the use of child labour with assumptions that human rights
will be protected and that the potential for children to participate in the workforce on a restricted
basis is a viable and important means of socialisation. That the latter factor has resulted in New
Zealand not agreeing to and signing International Labour Organisation (ILO) Convention 180 –
which sets a minimum age limit for employment – poses a possible target for consumer
concerns that would require KPIs to ensure that exploitation does not occur as a result.
The selection of indicators involves the relevance and importance of indicators within the
specified sector for which the NZSD is being produced (e.g., wine, kiwifruit). For example, the
extensive use of immigrant labour in the maintenance of vines and during harvest increases the
need for verification of employment practices and services and support provided to a more
vulnerable labour force. The conditions of wine growing and kiwifruit orcharding involve distinct
labour relations that expose these activities to potentially greater scrutiny from consumers and
regulators. Specifically, the demand for labour for managing the vines and harvesting fruit has
Chapter 6: Measuring the contribution of primary-based industries to social well-being
Synthesis Sustainability Framework and KPI
128
encouraged the use of temporary immigrant labour. Because such workers face the challenges
of working in a foreign country with poorer understandings of their labour rights and the potential
for exploitation by less scrupulous employers, there is a greater need for monitoring of
compliance with New Zealand labour regulations (see Human Rights Commission, n.d.). The
unique position of immigrant workers who require housing and other social services further
raises the importance of verifying the availability and use of adequate shelter and access to
affordable food, clothing and medical services. Despite the guarantees within the New Zealand
legal and regulatory frameworks, incidences of exploitation and mistreatment in similar
situations in other countries have led to strong scepticism among consumers and human rights
NGOs (for example, see www.ethicalconsumer.org). In this regard the response in high value
markets to corruption within the Dole “ethical banana’ labelling scheme provides a cautionary
example. The distinct post-harvest practices and requirements for kiwifruit and wine do,
however, give rise to slightly different emphases in some cases.
Creating the structure of the framework
A concerted effort was made to coordinate the outcomes with themes included in the (UN-FAO)
SAFA assessment framework in order to enable comparison with a recognised collection of
indicators.36 Following this approach facilitates a similar grouping of indicators to SAFA (2013b)
according to aspects of social well-being, i.e., ‘decent livelihoods are secured’, ‘working
conditions are acceptable’, ‘equity is supported’, ‘human health and safety is prioritised’ and
‘social resilience is enhanced’ (Figure 6.1 and Table 6.1). The first outcome differs slightly from
the equivalent theme used within the SAFA framework in order to capture a broader set of
stakeholders including the family farm and other stakeholders where the relevance of self-
employment is considered of greater relevance in the New Zealand context. In addition, the
framework described here includes the social resilience outcome, which suggests a variety of
KPIs that address objectives that have been identified as relevant to sustainability but do not
appear as sub-themes in the SAFA framework. While the latter outcome is not directly
comparable to a theme in the SAFA (2013b) compliance, it includes factors considered to have
high likelihood of relevance to consumer concerns. The following explanation of the framework
establishes the justification for the structure of the social well-being outcomes and objectives as
well as identifying potential indicators for each. The indicators include both generally recognised
(i.e., those that appear consistently in existing assessment frameworks) and relatively unique
(i.e., attempts to capture concepts and practices associated with social well-being in the
literature) measures.
36 N.B. The Fair Trading Practices Theme included in the SAFA (2013b) framework is not included in the framework
recommended within this chapter as its goals and measures are addressed in the Good Governance and Economic
Resilience pillars and in more specific objectives including those within the ‘decent livelihood’ and ‘social resilience’
outcomes of the Social Well-being pillar discussed in this chapter.
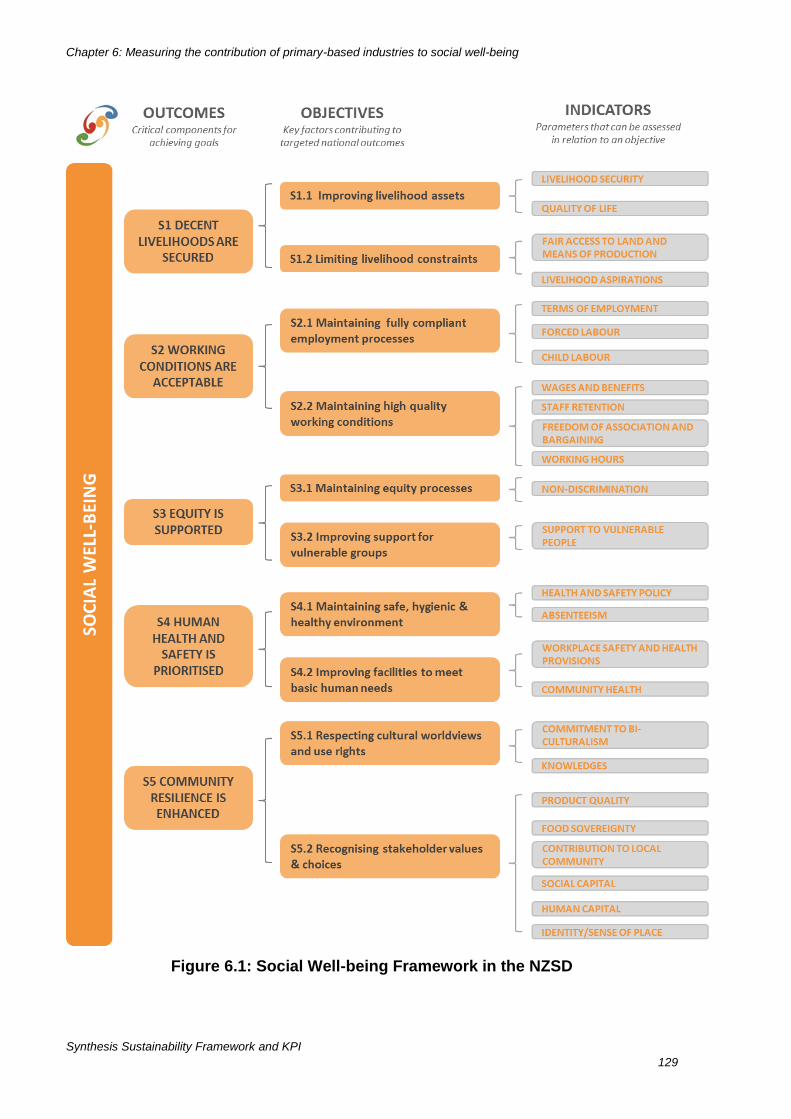
Chapter 6: Measuring the contribution of primary-based industries to social well-being
Synthesis Sustainability Framework and KPI
129
Figure 6.1: Social Well-being Framework in the NZSD
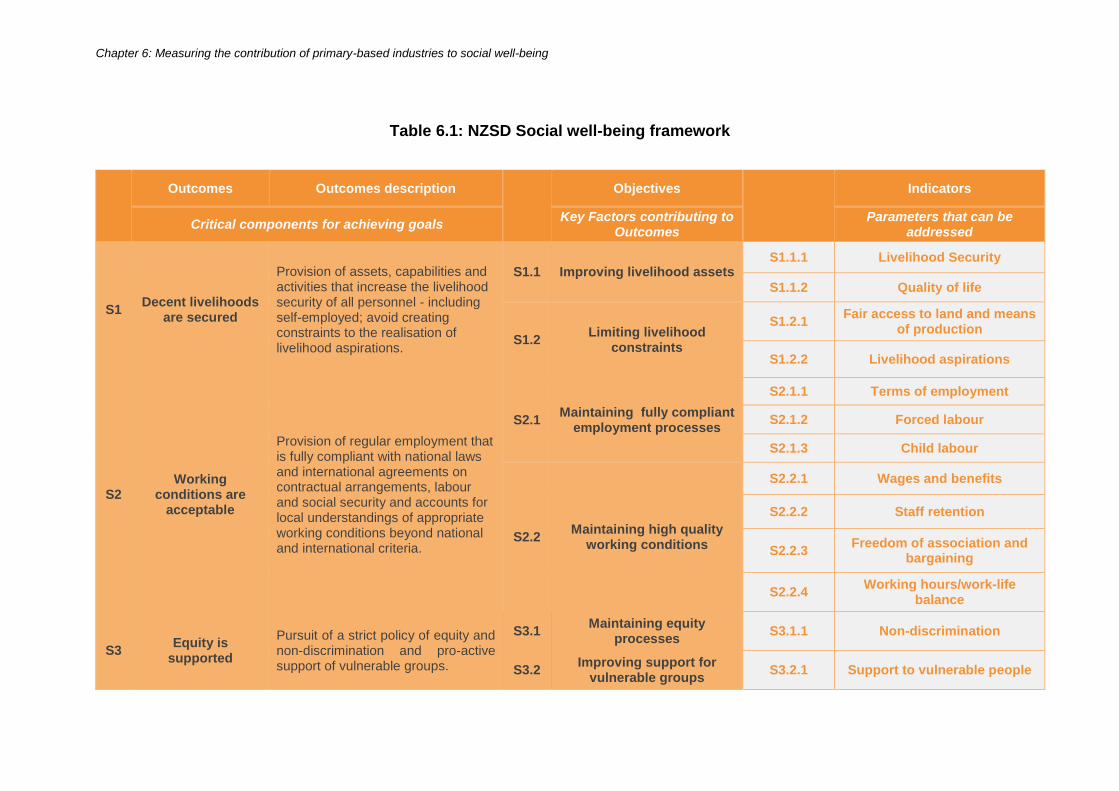
Chapter 6: Measuring the contribution of primary-based industries to social well-being
Table 6.1: NZSD Social well-being framework
Outcomes Outcomes description
Objectives
Indicators
Critical components for achieving goals Key Factors contributing to
Outcomes Parameters that can be
addressed
S1 Decent livelihoods
are secured
Provision of assets, capabilities and activities that increase the livelihood security of all personnel - including self-employed; avoid creating constraints to the realisation of livelihood aspirations.
S1.1 Improving livelihood assets S1.1.1 Livelihood Security
S1.1.2 Quality of life
S1.2 Limiting livelihood
constraints
S1.2.1 Fair access to land and means
of production
S1.2.2 Livelihood aspirations
S2 Working
conditions are acceptable
Provision of regular employment that is fully compliant with national laws and international agreements on contractual arrangements, labour and social security and accounts for local understandings of appropriate working conditions beyond national and international criteria.
S2.1 Maintaining fully compliant
employment processes
S2.1.1 Terms of employment
S2.1.2 Forced labour
S2.1.3 Child labour
S2.2 Maintaining high quality
working conditions
S2.2.1 Wages and benefits
S2.2.2 Staff retention
S2.2.3 Freedom of association and
bargaining
S2.2.4 Working hours/work-life
balance
S3 Equity is
supported
Pursuit of a strict policy of equity and non-discrimination and pro-active support of vulnerable groups.
S3.1 Maintaining equity
processes S3.1.1 Non-discrimination
S3.2 Improving support for
vulnerable groups S3.2.1 Support to vulnerable people
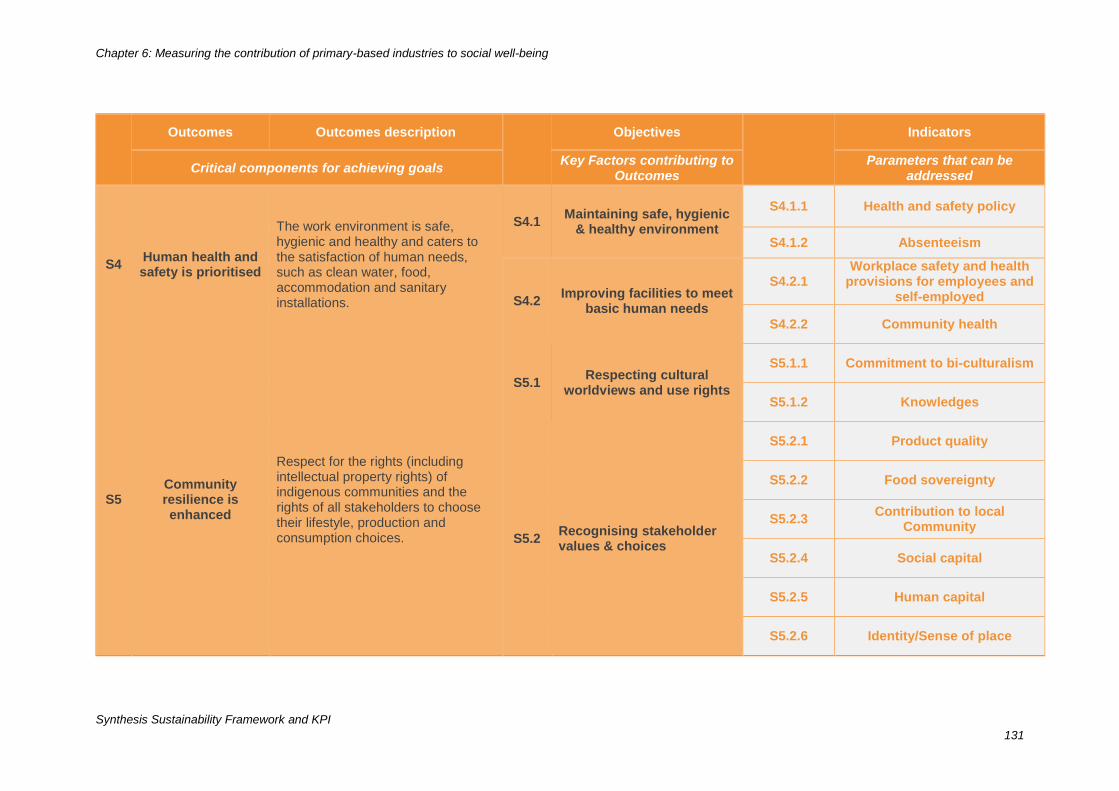
Chapter 6: Measuring the contribution of primary-based industries to social well-being
Synthesis Sustainability Framework and KPI
131
Outcomes Outcomes description
Objectives
Indicators
Critical components for achieving goals Key Factors contributing to
Outcomes Parameters that can be
addressed
S4 Human health and safety is prioritised
The work environment is safe, hygienic and healthy and caters to the satisfaction of human needs, such as clean water, food, accommodation and sanitary installations.
S4.1 Maintaining safe, hygienic
& healthy environment
S4.1.1 Health and safety policy
S4.1.2 Absenteeism
S4.2 Improving facilities to meet
basic human needs
S4.2.1 Workplace safety and health
provisions for employees and self-employed
S4.2.2 Community health
S5 Community resilience is enhanced
Respect for the rights (including intellectual property rights) of indigenous communities and the rights of all stakeholders to choose their lifestyle, production and consumption choices.
S5.1 Respecting cultural
worldviews and use rights
S5.1.1 Commitment to bi-culturalism
S5.1.2 Knowledges
S5.2 Recognising stakeholder values & choices
S5.2.1 Product quality
S5.2.2 Food sovereignty
S5.2.3 Contribution to local
Community
S5.2.4 Social capital
S5.2.5 Human capital
S5.2.6 Identity/Sense of place
Chapter 6: Measuring the contribution of primary-based industries to social well-being
Synthesis Sustainability Framework and KPI
132
Outcome S1: Decent livelihoods are secured
Provision of assets, capabilities and activities that increase the livelihood security of
all personnel - including self-employed; avoid creating constraints to the realisation
of livelihood aspirations.
The first outcome assesses the extent to which participation in the value chain either facilitates
or impedes the securing of ‘decent livelihoods’ for all stakeholders (Table 6.2). More specifically,
the outcome identifies the role of the enterprise (farm, farm family, processing firm, etc.) in
securing livelihoods by providing assets, capabilities and activities for individuals and groups
associated with the primary production process (SAFA 2013a). These individuals and groups
include the self-employed, family members, employees and contract participants. In addition,
the enterprise contributes to the outcome by avoiding the creation of constraints to the livelihood
aspirations of the individuals and groups it influences.
As elements of the outcome, we recognise two objectives that account for the potential of
economic and social dynamics of the chain to either adequately reward stakeholders through
financial returns or limit their capacity through factors such as insecurity of returns or excessive
demands on time. In order to represent these diverse facets, the objectives are further organised
according to four types of indicator, ‘livelihood security’, ‘quality of life’, ‘fair access to land and
means of production’, and ‘livelihood aspirations’, two of which are comparable to sub-themes
in SAFA. The addition of the ‘quality of life’ and ‘livelihood aspirations’ indicators is intended to
reflect their presence in several assessments associated with the promotion of specifically social
sustainability and ethical qualities (e.g., ETI and Fair Trade, SAI, MOST, Certification of
Business Competency in Business Analysis (CCBA)). Each of the recommended indicators
involves an aspect of the economic life of value chain stakeholders that reflects the aspirations
of individuals that are subject to either negotiation with the interests of other stakeholders or
constraints that are not easily mitigated or overcome. These indicators, in comparison to similar
factors in the social resilience outcome, focus more exclusively on the economic potential
associated with participation in the value chain.
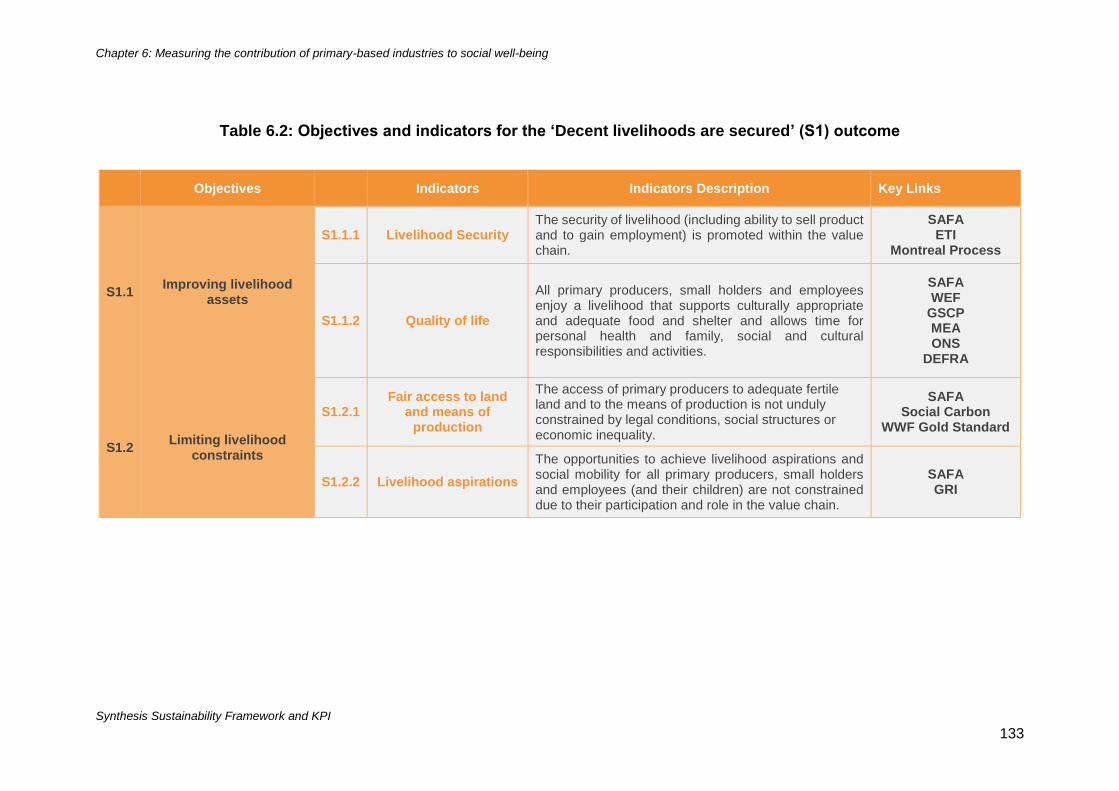
Chapter 6: Measuring the contribution of primary-based industries to social well-being
Synthesis Sustainability Framework and KPI
133
Table 6.2: Objectives and indicators for the ‘Decent livelihoods are secured’ (S1) outcome
Objectives Indicators Indicators Description Key Links
S1.1 Improving livelihood
assets
S1.1.1 Livelihood Security The security of livelihood (including ability to sell product and to gain employment) is promoted within the value chain.
SAFA ETI
Montreal Process
S1.1.2 Quality of life
All primary producers, small holders and employees enjoy a livelihood that supports culturally appropriate and adequate food and shelter and allows time for personal health and family, social and cultural responsibilities and activities.
SAFA WEF
GSCP MEA ONS
DEFRA
S1.2 Limiting livelihood
constraints
S1.2.1 Fair access to land
and means of production
The access of primary producers to adequate fertile land and to the means of production is not unduly constrained by legal conditions, social structures or economic inequality.
SAFA Social Carbon
WWF Gold Standard
S1.2.2 Livelihood aspirations
The opportunities to achieve livelihood aspirations and social mobility for all primary producers, small holders and employees (and their children) are not constrained due to their participation and role in the value chain.
SAFA GRI
Chapter 6: Measuring the contribution of primary-based industries to social well-being
Synthesis Sustainability Framework and KPI
134
Objective S1.1: Improving livelihood assets
The first objective in the livelihoods outcome focuses on the provision of potential assets that
support decent livelihoods. It includes two indicators related to stakeholders’ capacity to support
themselves and their families:
Livelihood Security—assessment of the ability of the stakeholder and stakeholder’s
family to sell product from the farm or enterprise and to gain employment on terms that
ensure secure and consistent relations (SAFA 2013a; Richards 2012, The Montreal
Process 2009, ETI37). This could be measured in terms of the documentation of contracts
that expressly refer to security of sale or employment during the stipulated period of the
contract, the average length of employment, the percent of contracts that are renewed
or the number of jobs related to the enterprise or value chain that are available locally
(depending on the relationships within the value chain involved) (DEFRA, 2012). If those
supply labour are included, a qualitative measure of the perceived accessibility of such
employment opportunities could also contribute to the assessment.
Quality of Life—within the livelihood outcome, this refers to the assessment of the
capacity stakeholders and their families to maintain access to adequate and culturally
appropriate food, shelter, education and health services (SAFA 2013a; Richards 2012,
WEF38, GSCP39). In comparison to SAFA, this framework redefines quality of life to
account for the potential self-exploitation of labour by farmers and farming families. A
basic measure of quality of life would be a ratio of stakeholder income to the cost of living
index, although additional qualitative information regarding the extent to which an
affordable lifestyle is also culturally appropriate would be required. Alternative measures
– again depending on the location within the value chain being examined – might include
ease and affordability of access to essential services such as water, food, medical or
sanitary facilities, to decent accommodation and to education, leisure options, and other
non-work activities (see Botha and Carter, 2007; ONS40 and DEFRA41, 2009; Millennium
Ecosystem Assessment, 2005).
Objective 1.2: Limiting livelihood constraints
The second objective draws attention to livelihood aspects that are more susceptible to
constraints that result from the practices of enterprises or other social structural factors. Two
indicators are used to establish measures within this objective:
Fair access to land and means of production—the access of primary producers to
land and means of production should be fair in terms of legal conditions, social structures
and economic equality. This indicator can be assessed by means of farm size disparity,
the relative age of mechanical or other technological components, or land values relative
to income potential (Social Carbon, 2009; WWF Gold Standard cited in Richards, 2012).
Farm size disparity is likely to only be a concern where concentrated ownership impedes
37 Ethical Trading Initiative 38 World Economic Forum 39 Global Social Science Programme 40 Office for National Statistics U.K. 41 Department for Environment and Rural Affairs U.K.
Chapter 6: Measuring the contribution of primary-based industries to social well-being
Synthesis Sustainability Framework and KPI
135
the participation of new entrants or the ability to purchase properties of a viable size. It
may become more of an issue for consumers exposed to unfair ownership conditions in
their own countries. The age of mechanical or other components acts as an alert to the
limited ability to invest in innovative practice. The ratio of land value to income is an
alternative measure to farm size disparity that assesses one likely cause of such
disparity.
Livelihood Aspirations—these aspirations include opportunities through education,
training, capital availability and other means of social advancement and social mobility
more generally. The indicator seeks to expand that of capacity development (as used in
the SAFA framework (2013c: 225)) to include the family members of stakeholders. In
this manner it can include measures of succession potential, such as succession plans
documented.
Outcome S2: Working conditions are acceptable
Provision of regular employment that is fully compliant with national laws and
international agreements on contractual arrangements, labour and social security
and accounts for local understandings of appropriate working conditions beyond
national and international criteria.
The second outcome for the social well-being pillar assesses the extent to which the conditions
under which stakeholders are employed meet established criteria for acceptability (Table 6.3).
The intent is to assess the extent to which the enterprise provides regular employment that is
fully compliant with national laws and international agreements on contractual arrangements,
labour and social security. In achieving these goals, the enterprise will also account for local
understandings of appropriate (culturally acceptable) working conditions that exceed national
and international criteria. The term ‘working conditions’ applies to the working environment and
aspects of an employee's terms and conditions of employment. This covers such matters as:
the organisation of work and work activities; training, skills and employability; health, safety and
well-being; and working time and work-life balance.42 It may also include recognition of
alternative holidays, commitments to family responsibilities or the ethical sanction of specific
management or processing practices (DEFRA 2012; GSCP).
42 http://www.eurofound.europa.eu/areas/industrialrelations/dictionary/definitions/workingconditions.htm
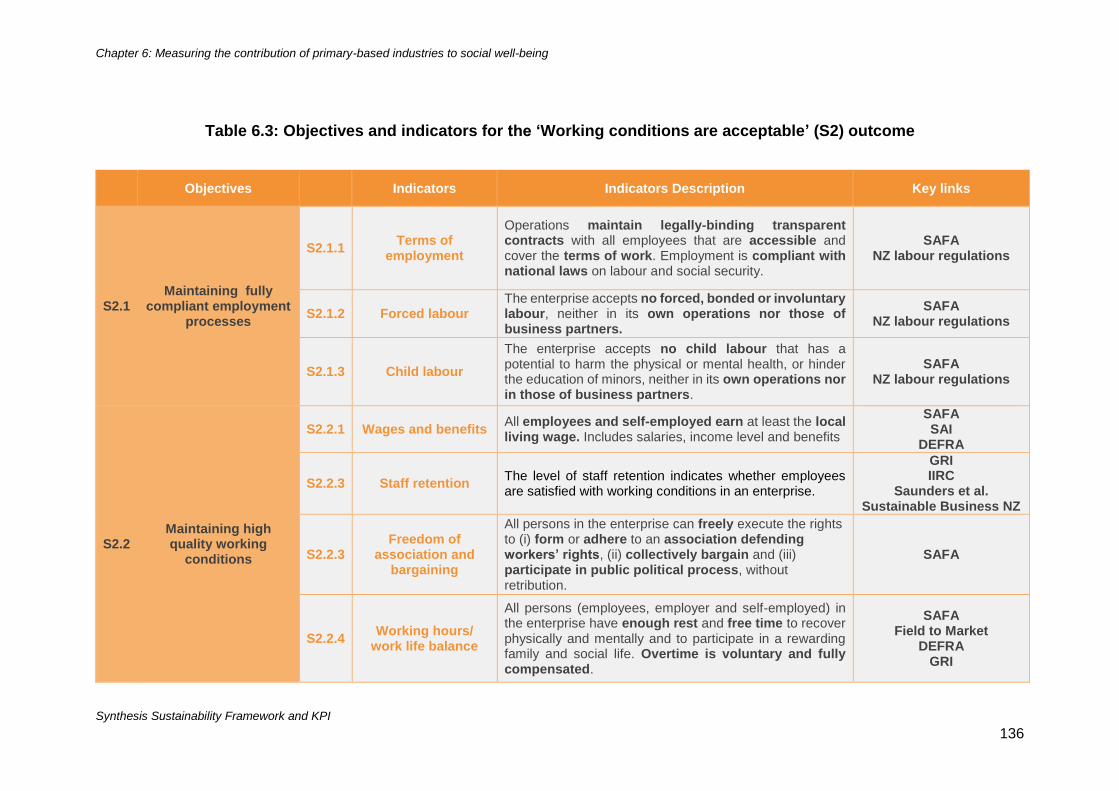
Chapter 6: Measuring the contribution of primary-based industries to social well-being
Synthesis Sustainability Framework and KPI
136
Table 6.3: Objectives and indicators for the ‘Working conditions are acceptable’ (S2) outcome
Objectives Indicators Indicators Description Key links
S2.1 Maintaining fully
compliant employment processes
S2.1.1 Terms of
employment
Operations maintain legally-binding transparent contracts with all employees that are accessible and cover the terms of work. Employment is compliant with national laws on labour and social security.
SAFA NZ labour regulations
S2.1.2 Forced labour The enterprise accepts no forced, bonded or involuntary labour, neither in its own operations nor those of business partners.
SAFA NZ labour regulations
S2.1.3 Child labour
The enterprise accepts no child labour that has a potential to harm the physical or mental health, or hinder the education of minors, neither in its own operations nor in those of business partners.
SAFA NZ labour regulations
S2.2 Maintaining high quality working
conditions
S2.2.1 Wages and benefits All employees and self-employed earn at least the local living wage. Includes salaries, income level and benefits
SAFA SAI
DEFRA
S2.2.3 Staff retention The level of staff retention indicates whether employees are satisfied with working conditions in an enterprise.
GRI IIRC
Saunders et al. Sustainable Business NZ
S2.2.3 Freedom of
association and bargaining
All persons in the enterprise can freely execute the rights to (i) form or adhere to an association defending workers’ rights, (ii) collectively bargain and (iii) participate in public political process, without retribution.
SAFA
S2.2.4 Working hours/
work life balance
All persons (employees, employer and self-employed) in the enterprise have enough rest and free time to recover physically and mentally and to participate in a rewarding family and social life. Overtime is voluntary and fully compensated.
SAFA Field to Market
DEFRA GRI
Chapter 6: Measuring the contribution of primary-based industries to social well-being
Synthesis Sustainability Framework and KPI
137
The structure of this outcome is also very similar to that used in the SAFA theme and other
assessment frameworks, although it has been renamed in an effort to account for the conditions
of self-employment especially on family operated farms and orchards. The outcome is further
divided into objectives that emphasis the maintenance of either ‘fully compliant employment
processes’ or ‘high quality working conditions’. It is important to note this outcome largely
involves aspects of ethical treatment of workers, and is not specifically tied to sustainability, thus
its justification is based on ethical response (see discussion above). Littig and Griessler (2005)
argue, however, that there is a basic connectivity between work and nature in that the former is
the sole means of meeting essential needs through exploitation of resources derived from the
latter. As a result of the reference to ethical treatment, the definition of ‘acceptable’ working
conditions directly refers to compliance with existing regulatory standards at both the national
and international level and therefore is shared with the Good Governance pillar outcome ‘the
rule of law is followed’. It also acknowledges the potential for the local context of employment
(reflecting social or cultural conditions of employment relations) to supersede the national or
international criteria. Objectives in this outcome distinguish particular types of employment or
particular aspects of the employment agreement.
Objective 2.1: Maintaining fully compliant employment processes
This objective focuses on the processes of recruiting labour. Indicators involve widely
recognised conditions of appropriate employment practice and are subject to regulation in New
Zealand employment law and international agreements.43 They include:
Terms of Employment—the terms refer to the employment agreement between the
enterprise and the employee. Compliance is measured first by the documentation of the
agreement in an accessible, transparent and legally binding contract. Further indicators
involve the assessment of the contracts’ compliance with national laws on labour and
social security.
Forced Labour—prohibits the use of forced, bonded or involuntary labour in the
enterprise or in the operations of business partners.
Child Labour—sanctions the use of inappropriate child labour, defined as an
employment situation that has the potential to harm the physical or mental health or to
hinder the educational opportunities of minors. As with the case of forced labour, this
stricture extends to the employment practices of business partners as well.
Objective 2.2: Maintaining high quality working conditions
The second objective addresses the actual working conditions at the enterprise, including the
level of compensation, the ability to form employee alliances and the length of the work day and
43 The specific Aspects under the theme of Labour Practices are based on internationally recognized universal
standards, including: United Nations Universal Declaration of Human Rights; United Nations Convention:
International Covenant on Civil and Political Rights; United Nations Convention: International Covenant on Economic,
Social, and Cultural Rights; Convention on the Elimination of all Form of Discrimination against Women (CEDAW);
ILO Declaration on Fundamental Principles and Rights at Work (in particular the eight core Conventions of the ILO
consisting of Conventions 100, 111, 87, 98, 138, 182, 29, 105); and The Vienna Declaration and Programme of Action
(GRI, 2012).
Chapter 6: Measuring the contribution of primary-based industries to social well-being
Synthesis Sustainability Framework and KPI
138
week. The indicators all involve mandatory compliance with New Zealand labour regulations
and additional reporting of practice by employers. They include:
Wages and benefits—stipulates that all employees (including self-employed) earn at
least minimum wages and receive standard benefits. Mere documentation of compliance
with minimum wage requirements may, however, be less than sufficient evidence of the
financial resilience achieved through participation in the value chain. For these ends, a
more appropriate measure (included in some form in SAFA, SAI44 and DEFRA 2012)
would assess wages relative to the skills and abilities or to the time committed (the latter
being particularly relevant for the self-employed).
Staff retention—indicates whether employees are satisfied with working conditions in
an enterprise. Economically speaking, an enterprise wishes to have a high rate of staff
retention as staff turnover can cost an enterprise because of the cost of training people
new to the enterprise, the cost of training already invested in a person who leaves, and
the loss of expertise when someone leaves. However, it is also thought that a turnover
rate can get too low because it is important to have change as well as stability.45
Training, skills and employability—these have been covered under the decent
livelihood objective indicator, livelihood aspirations, concerning capacity development.
Freedom of association—assesses the ability of all persons in an enterprise to freely
execute the right to form or belong to an association to assert workers’ rights, including
collective bargaining for working conditions. This indicator would involve both
documentation of this ability and, where feasible, a survey of employees at the enterprise
to confirm this. An additional measure could assess the ability to participate in a public
political process without retribution. Given that the perceived threat of retribution is as
great a constraint on freedom as an act of repression, measures would necessarily
include an accounting of reported acts of retribution as well as an employee self-
assessment of their sense of freedom in regard to political participation.
Working hours—in addition to complying with regulations regarding length of work day
and work week, all persons in the enterprise will receive sufficient time for rest and away
from the workplace such that they can recover physically and mentally. This indicator
would require employer reporting of working hours to gauge length of rest and free time
available. Within this context, overtime hours must be documented to be fully voluntary
and fully compensated according to New Zealand labour laws and any contract terms.
A simple accounting of working hours may obscure the impact of the time committed to
the workplace occurring through after-hours’ activities, travel time and other factors
(Field to Market, 2012). An alternative measure would involve a self-assessment of the
work-life balance experienced by an individual, an indicator that has been suggested in
assessments of social well-being and happiness (e.g., DEFRA, 2012). A final means of
assessing compliance with the working hours indicator involves an employee self-
assessment of their ability to participate in a rewarding family and social life.
44 Social Accountability International - SA8000 Standard. 45 In the UK the average employee turnover rate is 15 per cent, though it varies a lot between industries.
Chapter 6: Measuring the contribution of primary-based industries to social well-being
Synthesis Sustainability Framework and KPI
139
Employment conditions
There are many indicators available to do with compliance associated with the well-being of
employees (Hunt, 2013). Workers must be supplied with certain information and records have
to be kept. Businesses have to abide by laws and regulations to do with:
Employee wages/remuneration and benefits.
Working hours, holidays, sick leave.
Livelihood security.
Use of trained staff.
Using immigrants in the workplace.
Clothing requirements.
Health and safety, handling of chemicals, records that must be held, etc.
Contract labour.
Employee engagement.
Personnel Management/Review.
Seasonal labour.
Staff training/skills development and enhancement.
Working times.
Visitors to a workplace.
As businesses grow they are also more likely to employ labour outside of the family. There are
constraints to the use of labour; some of these will be personal, for example, farmers may limit
the number of hours they work so that they can spend time with their family. For hired labour
there are legal constraints imposed by a large number of Acts covering employee rights and
workplace safety. This means many of the SAFA good governance and social well-being
measures at the firm level for health and safety and working conditions can be measured by
compliance with New Zealand legislation.
Outcome S3: Equity is supported
Pursuit of a strict policy of equity and non-discrimination and pro-active support for
vulnerable groups.
Similar to the previous two outcomes, the equity46 outcome closely follows that included in the
SAFA framework (Table 6.4). The one distinction lies in combining gender with other forms of
discrimination as opposed to having a separate objective. Thus, the equity outcome comprises
two objectives, ‘maintaining equity processes’ and ‘improving support for vulnerable people’. As
an indicator of social well-being, equity includes measures relevant to society as a whole, with
indicators of equity and participation specific to the workplace included in the governance KPIs.
The two objectives refer to very general sets of goals to ensure non-discrimination and to
encourage responsibility toward the needs of more vulnerable people or communities.
46 The cornerstone of human rights is the International Bill of Rights which is formed by three instruments: the
Universal Declaration of Human Rights (1948); the International Covenant on Civil and Political Rights (1966); and
the International Covenant on Economic, Social and Cultural Rights (1966).
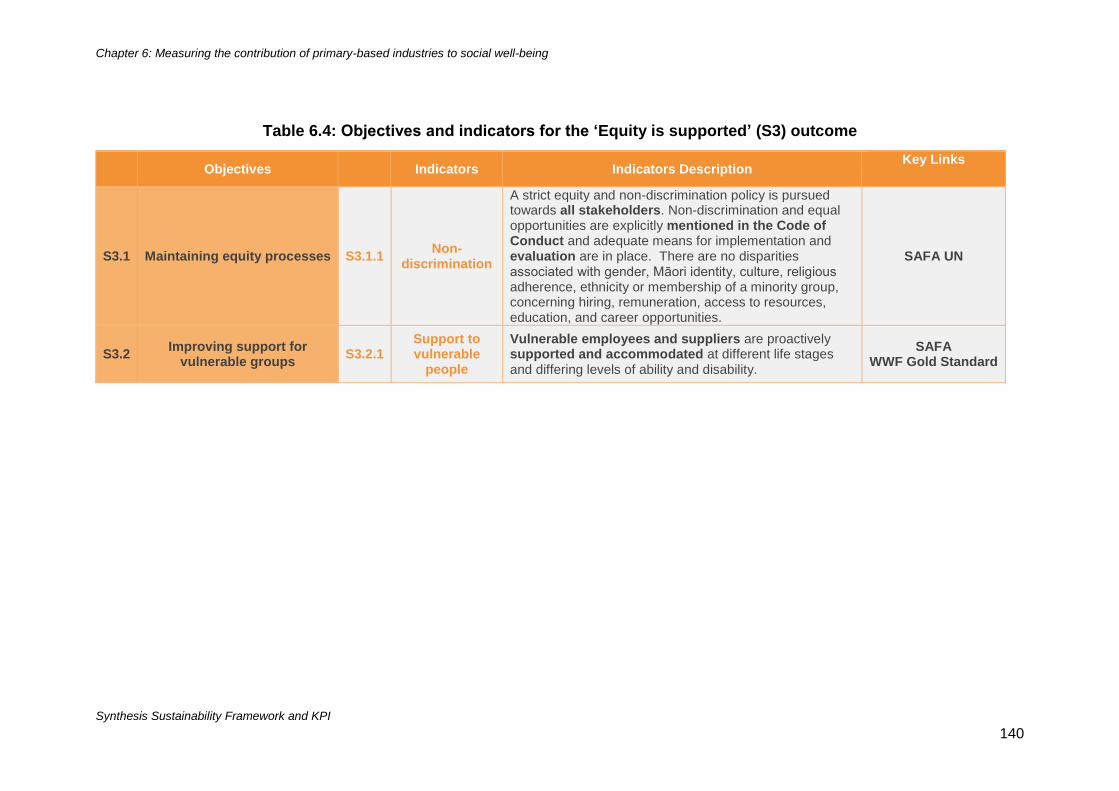
Chapter 6: Measuring the contribution of primary-based industries to social well-being
Synthesis Sustainability Framework and KPI
140
Table 6.4: Objectives and indicators for the ‘Equity is supported’ (S3) outcome
Objectives Indicators Indicators Description Key Links
S3.1 Maintaining equity processes S3.1.1 Non-
discrimination
A strict equity and non-discrimination policy is pursued towards all stakeholders. Non-discrimination and equal opportunities are explicitly mentioned in the Code of Conduct and adequate means for implementation and evaluation are in place. There are no disparities associated with gender, Māori identity, culture, religious adherence, ethnicity or membership of a minority group, concerning hiring, remuneration, access to resources, education, and career opportunities.
SAFA UN
S3.2 Improving support for
vulnerable groups S3.2.1
Support to vulnerable
people
Vulnerable employees and suppliers are proactively supported and accommodated at different life stages and differing levels of ability and disability.
SAFA WWF Gold Standard
Chapter 6: Measuring the contribution of primary-based industries to social well-being
Synthesis Sustainability Framework and KPI
141
Objective 3.1: Maintaining equity processes
The first objective in the equity outcome involves the development of processes which can verify
that the pursuit of equity is an active element of business practice, both within the enterprise
and in its business and community relationships. Most aspects of this objective are regulated
under New Zealand legislation, although the experience of less powerful participants in the
value-chain can be more difficult to assess through official statistics or reporting. Compliance is
assessed by means of a single indicator:
Non-discrimination—includes employment statistics such as the number of reported
incidents of discrimination and equity of salary among identified subgroups (e.g., gender,
ethnicity, etc.) as well as a self-assessment of the extent to which cultural, social or
spiritual values can be expressed without recrimination (see Gibson et al., 2010).
Objective 3.2: Improving support for vulnerable groups
Within the outcome, a further objective focuses more specifically on the less powerful members
of society as participants in the value-chain. The selected indicator for the objective draws on
proposed indicators outside of the SAFA framework to assess the support provided to such
groups in order to mitigate the impediments on their participation:
Support to vulnerable people—assesses the support offered to and inclusion of employees
and suppliers. Specific measures include both documentation of accessibility improvements in
the workplace as well as self-assessment of access to psychological support or protection from
bullying (see Littig and Griessler, 2005; WWF Gold Standard, cited in Richards, 2011).While
these factors are not specifically associated with sustainability, they raise very important issues
from the perspective of ethical social interactions. It is suggested that no occurrence of
discrimination at any level is acceptable. Support to vulnerable people is particularly relevant
with relation to an immigrant labour force, which is considered to be in a more vulnerable position
while working in New Zealand (Human Rights Commission, n.d.). Compliance with this outcome
would relate to criteria established in Fair Trade frameworks (ETI).
Outcome S4: Human health and safety is prioritised
The work environment is safe, hygienic and healthy and caters to the satisfaction of
human needs, such as clean water, food, accommodation and sanitary installations.
In the recommended NZSD and the SAFA framework, the impacts of the value chain on human
health and safety are considered outcomes/themes in the social well-being pillar. This follows
the description of the desired outcome/theme for both: a safe, hygienic and healthy work
environment that meets human needs with regard to food, water and shelter and provides
access to sanitary installations (Error! Not a valid bookmark self-reference.5). This desired
outcome extends beyond the immediate work environment to the impacts of workplace practices
on the health of the affected community. The structure of the outcome includes similar objectives
– namely, ‘maintaining safe, hygienic and healthy environments’ and ‘improving facilities to meet
basic human needs’ – to the SAFA sub-themes (‘workplace safety and health provisions’,
‘community health’), save for the presence of indicators for both health and safety policy and
action in the recommended framework. The recommended KPIs for assessing compliance with
Chapter 6: Measuring the contribution of primary-based industries to social well-being
Synthesis Sustainability Framework and KPI
142
the objectives and progress towards the health and safety outcome are all focused on workplace
practice and include readily collected quantitative data or documentation.
Objective 4.1: maintaining safe, hygienic and healthy environments
The first objective in the health and safety outcome deals to the processes which are expected
to enable safe, hygienic and healthy environments. These processes include practices of
planning and monitoring that ensure both proactive implementation of policies as well as the
continuous assessment of the state of compliance with and the performance of such policies:
Health and safety policy—records and assesses evidence of a health and safety policy
in the form of either the simple existence of a written plan or a more thorough accounting
of the frequency of health and safety training (see SAI).
Absenteeism—the amount of sick leave an employee takes is an indication to the
employer of the health of the workforce involved in the enterprise and that, with the
level of absenteeism, could be a reflection on working conditions. Also, from a
financial perspective, absenteeism costs an employer so it is something management
wish to minimise. According to New Zealand’s Holidays Act 200347, the purpose of
having sick leave is to promote a balance between work and other aspects of
employees’ lives.48 Under the Holidays Act 2003, all employees are entitled to a
minimum of five days paid sick leave a year after the first six months of employment
and an additional five days after each subsequent 12 month period.49 50
Objective 4.2: improving facilities to meet basic human needs
In addition to the confirmation of policy and processes related to health and safety, a second
objective for this outcome addresses the physical infrastructure of the enterprise. In this case,
the workplace and management practices and the tools and machinery used to facilitate them
are viewed as having the potential to impact on health and safety of both participants in the
value-chain and the communities within which the practices occur. The selected indicators use
both official reporting as well as participant self-assessment:
47 http://www.legislation.govt.nz/act/public/2003/0129/latest/DLM236387.html 48 http://www.legislation.govt.nz/act/public/2003/0129/latest/DLM236393.html 49 http://www.dol.govt.nz/workplace/knowledgebase/item/1244 50 An Australian website states that an acceptable level of absenteeism is 6.5 days of sick leave per
year. The Australian average is 9.4 days a year and 5 days for corporate staff. Some organisations with
professional staff aim for 2 to 3 days per employee. If people have little control over their work and do
not have access to flexible work practices average absences can rocket to 20 days a year. On average,
public servants took 11 days off work in 2010-11. See
http://www.afr.com/p/national/work_space/absenteeism_reflects_sick_organisation_QvCKWp1C
z5dtUNGF1rdhaN).
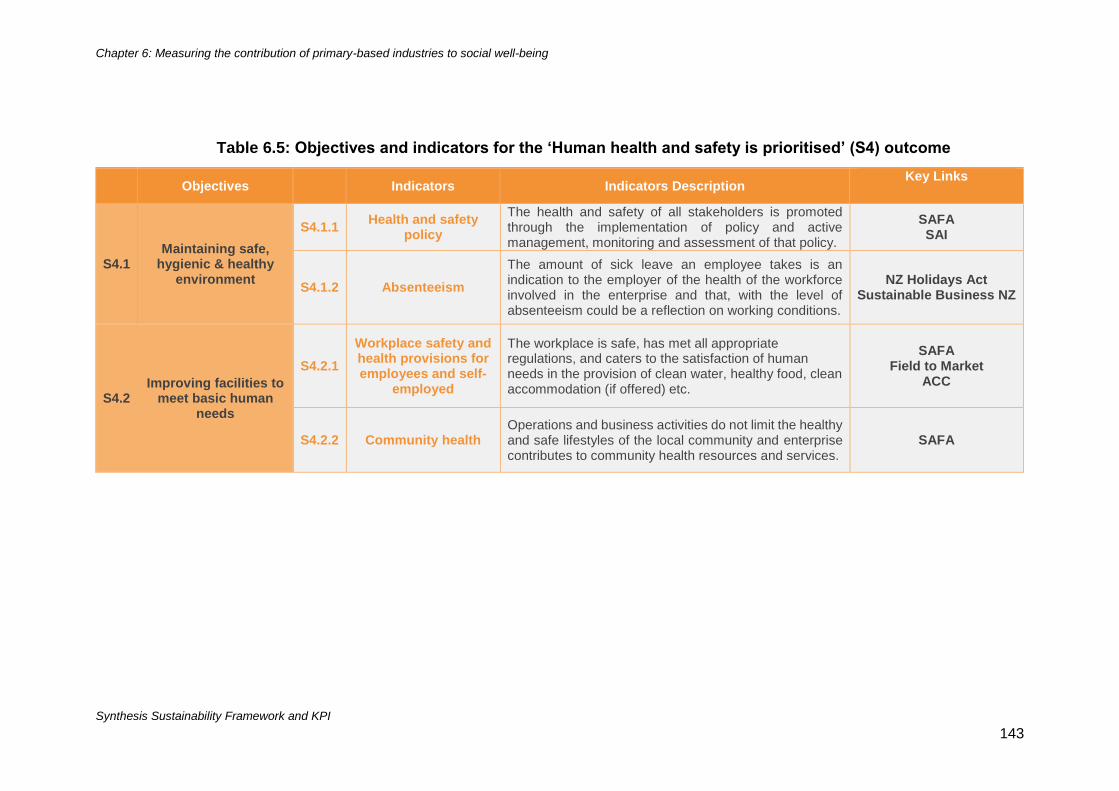
Chapter 6: Measuring the contribution of primary-based industries to social well-being
Synthesis Sustainability Framework and KPI
143
Table 6.5: Objectives and indicators for the ‘Human health and safety is prioritised’ (S4) outcome
Objectives Indicators Indicators Description Key Links
S4.1 Maintaining safe,
hygienic & healthy environment
S4.1.1 Health and safety
policy
The health and safety of all stakeholders is promoted through the implementation of policy and active management, monitoring and assessment of that policy.
SAFA SAI
S4.1.2 Absenteeism
The amount of sick leave an employee takes is an indication to the employer of the health of the workforce involved in the enterprise and that, with the level of absenteeism could be a reflection on working conditions.
NZ Holidays Act Sustainable Business NZ
S4.2 Improving facilities to
meet basic human needs
S4.2.1
Workplace safety and health provisions for employees and self-
employed
The workplace is safe, has met all appropriate regulations, and caters to the satisfaction of human needs in the provision of clean water, healthy food, clean accommodation (if offered) etc.
SAFA Field to Market
ACC
S4.2.2 Community health Operations and business activities do not limit the healthy and safe lifestyles of the local community and enterprise contributes to community health resources and services.
SAFA
Chapter 6: Measuring the contribution of primary-based industries to social well-being
Synthesis Sustainability Framework and KPI
144
Workplace safety and health provisions for employees and the self-employed—
includes measures of the frequency of health and safety incidences at the workplace
(see Field to Market, 2012) or, in the New Zealand situation, a good or improving
Accident Compensation Corporation (ACC) rating of the enterprise. (The ACC rating
determines the levy imposed on the enterprise in accordance with its accident record. In
New Zealand this government corporation compensates individuals for accidents rather
than having them go through a litigation process. In order to pay for this ACC charges a
work levy based on injury rates across industry categories. On 1 April 2011, it introduced
an experience rating - a system of modifying a business’s ACC work levy based on its
claims history. Historically a business paid the same work levy as others operating in the
same industry, despite differences in their safety record. Experience rating rewards
those business owners with safer workplaces, and encourages a focus on improving
workplace safety and making New Zealand businesses better places to work.51) Thus
measures of workplace safety could be:
Injury rates/lost time injury frequency – rate of frequency per million hours
worked.52
ACC experience rating - percentage loading/discount rate of company’s standard
industry levy.
Additional measures would be required to assess the state of any facilities provided for
workers, which might include food, water and accommodation. These latter measures
are of most relevance in situations where an itinerant or migrant workforce is involved.
Community health—assesses the commitment of an enterprise to the health of the
community by means of the life expectancy of the population residing within a
determined radius of impact (see Field to Market, 2012; DEFRA, 2012) or more directly
(albeit without an assessment of impact) through evidence of community notification with
regard to potentially dangerous activities (see Robledo, 2007).
Outcome S5: Community resilience is enhanced
Respect for the rights (including intellectual property rights) of indigenous
communities and the rights of all stakeholders to choose their lifestyle, production
and consumption choices.
The community resilience outcome is the most distinctive compared to the social well-being
themes found in the SAFA (2013) framework. While some of the objectives appear as sub-
themes elsewhere in SAFA (namely the cultural development theme), those included in the
recommended framework are combined as indicators that contribute to the resilience of the
communities affected by the value chain. The ‘community resilience’ outcome (Table 6.6) has
been added to account for aspects of social sustainability identified in both international
literature (Colantonio, 2009; DEFRA, 2012; Gibson et al., 2010) and prior ARGOS research
findings that do not fit comfortably within the SAFA framework themes. The achievement of this
51 http://www.acc.co.nz/for-business/experience-rating/index.htm 52 In 2007 Dairy InSight found that the accident rate of dairy farming in New Zealand was reported as third
worst in terms of injuries per person employed for the industry (Tipples et al., 2012).
Chapter 6: Measuring the contribution of primary-based industries to social well-being
Synthesis Sustainability Framework and KPI
145
outcome is defined as the responsibility of the participants in the value chain to respect the
indigenous knowledge and Waitangi Treaty claims of Māori specifically and the right to make
lifestyle, production and consumption choices for all stakeholders and communities affected by
activities more generally. The outcome comprises nine objectives that circumscribe the various
aspects of the outcome from indigenous rights (‘commitment to bi-culturalism’ and ‘respect of
knowledges’) to consumption choices (‘product quality’ and ‘innovation/experimentation as
practice’) to productive engagement with the community (‘food sovereignty’, ‘contribution to local
community’, ‘social capital’, ‘human capital’, ‘identity/sense of place’). Together these objectives
are intended to account for less easily measured concepts, which address progress toward
greater resilience or potential sustainability.
Objective 5.1: Respecting cultural use rights and worldviews
This objective in the social resilience outcome attempts to account for the specific conditions of
New Zealand society given the distinctive status and rights of Māori. In the New Zealand context,
reference to culture and its role in social sustainability is strongly influenced by the relationship
between Māori and Pakeha and the statutory role of the Treaty of Waitangi. A more
comprehensive description of a Māori approach to a sustainability framework and KPIs can be
found in a separate report (Reid et al., 2013) and summarised as a chapter in this report. For
the broader social well-being KPIs reported here, however, the framework proposes an indicator
of consultation with Māori as evidence of compliance within the value-chain:
Commitment to bi-culturalism—confirms the documentation of consultation first with
Māori and subsequently with other cultural or ethnic groups in relation to access to and
exploitation of local resources in the value chain (UN, 1998). This measure would be
predicated by the development of a consultation process in collaboration with locally
active organisations.
Knowledges—involves more explicit assessment of the conservation of and respect
for diverse, and in particular Māori, knowledge. In this case, the difficulty rests in the
need for valuation conducted by the affected population, which may not recognise the
parameters within which the enterprise operates. The suggested indicator attempts to
address this challenge by requiring the documentation of the extent to which diverse
knowledge systems are acknowledged in the normal practice of any participants within
the value chain (LOAM, cited in Aldrich and Sayer, 2007). The reference to and
engagement with local and tacit (in addition to scientific) knowledge in management
decisions and research design is of particular relevance to this measure.
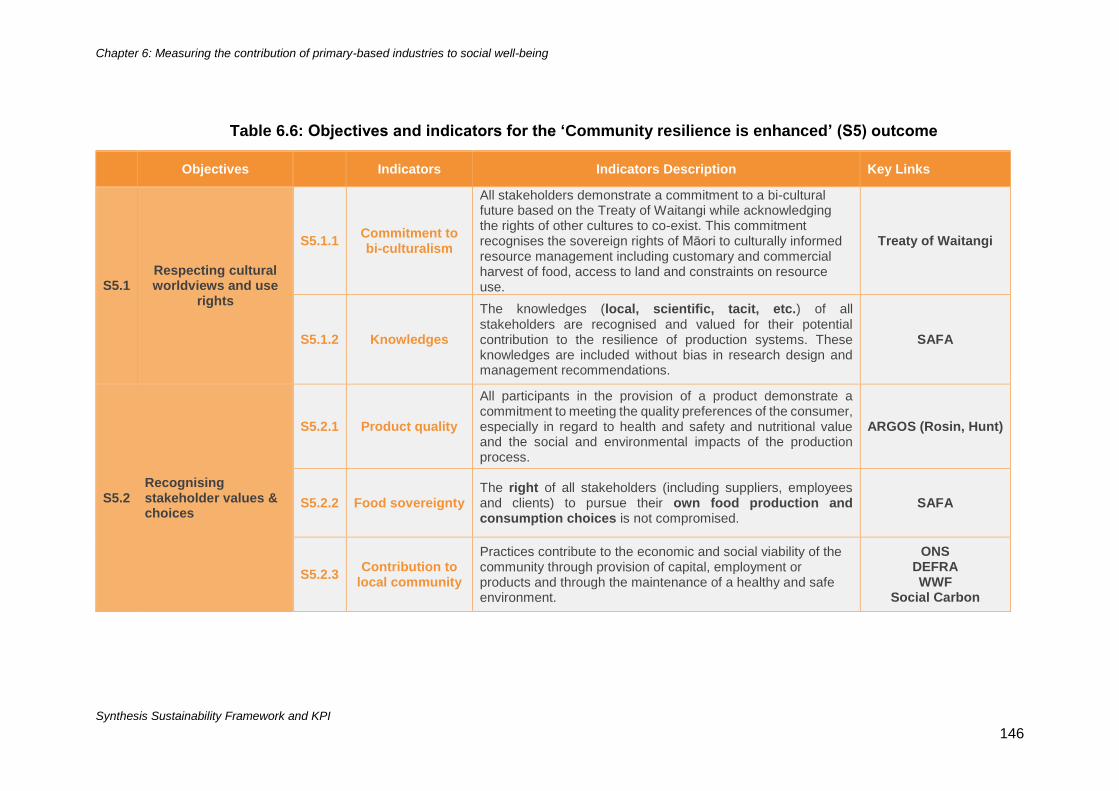
Chapter 6: Measuring the contribution of primary-based industries to social well-being
Synthesis Sustainability Framework and KPI
146
Table 6.6: Objectives and indicators for the ‘Community resilience is enhanced’ (S5) outcome
Objectives Indicators Indicators Description Key Links
S5.1 Respecting cultural worldviews and use
rights
S5.1.1 Commitment to bi-culturalism
All stakeholders demonstrate a commitment to a bi-cultural future based on the Treaty of Waitangi while acknowledging the rights of other cultures to co-exist. This commitment recognises the sovereign rights of Māori to culturally informed resource management including customary and commercial harvest of food, access to land and constraints on resource use.
Treaty of Waitangi
S5.1.2 Knowledges
The knowledges (local, scientific, tacit, etc.) of all stakeholders are recognised and valued for their potential contribution to the resilience of production systems. These knowledges are included without bias in research design and management recommendations.
SAFA
S5.2 Recognising stakeholder values & choices
S5.2.1 Product quality
All participants in the provision of a product demonstrate a commitment to meeting the quality preferences of the consumer, especially in regard to health and safety and nutritional value and the social and environmental impacts of the production process.
ARGOS (Rosin, Hunt)
S5.2.2 Food sovereignty The right of all stakeholders (including suppliers, employees and clients) to pursue their own food production and consumption choices is not compromised.
SAFA
S5.2.3 Contribution to
local community
Practices contribute to the economic and social viability of the community through provision of capital, employment or products and through the maintenance of a healthy and safe environment.
ONS DEFRA WWF
Social Carbon
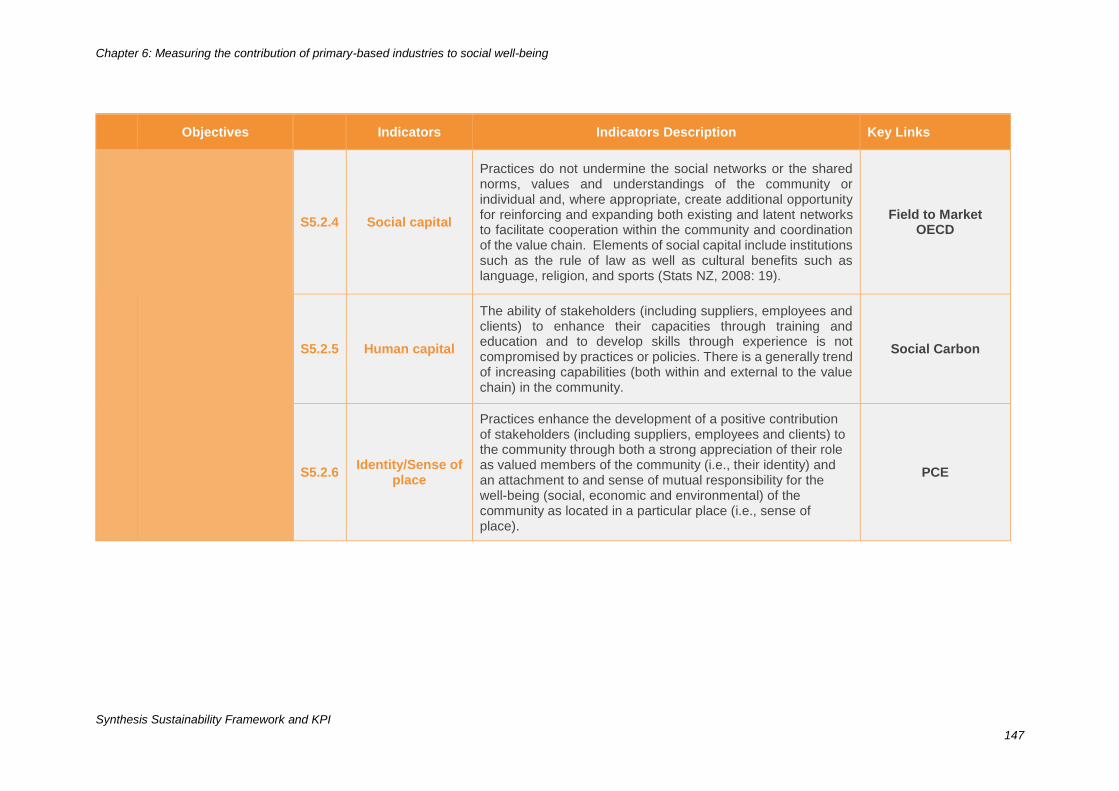
Chapter 6: Measuring the contribution of primary-based industries to social well-being
Synthesis Sustainability Framework and KPI
147
Objectives Indicators Indicators Description Key Links
S5.2.4 Social capital
Practices do not undermine the social networks or the shared norms, values and understandings of the community or individual and, where appropriate, create additional opportunity for reinforcing and expanding both existing and latent networks to facilitate cooperation within the community and coordination of the value chain. Elements of social capital include institutions such as the rule of law as well as cultural benefits such as language, religion, and sports (Stats NZ, 2008: 19).
Field to Market OECD
S5.2.5 Human capital
The ability of stakeholders (including suppliers, employees and clients) to enhance their capacities through training and education and to develop skills through experience is not compromised by practices or policies. There is a generally trend of increasing capabilities (both within and external to the value chain) in the community.
Social Carbon
S5.2.6 Identity/Sense of
place
Practices enhance the development of a positive contribution of stakeholders (including suppliers, employees and clients) to the community through both a strong appreciation of their role as valued members of the community (i.e., their identity) and an attachment to and sense of mutual responsibility for the well-being (social, economic and environmental) of the community as located in a particular place (i.e., sense of place).
PCE
Chapter 6: Measuring the contribution of primary-based industries to social well-being
Synthesis Sustainability Framework and KPI
148
Objective 5.2: Recognising stakeholder values and choices
The second objective for the outcome comprises a somewhat diverse set of measures that
account for factors that contribute to resilience as noted in the literature on social sustainability.
These include a set of indicators that refers to aspects of the orientation of productive practices
in the value chain, specifically the extent of commitment to the well-being of the community and
those that focus more exclusively on social dynamics (which can be influenced by practices of
the enterprise) that impact on the resilience and viability of communities:
Product quality—accounts for the level of commitment to consumer preferences and
concerns regarding both the quality (including health and safety related issues) of the
product and the impacts of the production process. While the compliance requirements
of meeting product quality standards fall within the economic resilience pillar, this focus
on the orientations of the employees in the enterprise is a social issue. The suggested
measure is an indirect assessment referred to as ‘breadth of view’, focusing on the
expressed emphasis on consumer concerns relative to other management and
production targets as indicated in a self-assessment in which such intentions are
assigned relative rankings (ARGOS, Rosin et al., 2010; Hunt et al., 2011).
Food sovereignty—assesses the impact of value chain activities on the capacity of
participants and affected communities (both locally and at broader scales) to pursue food
consumption preferences (including own production) in the community. Two measures
are suggested for this indicator; an accounting of the proportion of local food demand
that is met by self-produced food and a self-assessment of the accessibility of preferred
foods (scoring on a seven-point scale from very limited accessibility to very readily
accessible) (Robledo, 2007). The first measure addresses the potential for own
production in the community. The latter measure provides a potentially more relevant
set of data, albeit of a more subjective nature.
Contribution to local community—examines the extent to which the exploration of
innovative and alternative practices and technologies is encouraged within the
community (see ONS and DEFRA, 2007). It differs from similar indicators in the
economic resilience pillar of the framework in that the focus is on the influence of the
value chain on such capacity across stakeholders and within the broader community.
Because the causative links between the value chain and community capacity are
difficult to assess, the recommended indicator is the level of investment in organisations
and infrastructure that enable educational opportunities and provide direct support to
innovative practices outside traditional occupational training within the value chain
(WWF Gold Standard, cited in Richards, 2011). The arguably tenuous linkage suggests
that the latter indicator is most likely a minor requirement of the framework until sufficient
data is collected to demonstrate whether a positive correlation with community resilience
exists. It also measures the extent to which the enterprise enhances the capacity of the
local community to realise well-being on the basis of the level of investment in the
community activities and services (Social Carbon, 2009).
Social capital—assesses the level of social cohesion within the value-chain and in its
relations with the local community and society more generally (OECD 2001a). The
suggested indicators for this measure include the extent of knowledge of colleagues’
Chapter 6: Measuring the contribution of primary-based industries to social well-being
Synthesis Sustainability Framework and KPI
149
practices (seven-point from very little knowledge to extensively shared knowledge) as
an indicator of collaborative innovation of relevance for decision-makers (Field to Market,
2012) and self-assessment of trust of neighbours (seven-point from very little trust to
very strong trust) for community members.
Human capital—measures the investment in the capacity and skills of the individuals
participating in or affected by the value chain. Compliance with this measure involves
the availability of educational and training opportunities in the community as indicative
of the positive influence – or, at least, the lack of negative impact – associated with the
operation of the value-chain and, more specifically, the enterprise (Social Carbon, 2009).
This accounting could be compared to average levels for other similar communities in
New Zealand.
Identity/Sense of place—attempts to account for the benefits to sustainability
associated with an individual’s awareness of and interest in the social and environmental
dynamics and features of their more immediate surroundings – that is, the place where
they reside (Hay 2006; PCE 2001). The suggested indicators address an individual’s
sense of place (seven-point from very weak association to the locality to very strong
association to the locality) and the level of investment by enterprises that is intended to
enhance the desirability of the locality (for example, in infrastructure and aesthetic
features) in order to assess trends in the local sense of place and account for activities
likely to promote this.
Conclusions
The initial prioritisation of social well-being KPIs on the basis of the SAFA (2013) framework is
an attempt to account for factors that have been recognised as important and relevant within an
international effort to harmonise sustainability assessment in the agriculture sector. The
inclusion of indicators that conform to this framework facilitate claims to comparability as well
as providing legitimacy within international forums. Where an assessment does not include
indicators to account for themes and sub-themes identified in the SAFA (2013) framework,
NZSD case study participants using that assessment will need to prepare a defence of such an
omission. Where outcomes and objectives that are not included in SAFA have been added, the
additional indicators would provide a point of difference and possible source of value to the
participants in the assessment.
Using the New Zealand wine and kiwifruit value chains as an example of contexts in which the
NZSD project is engaged, the identified KPIs would show a strong similarity to those of SAFA
(2013). Whereas some of the SAFA indicators were strongly associated with existing legal
codes in New Zealand, the KPIs still include recommendations for a focus on labour rights
beyond legal requirements to account for consumer scepticism with regard to treatment of
immigrant labour. In cases where differences occur, these often involve either slight variation in
definitions of an outcome/theme (for example, a broader reference to decent livelihoods to
include self-employed producers) or the definition of an objective/sub-theme (for example, the
targeting of specifically community heath factors).
Chapter 6: Measuring the contribution of primary-based industries to social well-being
Synthesis Sustainability Framework and KPI
150
Recommended KPIs also reflect a much larger set of objectives under the outcome of
community resilience than are contained in the SAFA (2013) framework. These are drawn from
the international literature on indicators of social sustainability as well as from previous ARGOS
research findings (i.e., breadth of view). All of these latter indicators are more exploratory and
attempt to measure aspects of sustainability that do not appear as traditional functions of the
value chain. As indicators which draw the attention of consumers, they are loosely comparable
with features of Fair Trade certification and provide a potential point of difference and act as
pre-emptive response to concerns about the broader social implications of a given value chain.
As a whole, the indicators identified here are, as noted above, an attempt to approach a more
representative set of sustainability indicators. The product is, by necessity, emergent – that is,
is should not be considered complete or relevant to all future concerns. As a result, the KPIs
included in the NZSD will require stakeholder input over time. The chosen indicators are, in
other words, subject to negotiation that may involve the identification of alternative measures to
account for data availability or new tools/techniques of measurement. Equally, it is possible that
the structure of the framework (its outcomes and objectives) may change to account for
changing emphasis in the public concerns for social well-being. The framework presented in
this document is an initial set of KPIs that are supported by existing assessment frameworks
and by the international literature on social sustainability. They, thus, are strongly recommended
as indicators of social well-being, providing a strong foundation on which to build a truly sector
specific set of measures.
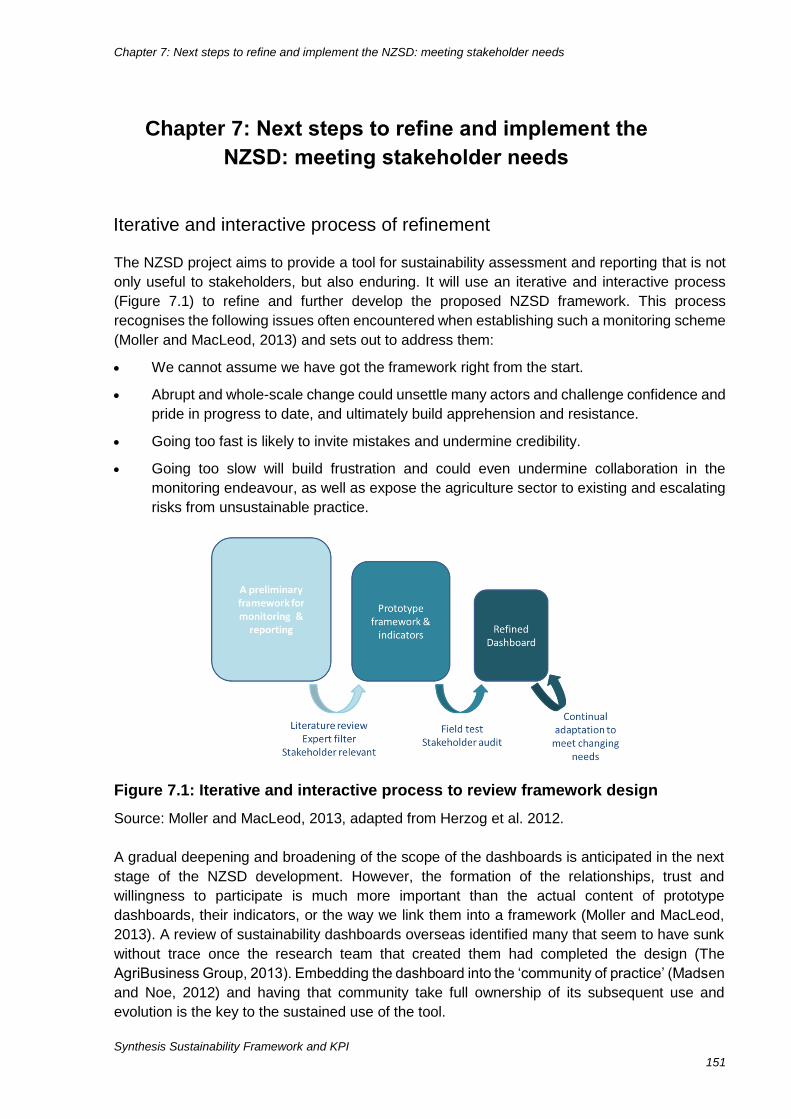
Chapter 7: Next steps to refine and implement the NZSD: meeting stakeholder needs
Synthesis Sustainability Framework and KPI
151
Iterative and interactive process of refinement
The NZSD project aims to provide a tool for sustainability assessment and reporting that is not
only useful to stakeholders, but also enduring. It will use an iterative and interactive process
(Figure 7.1) to refine and further develop the proposed NZSD framework. This process
recognises the following issues often encountered when establishing such a monitoring scheme
(Moller and MacLeod, 2013) and sets out to address them:
We cannot assume we have got the framework right from the start.
Abrupt and whole-scale change could unsettle many actors and challenge confidence and
pride in progress to date, and ultimately build apprehension and resistance.
Going too fast is likely to invite mistakes and undermine credibility.
Going too slow will build frustration and could even undermine collaboration in the
monitoring endeavour, as well as expose the agriculture sector to existing and escalating
risks from unsustainable practice.
Figure 7.1: Iterative and interactive process to review framework design
Source: Moller and MacLeod, 2013, adapted from Herzog et al. 2012.
A gradual deepening and broadening of the scope of the dashboards is anticipated in the next
stage of the NZSD development. However, the formation of the relationships, trust and
willingness to participate is much more important than the actual content of prototype
dashboards, their indicators, or the way we link them into a framework (Moller and MacLeod,
2013). A review of sustainability dashboards overseas identified many that seem to have sunk
without trace once the research team that created them had completed the design (The
AgriBusiness Group, 2013). Embedding the dashboard into the ‘community of practice’ (Madsen
and Noe, 2012) and having that community take full ownership of its subsequent use and
evolution is the key to the sustained use of the tool.
Chapter 7: Next steps to refine and implement the
NZSD: meeting stakeholder needs
Chapter 7: Next steps to refine and implement the NZSD: meeting stakeholder needs
Synthesis Sustainability Framework and KPI
152
Clarifying and harmonising sustainability goals
The very first step in goal definition is to clarify what is meant by ‘sustainability’ (Moller and
MacLeod, 2013). The concept of sustainability has broad political appeal and provides the basis
for several international monitoring frameworks (OECD, 2001; SAFA, 2013). However, despite
concerted academic effort by dedicated transdisciplinary teams, the concept of sustainability is
difficult to define in precise terms. Some argue that ‘defining sustainability is ultimately a social
and somewhat arbitrary choice about what to develop, what to sustain and for how long’ (Parris
and Kates, 2003). There is sometimes strident disagreement on which domains should be
included in sustainability assessment.
The NZSD provides a clear and common framework for defining sustainability goals, outcomes
and objectives for the businesses and organisations associated with New Zealand’s production
landscapes that will help stakeholders to make their own goals more explicit. The NZSD
framework design is based on a review of key sustainability goals and concepts set out in policy,
sustainability frameworks and the published literature to ensure it is not only scientifically robust,
but also relevant both locally and internationally (Figure 1.5).
Next steps in the NZSD framework development process will include:
Ensuring the framework is comprehensive. Embracing diverse values and goals can only
succeed if the process used to develop the framework and indicators is inclusive and
collaborative (Van den Belt, 2004). We will invite feedback on our preliminary framework
from key stakeholders and experts, to ensure that the NZSD encompasses a wide range
of goals of interest.
Tailoring the framework to meet specific stakeholder needs. What works for one sector or
ecological landscape may not help sustainability of a different sector, so taking a ‘one size
fits all’ approach to designing a single NZSD would be risky, especially if it is generated
mainly by consultants and researchers. Creating a single NZSD and attempting to insert
it within different sectors could also undermine crucial buy-in and excitement of the
participants and hosts who are co-designers rather than simple end-users. To
demonstrate how the proposed NZSD framework can be applied to meet specific needs,
we will focus initially on developing five prototype dashboards (kiwifruit, wine, Māori
enterprises, organic farming and forestry enterprises). As lessons emerge, we hope to
have subsequent development of NZSDs for aquaculture, dairy and sheep & beef and that
these will be more efficient because they will incorporate successful core features
developed for earlier dashboards.
Integrating and harmonising monitoring goals. It is aimed to understand how New Zealand
agro-ecosystems, global food supply chains and international economic forces are linked
to form a complex adaptive system (Moller and MacLeod 2013). This system is turbulent,
poorly understood and lacks coordinated communication and risk management. The
NZSD will reconnect multiple ‘layers and players’ and attempt to combine compliance,
reporting and learning into a complete package. Matching and integrating the NZSD with
local monitoring frameworks is important to address needs at an intermediate scale (e.g.
catchments, regional and national). New Zealand’s ecosystems and biodiversity (e.g.,
threatened indigenous biota) and agro-ecosystems, for example, require special
emphases; this not only highlights the importance of alignment to a coordinated
Chapter 7: Next steps to refine and implement the NZSD: meeting stakeholder needs
Synthesis Sustainability Framework and KPI
153
biodiversity monitoring and reporting system currently being developed by the Department
of Conservation and regional councils, but also an opportunity to support national
environmental policy, state of the environment reporting and inform sustainable land
management.
Indicator selection, development and implementation
Indicators are mostly quantitative measures that are selected to assess progress toward or
away from shared goals or to assess the state of a resource at any particular time (Parris and
Kates, 2003; Bell and Morse 2008). They are used as a vehicle for communicating information
in a summary form about issues important to stakeholders. Therefore, the choice of indicators
must not only match public and political needs, but also be analytically sound, measurable and
easy to interpret.
Prioritising indicators for deployment
All indicators in the NZSD framework are important for driving sustainable practice. The practical
reality is, however, that not all indicators can be deployed immediately. Approximate relative
ranking is needed, therefore, to capture maximum immediate benefit, depending on what is
required to obtain the necessary information and stakeholder priorities. Informing this
prioritisation process will require classifying indicators according to their importance, costs,
readiness for immediate deployment, measurability and sampling frequency (Figure 7.2).
To help the early stages of implementation, and identify where further development is required,
indicators could be broadly prioritised according to their importance (from a scientific
perspective) and cost (from a practical perspective; Figure 7.2). Where a potential indicator is
ranked of ‘low’ importance in the framework, this would need to be interpreted in a relative sense
only. We would expect relative importance to change as more stakeholders (farmers, industry,
regional and national policy makers) learn about agro-ecosystems and as food supply and
production chains experience unexpected turbulence. Each host industry would need to check
these scales and adjust ranks according to the specific opportunities and threats confronting
their own sector and regions. Whatever the sector-adjusted ranks for individual indicators, we
suggest that preliminary indicator selection considers all the design criteria set out in MacLeod
& Moller (2013), and is further prioritised as follows:
1. An iterative process of perfecting the framework should start by co-opting some of the more
fragmentary indicators already being monitored by each sector and then gradually migrating
and broadening the scope of monitoring into a long-term and more comprehensive package.
2. Policy relevance and direct link to keystone elements, feedbacks and drivers of the agro-
ecosystem is paramount, but it must also be meaningful and acceptable for the growers.
3. Time and monetary costs of monitoring need to be acceptable for both the individual growers
and the industry.
4. Only indicators that are already proven to be scientifically reliable and interpretable should
be immediately deployed across the entire sector.
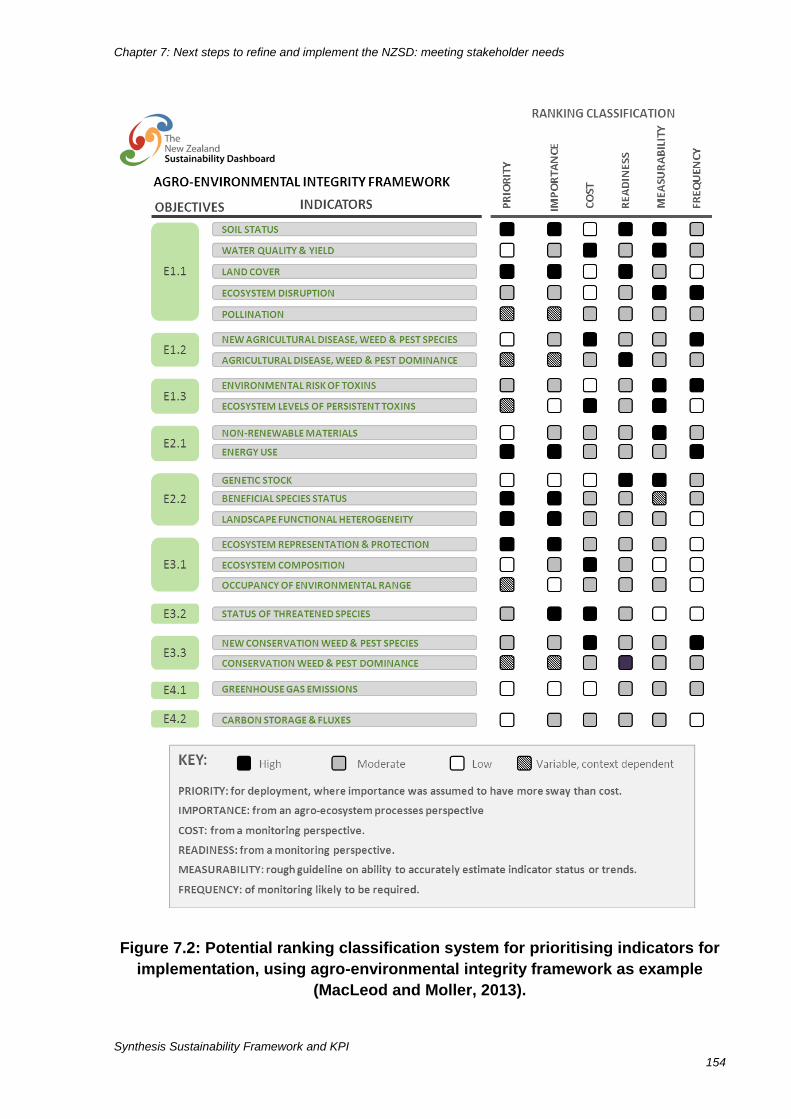
Chapter 7: Next steps to refine and implement the NZSD: meeting stakeholder needs
Synthesis Sustainability Framework and KPI
154
Figure 7.2: Potential ranking classification system for prioritising indicators for
implementation, using agro-environmental integrity framework as example
(MacLeod and Moller, 2013).
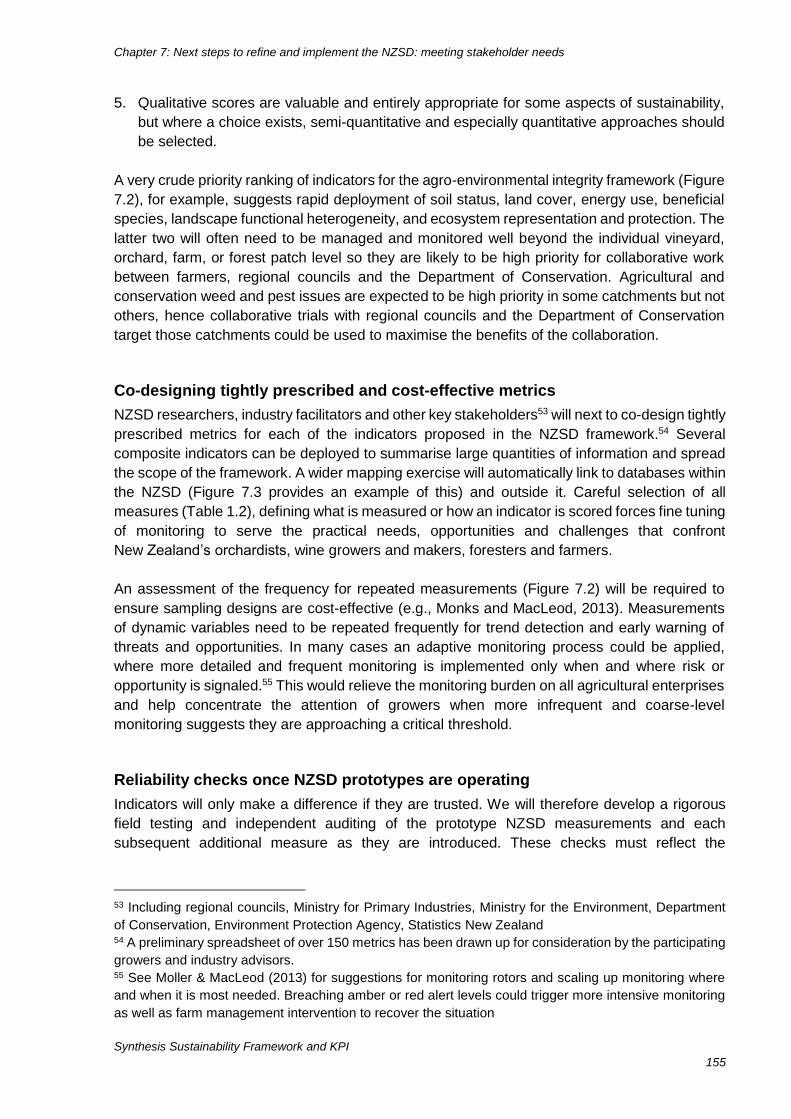
Chapter 7: Next steps to refine and implement the NZSD: meeting stakeholder needs
Synthesis Sustainability Framework and KPI
155
5. Qualitative scores are valuable and entirely appropriate for some aspects of sustainability,
but where a choice exists, semi-quantitative and especially quantitative approaches should
be selected.
A very crude priority ranking of indicators for the agro-environmental integrity framework (Figure
7.2), for example, suggests rapid deployment of soil status, land cover, energy use, beneficial
species, landscape functional heterogeneity, and ecosystem representation and protection. The
latter two will often need to be managed and monitored well beyond the individual vineyard,
orchard, farm, or forest patch level so they are likely to be high priority for collaborative work
between farmers, regional councils and the Department of Conservation. Agricultural and
conservation weed and pest issues are expected to be high priority in some catchments but not
others, hence collaborative trials with regional councils and the Department of Conservation
target those catchments could be used to maximise the benefits of the collaboration.
Co-designing tightly prescribed and cost-effective metrics
NZSD researchers, industry facilitators and other key stakeholders53 will next to co-design tightly
prescribed metrics for each of the indicators proposed in the NZSD framework.54 Several
composite indicators can be deployed to summarise large quantities of information and spread
the scope of the framework. A wider mapping exercise will automatically link to databases within
the NZSD (Figure 7.3 provides an example of this) and outside it. Careful selection of all
measures (Table 1.2), defining what is measured or how an indicator is scored forces fine tuning
of monitoring to serve the practical needs, opportunities and challenges that confront
New Zealand’s orchardists, wine growers and makers, foresters and farmers.
An assessment of the frequency for repeated measurements (Figure 7.2) will be required to
ensure sampling designs are cost-effective (e.g., Monks and MacLeod, 2013). Measurements
of dynamic variables need to be repeated frequently for trend detection and early warning of
threats and opportunities. In many cases an adaptive monitoring process could be applied,
where more detailed and frequent monitoring is implemented only when and where risk or
opportunity is signaled.55 This would relieve the monitoring burden on all agricultural enterprises
and help concentrate the attention of growers when more infrequent and coarse-level
monitoring suggests they are approaching a critical threshold.
Reliability checks once NZSD prototypes are operating
Indicators will only make a difference if they are trusted. We will therefore develop a rigorous
field testing and independent auditing of the prototype NZSD measurements and each
subsequent additional measure as they are introduced. These checks must reflect the
53 Including regional councils, Ministry for Primary Industries, Ministry for the Environment, Department
of Conservation, Environment Protection Agency, Statistics New Zealand 54 A preliminary spreadsheet of over 150 metrics has been drawn up for consideration by the participating
growers and industry advisors. 55 See Moller & MacLeod (2013) for suggestions for monitoring rotors and scaling up monitoring where
and when it is most needed. Breaching amber or red alert levels could trigger more intensive monitoring
as well as farm management intervention to recover the situation
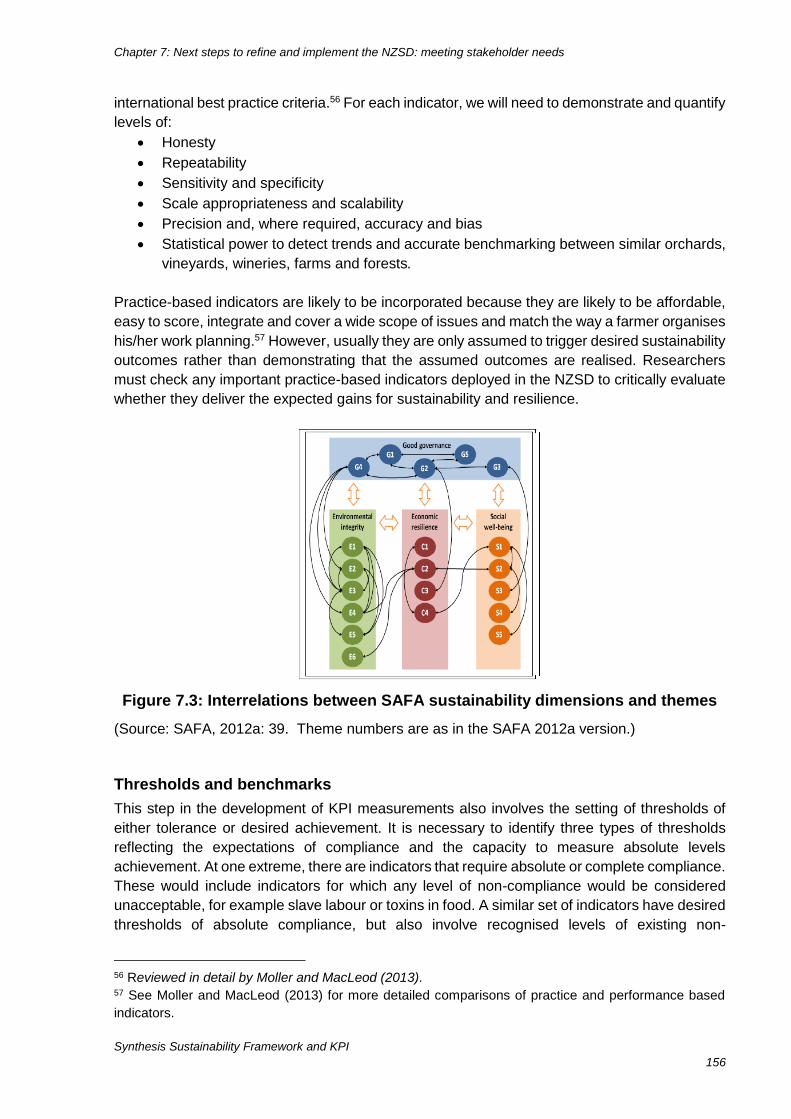
Chapter 7: Next steps to refine and implement the NZSD: meeting stakeholder needs
Synthesis Sustainability Framework and KPI
156
international best practice criteria.56 For each indicator, we will need to demonstrate and quantify
levels of:
Honesty
Repeatability
Sensitivity and specificity
Scale appropriateness and scalability
Precision and, where required, accuracy and bias
Statistical power to detect trends and accurate benchmarking between similar orchards,
vineyards, wineries, farms and forests.
Practice-based indicators are likely to be incorporated because they are likely to be affordable,
easy to score, integrate and cover a wide scope of issues and match the way a farmer organises
his/her work planning.57 However, usually they are only assumed to trigger desired sustainability
outcomes rather than demonstrating that the assumed outcomes are realised. Researchers
must check any important practice-based indicators deployed in the NZSD to critically evaluate
whether they deliver the expected gains for sustainability and resilience.
Figure 7.3: Interrelations between SAFA sustainability dimensions and themes
(Source: SAFA, 2012a: 39. Theme numbers are as in the SAFA 2012a version.)
Thresholds and benchmarks
This step in the development of KPI measurements also involves the setting of thresholds of
either tolerance or desired achievement. It is necessary to identify three types of thresholds
reflecting the expectations of compliance and the capacity to measure absolute levels
achievement. At one extreme, there are indicators that require absolute or complete compliance.
These would include indicators for which any level of non-compliance would be considered
unacceptable, for example slave labour or toxins in food. A similar set of indicators have desired
thresholds of absolute compliance, but also involve recognised levels of existing non-
56 Reviewed in detail by Moller and MacLeod (2013). 57 See Moller and MacLeod (2013) for more detailed comparisons of practice and performance based
indicators.
Chapter 7: Next steps to refine and implement the NZSD: meeting stakeholder needs
Synthesis Sustainability Framework and KPI
157
compliance. In these instances (e.g., women in management positions), the threshold may
involve evidence of an improving trend. A further set of indicators (e.g., contribution to local
community) has recommended levels or measures of achievement for which theorised or
assumed benefits can be attributed. In most cases, because of either the lack of pure scientific
experimentation or the high variability in social identity and character among individuals and
communities, the suggested thresholds will need to be adjusted in order to best represent the
context of the value chain within which they are applied.
The indicators which require absolute compliance are predominantly those related to ethical
behaviour. As noted above, these include many practices that are regulated by New Zealand
laws on employment, non-discrimination and health and safety. Shared international levels of
concern regarding these types of practices elevate the importance of compliance to avoid
consumer sanction of the value chain. In many cases, for example labour and human rights,
these indicators are also legally subject to compliance within New Zealand regulations. Other
examples of regulated practice involve practices without strict ethical boundaries, but that
involve legal considerations related to flexibility, openness, etc. Thresholds for such KPIs will
usually be set at a high level of compliance.
A second category of indicators involves practices that are not legally required, but are
considered representative of good or desirable practice by consumers or other external
observers. Generally, the impact of these practices is more difficult to measure, a factor which
partially explains their absence from commonly collected social statistics. As a result, the setting
of thresholds for these indicators faces several challenges: limited verification or policing of
compliance; limited justification of practice; lack of comparison with more general data. As a
result, thresholds are likely to be better applied to trends – showing improvement over time; to
require a broader range at threshold levels; and to involve continuous negotiation. In some
instances these types of indicators have been designated ‘minor’ requirements, which are
targeted but do not result in exclusion from certification.
A subset of the indicators of desirable practice include practices that are considered to be
closely related to the resilience of the value chain and the communities, ecologies and
economies with which it interacts. They reflect theorised relationships between social practice
or actions and resilience based on case study analysis in specific contexts. Thus, their
applicability in other contexts is not guaranteed. These are more likely to require continued
updating and monitoring along with more proven assessments of resilience. As with the main
set of desirable practices, threshold levels are difficult to set and may be highly context
dependent, reflecting the needs and character of the individuals, communities, ecosystems
involved.
Context. It is expected that the spreadsheet of indicators that has been developed for the
NZSD will need to be contextualised. First, the goals, which describe the sustainability
goal that is to be achieved, may need to be adapted or eliminated dependent on the
relevance to the sector (e.g., wine) and the level at which is the NZSD is supposed to
relate (e.g., family vineyard or corporate winery). Secondly, the core indicators will need
to be measured in a particular way, and with units of measurement that apply to their
context. For example, it is no use measuring production on a vineyard with the same
measurement that you would use to measure production in a winery.
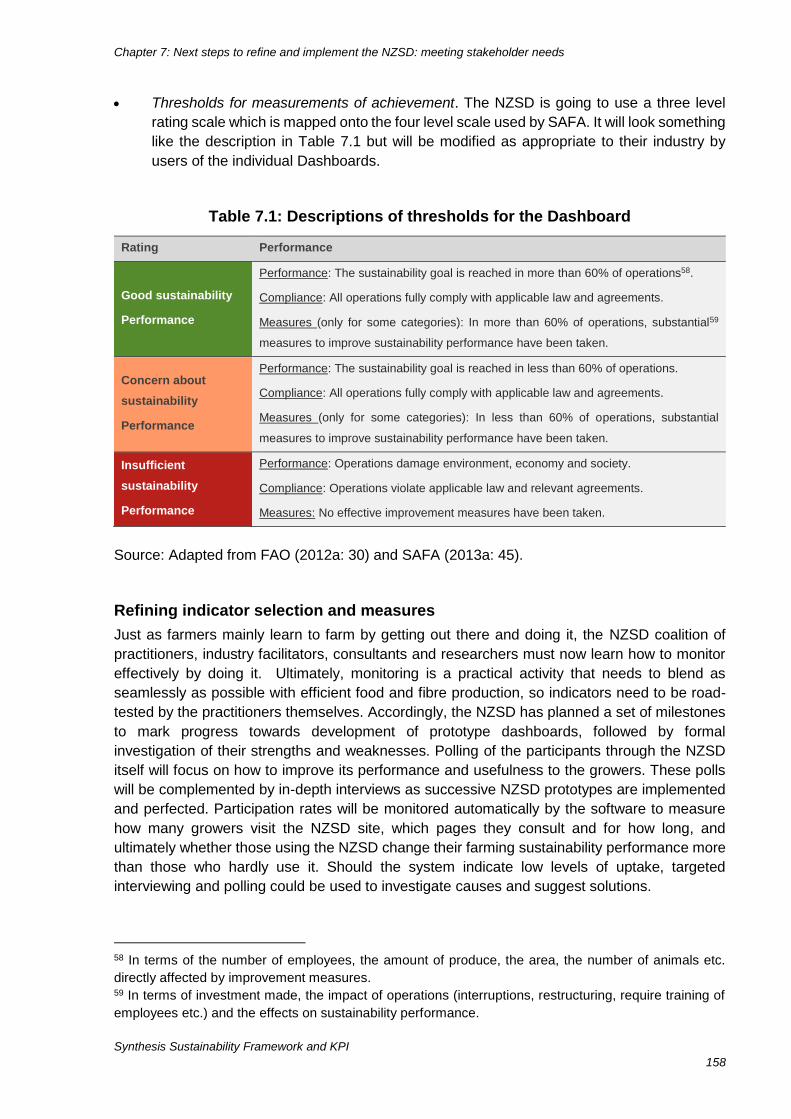
Chapter 7: Next steps to refine and implement the NZSD: meeting stakeholder needs
Synthesis Sustainability Framework and KPI
158
Thresholds for measurements of achievement. The NZSD is going to use a three level
rating scale which is mapped onto the four level scale used by SAFA. It will look something
like the description in Table 7.1 but will be modified as appropriate to their industry by
users of the individual Dashboards.
Table 7.1: Descriptions of thresholds for the Dashboard
Rating Performance
Good sustainability
Performance
Performance: The sustainability goal is reached in more than 60% of operations58.
Compliance: All operations fully comply with applicable law and agreements.
Measures (only for some categories): In more than 60% of operations, substantial59
measures to improve sustainability performance have been taken.
Concern about
sustainability
Performance
Performance: The sustainability goal is reached in less than 60% of operations.
Compliance: All operations fully comply with applicable law and agreements.
Measures (only for some categories): In less than 60% of operations, substantial
measures to improve sustainability performance have been taken.
Insufficient
sustainability
Performance
Performance: Operations damage environment, economy and society.
Compliance: Operations violate applicable law and relevant agreements.
Measures: No effective improvement measures have been taken.
Source: Adapted from FAO (2012a: 30) and SAFA (2013a: 45).
Refining indicator selection and measures
Just as farmers mainly learn to farm by getting out there and doing it, the NZSD coalition of
practitioners, industry facilitators, consultants and researchers must now learn how to monitor
effectively by doing it. Ultimately, monitoring is a practical activity that needs to blend as
seamlessly as possible with efficient food and fibre production, so indicators need to be road-
tested by the practitioners themselves. Accordingly, the NZSD has planned a set of milestones
to mark progress towards development of prototype dashboards, followed by formal
investigation of their strengths and weaknesses. Polling of the participants through the NZSD
itself will focus on how to improve its performance and usefulness to the growers. These polls
will be complemented by in-depth interviews as successive NZSD prototypes are implemented
and perfected. Participation rates will be monitored automatically by the software to measure
how many growers visit the NZSD site, which pages they consult and for how long, and
ultimately whether those using the NZSD change their farming sustainability performance more
than those who hardly use it. Should the system indicate low levels of uptake, targeted
interviewing and polling could be used to investigate causes and suggest solutions.
58 In terms of the number of employees, the amount of produce, the area, the number of animals etc.
directly affected by improvement measures. 59 In terms of investment made, the impact of operations (interruptions, restructuring, require training of
employees etc.) and the effects on sustainability performance.
Chapter 7: Next steps to refine and implement the NZSD: meeting stakeholder needs
Synthesis Sustainability Framework and KPI
159
We expect and encourage continual challenge and refinement of the indicators proposed and
especially rapid evolution of the metrics used for each indicator as the NZSDs are
operationalised. Nevertheless we have proposed a general framework that we hope is
sufficiently complete and flexible to confront global and national needs, while still being cast in
locally grounded and relevant terms for growers and agricultural industry sectors to future-proof
what they do best: the efficient production of high quality food and fibre in a way that maintains
the natural capital of the land and contributes to shared national and global goals for
environmental, economic, and social sustainability and resilience.
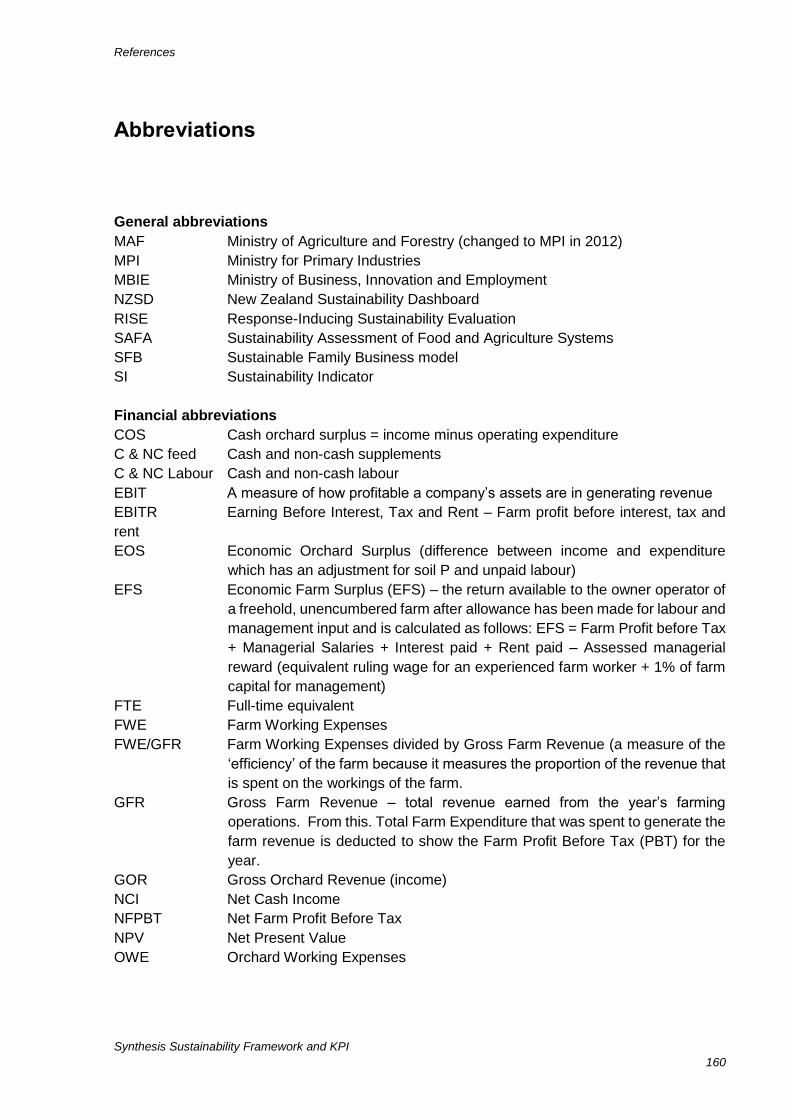
References
Synthesis Sustainability Framework and KPI
160
General abbreviations
MAF Ministry of Agriculture and Forestry (changed to MPI in 2012)
MPI Ministry for Primary Industries
MBIE Ministry of Business, Innovation and Employment
NZSD New Zealand Sustainability Dashboard
RISE Response-Inducing Sustainability Evaluation
SAFA Sustainability Assessment of Food and Agriculture Systems
SFB Sustainable Family Business model
SI Sustainability Indicator
Financial abbreviations
COS Cash orchard surplus = income minus operating expenditure
C & NC feed Cash and non-cash supplements
C & NC Labour Cash and non-cash labour
EBIT A measure of how profitable a company’s assets are in generating revenue
EBITR Earning Before Interest, Tax and Rent – Farm profit before interest, tax and
rent
EOS Economic Orchard Surplus (difference between income and expenditure
which has an adjustment for soil P and unpaid labour)
EFS Economic Farm Surplus (EFS) – the return available to the owner operator of
a freehold, unencumbered farm after allowance has been made for labour and
management input and is calculated as follows: EFS = Farm Profit before Tax
+ Managerial Salaries + Interest paid + Rent paid – Assessed managerial
reward (equivalent ruling wage for an experienced farm worker + 1% of farm
capital for management)
FTE Full-time equivalent
FWE Farm Working Expenses
FWE/GFR Farm Working Expenses divided by Gross Farm Revenue (a measure of the
‘efficiency’ of the farm because it measures the proportion of the revenue that
is spent on the workings of the farm.
GFR Gross Farm Revenue – total revenue earned from the year’s farming
operations. From this. Total Farm Expenditure that was spent to generate the
farm revenue is deducted to show the Farm Profit Before Tax (PBT) for the
year.
GOR Gross Orchard Revenue (income)
NCI Net Cash Income
NFPBT Net Farm Profit Before Tax
NPV Net Present Value
OWE Orchard Working Expenses
Abbreviations
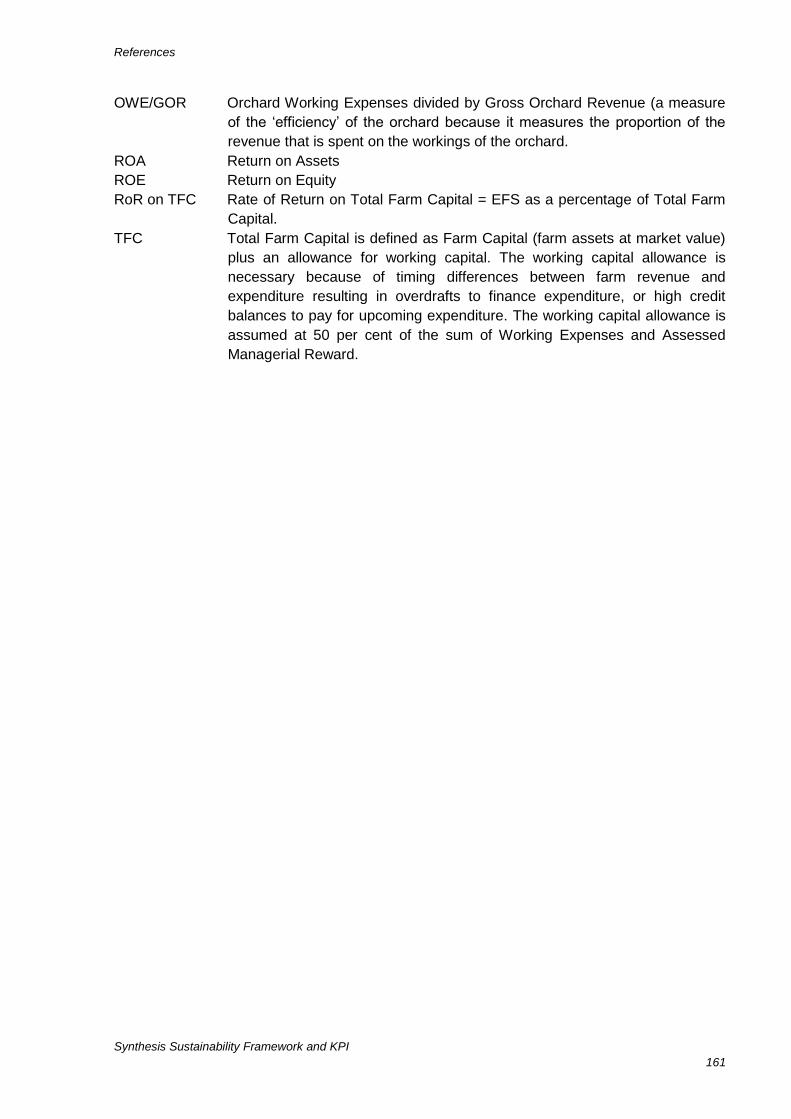
References
Synthesis Sustainability Framework and KPI
161
OWE/GOR Orchard Working Expenses divided by Gross Orchard Revenue (a measure
of the ‘efficiency’ of the orchard because it measures the proportion of the
revenue that is spent on the workings of the orchard.
ROA Return on Assets
ROE Return on Equity
RoR on TFC Rate of Return on Total Farm Capital = EFS as a percentage of Total Farm
Capital.
TFC Total Farm Capital is defined as Farm Capital (farm assets at market value)
plus an allowance for working capital. The working capital allowance is
necessary because of timing differences between farm revenue and
expenditure resulting in overdrafts to finance expenditure, or high credit
balances to pay for upcoming expenditure. The working capital allowance is
assumed at 50 per cent of the sum of Working Expenses and Assessed
Managerial Reward.
References
Synthesis Sustainability Framework and KPI
162
Abercrombie, N., Hill, S. and Turner, B.S. (1988). The Penguin dictionary of sociology. London: Penguin Books.
AccountAbility. (2011). AA1000 Stakeholder engagement standard 2011: Final exposure draft. Downloaded on 17/01/2013 from http://www.accountability.org/B34F2A96-8321-4BD5-8FA9-1BF750D745BA/FinalDownload/DownloadId-D3D3085FF43391050AE330C9E5FA8B43/B34F2A96-8321-4BD5-8FA9-1BF750D745BA/images/content/5/4/542/AA1000SES%202010%20PRINT.pdf
Adams, W.M. (2006). The future of sustainability: Re-thinking environmental and development in the twenty-first century. Report of the IUCN Renowned Thinkers Meeting, 29-31 January 2006. http://cmsdata.iucn.org/downloads/iucn_future_of_sustanability.pdf
Aldrich, M. and J. Sayer. (2007). In practice – Landscape Outcomes Assessment Methodology "LOAM". WWF Forests for Life Programme. Retrieved from: http://assets.panda.org/downloads/loaminpracticemay07.pdf Allen, R.B., Wright, E.F., MacLeod, C.J., Bellingham, P.J., Forsyth, D.M., Mason, N.W.H., Gormley, A.M., Marburg, A.E., MacKenzie, D.I. and McKay, M. (2009). Designing an inventory and monitoring programme for the Department of Conservation’s Natural Heritage Management System. Landcare Research Contract Report LC0809/153.
Animal Welfare Act (1999). Retrieved from: http://www.legislation.govt.nz/act/public/1999/0142/latest/DLM49664.html
Balmford, A., Green, R. and Phalan, B. (2012). What conservationists need to know about farming. Proceedings of the Royal Society Series B 279: 2714–2724.
Baynham, G. (2009). Building capability on Māori owned farms in Northland: consultancy guidelines. Whangarei: Enterprise Northland.
Bell, S. and Morse, S. (2008). Sustainability indicators: Measuring the immeasurable? (2nd ed.) London, U.K.: Earthscan.
Benton, T.G., Vickery, J.A. and Wilson, J.S. (2003). Farmland biodiversity: is habitat heterogeneity the key? Trends in Ecology and Evolution 18: 182–188
Blaustein, A.R. and Johnson, P.T.J. (2010). When an infection turns lethal. Nature 465: 881–882.
Boström, M. (2012). A missing pillar? Challenges in theorizing and practicing social sustainability: Introduction to the special issue. Sustainability: Science, Practice and Policy 8(1): 3-14.
Botha, N. and R. Carter. (2006). Social sustainability indicators for sheep and beef farmers. In FITT final Report 06FT175, 4. Wellington: Meat and Wool New Zealand.
Boyce Chartered Accountants. (2000). Goulburn Grazing Comparative Analysis 2000. Goulburn: Boyce Chartered Accountants.
Boyce, L., Meister, A. and Lang, S. (1999). An economic analysis of bird damage in vineyards of the Marlborough region. Palmerston North: Massey University.
Butchart, S.H.M., Stattersfield, A.J., Bennun, L.A., Akçakaya, H.R., Baillie, J.E.M., Stuart, S.N., Hilton-Taylor, C. and Mace, G.M. (2005). Using Red List Indices to measure progress towards the 2010 target and beyond. Philosophical Transactions of the Royal Society B 1454: 255–268.
References
References
Synthesis Sustainability Framework and KPI
163
Butchart, S.H.M., Walpole, M., Collen, B., van Strien, A,, Scharlemann, J.P.W., Almond, R.E.A., Baillie, J.E.M., Bomhard, B., Brown, C., Bruno, J., Carpenter, K.E., Carr, G.M., Chanson, J., Chenery, A.M., Csirke, J., Davidson, N.C., Dentener, F., Foster, M., Galli, A., Galloway, J.N., Genovesi, P., Gregory, R.D., Hockings, M., Kapos, V., Lamarque, J-F., Leverington, F., Loh, J., McGeoch, M.A., McRae, L., Minasyan, A., Hernández Morcillo, M., Oldfield, T.E.E., Pauly, D., Quader, S., Revenga, C., Sauer, J.R., Skolnik, B., Spear, D., Stanwell-Smith, D., Stuart, S.N., Symes, A., Tierney, M., Tyrrell, T.D., Vié, J-C. and Watson, R. (2010). Global biodiversity: indicators of recent declines. Science 328: 1164–1168.
Chamberlain, D.E., Fuller, R.J., Bunce, R.G.H., Duckworth, J.W. and Shrubb, M. (2000). Changes in the abundance of farmland birds in relation to the timing of agricultural intensification in England and Wales. Journal of Applied Ecology 37: 771–788.
Colantonio, A. (2009). Social sustainability: linking research to policy and practice. In paper presented at the 'Sustainable development: a challenge for European research' conference, 26-28 May 2009. Brussels.
Colantonio, A. (2011). Social sustainability: Exploring the linkages between research, policy and practice. In: Jaeger, C.C., Tàbara, D and Jaeger, J. (eds), European Research on Sustainable Development, Vol.1 Transformative science approaches for sustainability, pp.35-57.
Convention on Biological Diversity. (2011). Strategic plan for biodiversity 2011–2020 and the Aichi Targets. CBD.
Costanza, R., d’Arge, R., de Grott, R., Farber, S., Grasso, M., Hannon, B., Limburg, K., Naeem, S., O’Neill, R.V., Paruelo, J., Raskin, R.G., Sutton, P. and van den Belt, M. (1997). The value of the world’s ecosystem services and natural capital. Nature 387: 253–260.
Craig, J.L., Moller, H., Norton, D.A., Williams, M. and Saunders, D. (2013). Enhancing our Heritage: Conservation for 21st Century New Zealanders: Ways forward from the Tahi Group of Concerned Scientists. Pacific Conservation Biology (in press).
DairyNZ. (2007). Make the most of your Christmas break. Posted on Wednesday, 5 December 2007. Found on 20/01/2014 at: http://www.dairynz.co.nz/news/pageid/2145855875
DairyNZ. (2013a). DairyNZ Economic survey 2011/12. Retrieved from: http://www.dairynz.co.nz/page/pageid/2145871201?resourceId=779
DairyNZ. (2013b). Making dairy farming work for everyone. Strategy for sustainable dairy farming 2013-2020. Dairy NZ: Hamilton, NZ.. July 2013. Found on 20/01/2013 at: http://www.dairynz.co.nz/page/pageid/2145866853?resourceId=788
DairyNZ. (n.d.a). Develop your own strategic plan: develop strong guiding principles/values. Found on 22/01/2013 at http://www.dairynz.co.nz/file/fileid/27779
DairyNZ (n.d.b). Bay of Plenty focus farm. Found on 20/01/2014 at: http://www.dairynz.co.nz/page/pageid/2145855746/Bay_of_Plenty_Focus_Farm#ixzz2hkGjberl
DEFRA. (2012). Annex I – Sustainable Development Indicators 2012. Retrieved from: www.defra.gov.uk/new-sd-indicators/.
Didham, R.K., Denmead, L.H. and Deakin, E.L. (2012). Riches to rags: the ecological consequences of land use intensification in New Zealand. In Lindenmayer, D, Cunningham, S. and Young, A. (eds), Land use intensification. Effects on agriculture, biodiversity and ecological processes. CSIRO publishing
Donald, P.F., Green, R.E. and Heath, M.F. (2001). Agricultural intensification and the collapse of Europe’s farmland bird populations. Proceedings of the Royal Society London Series B 268: 25–29.
References
Synthesis Sustainability Framework and KPI
164
Ehm, F. (2010). The rule of law: concept, guiding principle and framework. Report to the European Commission for Democracy through Law (Venice Commission). Downloaded on 17/01/14 from http://www.venice.coe.int/webforms/documents/?pdf=CDL-UDT(2010)011-e
Erwin, P.M. (2010). Corporate Codes of Conduct: the effects of code content and quality on ethical performance. Journal of Business Ethics 99: 535-548.
FAO. (1989). Sustainable development and natural resources management. Twenty-fifth Conference, Paper C 98/2 – Sup. 2. Rome: Food and Agriculture Organization of the United Nations.
FAO. (2012a). SAFA (Sustainability Assessment of Food and Agriculture systems) Guidelines (Test Version 1.0). Rome: Natural Resources Management and Environment Department, FAO, 12 June 2012. Retrieved from: http://www.fao.org/fileadmin/templates/nr/sustainability_pathways/docs/SAFA_Guidelines_12_June_2012_final_v2.pdf
FAO. (2012b). SAFA. Sustainability Assessment of Food and Agriculture systems guidelines. Test version 1.1. Natural Resources Management and Environment Department. Rome: Food and Agriculture Organisation of the United Nations, 4 December 2012. Retrieved from: http://www.fao.org/B34F2A96-8321-4BD5-8FA9-1BF750D745BA/FinalDownload/DownloadId-4BCDA603079A1A5C7B9D3E730C6497C5/B34F2A96-8321-4BD5-8FA9-1BF750D745BA/docrep/017/ap773e/ap773e.pdf.
FAO/WHO. (2003). Recommended International Code of Practice: general principles of food hygiene. Rome: Food and Agriculture Organisation of the United Nations. Available at www.mhlw.go.jp/english/topics/imported foods/guideline/dl/04.pdf.
Farrell, A., and Hart, M. (1998). What does sustainability really mean? The search for useful indicators. Environment 40: 4-9, 26-31.
Field to Market (2012). Environmental and socioeconomic indicators for measuring outcomes of on-farm agricultural production in the United States: Second Report, (Version 2), December 2012. Retrieved from: www.fieldtomarket.org.
Fischer, J., Lindenmayer, D.B. and Manning, A.D. (2006). Biodiversity, ecosystem function and resilience: ten guiding principles for commodity production landscapes. Frontiers in Ecology and the Environment 4: 80–86.
Fischer, J., Brosi, B., Daily, G.C., Ehrlich, P.R., Goldman, R., Goldstien, J., Lindenmayer, D.B., Manning, A.D., Mooney, H.A., Pejchar, L., Ranganathan, J. and Tallis, H. (2008). Should agricultural policies encourage land sparing or wildlife-friendly farming? Frontiers in Ecology and Environment 6: 380–385.
Foley, J.A., DeFries, R., Asner, G.P., Barford, C., Bonan, G., Carpenter, S.R., Chapin, F.S., Coe, M.T., Daily, G.C., Gibbs, H.K., Helkowski, J.H., Holloway, T., Howard, E.A., Kucharik, C.J., Monfreda, C., Patz, J.A., Prentice, I.C., Ramankutty, N. and Snyder, P.K. (2005). Global consequences of land use. Science 309: 570–574.
FRC. (2013). Exposure draft: Guidance on the Strategic Report. Financial Reporting Council, (U.K.) August 2013. Retrieved from: http://www.frc.org.uk/Our-Work/Publications/Accounting-and-Reporting-Policy/Exposure-Draft-Guidance-on-the-Strategic-Report-File.pdf
Freeman, R.E. (1984). Strategic management: a stakeholder approach. Boston: Cambridge University Press.
Garibaldi, L.A., Steffan-Dewenter, .I, Winfree, R., Aizen, M.A., Bommarco, R., Cunningham, S.A., Kremen, C., Carvalheiro, L.G., Harder, L.D., Afik, O., Bartomeus, I., Benjamin, F., Boreux, V., Cariveau, D., Chacoff, N.P., Dudenhöffer, J.H., Freitas, B.M., Ghazoul, J., Javorek, S.K., Kennedy, C.M., Krewenka, K.M., Krishnan, S., Mandelik, Y., Mayfield, M.M., Motzke, I., Munyuli, T.M., Nault, B.A., Otieno, M., Petersen, J., Pisanty, G., Potts, S.G., Rader, R., Ricketts, T.H., Rundlöf, M., Seymour, C.L., Schüepp, C., Szentgyörgyi, H., Taki, H.,
References
Synthesis Sustainability Framework and KPI
165
Tscharntke, T., Vergara, C.H., Viana, B.F., Wanger, T.C., Westphal, C., Williams, N. and Klein, A.M. (2013). Wild pollinators enhance fruit set of crops regardless of honey bee abundance. Science 339: 1608–1611.
Gibson, R. B., S. Hassan, S. Holtz, J. Tansey and G. Whitelaw. (2010). Sustainability assessment: Criteria and processes. London: UK: Earthscan.
Global Reporting Initiative (GRI). (2006). Sustainability reporting guidelines. Version 3. GRI: Amsterdam.
Global Reporting Initiative (GRI). (2011a). Sustainability reporting guidelines: Version 3.1. GRI: Amsterdam. Downloaded on 12/03/2013 from https://www.globalreporting.org/resourcelibrary/G3.1-Guidelines-Incl-Technical-Protocol.pdf
Global Reporting Initiative (GRI). (2011b). Sustainability reporting guidelines. Version 3.1. Food Processing Sector Supplement. Global Reporting Initiative, Amsterdam. Retrieved from: www.globalreporting.org/ReportingFramework/SectorSupplements/FoodProcessing).
Global Reporting Initiative (GRI). (2012). Frequently asked questions about the G4 Exposure Draft and the second G4 Public Comment Period. Downloaded on 12/03/2013 from https://www.globalreporting.org/resourcelibrary/G4-ED-PCP2-FAQs.pdf
Global Reporting Initiative (GRI). (2013a). G4 Sustainability reporting guidelines: reporting principles and standard disclosures. GRI: Amsterdam. Downloaded on 14/01/2014 from https://www.globalreporting.org/resourcelibrary/GRIG4-Part1-Reporting-Principles-and-Standard-Disclosures.pdf
Global Reporting Initiative (GRI). (2013b). G4 Sustainability reporting guidelines: implementation manual. GRI: Amsterdam. Downloaded on 14/01/2014 from https://www.globalreporting.org/resourcelibrary/GRIG4-Part2-Implementation-Manual.pdf
Gray, D. (2005). The farm management process and farmer learning. In Shadbolt, N. and Martin, S. (eds), Farm Management in New Zealand, Melbourne, Australia: Oxford University Press, pp.42-61.
Green, R.E., Cornell, S.J., Scharlemann, J.P.W. and Balmford, A. (2005). Farming and the fate of wild nature. Science 307: 550–555.
Green, W. and Clarkson, B. (2005). Turning the tide? A review of the first five years of the New Zealand biodiversity strategy – the synthesis report. Retrieved from: http://www.doc.govt.nz/documents/conservation/nzbs-report.pdf
Group 100. (2003). Sustainability: A guide to Triple Bottom Line Reporting. Group 100 Inc., : An association of Australia’s senior finance executives from the nation’s business enterprises: Melbourne. Downloaded on 21/01/2014 from: http://www.group100.com.au/publications/G100_guide-tbl-reporting2003.pdf.
Hajjar, R., Jarvis, D.E. and Gemmill-Herrern, B. (2008). The utility of crop genetic diversity in maintaining ecosystem services. Agriculture, Ecosystems and Environment 123: 261–270.
Harmsworth, G. (2002). Indigenous concepts, values and knowledge for sustainable development: New Zealand case studies. Te Whare Wananga o Waikato/University of Waikato. Symposium conducted at the meeting of the 7th Joint Conference: "Preservation of Ancient Cultures and the Globalisation Scenario", India, 22-24 November.
Harmsworth, G. (2005). Report on the incorporation of traditional values/tikanga into contemporary Māori business organisation and process. Auckland: Mana Taiao Ltd.
Haslem, A. and Bennett, A.F. (2008). Birds in agricultural mosaics: the influence of landscape pattern and countryside heterogeneity. Ecological Applications 18: 185–196.

References
Synthesis Sustainability Framework and KPI
166
Herzog, F., Balázs, K., Dennis, P., Friedel, J., Geijzendorffer, I., Jeanneret, P., Kainz, M. and Pointereau, P. (2012). Biodiversity indicators for European farming systems. A guidebook. Retrieved from: www.biobio-indicator.org/deliverables/guidebook.pdf
Holdaway, R.J., Wiser, S.K. and Williams, P.A. (2012). Status assessment of New Zealand's naturally uncommon ecosystems. Conservation Biology 26: 619–629.
Human Rights Resource Centre. (2013). Developing global standards for the reporting and assurance of company alignment with the UN guiding principles on business and human rights. Human Rights Resource Centre., University of Indonesia, Jakarta. Downloaded on 20/01/14 from http://hrrca.org/content/developing-global-standards-reporting-and-assurance-company-alignment-un-guiding-principles-
Human Rights Commission. (n.d.) . The rights of migrants and their families. In, Human rights in NZ today: Chapter 17, Human Rights Commission: Wellington. Retrieved from: http://www.hrc.co.nz/report/summary/summary17.html#dcc
Hunt, L. (2013a). Business improvement sustainability frameworks and indicators: Literature review. ARGOS report: Number 13/05.
Hunt, L. (2013b). The New Zealand Sustainability Dashboard: Rankings of economic KPIs and lead indicators for the Sustainability Dashboard. ARGOS Working Paper.
Hunt, L., Fairweather, J., Rosin, C., Campbell, H., Lucock, D. And Greer, G. (2011). Doing the unthinkable: linking farmer’s breadth of view and adaptive propensity to the achievement of social, environmental and economic outcomes. Proceedings of the 18th International Farm Management Association Congress ‘Thriving in a global market: innovation, co-operation and leadership’, Methven, Canterbury, New Zealand. 20-25 March 2011, pp. 197-203.
ICL Chartered Accountants. (2013). Farm survey 2013. Alexandra: ICL Chartered Accountants. Retrieved from: http://www.iclca.co.nz/files/docs/farm%20survey%202013.pdf
IFAC (2011). Sustainability Framework 2.0: Professional accountants as integrators. International Federation of Accountants. (IFAC), March 2011. Retrieved from: http://www.accountability.org/images/content/4/3/435.pdf
IIRC. (2012). Integrated reporting: Prototype framework. International integrated Reporting Council (IIRC). Downloaded on 18/03/2013 from http://www.theiirc.org/wp-content/uploads/2012/11/23.11.12-Prototype-Final.pdf.
IUCN (2008). Guidelines for Using the IUCN Red List categories and criteria. Version 7.0. Gland, Switzerland: IUCN.
Jeanneret, P., Lüscher, G. and Denis, P. (2012). Species diversity indices. P 51–64. In Herzog, F., Balázs, K., Dennis, P., Friedel, J., Geijzendorffer, I., Jeanneret, P., Kainz, M. and Pointereau, P. (eds), Biodiversity indicators for European farming systems: A guidebook. Retrieved from: www.biobio-indicator.org/deliverables/guidebook.pdf
Jones, C. (2009). A performance measurement framework (PMF) for pest management. Landcare Research Contract Report: LC0910/055. MAF Contract No. 07 10630.
Jones, J.P.G., Asner, G.P., Butchart, S.H.M. and Karanth, K.U. (2013a). The ‘why’, ‘what’ and ‘how’ of monitoring for conservation. In, Macdonald, D.W. and Willis, K.J. (eds). Key Topics in Conservation Biology 2, First Edition, John Wiley & Sons, Ltd. (Chapter 18, in press), pp. 329–343.
Jones, B.A., Grace, D., Kock, R., Alonso, S., Rushton, J., Said, M.Y., McKeever, D., Mutua, F., Young, J., McDermott, J. and Pfeiffer, D.U. (2013b). Zoonosis emergence linked to agricultural intensification and climate change. PNAS 110(21): 8399–8404.
Keeble, J.J., Topiol, S., Berkeley, S. (2003). Using indicators to measure sustainability performance at a corporate and project level. Journal of Business Ethics 44(2/3): 149-158.
References
Synthesis Sustainability Framework and KPI
167
Kelly, T. and Bywater, T. (2005). The whole-farm systems approach. In Shadbolt, N. and Martin, S. (eds), Farm Management in New Zealand, Melbourne, Australia: Oxford University Press, pp.62-79.
Kelly, D.W., Poulin, R., Tompkins, D.M. and Townsend ,C.R. (2010). Synergistic effects of glyphosate formulation and parasite infection on fish malformations and survival. Journal of Applied Ecology 47: 498–504.
Kohl, D. (modified by Blonde, G.) (2009). Farm financial ratios and benchmarks: Calculations and implications. Centre for Dairy Profitability, University of Wisconsin- Madison. Downloaded on 7/08/13 from http://cdp.wisc.edu/pdf/FarmFinancialRatiosandBenchmarks3192009.pdf.
KPMG. (2011). Corporate sustainability: a progress report. KPMG International. Downloaded on 20/01/2014 at: https://www.kpmg.com/Global/en/IssuesAndInsights/ArticlesPublications/Pages/corporate-sustainability.aspx
Krebs, J.R., Wilson, J.D., Bradbury, R.B. and Siriwardena, G.M. (1999). The second Silent Spring? Nature 400: 611–612.
Kross, S.M., Tylianakis, J.M. and Nelson, X.J. (2011). Effects of introducing threatened falcons into vineyards on abundance of Passeriformes and bird damage to grapes. Conservation Biology 26: 142–149.
Labuschagne, C., Brent, A.C., van Erck, R.P.G. (2005). Assessing the sustainability performances of industries. Journal of Cleaner Production 13 (373-385).
Lee, W.G. and Allen, R.B. (2011). Recommended monitoring framework for regional councils assessing biodiversity outcomes in terrestrial ecoystems. Landcare Research Contract Report LC144. 29 p.
Lee, W., McGlone, M. and Wright, E. (2005). Biodiversity Inventory and Monitoring: A review of national and international systems and a proposed framework for future biodiversity monitoring by the Department of Conservation. Landcare Research Contract Report LC0405/122. 216 p.
Lee, W.G., Meurk, C.D. and Clarkson, B.D. (2008). Agricultural intensification: whither indigenous biodiversity? New Zealand Journal of Agricultural Research 51: 457–460.
Lenzen, M., Moran, D., Kanemoto, K., Foran, B., Lobefaro, L. and Geschke, A. (2012). International trade drives biodiversity threats in developing nations. Nature 486: 109–112.
Littig, B. and E. Griessler. (2005). Social sustainability: a catchword between political pragmatism and social theory. International Journal of Sustainable Development 8:65-79.
Lindenmayer, D.B., Zammit, C., Attwood, S.J., Burns, E., Shepherd, C.L., Kay, G. and Wood, J. (2012). A novel and cost-effective monitoring approach for outcomes in an Australian biodiversity conservation incentive program. PLoS ONE 7(12): e50872.
Loew, T. and Braun, S. (2006). Organisatorische Umsetzung von CSR. Vom Umweltmanagement zur Sustainable Corporate Governance. Institute 4 Sustainability, Berlin & future e.V., München. Retrieved from: www.4sustainability.org/downloads/Loew_Braun_2006_Organisatorische_Umsetzung_von_CSR.pdf.
Logan, D.P. and Xu, X. (2006). Germination of kiwifruit, Actinidia chinensis, after passage through Silvereyes, Zosterops lateralis. New Zealand Journal of Ecology 30: 407–11.
Maak, T. and Ulrich, P. (2007). Integrity management ethical orientation for business practice (released in German as Integre Unternehmensführung. Ethisches Orientierungswissen für die Wirtschaftspraxis). Schäefer Poeschel Verlag, Stuttgart, Germany.
References
Synthesis Sustainability Framework and KPI
168
Mace, G.M., Norris, K. and Fitter, A.H. (2012). Biodiversity and ecosystem services: a multi-layered relationship. Trends in Ecology and Evolution 27: 19–26.
MacLeod, C.J. and Moller, H. (2006). Intensification and diversification of New Zealand agriculture since 1960: An evaluation of current indicators of land use change. Agriculture Ecosystems & Environment 115: 201–218.
MacLeod, C.J. and Moller, H. (2013). Environmental monitoring for sustainable land management in New Zealand’s production landscapes. ARGOS Research Report 13/10.
MacLeod, C.J., Affield, K., Allen, R.B., Bellingham, P.J., Forsyth, D.M., Gormley, A.M., Holdaway, R.J., Richardson, S.J. and Wiser, S.K. (2012a). Department of Conservation biodiversity indicators: 2012 assessment. Landcare Research Contract Report LC1102.
MacLeod, C.J., Blackwell, G. and Benge, J. (2012b). Reduced pesticide toxicity and increased woody vegetation cover account for enhanced native bird densities on organic orchards. Journal of Applied Ecology 49: 652–660.
MacLeod, C.J., Gormley, A.M., Thomson, F.J. and Bellingham, P.J. (2012c). Designing a biodiversity monitoring and reporting system for the Greater Wellington Regional Council. Landcare Research Contract Report LC1190.
Madsen ML, Noe E (2012). Communities of practice in participatory approaches to environmental regulation. Prerequisites for implementation of environmental knowledge in agricultural context. Environmental Science & Policy 18: 25–33.
Manhire, J., Moller, H., Barber, A., Saunders, C., MacLeod, C., Rosin, C., Lucock, D., Post, E., Ombler, F., Campbell, H,, Benge, J., Reid, J., Hunt, L., Hansen, P., Carey, P., Rotarangi, S., Ford, S. and Barr, T. (2012). The New Zealand Sustainability Dashboard: Unified monitoring and learning for sustainable agriculture in New Zealand. ARGOS Working Paper No. 8. 40 + vi pages. Found at www.argos.org.nz
Martin, S., Zwart, T., Gardner, J. and Parker, W. (2005). Introduction. In, Martin, S. and Shadbolt, N. (eds), Farm Management in New Zealand, Oxford: Oxford University Press, pp.3-22.
Matson, P.A., Parton, W.J., Power, A.G. and Swift, M.J. (1997). Agricultural intensification and ecosystem properties. Science 277: 504–509.
McLean, D. (2002). Development of Māori land: Kellogg Rural Leaders Programme Report. Retrieved from: http://researcharchive.lincoln.ac.nz/bitstream/10182/4393/1/development_Māori_land.pdf
Meadows, S., Gradwohl, M., Moller, H., Rosin, C., MacLeod, C.J., Weller, F., Blackwell, G. and Perley, C. (2008). Pathways for integration of biodiversity conservation into New Zealand’s agricultural production. New Zealand Journal of Agricultural Research 51: 467–471.
Milestad, R. and Darnofer, I. (2003). Building farm resilience: the prospects of organic farming. Journal of Sustainable Agriculture 22: 81–97.
Millennium Ecosystem Assessment (MEA). (2005). Ecosystems and human well-being: Synthesis. Washington, DC: Island Press.
Ministry for the Environment (MfE). (2010). Measuring carbon emissions from land-use change and forestry. The New Zealand Land-Use and Carbon Analysis System. Retrieved from: http://www.mfe.govt.nz/publications/climate/carbon-emissions-land-use/measuring-carbon-emissions.pdf.
Ministry for the Environment (MfE) and Department of Conservation (DoC). (2000). The New
Zealand Biodiversity Strategy. Ministry for Environment & Department of Conservation:
Wellington. Retrieved from: http://www.biodiversity.govt.nz/pdfs/picture/nzbs-whole.pdf
References
Synthesis Sustainability Framework and KPI
169
Ministry for the Environment (MfE) and Department of Conservation (DoC). (2007). Protecting our places: Information about the Statement of National Priorities for Protecting Rare and Threatened Biodiversity on Private Land. Wellington: Ministry for the Environment.
Ministry for Primary Industries (MPI). (2012). Viticulture: Key results from the Ministry of Primary Industries 2012 viticulture monitoring programme. Retrieved from: http://www.mpi.govt.nz/news-resources/publications
Ministry for Primary Industries (MPI). (2013). Primary industries production and trade: June quarter 2013. Downloaded from http://www.mpi.govt.nz/news-resources/publications.aspx on 13/01/14.
Ministry of Business Innovation and Employment (MBIE). (2013). Minimum employment Rights. Retrieved from: http://www.dol.govt.nz/er/minimumrights/MinimumEmploymentRights.pdf
Ministry of Justice. (2012). Controller and Auditor-General, Fraud Awareness, Prevention and Detection in the Public Sector. Available at:http://justice.govt.nz/publications/global-publications/o/organised-crime-all-of-government-response/a-national-anti-corruption-strategy
Ministry of Justice. (n.d.). The New Zealand legal system: A guide to the constitution, government and legislature of New Zealand. Ministry of Justice: Wellington. Available from http://www.justice.govt.nz/publications/global-publications/t/the-new-zealand-legal-system
Moller, H. and MacLeod, C.J. (2013). Design criteria for effective monitoring of sustainability in New Zealand’s production landscapes. ARGOS Research Report 13/07.
Moller, H., MacLeod, C., Haggerty, M., Rosin, C., Blackwell, G., Perley, C., Meadows, S., Weller, F. and Gradwohl, M. (2008a). Intensification of New Zealand agriculture: implications for biodiversity. New Zealand Journal of Agricultural Research 51: 253–263.
Moller, H., Blackwell, G., Weller, F., MacLeod, C.J., Rosin, C., Gradwohl, M., Meadows, S. and Perley, C. (2008b). Social-ecological scales and sites of action: keys to conserving biodiversity while intensifying New Zealand’s agriculture? New Zealand Journal of Agricultural Research 51: 461–465.
Moller, H., Wearing, A., Pearson, A., Perley, C., Steven, D., Blackwell, G., Reid, J., Johnson, M.
(2005). Environmental monitoring and research for improved resilience of New Zealand
agriculture. Agriculture Research Group on Sustainability, Dunedin. ARGOS Working Paper No.
6. 136 pp.
Nelson, D.R., Adger, N. and Brown, K. (2007). Adaptation to environmental change: contributions of a resilience framework. 32: 395–419.
Nidumolu, R., Prahalad, C.K., and Rangaswami, M.R. (2009). Why sustainability is now the key driver of innovation. International Trade Forum 2009:4: 10. Excerpt from Harvard Business Review (Sept., 2009) 87.9: 56-64.
Norton, D. and Reid, N. (2013). Nature and farming. Sustaining native biodiversity in agricultural landscapes. CSIRO publishing.
Norton, S., Lucock, D., Moller, H. and Manhire, J. (2010). Energy return on investment for dairy and sheep/beef farms under conventional, integrated or organic management. Proceedings of the New Zealand Grassland Association 72: 145–150.
Organisation for Economic Co-operation and Development (OECD). (2001a). The well-being of nations: the role of human and social capital. Centre for Educational Research and Innovation, OECD: Paris, France.
Organisation for Economic Co-operation and Development (OECD). (2001b). Environmental indicators for agriculture. Methods and Results. Volume 3. OECD, Paris.
References
Synthesis Sustainability Framework and KPI
170
Organisation for Economic Co-operation and Development (OECD). (2004). Principles of good corporate governance. OECD, Paris. Downloaded on 17/01/2014 from http://www.oecd.org/corporate/ca/corporategovernanceprinciples/31557724.pdf
Office of National Statistics (ONS) and Department for Environment Food and Rural Affairs (DEFRA). (2007). Sustainable development indicators in your pocket. London: Defra Publications.
Olson, P.D., Zuiker, V.S., Danes, S.M., Stafford, K., Heck, R.K.Z. and Duncan K.A. (2003). The impact of the family and the business on family business sustainability. Journal of Business Venturing 18: 639-666.
Olsson, P., Folke, C. and Berkes, F. (2004). Adaptive co-management for building resilience in social-ecological systems. Environmental Management 34: 75–90.
Oman, I. and Spangenberg, J.H. (2002). Assessing social sustainability: the social dimension of sustainability in a socio-economic scenario. Proceedings of 7th Biennial Conference of the International Society for Ecological Economics, Sousse, Tunisia, 6-9 March 2002: Sustainable Europe Research Institute SERI, 1-20.
Parliamentary Commissioner for the Environment (PCE). (2004). Growing for good. Intensive farming, sustainability and New Zealand’s environment. Wellington: Parliamentary Commissioner for the Environment.
Parris, T.M. and Kates, R.W. (2003). Characterizing a sustainability transition: goals, targets, trends, and driving forces. Proceedings of the National Academy of Sciences (USA) 100: 8063–8073.
Phalan, B., Onial, M., Balmford, A. and Green, R.E. (2011). Reconciling food production and biodiversity conservation: land sharing and land sparing compared. Science 333: 1289–1291.
Porter, R.E.R., Rudgem M.R. and McLennan, J.A. (1994). Birds and small mammals – a pest control manual. Manaaki Whenua Press, Lincoln.
Power, A.G. (2010). Ecosystem services and agriculture: trade-offs and synergies. Philosophical Transactions Royal Society of London B 365: 2959–2971.
Pretty, J. (2008). Agricultural sustainability: concepts, principles and evidence. Philosophical Transactions of the Royal Society B 363: 447–465.
Pretty, J., Smith, G., Goulding, K.W.T., Groves, S.J., Henderson, I., Hine, R.E., King, V., van Oostrum, J., Pendlington, D.J., Vis, J.K. and Walter, C. (2008). Multi-year assessment of Unilever’s progress towards agricultural sustainability I: indicators, methodology and pilot farm results. International Journal of Agricultural Sustainability 6: 37–62.
Pretty, J., Sutherland, W.J., Ashby, J., Auburn, J., Baulcombe, D., Bell, M., Bentley, J., Bickersteth, S., Brown, K., Burke, J., Campbell, H., Chen, K., Crowley, E., Crute, I., Dobbelaere, D., Edwards-Jones, G., Funes-Monzote, F., Godfray, H.C.J., Griffon, M., Gypmantisiri, P., Hadda, L., Halavatau, S., Herren, H., Holderness, M., Izac, A.M., Jones, M., Koohafkan, P., Lal, R., Lang, T., McNeely, J., Mueller, A., Nisbett, N., Noble, A., Pingali, P., Pinto, Y., Rabbinge, R., Ravindranath, N.H., Rola, A., Roling, N., Sage, C., Settle, W., Sha, J.M., Shiming, L., Simons, T., Smith, P., Strzepeck, K., Swaine, H., Terry, E., Tomich, T.P., Toulmin, C., Trigo, E., Twomlow, S., Vis, J.K., Wilson, J. and Pilgrim, S. (2010). The top 100 questions of importance to the future of global agriculture. International Journal of Agricultural Sustainability 8: 219–236.
PricewaterhouseCoopers (PwC). (2013). Growing the productive baseof Māori freehold land.
Prepared for the Ministry for Primary Industries, February 2013. Retrieved from: http://www.mpi.govt.nz/Default.aspx?TabId=126&id=1734
Pyšek, P., Křivánek, M. and Jarošík, V. (2009). Planting intensity, residence time, and species traits determine invasion success of alien woody species. Ecology 90, 2734–44.
References
Synthesis Sustainability Framework and KPI
171
Reid, J. (2011). Māori land: A strategy for overcoming constraints on development. Doctoral Dissertation, Lincoln University, Canterbury, N.Z.
eid, J., Barr, T. and Lambert, S. (ed. Varona, G.). (2013). Indigenous sustainability indicators for Māori farming and fishing enterprises: a theoretical framework. ARGOS Report
Resource Management Act (RMA). (2013). Resource Management Act (RMA) 1991 Public Act No 69: Reprint as at 3 December 2013. New Zealand Legislation, Parliamentary Council Office: Wellington. Retrieved from: http://www.legislation.govt.nz/act/public/1991/0069/latest/DLM230265.html.
Richards, M. (2011). Social and Biodiversity Impact Assessment (SBIA) Manual for REDD+ Projects: Part 2 – Social Impact Assessment Toolbox. Washington, DC: Climate, Community & Biodiversity Alliance (CCBA) and Forest Trends with Rainforest Alliance and Fauna & Flora.
RISE. (2011). RISE (Response Inducing Sustainability Evaluation), version 2.0. Released on February 1st, 2011. Retrieved from: http://www.saiplatform.org/uploads/Modules/Library/What%20is%20RISE%202.pdf.
Robledo C. (2007). Manual for addressing social and institutional issues. Environment and community based framework for designing afforestation/reforestation projects in the CDM: methodology development and case studies. Retrieved from: http://www.joanneum.at/encofor/.
Rodriguez, J.P., Rodriguez-Clark, K.M., Baillie, J.E.M., Ash, N., Benson, J., Boucher, T., Brown, C., Burgess, N.D., Collen, B., Jennings, M., Keith, D.A., Nicholson, E., Revenga, C., Reyers, B., Rouget, M., Smith, T., Spalding, M., Taber, A., Walpole, M., Zager, I. and Zamin, T. (2011). Establishing IUCN Red List criteria for threatened ecosystems. Conservation Biology 25: 21–29.
Rosin, C., L. Hunt, H. Campbell, and J. Fairweather. (2010). Social Objective Synthesis Report 2: Social differentiation and choice of management system among ARGOS farmers/orchardists. ARGOS Research Report 10/03.
Rowarth, J.S. (2008). Agricultural intensification protects global biodiversity. New Zealand Journal of Agricultural Research 51: 451–455.
Ryan, T.J., Livingstone, P.G., Ramsey, D.S., de Lisle, G.W., Nugent, G., Collins, D.M. and Buddle, B.M. (2006). Advances in understanding disease epidemiology and implications for control and eradication of tuberculosis in livestock: the experience from New Zealand. Vet Microbiol.112: 211–219.
SAFA. (2013a). Sustainability Assessment of Food and Agriculture systems (SAFA) Draft Guidelines (Version 2.0). Natural Resources and Environment Department, FAO, July 2013. Retrieved from: http://www.fao.org/C87C3B76-06D2-4AAA-BF7E-952132DE6ACD/FinalDownload/DownloadId-103116B4FF23C33509E189487E4FE8FF/C87C3B76-06D2-4AAA-BF7E-952132DE6ACD/fileadmin/templates/nr/sustainability_pathways/docs/SAFA_Guidelines_12_June_2012_final_v2.pdf
SAFA. (2013b). Sustainability Assessment of Food and Agriculture systems (SAFA) Guidelines (Version 3.0). Natural Resources and Environment Department, FAO, December 2013. Retrieved from: http://www.fao.org/nr/sustainability/sustainability-assessments-safa/en/
SAFA. (2013c). Sustainability Assessment of Food and Agriculture systems (SAFA) Indicators. Natural Resources and Environment Department, FAO, December 2013. Retrieved from: http://www.fao.org/nr/sustainability/sustainability-assessments-safa/en/
Saunders, C., Kaye-Blake, W., Shadbolt, N. and Shettihewa, S. (2006). Business models and performance indicators for SMEs. Report for MAF, November 2006. AERU, Lincoln University.
References
Synthesis Sustainability Framework and KPI
172
Saunders, C., Kaye-Blake, W., Shadbolt, N., Zellman, E. and Hope, T. (2007a). Applicability of performance indicators to agribusinesses. Report for MAF, March 2007. AERU, Lincoln University.
Saunders, C., Kaye-Blake, W., Hayes, P. and Shadbolt, N. (2007b). Model development and key indicators applicable to agribusiness development. Report for MAF, May 2007. AERU, Lincoln University.
Saunders, C., Kaye-Blake, W., Hayes, P. and Shadbolt, N. (2007c). Business models and performance indicators for AgriBusinesses. Report for MAF, June 2007. AERU, Lincoln University.
Saunders, C., Zellman, E. and Kaye-Blake, W. (2007d). Applicability of performance indicators to farms and orchards. ARGOS Research Report: Number 07/04, July 2007.
Saunders, C.M., Kaye-Blake, W., Campbell, R. and Kolandai, K. (2010). Capital based sustainability indicators as a possible way for measuring agricultural sustainability. ARGOS Research Report 10/02.
Scott Cato, M. (2009). Green economics. London: Earthscan.
Saunders, C., Guenther, M. and Driver, T. (2013). Sustainability trends in key overseas markets to New Zealand and the KPI identification. ARGOS report.
Shadbolt, N. and Bywater, T. (2005). The dimensions of management. In Shadbolt, N. and Martin, S. (eds), Farm Management in New Zealand, Melbourne, Australia: Oxford University Press, pp.23-41.
Shadbolt, N. and Gardner, J. (2005). Financial management. In Shadbolt, N. and Martin, S. (eds), Farm Management in New Zealand, Melbourne, Australia: Oxford University Press, pp.139-181.
Shift and Mazars (2013). Developing global standards for the reporting and assurance of company alignment with the UN guiding principles on business and Human Rights. Discussion Paper Launch - May 1, 2013. Retrieved from: http://www.shiftproject.org/news/shift-and-mazars-launch-discussion-paper-comment
Simons, S., Bouvier, J-C., Debras, J-F., and Sauphanor, B. (2010). Biodiversity and pest management in orchard systems. A review. Agronomy for Sustainable Development 30: 139–152.
Smith, P., Martino, D., Cai, Z., Gwary, D., Janzen, H., Kumar, P., McCarl, B., Ogle, S., O’Mara, F., Rice, C., Scholes, B., Sirotenko, O., Howden, M., McAllister, T., Pan, G., Romanenkov, V., Schneider, U., Towprayoon, S., Watternbach, M. and Smith, J. (2008). Greenhouse gas mitigation in agriculture. Philosophical Transactions of the Royal Society B 363: 789–813.
Social Carbon. (2009). Social Carbon Guidelines. Manual for the development of projects and certification of social carbon credits. Version 03, May 2009. http://www.socialcarbon.org/ Guidelines/Files/socialcarbon_guidelines_en.pdf.
Spangenberg, J.H., Pfahl, S., Deller, K. (2002). Towards indicators for institutional sustainability: lessons from the analysis of Agenda 21. Ecological Indicators 2002(2(1-2)): 61-77.
Statistics New Zealand (Stats NZ). (2009). Measuring New Zealand’s progress using a sustainable development approach 2008. Wellington: Statistics New Zealand. Retrieved from: http://www.stats.govt.nz/searchresults.aspx?q=sustainability
Statistics New Zealand (Stats NZ). (2013). Find your industry benchmarks. Retrieved from: http://www.ird.govt.nz/industry-benchmarks/bm-find-your-benchmark/benchmarks-find-your-benchmark.html
References
Synthesis Sustainability Framework and KPI
173
Statistics NZ, Ministry for the Environment, Department of Conservation. (2013). Environment domain plan 2013: Initiatives to address our environmental information needs. Retrieved from: www.stats.govt.nz.
Steele, K. and Kanawa, L. (2009). Realising the productive capacity of Māori land – draft issue and context paper. Ministry of Agriculture and Forestry Māori Land Project. Wellington, Ministry of Agriculture and Forestry.
Sullivan, J.J. and Williams, P.A. (2002). The ecology, distribution and environmental weed potential of wild kiwifruit (Actinidia species) in the Bay of Plenty, New Zealand. Landcare Research Contract Report LC0102/166.
Sullivan, J.J., Timmins, S.M. and Williams, P.A. (2005). Movement of non-native plants into coastal native forests from gardens in northern New Zealand. New Zealand Journal of Ecology 29: 1–10.
Sullivan, J.J., Williams, P.A., Cameron, E.K. and Timmins, S.M. (2004). People and time explain the distribution of naturalized plants in New Zealand. Weed Technology 18: 1330–1333.
Tallis, H., Mooney, H., Andelman, S., Balvanera, P., Cramer, W., Karp, D., Polasky, S., Reyer, B., Ricketts, T., Running, S., Thonicke, K., Tietjen, B. and Walz, A. (2012). A global system for monitoring ecosystem service change. BioScience 62: 977–986.
The Economics of Ecosystems and Biodiversity (TEEB). (2010). Mainstreaming the economics of nature: a synthesis of the approach, conclusions and recommendations of TEEB. UNEP. Retrieved from: http://www.teebweb.org/wp-content/uploads/Study%20and%20Reports/Reports/Synthesis%20report/TEEB%20Synthesis%20Report%202010.pdf
The Agribusiness Group (2013). Sustainability Dashboard: A review of regulatory sustainability frameworks and indicators. ARGOS report.
The Montréal Process (2009). Criteria and indicators for the conservation and sustainable management of temperate and boreal forests. Fourth Edition, October 2009. Japan: Montréal Process. Retrieved from: http://www.montrealprocess.org/documents/publications/general/2009p_4.pdf
Thorpe, G. W. (1976). The Māori land incorporation: with specific reference to the Tairawhiti District. Auckland University.
Tipples, R., Hill, R. and Wilson, K. (2012). How did fatigue research come about and what
are we doing? South Island Dairy Event (SIDE) 2012. Retrieved from: http://www.side.org.nz/IM_Custom/ContentStore/Assets/11/80/e0920058505aa7f90308611c5dcd8e08/How-Did-Dairy-Fatigue-Research-Come-About.pdf
Tscharntke, T., Batáry, P., Clough, Y., Kleign, D., Scherber, C., Thies, C., Wanger, T.C. and Westphal, C. (2012). Combining biodiversity conservation with agricultural intensification. In Lindenmayer, D., Cunningham, S. and Young, A. (eds), Land use intensification. Effects on agriculture, biodiversity and ecological processes, CSIRO Publishing: Australia, pp 7–15.
Tylianakis, J.M. (2013). The global plight of pollinators. Science 339: 1532–1533.
United Nations (UN). (1998). Convention on access to information, public participation in decision-making and access to justice in environmental matters (The Aarhus convention). 28 pp. Aarhus: United Nations.
United Nations (UN). (2002). Johannesburg declaration on sustainable development. World Summit on Sustainable Development, 4 September 2002. UN Documents: Gathering a body of global agreements. Found at: http://www.un-documents.net/jburgdec.htm
References
Synthesis Sustainability Framework and KPI
174
United Nations (UN). (2008). Measuring sustainable development: Report of the Joint UNECE/OECD/Eurostat Working group on Statistics for Sustainable Development. New York or Geneva: United Nations.
UNEP/CBD/COP/3/14. (1996). Consideration of agricultural biodiversity under the convention on biological diversity. Convention on Biological Diversity, Third Meeting, Buenos Aires, 4-15 November 1996. Retrieved from: http://www.iisd.ca/biodiv/cop3/cop3_14_vfinal.htm
UNEP-WCMC (2011). Review of the biodiversity requirements of standards and certification schemes: a snapshot of current practices. Montréal, Canada: Secretariat of the Convention on Biological Diversity. Technical Series No. 63.
UNESCAP. (2009). What is Good Governance? United Nations Economic and Social Commission for Asia and the Pacific: Bangkok. Downloaded on 21/01/2013 from: http://www.unescap.org/pdd/prs/ProjectActivities/Ongoing/gg/governance.pdf.
UNGC/IFC. (2009). Corporate Governance. The foundation for corporate citizenship and sustainable business. United Nations Global Compact / International Finance Corporation. New York & Washington D.C. Retrieved from: www.unglobalcompact.org/docs/issues_doc/Corporate_Governance/Corporate_Governance_IFC _UNGC.pdf).
United Nations Human Rights Council (UNHRC). (2011). Report of the Special Representative of the Secretary-General on the issue of human rights and transnational corporations and other business enterprises, John Ruggie. Guiding Principles on Business and Human Rights: Implementing the United Nations “Protect, Respect and Remedy” Framework. Retrieved from: http://www.business-humanrights.org/SpecialRepPortal/Home/Protect-Respect-Remedy-Framework/GuidingPrinciples, or www.business-humanrights.org/media/documents/ruggie/ruggie-guiding-principles-21- mar-2011.pdf.
Vallance, R. (2002). Managing successful Māori Farms. New Zealand Property Journal, July: 21-23.
Vallance, S., Perkins, H.C. and Dixon, J.E. (2011). What is social sustainability? A clarification of concepts. Geoforum 42: 342-48.
Van den Belt, M. (2004). Mediated modelling. A system Dynamics approach to environmental consensus building. Washington, DC, Island Press. 339 + xxi p.
Waitangi Tribunal. (2011). Ko Aotearoas tenei: Tuatahi. Wellington: Waitangi Tribunal.
Waitangi Tribunal. (n.d.). The principles of the treaty. Wellington: Waitangi Tribunal. Retrieved from: http://www.justice.govt.nz/tribunals/waitangi-tribunal/treaty-of-waitangi/the-principles-of-the-treaty
Walker, B., Holling, C.S., Carpenter, S.R. and Kinzig, A. (2004). Resilience, adaptability and transformability in social-ecological systems. Ecology and Society 9(2): 5.
Walker, J.T.S., Hodson, A.J., Batchelor, T.A., Manktelow, D.W. and Tomkins, A.R. (1997). A pesticide rating system for monitoring agrichemical inputs in New Zealand horticulture. Proc. 50th NZ Plant Protection Conference 1997: 529–534.
Walmart. (2012). A guide to help suppliers understand the expectations and obligations of Walmart’s standards for suppliers. Ethical Sourcing, Wal-Mart Stores Inc., Bentonville, AR. January 2012. Retrieved from: http://cdn.corporate.walmart.com/0e/ca/52eda3d84f828f82da0e9a02f021/standards-for-suppliers-manual_129833075555266802.pdf
WCED (1987). Our common future. World Commission on environment and development. Oxford, England: Oxford University Press.
References
Synthesis Sustainability Framework and KPI
175
WHOQOL Group. (1995). The World Health Organization Quality of Life Assessment (WHOQOL): Position paper from the World Health Organization. Social Science and Medicine 41: 1401-1409.
Williams, P.A. and Cameron, E. (2006). Creating gardens: the diversity and progression of European plant introductions. In Allen, R.B. and Lee, W.G. (eds), Biological Invasions in New Zealand. Ecological Studies 186, Springer: Berlin, pp. 33–47.
Williams, P.A., Wiser, S.K., Clarkson, B. and Stanley, M. (2007). New Zealand’s historically rare terrestrial ecosystems set in a physical and physiognomic framework. New Zealand Journal of Ecology 31: 119–128.
Wilson, R.H., Charry, A.A. and Kemp, D.R. (2005). Performance indicators and benchmarking in Australian agriculture: synthesis and perspectives. Extension Farming Systems Journal 1(1): 47-58.
Wiser, S.K. and Buxton, R.P. (2008). Context matters: matrix vegetation influences native and exotic species composition on habitat islands. Ecology 89: 380–391.
Wood, J., Williams, A., Hughes, J.K., Black, M. and Murphy, R. (2010). Energy and the food system. Philosophical Transactions of the Royal Society B 365: 2991–3006.
Yoccoz, N.G., Nichols, J.D. and Boulinier, T. (2001). Monitoring of biological diversity in space and time. Trends in Ecology and Evolution 16: 446–453.
Yodzis, P. (1988). The indeterminacy of ecological interactions as perceived through
perturbation experiments. Ecology 69: 508–515.
References
Synthesis Sustainability Framework and KPI
176
Tables
Table 1.1: Qualities of good indicators ..................................................................................... 20
Table 1.2: Criteria for sets of indicators .................................................................................. 21
Table 2.1: NZSD detailed overarching goals .......................................................................... 23
Table 2.2: Government strategies aligning with the NZSD .............................................. 24
Table 2.3: Alignment of NZSD with Māori values ................................................................. 26
Table 2.4: SAFA (2013b) framework (Dimensions, Themes and Sub-themes)
showing sub-themes adopted in NZSD pillars .............................................................. 28
Table 2.5: Sustainability initiatives informing the design of the NZSD framework:
their origin, scope, drivers (■) and spatial scales ( ) ............................................... 29
Table 3.1: Key practices for achieving sustainable development goals in Māori
enterprises and institutions .................................................................................................. 38
Table 3.2: NZSD governance detailed outcomes and objectives ................................... 41
Table 3.3: Objectives associated with Outcome G1: Governance structure is
effective ........................................................................................................................................ 46
Table 3.4: Objectives associated with Outcome 2: Accountability is maintained .... 51
Table 3.5: Objectives associated with Outcome G3: Stakeholder participation is
enhanced ..................................................................................................................................... 54
Table 3.6: Objectives associated with Outcome G4: The Rule of Law is followed .. 59
Table 3.7: Objectives associated with Outcome G5: Management approach is
holistic ........................................................................................................................................... 67
Table 4.1: The NZSD Framework for Economic Resilience ............................................... 77
Table 4.2: Objectives and indicators for the ‘Financial well-being is maintained’ (C1)
outcome ....................................................................................................................................... 80
Table 4.3: Objectives and indicators for the ‘Vulnerability is minimised’ (C2)
outcome ....................................................................................................................................... 88
Table 4.4: Objectives and indicators of ‘Product quality and information is enhanced’
(C3) outcome ............................................................................................................................. 94
Table 4.5: Objectives and indicators for the ‘Contributed to creating value in local
economy’ (C4) outcome ......................................................................................................... 96
Table 4.6: Objectives and indicators for the ‘Production is efficient’ (C5) outcome
......................................................................................................................................................... 99
Table 5.1: NZSD agro-environmental integrity detailed outcomes and objectives
....................................................................................................................................................... 110
Table 5.2: Objectives and indicators for the natural capital outcome (E1), specifying
the indicator definition, the percentage of reviewed schemes that monitored
similar indicators and key international (SAFA) and local (BMRS and TBMF)
frameworks (MacLeod and Moller, 2013). .................................................................... 114
References
Synthesis Sustainability Framework and KPI
177
Table 5.3: Objectives and indicators for resilience (E2 outcome), specifying the
indicator definition, the percentage of reviewed schemes that monitored similar
indicators and key international (SAFA) and local (BMRS and TBMF) frameworks
(MacLeod and Moller, 2013). ............................................................................................. 118
Table 5.4: Objectives and indicators for natural heritage (E3 outcome), specifying
the indicator definition, the percentage of reviewed schemes that monitored
similar indicators and key international (SAFA) and local (BMRS and TBMF)
frameworks (MacLeod and Moller, 2013). .................................................................... 120
Table 5.5: Objectives and indicators for Global Environmental Change (E4
outcome), specifying the indicator definition, percentage of reviewed schemes
that monitored similar indicators and the key international (SAFA) and local
(BMRS and TBMF) frameworks (MacLeod and Moller, 2013)................................ 123
Table 6.1: NZSD Social well-being framework .................................................................... 130
Table 6.2: Objectives and indicators for the ‘Decent livelihoods are secured’ (S1)
outcome ..................................................................................................................................... 133
Table 6.3: Objectives and indicators for the ‘Working conditions are acceptable’ (S2)
outcome ..................................................................................................................................... 136
Table 6.4: Objectives and indicators for the ‘Equity is supported’ (S3) outcome . 140
Table 6.5: Objectives and indicators for the ‘Human health and safety is prioritised’
(S4) outcome ........................................................................................................................... 143
Table 6.6: Objectives and indicators for the ‘Community resilience is enhanced’ (S5)
outcome ..................................................................................................................................... 146
Table 7.1: Descriptions of thresholds for the Dashboard ................................................ 158
References
Synthesis Sustainability Framework and KPI
178
Figures
Figure 1.1: Nested sustainability where economy and social dimensions are
constrained by environment................................................................................................. 13
Figure 1.2: Interlinked nature of three pillars of sustainability ...................................... 14
Figure 1.3: The three pillars of sustainable development ................................................. 14
Figure 1.4: Outline of NZSD framework structure ............................................................... 17
Figure 1.5: Criteria used to select framework and indicators for New Zealand
Sustainability Dashboard ....................................................................................................... 18
Figure 2.1: NZSD overarching goals ......................................................................................... 22
Figure 3.1: Good governance (UNESCAP) ............................................................................... 34
Figure 3.2: Good governance framework in the NZSD ...................................................... 40
Figure 4.1: Economic Resilience Framework in the NZSD ................................................ 76
Figure 4.2: Dairy farm output, input and productivity movements ............................ 101
Figure 5.1: Environmental monitoring framework proposed for sustainable land
management in New Zealand’s production landscapes ........................................... 109
Figure 6.1: Social Well-being Framework in the NZSD .................................................... 129
Figure 7.1: Iterative and interactive process to review framework design.............. 151
Figure 7.2: Potential ranking classification system for prioritising indicators for
implementation, using agro-environmental integrity framework as example
(MacLeod and Moller, 2013). ............................................................................................. 154
Figure 7.3: Interrelations between SAFA sustainability dimensions and themes .. 156
Recommended