Framework for Evaluating Foreign Exchange ExposureManagement Practices of Non-Financial Companies: Amanagerial approach
International Business
Master's thesis
Samuli Luostarinen
2011
Department of Management and International BusinessAalto UniversitySchool of Economics
Abstract
Foreign currencies are an integral part of doing international business. Their role is
often accepted as a necessity, while the significance of the risks associated with
uncertain future exchange rates is dismissed. Previous studies have shown that actively
managing foreign exchange (FX) exposure can be beneficial. Few studies, however,
have comprehensively explored how to manage FX exposure. The purpose of this study
is to examine the FX exposure management practices of non-financial companies
involved in international business and ultimately to evaluate their practices.
This study contributes to existing literature by outlining a framework for FX exposure
management. Previous studies have been content to conclude FX management practices
to vary significantly across companies, but this study asserts that sufficient similarities
do exist for identifying common developmental paths. Identifying them enables
evaluation and comparison of FX exposure management practices between companies.
For managers the study includes a tool for self-evaluation and benchmarking purposes.
The empirical part of the study gives an overview of the prevailing FX exposure
management practices in Finnish non-financial companies. For the empirical part an
online survey was conducted in between December 2010 and January 2011. 1110
Finnish non-financial companies were asked to participate out of which 86 applicable
responses were received. This constituted overall a 7,7 % response rate.
The results of the survey study showed that company size, quantity of FX exposure and
the number of foreign currencies used by a company in its operations have positive
relationships with the sophistication of prevailing FX exposure management practices.
Still the study found that there are significant variations in managing practices of
companies with similar FX exposure profiles. Overall performance evaluation was the
most neglected component of FX exposure management.
Keywords: Currency, Foreign Exchange, FX, Foreign Exchange Exposure
Management, Foreign Exchange Risk Management, Hedging
2
3
Tiivistelmä
Ulkomaanvaluutat ovat olennainen osa kansainvälistä liiketoimintaa. Niiden rooli
hyväksytään kaupan edellytyksenä, mutta usein valuuttakurssimuutoksiin liittyvien
riskien merkitys jätetään huomiotta. Aiemmat tutkimukset ovat osoittaneet aktiivisen
valuttahallinnon hyödyt yritykselle. Harvat tutkimukset ovat kuitenkaan tarkastelleet
kokonaisvaltaisesti valuuttahallinnon käytännön menettelytapoja. Tämän tutkimuksen
tavoite on tarkastella ja arvioida valuuttahallinnon menettelytapoja kansainvälistä
liiketoimintaa harjoittavissa yrityksissä, poislukien rahoitus-alan yritykset.
Tässä tutkimuksessa esitetään valuuttahallinnon teoreettinen mallinus, jossa
valuuttahallinto on jaettu viiteen osioon. Aiemmat tutkimukset ovat tyytyneet toteamaan
yritysten välillä olevan merkittäviä eroja valuuttahallinnon menettelytavoissa. Tässä
tutkimuksessa puolestaan väitetään, että menettelytavoissa on riittäviä yhteneväisyyksiä
yhteisten kehityspolkujen havaitsemiseksi. Yhteneväisyydet mahdollistavat yritysten
arvioimisen ja vertailun valuuttahallinnon menettelytapojen suhteen. Tutkimus sisältää
myös itsearviointi- ja vertailutyökalun yritysjohdolle.
Tutkimuksen empiirinen osuus luo katsauksen hallitseviin valuuttahallinnon
menettelytapoihin suomalaisissa yrityksissä. Empiiristä osuutta varten toteutettiin
internetkyselytutkimus Joulukuun 2010 ja Tammikuun 2011 välisenä aikana.
Kyselykutsu lähetettiin 1110 suomalaiseen yritykseen, jotka harjoittivat kansainvälistä
liiketoimintaa. Kyselyyn saatiin 86 tutkimukseen soveltuvaa vastausta, joista muodostui
vastausprosentiksi 7,7 %.
Tutkimuksen tulokset osoittivat, että yrityksen koolla, ulkomaanvaluuttavirtojen
määrällä ja kaupankäyntivaluuttojen määrällä oli positiiviset suhteet valuuttahallinnon
menettelytapojen kehittyneisyyteen. Tästä huolimatta tutkimuksessa havaittiin, että
menttelytavoissa oli merkittäviä eroja samanlaisen profiilin omaavien yritysten kesken.
Valuuttahallinnon suorituskyvyn arvioinnin huomattiin olevan yleisesti heikoiten
toteutettu valuuttahallinnon osio.
Avainsanat: Ulkomaanvaluutta, Valuuttahallinto, Valuuttariski, Valuttasuojaus
Contents 1 Introduction ............................................................................................................ 6
2 Scope of the study and research question............................................................. 9
3 Foreign exchange exposure.................................................................................. 11
3.1. Foreign exchange exposure types................................................................... 11
3.2. Open position.................................................................................................. 14
4 Foreign exchange exposure management........................................................... 15
4.1. FX Policy........................................................................................................ 16
4.1.1. Operational structure .............................................................................. 18
4.2. Position calculation ........................................................................................ 20
4.2.1. Forecasted exposure ............................................................................... 22
4.2.2. Risk assessment ...................................................................................... 25
4.3. Forecasting future FX rates ............................................................................ 27
4.4. Hedging methods............................................................................................ 31
4.4.1. Internal hedging techniques.................................................................... 33
4.4.2. External hedging techniques................................................................... 36
4.5. Performance evaluation .................................................................................. 37
5 Framework for evaluating FX exposure management practices ..................... 42
6 Survey study.......................................................................................................... 44
6.1. Variable definitions ........................................................................................ 45
6.2. Sample description ......................................................................................... 53
6.3. Empirical results ............................................................................................. 55
6.3.1. FX Policy................................................................................................ 56
6.3.2. Position calculation ................................................................................ 59
6.3.3. Forecasting future FX rates .................................................................... 63
6.3.4. Hedging methods.................................................................................... 65
6.3.5. Performance evaluation .......................................................................... 69
7 A Tool for evaluating FX exposure management practices.............................. 74
7.1. Scoring model fit ............................................................................................ 82
7.2. Benchmarks and analysis ............................................................................... 83
8 Conclusions ........................................................................................................... 86
4
9 References ............................................................................................................. 89
10 Appendices ............................................................................................................ 93
10.1. Appendix A – Survey ..................................................................................... 93
10.2. Appendix B – Nokia’s position calculation.................................................. 101
10.3. Appendix C – Survey skip logic................................................................... 102
List of Figures
Figure 5.1 – FX Exposure management framework....................................................... 43 Figure 6.1 – Size distribution of companies participating in the survey study .............. 54 Figure 6.2 – Distribution of values for the explanatory variable Foreign exchange exposure in the sample ................................................................................................... 54 Figure 6.3 – Number of foreign currencies used by companies..................................... 55 Figure 6.4 – Centralization ............................................................................................. 58 Figure 6.5 – Policy components ..................................................................................... 59 Figure 6.6 – Forecast source........................................................................................... 65 Figure 6.7 – Internal hedging methods........................................................................... 67 Figure 6.8 – External hedging methods.......................................................................... 68 Figure 6.9 – Position valuation....................................................................................... 72 Figure 7.1 – Future FX rate forecasting scores .............................................................. 83 Figure 7.2 – Benchmark scores ...................................................................................... 86 List of Tables Table 6.1 – FX Policy results ......................................................................................... 56 Table 6.2 – Position calculation results .......................................................................... 60 Table 6.3 – Forecasting future FX rates results.............................................................. 63 Table 6.4 – Hedging methods results ............................................................................. 66 Table 6.5 – Performance evaluation results ................................................................... 70 Table 7.1 – Policy scoring .............................................................................................. 75 Table 7.2 – Policy format and policy aim scoring logics ............................................... 76 Table 7.3 – Position calculation scoring......................................................................... 77 Table 7.4 – Scoring logics for position calculation questions........................................ 77 Table 7.5 – Future FX rate forecasting scoring.............................................................. 78 Table 7.6 – Forecast usage and forecast source scoring logics ...................................... 79 Table 7.7 – Hedging scoring........................................................................................... 79 Table 7.8 – Performance evaluation scoring .................................................................. 80 Table 7.9 – Performance evaluation scoring logics........................................................ 81 Table 7.10 – Back office segregation & Risk oversight scoring logics ......................... 82 Table 7.11 – Scoring model correlations........................................................................ 82 Table 7.12 – Benchmark scores...................................................................................... 84
5
1 Introduction
Foreign currencies are an integral part of doing international business. With
globalization an increasing number of goods and services flow from one currency zone
to another. Simultaneously the global investment environment is rapidly growing and
asserting increasing influence on foreign exchange rates. A larger and faster global
economy makes foreign exchange an important issue to a growing number of
companies and its significance ever greater to individual companies particularly in open
economies such as Finland1.
For companies foreign exchange (FX) can be a source of significant risk and
opportunity because of the uncertainty of future exchange rates. Entering into for
example a purchase or a sales contract involving foreign currencies exposes companies
to parity fluctuations i.e. the fluctuations in the value of one currency in terms of
another. Typically only the profits from the contract are affected by any gains or losses
brought about by the parity shift. Thus, the impact of this exposure can quickly increase
as the effect of a parity shift to the value of the contract is leveraged naturally by the
profit margin of the company.
The effect of the natural leverage combined with significant volatility that the FX
markets tend to experience should be recognized by companies. Considering a contract
with a 30% profit margin, then a 1% parity shift would have a 3,33% change on real
returns from the contract. The effects of the natural leverage increase as the profit
margin of the contract decreases. While also considering that a 1% parity shift is
common place within a week’s time frame, does the nature of FX exposure become
clearer. On a larger scale consider that in fact the EUR/USD currency pair experienced
1 Finland as an open economy trades with many countries in different currency zones. In 2009 out of the top 30 foreign export and import partners of Finland 20 were countries with national currencies other than the Euro. The combined imports from these 20 countries to Finland were worth 25 500 M€ in 2009 and correspondingly Finland’s exports to them were worth 24 900 M€. Source Tulli import and export statistics of 2009.
6
a 19% parity shift in 2009, the EUR/JPY respectfully a 17% parity shift and the
USD/JPY respectfully a 15% parity shift. From this quick overview alone it should be
clear enough that FX exposure management is of considerable importance to companies
involved in international business. Never-the-less many large companies ranging from
airlines to Korean multinational conglomerates who imaginably should have known
better have been driven to bankruptcy by underestimating the impact of fluctuating
currencies2.
Several books and studies have been written about foreign exchange in the corporate
realm through out the years. Generally this literature has focused on risk management
aspects (FERM, Foreign Exchange Risk Management). In addition specialist literature
exists in financing dealing with individual foreign exchange instruments, derivatives
and business practices. Most general management books on international business,
international financing and multinational companies briefly go over similar subjects. On
the other hand financial literature includes books and studies on profit making strategies
related to foreign exchange and individual instruments. Other significant fields of
foreign exchange exposure management literature include taxonomical literature,
tackling the nature of exposure, and literature dealing with effectiveness of hedging
foreign exchange exposure.
For non-financial companies foreign exchange management is mostly perceived in
literature as risk management and focuses on limiting exposure. However, a study of FX
exposure management practices by Hakkarainen et al.3 found that the more experienced
the companies are the more inclined they are to accept foreign exchange exposure risk
by selectively leaving open positions unhedged. Profit seeking foreign exchange
strategies are covered in financial literature along with literature on foreign exchange
derivatives, however, a company involved in foreign trade is a different context than a
purely financial company engaged in profit seeking activities in the realm of foreign
exchange. In the case of an importer or exporter the balancing required between
2 Shapiro, A., 2006 3 Hakkarainen et al., 1996
7
demands of core business processes and employment of profit seeking foreign exchange
strategies exposes the foreign exchange management to elements of two worlds, finance
and operational. This study aims to look beyond the conventional risk management
approach and to examine connections between the core business processes of non-
financial companies and alternative approaches to foreign exchange exposure
management.
Foreign exchange management is usually conducted via instruments and services
provided by financial companies, e.g. commercial banks, offering varying ranges of
services. These companies create the over-the-counter (OTC) means to manage FX
exposure. In addition exchange type of market places exist where exchange traded FX
financial instruments, e.g. options, are traded. The geographical distribution of these
middle men and market places may create differences in the possibilities available to
companies in different regions for managing their foreign exchange exposures. These
issues can be related to the size of the company in respect of the extent of its
international operations as well as the resources available for foreign exchange
management.
Majority of FX exposure management literature has addressed the practices of
multinational companies and larger companies but there exist a large number of smaller
importers and exporters without resources for dedicated financial managers. Still the
benefits from foreign exchange exposure management are as real to smaller companies
as to larger ones. As the needs of this group of companies have limited exposure in the
literature a possible gap in research has been identified. A Finnish survey study into
foreign exchange exposure management conducted in the Vaasa area4 provides some
quantitative results portraying the SMEs’ foreign exchange management as
underdeveloped. Another study5 examining FX exposure management practices of a
larger international Finnish company, Tecnomen, showed that even larger companies’
foreign exchange management can be underdeveloped. The challenge in the case of
4 Harju, M. & Martikainen, T., 1997 5 Kiuru, J., 2007
8
Tecnomen was tracking future cash flows, a key component of successful FX exposure
management.
The financial instruments such as foreign exchange derivatives are somewhat complex
and efficiently managing a portfolio of them can be challenging. Financial corporations
that deal in foreign exchange instruments provide a limited number of clear and
standardised services to go with the instruments. In literature FX exposure management
is without exception portrayed as an internal process of an importer’s or exporter’s
financial department. With the limited resources available to SMEs this combination
poses a dilemma. Could there be a more or less standardised service aimed at foreign
exchange exposure management that the current financial companies could provide to
SMEs but are not currently doing so?
The general public’s increasing access to OTC financial instruments has been a strong
trend in recent years. As accessibility to OTC financial instruments improves the means
to manage FX exposure by SMEs eases. This development is complemented by political
pressures in Western countries brought on by the recent financial crisis to bring more
derivatives to public exchanges and, thus, increase transparency of the market. Were
this trend to continue access to and availability of foreign exchange OTC derivatives
will increase and likely we will see an increase in interest towards FX exposure
management among companies of all sizes.
2 Scope of the study and research question
This study addresses the question of how to evaluate FX exposure management
practices of non-financial companies. The answer to this question should prove
valuable to a number of groups. Foremost it should give companies an objective tool for
evaluating their own practices and help in self-improvement. It should also be of use for
consultancies by providing a quick tool for assessing a client company’s FX exposure
9
management practices and perhaps provide a basis for categorizing case companies in
records for future reference. Another group who could be among beneficiaries from this
study are FX management service providers or other companies, e.g. commercial banks,
that may be interested in developing standardised services for FX management
functions of companies. By providing a solid tool for comparison these companies may
identify market segments and develop standardised services for them. The benefits for
the scientific community should not be overlooked either. Although a lot has been
written on the subject of FX exposure management a unified framework has not
emerged6. Survey studies for instance would greatly benefit from enhanced cross
compatibility of results.
The purpose of this study is to examine the FX exposure management practices of
companies involved in foreign trade. This means that the focus will be on non-financial
companies that practice import or export activities or companies with foreign
subsidiaries which make FX exposure management relevant to their core business
operations. Financial companies were excluded in order to assure that FX exposure is an
unintended by-product of core business operations and in order to focus on end-users
rather than producers of financial services.
The main research question of this study is:
How to evaluate FX exposure management practices of non-financial
companies?
The study is guided by three additional questions further decomposing the research
question:
How do companies manage FX exposure?
Does a common developmental path for FX exposure management
practices exist?
How could FX exposure management practices of different
companies be compared? 6 Hakkarainen, A. et al., 1996 pg 10
10
Due to practical limitations the empirical part of this study will be limited to Finnish
companies. This limitation, however, ensures that all the companies operate in a similar
regulatory environment. This eliminates variations in results due to regulatory
differences. The study also attempts to take into consideration the needs of SMEs as the
majority of literature focuses on large and multinational companies.
It is important to note that this study does not address the question of why should a
company manage their FX exposure. This question has been extensively addressed by a
number of prior studies7 examining the benefits of FX exposure management. The aim
of this study is therefore to look at FX exposure management from a more managerial
perspective of how to implement FX exposure management by presupposing the need
for it.
3 Foreign exchange exposure
3.1. Foreign exchange exposure types
The contemporary literature typically distinguishes between three types of foreign
exchange exposures. These include transaction exposure, economic exposure and
translation exposure. The categorization of foreign exchange exposure is loosely based
on temporal differentiation of cash flows and much variance exists between
interpretations by different authors. The only exposure that authors extensively agree
upon is the definition of transaction exposure.
Transaction exposure measures the quantity of future cash flows (committed or
anticipated) exposed to potential currency exchange rate changes.8 It comprises of cash
7 For a comprehensive review of theoretical arguments for why companies should hedge see Pramborg, B., 2002 8 Pramborg, B., 2002
11
flows which require actual conversion of currencies (i.e. transactions) and arises
whenever there is a time gap between a company committing to a cash flow and the
time of its settlement.9 It is the simplest source of foreign exchange exposure and the
most relevant to most companies. Transaction exposure has the greatest impact on
profitability at least in the short and arguably in the medium term, and it is the primary
object of foreign exchange exposure management for any company involved in foreign
trade.
There is much controversy around the concept of economic exposure in literature. As a
generalization it is concerned with long term future cash flows that are currently
unidentifiable. Glaum10 defines economic exposure as the future operating cash flows
of the company that are exposed to potential currency exchange rate changes.
Pramborg11, however, defines economic exposure to be combination of transaction
exposure and competitive exposure. For him competitive exposure consists of
unidentifiable anticipated transactions. Yet other authors coin the term economic
exposure with operational exposure.12 The two terms operational and competitive shed
light on the dual nature of economic exposure in contemporary literature. On the one
hand it has to do with future (operational) cash flows originating from e.g. the
company’s foreign subsidiaries, foreign direct investments or day-to-day international
trade which as Pramborg puts it, are as of yet unidentifiable anticipated transactions.
But on the other hand in a more sophisticated manner economic exposure has to do with
the international competitive environment of each company.
To illustrate the significance of foreign exchange rate changes on the competitive
environment consider a company with a foreign subsidiary. In the case that the
exchange rate of the local currency of the subsidiary changes it will affect the costs of
its production factors and thus the margins on its outputs. Should the subsidiary have a
foreign competitor whose production factors and thus margins were not affected by the
9 Glaum, M., 1990 10 Glaum, M., 1990 11 Pramborg, B., 2002 12 Daniels, J., 2004
12
parity shift then the competitive position between the two competitors has changed. The
effects, however, continue as the net profits of the subsidiary are transferred to its parent
company. To put it simply parity changes in currency pairs can affect the competitive
position of subsidiaries, their net profits and net profits converted to home currencies of
parent companies.13
Economic exposure differs from transaction exposure in a number of significant ways.
Firstly the concept of economic exposure tends to be very company and industry
specific. Its effects reach further than when to convert a given amount to or from a
foreign currency and at what exchange rate, but it will actually have effect also on size
of the amount being converted. It is also note worthy that virtually every company
irrespective of whether it is involved in foreign trade or not has economic exposure.14
As a simplification, however, economic exposure can be thought of as future cash flows
that are exposed to potential currency exchange rate changes that will eventually, when
they are identifiable, change into transaction exposures.
Translation exposure is a financial accounting technicality and arises when financial
accounting statements of foreign affiliates are translated into the home currency of the
parent company.15 It does not reflect realized profits or losses and it is subject to the
translation methods used i.e. local accounting standards. The general view of authors16
on foreign exchange exposure management is that translation exposure should not be
hedged because it does not add value to the company. However, survey results have
indicated that it is often being hedged. Hakkarainen et al.17 explain translation exposure
hedging by the existence of management compensation schemes which are often tied to
financial statements and are thus affected by translation gains and losses.
13 For more discussion see Dufey, G., 1972 or examples of competitive exposure in import and export companies provided by Holland, J., 1993, pages 157-161 14 For more discussion see Laitiainen, T., 1996 15 Pramborg, B., 2002 16 See e.g. Dufey, G., 1972 and Pramborg, B., 2002 17 Hakkarainen, A. et al., 1996
13
From the point of view of foreign exchange exposure management often a more
practical way of differentiating among exposure types is to divide them into
contractually based and forecasted exposures. In this way the focus is on real future
exposures and the usefulness of this will become apparent later in calculating FX
exposure positions.
One additional ambiguity in FX exposure management literature is simply the definition
of exposure. Authors use exposure without explicitly informing the reader of their
definition and different authors tend to have different definitions. This shows that the
concept of exposure in FX is not altogether that straightforward. Unfortunately it
contributes to general ambiguity in literature and complicates devising practical
applications for FX exposure management. This study adopts a simple definition of
exposure to enhance readability: Exposure is the foreign currency value of assets and
liabilities that are denoted in foreign currencies. I.e. a company with all assets and
liabilities in its home currency except for a USD 1000 bank deposit has an exposure of
USD 1000. An important aspect of exposure is that it is not directly proportional to the
extent of a company’s foreign activities. A company with assets and liabilities denoted
in foreign currencies may have no exposure if the assets and liabilities are offsetting e.g.
if the above mentioned company has a USD 1000 invoice payable in addition to its bank
deposit it then does not have FX exposure.
An important distinction from exposure is risk which can be measured with a number of
metrics and is concerned with how much the home currency value of the exposure
varies. Authors often use FX exposure and FX risk interchangeably.
3.2. Open position
In the foreign exchange literature the concept of position is used to describe binding
commitments to buy or sell a given amount of a currency. It can also refer to the amount
14
of a currency held by a company at a time. Positions are either long or short depending
on whether the company is committed to buying or selling the currency in question, i.e.
committing to buying or owning a position in a currency is a long position in that
currency. Because currencies always trade in pairs a given position is always
simultaneously short in one currency and long in the other. Most companies would
speak of positions in terms of the currency of its head office i.e. home currency. A
position becomes open when the company has committed to a short or long position in a
currency pair. Subsequently the position remains open until it has been closed by
resolving the transaction.
The concept of an open position is of importance for companies in calculating FX
exposure in different currencies at a given time. The concept of net position becomes
relevant when a company has more than one open position in a given currency pair. It is
a simple calculation of subtracting short open positions from long open positions in the
currency pair. However, minding the time structure of open positions is important as a
net position changes if only one of offsetting positions is closed. Similarly to open
positions net positions are also described as being long or short.
4 Foreign exchange exposure management
Foreign exchange exposure management is the practice of companies to limit the FX
exposure that is inherent in their core businesses. In practice companies take actions to
enumerate the extent of exposure and seek ways of managing it. FX exposure
management literature has explored the various aspects of effective FX exposure
management practices often focusing more on one or another aspect. The lack of a
general framework has resulted in fragmented literature with studies focusing rather
eclectically on individual aspects. From a review of the literature, however, FX
exposure management can be perceived as a comprehensive system with five distinct
components. These include policy, position calculation, forecasting exchange rates,
15
hedging and performance evaluation. Each component has its particular purpose and
they work together effectively creating the FX exposure management process.
In this part we will address individually each of the five components. Next part will
then draw together current advancements in literature of each component in an effort to
form a general framework. This framework will then be used for categorization and
ultimately evaluation of individual companies’ FX exposure management practices. A
categorization of companies that describes the level of sophistication of their foreign
exchange exposure management practices would be useful for empirical studies of FX
exposure management as well as for companies to conduct self assessment. As this part
will show, effective FX exposure management has a number of features which are to a
great extent uniform across companies. The categorization would, thus, enable a
company to quickly analyze its own situation and see to which component it should
next focus its efforts on, in order to improve its FX exposure management practices.
4.1. FX Policy
For any company wanting to manage its FX exposure the first step is to make a decision
on committing to the activity. As with any other organizational activity that requires
substantial effort and affects broadly the organization, a commitment of the top
management is necessary for implementing effective FX exposure management
practices. This commitment should be formalized in a FX policy. For an SME an
informal policy may be more practical but quickly as the organizational size grows a
formal document becomes useful, even necessary to communicate to employees the
essential characteristics of FX exposure management to be practiced in the particular
company. In a study of foreign exchange exposure management practices in large
Finnish companies18 the authors found that 73% of the companies had either formalized
or general documented FX policies.
18 Hakkarainen, A. et al., 1996
16
In a FX policy a company outlines what FX exposure management means for them and
what its aims are. It usually contains a definition of FX exposure, the aim of FX
exposure management, the amount of exposure allowed and the hedging methods
selected for managing it. It may also contain information about responsibilities and
procedures involved in FX exposure management19. Large companies have been
reported to also include time horizon, permissible derivatives, permissible trading
techniques, performance evaluation measures, performance compensation, internal
controls and compliance and risk oversight practices. It is natural for a large
organization to also document in their policy who has the authority to approve changes
to it and exceptions from it20.
In terms of the aim of FX exposure management, FX policies can be divided into
passive and active policies. Companies adopting a passive policy choose not to engage
in effective management of their FX exposure. All else falls into the category of active
policies which can then further be divided according to the aims set for FX exposure
management. A company can either take a risk averse or a profit seeking stance towards
its FX exposure. As noted before most literature considers FX exposure management as
risk management. Proponents of risk averseness most often point to the efficient market
hypothesis and declare that consistent profits are impossible in the FX market.21 Survey
studies’ results, however, show that despite concerns raised against profitability of FX
exposure management many companies practice profit seeking FX exposure
management.22 These studies are complemented by literature discrediting the
applicability of the efficient market hypothesis to the FX market.23 Without taking sides
in this debate it is sufficient to say, in the words of Glaum, that FX risk can “result in
19 See e.g. Koh, A., 1997 20 Wallace, J., 1999 21 For a detailed discussion see for instance Giddy, I.. & Dufey, G., 1975 22 In his study Pramborg, B. (2002) reported that 61% of Swedish companies used profit-based evaluation criteria for their FX exposure management. Comparatively 71% of Korean companies included in the study had similar evaluation criteria. Similarly in a study of Finnish companies Hakkarainen, A. et al. (1996) found that 33% of the companies pursued profitable FX trading strategies. 23 See for instance Alexander, C. & Johanson, A., 1992
17
gains as well as losses, and by the same token foreign exchange risk management may
aim at making profits as well as preventing losses.”24
A company with an active profit seeking FX policy would aim to increase its assets and
decrease its liabilities in appreciating currencies and simultaneously decrease its assets
and increase its liabilities in depreciating currencies.25 A risk averse policy on the other
hand would aim the company’s efforts towards minimizing exposure in all foreign
currencies. While the aim of the policy can be either of the two, most policies define
acceptable levels of exposure.26 Limits to total exposure or targeted exposure levels are
commonly defined in policies. Limits to risk metrics are also used as indirect exposure
limits.27 A Finnish study found that companies with more experience in FX exposure
management were more likely to take risk and not to set exposure limits28.
4.1.1. Operational structure
The consensus in contemporary literature supports a policy of centralized FX exposure
management.29 Decentralizing hedging decisions can be costly for a company as it may
result in double hedging i.e. hedging separately two transactions in the same currency
pair but in different directions of conversion, when at the aggregate level it could have
been seen that they offset each other.30 Decentralization also reduces transaction sizes,
increases transaction frequency and requires more employees to manage FX exposure.
Thus, centralization can be cost effective and concentrating FX exposure management
skills in one place can be beneficial for the treasury in improving its ability to fulfil its
24 Glaum, M., 1990, page 65 25 Holland, J., 1993 26 Batten and Livermore (1995) found that a general trend in FX exposure management is away from complete elimination of FX exposure. 27 Pramborg, B., 2002 28 Hakkarainen, A. et al., 1996 29 See e.g. Batten, J. and Livermore, A., 1995 30 The practice of offsetting long and short positions in the same currency is often called matching, but in this study it will be discussed under position calculation.
18
advisory role in the company.31 Even though the overall control is centralized often
some aspects of FX exposure management must be decentralized. As the other units of
the company are most often the sources for transaction exposure, a centralized FX
management will have an important responsibility in providing tools and support for
those units. Partial decentralization will also enable the company to gather local
knowledge32 and can be organized in a way that local management can take advantage
of particular situations with which only they may be familiar with.
Discussion of the way in which to organize FX exposure management is rather limited
in literature. Some authors note that there is no generally accepted way to organize for
FX exposure management33. They point out that companies have adopted a variety of
ways in which to cope with FX exposure. Others are somewhat more descriptive. The
early stages of FX exposure management are described to be characterized by it being
the responsibility of a single person in the company e.g. the finance director,
accountant34 or managing director35. This is followed by the employment of a small
team of FX specialists as the scale of international trade grows to justify it.36 Examining
characteristics of FX exposure management from the perspective of general
organizational structure literature, the functional structure would likely be the one that
FX exposure management would gravitate towards. This is because a divisional
structure would in turn mean a significant degree of decentralization as business units
would manage their exposures separately. As this study presents FX exposure
management in four distinct activities (position calculation, forecasting future FX rates,
hedging and performance evaluation) it also asserts that companies would most of the
time develop towards a functional division of labour along the lines of the four activities
within its team of FX specialists.
31 In a study of FX exposure management in 14 large Australian companies all of the companies had centralized treasuries. The reasons for centralizing FX exposure management were cheaper rates due to access of the wholesale markets and separating treasury left other units able to concentrate on their core activities. Batten, J. and Livermore, A., 1995 32 Shapiro, A., 2006 33 see e.g. Karppinen, A., 1997 34 Hakkarainen, A. et al., 1996 35 Harju, M. and Martikainen, T., 1997 36 Hakkarainen, A. et al., 1996
19
4.2. Position calculation
In order to effectively manage FX exposure detailed information of all foreign-
currency-denominated future transactions need to be gathered and compiled.37 The
information needed includes currency denominations, amounts and maturities for all
transactions.38 This information is then compiled into a FX position calculation which
determines the net positions. A net position is calculated for each currency and each
maturity separately. The position calculation is then used as the basis for hedging
decisions.
A recent benchmark study39 found that the biggest challenge in effective FX exposure
management that companies face is attaining accurate and timely FX exposure data and
turning them into accurate position calculations. Thus the importance of position
calculations should not be underestimated. In fact significant differences exist in
position calculations among companies. Many of the differences arise from decisions
concerning how to enumerate transactions with uncertainties concerning their amounts,
maturities or both. By conforming to the division of contractually based and forecasted
exposures differences among companies due to taxonomical debates can be avoided, i.e.
whether an exposure is a transaction or an economic exposure.40 The only meaningful
questions can then be pointed out to be how to forecast the amount and maturity of an
exposure and how accurate the forecasting models are.
Contractual exposure is most often simple to calculate. Information regarding
contractual commitments in larger companies is gathered using scheduled exposure
reports that business units and subsidiaries submit to the head office.41 A more
sophisticated way of conducting reporting is to integrate FX exposure management into 37 In effect the only available alternatives to compiling a position calculation are a passive FX policy and hedging each individual transaction separately. 38 Karppinen, A., 1997 39 Koester, W., 2010 40 A Finnish study found that large Finnish companies usually divide FX positions into commercial flow, financial flow and estimated flow. Isokallio, K., 1996 41 For instance Finnair’s business units report their FX exposures to the corporate treasury every three months for the purpose of position calculation. Mattila, T., 1999
20
a company’s IT infrastructure such as an enterprise resource planning system (ERP).
However, studies have reported that FX exposure management often relies on separate
IT systems and all too often is run on a single Excel sheet.42 Sources of contractual
exposure include for example accounts receivable and payable, capital amounts of loans
receivable and payable, purchase and sale orders and interest income and expenses. It
must be kept in mind, however, that parity shifts change the home currency value of
some contractual positions differently than others i.e. contractual position may have
differing systemic relationships with parity shifts. These include e.g. contracts with
adjustment clauses linking their prices to exchange rate changes43 and some financial
instruments used in hedging with more sophisticated pricing models. Systemic
relationships will be discussed further in 4.2.2.
In literature discussion concerning the accuracy with which maturities of transactions
should be reported in a position calculation brings about different suggestions. The
suggestions of authors vary between accuracies ranging from days to months for
calculating maturities of positions. As the maturities of FX exposures are tracked more
accurately so can the time a position remains open be shortened and the company’s net
exposure be reduced. The appropriate accuracy for a given company depends of course
on the nature of the business and frequency of its FX transactions. A relatively
frequently proposed model dictates that on a rolling basis a company should aim for
daily accuracy for positions expiring during the first week, a weekly accuracy for
positions expiring during the following weeks of the first month and a monthly accuracy
for the rest of the first year44. Often noted is that the accuracy of forecasts regarding the
maturity and the amount of future transactions deteriorates the further in the future they
are expected to occur45.
42 Edens, C., 2010 43 Laitiainen, T., 1996 44 See e.g. Laitiainen, T., 1996 45 A study of 11 Finnish MNCs found that all of the companies found it difficult to forecast future cash flows beyond six months. Karppinen, A., 1997
21
Literature suggests that position calculations should ideally be compiled 1-4 times a
month.46 Pramborg47 found that over 50% of the large Swedish companies evaluated
their FX risk at least weekly. Comparatively the same study found that 56% of large
Korean companies evaluated their FX risk at least monthly. A significant positive
association was found with the size of the company as well as the size of its FX
exposure and the frequency of evaluations. This may be in part because more
sophisticated hedging programs require as a prerequisite a more accurate and up-to-date
position calculation. Companies should keep in mind that while the position calculation
may be compiled at some frequency the net position may also be valued in home
currency more often, i.e. marked-to-market. Large financial companies are known to
value their net position daily48.
4.2.1. Forecasted exposure
As mentioned above measuring and accounting for non-contractual exposure in position
calculations is often complicated. Non-contractual exposure is characterized by
uncertainties concerning the amounts and maturities of the future transactions. The
underlying reason for forecasting exposure is that FX exposure management can only
protect margins as far as future exposure can be forecasted. All exposure beyond
accurate forecasts cannot be hedged and will therefore be exposed to adverse parity
shifts.
There are substantial differences in the forecastability of exposure between industries.
In some established industries future cash flows can be fairly accurately forecasted over
extended periods. For instance some resource based companies are able to forecast their
FX exposures 2 to 3 years forward.49 Companies in more volatile industries, however,
can face significant challenges with forecasting exposure beyond their currently booked
46 Laitiainen, T., 1996 47 Pramborg, B., 2002 48 Saunders, A. and Cornett, M., 2008 49 Batten, J. and Livermore, A., 1995
22
orders. Porsche, however, is an example of a company that has managed to develop
sophisticated exposure forecasting capabilities. It has been reported that Porsche
secured its profit margins in 2004 up to July 2007 by hedging against the rise of
EUR/USD50.
It is important for companies to make a clear distinction between position calculation
and hedging decisions. The goal of a position calculation should be to determine the
amount of exposure and its maturities to the highest possible degree of accuracy. The
decisions regarding how much of the exposure to hedge should be kept separate and
should solely be the concern of the hedging activity. Maintaining this distinction is of
great significance particularly when forecasting future exposure because it is easy to
accidentally incorporate hedging decisions into exposure forecasts. For example the
forecaster may be biased towards a currency pair and thus may influence the quantities
of forecasted exposure. This could potentially result in hedging twice particularly if the
two activities of position calculation and hedging are performed by separate entities in
the organization.
Several approaches have been suggested for including non-contractual flows in position
calculations. One of the most conventional practices is to use already existing budgets
as the basis for forecasting. This would include the examination of purchase and sales
budgets and using them either directly as forecasts or modifying them in some fashion.
The usefulness of this practice is obviously dependant upon the method of budgeting
that a company is employing and subsequently on its accuracy.
Many companies have indicated that forecasting cash flows further than six months into
the future is difficult.51 As a response at least one author has suggested a somewhat
crude method of applying a descending probability to budgeted cash flows beyond six
months. In this scheme all forecasted cash flows up to six months were included in their
full amount and those beyond would be multiplied by a probability of (1 – (0,2 * (n –
50 Shapiro, A., 2006 51 Karppinen, A., 1997
23
6))), where n is the number of the month in question.52 Certainly an increase in time
brings about a degree of uncertainty to non-contractual cash flows, but these views may
also reflect the unrealized potential for development in the forecasting methods used by
the companies in question.
A frequently raised question in FX exposure management literature is that of how to
hedge against uncertain exposure resulting from bid entries. The bids are contractual,
however, uncertain. The problem is of considerable importance e.g. for manufacturing
companies for whom the size of the contracts they bid for are considerable in terms of
their annual revenues. An adverse parity shift in these cases could cause financial
distress for the companies. The problem has many challenging dynamics for instance
that the size of the exposure is large and thus the price of hedging is great, all the while
the realization of the exposure is uncertain. Generally these cases are suggested to be
individually assessed for the probability of success of the bid as opposed to using the
same probability for all bids or deriving the probability from the maturity of the bid53.
Individual consideration of all forecasted exposures in most cases is inefficient. This is
dependant upon company characteristics such as the frequency and quantity of its FX
exposures, but as the quantity of transactions grows the effort needed to evaluate all
transactions may become a burden. Never the less, at least whether an exposure is
certain or not should be maintained and updated at all times, hence, it is important to
keep contractual and forecasted exposures separate in position calculations. Nokia for
instance uses a progressive position calculation with three levels of exposures.54
Individual exposures travel through the levels beginning at the 3rd level, which includes
forecasted exposures, followed by the 2nd level, which includes certain exposures that
the company is committed to but which have not yet been included in the financial
accounting system, and further to the 1st level, which consists of exposures in financial
accounting55. This type of progressive position calculation is also in agreement with the
52 Mattila, T., 1999 53 See e.g. Laitiainen, T., 1996 54 Isokallio, K., 1996 55 See Appendix B for Nokia’s position calculation
24
above discussed nature of economic exposure to eventually change into transactional
exposure.
4.2.2. Risk assessment
In order to further assess the extent of their exposure companies have come up with
sophisticated methods to improve and complement position calculations. Knowing the
net position is paramount but in order to interpret it the concept of effective size is
useful.
There are two things that influence the effective size of a position. Firstly currency pairs
behave differently which can be depicted by their volatility. Two identical open
positions in different foreign currencies of equal value in home currency are most likely
not going to change in value equally, i.e. their effective sizes are different.
Secondly the type of asset and liability a position consists of influences effective size.
Different assets and liabilities may have different systemic relationships between
exchange rate changes and home currency value changes. Where a cash position has a
directly proportional inverse relationship, i.e. a 1% parity shift translates to a -1% home
currency value change, another asset such as a foreign currency-denominated bond
could have a systemic relationship in which direct proportionality does not hold due to
e.g. the international Fisher-effect56.
Some of the methods presented in this part are discussed in literature under hedging.57 It
is important to make the distinction that this study considers them to belong under the
56 The international Fisher-effect states that “the spot exchange rate should change in an equal amount but in the opposite direction to the difference in interest rates between two countries” (Eiteman, D. et al., 1998, page 121). For further examples and discussion on these dynamics of exposure see Levi (2005) starting page 288. 57 It is noteworthy that position calculation is also considered a hedging method by some, and is known as matching in literature. This line of thought, I believe, is a relic from earlier evolutionary stages of FX exposure management literature and its use should be discontinued. Nothing is offset in ascertaining the extent of exposure.
25
position calculation –activity because no hedging decisions are made. These methods
are only used to accurately determine the extent of exposure. Hedging decisions then
follow to offset the exposure identified by position calculation.
Cross-hedging
One of the methods that companies use is cross-hedging58. It involves covariance
analysis across all the currencies in which a company has net open positions.
Covariances are then used to calculate net exposures so that long and short positions in
different currencies can partially offset each other effectively reducing overall net
exposure.59 It is a probability model used to determine the likelihood that an
unanticipated parity shift in one currency pair is offset to a degree by a parity shift in
another.60
VAR analysis
VAR stands for “Value at Risk” and it is a metric61 used for measuring risk of loss on a
portfolio. It is used for a variety of assets but it is compatible with FX positions. As an
output a VAR analysis produces a single home currency value (VAR) which stands for
the amount of loss that the net position can incur in one day measured to a certain
confidence level62. VAR analyses are usually conducted daily by large companies63 and
several methods exist. These include covariance analysis (e.g. RiskMetrics),
historic/back simulation and Monte Carlo simulation64. RiskMetrics uses a covariance
analysis with normal probability distributions and has attracted some criticism
58 It should be noted that the term cross-hedging can refer to a number of other ways in which to use correlating currencies, commodities or derivatives linked to them to hedge against unexpected value changes in another currency or commodity. 59 Karppinen, A., 1997 60 Holland, J., 1993 61 Note that VAR is also used to refer to the method which produces the metric. 62 Usually 95% or 99% confidence levels are used. 63 Saunders, A. and Cornett, M., 2008 64 For insight into the details of conducting any of these three analyses Linsmeier and Pearson (1997) is highly recommended reading.
26
particularly for using normal distribution even for currencies65. Historic simulation does
not use covariance analysis but instead uses historic market values of current positions
to determine probability distributions. Monte Carlo simulation generates additional
simulated market value observations that are usually used in conjunction with historic
simulation. Naturally companies have made variations to these standard models to
produce internal models of their own.
FX policies can use net exposures as their basis for hedging decisions by e.g. setting
maximum or targeted levels of net exposures. VAR values can be used in a similar
fashion instead of net positions, but they also provide additional information. In VAR
analyses each currency position’s VAR value is calculated and these values can be used
to direct hedging efforts to the positions in which portfolio VAR can be reduced with
the least amount of hedging.
Among other methods that companies use to complement position calculations or assess
FX risk are stress tests and scenarios66, linear programming, simulation, sensitivity
analyses and various optimization models. Although VAR analysis is often considered a
powerful tool it is recommended to use several methods simultaneously due to
limitations associated with each individual method67.
4.3. Forecasting future FX rates
Forecasting is a process of forming a justified opinion regarding the future parity of a
currency pair. FX forecasting methods can be divided into market-based and model-
based methods. While there are numerous forecasting methods that are being used, the
choice of a method should be based on an evaluation of accuracy and correctness of the
method.68 There are several elements in the behaviour of parity of a currency pair that
65 See e.g. Rogalski, R. and Vinso, J., 1978 66 Mattila, T., 1999 67 Linsmeier, T. and Pearson, N., 1997 68 Shapiro, A., 2006
27
can be observed and measured. Parity can shift to one direction or another or it can stay
within a range. From these observations it can be further deduced that the degree and
direction of change or the lack there of and the time of the change are all measurable
elements. Therefore regardless of the method of forecasting the outputs will be forecasts
determining the value of one or more of these elements.
Future FX rate forecasts are necessary for companies pursuing an active profit seeking
policy. This is natural because forecasts are necessary inputs for selective hedging
decisions. As inputs their accuracy will have direct effect on the profitability of FX
exposure management. It is important therefore to be able to measure the accuracy and
correctness of any forecasting method before, and even more so during, its use as the
company’s source of information. In contrast, risk averse active policies can be
maintained without having opinions on future parities by simply minimizing risk and
selecting the most cost efficient hedging method. However, companies with risk averse
active policies can also benefit from the use of forecasts in their hedging decisions if the
accuracy of their forecasts can be measured.
The accuracy of a forecasting method can be defined as the difference between
forecasted exchange rate and actual exchange rate. The correctness on the other hand
examines the direction of parity shift and whether the forecasted direction and the real
change occur in the same direction.69 Accuracy and correctness should be assessed in
numerical terms. A forecasting method in itself is not profitable, for this it also needs a
decision rule.70 A decision rule would dictate when to act and with what amount. The
FX policy of a company should be a source for the variables of a decision rule. Only a
combined analysis of these variables would be sufficient to compare and choose the
appropriate forecasting method, i.e. the combination of a FX policy and forecasting
method.
69 Shapiro, A., 2006 70 Gotthelf, P., 2003
28
Literature recognizes that a market-based forecasting method can be used to forecast
future spot rates71. This activity culminates in the pricing of forward rates that are used
in forward contracts. Market-based forecasting is based on equilibrium relationships
governed by the law of one price, which states that in an efficient market all identical
goods must have only one price. The method is a standard mathematical formula which
uses inflation rate differentials, interest rate differentials and spot rates to forecast future
spot rates. It is often considered the most accurate prediction particularly by those
considering FX markets to be efficient. Forward contracts have been found by many
studies to be the most popular hedging method72.
Many different model-based FX forecasting methods exist. FX literature most
commonly categorizes them in either fundamental or technical analysis. Fundamental
analysis examines the macro economical variables and regulatory policies that are likely
to influence a currency’s prospects. Technical analysis on the other hand focuses on
historical price and volume movements of a currency pair to uncover patterns which
repeat themselves.73 Reviewing all of these forecasting methods is far beyond the scope
of this study; however, observing some of the ways in which forecasting practices are
used by companies may prove useful in assessing a company’s ability to forecast
successfully.
Previous studies have found that some companies prefer to use external sources for
acquiring FX forecasts while others have developed and employ internal forecasting
methods. External sources cited include media such as financial news papers, banks’ FX
departments and commercial forecasting services. These methods are very common
among SMEs which are at early stages of FX exposure management. SMEs use free
forecast sources and prefer financial news papers and banks’ forecasts.74 The use of
internal methods has been found to be more common among companies with longer
71 E.g. Karppinen, A., 1997, Stonehill, A. and Moffett, M., 1997, and Hakkarainen, A. et al., 1996 72 E.g. Pramborg, B., 2002 and Hakkarainen, A. et al., 1996 73 Shapiro, A., 2006 74 Harju, M. and Martikainen, T., 1997
29
history in the practice of FX exposure management.75 This finding is understandable
when considering the time and effort required to explore and to evaluate the accuracy of
different forecasting methods. In addition formulating forecasting methods requires
specialized skills that have been asserted to be often out of the reach of smaller
companies.76 However, one would expect companies with more sophisticated FX
exposure management practices to evaluate the accuracy of forecasts they acquire from
external sources as well, particularly if money is spent on acquiring forecasts from a FX
forecasting service.
A study by Hakkarainen et al.77 indicates that companies view long-term FX rate
forecasting to be more difficult than short-term. Many companies do not believe that
long-term parity shifts can be forecasted. This issue is related to the more general debate
on efficiency of FX markets, as discussed earlier. Interestingly companies have mixed
feelings towards short-term forecasting.78
In discussing benefits for a company from forecasting future FX rates Holland79 pays
attention to local market information from subsidiaries. He points out that a company
can get a comparative advantage over its competitors by forecasting relative price
changes in its industry or relative price changes specific to itself. These advantages,
allied with knowledge of local conditions, may give the firm an advantage in assessing
the impact of real exchange rate changes on the firm. The main effect in this is
associated with economic exposure and more accurately its competitive component.
However, it raises questions regarding the value of local market information that firms’
subsidiaries may have. Particularly in the case of exotic foreign currencies local
subsidiaries may be valuable sources of information for future FX rate forecasting.
75 Hakkarainen, A. et al. (1996) found that companies in which FX policies had existed for more than seven years placed more emphasis on internally generated forecasts where as companies with FX policies in place for less than seven years placed more emphasis on the views of other players in the market. 76 E.g. Pramborg, B., 2002 77 Hakkarainen, A. et al., 1996 78 Hakkarainen, A. et al., 1996 79 Holland, J., 1993
30
4.4. Hedging methods
One way of looking at the hedging possibilities available to companies is to categorize
financial transactions according to counterparties involved in them. For the most
extensive case, that of a MNC, four major choices exist in implementing active foreign
exchange exposure management. Firstly the MNC can transfer funds internally between
parent and subsidiary, and between subsidiary and subsidiary. Secondly all units of the
MNC can transact in the offshore or Eurocurrency market (the international financial
market). Thirdly all units of the MNC can transact in their locally based capital and
foreign exchange markets. In addition each unit may have access to another unit’s local
markets through their subsidiaries; the funds would then be internally transferred.
Finally the payments to suppliers and receipts from customers are a source of domestic
and foreign currency and thus adjustments to payment terms can be used.80 The same
categorization can be adopted for any company by minding the company specific
parameters. For instance a domestic SME would not have foreign subsidiaries and thus
its choices would be more limited.
In categorizing hedging methods FX exposure management literature commonly likes
to make a distinction between hedging techniques that involve the use of financial
instruments and other techniques. The former are grouped under the term external
hedging techniques and the latter are denoted internal hedging techniques. From the
perspective of position calculations, as discussed previously, it is often not enough only
to account for external methods. In fact in hedging literature the position calculation is
in itself an internal method referred to as matching inflows and outflows. This
categorization has some other problems as well, as for instance in the case of MNCs or
conglomerates where the central treasury may act as a bank, and a market for financial
instruments within the company may emerge. These problems aside the division into
internal and external hedging techniques serves well enough for the purpose of this
study.
80 Holland, J., 1993
31
There is strong evidence in literature supporting the view that companies prefer to use
internal hedging techniques before turning to external techniques.81 This is because
internal hedging is considered to be more cost effective than using financial
instruments.82 Support for this assertion can be found from Pramborg’s83 survey study.
He reports that there is a positive correlation between company size and extent of the
use of external techniques. Furthermore he concluded that expenses associated with
setting up a hedging program are often the reason not to use any external hedging as
economies of scale are a factor of importance in using financial instruments.
The amount needed to be hedged, i.e. the net exposure, is not directly proportional to
the extent of foreign operations of a company. Companies’ net exposures start at a low
level when they enter into international trade. Very quickly, however, as the magnitude
of companies’ international trade grows net exposures in absolute terms reach their peak
levels.84 The quick rises in FX net exposures are most likely due to passive policies and
undeveloped FX exposure management practices. As companies’ international
businesses grow the net exposures begin to decline. Evidence from literature85 suggests
that this decline continues ever after except perhaps in some instances where the
treasuries have engaged in massive FX speculation. The decline of net exposures is
certainly to some extent explained by the increase in sophistication of FX exposure
management as the companies grow, however, another factor of importance is at play.
As companies advance towards becoming MNCs they trade in ever growing number of
currencies. The diversification into more currencies begins to reduce the net exposure
due to the portfolio effect: the decreases in value of some currencies are offset by
increases in the value of others. While some authors advice companies to
81 See e.g. Holland, J., 1993 82 Pramborg (2002) found that Swedish firms that chose not to use derivatives for hedging did so because associated expenses relative to expected returns were higher and because other means were considered to be more effective. In the case of Korean companies the top reasons were difficulty in pricing and valuing derivatives and insufficient exposure, respectively. 83 Pramborg, B., 2002 84 Pramborg, B., 2002 85 Glaum (1990) points out that internationalization increases the portfolio effect which in turn reduces a company’s FX exposure.
32
geographically diversify for the sole purpose of reducing FX exposure86 this may be
taking it to extremes. None-the-less the portfolio effect can be used by smaller
companies as well by actively seeking to diversify their currency portfolio, i.e. increase
the number of currencies in which they conduct business. Also what should be taken
from this relationship between the extent of international operations and the net
exposure of a company is that in fact it is the comparatively smaller companies that
require FX exposure management more or at least that smaller companies would greatly
benefit from devoting resources to it and adapting active policies.
4.4.1. Internal hedging techniques
Internal hedging techniques cited in literature include at least the following: leading and
lagging, matching inflows and outflows87, inter-company netting of receipts and
payments, domestic (home) currency invoicing, adjustment clauses in sales or purchase
contracts, currency portfolio diversification, currency portfolio correlation analysis,
geographical diversification of operations, transfer pricing agreements and adjustments
to internal financial flows such as royalties or fees. The unifying element with these
techniques is that usually their use concerns solely the company itself.
Differences exist in the popularity of internal hedging methods between companies of
different sizes and different nationalities. In a study focusing on larger companies88
most popular internal hedging techniques were found to be inter-company netting,
domestic currency invoicing and leading and lagging. The same study reported of
differences in internal hedging between Swedish and Korean companies. Another study
focusing on smaller companies89 found the most popular methods to be invoicing
currency selection and currency portfolio diversification. We will now go into more
details of selected techniques.
86 Stonehill, A. and Moffett, M., 1997 87 Already discussed above under position calculation. 88 Pramborg, B., 2002 89 Harju, M. and Martikainen, T., 1997
33
Contractual Adjustments
A company can influence the contractual part of their FX exposure by adjusting its own
terms of trade or seek a FX risk sharing agreement with their business partner. One way
in which companies can do this is by adding an adjustment clause to sales or purchase
contracts. A clause can work for instance by effectively creating an exchange rate
channel i.e. so that if the parity changes considerably during the running time of the
contract then the price will change to offset the parity change. Another commonly used
method is to adjust the currency of trade.90 Most often this means home currency
invoicing, thus eliminating the transaction exposure of the contract in question.
However, not all companies are able to make these adjustments to their contracts
because of e.g. established business practices or competitive forces.
Internal Trade
Large companies with foreign subsidiaries have a variety of ways in which to influence
their FX exposure by making adjustments to the variables of internal trade. Adjustments
in royalties, managerial or legal fees, transfer prices and invoicing currencies can be
used to adjust net exposures. Adjustments to internal trade are, however, subject to
government regulation in many countries and their use is case specific. Widely used
internal hedging techniques involving internal trade are leading and lagging and netting,
both of which deserve separate examination.
Leading and Lagging
Practiced by companies with foreign subsidiaries, leading and lagging is the practice of
making adjustments to credit terms between its units.91 In effect it is speeding up or
slowing down of currency flows from one unit of a company to another. It can be used 90 Survey study by Harju and Martikainen (1997) found that the most used internal hedging technique by Finnish SMEs (43%) was choice of invoicing currency. 91 Holland, J., 1993
34
with a risk averse as well as a profit seeking FX policy, however, a complementing
forecasting program is necessary for it to be used for profit seeking. Holland92 asserts
that forecasts of the expected development of exchange rates for a 12 month period are
essential in developing a leading and lagging –policy. These are then used to determine
the relative strengths of currencies which are further used to craft guidelines for
subsidiaries to follow. A centralized FX exposure management policy can thus be seen
as an important prerequisite for the company to effectively use leading and lagging. It is
also worth noting that some governments regulate leading and lagging practices93.
Netting
Netting is a popular internal hedging technique94 and it can be practiced by companies
with foreign subsidiaries. It involves a scheduled calculation of net amounts owed by
each unit of the company to other units of the company. In other words a calculation of
payments and receipts originating from trade within the company is conducted.
Afterwards only the net amounts are transferred to minimize transaction costs. When
flows in several currencies are involved foreign exchange conversions can be a source
of significant transaction costs. With many subsidiaries generating a significant number
of multicurrency payments and receipts netting can become highly complex.95 In
addition netting involves choosing the timing of settling net amounts and thus
inherently involves taking a view on future development of foreign exchange rates.
Netting is subject to government regulation in many countries. Centralized FX exposure
management and effective position calculation are prerequisites to netting.
Computerised modelling in conjunction with netting can provide significant savings for
the company96.
92 Holland, J., 1993 93 To demonstrate the popularity of leading and lagging, over 50% of the large Korean companies participating in a survey study by Pramborg (2002) used it. 94 Pramborg’s (2002) survey study found that over 60% of Swedish listed companies used it as part of their FX exposure management practice. 95 Holland (1993) provides a useful example of netting in a MNC and a linear optimization model for resolving transaction cost minimization. Pages 192-198 96 Holland, J., 1993
35
4.4.2. External hedging techniques
External hedging techniques involve contracts with external parties that are often in the
form of financial instruments. They include at least the following: forward contracts
(OTC), futures contracts (exchange-traded), swaps, options (OTC or exchange-traded),
options on futures, non-deliverable forwards (NDF), foreign denominated debt, foreign
currency bank accounts, margined FX trading accounts and money market hedging.
Extensive review of these instruments and hedging strategies associated with them is
beyond the scope of this study. For specific details readers are referred to dedicated
literature, of which there are volumes97. A few characteristics, however, will be
considered that are beneficial for this study.
Forward contracts are widely reported as the most common external hedging technique
used by companies98. Options are considered more expensive, but they are better for
hedging forecasted exposure because they do not need to be exercised. Particularly
compounded options (options on options) are recommended for hedging forecasted
exposure from bid offers99. The forward and money market hedging techniques both
secure a fixed exchange rate and are better tools for a risk averse policy. Leaving open
positions or using options on the other hand leave room for value fluctuations and are
more suitable for profit seeking policies.
A rather recent development in the foreign exchange market is the emergence and
popularity of electronic FX spot trading platforms. These platforms are primarily used
for speculation and their recent emergence may be a reason why their hedging potential
has not been addressed by literature. None-the-less, these platforms provide users with a
number of advantages including tight spreads, significant liquidity, quick execution,
easy access and perhaps most importantly margined accounts. With a margin
requirement of 1-2% their use may be cost effective compared to options for instance.
97 See e.g. Kolb and Overdahl (2007) for detailed descriptions of most these instruments. 98 E.g. Pramborg (2002) found that ~80% of companies used OTC forward contracts. 99 Laitiainen, T., 1996
36
Due to their electronic nature the platforms enable the construction and automation of
complex hedging strategies.
While the use of external techniques is indicative of a more advanced FX management
practice so can the relationship a company has with its derivative provider. A company
in its early stages of FX management seeks to build a foreign exchange relationship
with a bank that already is providing it with other financial services. The early
relationship is characterised with the bank providing the company with advice on
alternative derivatives and to supply them at market prices. As a more active policy is
adopted or trading volumes increase the relationship becomes more profitable for the
bank and the company may be able to establish foreign exchange relationships with
more than one bank. Finally when a company is an active trader in foreign exchange
markets, then bank margins become narrower as the company seeks inter-bank spreads.
If the company has the means to make very large deals it may enter into a wholesale
relationship with banks and act much like a bank would.100 However, as capabilities for
use of internal methods of hedging improve the need for external hedging is expected to
be reduced.101
4.5. Performance evaluation
The purpose of performance evaluation is to assess the quality of current FX exposure
management practices. It is the process of obtaining, analyzing and recording
information about recent performance such as successes, failures and profitability by
means of a select set of evaluation metrics. As the saying goes “what cannot be
measured, cannot be managed”.
The central performance criterion for evaluation of FX exposure management is the aim
of a company’s FX policy. In fact the FX policy itself should list the metrics by which
100 Canaday, J. and Feenstra, F., 1991 101 Holland, J., 1993
37
FX exposure management is to be measured by. It is critical that the performance
measurements are aligned with the aims of the FX policy. A mismatch between policy
and performance measurement such as evaluating a risk averse FX policy by measuring
its profitability will increase confusion and most likely fail in effectively reducing risk.
The aims of active FX policies can be categorized into risk averse and profit seeking
policies. Therefore there are two primary performance metrics correspondingly. Risk
can be measured by the volatility of the home currency value of net exposure and value
addition by measures of profitability. Alternatively a company can use a risk-adjusted
performance metric such as VAR, in which volatility and profitability both are
considered.102 These three types of metrics form the basic FX exposure management
performance measures from which most companies choose when a single metric
approach is adopted.
Literature recommends using more than one metric for FX exposure management
performance evaluation103. For example VAR alone is not sufficient in assessing the
over-all success of FX exposure management because developments in some areas of
FX exposure management, such as forecasting future FX rates, are not reflected in
changes of VAR. The five separate components of FX exposure management that are
identified by this study can be used as a basis for performance evaluation. The
performance of individual components of position calculation, future FX rate
forecasting and hedging can be individually evaluated with specific numerical metrics.
Some of the metrics for these components have already been discussed in previous
parts. Additionally it is recommended that the FX policy go under a formal review
every two to three years to make sure its applicability to current conditions104. Using
several metrics helps to track and reward improvements in performance as well as to
allocate resources to the areas needing extra effort. However, extensive reporting can be
102 Pramborg, B., 2002 103 Majority of the 31 MNCs included in the study by Wallace (1999) used more than one performance evaluation metric for measuring FX exposure management performance. 104 Wallace, J., 1999
38
a big effort for small companies and thus it is presumable that smaller companies prefer
to use fewer evaluation metrics.
There are very many different metrics that are used for performance evaluation. No
standard set can be identified and companies have to choose by themselves the ones that
they judge to suit best their needs and capabilities. Some aspects, however, are quite
important and it is worth looking into measuring their performance. One of them
concerns position calculation evaluation. Position calculations which include forecasted
exposure need to be measured for forecast errors. A study by Wallace105 of 31 MNCs
found that 75% of the companies with risk averse policies (6 of 8 companies) did not
control their forecast errors. It is important to keep in mind that even the best traders,
systems and controls cannot prevent losses from derivatives hedging an exposure that
does not exist106. Another important measurement that concerns companies which use
future FX rate forecasts is measuring the accuracy of the forecasts. Hedging
performance should be measured as well by frequently marking-to-market the
outstanding hedges as well as the underlying exposures. Hedging performance
evaluation needs a benchmark for comparison but no benchmark has become a standard
practice. Because the choice of a benchmark can drive hedging results to cluster around
it, a benchmark should be chosen with care107. Therefore the aim of the FX policy
should naturally be considered when choosing a benchmark to promote a common
direction.
Performance compensation is a common practice particularly in larger companies to
direct attention and to improve performance of employees. Similarly to mismatches
between policy and performance measurement, a performance evaluation metric that is
not aligned with management and employee evaluation and compensation will either be
ineffective or require change in how personnel are evaluated and compensated108. Over
105 Wallace, J., 1999 106 Wallace, J., 1999 107 Wallace, J., 1999 108 Wallace, J., 2002
39
half of the 31 MNCs included in a study109 compensated their traders based on
performance. Active hedgers among the MNCs used stronger positive correlation
between performance and bonuses. Examining whether people involved in FX exposure
management are compensated on the basis of the performance of FX exposure
management could be used as a proxy for sophistication of the performance evaluation
component.
The two activities of segregating the back office function and organizing risk oversight
are associated with performance evaluation of FX exposure management. They have
more to do with compliance to policies than performance per se, however, the risks
associated with the lack of these procedures and the need to segregate them from
personnel performing other activities of FX exposure management warrant their
placement under performance evaluation.
Back office activities of FX exposure management such as confirmations, accounting
and settlements need to be performed by different personnel than trading.110 The history
of derivatives usage in companies is littered with examples of massive losses from FX
speculation.111 An important point to understand, however, is that these losses have
been a cause of failures in risk management systems and controls rather than any
inherent risk in the use of derivatives themselves112. Shapiro113 provides a list of
practices recommended to be implemented in companies engaging in active FX
exposure management:
• Those trading derivatives should be separated from those who monitor them.
This allows for an independent review of FX exposures by preventing faulty
book keeping.
109 Wallace, J., 1999 110 Wallace, J., 1999 111 For instance see Dunne, T. et al., 2003 112 Shapiro, A., 2006 113 Shapiro, A., 2006
40
• Derivatives positions should be limited and they should be marked-to-market
value every day to avoid massive losses.
• Compensation schemes should place some of the risk on the shoulders of those
taking the risk to make them more cognizant of the risks they are taking.
• A system of scanning for and quickly reacting to early warning signals should be
put in place. It is not sufficient to pay attention only to things that look bad, but
to all things out of place such as excessive profits.
A study of the FX exposure management practices of 31 MNCs114 confirms the
importance of segregating back office functions. 93% of the 31 MNCs did not allow
their traders to confirm, do accounting or settle their trades. These actions are necessary
to prevent frauds in FX exposure management function.
Risk oversight deals with compliance by all parts of the company with the FX policy.
Companies are recommended to have a risk oversight committee consisting of senior
management to ensure that procedures of the FX management comply with the
approved FX policy.115 The risk oversight committee does not partake in tactical
decision-making but reviews FX strategies, exposure limits and may approve when
necessary exceptions to FX policy. Companies with significant FX exposure to manage
should also have a compliance function ensuring operational compliance with policy. Its
tasks include monitoring that only approved derivatives are used, trading procedures are
followed, exposures are properly calculated and FX risk correctly measured. The
compliance function set up for this purpose can be a part-time or a dedicated function
depending on the extent of FX exposure management. 90% of MNCs included in a
study116 had risk oversight practices consisting of a risk oversight committee (69%),
compliance function (84%) or both (61%). By contrast a study by Hakkarainen et al.117
reported that 17% of respondents did not monitor implementation of hedging decisions
at all.
114 Wallace, J., 1999 115 Wallace, J., 2002 116 Wallace, J., 1999 117 Hakkarainen, A. et al., 1996
41
5 Framework for evaluating FX exposure management practices
Previous studies have indicated that translation exposure should not be hedged and that
the competitive component of economic exposure is highly company and industry
specific. Considering the practicality of FX exposure management it is evident that
transaction exposure is essential but in addition there is a need for companies to account
for future foreign currency denominated cash flows currently unbound by contractual
agreements. As such a framework is needed that will account for both transaction
exposure and the operational part of economic exposure and concentrate on the division
of exposures into contractual and forecasted exposures.
Reviewing literature has revealed five distinct components that compose effective FX
exposure management. FX policy is the first component and the basis upon which other
FX exposure management components are built. A position calculation is performed to
establish the net exposure which is used as a basis for the following FX exposure
management activities. Forecasting future FX rates follows, but it can be considered as
a more advanced FX exposure management activity and is not a necessity for risk
averse policies. Hedging is another distinct component. It is the only activity which
actually affects the FX exposure and it uses the three preceding components of policy,
position calculation and forecasting future FX rates as its inputs. The last activity is
performance evaluation which assesses the output of the FX exposure management
process and the performance of its individual components. Performance evaluation
should have a dynamic relationship with the other components so that the overall
performance of FX exposure management could be improved. Despite the dependencies
that the components have with each other, they are in themselves distinct iterative
processes. The FX exposure management process can be depicted in a framework
diagram such as in Figure 5.1.
42
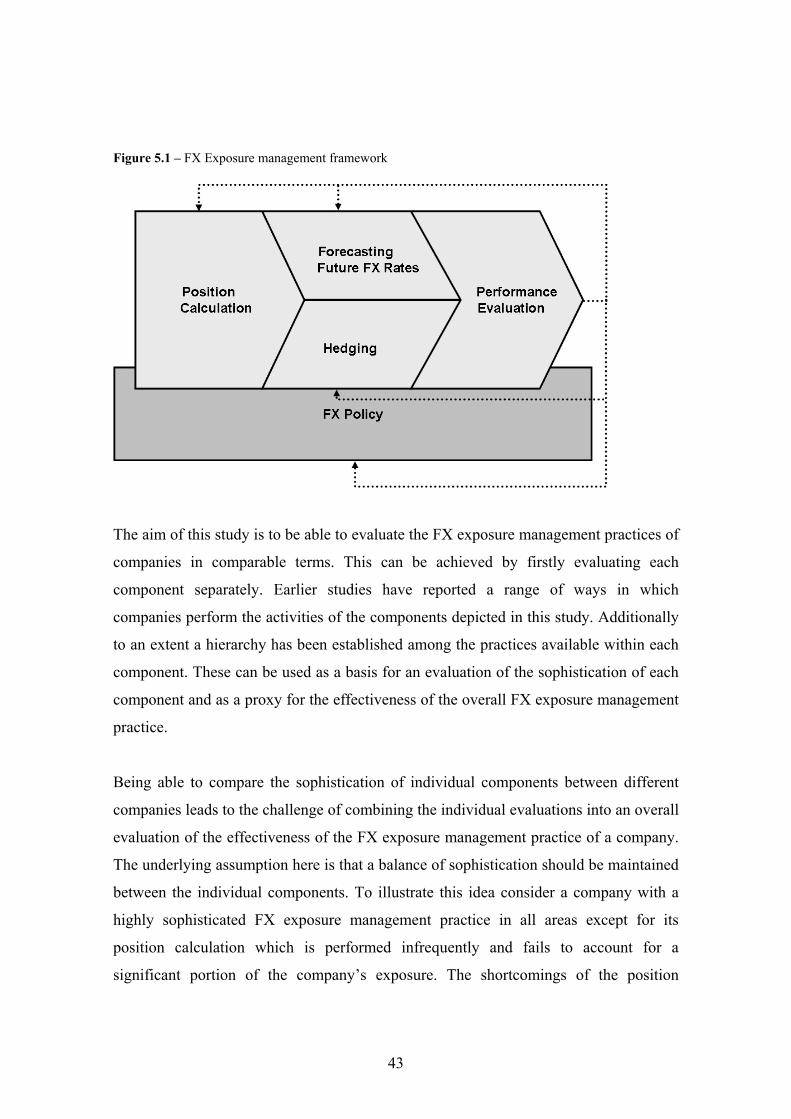
Figure 5.1 – FX Exposure management framework
The aim of this study is to be able to evaluate the FX exposure management practices of
companies in comparable terms. This can be achieved by firstly evaluating each
component separately. Earlier studies have reported a range of ways in which
companies perform the activities of the components depicted in this study. Additionally
to an extent a hierarchy has been established among the practices available within each
component. These can be used as a basis for an evaluation of the sophistication of each
component and as a proxy for the effectiveness of the overall FX exposure management
practice.
Being able to compare the sophistication of individual components between different
companies leads to the challenge of combining the individual evaluations into an overall
evaluation of the effectiveness of the FX exposure management practice of a company.
The underlying assumption here is that a balance of sophistication should be maintained
between the individual components. To illustrate this idea consider a company with a
highly sophisticated FX exposure management practice in all areas except for its
position calculation which is performed infrequently and fails to account for a
significant portion of the company’s exposure. The shortcomings of the position
43
calculation component will obviously affect the overall performance and no degree of
further improvement in e.g. the hedging activity will improve the overall performance.
Due to these interdependencies the evaluation should be balanced so that it can point
out which components require efforts of improvement in order to improve the overall
performance of the FX exposure management practice. To be able to measure the
sophistication of FX exposure management practices of companies and to be able to do
company comparison a survey study is undertaken.
6 Survey study
A survey study was constructed to study the FX exposure management practices of
companies. The survey was conducted between December 2010 and January 2011 as an
online questionnaire. An e-mail invitation to participate in the study was sent to 1110
Finnish non-financial companies involved in foreign trade. The companies selected for
the study were gathered from a database of Finnish companies involved in foreign trade
compiled by Finpro and the list of companies publicly listed in the Finnish stock
exchange (OMX Helsinki). The invitation was directed to the manager responsible for
FX exposure management or the chief financial officer depending on availability of
contact information. Of these companies 110 participated in the survey and a total
number of 86 responses were applicable for this study. 24 responses were excluded
from further analysis because they indicated that 0% of their annual revenues and
expenditures were in foreign currencies118. The applicable responses constituted an
overall 7,7 % response rate. A copy of the survey can be found in appendix A. The
survey was translated into Finnish and the respondents had the opportunity to choose
between answering in Finnish or English.
118 At least partially the loss of 24 responses is attributable to the question setting for ii. Foreign exchange exposure. 10% was the smallest positive choice in the question for the portion of revenues and expenditures in foreign currencies. Among the 24 companies some likely had positive foreign exchange exposures despite choosing 0% for both revenues and expenditures.
44
This part will first go over the variables used in the study and then progress towards
describing the sample in more details. Finally the empirical results are presented for
each dependant variable in accordance with the five FX exposure management
components giving and overview of each component.
6.1. Variable definitions
Explanatory variables:
Size of a company and the extent of its foreign exchange exposure have been
extensively shown by studies to be strong explanatory variables for the sophistication of
FX exposure management practices119. In addition to these two variables the number of
foreign currencies a company conducts its business in may be of interest. Therefore
these three variables are used as the explanatory variables in this study. The components
of FX exposure management identified in this study and their individual aspects
depicted by the dependant variables are evaluated in terms of sophistication by using the
explanatory variables.
i. Size (A1120)
Size of a company is measured in this study by its annual revenues. Revenue was
chosen because it accounts for the core business and real cash flows. Net assets used by
some studies could have been an alternative measure; however, net assets have more
importance for studies of translation exposure than transactional exposure. Several
studies have reported changes in FX exposure management practices as company size
grows121. Further more companies were divided into five size categories based on
annual revenues (r):
119 See e.g. Hakkarainen, A. et al., 1996 and Pramborg, B., 2002 120 A1, A2, A3, and so forth refer to the question numbers on the survey. See appendix A. 121 See e.g. Hakkarainen, A. et al., 1996 and Pramborg, B., 2002
45
1. r ≤ 2 M€
2. 2 M€ < r ≤ 10 M€
3. 10 M€ < r ≤ 50 M€
4. 50 M€ < r ≤ 500 M€
5. r > 500 M€
Size categories were selected to reflect the EU recommendation 2003/361/EC for SME
size definitions. This accounts for the three smallest categories. For the purpose of this
study it was perceived useful to divide large companies further into two categories.
Logarithmic scale was chosen to set the division between the two largest size categories.
ii. Foreign exchange exposure (A2)
Having foreign exchange exposure is a prerequisite for managing it. As the size of FX
exposure grows it also becomes more important to manage and more elaborate methods
are required from an operational perspective. Also as exposure grows new tools like FX
derivatives become financially feasible options. Thus it is presumable that foreign
exchange exposure is positively related to the sophistication of FX exposure
management practices.
This study uses the average of the percentages of a company’s annual revenues and
expenditures that are denominated in foreign currencies multiplied by its annual revenue
as a proxy for foreign exchange exposure. There was no indirect way to assess the
operating profit of the participating companies and directly asking it was perceived to
influence survey response rate negatively. Thus, the formula for calculation the foreign
exchange exposure was selected to give a good estimate across companies. Also a
similar measure was used at least in one previous study122.
122 Pramborg, B., 2002
46
iii. Foreign currencies (A3)
Ten foreign currencies most used123 by Finnish companies in foreign trade were
selected in addition to an 11th category encompassing all other foreign currencies. In
addition to foreign exchange exposure the number of foreign currencies a company
conducts its business in is a proxy for the extent of its foreign business. A company with
more currencies to manage is presumably more likely to adopt FX exposure
management practices and a positive relationship is expected between this variable and
the sophistication of FX exposure management practices in companies.
Dependant variables:
The dependant variables in this study represent companies’ decisions on how to manage
FX exposure. This examination is built around the five components of FX exposure
management examining each component individually.
FX policy:
a. Policy format (A4)
Policy format measures to what extent companies have progressed in developing
and formalizing their FX policy. Earlier studies124 have used similar categorizations.
b. Policy aim (A5)
Empirical evidence125 suggests that companies with more sophisticated FX
exposure management practices are more prone to seek profits from FX exposure
management. Conversely less developed companies follow more risk averse
policies. Thus, it would be presumable that the explanatory variables would be
positively related to active and profit seeking FX policy aims. Companies with a
policy format of no policy were not included in the analysis.
123 Source Tulli import and export statistics of 2009, Finland’s 10 largest trade partners measured by combined value of imports and exports excluding all countries using EUR as their domestic currency. 124 See e.g. Hakkarainen, A. et al., 1996 125 See e.g. Hakkarainen, A. et al., 1996 and Doukas, J. and Lang, L., 1995
47
c. Centralization (A6)
Literature considers centralized FX exposure management as a best practice.
However, some authors126 have pointed out the value of local market knowledge.
This would suggest a development from decentralized to centralized and further to a
hybrid model as FX exposure management becomes highly sophisticated.
Companies with a policy format of no policy were not included in the analysis.
d. Policy components (A7)
This is a measure of the degree of sophistication of the FX policy. It is evaluated
quantitatively on a scale of 0-15 with all items valued equally. Companies with a
policy format of no policy and general guidelines which are not documented were
not included in the analysis.
Position calculation:
e. Position calculation (B1)
This dummy variable measures whether a company uses a position calculation to
manage its FX exposure. This variable is assigned a value of 1 in the case a
company uses a position calculation and 0 otherwise.
f. Position update (B2)
This variable measures the frequency with which a company reviews the size of its
FX exposure. When the updating frequency is low reacting to changes in FX
exposure become delayed and new positions remain open for longer periods. It is
presumable that updating of the position calculation becomes systematic and more
frequent as the sophistication of FX exposure management increases. Only
companies that had a position calculation were included in the analysis.
126 Daniels, J., 2004
48
g. Time horizon (B3)
Unsophisticated FX exposure management practices are expected to have short time
horizons on their position calculations. As exposure forecasting capabilities improve
time horizons are expected to increase. However, the ability to forecast exposures
may be hindered by industry dynamics and divergence is expected to be larger
among companies with more sophisticated practices. Only companies that had a
position calculation were included in the analysis.
h. Position calculation contents (B4)
This variable represents the sophistication of the position calculation and whether a
company employs exposure forecasting. Only companies that had a position
calculation were included in the analysis.
i. Use of IT (B5)
The use of IT dramatically improves accuracy and timeliness of position
calculations and overall FX exposure management capabilities. This variable assess
the sophistication of IT infrastructure used for purposes of FX exposure
management. Presumably the explanatory variables are positively correlated with
the use of IT. Only companies that had a position calculation were included in the
analysis.
j. Analytic methods (B6)
Analytic methods improve exposure and risk assessment which may lead to cost
reductions and improvements in performance of FX exposure management. This
variable measures the range of analytic methods employed by companies and uses a
quantitative analysis with a scale of 0-9 and all items equally valued. Only
companies that had a position calculation were included in the analysis.
49
Forecasting future FX rates:
k. Forecast usage (C1)
Use of future FX rate forecasts can improve hedging decisions and are needed by
companies with active profit seeking policies. Earlier studies have shown that
companies find long-term forecasting difficult and thus, it is presumed that less
sophisticated companies will use only short-term forecasts. The use of forecasts is
expected to be positively related to the explanatory variables.
l. Forecast source (C2)
Empirical evidence127 shows that companies with more sophisticated FX exposure
management practices prefer to develop internal forecasting capabilities. Smaller
companies have been shown to prefer external sources128. Thus, a positive
relationship between size and internalization of future FX rate forecasting is
presumed. Companies that did not use any forecasts were excluded from analysis.
m. Local knowledge (C3)
This variable represents the use of local knowledge from foreign subsidiaries in FX
rate forecasting. Particularly in smaller economies, it may be that local managers
have better access to local information which could be valuable for forecasting
future FX rates. The use of local knowledge is expected to increase with company
size.
Hedging:
n. Internal hedging (D1)
This variable measures the range of internal hedging techniques used by a company.
Some techniques like netting are only available to larger companies so positive
127 Hakkarainen, A. et al., 1996 128 Harju, M. and Martikainen, T., 1997
50
relationship between size and the extent of internal hedging techniques use is
expected.
o. External hedging (D2)
Derivative hedging requires specialized knowledge and may present challenges with
e.g. pricing. Standard contract sizes may also exclude their use from smaller
companies. It is therefore presumable that the use of external hedging methods
increases with the explanatory variables.
p. Speculation (D3)
Preceding studies have shown that some companies allow speculation with
derivatives while others do not allow it. Speculation is usually associated with profit
seeking policies and thus a relationship similar to that between active profit seeking
policy and the explanatory variables is expected.
Performance evaluation:
q. Primary metrics (E1)
To evaluate the performance of FX exposure management a company needs to
measure it. Literature has suggested three categories of measurements suitable for
FX exposure management129. This variable measures which type of metric is chosen
by the company to evaluate their FX exposure management by.
r. Secondary metrics (E2)
Assessing the performance of the main components of the FX exposure
management process gives management improved oversight. This variable measures
whether performance metrics are set for three of the FX exposure management
components identified in this study. A positive relationship with their use and both
of the explanatory variables is expected.
129 Wallace, J., 2002 and Pramborg, B., 2002
51
s. Policy review (E3)
This variable measures how often a company reviews and renews its FX policy.
Taking a systematic approach to improving FX policy enables a company to react to
change in its operating environment. Policy review frequency is presumed to be
positively related to the explanatory variables.
t. Position valuation (E4)
Frequently valuing hedges and underlying exposures reduces risk of excessive
losses. Also a company capable of valuing its positions frequently is well set for
performing other advanced FX exposure management activities requiring proper
position calculations. Frequency of position valuation is presumed to be positively
related to both of the explanatory variables.
u. Back office segregation (E5)
Segregating back office functions reduces risk of fraud and improves compliance to
FX policy. Smaller companies are expected have less back office segregation as
they have fewer employees involved in FX exposure management. Empirical
evidence130 shows that very few MNCs do not segregate back office functions and
thus a positive relationship between the explanatory variables is presumed. It is also
expected that companies allowing speculation are more likely to segregate back
office functions.
v. Risk oversight (E5)
Empirical evidence131 shows that larger companies implement risk oversight
mechanisms such as risk oversight committees or compliance functions to manage
FX risk. This variable dummy variable has a value 0 when a company has not
developed the risk oversight mechanism and 1 when it has. A positive relationship
between the explanatory variables and risk oversight is expected. It is also expected
130 Wallace, J., 1999 131 Wallace, J., 1999
52
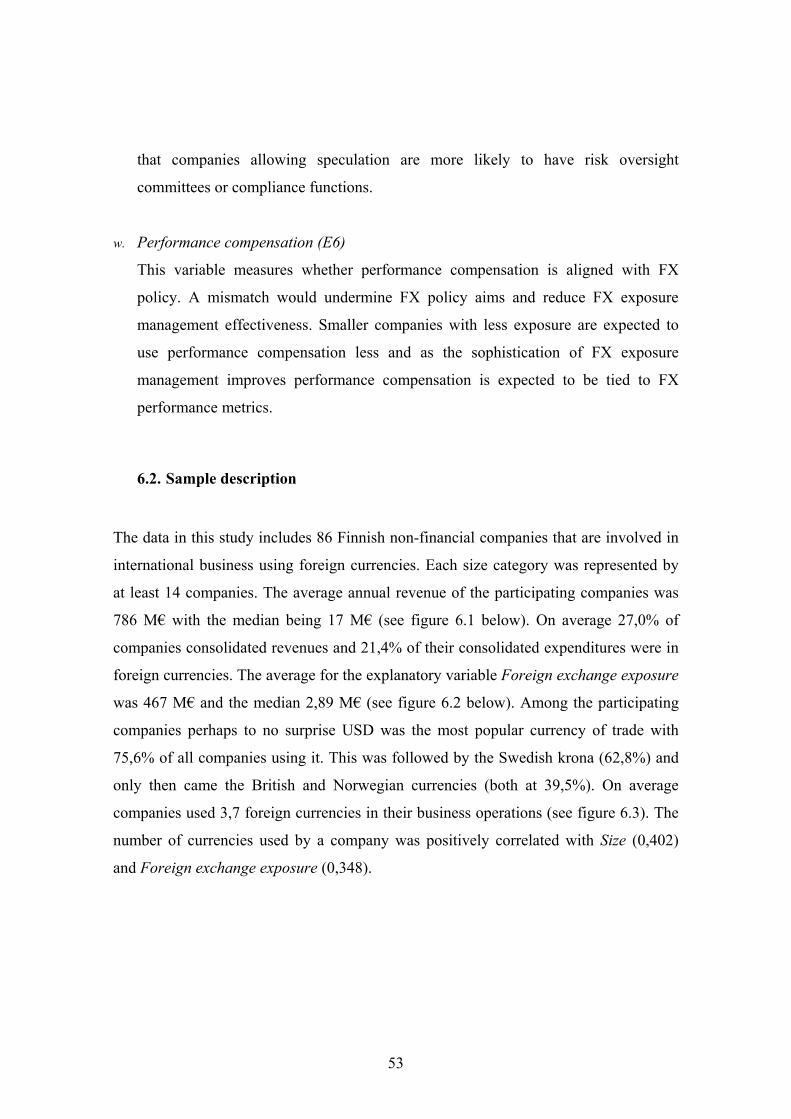
that companies allowing speculation are more likely to have risk oversight
committees or compliance functions.
w. Performance compensation (E6)
This variable measures whether performance compensation is aligned with FX
policy. A mismatch would undermine FX policy aims and reduce FX exposure
management effectiveness. Smaller companies with less exposure are expected to
use performance compensation less and as the sophistication of FX exposure
management improves performance compensation is expected to be tied to FX
performance metrics.
6.2. Sample description
The data in this study includes 86 Finnish non-financial companies that are involved in
international business using foreign currencies. Each size category was represented by
at least 14 companies. The average annual revenue of the participating companies was
786 M€ with the median being 17 M€ (see figure 6.1 below). On average 27,0% of
companies consolidated revenues and 21,4% of their consolidated expenditures were in
foreign currencies. The average for the explanatory variable Foreign exchange exposure
was 467 M€ and the median 2,89 M€ (see figure 6.2 below). Among the participating
companies perhaps to no surprise USD was the most popular currency of trade with
75,6% of all companies using it. This was followed by the Swedish krona (62,8%) and
only then came the British and Norwegian currencies (both at 39,5%). On average
companies used 3,7 foreign currencies in their business operations (see figure 6.3). The
number of currencies used by a company was positively correlated with Size (0,402)
and Foreign exchange exposure (0,348).
53
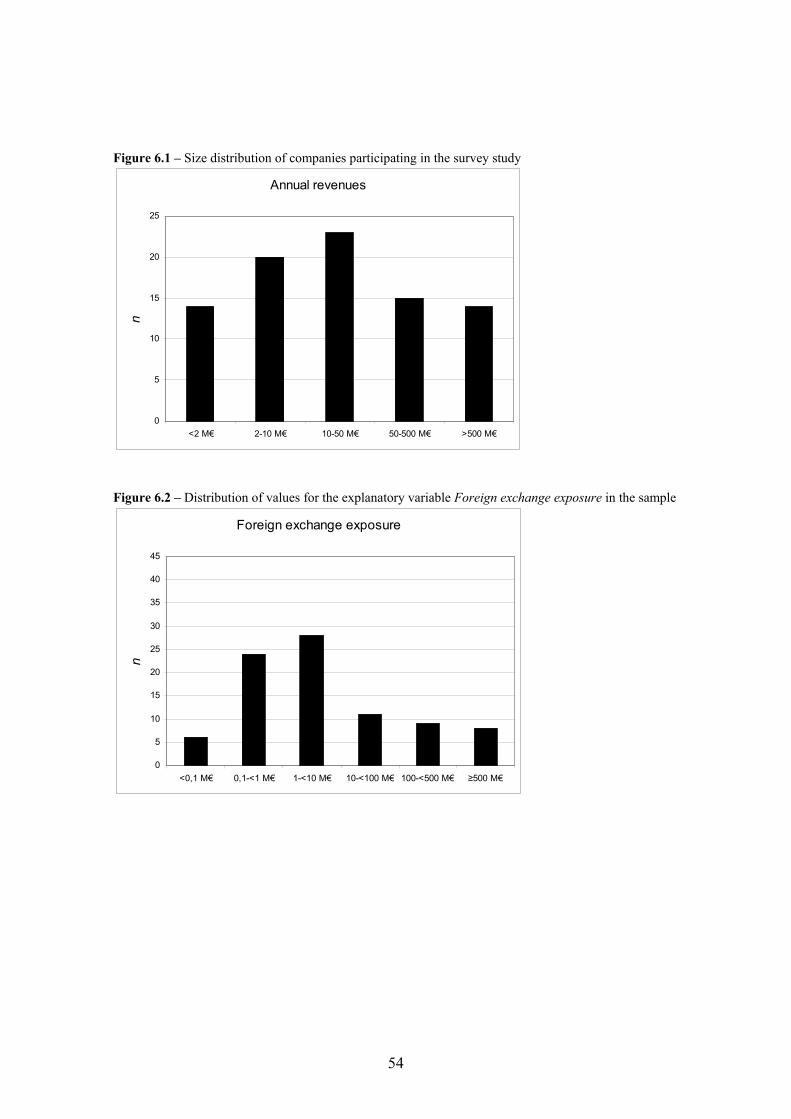
Figure 6.1 – Size distribution of companies participating in the survey study
Annual revenues
0
5
10
15
20
25
<2 M€ 2-10 M€ 10-50 M€ 50-500 M€ >500 M€
n
Figure 6.2 – Distribution of values for the explanatory variable Foreign exchange exposure in the sample
Foreign exchange exposure
0
5
10
15
20
25
30
35
40
45
<0,1 M€ 0,1-<1 M€ 1-<10 M€ 10-<100 M€ 100-<500 M€ ≥500 M€
n
54
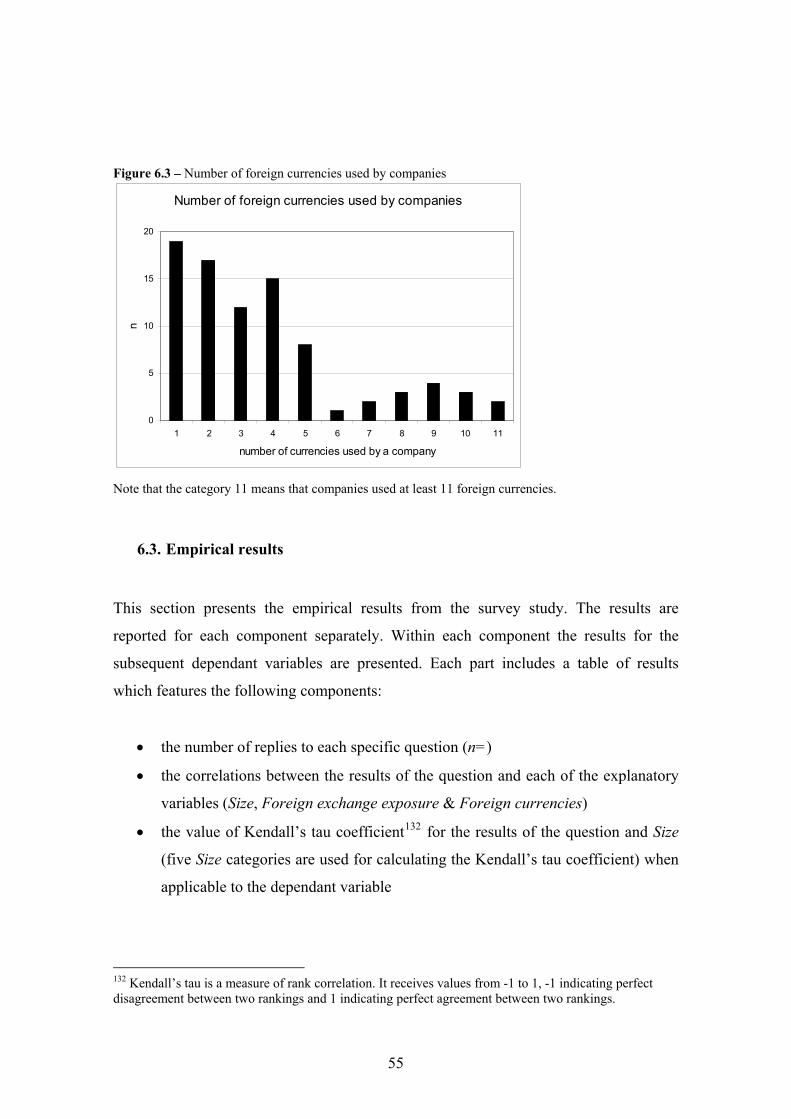
Figure 6.3 – Number of foreign currencies used by companies
Number of foreign currencies used by companies
0
5
10
15
20
1 2 3 4 5 6 7 8 9 10 11
number of currencies used by a company
n
Note that the category 11 means that companies used at least 11 foreign currencies.
6.3. Empirical results
This section presents the empirical results from the survey study. The results are
reported for each component separately. Within each component the results for the
subsequent dependant variables are presented. Each part includes a table of results
which features the following components:
• the number of replies to each specific question (n=)
• the correlations between the results of the question and each of the explanatory
variables (Size, Foreign exchange exposure & Foreign currencies)
• the value of Kendall’s tau coefficient132 for the results of the question and Size
(five Size categories are used for calculating the Kendall’s tau coefficient) when
applicable to the dependant variable
132 Kendall’s tau is a measure of rank correlation. It receives values from -1 to 1, -1 indicating perfect disagreement between two rankings and 1 indicating perfect agreement between two rankings.
55
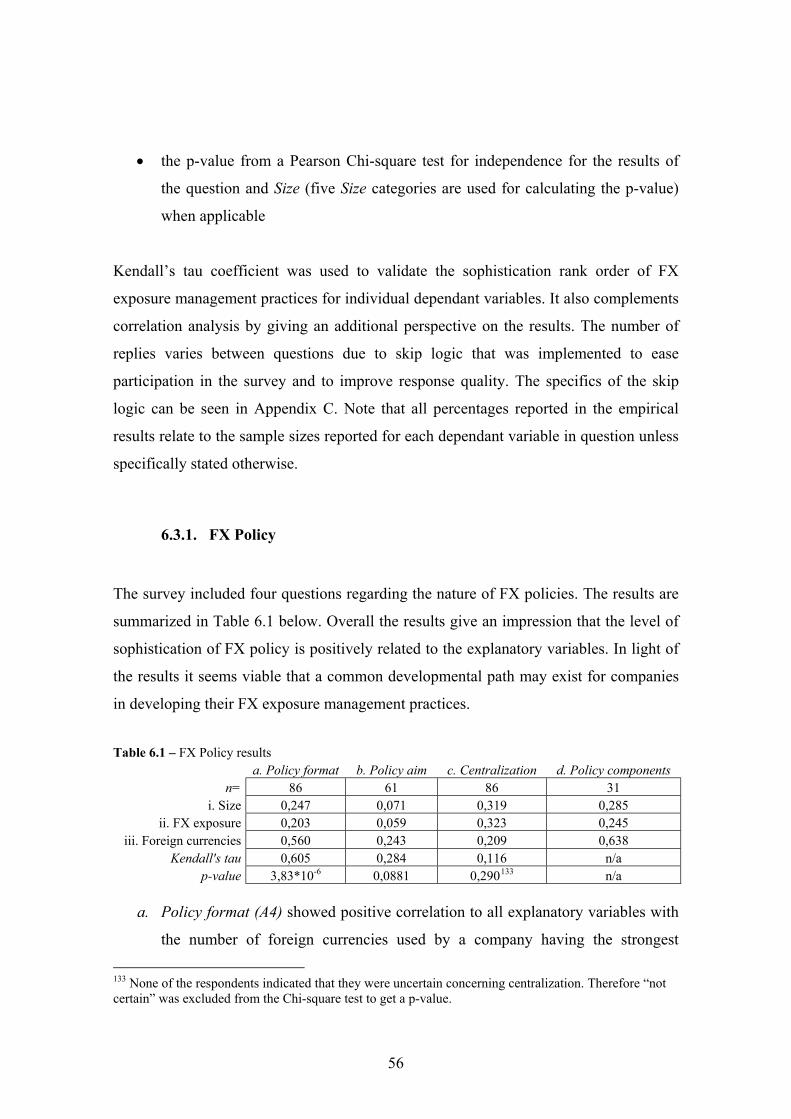
• the p-value from a Pearson Chi-square test for independence for the results of
the question and Size (five Size categories are used for calculating the p-value)
when applicable
Kendall’s tau coefficient was used to validate the sophistication rank order of FX
exposure management practices for individual dependant variables. It also complements
correlation analysis by giving an additional perspective on the results. The number of
replies varies between questions due to skip logic that was implemented to ease
participation in the survey and to improve response quality. The specifics of the skip
logic can be seen in Appendix C. Note that all percentages reported in the empirical
results relate to the sample sizes reported for each dependant variable in question unless
specifically stated otherwise.
6.3.1. FX Policy
The survey included four questions regarding the nature of FX policies. The results are
summarized in Table 6.1 below. Overall the results give an impression that the level of
sophistication of FX policy is positively related to the explanatory variables. In light of
the results it seems viable that a common developmental path may exist for companies
in developing their FX exposure management practices.
Table 6.1 – FX Policy results a. Policy format b. Policy aim c. Centralization d. Policy components
n= 86 61 86 31 i. Size 0,247 0,071 0,319 0,285
ii. FX exposure 0,203 0,059 0,323 0,245 iii. Foreign currencies 0,560 0,243 0,209 0,638
Kendall's tau 0,605 0,284 0,116 n/a p-value 3,83*10-6 0,0881 0,290133 n/a
a. Policy format (A4) showed positive correlation to all explanatory variables with
the number of foreign currencies used by a company having the strongest
133 None of the respondents indicated that they were uncertain concerning centralization. Therefore “not certain” was excluded from the Chi-square test to get a p-value.
56
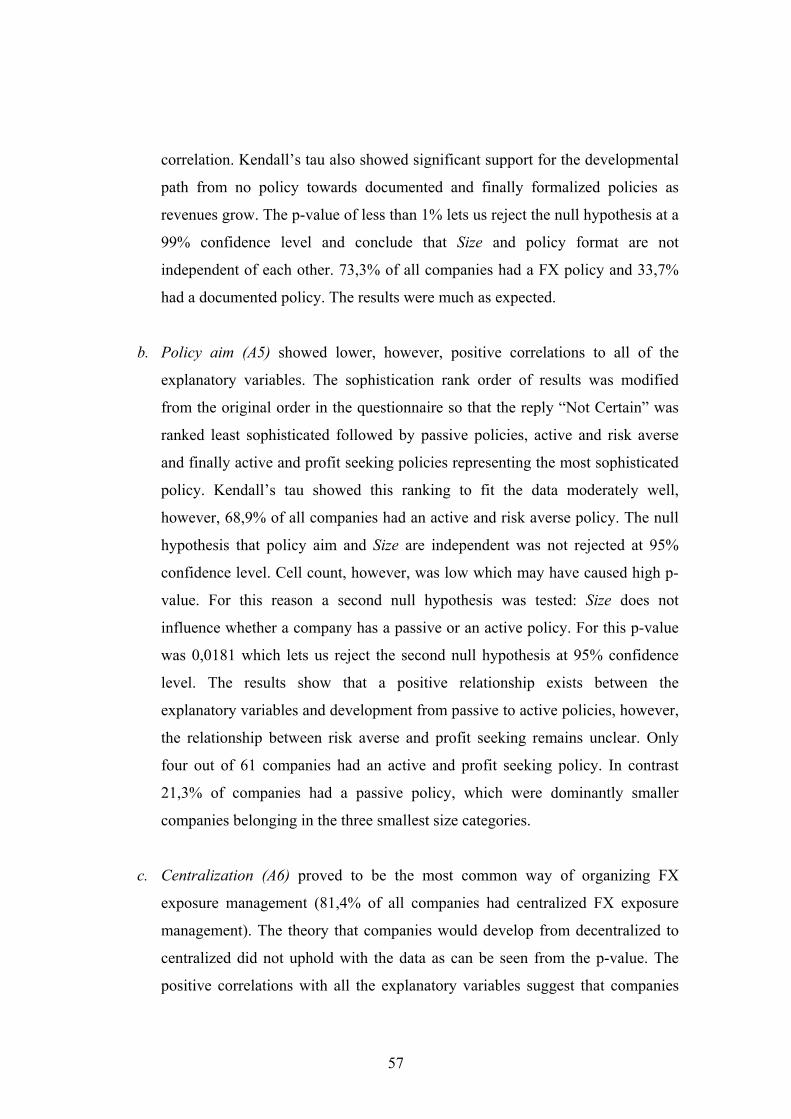
correlation. Kendall’s tau also showed significant support for the developmental
path from no policy towards documented and finally formalized policies as
revenues grow. The p-value of less than 1% lets us reject the null hypothesis at a
99% confidence level and conclude that Size and policy format are not
independent of each other. 73,3% of all companies had a FX policy and 33,7%
had a documented policy. The results were much as expected.
b. Policy aim (A5) showed lower, however, positive correlations to all of the
explanatory variables. The sophistication rank order of results was modified
from the original order in the questionnaire so that the reply “Not Certain” was
ranked least sophisticated followed by passive policies, active and risk averse
and finally active and profit seeking policies representing the most sophisticated
policy. Kendall’s tau showed this ranking to fit the data moderately well,
however, 68,9% of all companies had an active and risk averse policy. The null
hypothesis that policy aim and Size are independent was not rejected at 95%
confidence level. Cell count, however, was low which may have caused high p-
value. For this reason a second null hypothesis was tested: Size does not
influence whether a company has a passive or an active policy. For this p-value
was 0,0181 which lets us reject the second null hypothesis at 95% confidence
level. The results show that a positive relationship exists between the
explanatory variables and development from passive to active policies, however,
the relationship between risk averse and profit seeking remains unclear. Only
four out of 61 companies had an active and profit seeking policy. In contrast
21,3% of companies had a passive policy, which were dominantly smaller
companies belonging in the three smallest size categories.
c. Centralization (A6) proved to be the most common way of organizing FX
exposure management (81,4% of all companies had centralized FX exposure
management). The theory that companies would develop from decentralized to
centralized did not uphold with the data as can be seen from the p-value. The
positive correlations with all the explanatory variables suggest that companies
57
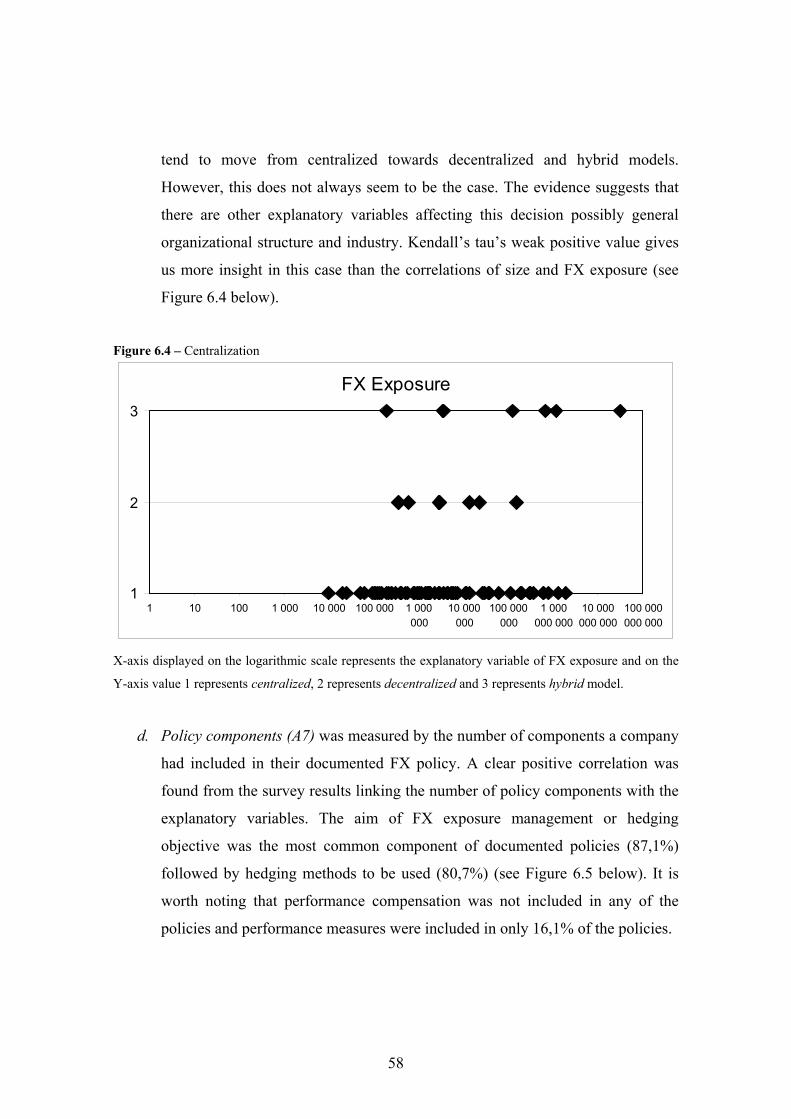
tend to move from centralized towards decentralized and hybrid models.
However, this does not always seem to be the case. The evidence suggests that
there are other explanatory variables affecting this decision possibly general
organizational structure and industry. Kendall’s tau’s weak positive value gives
us more insight in this case than the correlations of size and FX exposure (see
Figure 6.4 below).
Figure 6.4 – Centralization
FX Exposure
1
2
3
1 10 100 1 000 10 000 100 000 1 000000
10 000000
100 000000
1 000000 000
10 000000 000
100 000000 000
X-axis displayed on the logarithmic scale represents the explanatory variable of FX exposure and on the
Y-axis value 1 represents centralized, 2 represents decentralized and 3 represents hybrid model.
d. Policy components (A7) was measured by the number of components a company
had included in their documented FX policy. A clear positive correlation was
found from the survey results linking the number of policy components with the
explanatory variables. The aim of FX exposure management or hedging
objective was the most common component of documented policies (87,1%)
followed by hedging methods to be used (80,7%) (see Figure 6.5 below). It is
worth noting that performance compensation was not included in any of the
policies and performance measures were included in only 16,1% of the policies.
58
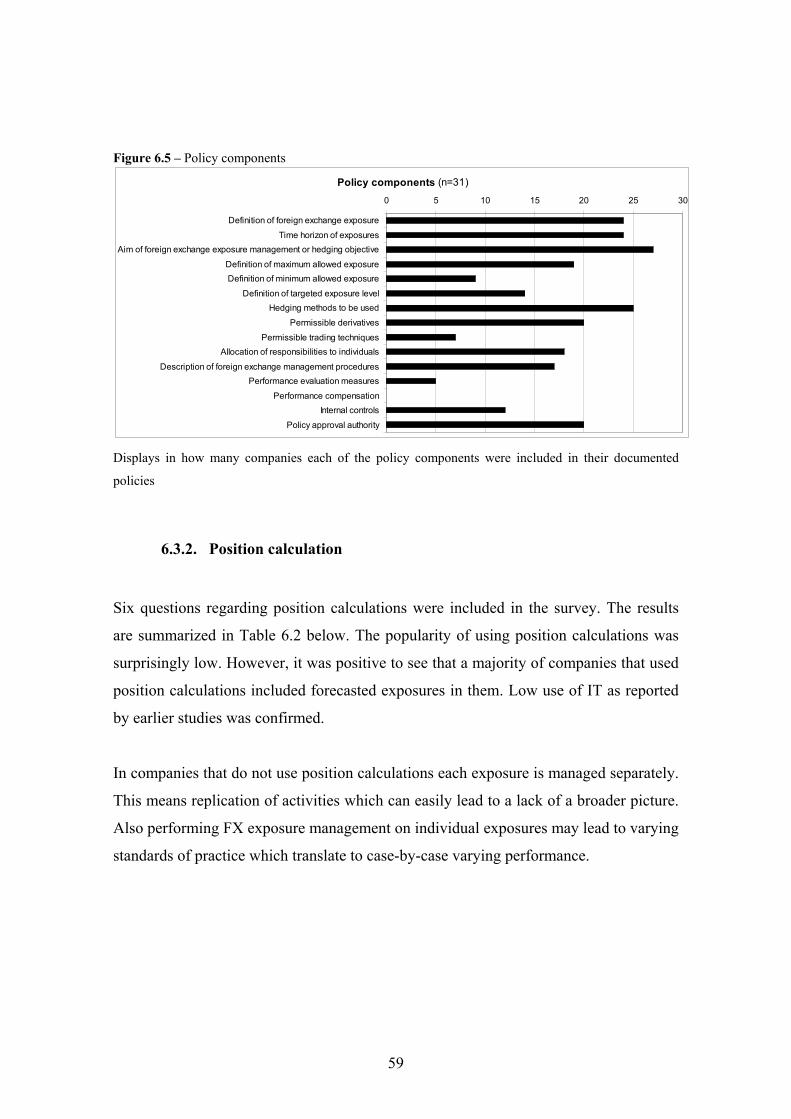
Figure 6.5 – Policy components
Policy components (n=31)
0 5 10 15 20 25 30
Definition of foreign exchange exposure
Time horizon of exposuresAim of foreign exchange exposure management or hedging objective
Definition of maximum allowed exposureDefinition of minimum allowed exposure
Definition of targeted exposure levelHedging methods to be used
Permissible derivatives
Permissible trading techniquesAllocation of responsibilities to individuals
Description of foreign exchange management proceduresPerformance evaluation measures
Performance compensationInternal controls
Policy approval authority
Displays in how many companies each of the policy components were included in their documented
policies
6.3.2. Position calculation
Six questions regarding position calculations were included in the survey. The results
are summarized in Table 6.2 below. The popularity of using position calculations was
surprisingly low. However, it was positive to see that a majority of companies that used
position calculations included forecasted exposures in them. Low use of IT as reported
by earlier studies was confirmed.
In companies that do not use position calculations each exposure is managed separately.
This means replication of activities which can easily lead to a lack of a broader picture.
Also performing FX exposure management on individual exposures may lead to varying
standards of practice which translate to case-by-case varying performance.
59
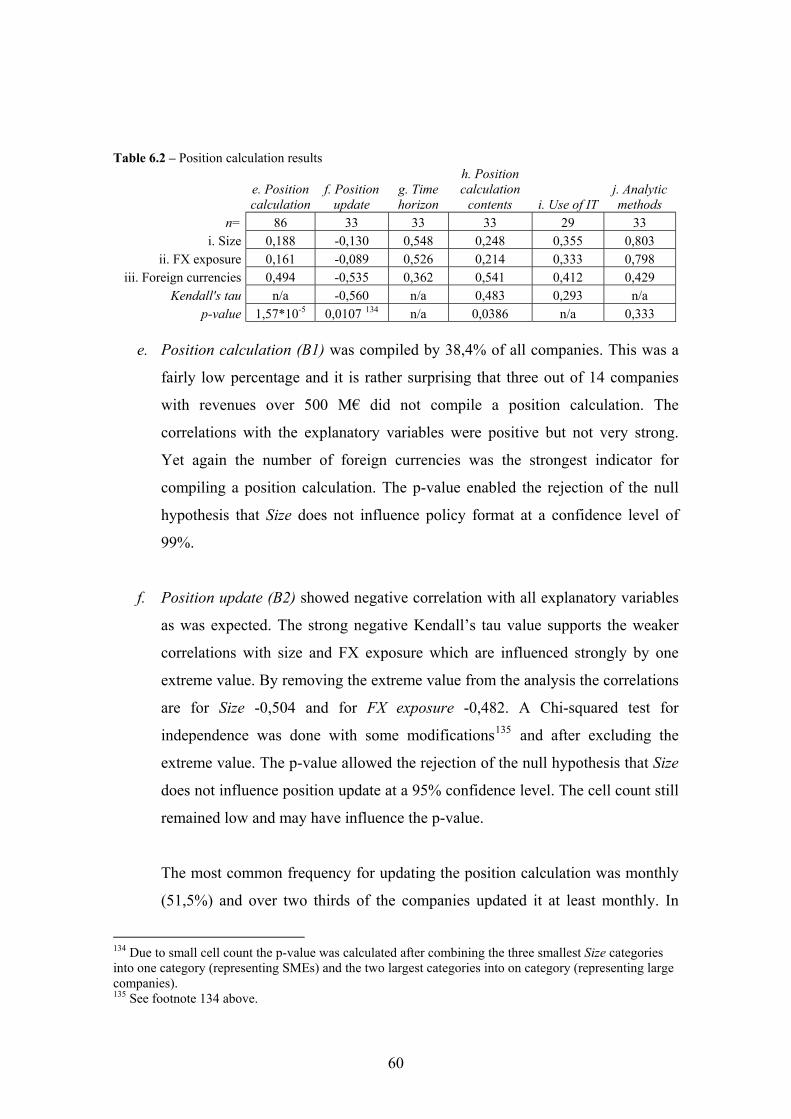
Table 6.2 – Position calculation results
e. Position calculation
f. Position update
g. Time horizon
h. Position calculation
contents i. Use of IT j. Analytic methods
n= 86 33 33 33 29 33 i. Size 0,188 -0,130 0,548 0,248 0,355 0,803
ii. FX exposure 0,161 -0,089 0,526 0,214 0,333 0,798 iii. Foreign currencies 0,494 -0,535 0,362 0,541 0,412 0,429
Kendall's tau n/a -0,560 n/a 0,483 0,293 n/a p-value 1,57*10-5 0,0107 134 n/a 0,0386 n/a 0,333
e. Position calculation (B1) was compiled by 38,4% of all companies. This was a
fairly low percentage and it is rather surprising that three out of 14 companies
with revenues over 500 M€ did not compile a position calculation. The
correlations with the explanatory variables were positive but not very strong.
Yet again the number of foreign currencies was the strongest indicator for
compiling a position calculation. The p-value enabled the rejection of the null
hypothesis that Size does not influence policy format at a confidence level of
99%.
f. Position update (B2) showed negative correlation with all explanatory variables
as was expected. The strong negative Kendall’s tau value supports the weaker
correlations with size and FX exposure which are influenced strongly by one
extreme value. By removing the extreme value from the analysis the correlations
are for Size -0,504 and for FX exposure -0,482. A Chi-squared test for
independence was done with some modifications135 and after excluding the
extreme value. The p-value allowed the rejection of the null hypothesis that Size
does not influence position update at a 95% confidence level. The cell count still
remained low and may have influence the p-value.
The most common frequency for updating the position calculation was monthly
(51,5%) and over two thirds of the companies updated it at least monthly. In
134 Due to small cell count the p-value was calculated after combining the three smallest Size categories into one category (representing SMEs) and the two largest categories into on category (representing large companies). 135 See footnote 134 above.
60
light of this evidence the presumption that updating position calculations
becomes systematic and more frequent as FX exposure management practices
become more sophisticated is supported.
g. Time horizon (B3) is a measure for how far in the future does a position
calculation track FX exposure. The average time horizon was 9,1 months with
54,5% of companies using a 12 month horizon. The correlations of the
explanatory variables were significantly positive supporting the progressive
relationship.
To evaluate whether larger companies have a larger divergence in their
capabilities to forecast exposure the results of the largest companies (>500 M€
revenues) were compared to smaller companies (<500 M€). This was done by
comparing the slopes of the logarithmic regression lines for the variables of
Time horizon and Size. For the smaller companies the slope was 1,122 and for
the largest companies it was 2,717. The values for Time horizon ranged for the
smaller companies from 0 to 12 months and for the larger companies from 3 to
24 months. The larger slope and the larger span both support the presumption
that greater divergence exists for larger companies.136
h. Position calculation contents (B4) The survey results showed that the order of
sophistication presumed in the survey for the contents of position calculation
was correct. This was indicated by the Kendall’s tau value of 0,483. In addition
the p-value enabled the rejection of the null hypothesis that Size and position
calculation contents were independent at a 95% confidence level. In short
companies include financial hedges along with contractually binding exposures
in their position calculation before incorporating forecasted exposures into their
position calculations. Due to low cell count in the Chi-squared test for
136 The choice of using 500 M€ revenues as the point of comparison was based on sample dynamics. Most of the companies in the sample for this variable had revenues of over 50 M€ leaving too few companies in the smaller categories. Also 33% of the companies in the sample belonged in the largest size category so it was a natural choice.
61
independence future research should attempt to verify these results. 60,6% of
companies included forecasted exposures in their position calculations and
39,4% had all three, contractually binding exposures, forecasted exposures and
financial hedges, in their position calculations.
i. Use of IT (B5) was limited to simple calculations with e.g. Excel in 69,0% of the
companies. This was not a surprise as previous studies and literature had
described this to often be the case. Never-the-less, positive correlation with the
explanatory variables supports the presumed positive correlation. Kendall’s tau
adds further support and validates the order of sophistication presumed in the
survey. In 17,2% of companies position calculations were part of a separate
treasury or accounting software with only 1 company reporting it to be a part of
their ERP137 software.
j. Analytic methods (B6) had high positive correlations with the explanatory
variables. The results were dominated by low usage of analytic methods for
assessing exposure and risk. 54,5% of companies did not use any of the analytic
methods and only one company used more than two methods. Sensitivity
analysis was the most popular method (24,2%) with cross hedging following
right behind (21,2%). None of the companies used linear programming or
optimization. Stress testing or scenarios were also popular with five of the 33
companies using them. The null hypothesis that Size does not influence use of
analytical methods was not rejected, but again low cell count may have
influenced the p-value138.
137 ERP = Enterprise Resource Planning 138 For this reason the same null hypothesis was retested after combining the three smallest Size categories into one category (representing SMEs) and the two largest categories into on category (representing large companies). This resulted in a p-value of 0,0744 which still did not allow for rejecting the null hypothesis at a 95% confidence level.
62
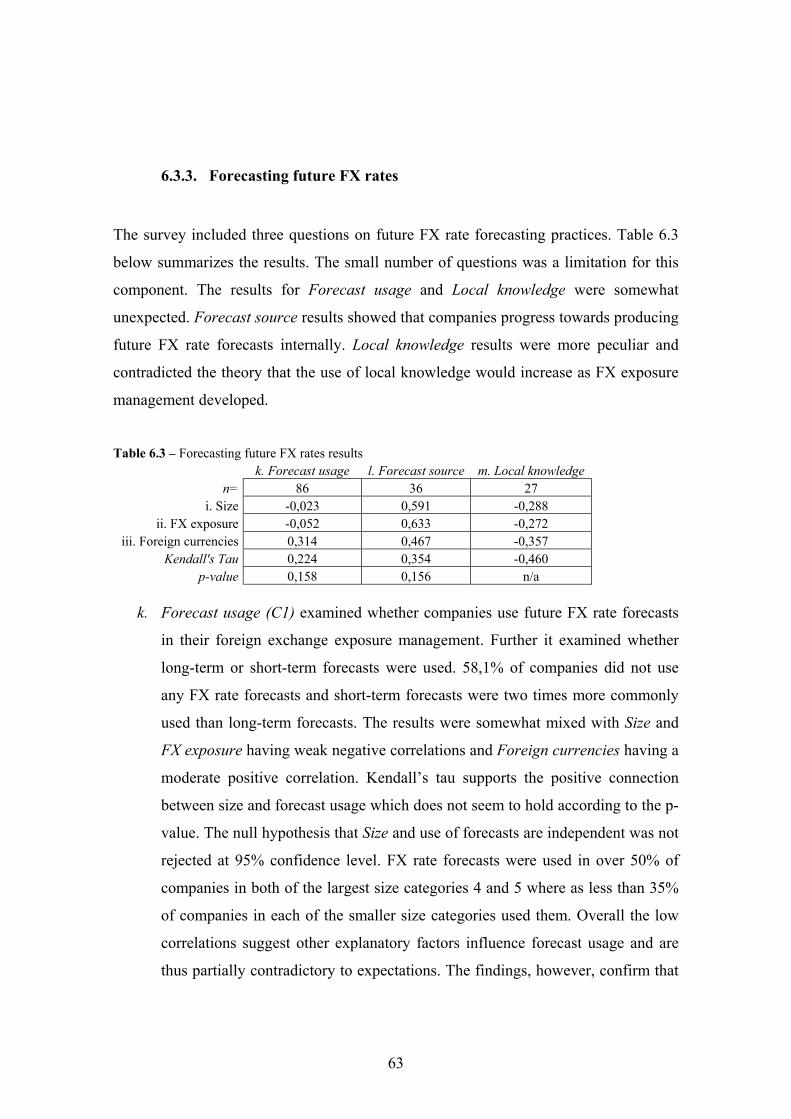
6.3.3. Forecasting future FX rates
The survey included three questions on future FX rate forecasting practices. Table 6.3
below summarizes the results. The small number of questions was a limitation for this
component. The results for Forecast usage and Local knowledge were somewhat
unexpected. Forecast source results showed that companies progress towards producing
future FX rate forecasts internally. Local knowledge results were more peculiar and
contradicted the theory that the use of local knowledge would increase as FX exposure
management developed.
Table 6.3 – Forecasting future FX rates results
k. Forecast usage l. Forecast source m. Local knowledge n= 86 36 27
i. Size -0,023 0,591 -0,288 ii. FX exposure -0,052 0,633 -0,272
iii. Foreign currencies 0,314 0,467 -0,357 Kendall's Tau 0,224 0,354 -0,460
p-value 0,158 0,156 n/a
k. Forecast usage (C1) examined whether companies use future FX rate forecasts
in their foreign exchange exposure management. Further it examined whether
long-term or short-term forecasts were used. 58,1% of companies did not use
any FX rate forecasts and short-term forecasts were two times more commonly
used than long-term forecasts. The results were somewhat mixed with Size and
FX exposure having weak negative correlations and Foreign currencies having a
moderate positive correlation. Kendall’s tau supports the positive connection
between size and forecast usage which does not seem to hold according to the p-
value. The null hypothesis that Size and use of forecasts are independent was not
rejected at 95% confidence level. FX rate forecasts were used in over 50% of
companies in both of the largest size categories 4 and 5 where as less than 35%
of companies in each of the smaller size categories used them. Overall the low
correlations suggest other explanatory factors influence forecast usage and are
thus partially contradictory to expectations. The findings, however, confirm that
63
short-term forecasting is used more often than long-term forecasting as
suggested by findings in earlier studies139. Interestingly Time horizon had a
distinct connection with the use of short- and long-term forecasts. The use of
both short- and long-term forecasts (38,1%) was more popular than use of only
short-term forecasts (23,8%) among companies with Time horizon over six
months. The converse applied to companies with Time horizon less or equal to
six months, where as the use of only short-term forecasts (50,0%) was more
popular than the use of both short- and long-term forecasts (10,0%).
l. Forecast source (C2) showed significant positive correlation between the
explanatory variables and development of internal forecasting capabilities. FX
exposure had a particularly strong correlation with forecast source. The order of
sophistication or forecast sources presumed by the survey was supported by
Kendall’s tau. The p-value, however, didn’t justify rejecting the null hypothesis
that Size and producing forecasts internally are independent at 95% confidence
level140. 58,3% of companies obtained their forecasts from their banks which
made it by far the most popular source. This result was expected based on results
from earlier studies141. 19,4% had developed internal forecasting capabilities.
Notable was, however, that none of the companies used primarily technical
analysis to obtain their forecasts (see Figure 6.6 below).
139 E.g. Hakkarainen, A. et al., 1996 140 Sample size for this variable was too small and likely affected negatively establishing statistical significance. For comparison the null hypothesis was tested by using only two size categories, combining the three smallest categories into one category (representing SMEs) and the two largest into another (representing large companies). The p-value was then recalculated and received the value of 0,0230, thus, rejecting the null hypothesis at a 95% confidence level. 141 E.g. Harju, M. & Martikainen, T., 1997
64
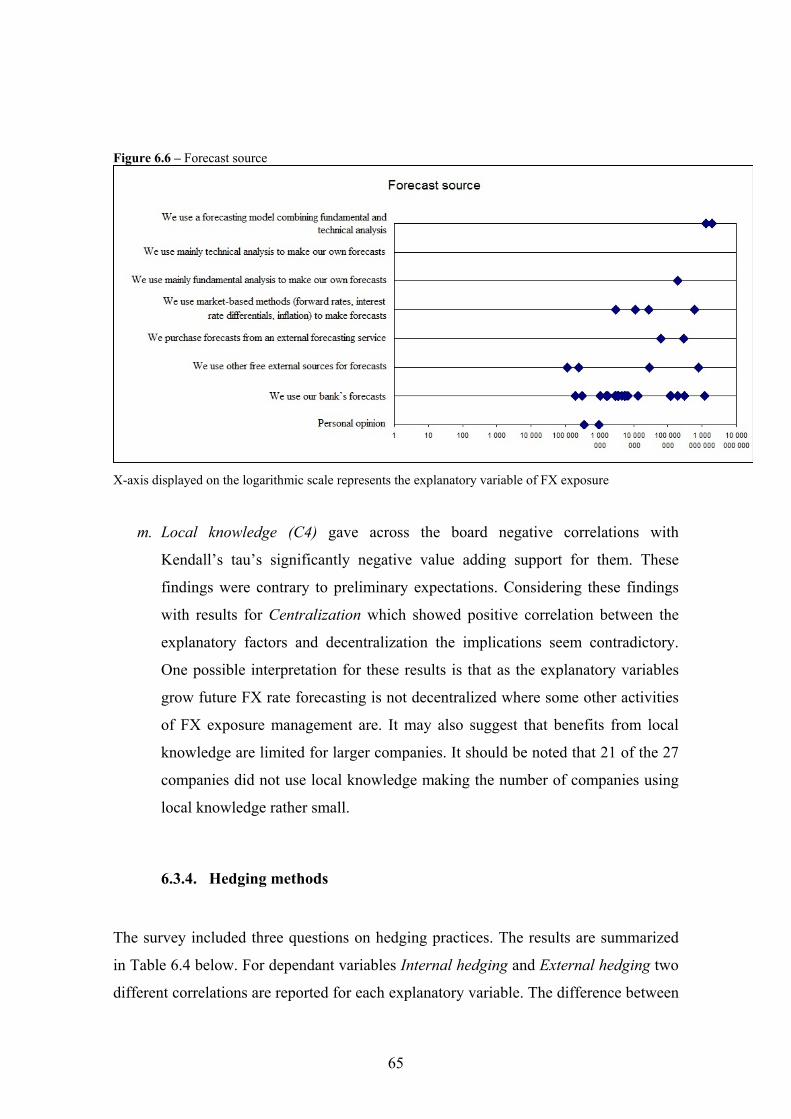
Figure 6.6 – Forecast source
X-axis displayed on the logarithmic scale represents the explanatory variable of FX exposure
m. Local knowledge (C4) gave across the board negative correlations with
Kendall’s tau’s significantly negative value adding support for them. These
findings were contrary to preliminary expectations. Considering these findings
with results for Centralization which showed positive correlation between the
explanatory factors and decentralization the implications seem contradictory.
One possible interpretation for these results is that as the explanatory variables
grow future FX rate forecasting is not decentralized where some other activities
of FX exposure management are. It may also suggest that benefits from local
knowledge are limited for larger companies. It should be noted that 21 of the 27
companies did not use local knowledge making the number of companies using
local knowledge rather small.
6.3.4. Hedging methods
The survey included three questions on hedging practices. The results are summarized
in Table 6.4 below. For dependant variables Internal hedging and External hedging two
different correlations are reported for each explanatory variable. The difference between
65
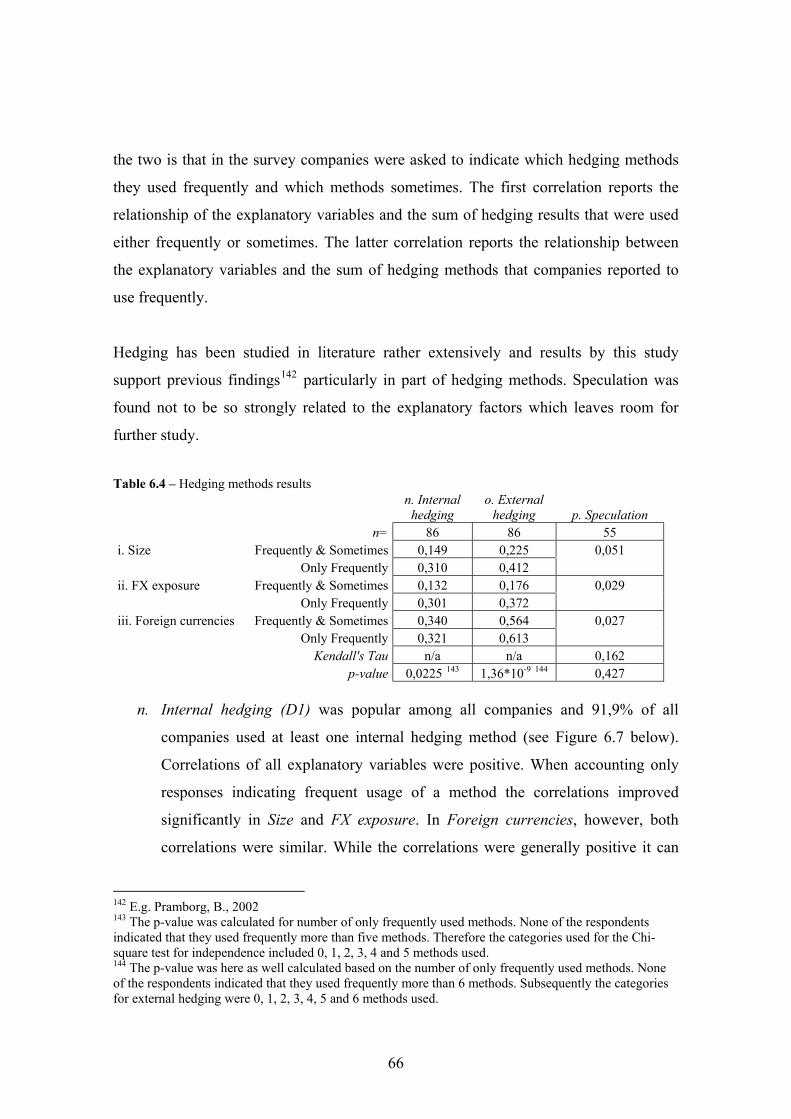
the two is that in the survey companies were asked to indicate which hedging methods
they used frequently and which methods sometimes. The first correlation reports the
relationship of the explanatory variables and the sum of hedging results that were used
either frequently or sometimes. The latter correlation reports the relationship between
the explanatory variables and the sum of hedging methods that companies reported to
use frequently.
Hedging has been studied in literature rather extensively and results by this study
support previous findings142 particularly in part of hedging methods. Speculation was
found not to be so strongly related to the explanatory factors which leaves room for
further study.
Table 6.4 – Hedging methods results
n. Internal hedging
o. External hedging p. Speculation
n= 86 86 55 i. Size Frequently & Sometimes 0,149 0,225 0,051 Only Frequently 0,310 0,412 ii. FX exposure Frequently & Sometimes 0,132 0,176 0,029 Only Frequently 0,301 0,372 iii. Foreign currencies Frequently & Sometimes 0,340 0,564 0,027 Only Frequently 0,321 0,613 Kendall's Tau n/a n/a 0,162 p-value 0,0225 143 1,36*10-9 144 0,427
n. Internal hedging (D1) was popular among all companies and 91,9% of all
companies used at least one internal hedging method (see Figure 6.7 below).
Correlations of all explanatory variables were positive. When accounting only
responses indicating frequent usage of a method the correlations improved
significantly in Size and FX exposure. In Foreign currencies, however, both
correlations were similar. While the correlations were generally positive it can
142 E.g. Pramborg, B., 2002 143 The p-value was calculated for number of only frequently used methods. None of the respondents indicated that they used frequently more than five methods. Therefore the categories used for the Chi-square test for independence included 0, 1, 2, 3, 4 and 5 methods used. 144 The p-value was here as well calculated based on the number of only frequently used methods. None of the respondents indicated that they used frequently more than 6 methods. Subsequently the categories for external hedging were 0, 1, 2, 3, 4, 5 and 6 methods used.
66
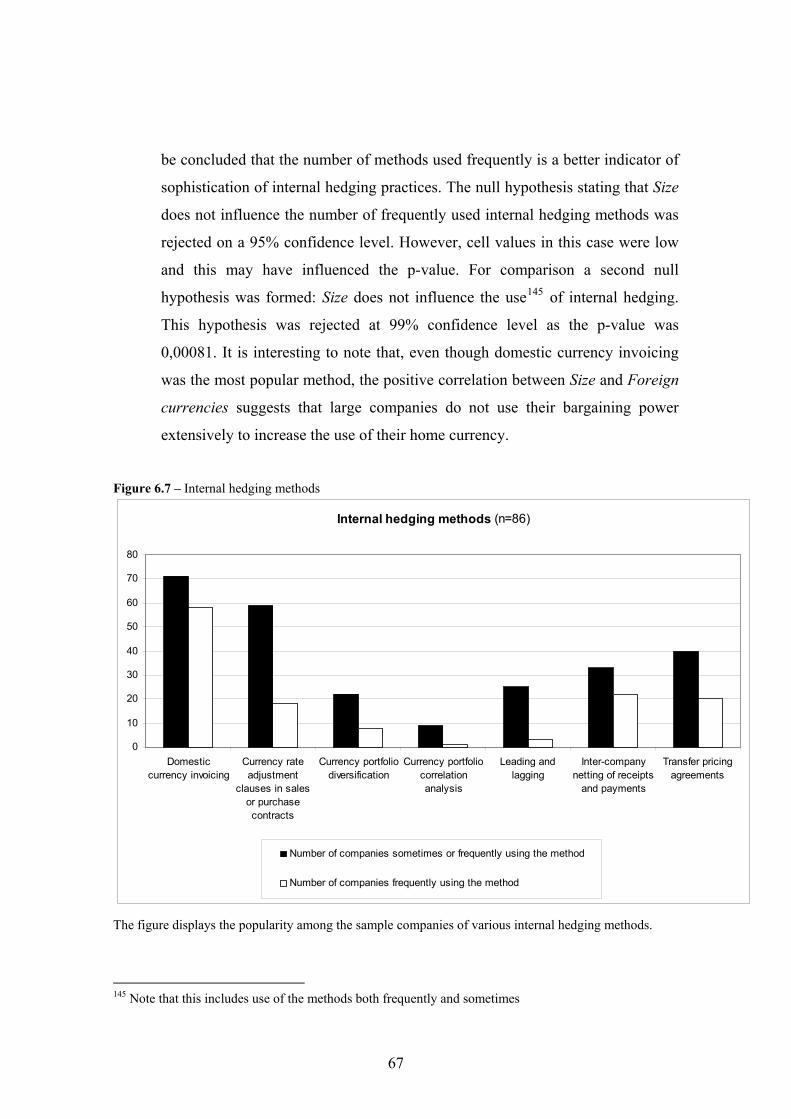
be concluded that the number of methods used frequently is a better indicator of
sophistication of internal hedging practices. The null hypothesis stating that Size
does not influence the number of frequently used internal hedging methods was
rejected on a 95% confidence level. However, cell values in this case were low
and this may have influenced the p-value. For comparison a second null
hypothesis was formed: Size does not influence the use145 of internal hedging.
This hypothesis was rejected at 99% confidence level as the p-value was
0,00081. It is interesting to note that, even though domestic currency invoicing
was the most popular method, the positive correlation between Size and Foreign
currencies suggests that large companies do not use their bargaining power
extensively to increase the use of their home currency.
Figure 6.7 – Internal hedging methods
Internal hedging methods (n=86)
0
10
20
30
40
50
60
70
80
Domesticcurrency invoicing
Currency rateadjustment
clauses in salesor purchasecontracts
Currency portfoliodiversification
Currency portfoliocorrelationanalysis
Leading andlagging
Inter-companynetting of receipts
and payments
Transfer pricingagreements
Number of companies sometimes or frequently using the method
Number of companies frequently using the method
The figure displays the popularity among the sample companies of various internal hedging methods.
145 Note that this includes use of the methods both frequently and sometimes
67
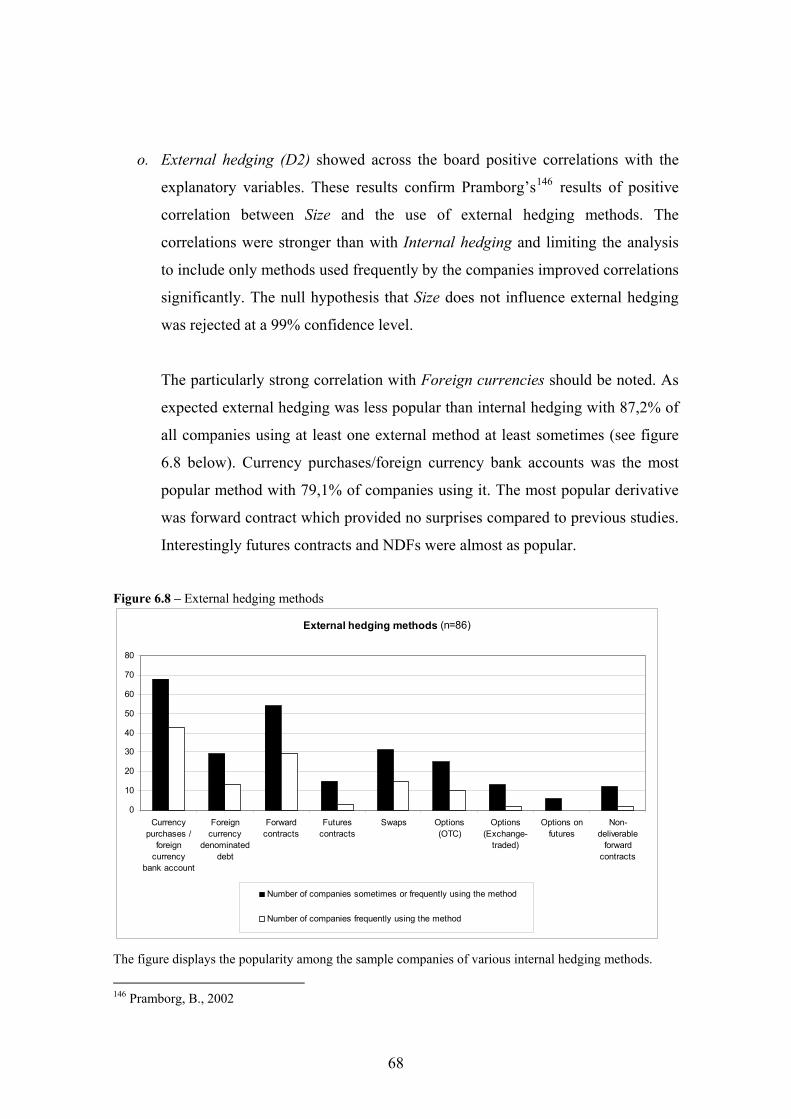
o. External hedging (D2) showed across the board positive correlations with the
explanatory variables. These results confirm Pramborg’s146 results of positive
correlation between Size and the use of external hedging methods. The
correlations were stronger than with Internal hedging and limiting the analysis
to include only methods used frequently by the companies improved correlations
significantly. The null hypothesis that Size does not influence external hedging
was rejected at a 99% confidence level.
The particularly strong correlation with Foreign currencies should be noted. As
expected external hedging was less popular than internal hedging with 87,2% of
all companies using at least one external method at least sometimes (see figure
6.8 below). Currency purchases/foreign currency bank accounts was the most
popular method with 79,1% of companies using it. The most popular derivative
was forward contract which provided no surprises compared to previous studies.
Interestingly futures contracts and NDFs were almost as popular.
Figure 6.8 – External hedging methods
External hedging methods (n=86)
0
10
20
30
40
50
60
70
80
Currencypurchases /
foreigncurrency
bank account
Foreigncurrency
denominateddebt
Forwardcontracts
Futurescontracts
Swaps Options(OTC)
Options(Exchange-
traded)
Options onfutures
Non-deliverable
forwardcontracts
Number of companies sometimes or frequently using the method
Number of companies frequently using the method
The figure displays the popularity among the sample companies of various internal hedging methods. 146 Pramborg, B., 2002
68
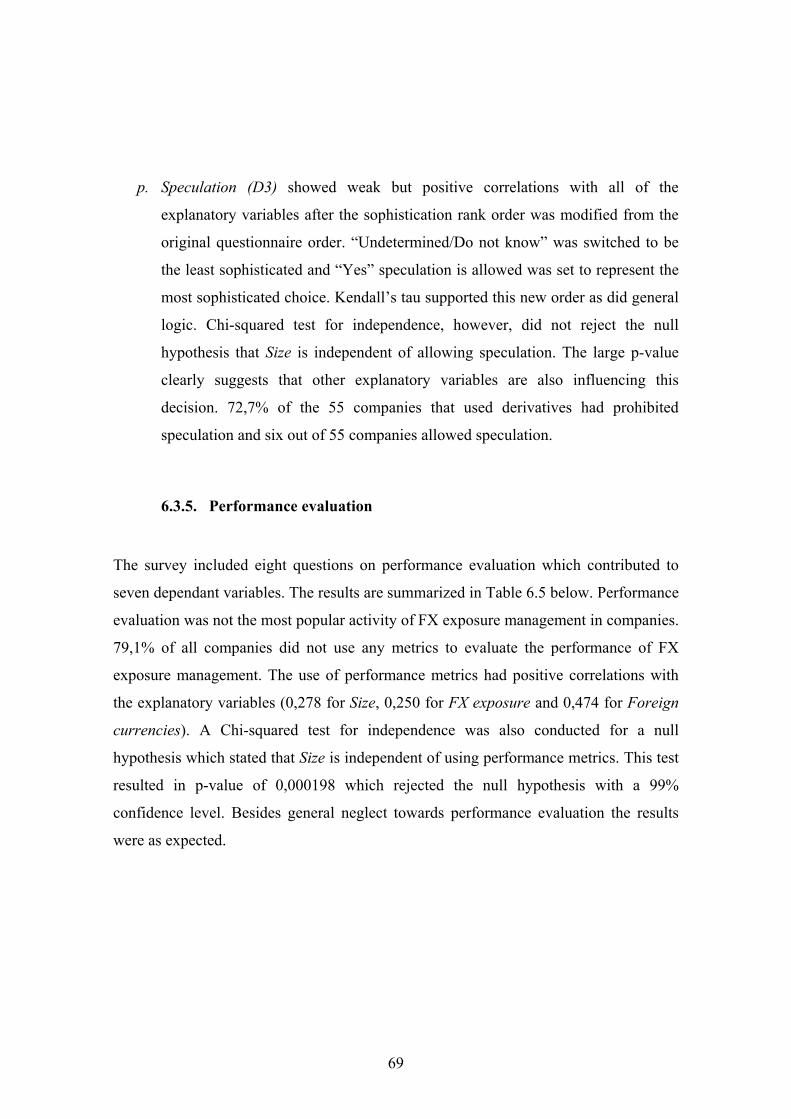
p. Speculation (D3) showed weak but positive correlations with all of the
explanatory variables after the sophistication rank order was modified from the
original questionnaire order. “Undetermined/Do not know” was switched to be
the least sophisticated and “Yes” speculation is allowed was set to represent the
most sophisticated choice. Kendall’s tau supported this new order as did general
logic. Chi-squared test for independence, however, did not reject the null
hypothesis that Size is independent of allowing speculation. The large p-value
clearly suggests that other explanatory variables are also influencing this
decision. 72,7% of the 55 companies that used derivatives had prohibited
speculation and six out of 55 companies allowed speculation.
6.3.5. Performance evaluation
The survey included eight questions on performance evaluation which contributed to
seven dependant variables. The results are summarized in Table 6.5 below. Performance
evaluation was not the most popular activity of FX exposure management in companies.
79,1% of all companies did not use any metrics to evaluate the performance of FX
exposure management. The use of performance metrics had positive correlations with
the explanatory variables (0,278 for Size, 0,250 for FX exposure and 0,474 for Foreign
currencies). A Chi-squared test for independence was also conducted for a null
hypothesis which stated that Size is independent of using performance metrics. This test
resulted in p-value of 0,000198 which rejected the null hypothesis with a 99%
confidence level. Besides general neglect towards performance evaluation the results
were as expected.
69
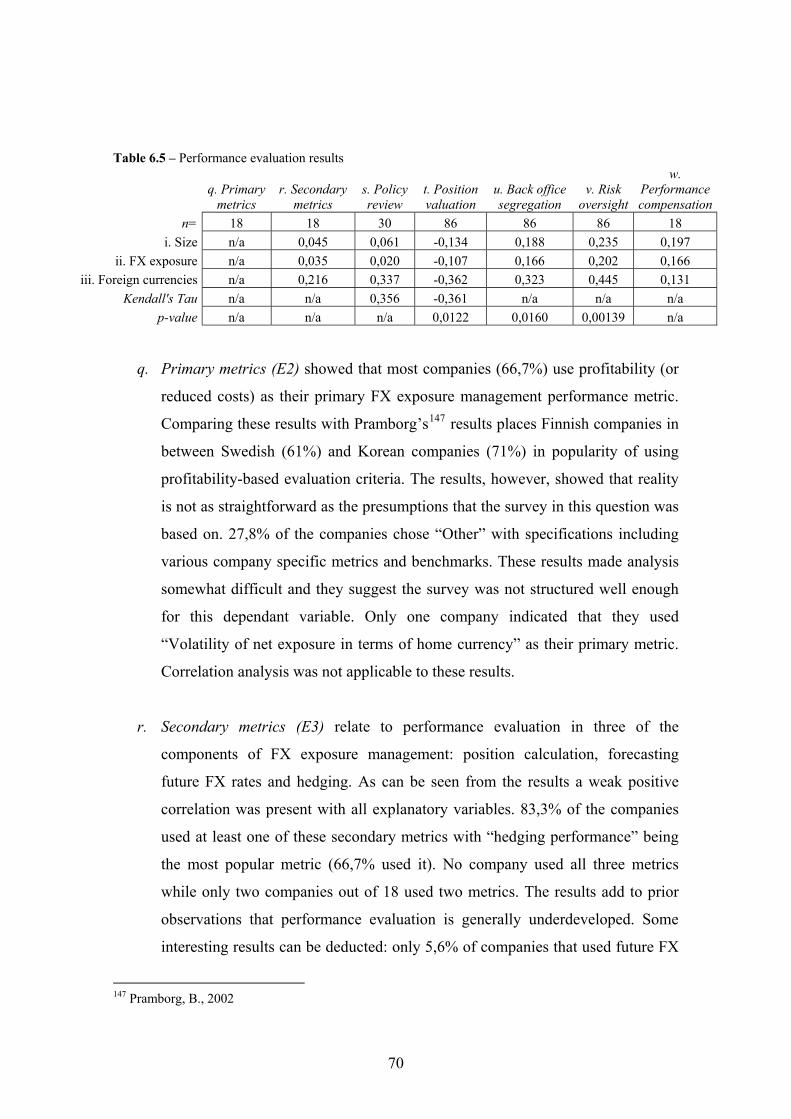
Table 6.5 – Performance evaluation results
q. Primary
metrics r. Secondary
metrics s. Policy review
t. Position valuation
u. Back office segregation
v. Risk oversight
w. Performance compensation
n= 18 18 30 86 86 86 18 i. Size n/a 0,045 0,061 -0,134 0,188 0,235 0,197
ii. FX exposure n/a 0,035 0,020 -0,107 0,166 0,202 0,166 iii. Foreign currencies n/a 0,216 0,337 -0,362 0,323 0,445 0,131
Kendall's Tau n/a n/a 0,356 -0,361 n/a n/a n/a p-value n/a n/a n/a 0,0122 0,0160 0,00139 n/a
q. Primary metrics (E2) showed that most companies (66,7%) use profitability (or
reduced costs) as their primary FX exposure management performance metric.
Comparing these results with Pramborg’s147 results places Finnish companies in
between Swedish (61%) and Korean companies (71%) in popularity of using
profitability-based evaluation criteria. The results, however, showed that reality
is not as straightforward as the presumptions that the survey in this question was
based on. 27,8% of the companies chose “Other” with specifications including
various company specific metrics and benchmarks. These results made analysis
somewhat difficult and they suggest the survey was not structured well enough
for this dependant variable. Only one company indicated that they used
“Volatility of net exposure in terms of home currency” as their primary metric.
Correlation analysis was not applicable to these results.
r. Secondary metrics (E3) relate to performance evaluation in three of the
components of FX exposure management: position calculation, forecasting
future FX rates and hedging. As can be seen from the results a weak positive
correlation was present with all explanatory variables. 83,3% of the companies
used at least one of these secondary metrics with “hedging performance” being
the most popular metric (66,7% used it). No company used all three metrics
while only two companies out of 18 used two metrics. The results add to prior
observations that performance evaluation is generally underdeveloped. Some
interesting results can be deducted: only 5,6% of companies that used future FX
147 Pramborg, B., 2002
70
rate forecasts measured the accuracy of those forecasts and only 15,0% of
companies that include forecasted exposures in their position calculations
account for errors in those forecasts. Neither of the two companies that
purchased their future FX rate forecasts from an external service provider
checked the accuracy of the forecasts they paid for. This finding was in
contradiction with expectations; thought the small sample here limits
generalization dramatically.
s. Policy review (E4) process was conducted in 73,3% of the companies as the
need arises. 16,7% on the other hand had a scheduled review process. Kendall’s
tau value validates the sophistication rank order as presumed by the survey
study. Weak correlations for Size and FX exposure are dominated by one
extreme result. By removing it from the analysis the correlations are respectfully
0,529 and 0,527 and the nature of correlation can be seen more clearly. Over all
the results are much as expected.
t. Position valuation (E5) showed negative correlations for all explanatory
variables. Kendall’s tau gave extra support for confirming a negative
relationship between Size and the rank order of sophistication for this variable.
The null hypothesis that Size does not influence position valuation was rejected
at 95% confidence level. Cell count, however, was partially low and the p-value
may have been affected by this. With little further analysis it was possible to
improve the results significantly. Firstly all results from the last category of “No
schedule / Not applicable” were excluded. Secondly because yet again a single
extreme value had a large effect on the correlations it was excluded. After these
restrictions correlations were -0,405 for Size, -0,465 for FX exposure and -0,239
for Foreign currencies. 32,6% of all companies marked-to-market their
positions monthly and 48,8% at least monthly. 33,7% selected “No schedule /
Not applicable” (see Figure 6.9 below).
71
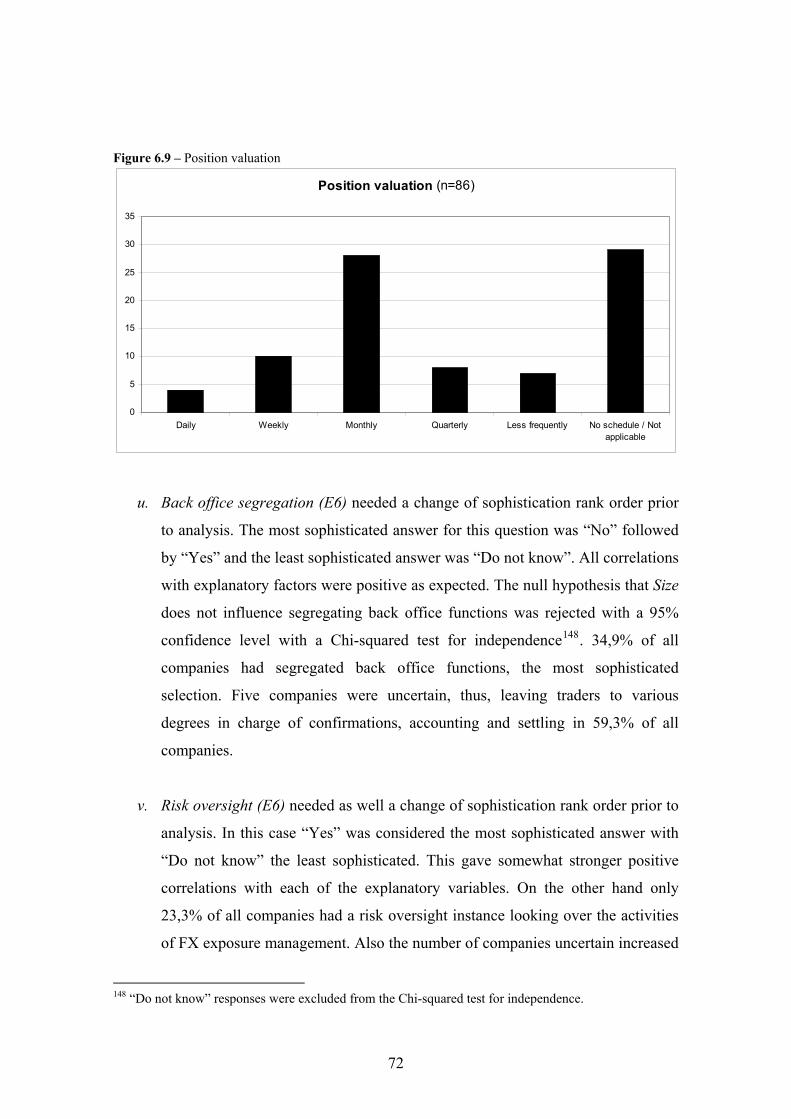
Figure 6.9 – Position valuation
Position valuation (n=86)
0
5
10
15
20
25
30
35
Daily Weekly Monthly Quarterly Less frequently No schedule / Notapplicable
u. Back office segregation (E6) needed a change of sophistication rank order prior
to analysis. The most sophisticated answer for this question was “No” followed
by “Yes” and the least sophisticated answer was “Do not know”. All correlations
with explanatory factors were positive as expected. The null hypothesis that Size
does not influence segregating back office functions was rejected with a 95%
confidence level with a Chi-squared test for independence148. 34,9% of all
companies had segregated back office functions, the most sophisticated
selection. Five companies were uncertain, thus, leaving traders to various
degrees in charge of confirmations, accounting and settling in 59,3% of all
companies.
v. Risk oversight (E6) needed as well a change of sophistication rank order prior to
analysis. In this case “Yes” was considered the most sophisticated answer with
“Do not know” the least sophisticated. This gave somewhat stronger positive
correlations with each of the explanatory variables. On the other hand only
23,3% of all companies had a risk oversight instance looking over the activities
of FX exposure management. Also the number of companies uncertain increased
148 “Do not know” responses were excluded from the Chi-squared test for independence.
72
to eight companies compared with Back office segregation. This clearly meant
that risk oversight committees and compliance functions were less common than
Back office segregation. On the other hand the p-value for the null hypothesis
that Size does not influence having risk oversight was smaller, thus, rejecting the
null hypothesis at a higher 99% confidence level149.
13 companies of 86 had both Back office segregation and Risk oversight in good
order. The theory was also confirmed that companies which allowed speculation
were more likely to have better risk oversight and back office segregation. This
was shown by a 0,336 correlation between Speculation and the combined
variables of Back office segregation and Risk oversight.
w. Performance compensation (E7 & E8) results were combined from the two last
questions of the survey to form four different combinations (in order of
sophistication):
1) I do not know whether individuals in FX exposure management are
compensated based on performance
2) Individuals are not compensated based on performance in FX exposure
management
3) Yes individuals in FX exposure management are compensated based on
performance, however, performance measures are not related to FX
exposure management metrics
4) Yes individuals in FX exposure management are compensated based on
performance of FX exposure management performance metrics
Correlations were positive with all explanatory variables. Half of the companies
(n=18) used performance based compensation for employees working with FX
exposure management. Only two companies, however, based performance
compensation on FX exposure management performance metrics. This was 149 “Do not know” responses were excluded from the Chi-squared test for independence.
73
perhaps not a surprise considering that only 20,9% of all companies measured
FX exposure management performance by some measure. These findings are
complemented by the fact that all companies that used performance
compensation of FX exposure management employees belonged in the two
largest size categories.
7 A Tool for evaluating FX exposure management practices
This part addresses the last research question set out for this study: How could FX
exposure management practices of different companies be compared? This study has
described how FX exposure management in companies can be divided into five distinct
components and they can further be individually assessed. The benefit of evaluating one
component at a time is that it simplifies comparison across companies.
Compartmentalizing the results also helps identifying the strengths and weaknesses of
the prevailing management practices in individual companies. Being able to spot the
components requiring attention more easily enables issues to be addressed faster. In
order to get comparable results a scoring model is needed for enumerating the results of
the survey.
The author’s suggested scoring model based on the survey will now be described. The
model uses responses to the survey’s questions to form a numeric approximation of
sophistication for each FX exposure management component. The suggested model
gives a benchmarking tool for companies which can be used for self assessment. A
number of benchmarks are also provided based on the survey conducted for this study.
As any scoring model it is not perfect but an approximation and the results should not
be held as scientific truths. However, the practical applications of the model are
believed to outweigh its shortcomings in accuracy.
74
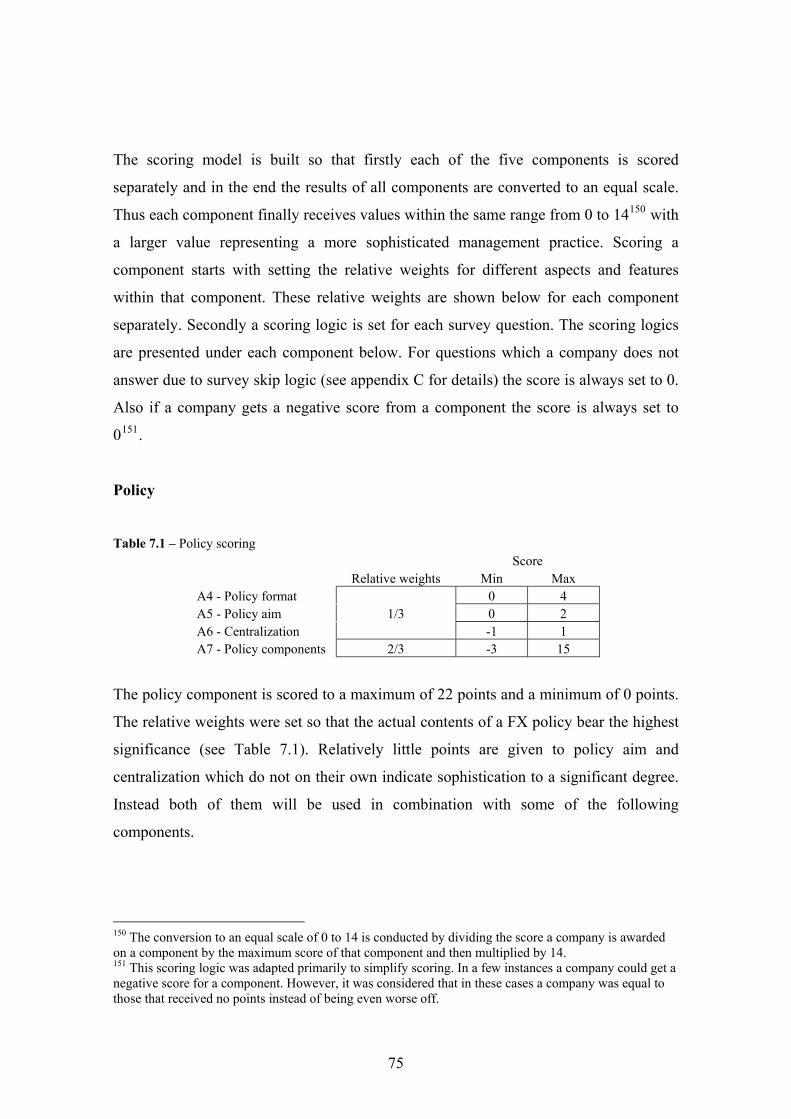
The scoring model is built so that firstly each of the five components is scored
separately and in the end the results of all components are converted to an equal scale.
Thus each component finally receives values within the same range from 0 to 14150 with
a larger value representing a more sophisticated management practice. Scoring a
component starts with setting the relative weights for different aspects and features
within that component. These relative weights are shown below for each component
separately. Secondly a scoring logic is set for each survey question. The scoring logics
are presented under each component below. For questions which a company does not
answer due to survey skip logic (see appendix C for details) the score is always set to 0.
Also if a company gets a negative score from a component the score is always set to
0151.
Policy
Table 7.1 – Policy scoring
Score Relative weights Min Max A4 - Policy format 0 4 A5 - Policy aim 1/3 0 2 A6 - Centralization -1 1 A7 - Policy components 2/3 -3 15
The policy component is scored to a maximum of 22 points and a minimum of 0 points.
The relative weights were set so that the actual contents of a FX policy bear the highest
significance (see Table 7.1). Relatively little points are given to policy aim and
centralization which do not on their own indicate sophistication to a significant degree.
Instead both of them will be used in combination with some of the following
components.
150 The conversion to an equal scale of 0 to 14 is conducted by dividing the score a company is awarded on a component by the maximum score of that component and then multiplied by 14. 151 This scoring logic was adapted primarily to simplify scoring. In a few instances a company could get a negative score for a component. However, it was considered that in these cases a company was equal to those that received no points instead of being even worse off.
75
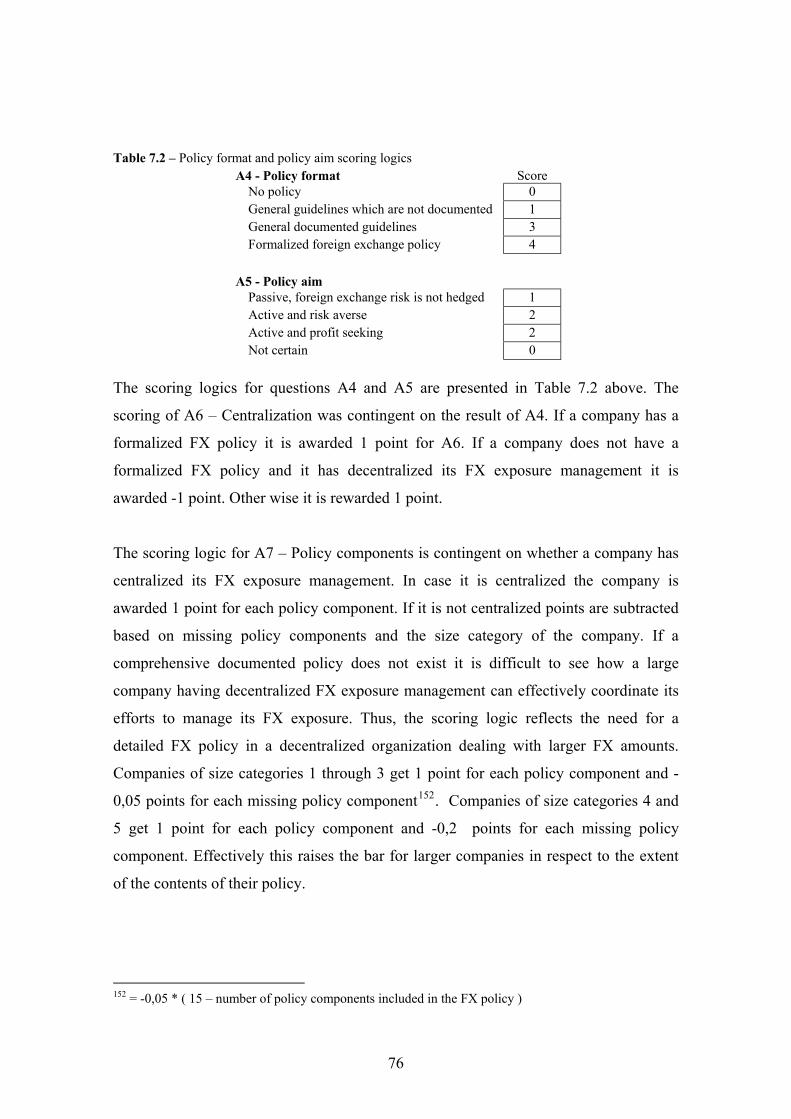
Table 7.2 – Policy format and policy aim scoring logics A4 - Policy format Score No policy 0 General guidelines which are not documented 1 General documented guidelines 3 Formalized foreign exchange policy 4 A5 - Policy aim Passive, foreign exchange risk is not hedged 1 Active and risk averse 2 Active and profit seeking 2 Not certain 0
The scoring logics for questions A4 and A5 are presented in Table 7.2 above. The
scoring of A6 – Centralization was contingent on the result of A4. If a company has a
formalized FX policy it is awarded 1 point for A6. If a company does not have a
formalized FX policy and it has decentralized its FX exposure management it is
awarded -1 point. Other wise it is rewarded 1 point.
The scoring logic for A7 – Policy components is contingent on whether a company has
centralized its FX exposure management. In case it is centralized the company is
awarded 1 point for each policy component. If it is not centralized points are subtracted
based on missing policy components and the size category of the company. If a
comprehensive documented policy does not exist it is difficult to see how a large
company having decentralized FX exposure management can effectively coordinate its
efforts to manage its FX exposure. Thus, the scoring logic reflects the need for a
detailed FX policy in a decentralized organization dealing with larger FX amounts.
Companies of size categories 1 through 3 get 1 point for each policy component and -
0,05 points for each missing policy component152. Companies of size categories 4 and
5 get 1 point for each policy component and -0,2 points for each missing policy
component. Effectively this raises the bar for larger companies in respect to the extent
of the contents of their policy.
152 = -0,05 * ( 15 – number of policy components included in the FX policy )
76
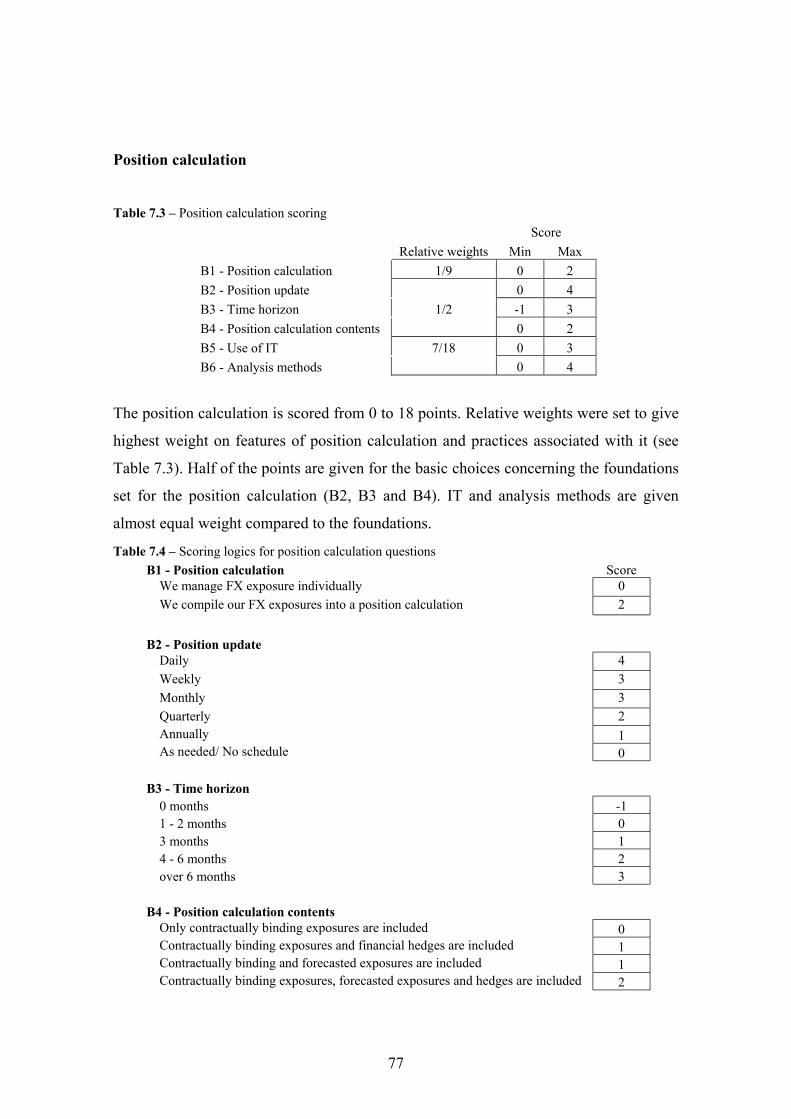
Position calculation
Table 7.3 – Position calculation scoring
Score Relative weights Min Max B1 - Position calculation 1/9 0 2 B2 - Position update 0 4 B3 - Time horizon 1/2 -1 3 B4 - Position calculation contents 0 2 B5 - Use of IT 7/18 0 3 B6 - Analysis methods 0 4
The position calculation is scored from 0 to 18 points. Relative weights were set to give
highest weight on features of position calculation and practices associated with it (see
Table 7.3). Half of the points are given for the basic choices concerning the foundations
set for the position calculation (B2, B3 and B4). IT and analysis methods are given
almost equal weight compared to the foundations.
Table 7.4 – Scoring logics for position calculation questions B1 - Position calculation Score We manage FX exposure individually 0 We compile our FX exposures into a position calculation 2 B2 - Position update Daily 4 Weekly 3 Monthly 3 Quarterly 2 Annually 1 As needed/ No schedule 0 B3 - Time horizon 0 months -1 1 - 2 months 0 3 months 1 4 - 6 months 2 over 6 months 3 B4 - Position calculation contents Only contractually binding exposures are included 0 Contractually binding exposures and financial hedges are included 1 Contractually binding and forecasted exposures are included 1 Contractually binding exposures, forecasted exposures and hedges are included 2
77
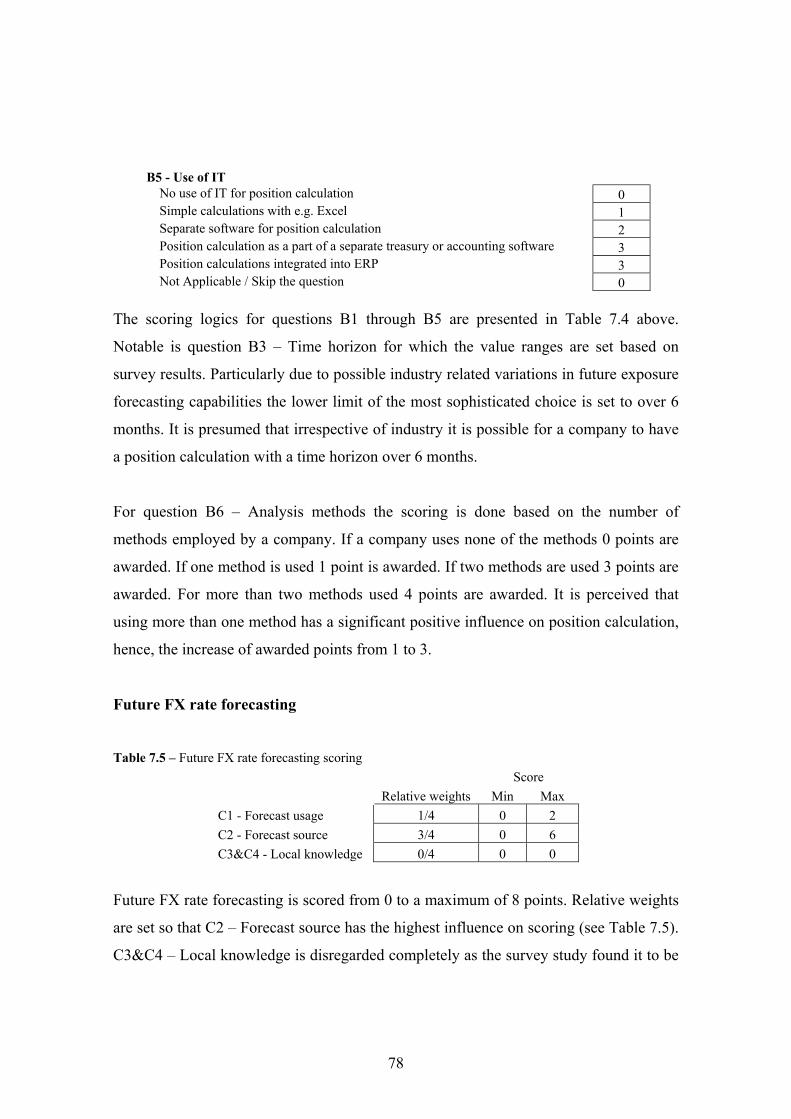
B5 - Use of IT No use of IT for position calculation 0 Simple calculations with e.g. Excel 1 Separate software for position calculation 2 Position calculation as a part of a separate treasury or accounting software 3 Position calculations integrated into ERP 3 Not Applicable / Skip the question 0
The scoring logics for questions B1 through B5 are presented in Table 7.4 above.
Notable is question B3 – Time horizon for which the value ranges are set based on
survey results. Particularly due to possible industry related variations in future exposure
forecasting capabilities the lower limit of the most sophisticated choice is set to over 6
months. It is presumed that irrespective of industry it is possible for a company to have
a position calculation with a time horizon over 6 months.
For question B6 – Analysis methods the scoring is done based on the number of
methods employed by a company. If a company uses none of the methods 0 points are
awarded. If one method is used 1 point is awarded. If two methods are used 3 points are
awarded. For more than two methods used 4 points are awarded. It is perceived that
using more than one method has a significant positive influence on position calculation,
hence, the increase of awarded points from 1 to 3.
Future FX rate forecasting
Table 7.5 – Future FX rate forecasting scoring
Score Relative weights Min Max C1 - Forecast usage 1/4 0 2 C2 - Forecast source 3/4 0 6 C3&C4 - Local knowledge 0/4 0 0
Future FX rate forecasting is scored from 0 to a maximum of 8 points. Relative weights
are set so that C2 – Forecast source has the highest influence on scoring (see Table 7.5).
C3&C4 – Local knowledge is disregarded completely as the survey study found it to be
78
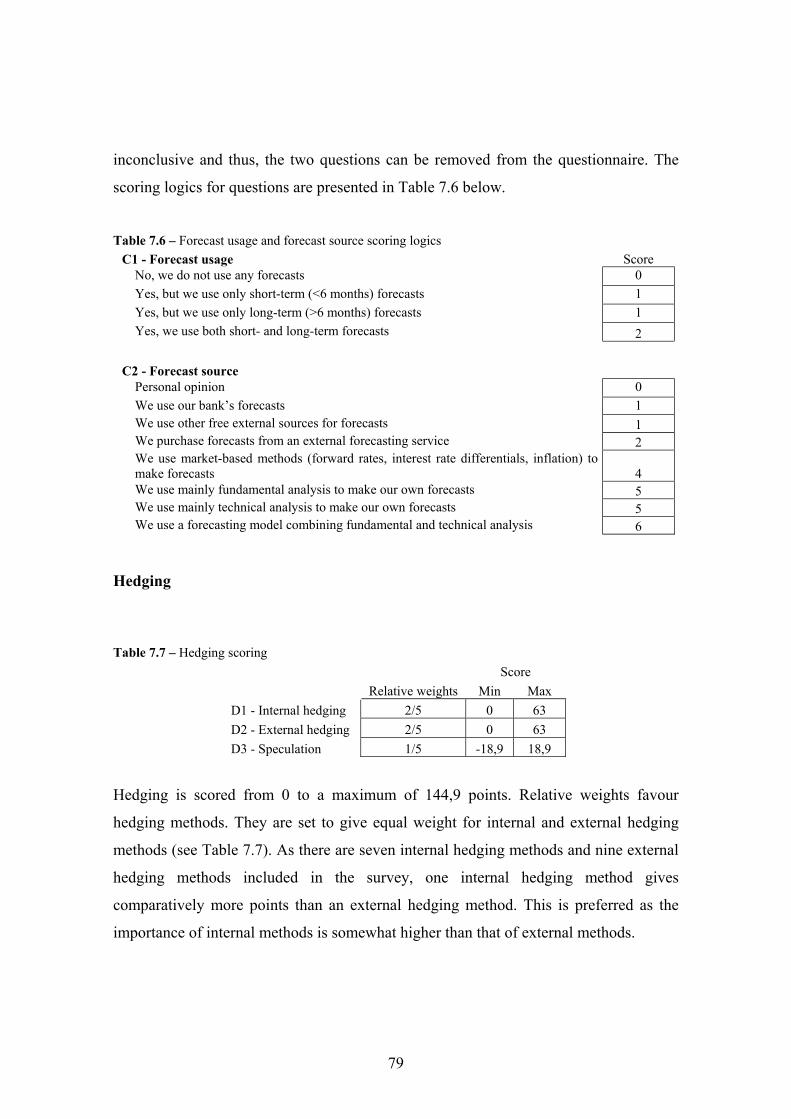
inconclusive and thus, the two questions can be removed from the questionnaire. The
scoring logics for questions are presented in Table 7.6 below.
Table 7.6 – Forecast usage and forecast source scoring logics
C1 - Forecast usage Score No, we do not use any forecasts 0 Yes, but we use only short-term (<6 months) forecasts 1 Yes, but we use only long-term (>6 months) forecasts 1 Yes, we use both short- and long-term forecasts 2 C2 - Forecast source Personal opinion 0 We use our bank’s forecasts 1 We use other free external sources for forecasts 1 We purchase forecasts from an external forecasting service 2
We use market-based methods (forward rates, interest rate differentials, inflation) to make forecasts 4
We use mainly fundamental analysis to make our own forecasts 5 We use mainly technical analysis to make our own forecasts 5 We use a forecasting model combining fundamental and technical analysis 6
Hedging
Table 7.7 – Hedging scoring Score Relative weights Min Max D1 - Internal hedging 2/5 0 63 D2 - External hedging 2/5 0 63 D3 - Speculation 1/5 -18,9 18,9
Hedging is scored from 0 to a maximum of 144,9 points. Relative weights favour
hedging methods. They are set to give equal weight for internal and external hedging
methods (see Table 7.7). As there are seven internal hedging methods and nine external
hedging methods included in the survey, one internal hedging method gives
comparatively more points than an external hedging method. This is preferred as the
importance of internal methods is somewhat higher than that of external methods.
79
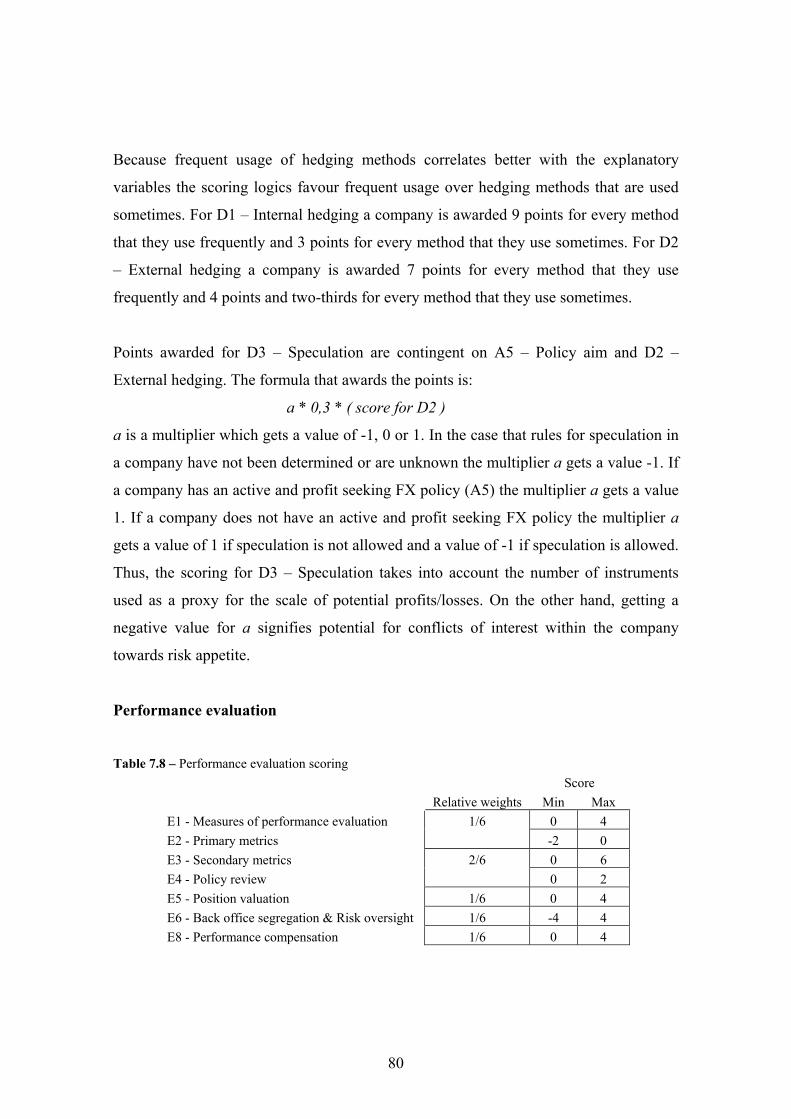
Because frequent usage of hedging methods correlates better with the explanatory
variables the scoring logics favour frequent usage over hedging methods that are used
sometimes. For D1 – Internal hedging a company is awarded 9 points for every method
that they use frequently and 3 points for every method that they use sometimes. For D2
– External hedging a company is awarded 7 points for every method that they use
frequently and 4 points and two-thirds for every method that they use sometimes.
Points awarded for D3 – Speculation are contingent on A5 – Policy aim and D2 –
External hedging. The formula that awards the points is:
a * 0,3 * ( score for D2 )
a is a multiplier which gets a value of -1, 0 or 1. In the case that rules for speculation in
a company have not been determined or are unknown the multiplier a gets a value -1. If
a company has an active and profit seeking FX policy (A5) the multiplier a gets a value
1. If a company does not have an active and profit seeking FX policy the multiplier a
gets a value of 1 if speculation is not allowed and a value of -1 if speculation is allowed.
Thus, the scoring for D3 – Speculation takes into account the number of instruments
used as a proxy for the scale of potential profits/losses. On the other hand, getting a
negative value for a signifies potential for conflicts of interest within the company
towards risk appetite.
Performance evaluation
Table 7.8 – Performance evaluation scoring
Score Relative weights Min Max E1 - Measures of performance evaluation 1/6 0 4 E2 - Primary metrics -2 0 E3 - Secondary metrics 2/6 0 6 E4 - Policy review 0 2 E5 - Position valuation 1/6 0 4 E6 - Back office segregation & Risk oversight 1/6 -4 4 E8 - Performance compensation 1/6 0 4
80
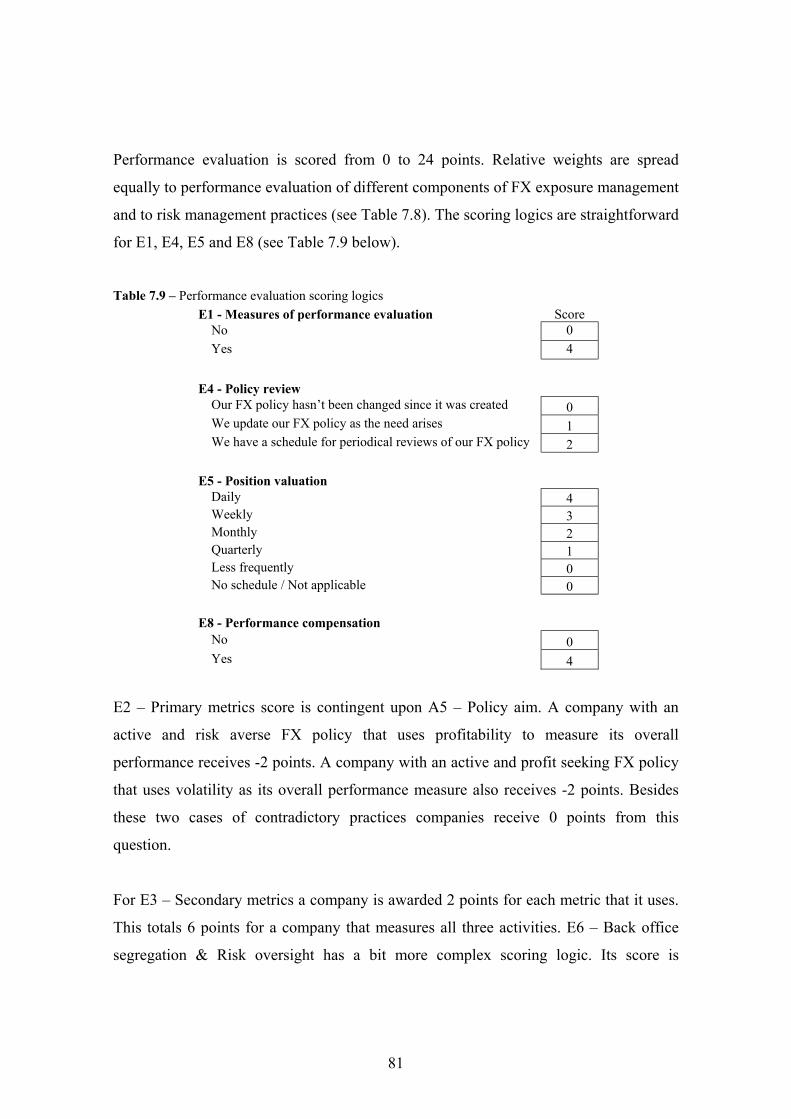
Performance evaluation is scored from 0 to 24 points. Relative weights are spread
equally to performance evaluation of different components of FX exposure management
and to risk management practices (see Table 7.8). The scoring logics are straightforward
for E1, E4, E5 and E8 (see Table 7.9 below).
Table 7.9 – Performance evaluation scoring logics
E1 - Measures of performance evaluation Score No 0 Yes 4 E4 - Policy review Our FX policy hasn’t been changed since it was created 0 We update our FX policy as the need arises 1 We have a schedule for periodical reviews of our FX policy 2 E5 - Position valuation Daily 4 Weekly 3 Monthly 2 Quarterly 1 Less frequently 0 No schedule / Not applicable 0 E8 - Performance compensation No 0 Yes 4
E2 – Primary metrics score is contingent upon A5 – Policy aim. A company with an
active and risk averse FX policy that uses profitability to measure its overall
performance receives -2 points. A company with an active and profit seeking FX policy
that uses volatility as its overall performance measure also receives -2 points. Besides
these two cases of contradictory practices companies receive 0 points from this
question.
For E3 – Secondary metrics a company is awarded 2 points for each metric that it uses.
This totals 6 points for a company that measures all three activities. E6 – Back office
segregation & Risk oversight has a bit more complex scoring logic. Its score is
81
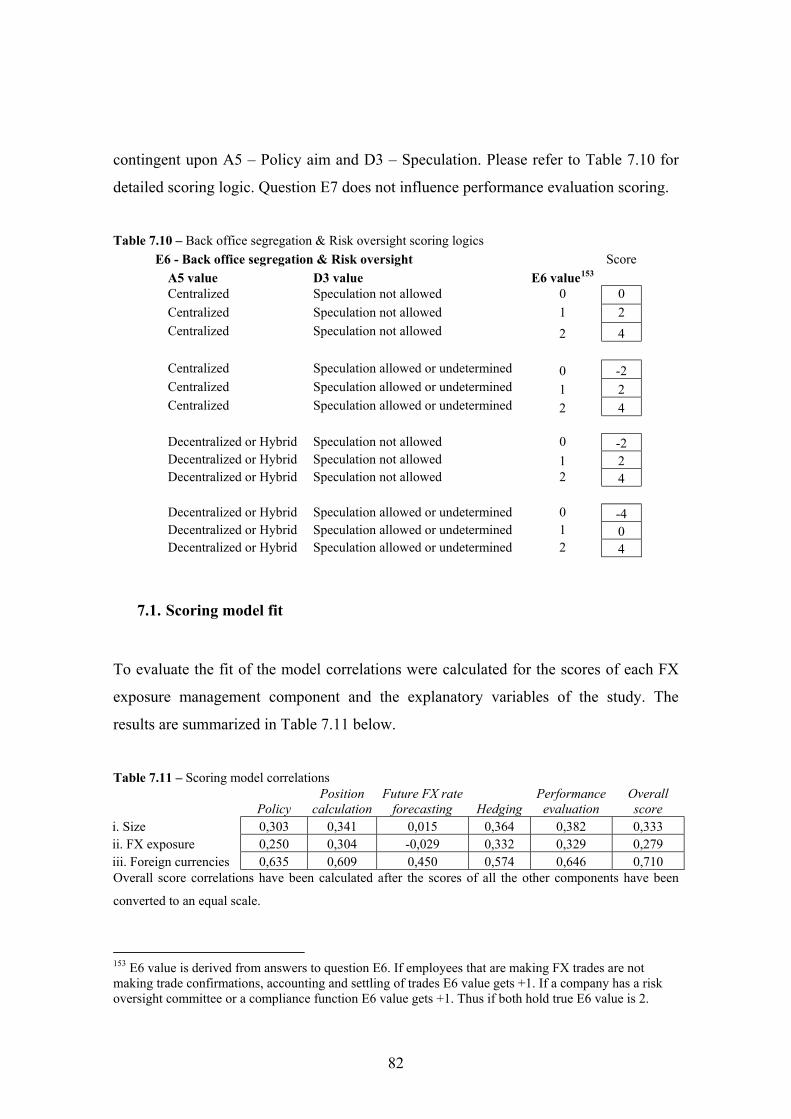
contingent upon A5 – Policy aim and D3 – Speculation. Please refer to Table 7.10 for
detailed scoring logic. Question E7 does not influence performance evaluation scoring.
Table 7.10 – Back office segregation & Risk oversight scoring logics
E6 - Back office segregation & Risk oversight Score A5 value D3 value E6 value153 Centralized Speculation not allowed 0 0 Centralized Speculation not allowed 1 2 Centralized Speculation not allowed 2 4 Centralized Speculation allowed or undetermined 0 -2 Centralized Speculation allowed or undetermined 1 2 Centralized Speculation allowed or undetermined 2 4 Decentralized or Hybrid Speculation not allowed 0 -2 Decentralized or Hybrid Speculation not allowed 1 2 Decentralized or Hybrid Speculation not allowed 2 4 Decentralized or Hybrid Speculation allowed or undetermined 0 -4 Decentralized or Hybrid Speculation allowed or undetermined 1 0 Decentralized or Hybrid Speculation allowed or undetermined 2 4
7.1. Scoring model fit
To evaluate the fit of the model correlations were calculated for the scores of each FX
exposure management component and the explanatory variables of the study. The
results are summarized in Table 7.11 below.
Table 7.11 – Scoring model correlations
Policy Position
calculationFuture FX rate
forecasting Hedging Performance evaluation
Overall score
i. Size 0,303 0,341 0,015 0,364 0,382 0,333 ii. FX exposure 0,250 0,304 -0,029 0,332 0,329 0,279 iii. Foreign currencies 0,635 0,609 0,450 0,574 0,646 0,710 Overall score correlations have been calculated after the scores of all the other components have been
converted to an equal scale.
153 E6 value is derived from answers to question E6. If employees that are making FX trades are not making trade confirmations, accounting and settling of trades E6 value gets +1. If a company has a risk oversight committee or a compliance function E6 value gets +1. Thus if both hold true E6 value is 2.
82
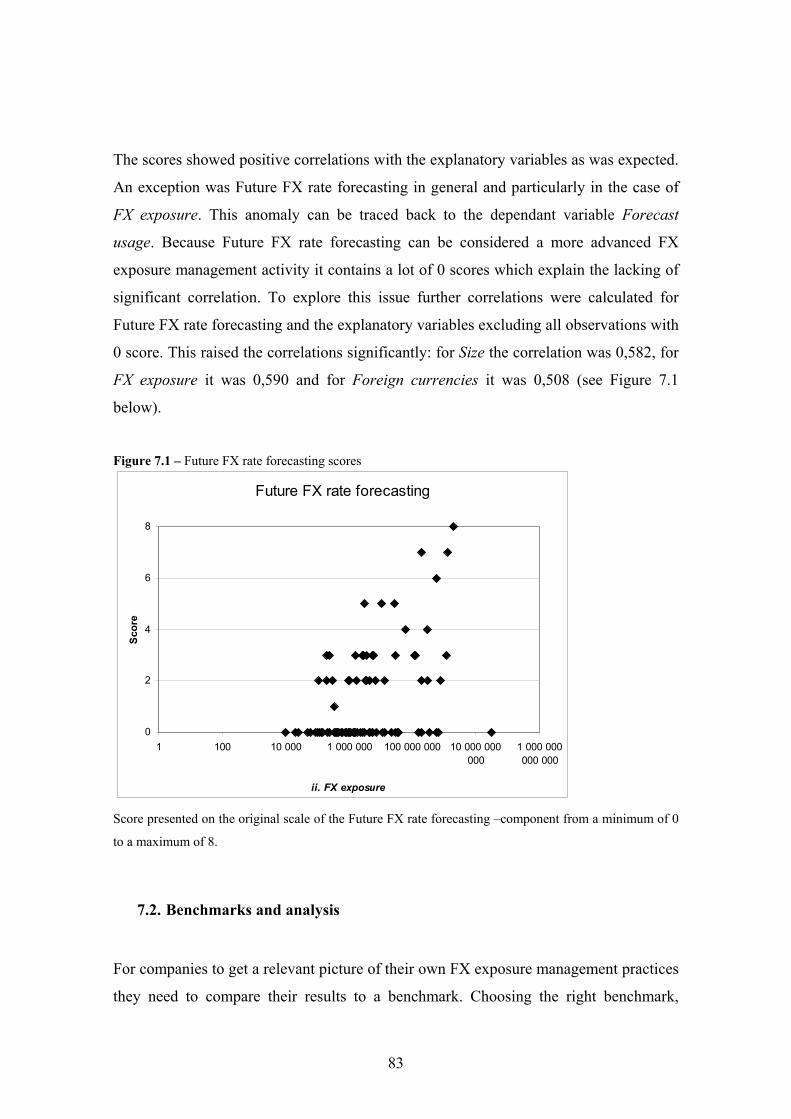
The scores showed positive correlations with the explanatory variables as was expected.
An exception was Future FX rate forecasting in general and particularly in the case of
FX exposure. This anomaly can be traced back to the dependant variable Forecast
usage. Because Future FX rate forecasting can be considered a more advanced FX
exposure management activity it contains a lot of 0 scores which explain the lacking of
significant correlation. To explore this issue further correlations were calculated for
Future FX rate forecasting and the explanatory variables excluding all observations with
0 score. This raised the correlations significantly: for Size the correlation was 0,582, for
FX exposure it was 0,590 and for Foreign currencies it was 0,508 (see Figure 7.1
below).
Figure 7.1 – Future FX rate forecasting scores
Future FX rate forecasting
0
2
4
6
8
1 100 10 000 1 000 000 100 000 000 10 000 000000
1 000 000000 000
ii. FX exposure
Scor
e
Score presented on the original scale of the Future FX rate forecasting –component from a minimum of 0
to a maximum of 8.
7.2. Benchmarks and analysis
For companies to get a relevant picture of their own FX exposure management practices
they need to compare their results to a benchmark. Choosing the right benchmark,
83
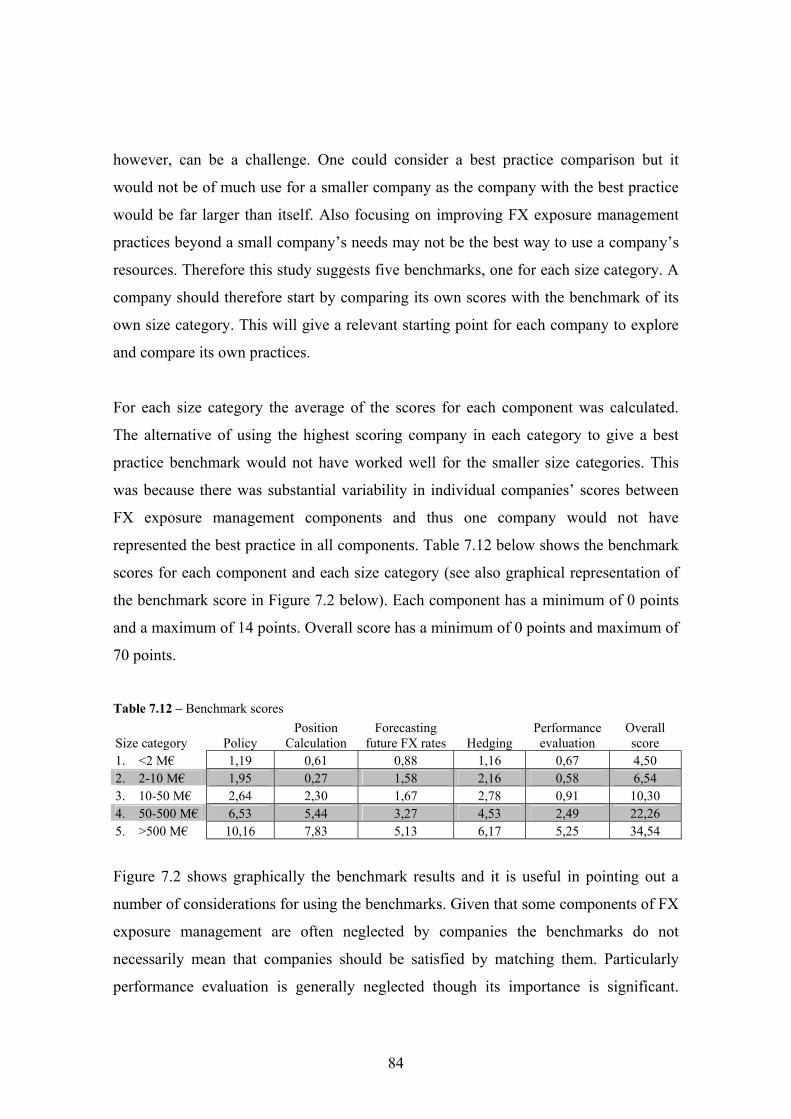
however, can be a challenge. One could consider a best practice comparison but it
would not be of much use for a smaller company as the company with the best practice
would be far larger than itself. Also focusing on improving FX exposure management
practices beyond a small company’s needs may not be the best way to use a company’s
resources. Therefore this study suggests five benchmarks, one for each size category. A
company should therefore start by comparing its own scores with the benchmark of its
own size category. This will give a relevant starting point for each company to explore
and compare its own practices.
For each size category the average of the scores for each component was calculated.
The alternative of using the highest scoring company in each category to give a best
practice benchmark would not have worked well for the smaller size categories. This
was because there was substantial variability in individual companies’ scores between
FX exposure management components and thus one company would not have
represented the best practice in all components. Table 7.12 below shows the benchmark
scores for each component and each size category (see also graphical representation of
the benchmark score in Figure 7.2 below). Each component has a minimum of 0 points
and a maximum of 14 points. Overall score has a minimum of 0 points and maximum of
70 points.
Table 7.12 – Benchmark scores
Size category Policy Position
Calculation Forecasting
future FX rates Hedging Performance evaluation
Overall score
1. <2 M€ 1,19 0,61 0,88 1,16 0,67 4,50 2. 2-10 M€ 1,95 0,27 1,58 2,16 0,58 6,54 3. 10-50 M€ 2,64 2,30 1,67 2,78 0,91 10,30 4. 50-500 M€ 6,53 5,44 3,27 4,53 2,49 22,26 5. >500 M€ 10,16 7,83 5,13 6,17 5,25 34,54
Figure 7.2 shows graphically the benchmark results and it is useful in pointing out a
number of considerations for using the benchmarks. Given that some components of FX
exposure management are often neglected by companies the benchmarks do not
necessarily mean that companies should be satisfied by matching them. Particularly
performance evaluation is generally neglected though its importance is significant.
84
Secondly when interpreting the scoring of the hedging component one should keep in
mind that to a great extent it is a sum of the number of hedging methods a company
employs. Using more methods does not always mean a company will be more
successful in hedging. Thus in the case of hedging score, and to a large degree contrary
to the other scores, a company should perhaps refrain from striving for the full 14
points. None the less having a high hedging score can be interpreted to mean that a
company has highly sophisticated FX exposure management practices, though not
because it uses many methods but instead because it is capable of using many methods.
Capability often means flexibility which in turn may lead to better performance.
In any case a simple numerical comparison of a company’s scores with a benchmark
should be considered only the first step. Attention should be paid to components in
which scores are below those of the benchmark. Also components in which a company
receives lower scores than its other components should be taken under further analysis
but this does not always indicate an imbalance as pointed out earlier. For these purposes
a graphical representation (see Figure 7.2) of the company’s score can be useful. After
identifying the FX exposure management components which most likely require
improvement efforts it is time to see one at a time how the low score was formed. When
analysing the low scores it is important to check if any negative points were awarded.
They often represent significant short coming or inconsistencies in a company’s FX
exposure management practices.
When trying to improve the score of a component one should see which choices award
the highest points. Better yet a cost reward calculation of implementing an improvement
should be done so that the most cost effective improvements are given priority in
implementation. Some improvement choices have prerequisites as discussed in this
study but the survey skip logic (see appendix C) can be a useful source of information
for reminding of them. Some other improvement choices may not suitable for a given
company. It is therefore important to consider the organizational fit of any improvement
before implementation.
85
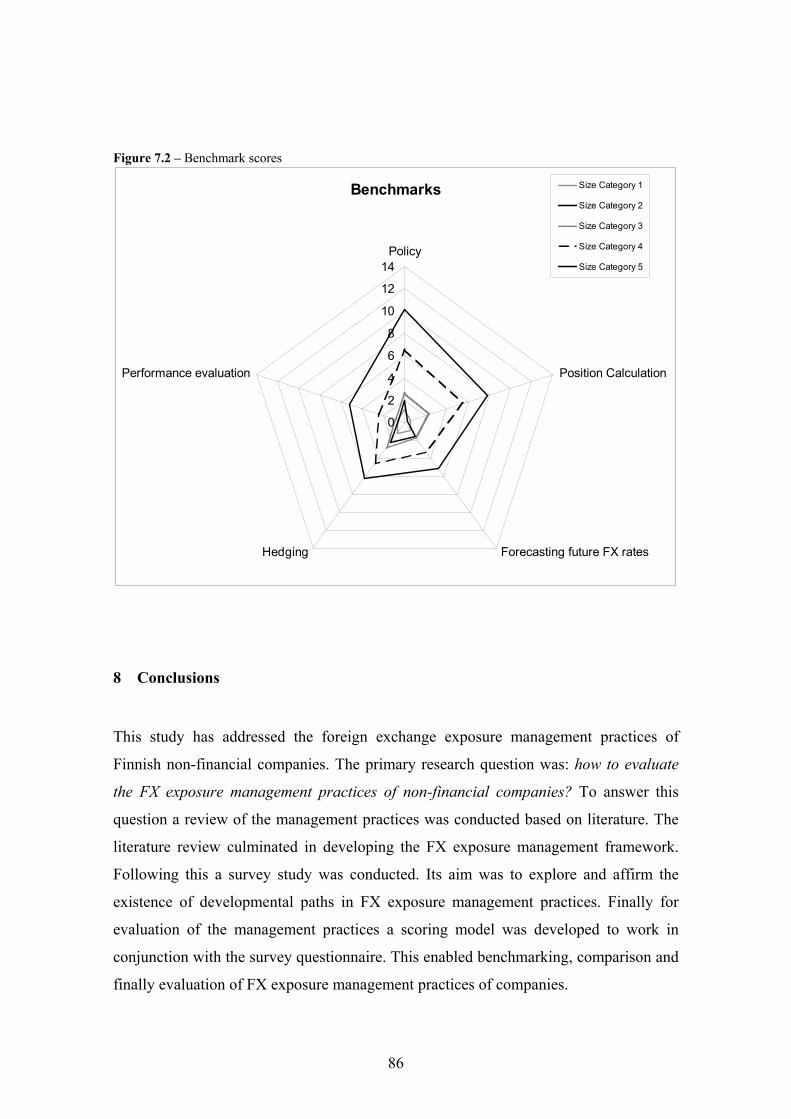
Figure 7.2 – Benchmark scores
Benchmarks
0
2
4
6
8
10
12
14Policy
Position Calculation
Forecasting future FX ratesHedging
Performance evaluation
Size Category 1
Size Category 2
Size Category 3
Size Category 4
Size Category 5
8 Conclusions
This study has addressed the foreign exchange exposure management practices of
Finnish non-financial companies. The primary research question was: how to evaluate
the FX exposure management practices of non-financial companies? To answer this
question a review of the management practices was conducted based on literature. The
literature review culminated in developing the FX exposure management framework.
Following this a survey study was conducted. Its aim was to explore and affirm the
existence of developmental paths in FX exposure management practices. Finally for
evaluation of the management practices a scoring model was developed to work in
conjunction with the survey questionnaire. This enabled benchmarking, comparison and
finally evaluation of FX exposure management practices of companies.
86
The empirical part of this study shows that company size, foreign exchange exposure
and the number of foreign currencies a company uses in its operations have significant
explanatory relationships with FX exposure management practices that a company
employs. On part of company size and foreign exchange exposure findings of this study
support the findings of earlier studies including studies by Pramborg154, Hakkarainen et
al.155 and Harju and Martikainen156. On part of the number of foreign currencies a
company uses in its operations this study adds to literature, as to the extent of the
knowledge of the author earlier studies have not recorded this relationship.
The results of the study support a progressive model of FX exposure management
practice development. Common developmental paths were identified in all components
of the outlined FX exposure management framework. Overall the framework was
supported by the findings from the survey study. Since existing literature has not
provided a conceptual framework for FX exposure management the contribution of this
study is in this respect valuable.
The framework offers a conceptual model of reference for managers. A comprehensive
framework of reference is important for developing FX exposure management
capabilities. The scoring model and the benchmarks based on the survey are specifically
intended for managers. By using them a relatively quick assessment of the prevailing
FX exposure management practices can be conducted in a company. Further more the
results can be compared with results from other companies.
The scoring model produces sophistication scores for individual components as well as
an overall company score. Their possible applications reach beyond an individual
company’s interest in self improvement. Some possible beneficiaries may include
investors that can use it in the assessment of company risk in respect to FX exposure
and financial service providers in segmenting markets for marketing and product 154 Pramborg, B., 2002 155 Hakkarainen, A. et al., 1996 156 Harju, M. and Marikainen, T., 1997
87
development purposes. Consultancies could as well benefit from categorizing their
clients based on the scores or using the evaluation tool in their service creation process.
The empirical findings of this study showed that in each component of the FX exposure
management framework there were practices with significant correlations with the three
explanatory factors. All of the practices studied, however, were not fully explained by
the results. On their part the results point to a number of issues warranting further
research. They include Centralization, Forecast source, Analytic methods and
Speculation. Firstly, the results of this study did not offer a clear reason for the choices
made concerning Centralization. Secondly, on part of Forecasting future FX rates,
future research could further explore the reasons for developing internal forecasting
capabilities. The sample size of this study was too small in this case and further research
is suggested to fully affirm the relationship between Size and internalizing forecasting.
Thirdly, the use of Analytic methods with position calculations showed high positive
correlations with the explanatory variables, but statistical significance could not be
established at a 95% confidence level. This issue could be revisited by future research to
better understand the dynamics behind adopting analytic methods in position
calculations. And finally, in hedging the role of Speculation remains somewhat unclear.
This is possibly related to dynamics concerning selecting between risk averse and profit
seeking policies, which could not be affirmed by this study due to the few number of
instances of active profit seeking policies. Future research could also consider
expanding the scope of FX exposure management practices from those included in this
study as some may have been overlooked or new practices may be develop in the future.
There were two distinct sources of limitations for the study. One of them was
structuring the survey questionnaire, best exemplified by the question concerning the
variable Primary metrics in performance evaluation. The question proved to be
inadequate in accounting for the diversity of metrics in reality. Also the question
concerning FX exposure could perhaps have been structured better. Companies with
very small percentages of revenues and expenditures denominated in foreign currencies
may have been discriminated against by the question setting. The other source of
88
limitations for the study was sample size. Analysis of the results would have benefited
on several accounts from a larger sample. This was reflected for instance in some cases
on the low levels of statistical significance. Partially this limitation could possibly have
been avoided by improved structuring of the survey questionnaire. However, a higher
response rate would surely have contributed significantly. Finally it can be concluded
that there is always room for improvement in the scoring model as our understanding of
managing FX exposure advances.
9 References
Articles
Alexander, C. and Johnson, A., “Are foreign exchange markets really efficient”, (1992),
Economic Letters, vol. 40, Issues 4, Pages 449-453
Canaday, J. and Feenstra, F., “Managing FX relationships”, (1991), The Treasurer,
April 1991, Pages 6-12. Adapted from Holland, J. (1993)
Dufey, G., “Corporate finance and exchange rate variations”, (1972), Financial
Management, Summer vol. 1, Issue 2, Pages 51-57
Dunne, T., Helliar, C. and Power, D., “Fraud at Allfirst financial: the failure of
corporate governance?”, (2003), European Business Journal, vol. 15, Issue 4, Pages
159-167
Edens, C., “A holistic view of corporate foreign exchange exposure management”,
(2010), Journal of Corporate Treasury Management, vol. 3, Issue 4, Pages 341-347
89
Giddy, I. and Dufey, G., “The random behaviour of flexible exchange rates:
Implications for forecasting”, (1975), Journal of International Business Studies, Spring
vol. 6, Issue 1, Pages 1-32
Glaum, M., “Strategic management of exchange rate risk”, (1990), Long Range
Planning, vol. 23, Issue 4, Pages 65-72
Koester, W., “No surprises: FX results remain a mystery for most multinational
companies”, (2010), AFT Exchange, June 2010, Pages 30-33
Rogalski, R. and Vinso, J., “Empirical properties of foreign exchange rates”, (1978),
Journal of International Business Studies, Fall vol. 9, Issue 2, Pages 69-79
Wallace, J., “The group of 31 report: Core principles for managing multinational FX
risk”, (1999), Greenwich Treasury Advisors LLC, [online] Available at:
http://greenwichtreasury.com/articles/articles.cfm [Accessed 15.8.2010]
Wallace, J., “A metric approach to risk management”, (2002), Greenwich Treasury
Advisors LLC, [online] Available at: http://greenwichtreasury.com/articles/articles.cfm
[Accessed 15.8.2010]
Books
Batter, J. and Livermore, A., “Australian firms’ foreign exchange risk management
practices: A case study approach”, (1995), In: J., Doukas, and L., Lang, eds. “Research
in international business and finance”, (1995), Vol. 12, Jai Press Inc., Greenwich, CT,
UK, Pages 133-149
Daniels, J., “International business: environments and operations”, (2004), Pearson
Education International, Upper Saddle River, NJ, USA
90
Doukas, J. and Lang, L., “Research in international business and finance”, (1995), Vol.
12, Jai Press Inc., Greenwich, CT, UK
Eiteman, D., Stonehill, A. and Moffett, M., “Multinational business finance”, (1998),
Eighth Edition, Addison-Wesley Publishing Company Inc., Reading, MA, USA
Gotthelf, P., “Currency trading: how to access and trade the world’s biggest market”,
(2003), John Wiley & Sons Inc, NJ, USA
Hakkarainen, A., Joseph, N., Kasanen, E. and Puttonen, V., “Foreign exchange
exposure management among Finnish firms”, (1996), Working Papers, Helsinki School
of Economics and Business Administration, Finland
Harju, M. and Martikainen, T., “Managing foreign exchange and interest rate risk
among small and medium-seized Finnish firms”, (1997), Proceedings of the University
of Vaasa, Finland
Holland, J., ”International financial management”, (1993), Oxford: Blackwell, Great
Britain
Koh, A., “The relationship of management to effective risk control”, (1997), In: G.,
Klopfenstein, ed. “FX: Managing global currency risk”, (1997), Glenlake Publishing
Company, Ltd., Chicago, IL, USA, Chapter 12, Pages 193-211
Kolb, R. and Overdahl, J., “Futures, options and swaps”, (2007), Blackwell Publishing,
Malden, MA, USA
Levi, M., “International finance”, (2005), Routledge, London, Great Britain
91
Linsmeier, T. and Pearson, N., “Risk measurement”, (1997), In: G., Klopfenstein, ed.
“FX: Managing global currency risk”, (1997), Glenlake Publishing Company, Ltd.,
Chicago, IL, USA, Chapter 13, Pages 213-260
Saunders, A. and Cornett, M., “Financial institutions management: A risk management
approach”, 6th edition (2008), McGraw-Hill, Boston, MA, USA
Shapiro, A., “Multinational financial management”, (2006), John Wiley & Sons Inc,
NJ, USA
Stonehill, A. and Moffett, M., “International financial management”, (1997),
International Thomson Business Press, London, Great Britain
Other
Isokallio, K., ”The reliability of cash flow estimates in managing forex exposures.
Case: Nokia”, (1996), Thesis t6683, Helsinki School of Economics, Finland
Karppinen, A., “Real exchange rate and competitive exposure: a study on strategic
hedging in Finnish multinational companies”, (1997), Thesis t6832, Helsinki School of
Economics, Finland
Kiuru, J., “IAS 39 ja suojauslaskenta valuuttariskin hallinnassa: Case Tecnomen”,
(2007), Thesis t10391, Helsinki School of Economics, Finland
Laitiainen, T., “Yrityksen valuuttakurssiriskit ja niiltä suojautuminen valuuttaoptioiden
avulla”, (1996), Thesis t6680, Helsinki School of Economis, Finland
Mattila, T., ”Valuuttaposition määrittely ja riskilaskenta yrityksessä: case Finnair”,
(1999), Thesis t7617, Helsinki School of Economics, Finland
92
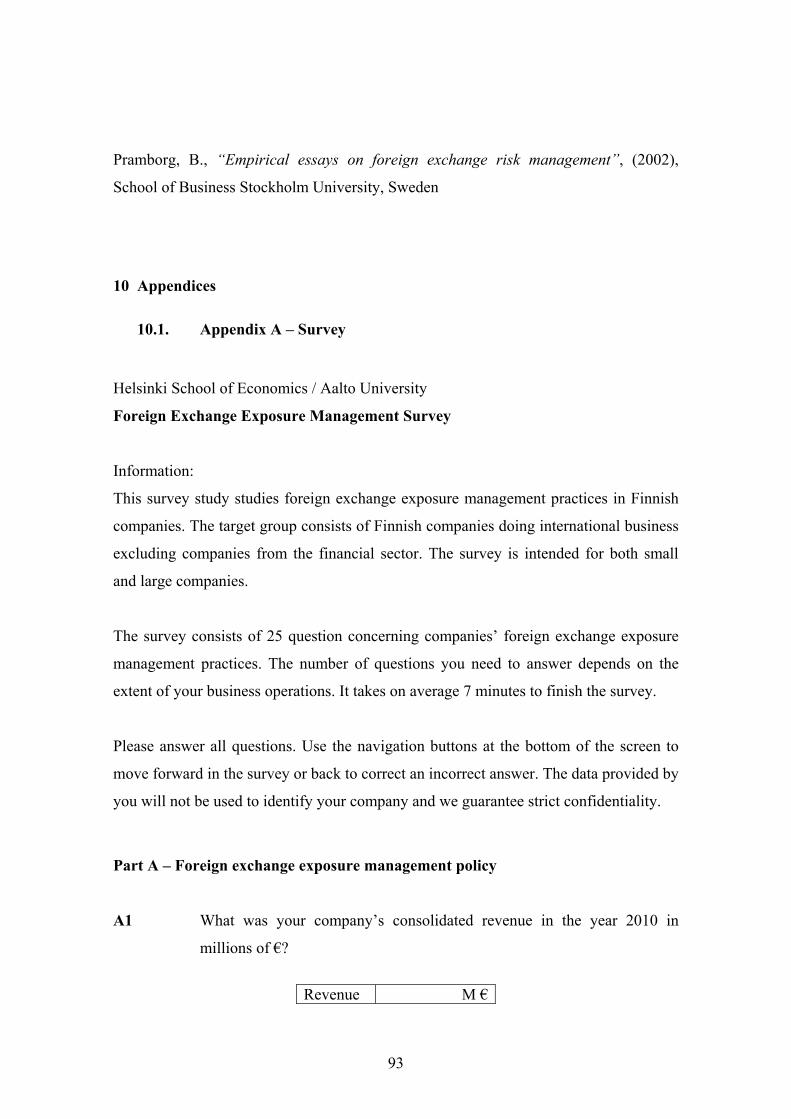
Pramborg, B., “Empirical essays on foreign exchange risk management”, (2002),
School of Business Stockholm University, Sweden
10 Appendices
10.1. Appendix A – Survey
Helsinki School of Economics / Aalto University
Foreign Exchange Exposure Management Survey
Information:
This survey study studies foreign exchange exposure management practices in Finnish
companies. The target group consists of Finnish companies doing international business
excluding companies from the financial sector. The survey is intended for both small
and large companies.
The survey consists of 25 question concerning companies’ foreign exchange exposure
management practices. The number of questions you need to answer depends on the
extent of your business operations. It takes on average 7 minutes to finish the survey.
Please answer all questions. Use the navigation buttons at the bottom of the screen to
move forward in the survey or back to correct an incorrect answer. The data provided by
you will not be used to identify your company and we guarantee strict confidentiality.
Part A – Foreign exchange exposure management policy
A1 What was your company’s consolidated revenue in the year 2010 in
millions of €?
Revenue M €
93
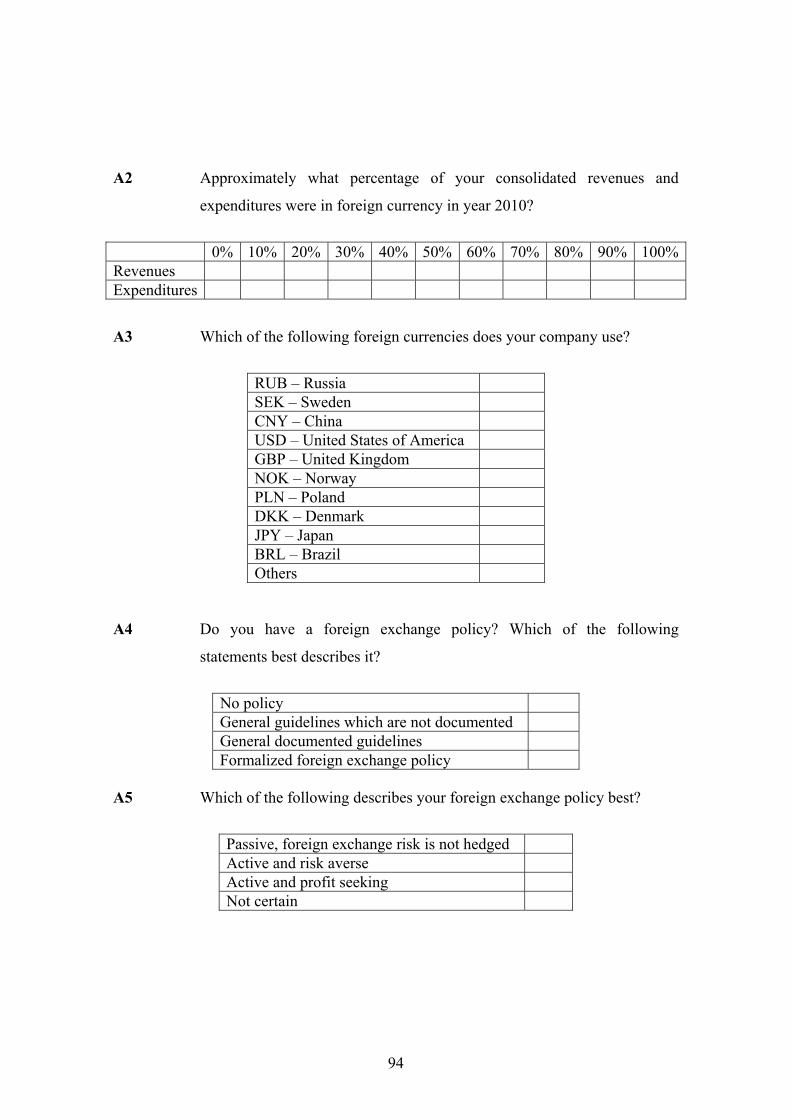
A2 Approximately what percentage of your consolidated revenues and
expenditures were in foreign currency in year 2010?
0% 10% 20% 30% 40% 50% 60% 70% 80% 90% 100%Revenues Expenditures
A3 Which of the following foreign currencies does your company use?
RUB – Russia SEK – Sweden CNY – China USD – United States of America GBP – United Kingdom NOK – Norway PLN – Poland DKK – Denmark JPY – Japan BRL – Brazil Others
A4 Do you have a foreign exchange policy? Which of the following
statements best describes it?
No policy General guidelines which are not documented General documented guidelines Formalized foreign exchange policy
A5 Which of the following describes your foreign exchange policy best?
Passive, foreign exchange risk is not hedged Active and risk averse Active and profit seeking Not certain
94
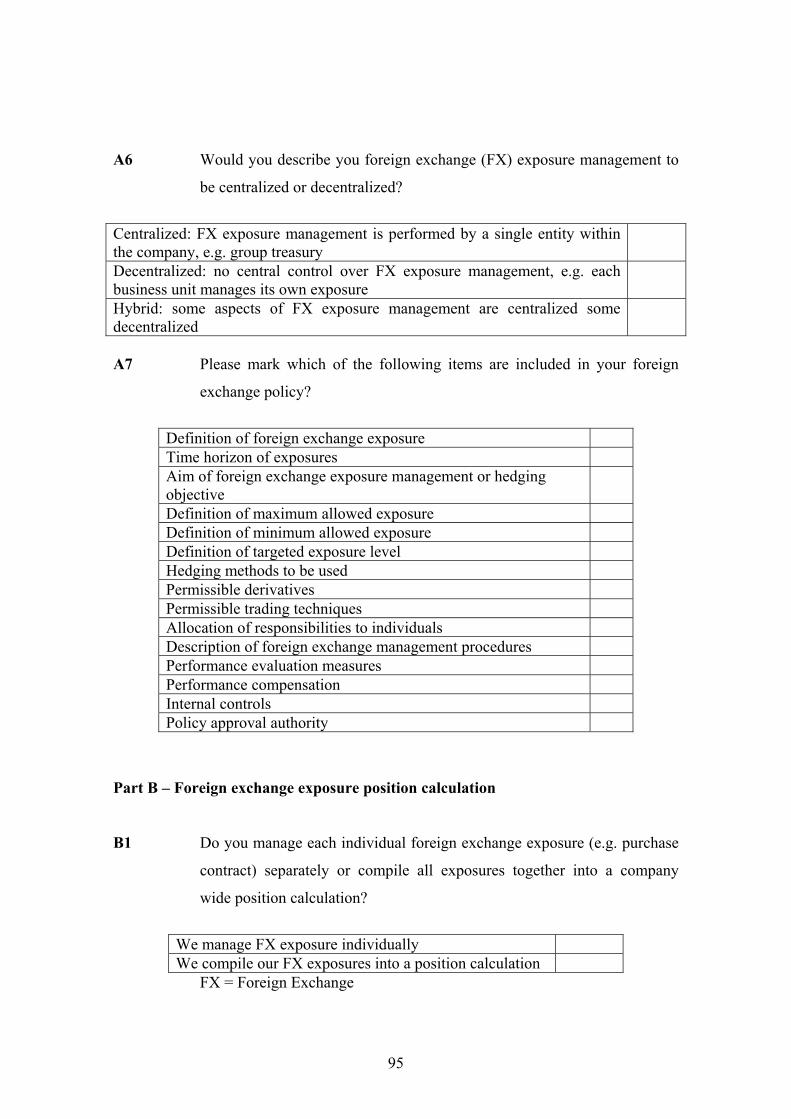
A6 Would you describe you foreign exchange (FX) exposure management to
be centralized or decentralized?
Centralized: FX exposure management is performed by a single entity within the company, e.g. group treasury
Decentralized: no central control over FX exposure management, e.g. each business unit manages its own exposure
Hybrid: some aspects of FX exposure management are centralized some decentralized
A7 Please mark which of the following items are included in your foreign
exchange policy?
Definition of foreign exchange exposure Time horizon of exposures Aim of foreign exchange exposure management or hedging objective
Definition of maximum allowed exposure Definition of minimum allowed exposure Definition of targeted exposure level Hedging methods to be used Permissible derivatives Permissible trading techniques Allocation of responsibilities to individuals Description of foreign exchange management procedures Performance evaluation measures Performance compensation Internal controls Policy approval authority
Part B – Foreign exchange exposure position calculation
B1 Do you manage each individual foreign exchange exposure (e.g. purchase
contract) separately or compile all exposures together into a company
wide position calculation?
We manage FX exposure individually We compile our FX exposures into a position calculation
FX = Foreign Exchange
95
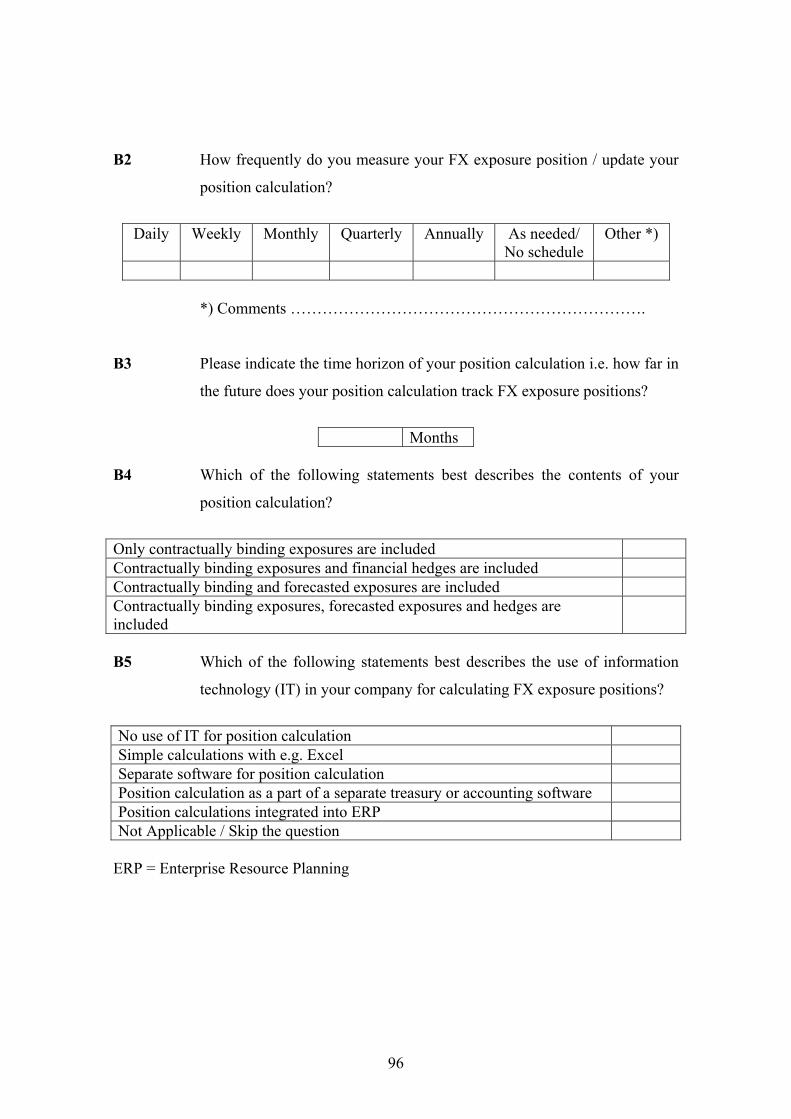
B2 How frequently do you measure your FX exposure position / update your
position calculation?
Daily Weekly Monthly Quarterly Annually As needed/
No schedule Other *)
*) Comments ………………………………………………………….
B3 Please indicate the time horizon of your position calculation i.e. how far in
the future does your position calculation track FX exposure positions?
Months
B4 Which of the following statements best describes the contents of your
position calculation?
Only contractually binding exposures are included Contractually binding exposures and financial hedges are included Contractually binding and forecasted exposures are included Contractually binding exposures, forecasted exposures and hedges are included
B5 Which of the following statements best describes the use of information
technology (IT) in your company for calculating FX exposure positions?
No use of IT for position calculation Simple calculations with e.g. Excel Separate software for position calculation Position calculation as a part of a separate treasury or accounting software Position calculations integrated into ERP Not Applicable / Skip the question
ERP = Enterprise Resource Planning
96
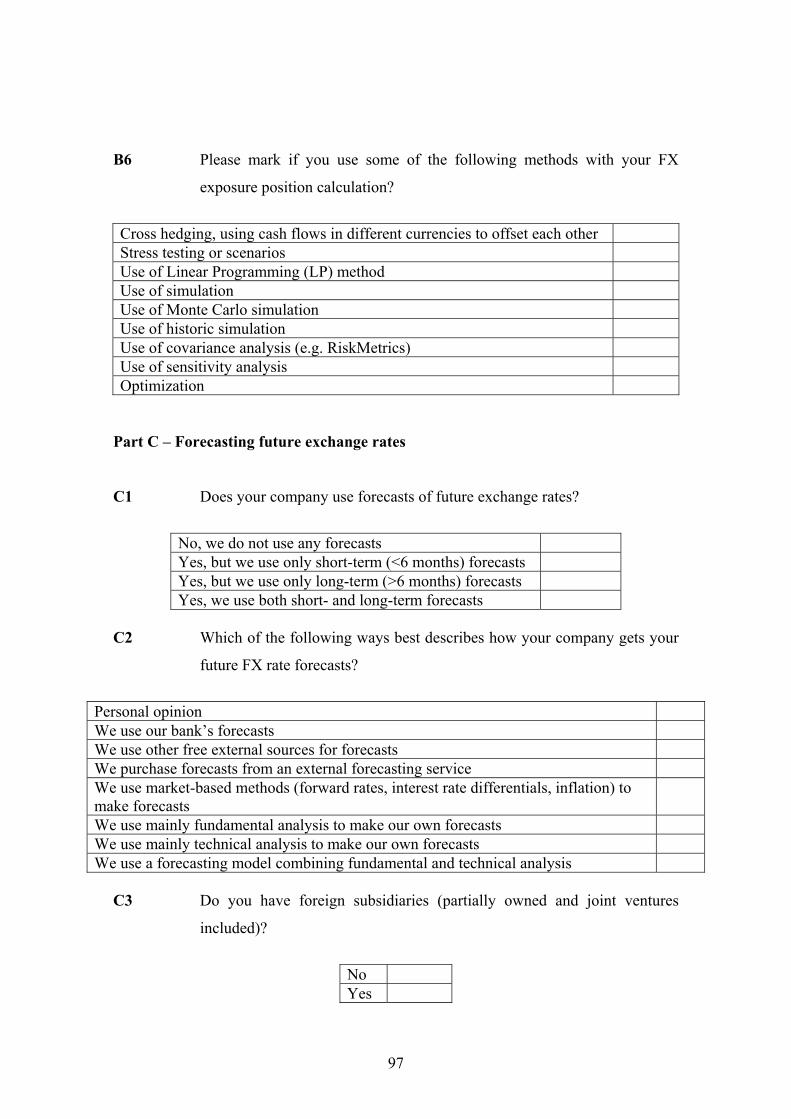
B6 Please mark if you use some of the following methods with your FX
exposure position calculation?
Cross hedging, using cash flows in different currencies to offset each other Stress testing or scenarios Use of Linear Programming (LP) method Use of simulation Use of Monte Carlo simulation Use of historic simulation Use of covariance analysis (e.g. RiskMetrics) Use of sensitivity analysis Optimization
Part C – Forecasting future exchange rates
C1 Does your company use forecasts of future exchange rates?
No, we do not use any forecasts Yes, but we use only short-term (<6 months) forecasts Yes, but we use only long-term (>6 months) forecasts Yes, we use both short- and long-term forecasts
C2 Which of the following ways best describes how your company gets your
future FX rate forecasts?
Personal opinion We use our bank’s forecasts We use other free external sources for forecasts We purchase forecasts from an external forecasting service We use market-based methods (forward rates, interest rate differentials, inflation) to make forecasts
We use mainly fundamental analysis to make our own forecasts We use mainly technical analysis to make our own forecasts We use a forecasting model combining fundamental and technical analysis
C3 Do you have foreign subsidiaries (partially owned and joint ventures
included)?
No Yes
97
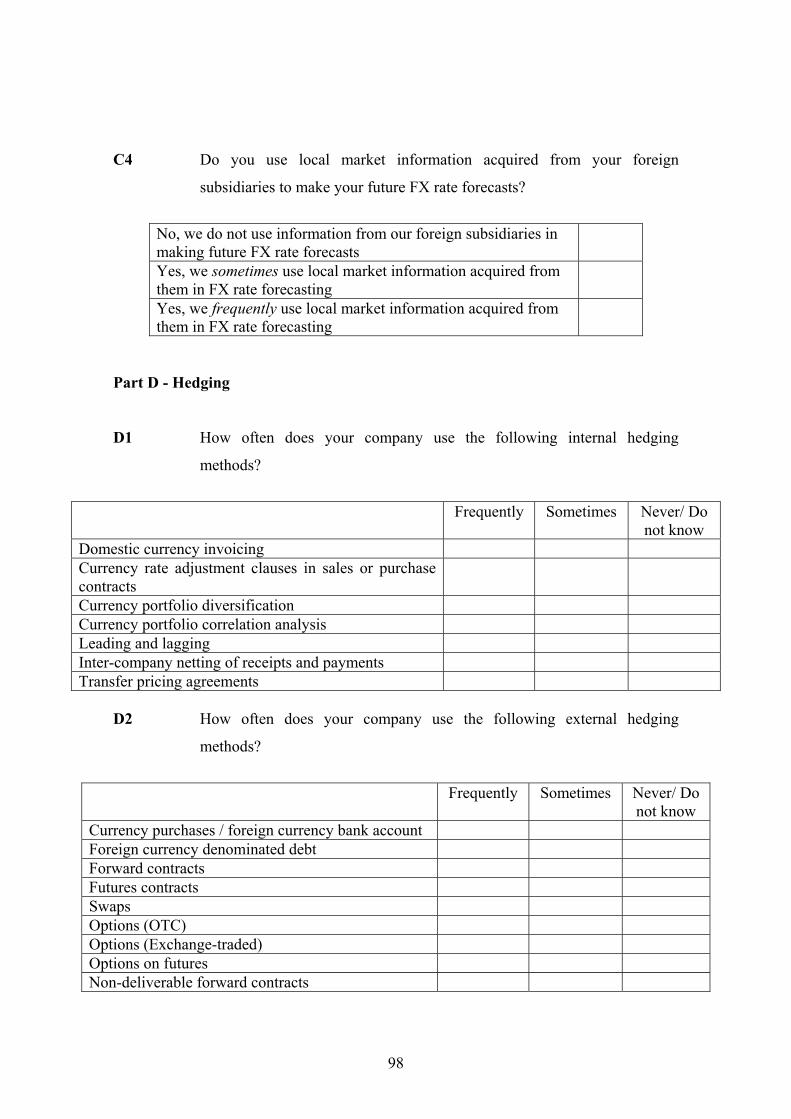
C4 Do you use local market information acquired from your foreign
subsidiaries to make your future FX rate forecasts?
No, we do not use information from our foreign subsidiaries in making future FX rate forecasts
Yes, we sometimes use local market information acquired from them in FX rate forecasting
Yes, we frequently use local market information acquired from them in FX rate forecasting
Part D - Hedging
D1 How often does your company use the following internal hedging
methods?
Frequently Sometimes Never/ Do
not know Domestic currency invoicing Currency rate adjustment clauses in sales or purchase contracts
Currency portfolio diversification Currency portfolio correlation analysis Leading and lagging Inter-company netting of receipts and payments Transfer pricing agreements
D2 How often does your company use the following external hedging
methods?
Frequently Sometimes Never/ Do
not know Currency purchases / foreign currency bank account Foreign currency denominated debt Forward contracts Futures contracts Swaps Options (OTC) Options (Exchange-traded) Options on futures Non-deliverable forward contracts
98
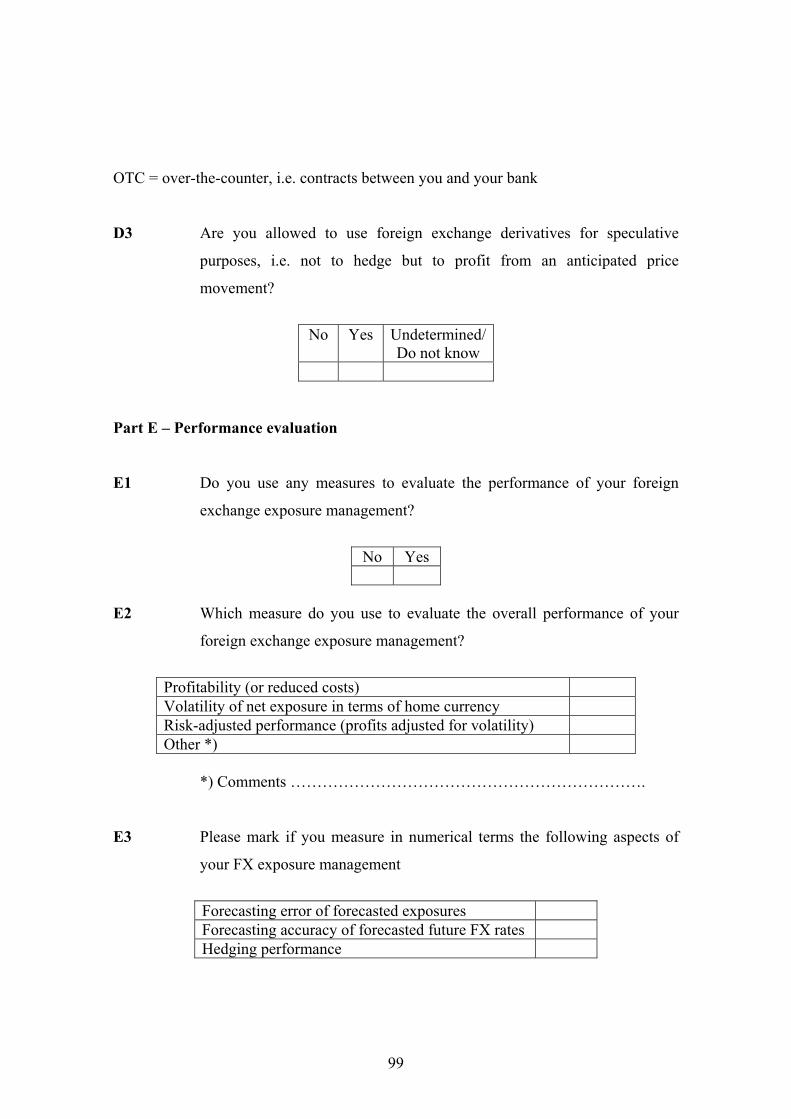
OTC = over-the-counter, i.e. contracts between you and your bank
D3 Are you allowed to use foreign exchange derivatives for speculative
purposes, i.e. not to hedge but to profit from an anticipated price
movement?
No Yes Undetermined/
Do not know
Part E – Performance evaluation
E1 Do you use any measures to evaluate the performance of your foreign
exchange exposure management?
No Yes
E2 Which measure do you use to evaluate the overall performance of your
foreign exchange exposure management?
Profitability (or reduced costs) Volatility of net exposure in terms of home currency Risk-adjusted performance (profits adjusted for volatility) Other *)
*) Comments ………………………………………………………….
E3 Please mark if you measure in numerical terms the following aspects of
your FX exposure management
Forecasting error of forecasted exposures Forecasting accuracy of forecasted future FX rates Hedging performance
99
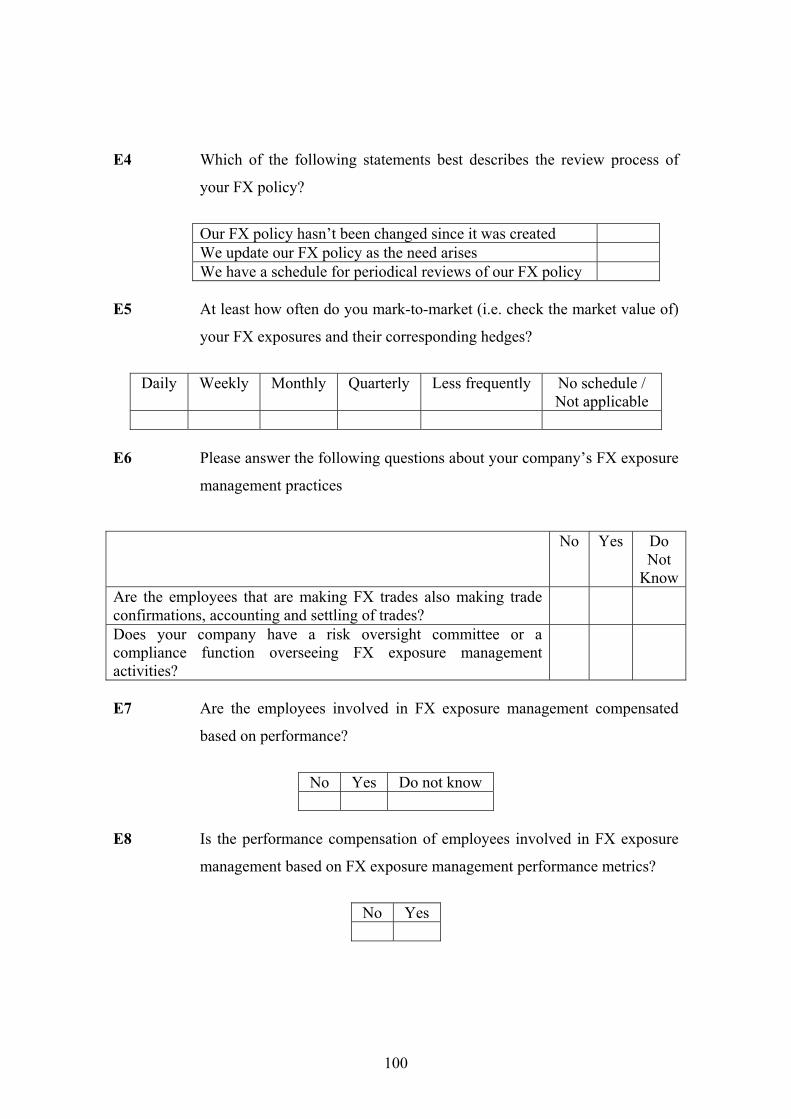
E4 Which of the following statements best describes the review process of
your FX policy?
Our FX policy hasn’t been changed since it was created We update our FX policy as the need arises We have a schedule for periodical reviews of our FX policy
E5 At least how often do you mark-to-market (i.e. check the market value of)
your FX exposures and their corresponding hedges?
Daily Weekly Monthly Quarterly Less frequently No schedule /
Not applicable
E6 Please answer the following questions about your company’s FX exposure
management practices
No Yes Do Not
KnowAre the employees that are making FX trades also making trade confirmations, accounting and settling of trades?
Does your company have a risk oversight committee or a compliance function overseeing FX exposure management activities?
E7 Are the employees involved in FX exposure management compensated
based on performance?
No Yes Do not know
E8 Is the performance compensation of employees involved in FX exposure
management based on FX exposure management performance metrics?
No Yes
100
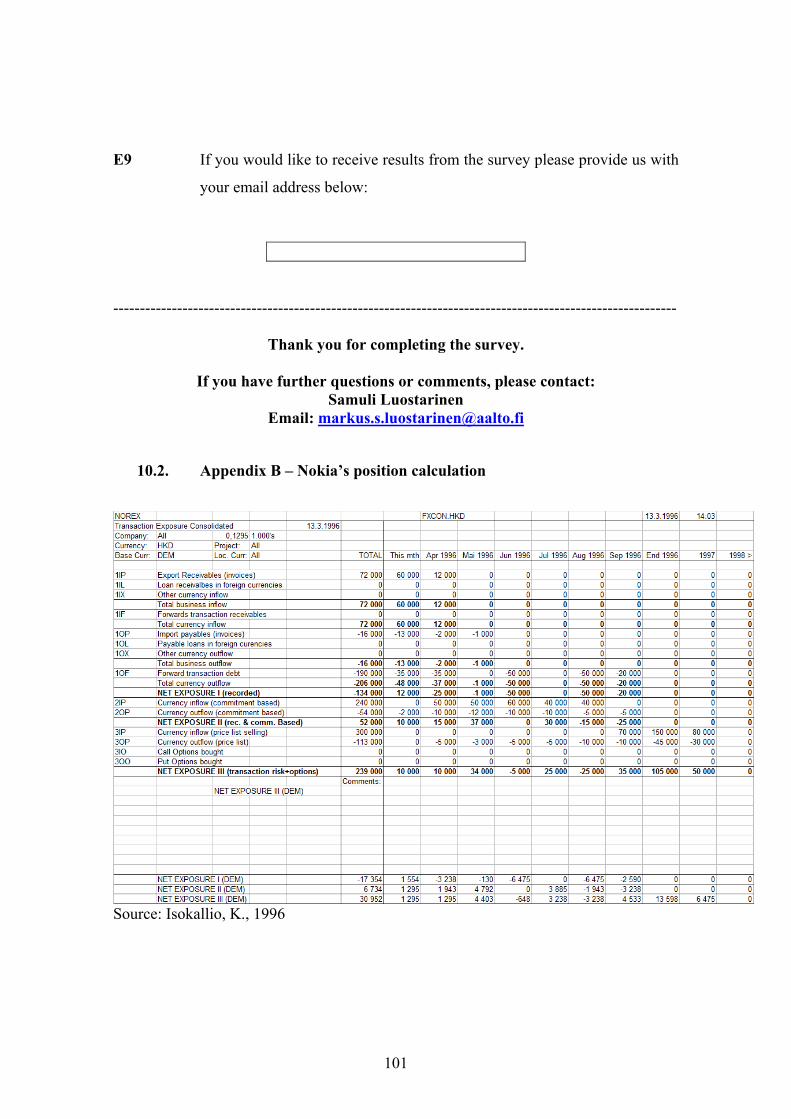
E9 If you would like to receive results from the survey please provide us with
your email address below:
----------------------------------------------------------------------------------------------------------
Thank you for completing the survey.
If you have further questions or comments, please contact: Samuli Luostarinen
Email: [email protected]
10.2. Appendix B – Nokia’s position calculation
Source: Isokallio, K., 1996
101
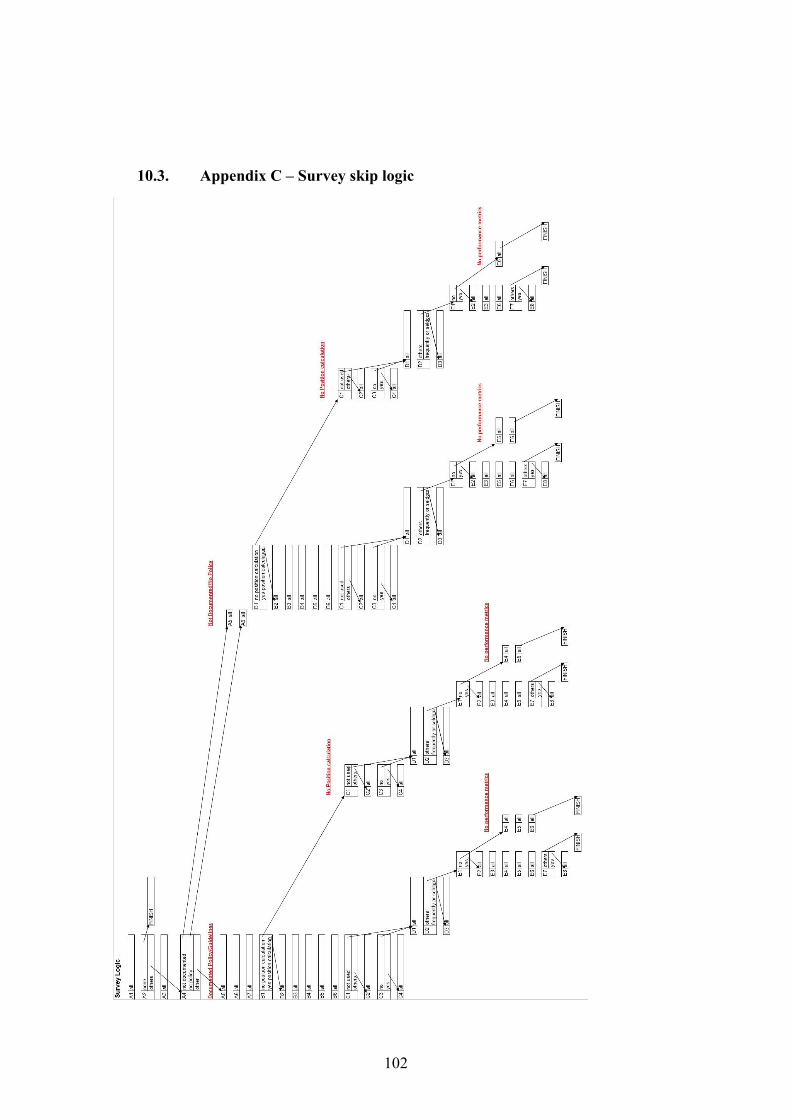
10.3. Appendix C – Survey skip logic
102
Recommended