Full wwPDB NMR Structure Validation Report i○
Feb 18, 2018 – 02:25 am GMT
PDB ID : 2KUNTitle : Three dimensional structure of HuPrP(90-231 M129 Q212P)
Authors : Ilc, G.; Giachin, G.; Jaremko, M.; Jaremko, L.; Zhukov, I.; Plavec, J.; Leg-name, G.; Benetti, F.
Deposited on : 2010-02-23
This is a Full wwPDB NMR Structure Validation Report for a publicly released PDB entry.
We welcome your comments at [email protected] user guide is available at
https://www.wwpdb.org/validation/2017/NMRValidationReportHelpwith specific help available everywhere you see the i○ symbol.
The following versions of software and data (see references i○) were used in the production of this report:
Cyrange : Kirchner and Güntert (2011)NmrClust : Kelley et al. (1996)
MolProbity : 4.02b-467Percentile statistics : 20171227.v01 (using entries in the PDB archive December 27th 2017)
RCI : v_1n_11_5_13_A (Berjanski et al., 2005)PANAV : Wang et al. (2010)
ShiftChecker : trunk30686Ideal geometry (proteins) : Engh & Huber (2001)
Ideal geometry (DNA, RNA) : Parkinson et al. (1996)Validation Pipeline (wwPDB-VP) : trunk30686

Page 2 Full wwPDB NMR Structure Validation Report 2KUN
1 Overall quality at a glance i○
The following experimental techniques were used to determine the structure:SOLUTION NMR
The overall completeness of chemical shifts assignment is 88%.
Percentile scores (ranging between 0-100) for global validation metrics of the entry are shown inthe following graphic. The table shows the number of entries on which the scores are based.
Metric Whole archive(#Entries)
NMR archive(#Entries)
Clashscore 136279 12091Ramachandran outliers 132675 10835
Sidechain outliers 132484 10811
The table below summarises the geometric issues observed across the polymeric chains and theirfit to the experimental data. The red, orange, yellow and green segments indicate the fractionof residues that contain outliers for >=3, 2, 1 and 0 types of geometric quality criteria. A cyansegment indicates the fraction of residues that are not part of the well-defined cores, and a grey seg-ment represents the fraction of residues that are not modelled. The numeric value for each fractionis indicated below the corresponding segment, with a dot representing fractions <=5%
Mol Chain Length Quality of chain
1 A 148
Page 3 Full wwPDB NMR Structure Validation Report 2KUN
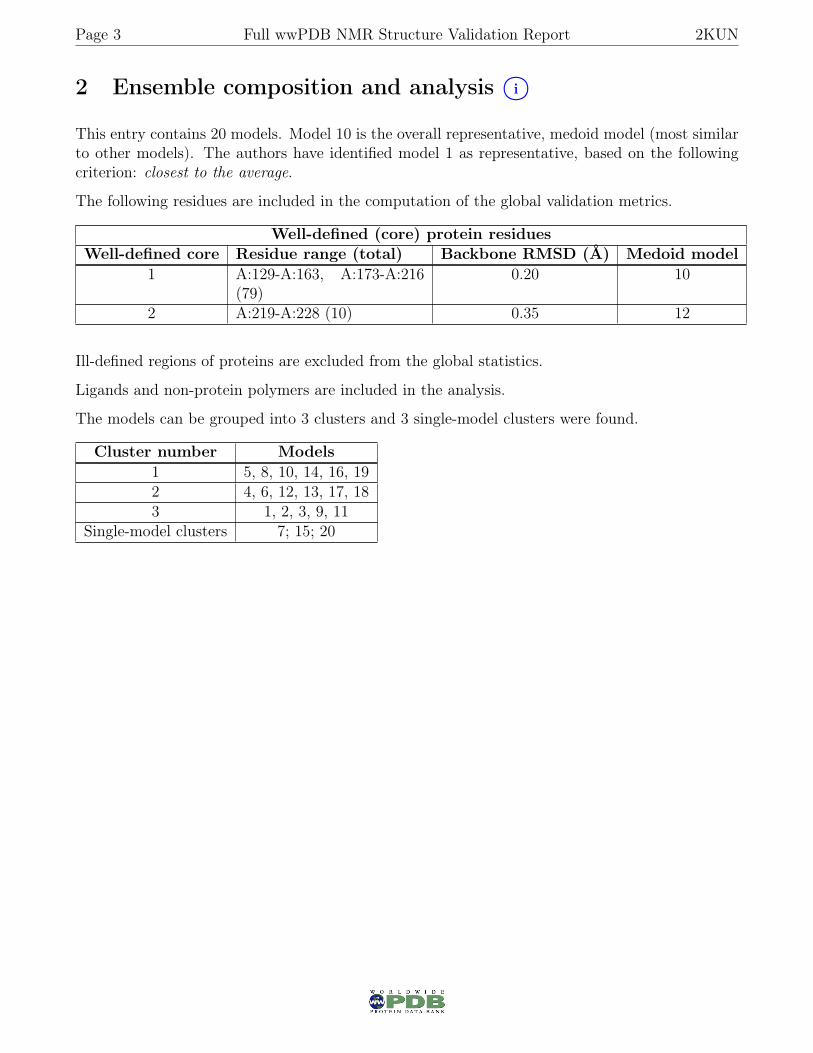
2 Ensemble composition and analysis i○
This entry contains 20 models. Model 10 is the overall representative, medoid model (most similarto other models). The authors have identified model 1 as representative, based on the followingcriterion: closest to the average.
The following residues are included in the computation of the global validation metrics.
Well-defined (core) protein residuesWell-defined core Residue range (total) Backbone RMSD (Å) Medoid model
1 A:129-A:163, A:173-A:216(79)
0.20 10
2 A:219-A:228 (10) 0.35 12
Ill-defined regions of proteins are excluded from the global statistics.
Ligands and non-protein polymers are included in the analysis.
The models can be grouped into 3 clusters and 3 single-model clusters were found.
Cluster number Models1 5, 8, 10, 14, 16, 192 4, 6, 12, 13, 17, 183 1, 2, 3, 9, 11
Single-model clusters 7; 15; 20

Page 4 Full wwPDB NMR Structure Validation Report 2KUN
3 Entry composition i○
There is only 1 type of molecule in this entry. The entry contains 2302 atoms, of which 1114 arehydrogens and 0 are deuteriums.
• Molecule 1 is a protein called Major prion protein.
Mol Chain Residues Atoms Trace
1 A 148 Total C H N O S2302 731 1114 221 225 11 0
There are 7 discrepancies between the modelled and reference sequences:
Chain Residue Modelled Actual Comment ReferenceA 212 PRO GLN ENGINEERED UNP P04156A 232 HIS - EXPRESSION TAG UNP P04156A 233 HIS - EXPRESSION TAG UNP P04156A 234 HIS - EXPRESSION TAG UNP P04156A 235 HIS - EXPRESSION TAG UNP P04156A 236 HIS - EXPRESSION TAG UNP P04156A 237 HIS - EXPRESSION TAG UNP P04156

Page 5 Full wwPDB NMR Structure Validation Report 2KUN
4 Residue-property plots i○
4.1 Average score per residue in the NMR ensemble
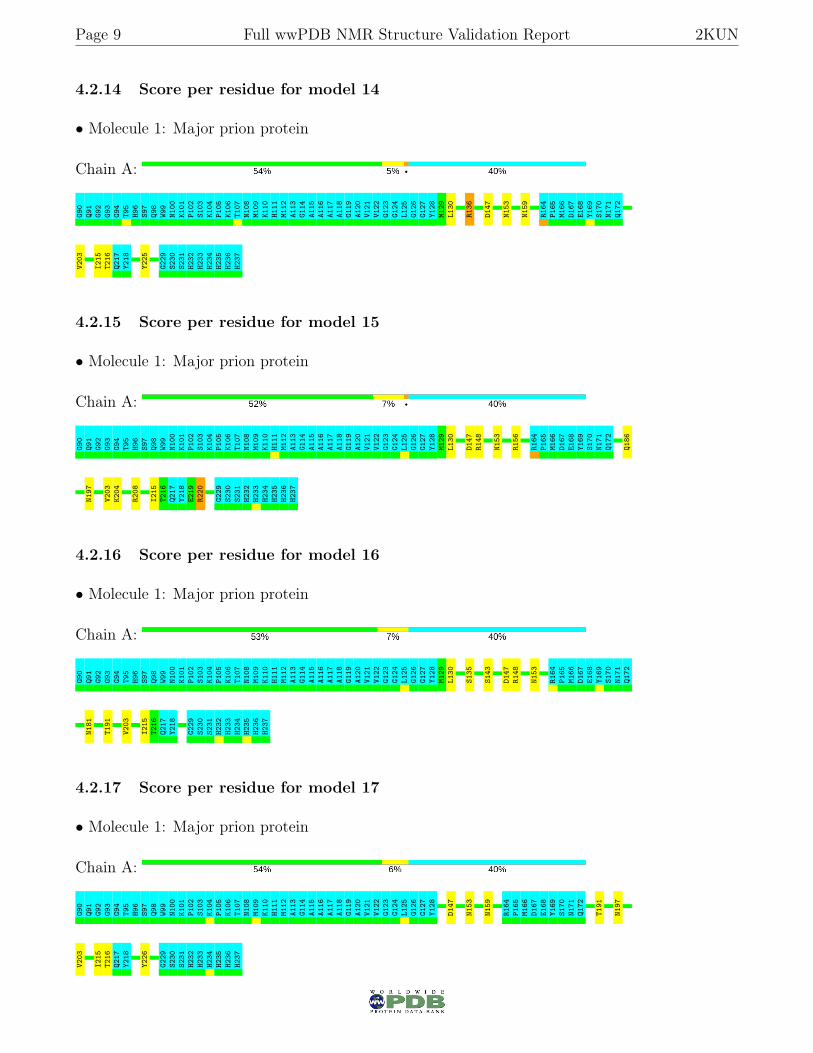
These plots are provided for all protein, RNA and DNA chains in the entry. The first graphic is thesame as shown in the summary in section 1 of this report. The second graphic shows the sequencewhere residues are colour-coded according to the number of geometric quality criteria for whichthey contain at least one outlier: green = 0, yellow = 1, orange = 2 and red = 3 or more. Stretchesof 2 or more consecutive residues without any outliers are shown as green connectors. Residueswhich are classified as ill-defined in the NMR ensemble, are shown in cyan with an underlinecolour-coded according to the previous scheme. Residues which were present in the experimentalsample, but not modelled in the final structure are shown in grey.
• Molecule 1: Major prion protein
Chain A:
G90
Q91
G92
G93
G94
T95
H96
S97
Q98
W99
N100
K101
P102
S103
K104
P105
K106
T107
N108
M109
K110
H111
M112
A113
G114
A115
A116
A117
A118
G119
A120
V121
V122
G123
G124
L125
G126
G127
Y128
M129
L130
D147
N153
R164
P165
M166
D167
E168
Y169
S170
N171
Q172
V203
I215
T216
Q217
Y218
G229
S230
S231
H232
H233
H234
H235
H236
H237
4.2 Scores per residue for each member of the ensemble
Colouring as in section 4.1 above.
4.2.1 Score per residue for model 1
• Molecule 1: Major prion protein
Chain A:
G90
Q91
G92
G93
G94
T95
H96
S97
Q98
W99
N100
K101
P102
S103
K104
P105
K106
T107
N108
M109
K110
H111
M112
A113
G114
A115
A116
A117
A118
G119
A120
V121
V122
G123
G124
L125
G126
G127
Y128
M129
L130
S143
D147
R151
E152
N153
R164
P165
M166
D167
E168
Y169
S170
N171
Q172
D178
V203
I215
T216
Q217
Y218
E219
R220
G229
S230
S231
H232
H233
H234
H235
H236
H237
4.2.2 Score per residue for model 2
• Molecule 1: Major prion protein
Chain A:

Page 6 Full wwPDB NMR Structure Validation Report 2KUN
G90
Q91
G92
G93
G94
T95
H96
S97
Q98
W99
N100
K101
P102
S103
K104
P105
K106
T107
N108
M109
K110
H111
M112
A113
G114
A115
A116
A117
A118
G119
A120
V121
V122
G123
G124
L125
G126
G127
Y128
M129
L130
R136
D147
N153
R164
P165
M166
D167
E168
Y169
S170
N171
Q172
T191
N197
V203
I215
T216
Q217
Y218
G229
S230
S231
H232
H233
H234
H235
H236
H237
4.2.3 Score per residue for model 3
• Molecule 1: Major prion protein
Chain A:
G90
Q91
G92
G93
G94
T95
H96
S97
Q98
W99
N100
K101
P102
S103
K104
P105
K106
T107
N108
M109
K110
H111
M112
A113
G114
A115
A116
A117
A118
G119
A120
V121
V122
G123
G124
L125
G126
G127
Y128
M129
L130
S135
R136
D147
N153
R164
P165
M166
D167
E168
Y169
S170
N171
Q172
N181
T191
V203
K204
I215
T216
Q217
Y218
G229
S230
S231
H232
H233
H234
H235
H236
H237
4.2.4 Score per residue for model 4
• Molecule 1: Major prion protein
Chain A:
G90
Q91
G92
G93
G94
T95
H96
S97
Q98
W99
N100
K101
P102
S103
K104
P105
K106
T107
N108
M109
K110
H111
M112
A113
G114
A115
A116
A117
A118
G119
A120
V121
V122
G123
G124
L125
G126
G127
Y128
M129
L130
M134
D147
R148
R151
E152
N153
V161
R164
P165
M166
D167
E168
Y169
S170
N171
Q172
K185
Q186
I215
T216
Q217
Y218
G229
S230
S231
H232
H233
H234
H235
H236
H237
4.2.5 Score per residue for model 5
• Molecule 1: Major prion protein
Chain A:
G90
Q91
G92
G93
G94
T95
H96
S97
Q98
W99
N100
K101
P102
S103
K104
P105
K106
T107
N108
M109
K110
H111
M112
A113
G114
A115
A116
A117
A118
G119
A120
V121
V122
G123
G124
L125
G126
G127
Y128
M129
L130
N153
R164
P165
M166
D167
E168
Y169
S170
N171
Q172
Q186
N197
V203
R208
I215
T216
Q217
Y218
S222
G229
S230
S231
H232
H233
H234
H235
H236
H237
4.2.6 Score per residue for model 6
• Molecule 1: Major prion protein

Page 7 Full wwPDB NMR Structure Validation Report 2KUN
Chain A:G9
0Q9
1G9
2G9
3G9
4T9
5H9
6S9
7Q9
8W9
9N1
00K1
01P1
02S1
03K1
04P1
05K1
06T1
07N1
08M1
09K1
10H1
11M1
12A1
13G1
14A1
15A1
16A1
17A1
18G1
19A1
20V1
21V1
22G1
23G1
24L1
25G1
26G1
27Y1
28M1
29L1
30
D147
N153
R164
P165
M166
D167
E168
Y169
S170
N171
Q172
Q186
V203
R208
I215
T216
Q217
Y218
Y225
G229
S230
S231
H232
H233
H234
H235
H236
H237
4.2.7 Score per residue for model 7
• Molecule 1: Major prion protein
Chain A:
G90
Q91
G92
G93
G94
T95
H96
S97
Q98
W99
N100
K101
P102
S103
K104
P105
K106
T107
N108
M109
K110
H111
M112
A113
G114
A115
A116
A117
A118
G119
A120
V121
V122
G123
G124
L125
G126
G127
Y128
M129
L130
D147
N153
R164
P165
M166
D167
E168
Y169
S170
N171
Q172
D178
Q186
N197
V203
I215
T216
Q217
Y218
S222
G229
S230
S231
H232
H233
H234
H235
H236
H237
4.2.8 Score per residue for model 8
• Molecule 1: Major prion protein
Chain A:
G90
Q91
G92
G93
G94
T95
H96
S97
Q98
W99
N100
K101
P102
S103
K104
P105
K106
T107
N108
M109
K110
H111
M112
A113
G114
A115
A116
A117
A118
G119
A120
V121
V122
G123
G124
L125
G126
G127
Y128
M129
L130
D144
D147
N153
R164
P165
M166
D167
E168
Y169
S170
N171
Q172
T191
V203
R208
I215
T216
Q217
Y218
G229
S230
S231
H232
H233
H234
H235
H236
H237
4.2.9 Score per residue for model 9
• Molecule 1: Major prion protein
Chain A:
G90
Q91
G92
G93
G94
T95
H96
S97
Q98
W99
N100
K101
P102
S103
K104
P105
K106
T107
N108
M109
K110
H111
M112
A113
G114
A115
A116
A117
A118
G119
A120
V121
V122
G123
G124
L125
G126
G127
Y128
M129
L130
D147
N153
R156
R164
P165
M166
D167
E168
Y169
S170
N171
Q172
N197
V203
I215
T216
Q217
Y218
G229
S230
S231
H232
H233
H234
H235
H236
H237

Page 8 Full wwPDB NMR Structure Validation Report 2KUN
4.2.10 Score per residue for model 10 (medoid)
• Molecule 1: Major prion protein
Chain A:
G90
Q91
G92
G93
G94
T95
H96
S97
Q98
W99
N100
K101
P102
S103
K104
P105
K106
T107
N108
M109
K110
H111
M112
A113
G114
A115
A116
A117
A118
G119
A120
V121
V122
G123
G124
L125
G126
G127
Y128
M129
L130
R136
N153
N159
R164
P165
M166
D167
E168
Y169
S170
N171
Q172
T191
N197
V203
I215
T216
Q217
Y218
E219
R220
G229
S230
S231
H232
H233
H234
H235
H236
H237
4.2.11 Score per residue for model 11
• Molecule 1: Major prion protein
Chain A:
G90
Q91
G92
G93
G94
T95
H96
S97
Q98
W99
N100
K101
P102
S103
K104
P105
K106
T107
N108
M109
K110
H111
M112
A113
G114
A115
A116
A117
A118
G119
A120
V121
V122
G123
G124
L125
G126
G127
Y128
M129
L130
D147
R151
E152
N153
R156
R164
P165
M166
D167
E168
Y169
S170
N171
Q172
I215
T216
Q217
Y218
S222
G229
S230
S231
H232
H233
H234
H235
H236
H237
4.2.12 Score per residue for model 12
• Molecule 1: Major prion protein
Chain A:
G90
Q91
G92
G93
G94
T95
H96
S97
Q98
W99
N100
K101
P102
S103
K104
P105
K106
T107
N108
M109
K110
H111
M112
A113
G114
A115
A116
A117
A118
G119
A120
V121
V122
G123
G124
L125
G126
G127
Y128
M129
L130
D147
R151
E152
N153
Y162
Y163
R164
P165
M166
D167
E168
Y169
S170
N171
Q172
T183
Q186
I215
T216
Q217
Y218
E219
R220
R228
G229
S230
S231
H232
H233
H234
H235
H236
H237
4.2.13 Score per residue for model 13
• Molecule 1: Major prion protein
Chain A:
G90
Q91
G92
G93
G94
T95
H96
S97
Q98
W99
N100
K101
P102
S103
K104
P105
K106
T107
N108
M109
K110
H111
M112
A113
G114
A115
A116
A117
A118
G119
A120
V121
V122
G123
G124
L125
G126
G127
Y128
D147
N153
R156
R164
P165
M166
D167
E168
Y169
S170
N171
Q172
Q186
T191
V203
R208
I215
T216
Q217
Y218
G229
S230
S231
H232
H233
H234
H235
H236
H237
Page 9 Full wwPDB NMR Structure Validation Report 2KUN
4.2.14 Score per residue for model 14
• Molecule 1: Major prion protein
Chain A:
G90
Q91
G92
G93
G94
T95
H96
S97
Q98
W99
N100
K101
P102
S103
K104
P105
K106
T107
N108
M109
K110
H111
M112
A113
G114
A115
A116
A117
A118
G119
A120
V121
V122
G123
G124
L125
G126
G127
Y128
M129
L130
R136
D147
N153
N159
R164
P165
M166
D167
E168
Y169
S170
N171
Q172
V203
I215
T216
Q217
Y218
Y225
G229
S230
S231
H232
H233
H234
H235
H236
H237
4.2.15 Score per residue for model 15
• Molecule 1: Major prion protein
Chain A:
G90
Q91
G92
G93
G94
T95
H96
S97
Q98
W99
N100
K101
P102
S103
K104
P105
K106
T107
N108
M109
K110
H111
M112
A113
G114
A115
A116
A117
A118
G119
A120
V121
V122
G123
G124
L125
G126
G127
Y128
M129
L130
D147
R148
N153
R156
R164
P165
M166
D167
E168
Y169
S170
N171
Q172
Q186
N197
V203
K204
R208
I215
T216
Q217
Y218
E219
R220
G229
S230
S231
H232
H233
H234
H235
H236
H237
4.2.16 Score per residue for model 16
• Molecule 1: Major prion protein
Chain A:
G90
Q91
G92
G93
G94
T95
H96
S97
Q98
W99
N100
K101
P102
S103
K104
P105
K106
T107
N108
M109
K110
H111
M112
A113
G114
A115
A116
A117
A118
G119
A120
V121
V122
G123
G124
L125
G126
G127
Y128
M129
L130
S135
S143
D147
R148
N153
R164
P165
M166
D167
E168
Y169
S170
N171
Q172
N181
T191
V203
I215
T216
Q217
Y218
G229
S230
S231
H232
H233
H234
H235
H236
H237
4.2.17 Score per residue for model 17
• Molecule 1: Major prion protein
Chain A:
G90
Q91
G92
G93
G94
T95
H96
S97
Q98
W99
N100
K101
P102
S103
K104
P105
K106
T107
N108
M109
K110
H111
M112
A113
G114
A115
A116
A117
A118
G119
A120
V121
V122
G123
G124
L125
G126
G127
Y128
D147
N153
N159
R164
P165
M166
D167
E168
Y169
S170
N171
Q172
T191
N197
V203
I215
T216
Q217
Y218
Y226
G229
S230
S231
H232
H233
H234
H235
H236
H237

Page 10 Full wwPDB NMR Structure Validation Report 2KUN
4.2.18 Score per residue for model 18
• Molecule 1: Major prion protein
Chain A:
G90
Q91
G92
G93
G94
T95
H96
S97
Q98
W99
N100
K101
P102
S103
K104
P105
K106
T107
N108
M109
K110
H111
M112
A113
G114
A115
A116
A117
A118
G119
A120
V121
V122
G123
G124
L125
G126
G127
Y128
M129
L130
D147
R148
N153
R164
P165
M166
D167
E168
Y169
S170
N171
Q172
N181
T191
V203
I215
T216
Q217
Y218
E219
R220
E221
S222
G229
S230
S231
H232
H233
H234
H235
H236
H237
4.2.19 Score per residue for model 19
• Molecule 1: Major prion protein
Chain A:
G90
Q91
G92
G93
G94
T95
H96
S97
Q98
W99
N100
K101
P102
S103
K104
P105
K106
T107
N108
M109
K110
H111
M112
A113
G114
A115
A116
A117
A118
G119
A120
V121
V122
G123
G124
L125
G126
G127
Y128
M129
L130
S143
N153
R156
R164
P165
M166
D167
E168
Y169
S170
N171
Q172
V176
H177
D178
Q186
N197
V203
I215
T216
Q217
Y218
G229
S230
S231
H232
H233
H234
H235
H236
H237
4.2.20 Score per residue for model 20
• Molecule 1: Major prion protein
Chain A:
G90
Q91
G92
G93
G94
T95
H96
S97
Q98
W99
N100
K101
P102
S103
K104
P105
K106
T107
N108
M109
K110
H111
M112
A113
G114
A115
A116
A117
A118
G119
A120
V121
V122
G123
G124
L125
G126
G127
Y128
M129
L130
R148
N153
R156
R164
P165
M166
D167
E168
Y169
S170
N171
Q172
T191
N197
K204
R208
I215
T216
Q217
Y218
R228
G229
S230
S231
H232
H233
H234
H235
H236
H237

Page 11 Full wwPDB NMR Structure Validation Report 2KUN
5 Refinement protocol and experimental data overview i○
The models were refined using the following method: torsion angle dynamics, simulated anneal-ing.
Of the 200 calculated structures, 20 were deposited, based on the following criterion: structureswith the lowest energy.
The following table shows the software used for structure solution, optimisation and refinement.
Software name Classification VersionCYANA structure solutionCNS structure solutionCNS refinement
The following table shows chemical shift validation statistics as aggregates over all chemical shiftfiles. Detailed validation can be found in section 7 of this report.
Chemical shift file(s) BMRB entry 16743Number of chemical shift lists 1Total number of shifts 1699Number of shifts mapped to atoms 1699Number of unparsed shifts 0Number of shifts with mapping errors 0Number of shifts with mapping warnings 0Assignment completeness (well-defined parts) 88%
No validations of the models with respect to experimental NMR restraints is performed at thistime.

Page 12 Full wwPDB NMR Structure Validation Report 2KUN
6 Model quality i○
6.1 Standard geometry i○
The Z score for a bond length (or angle) is the number of standard deviations the observed valueis removed from the expected value. A bond length (or angle) with |Z| > 5 is considered an outlierworth inspection. RMSZ is the (average) root-mean-square of all Z scores of the bond lengths (orangles).
Mol Chain Bond lengths Bond anglesRMSZ #Z>5 RMSZ #Z>5
1 A 0.76±0.10 0±0/766 (0.0±0.0%) 0.78±0.05 1±1/1036 (0.1±0.1%)All All 0.77 0/15320 (0.0%) 0.78 28/20720 (0.1%)
There are no bond-length outliers.
All unique angle outliers are listed below. They are sorted according to the Z-score of the worstoccurrence in the ensemble.
Mol Chain Res Type Atoms Z Observed(o) Ideal(o) ModelsWorst Total
1 A 151 ARG NE-CZ-NH1 10.55 125.58 120.30 12 41 A 148 ARG NE-CZ-NH1 7.26 123.93 120.30 4 51 A 136 ARG NE-CZ-NH1 5.80 123.20 120.30 14 21 A 208 ARG NE-CZ-NH1 5.72 123.16 120.30 13 61 A 220 ARG NE-CZ-NH1 5.67 123.14 120.30 12 51 A 156 ARG NE-CZ-NH1 5.65 123.12 120.30 11 51 A 151 ARG NE-CZ-NH2 -5.08 117.76 120.30 4 1
There are no chirality outliers.
There are no planarity outliers.
6.2 Too-close contacts i○
In the following table, the Non-H and H(model) columns list the number of non-hydrogen atomsand hydrogen atoms in each chain respectively. The H(added) column lists the number of hydrogenatoms added and optimized by MolProbity. The Clashes column lists the number of clashesaveraged over the ensemble.
Mol Chain Non-H H(model) H(added) Clashes1 A 748 707 703 0±0All All 14960 14140 14060 1
The all-atom clashscore is defined as the number of clashes found per 1000 atoms (including
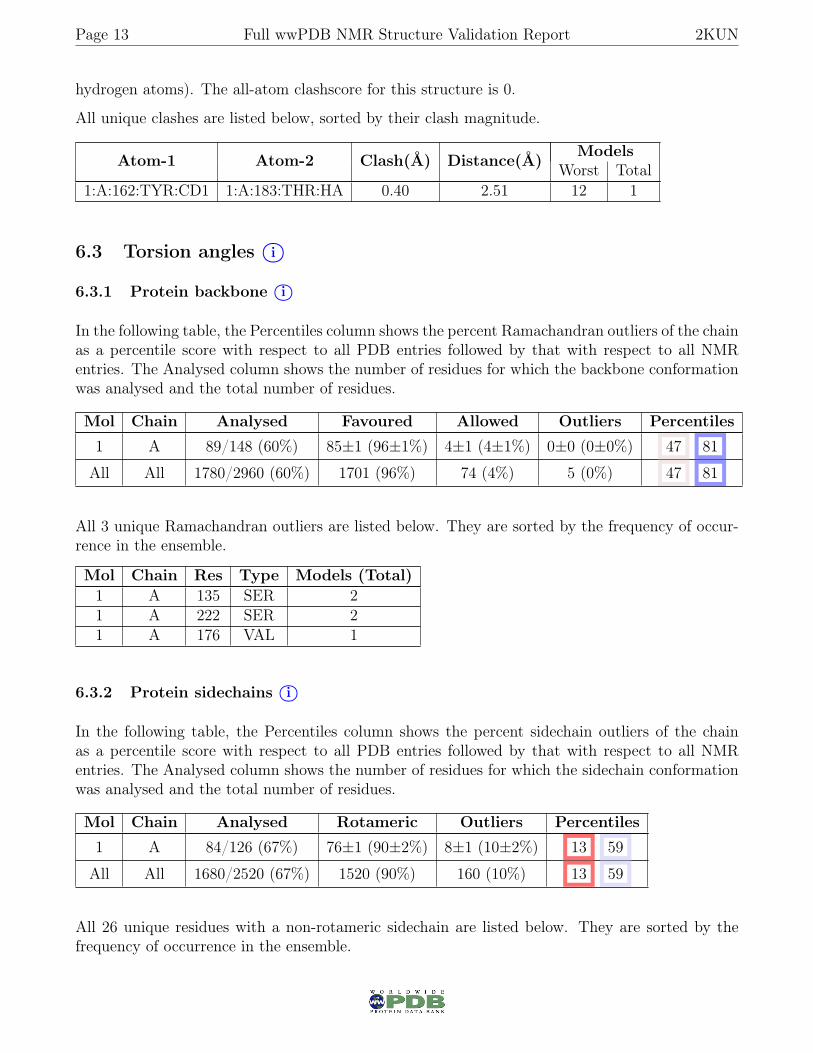
Page 13 Full wwPDB NMR Structure Validation Report 2KUN
hydrogen atoms). The all-atom clashscore for this structure is 0.
All unique clashes are listed below, sorted by their clash magnitude.
Atom-1 Atom-2 Clash(Å) Distance(Å) ModelsWorst Total
1:A:162:TYR:CD1 1:A:183:THR:HA 0.40 2.51 12 1
6.3 Torsion angles i○
6.3.1 Protein backbone i○
In the following table, the Percentiles column shows the percent Ramachandran outliers of the chainas a percentile score with respect to all PDB entries followed by that with respect to all NMRentries. The Analysed column shows the number of residues for which the backbone conformationwas analysed and the total number of residues.
Mol Chain Analysed Favoured Allowed Outliers Percentiles
1 A 89/148 (60%) 85±1 (96±1%) 4±1 (4±1%) 0±0 (0±0%) 47 81
All All 1780/2960 (60%) 1701 (96%) 74 (4%) 5 (0%) 47 81
All 3 unique Ramachandran outliers are listed below. They are sorted by the frequency of occur-rence in the ensemble.
Mol Chain Res Type Models (Total)1 A 135 SER 21 A 222 SER 21 A 176 VAL 1
6.3.2 Protein sidechains i○
In the following table, the Percentiles column shows the percent sidechain outliers of the chainas a percentile score with respect to all PDB entries followed by that with respect to all NMRentries. The Analysed column shows the number of residues for which the sidechain conformationwas analysed and the total number of residues.
Mol Chain Analysed Rotameric Outliers Percentiles
1 A 84/126 (67%) 76±1 (90±2%) 8±1 (10±2%) 13 59
All All 1680/2520 (67%) 1520 (90%) 160 (10%) 13 59
All 26 unique residues with a non-rotameric sidechain are listed below. They are sorted by thefrequency of occurrence in the ensemble.
Page 14 Full wwPDB NMR Structure Validation Report 2KUN
Mol Chain Res Type Models (Total)1 A 215 ILE 201 A 153 ASN 201 A 130 LEU 181 A 147 ASP 161 A 203 VAL 161 A 216 THR 101 A 197 ASN 91 A 191 THR 91 A 186 GLN 81 A 136 ARG 41 A 143 SER 31 A 181 ASN 31 A 222 SER 31 A 178 ASP 31 A 204 LYS 31 A 159 ASN 31 A 225 TYR 21 A 228 ARG 21 A 185 LYS 11 A 144 ASP 11 A 226 TYR 11 A 134 MET 11 A 161 VAL 11 A 220 ARG 11 A 156 ARG 11 A 148 ARG 1
6.3.3 RNA i○
There are no RNA molecules in this entry.
6.4 Non-standard residues in protein, DNA, RNA chains i○
There are no non-standard protein/DNA/RNA residues in this entry.
6.5 Carbohydrates i○
There are no carbohydrates in this entry.

Page 15 Full wwPDB NMR Structure Validation Report 2KUN
6.6 Ligand geometry i○
There are no ligands in this entry.
6.7 Other polymers i○
There are no such molecules in this entry.
6.8 Polymer linkage issues i○
There are no chain breaks in this entry.

Page 16 Full wwPDB NMR Structure Validation Report 2KUN
7 Chemical shift validation i○
The completeness of assignment taking into account all chemical shift lists is 88% for the well-defined parts and 84% for the entire structure.
7.1 Chemical shift list 1
File name: BMRB entry 16743
Chemical shift list name: assigned_chem_shift_list_1
7.1.1 Bookkeeping i○
The following table shows the results of parsing the chemical shift list and reports the number ofnuclei with statistically unusual chemical shifts.
Total number of shifts 1699Number of shifts mapped to atoms 1699Number of unparsed shifts 0Number of shifts with mapping errors 0Number of shifts with mapping warnings 0Number of shift outliers (ShiftChecker) 1
7.1.2 Chemical shift referencing i○
The following table shows the suggested chemical shift referencing corrections.
Nucleus # values Correction ± precision, ppm Suggested action13Cα 144 -0.15 ± 0.08 None needed (< 0.5 ppm)13Cβ 130 0.13 ± 0.09 None needed (< 0.5 ppm)13C′ 130 -0.22 ± 0.07 None needed (< 0.5 ppm)15N 132 -0.16 ± 0.15 None needed (< 0.5 ppm)
7.1.3 Completeness of resonance assignments i○
The following table shows the completeness of the chemical shift assignments for the well-definedregions of the structure. The overall completeness is 88%, i.e. 1019 atoms were assigned a chemicalshift out of a possible 1155. 8 out of 8 assigned methyl groups (LEU and VAL) were assignedstereospecifically.
Total 1H 13C 15NBackbone 429/439 (98%) 173/175 (99%) 171/178 (96%) 85/86 (99%)Sidechain 487/593 (82%) 306/350 (87%) 171/209 (82%) 10/34 (29%)
Continued on next page...
Page 17 Full wwPDB NMR Structure Validation Report 2KUN
Continued from previous page...Total 1H 13C 15N
Aromatic 103/123 (84%) 53/63 (84%) 50/52 (96%) 0/8 (0%)Overall 1019/1155 (88%) 532/588 (90%) 392/439 (89%) 95/128 (74%)
The following table shows the completeness of the chemical shift assignments for the full structure.The overall completeness is 84%, i.e. 1540 atoms were assigned a chemical shift out of a possible1829. 11 out of 11 assigned methyl groups (LEU and VAL) were assigned stereospecifically.
Total 1H 13C 15NBackbone 679/728 (93%) 273/290 (94%) 274/296 (93%) 132/142 (93%)Sidechain 717/878 (82%) 450/523 (86%) 253/307 (82%) 14/48 (29%)Aromatic 144/223 (65%) 74/113 (65%) 69/85 (81%) 1/25 (4%)Overall 1540/1829 (84%) 797/926 (86%) 596/688 (87%) 147/215 (68%)
7.1.4 Statistically unusual chemical shifts i○
The following table lists the statistically unusual chemical shifts. These are statistical measures,and large deviations from the mean do not necessarily imply incorrect assignments. Molecules con-taining paramagnetic centres or hemes are expected to give rise to anomalous chemical shifts.
Mol Chain Res Type Atom Shift, ppm Expected range, ppm Z-score1 A 156 ARG HG2 0.18 2.92 – 0.22 -5.1
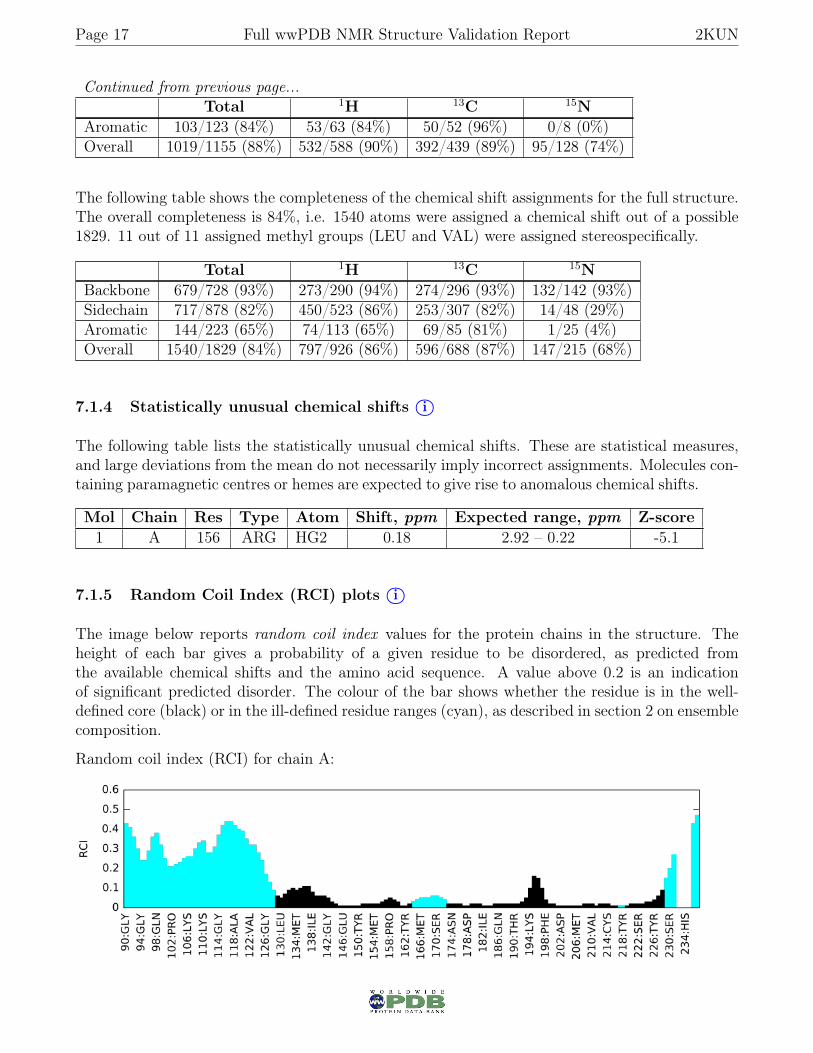
7.1.5 Random Coil Index (RCI) plots i○
The image below reports random coil index values for the protein chains in the structure. Theheight of each bar gives a probability of a given residue to be disordered, as predicted fromthe available chemical shifts and the amino acid sequence. A value above 0.2 is an indicationof significant predicted disorder. The colour of the bar shows whether the residue is in the well-defined core (black) or in the ill-defined residue ranges (cyan), as described in section 2 on ensemblecomposition.
Random coil index (RCI) for chain A:
Recommended