Fund Speak, March 2018
Refer page 3 for product labelling.
(An open ended equity linked saving scheme with a 3 years lock-in period)

Type of Scheme
Investment Objective
Fund Manager**
Allotment Date
Benchmark Index
Minimum InvestmentAmount
Systematic InvestmentPlan (SIP)
Load Structure
Plans Available
Options Available
MonthlyAverageAUM ( Cr.)`
as on February 28 ,2018th
Monthly Avg. ExpenseRatio( Statutory Levies)Includingas on February 28 , 2018
th
Product Labelling
Mirae AssetEmerging Bluechip Fund
Mirae Asset Prudence FundMirae Asset India Equity Fund*
An open ended equityoriented scheme
The investment objective of thescheme is to generate long termcapital appreciation by capitalizingon potential investmentopportunities through predominantlyinvesting in equities, equity relatedsecurities. There is no assurance orguarantee of returns
Mr. Neelesh Surana
Mr. Harshad Borawake(since May 2008) and
(sinceMay 01, 2017)
04 April, 2008th
S&P BSE 200 (TRI)
Entry load: NAExit load:If redeemed within 1 year (365 days) from the date of allotment: 1%If redeemed after 1 year (365 days) from the date of allotment: NIL
Regular Plan and Direct Plan
Growth Option and Dividend Option (Payout & Re-investment)
6,612.71
Regular Plan:Direct Plan:
2.37%1.60%
5,086.04
Regular Plan:Direct Plan:
2.24%1.68%
1,093.14
Regular Plan:Direct Plan: 0.98%
2.48%
To generate income and capitalappreciation from a diversified portfoliopredominantly investing in Indianequities and equity related securities ofcompanies which are not part of the top100 stocks by market capitalization andhave market capitalization of atleast100 Crores at the time of investment.
The Scheme does not guarantee orassure any returns
`
Mr. Neelesh Surana,(since inception of the fund)
09 July, 2010th
Nifty Free Float Midcap 100 (TRI)
The investment objective of the Scheme is togenerate capital appreciation along withcurrent income from a combined portfolio ofequity & equity related instruments and debtand money market instruments. The Schemedoes not guarantee or assure any returns.
Mr. Neelesh Surana& Mr. Sudhir Kedia
Mr. Mahendra Jajoo
()
(since April 01, 2017 .for Debt
portion - (since 8 September 2016)th
sinceInception
)
29 July, 2015th
CRISIL Hybrid 35+65 -Aggressive
Index@
An open ended equityfund
An Open Ended Equity OrientedAsset Allocation Scheme
`5,000/- and in multiples of 1/-thereafter. Minimum AdditionalApplication Amount: 1,000/-per application and in multiplesof 1/- thereafter.
`
`
`
Fresh lumpsum subscription/switch-into all the Plans & Options of MiraeAsset Emerging Bluechip Fundthrough any mode including StockExchange platform has beentemporarily suspended with effect fromOctober 25, 2016
`5,000/- and in multiples of 1/-thereafter. Minimum AdditionalApplication Amount: 1,000/-per application and in multiplesof 1/- thereafter.
`
`
`
Monthly and Quarterly:Minimum of .1000/-(multiples of . 1/- thereafter),minimum 5 installments.
`
`
Monthly : Minimum of .1000 (multiple of.1 thereafter) minimum 5 installments.
SIP shall be allowed maximum of upto
. 25,000/- per installment per PAN. SIPis available on 10th of each month. Witheffect from 15th December 2017.
For detail refer addendum datedNovember 30, 2017.
`
`
`
Monthly and Quarterly: Minimum of.1000/- (multiples of . 1/-
thereafter), minimum 5 installments.` `
This product is suitable for investorswho are seeking*:
• Capital appreciation along with currentincome over long term
• Investment predominantly in equitiesan equity related instruments withbalance exposure to debt and moneymarket investments
This product is suitable for investorswho are seeking*:
• Long - term capital appreciation
• predominantly investments in Indianequities and equity related securities ofcompanies which are not part of the top100 stocks by market capitalization
This product is suitable forinvestors who are seeking*:
• Long - term capitalappreciation
investments in equities,equityrelated securities
•
Investors understand that their principalwill be at moderately high risk
M
oderately
Lo
w
Hig
h
LowHigh
LOW HIGH
Moderately
Riskometer
*Investors should consult their financial advisers if they are not clear about the suitability of the product.
Key Features
Fund Speak 2
**For experience of Fund Managers refer page no.14
*Mirae Asset India Opportunities Fund was renamed as Mirae Asset India Equity Fund with effect from March 01, 2018@
CRISIL Balanced Fund Index has been renamed as CRISIL Hybrid 35+65 –Aggressive Index with effect from January 31, 2018.
FUND FACTS

Key Features
Type of Scheme
Investment Objective
Fund Manager**
Allotment Date
Benchmark Index
Minimum InvestmentAmount
Systematic InvestmentPlan (SIP)
Load Structure
Plans Available
Options Available
Monthly Average AUM ( Cr.)`
as on February 28 , 2018th
Monthly Avg. ExpenseRatio( )Including Statutory Leviesas on February 28 , 2018
th
Product Labelling
Mirae Asset Great Consumer Fund
An open-ended consumptionoriented sector scheme
The investment objective of the scheme is togenerate long term capital appreciation byinvesting in a portfolio of companies/funds thatare likely to benefit either directly or indirectlyfrom consumption led demand in India andacross the Asia Pacific region. The Schemedoes not guarantee or assure any returns.
Mr. Ankit Jain
Ms. BhartiSawant
(Domestic Investments)(since Oct 2016) and
(Overseas Investments)(since August 2014)
29 March, 2011th
S&P BSE 200 (65%) & S&PAsia Pacific Emerging BMI(35%) Index (TRI)
Monthly and : 1,000/- (multiplesof 1/- thereafter), minimum 5 installments
`
`
Quarterly
Entry load: NAExit load:If redeemed within 1 year (365 days) from thedate of allotment: 1%If redeemed after 1 year (365 days) from thedate of allotment: NIL
Regular Plan and Direct Plan
Growth Option and Dividend Option (Payout & Re-investment)
248.02
`5,000/- and in multiples of 1/-thereafter.Minimum Additional Application Amount:1,000/- per application and in multiples of1/- thereafter.
`
`
`
Riskometer
Fund Speak 3
*Investors should consult their financial advisers if they are not clear about the suitability of the product.
Investors understand that their principalwill be at high risk
M
oderately
Lo
w
Hig
h
LowHigh
LOW HIGH
Moderately
FUND FACTS
**For experience of Fund Managers refer page no.14
Mirae Asset Tax Saver Fund
An open ended equity linkedsaving scheme with a 3 yearlock-in period
The investment objective of thescheme is to generate long termcapital appreciation from a diversifiedportfolio of predominantly equity andequity related instruments. TheScheme does not guarantee orassure any returns.
Mr. Neelesh Surana(since Inception)
28 December, 2015th
S&P BSE 200 (TRI)
`500/- and in multiples of500/- thereafter`
Minimum installment of 500/-(monthly / quarterly frequency) andin multiples of 500/- thereafter.
`
`
Entry Load:NAExit Load: NIL
844.17
Regular Plan:Direct Plan:
2.52%1.39%
Regular Plan:Direct Plan:
2.73%1.63%
This product is suitable forinvestors who are seeking*:
• Growth of capital over longterm
• Investment predominantlyin equity and equity relatedinstruments
This product is suitable for investorswho are seeking*:
• Long-term Capital appreciation
• Investment in equity & equity relatedsecurities of companies benefitingdirectly or indirectly from consumptionled demand in india & across the Asiapacific region
Investors understand that their principalwill be at moderately high risk
M
oderately
Lo
w
Hig
h
LowHigh
LOW HIGH
Moderately

Key Features
Type of Scheme
Investment Objective
Fund Manager**
Allotment Date
Benchmark Index
Minimum InvestmentAmount
Systematic InvestmentPlan (SIP)
Load Structure
Plans Available
Options Available
Product Labelling
Monthly and Quarterly: 1,000/- (multiples of 1/- thereafter), minimum 5 installments` `
`5,000/- and in multiples of 1/-thereafter. MinimumAdditionalApplicationAmount: 1,000/- per application and in multiplesof 1/- thereafter.
` `
`
Riskometer
Fund Speak 4
*Investors should consult their financial advisers if they are not clear about the suitability of the product.
**For experience of Fund Managers refer page no. 14
Mirae Asset Dynamic Bond Fund
An open-ended income scheme
The objective of the Scheme is to generateop t ima l r e tu rns th rough ac t i vemanagement of a portfolio of debt andmoney market instruments. However,there is no assurance that the investmentobjective of the Scheme will be realizedand the Scheme does not assure orguarantee any returns.
Mr. Mahendra Kumar Jajoo -(since 24 March, 2017)
th
24 March, 2017th
CRISIL Composite Bond Fund Index
Entry Load: NAExit Load: If redeemed within 6 months(182 days) from the date of allotment –0.50% ;If redeemed after 6 months (182 days)from the date of allotment – Nil
Regular Plan and Direct Plan Regular Plan and Direct PlanRegular Savings Plan and Direct Plan
This product is suitable for investors whoare seeking*:
• Optimal returns over short to medium term
• To generate optimal returns through activemanagement of a portfolio of debt andmoney market instruments
Investors understand that their principalwill be at moderate risk
M
oderately
Lo
w
Hig
h
LowHigh
LOW HIGH
Moderately
Growth Option and Dividend Option (Payout & Re-investment)
FUND FACTS
Monthly Average AUM ( Cr.)`
as on February 28 , 2018th
Monthly Avg. ExpenseRatio( )Including Statutory Leviesas on February 28 , 2018
th
68.28
Regular Plan: 2.14%Direct Plan: 0.53%
Mirae Asset CashManagement Fund
The investment objective of the scheme isto generate consistent returns with a highlevel of liquidity in a judicious portfolio mixcomprising of money market and debtinstruments. The Scheme does notguarantee any returns.
An open ended Liquid scheme
Mr. Mahendra Jajoo -(since 8 September 2016)
th
12 January, 2009th
CRISILLiquid Fund Index
Entry Load NAExit Load Nil
::
Entry Load NAExit Load Nil
::
1,132.69
Regular Plan: 0.19%Direct Plan: 0.04%
This product is suitable for investors whoare seeking*:
• Optimal returns over short term• Investment in portfolio of short duration
money market and debt instruments
Investors understand that their principalwill be at low risk
M
oderately
Lo
w
Hig
h
LowHigh
LOW HIGH
Moderately
395.20
Regular Savings Plan: 0.90%Direct Plan: 0.23%
This product is suitable forinvestors who are seeking*:
• Optimal returns over medium term
• Investment in a portfolio of debtand money market instruments
Investors understand that their principalwill be at moderately low risk
M
oderately
Lo
w
Hig
h
LowHigh
LOW HIGH
Moderately
Mirae Asset Savings Fund
An open ended debt scheme
The investment objective of the scheme isto seek to generate returns with lowvolatility and higher liquidity through aportfolio of debt and money marketinstruments. The Scheme does notguarantee any returns.
Mr. Mahendra Jajoo -(since 8 September 2016)
th
5 March, 2008th
CRISILLiquid Fund Index

11,80,000 8,40,000 6,00,000 3,60,000 1,20,000
31,90,577 16,76,903 9,84,043 4,66,735 1,28,126
19.26 19.42 19.91 17.66 12.91
14.12 15.09 15.75 15.72 14.04
12.59 13.06 13.11 13.94 15.28
SIP Investment Since Inception 3 Years5 Years
SIP Performance
1 Year
Total Amount Invested
Fund Return* (%)
Benchmark Return* (%)
Add. Benchmark Return* (%)
Mkt Value as of 28 February, 2018th
7 Years
18.23%
2.78%
3.68%
3.92%
5.10%
5.20%
6.59%
7.29%
8.59%
9.43%
27.27%
0% 10% 20% 30% 40%
Other Sectors
Gas
Cement
Pharmaceuticals
Petrol Products
Const Project
Finance
Auto
Cons. N-Durables
Software
BanksEquity Shares
Equity Holding Total 98.08%
Cash & Other Receivables 1.92%
Total 100.00%
HDFC Bank Ltd 8.61%
Infosys Ltd 5.44%
ICICI Bank Ltd 5.23%
HDFC Ltd 4.29%
Larsen & Toubro Ltd 3.98%
State Bank of India 3.42%
Reliance Industries Ltd 3.30%
ITC Ltd 3.26%
Grasim Industries Ltd 3.16%
Kotak Mahindra Bank Ltd 3.01%
Other Equities 54.38%
^Industrywise classification as recommended by AMFI
Allocation - Top 10 Sectors^Portfolio Top 10 holdings
Past Performance may or may not be sustained in future. * Since inception of the fund.
MAIEF S&P BSE 200 (TRI) S&P BSE SENSEX (TRI)
Abs
olut
e R
etur
n
Direct Plan Regular Plan
Growth Option
Dividend Option
` `
` `
49.041 46.930
36.521 20.282
Net Asset Value (NAV)
Fund Information
Fund Manager
Benchmark Index
Net AUM ( Cr.)
Entry load
Exit load
Plans Available
Mr. Neelesh Surana &
S&P BSE 200
6,769.71
NA
If redeemed within 1 year (365 days) from the date ofallotment: 1%
If redeemed after 1 year (365 days) from the date ofallotment: NIL
Regular and Direct Plan
Allotment Date 4 April, 2008th
`
Mr. Harshad Borawake
Ratios (Annualised)@
Volatility 14.04%
Beta 0.98
R Squared 0.95
Sharpe Ratio # 0.47
Information Ratio 0.99
Portfolio Turnover Ratio^ 0.36 times
@ Please refer last page for details.
Dividend History
Record DateDividend
(`)Face
Value (`)Cum
NAV (`)10-Dec-10 1.50 per Unit 10 13.978
22-Mar-12 1.50 per Unit 10 13.376
14-Mar-13 1.40 per unit 10 13.559
27-Jan-14 1.20 per unit 10 13.196
13-Feb-15 1.60 per unit 10 19.709
11-Mar-16 1.35 per Unit 10 16.616
26-Jul-16 1.50 per Unit 10 17.922
24-Jul-17 1.70 per Unit 10 19.049
Fund Performance
Fund Speak 5
Past Performance may or may not sustained in future.Pursuant to payment of dividend the NAV of the dividendoption of the scheme will fall to the extent of payout andstatutory levy (if applicable).
Dividend history is for MAIEF - Regular Plan - DividendOption
Monthly Average Expense Ratio
Regular Plan
Direct Plan
2.37%
1.60%
Minimum Investment Amount
`
`
`
5,000/- and in multiples of 1/- thereafter.
Minimum Additional Application Amount: 1,000/- perapplication and in multiples of 1/- thereafter.
`
% Allocation
Note:1. Different Plans under the scheme has different expense structure. The reference and details provided herein are
of Regular Plan - Growth Option2. Fund manager : Mr. Neelesh Surana (since May, 2008) and (since May 01, 2017)
^Mr. Harshad Borawake
Performance Report
PeriodMAIEF Scheme Benchmark* Additional Benchmark**
Last 1 year
Last 3 years
Last 5 years
Since Inception
4 April, 2008th
22.13 20.55 20.46
12.59 9.36 6.86
21.54 16.38 14.28
16.88 10.87 10.01
46,930 27,811 25,740
Index Value ( )28 February, 2018th
Date of allotment
Scheme Benchmark
NAV as on 28 February, 2018th 46.93
*S&P BSE 200 (TRI)
** (TRI)S&P BSE Sensex
Returns (%)
Additional Benchmark
Value of Rs. 10000 invested(in Rs.) Since Inception
CY 2008 CY2009 CY 2010 CY 2011 CY 2012 CY 2013 CY 2014 CY 2015 CY 2016 CY 2017 YTD 2018
Index Value of S&P BSE 200 is 5370.34 and S&P BSE Sensex is 48772.48(TRI) (TRI)
-60%
-33%
109%
23%
-20%
33%
9%
53%
4% 8%
39%
-3%
-38%
91%
18%
-27%
33%
6%
37%
0%
5%
35%
-2%
-36%
83%
19%
-25%
28%
11%
32%
-4%
3%
30%
0%
-40%
-20%
0%
20%
40%
60%
80%
100%
120%
Past Performance may or may not sustained in future.
Note
*MiraeAsset India Opportunities Fund was renamed as MiraeAsset India Equity Fund with effect from March 01, 2018
: For computation of since inception returns (%) the allotment NAV has been taken as 10.00. The performance of other funds managed by the same fund managers are given
in the respective page of the schemes and on page No.13.
`
*The SIP returns are calculated by XIRR approach assuming investment of 10,000/- on the 1st working day of every month.
MIRAE ASSETINDIA EQUITY FUND - (MAIEF)*(An open ended equity oriented scheme)
Monthly Factsheet as on February 2018

Equity Shares
Equity Holding Total 99.37%
Cash & Other Receivables 0.63%
Total 100.00%
Tata Global Beverages Ltd 3.76%
Kotak Mahindra Bank Ltd 3.56%
ICICI Bank Ltd 3.51%
Raymond Ltd 3.27%
HDFC Bank Ltd 3.06%
Voltas Ltd 2.91%
Info Edge (India) Ltd 2.89%
The Federal Bank Ltd 2.87%
Havells India Ltd 2.84%
Infosys Ltd 2.83%
Other Equities 67.87%
^Industrywise classification as recommended by AMFI
Allocation - Top 10 Sectors^Portfolio Top 10 holdings
Direct Plan Regular Plan
Growth Option
Dividend Option
`
` `
`52.326 49.909
47.711 29.953
Net Asset Value (NAV)
Fund Information
Fund Manager
Allotment Date
Benchmark Index
Net AUM ( Cr.)
Entry load
Exit load
Plans Available
Mr. Neelesh Surana
9 July, 2010
Nifty Free Float Midcap 100
5,128.35
NA
If redeemed within 1 year (365 days) from the date ofallotment: 1%
If redeemed after 1 year (365 days) from the date ofallotment: NIL
Regular and Direct Plan
th
`
Ratios (Annualised)@
Volatility 14.54%
Beta 0.86
R Squared 0.90
Sharpe Ratio # 0.92
Information Ratio 0.72
Portfolio Turnover Ratio^ 0.72 times
@ Please refer last page for details.
Dividend History
Record DateDividend
(`)Face
Value (`)Cum
NAV (`)18-Mar-14 1.20 per Unit 10 14.959
08-Dec-14 1.80 per Unit 10 22.991
05-Jan-16 2.00 per Unit 10 24.495
20-Jul-16 2.00 per Unit 10 24.292
24-Jul-17 2.50 per Unit 10 28.233
Fund Performance
Fund Speak 6
MIRAE ASSETEMERGING BLUECHIP FUND - (MAEBF)(An open ended equity fund)
Monthly Factsheet as on February 2018
Past Performance may or may not sustained in future. Pursuantto payment of dividend the NAV of the dividend option of thescheme will fall to the extent of payout and statutory levy (ifapplicable).
Dividend history is for MAEBF - Regular Plan - Dividend Option
Monthly Average Expense Ratio
Regular Plan
Direct Plan
2.24%
1.68%
Minimum Investment Amount
Please note the below changes are with effect fromDecember 15, 2017
1.All Systematic Transfer Plan (STP) / MiraeAsset VariableTransfer Plan (VTP) / Mirae Asset Trigger Investment Plan(TRIP) / Mirae Asset Group Investment Plan (GRIP)applications for all designated modes and frequencies willget in to suspension till further Notice.
2. Fresh Registration through Systematic Investment Plan(SIP) shall be allowed for a maximum of upto . 25,000/- pereach installment through Monthly mode for SIP Date of 10thof each month before the cut off time of 15:00 hours on anybusiness day. Further, the said limit of . 25,000/- throughSIP shall be applicable at primary PAN level for eachapplication.
3.Any change of plan or option within MAEBF scheme fromRegular Plan to Direct Plan or Growth Option to DividendOption and vice versa shall be allowed, subject toapplicable loads and levies.
`
`
Past Performance may or may not be sustained in future. * Since inception of the fund.
MAEBF Nifty Free Float Midcap 100 (TRI) S&P BSE SENSEX (TRI)
-40%-24%
-15%
-4% -6%-7%
13%
46%
58%
85%
14% 12%
49%
7%
-30%
42% 36%
58%
8% 8%
49%
16%27%
42%
32%
3%
30%
0%
-20%
0%
20%
40%
60%
80%
100%
Abs
olut
e R
etur
n
% Allocation
For detail refer addendum dated November 30, 2017.
Note:1. Different Plans under the scheme has different expense structure. The reference and details provided herein are
of Regular Plan - Growth Option2. Fund manager : Mr. Neelesh Surana managing the scheme since 9 July, 2010.
th
Performance Report
PeriodMAEBF Scheme Benchmark* Additional Benchmark**
Last 1 year
Last 3 years
Last 5 years
Since Inception
9 July, 2010th
22.83 20.80 20.46
19.44 15.83 6.86
31.15 22.66 14.28
23.40 13.39 10.46
49,909 26,140 21,396
Index Value ( )28 February, 2018th
Date of allotment
Index Value of is 25008.10 and S&P BSE Sensex is 48772.48Scheme benchmark (TRI)
Scheme Benchmark
NAV as on 28 February, 2018th 49.91
*Nifty Free Float Midcap 100 (TRI)
**S&P BSE Sensex (TRI)
Returns (%)
Additional Benchmark
Value of Rs. 10000 invested(in Rs.) Since Inception
CY 2010 CY 2011 CY 2012 CY 2013 CY 2014 CY 2015 CY 2016 CY 2017 YTD 2018
27.46%
3.87%
3.88%
5.02%
5.54%
5.72%
5.83%
6.25%
6.71%
9.15%
19.94%
0% 10% 20% 30% 40%
Other Sectors
Gas
Cement
Chemicals
Textile Products
Software
Finance
Auto Ancillaries
Pharmaceuticals
Cons. N-Durables
Banks
9,20,000 8,40,000 6,00,000 3,60,000 1,20,000
25,84,435 22,61,819 12,16,355 4,99,631 1,27,063
27.02 28.05 29.01 22.92% 11.75
18.85 20.26 22.54 20.30% 12.43
12.51 13.16 13.20 14.51% 16.38
SIP Investment Since Inception 3 Years5 Years
SIP Performance
1 Year
Total Amount Invested
Fund Return* (%)
Benchmark Return* (%)
Add. Benchmark Return* (%)
Mkt Value as of 28 February, 2018th
7 Years
Past Performance may or may not sustained in future.Note : For computation of since inception returns (%) the allotment NAV has been taken as 10.00. The performance of
other funds managed by the same fund managers are given in the respective page of the schemes and on page No.13 .
`
*The SIPreturns are calculated by XIRR approach
assuming investment of 10,000/- on the 10th working day of every month.

3,100,00 1,20,000
37,6353 12,6192
15.25 9.80
13.42 9.25
15.97 15.28
SIP Investment Since Inception 1 Year
SIP Performance
Total Amount Invested
Fund Return* (%)
Benchmark Return* (%)
Add. Benchmark Return** (%)
Mkt Value as of 28 February, 2018th
^Industrywise classification as recommended by AMFI
Equity Allocation - Top 10 Sectors^
Overall Asset Allocation
Direct Plan Regular Plan
Growth Option
Dividend Option
`
` `
`14.213 13.550
13.161 12.560
Net Asset Value (NAV)
Fund Information
Fund Managers
Allotment Date
Benchmark Index
Net AUM ( Cr.)
Entry load
Exit load
Plans Available
Mr. Neelesh Surana &Mr. Sudhir Kedia(Equity Portion) & Mr.Mahendra Jajoo (DebtPortion)
29 July, 2015
1,108.88
NA
If redeemed within 1 year (365 days) from the date ofallotment: 1%
If redeemed after 1 year (365 days) from the date ofallotment: NIL
Regular and Direct Plan
th
CRISIL Hybrid 35+65 -Aggressive Index
@
`
Quantitative Data: Debt Portion
Weighted Average Maturity 6.17 Years
Modified Duration 4.13
Yield to Maturity 7.34%
Years
4.45 YearsMacaulay Duration
Fund Speak 7
Monthly Average Expense Ratio
Regular Plan
Direct Plan
2.48%
0.98%
Minimum Investment Amount
` `
`
`
5,000/- and in multiples of 1/-thereafter.Minimum Additional Application Amount: 1,000/- perapplication and in multiples of 1/- thereafter.
Portfolio Top 10 holdings
Ratios (Annualised)
Portfolio Turnover Ratio^ 2.10 times
Please refer last page for details.^
Dividend History
Record DateDividend
(`)Face
Value (`)Cum
NAV (`)17-Apr-17 0.25 per Unit 10 11.925
17-Jul-17 0.25 per Unit 10 12.215
06-Nov-17 0.20 per Unit 10 12.720
Past Performance may or may not sustained in future.Pursuant to payment of dividend the NAV of the dividendoption of the scheme will fall to the extent of payout andstatutory levy (if applicable).
Dividend history is for MAPF - Regular Plan - DividendOption
Equity Shares
Equity Holding Total 75.45%
Government Bond
Government Bond Total 9.28%
Corporate Bond
Corporate Bond Total 4.65%
Commercial Paper
Commercial Paper Total 4.01%
Certificate of Deposit
Certificate of Deposit Total 2.25%
Margin Fixed Deposit
Margin Fixed Deposit Total 0.05%
Cash & Other Receivables 4.31%
Total 100.00%
HDFC Bank Ltd 8.03%
Infosys Ltd 4.46%
ICICI Bank Ltd 4.05%
HDFC Ltd 3.55%
ITC Ltd 3.50%
Reliance Industries Ltd 3.06%
Larsen & Toubro Ltd 2.72%
Kotak Mahindra Bank Ltd 2.54%
State Bank of India 2.53%
Grasim Industries Ltd 2.49%
Other Equities 38.52%
7.17% GOI (08/01/2028) 4.55%
6.68% GOI (17/09/2031) 3.83%
7.72% GOI (25/05/2025) 0.90%
8.87% EXIM Bank (10/10/2022) 0.93%
7.27% Power Fin Corp Ltd (22/12/2021) 0.88%
8.88% EXIM Bank (18/10/2022) 0.47%
7.18% NABARD (23/03/2020) 0.45%
8.05% NTPC Ltd (05/05/2026) 0.44%
7.28% Power Fin Corp (10/06/2022) 0.44%
7.45% LIC Hsg Fin Ltd (17/10/2022) 0.43%
7.42% LIC Hsg Fin Ltd (15/07/2022) 0.43%
7.14% RECL Ltd (09/12/2021) 0.09%
7.17% NHAI (23/12/2021) 0.09%
National Bank For Agri & Rural (01/03/2018) 2.25%
JM Financial Products Ltd (07/06/2018) 1.76%
National Bank For Agri & Rural (02/03/2018) 2.25%
5.75% HDFC Bank Ltd (21/05/2018) 0.05%
% Allocation
Note:1. Different Plans under the scheme has different expense structure. The reference and details provided herein are ofRegular Plan - Growth Option2. Mr. Neelesh Surana (Equity Portion) (since 29 July, 2015), Mr. Sudhir Kedia co - managed the equity portion(since April 01, 2017) & Mr. Mahendra Jajoo (Debt Portion) (since 8 September, 2016)
3.
th
th
The scheme is in existence for more than 1 year and less than 3 years.
Performance Report
PeriodMAPF Scheme Benchmark* Additional Benchmark**
Last 1 year
Since Inception
29 July, 2015th
16.61 14.71 20.46
12.45 10.86 10.00
13,550 13,059 12,800
Index Value ( )28 February, 2018th
Date of allotment
Index Value of is 8665.15 and S&P BSE Sensex is 48772.48Scheme benchmark (TRI)
Scheme Benchmark
NAV as on 28 February, 2018th
*CRISIL Hybrid 35+65 -Aggressive Index@
** (TRI)S&P BSE Sensex
Returns (%)
Additional Benchmark
Value of Rs. 10000 invested(in Rs.) Since Inception
Debt HoldingsEquity Holdings
Cash & Other Receivables
13.55
12.76%
2.18%
2.49%
2.90%
3.19%
4.64%
4.66%
6.97%
7.76%
8.20%
19.70%
0% 10% 20% 30% 40%
Other Sectors
Gas
Cement
Const Project
Pharmaceuticals
Auto
Petrol Products
Finance
Cons. N-Durables
Software
Banks
75.45%
20.24%
4.3
1%
Past Performance may or may not sustained in future.
NoteCRISILBalanced Fund Index has been renamed as CRISILHybrid 35+65 –Aggressive Index with effect from January 31, 2018.
: For computation of since inception returns (%) the allotment NAV has been taken as 10.00. The performance of other funds managed by the same fund managers aregiven in the respective page of the schemes and on page No.13 & 14.
@
`
*The SIPreturns are calculated by XIRR approach assuming investment of 10,000/- on the 1st workingday of every month.
MIRAE ASSETPRUDENCE FUND - (MAPF)
Monthly Factsheet as on February 2018
( )An Open Ended Equity Oriented Asset Allocation Scheme

2,600,00 1,20,000
3,418,85 1,30,276
26.51 16.41
18.88 14.04
17.61 15.28
SIP Investment Since Inception 1 Year
SIP Performance
Total Amount Invested
Fund Return* (%)
Benchmark Return* (%)
Add. Benchmark Return* (%)
Mkt Value as of 28 February, 2018th
^Industrywise classification as recommended by AMFI
Allocation - Top 10 Sectors^
Overall Asset Allocation
Direct Plan Regular Plan
Growth Option
Dividend Option
`
` `
`16.917 16.409
16.242 15.722
Net Asset Value (NAV)
Fund Information
Fund Managers
Allotment Date
Benchmark Index
Net AUM ( Cr.)
Entry load
Exit load
Plans Available
Mr. Neelesh Surana
28 December, 2015
S&P BSE 200
862.90
NA
Regular and Direct Plan
th
`
NA
Fund Speak 8
MIRAE ASSETTAX SAVER FUND - (MATSF)( )An open ended equity linked saving scheme with a 3 year lock-in period
Monthly Factsheet as on February 2018
Monthly Average Expense Ratio
Regular Plan
Direct Plan
2.52%
1.39%
Minimum Investment Amount
` `500/- and in multiples of 500/- thereafter
Portfolio Top 10 holdings
Ratios (Annualised)
Portfolio Turnover Ratio^ 0.73 times
Please refer last page for details.^
Equity Shares
Equity Holding Total 99.09%
Cash & Other Receivables 0.91%
Total 100.00%
HDFC Bank Ltd 7.61%
ICICI Bank Ltd 5.35%
Infosys Ltd 5.07%
IndusInd Bank Ltd 3.49%
Tata Global Beverages Ltd 3.37%
Larsen & Toubro Ltd 3.30%
Kotak Mahindra Bank Ltd 3.27%
Grasim Industries Ltd 3.21%
State Bank of India 3.14%
Raymond Ltd 2.97%
Other Equities 58.31%
Equity Holdings Cash & Other Receivables
% Allocation
Note:1. Different Plans under the scheme has different expense structure. The reference and detailsprovided herein are of Regular Plan - Growth Option2. Fund manager : Mr. Neelesh Surana managing the scheme since 28 December, 2015
th
3. The scheme is in existence for more than 1 year and less than 3 years.
Dividend History
Record DateDividend
(`)Face
Value (`)Cum
NAV (`)23-Mar-17 0.55 per Unit 10 13.275
Past Performance may or may not sustained in future.Pursuant to payment of dividend the NAV of the dividendoption of the scheme will fall to the extent of payout andstatutory levy (if applicable).
Dividend history is for MATSF - Regular Plan - DividendOption
Performance Report
PeriodMATSF Scheme Benchmark* Additional Benchmark**
Last 1 year
Since Inception
28 December, 2015th
27.19 20.55 20.46
25.60 16.91 14.85
16,409 14,043 13,510
Index Value ( )28 February, 2018th
Date of allotment
Index Value of S&P BSE 200 is 5370.34 and S&P BSE Sensex is 48772.48(TRI) (TRI)
Scheme Benchmark
NAV as on 28 February, 2018th 16.41
*S&P BSE 200 (TRI)
**S&P BSE Sensex (TRI)
Returns (%)
Additional Benchmark
Value of Rs. 10000 invested(in Rs.) Since Inception
99.09%
0.91%
23.17%
2.99%
3.21%
3.28%
4.92%
4.98%
5.55%
6.25%
8.51%
9.01%
27.22%
0% 10% 20% 30% 40%
Other Sectors
Consumer Durables
Cement
Finance
Const Project
Auto Ancillaries
Pharmaceuticals
Auto
Software
Cons. N-Durables
Banks
Past Performance may or may not sustained in future.Note: For computation of since inception returns (%) the allotment NAV has been taken as 10.00. The performance of
other funds managed by the same fund managers are given in the respective page of the schemes and on page No.13 .
`
*The SIPreturns are calculated by XIRR approach
assuming investment of 10,000/- on the 1st working day of every month.

83,000 60,000 36,000 12,000
16,67,683 99,0563 48,5459 13,3261
19.86 20.19 20.47 21.31
15.72 15.92 16.32 21.78
13.12 13.11 13.94 15.28
SIP Investment Since Inception 3 Years5 Years
SIP Performance
1 Year
Total Amount Invested
Fund Return* (%)
Benchmark Return* (%)
Add. Benchmark Return* (%)
Mkt Value as of 28 February, 2018th
^Industrywise classification as recommended by AMFI
Allocation - Top Holdings^
Direct Plan Regular Plan
Growth Option
Dividend Option
`
` `
`34.617 32.494
34.366 17.589
Net Asset Value (NAV)
Fund Information
FundManagers
Allotment Date
Benchmark Index
Net AUM ( Cr.)
Entry load
Exit load
Plans Available
Mr. Ankit Jain andMs. Bharti Sawant
29 March, 2011
S&P BSE 200 (65%)& S&P Asia PacificEmerging BMI (35%)Index (TRI)
261.00
NA
Regular and Direct Plan
th
`
If redeemed within 1 year (365 days) from the date ofallotment: 1%
If redeemed after 1 year (365 days) from the date ofallotment: NIL
Fund Speak 9
MIRAE ASSETGREAT CONSUMER FUND - (MAGCF)( )An open-ended consumption oriented sector scheme
Monthly Factsheet as on February 2018
Portfolio Top 10 holdings
Monthly Average Expense Ratio
Regular Plan
Direct Plan
2.73%
1.63%
Minimum Investment Amount
` `
`
`
5,000/- and in multiples of 1/-thereafter.Minimum Additional Application Amount: 1,000/- perapplication and in multiples of 1/- thereafter.
Equity Shares
Equity Holding Total 89.38%
Cash & Other Receivables 10.62%
Total 100.00%
HDFC Bank Ltd 7.72%
ITC Ltd 4.47%
ICICI Bank Ltd 3.83%
Tata Global Beverages Ltd 3.48%
Bajaj Auto Ltd 3.47%
Grasim Industries Ltd 3.31%
IndusInd Bank Ltd 3.28%
Havells India Ltd 3.21%
Khadim India Ltd 2.96%
GlaxoSmithKline Consumer Healthcare Ltd 2.95%
Other Equities 50.70%
Ratios (Annualised)@
Volatility 13.95%
Beta 0.95
R Squared 0.69
Sharpe Ratio# 0.53
Portfolio Turnover Ratio^ 0.45 times
@ Please refer last page for details.
Dividend History
Record DateDividend
(`)Face
Value (`)Cum
NAV (`)25-Jan-16 1.50 per Unit 10 14.494
22-Mar-17 2.00 per Unit 10 16.376
27-Jun-17 0.50 per Unit 10 16.365
0.50 per Unit17-Oct-17 10 16.940
Past Performance may or may not sustained in future.Pursuant to payment of dividend the NAV of the dividendoption of the scheme will fall to the extent of payout andstatutory levy (if applicable). Dividend history is forMAGCF - Regular Plan - Dividend Option
Domestic Equities Sectoral Allocation^(Top 10 holdings)
% Allocation
Note:
1. Different Plans under the scheme has different expense structure. The reference and details provided herein are ofRegular Plan - Growth Option
2. Fund manager : Mr. Ankit Jain managing the scheme since October, 2016 and Ms. Bharti Sawant managing thescheme since August, 2014.
Performance Report
PeriodMAGCF Scheme Benchmark* Additional Benchmark**
Last 1 year
Last 3 years
Last 5 years
Since Inception
29 March, 2011th
31.93 21.51 20.46
13.41 10.05 6.86
20.87 13.66 14.28
20.30 16.50 10.40
32,494 28,778 19,837
Index Value ( )28 February, 2018th
Date of allotment
Index Value of benchmark is and Index value of S&PBSE Sensex is 48772.48290.52 (TRI)
Scheme Benchmark
NAV as on 28 February, 2018th 32.49
*S&P BSE 200 (65%) & S&P Asia Pacific Emerging BMI (35%) Index (TRI)
**S&P BSE Sensex (TRI)
Returns (%)
Additional Benchmark
Value of Rs. 10000 invested(in Rs.) Since Inception
6.28%
2.22%
2.60%
2.93%
3.78%
4.09%
6.20%
6.65%
8.30%
22.23%
24.10%
0% 10% 20% 30% 40%
Other Sectors
Const Project
Software
Textile Products
Finance
Cement
Consumer Durables
Auto Ancillaries
Auto
Banks
Cons. N-Durables
Past Performance may or may not sustained in future. Note: For computation of since inception returns (%) the allotment NAV has been taken as 10.00. The performance of
other funds managed by the same fund managers are given in the respective page of the schemes and on page No.13.
`
*The SIP returns are calculated by XIRR approach
assuming investment of 10,000/- on the 1st working day of every month.

104.54%
2.33%2.31%
-9.18%
Direct Plan Regular Plan
Growth Option
Dividend Monthly Option
`
` `
`1,821.6029 1,803.3038
1,152.71101,135.0769
Net Asset Value (NAV)
Fund Information
Fund Manager
Allotment Date
Benchmark Index
Net AUM ( Cr.)
Entry load
Exit load
Plans Available
Mr. Mahendra Jajoo
12 January, 2009
Crisil Liquid Fund Index
1,075.21
NA
Nil
Regular and Direct Plan
th
`
Fund Speak 10
MIRAE ASSETCASH MANAGEMENT FUND - (MACMF)( )An open ended liquid scheme) CRISIL AAAmfs Rated ~
Monthly Factsheet as on February 2018
Portfolio holdings
Past Performance may or may not sustained in future. For computation of since inception returns (%) the allotment NAV has been taken as 1000.00. Returns (%) for less than
1 year calculated on simple annualized basis. The performance of other funds managed by the same fund managers are given in the respective page of the schemes and on
pageNo. 14.
`
Monthly Average Expense Ratio
Regular Plan
Direct Plan
0.19%
0.04%
Minimum Investment Amount
` `
`
`
5,000/- and in multiples of 1/- thereafter.Minimum Additional Application Amount: 1,000/- perapplication and in multiples of 1/- thereafter.
Quantitative Data
Weighted Average Maturity 31.69 Days
Modified Duration 0.09 Years
Yield to Maturity 7.80%
Macaulay Duration 0.09 Years
Dividend History
Face value 1000/-.
Past Performance may or may not sustained in future.Pursuant to payment of dividend the NAV of the dividendoption of the scheme will fall to the extent of payout andstatutory levy (if applicable).
Dividend history is for MACMF - Regular Plan - MonthlyDividend Option
`
Record DateDividend ( )` Per Unit Cum
NAV ( )`
26-Dec-17 4.6677 4.3245 1,158.7654
24-Jan-18 4.3493 4.0295 1,158.3245
26-Feb-18 4.8998 4.5395 1,159.0867
Individual Corporate
Allocation
Rating Profile
A1+ AAA SOV
% Allocation
Note:1. Different Plans under the scheme has different expense structure. The reference and details provided herein are
of Regular Plan - Growth Option.2. Fund manager : Mr. Mahendra Jajoo managing the scheme since 8 .
thSeptember, 2016
Performance Report
PeriodMACMF Scheme Benchmark* Additional Benchmark**
Last 7 days
Last 15 days
Last 30 days
Last 1 year
Last 3 years
Last 5 years
Since Inception
12 January, 2009th
6.68 7.07 4.03
6.75 7.12 3.63
6.96 7.45 5.44
6.64 6.68 5.65
7.13 7.38 6.98
7.66 8.08 7.05
6.67 7.44 6.17
18,033 19,256 17,277
Index Value ( )28 February, 2018th
Date of allotment
Index Value of benchmark is 2849.10 and Crisil 1 Year T-Bill is 5012.48
Scheme Benchmark
Additional Benchmark
NAV as on 28 February, 2018th 1803.30
*CRISIL Liquid Fund Index
**Crisil 1 Year T-Bill
Returns (%)
Value of Rs. 10000 invested(in Rs.) Since Inception
Cash & Other Receivables
Commercial Paper
Corporate Bond
Certificate of Deposit
Treasury Bill
Cash & Other Receivables
Commercial Paper
National Bank For Agri & Rural (05/03/2018) 6.97%
Small Ind Dev Bank of India (01/03/2018) 4.65%
Steel Authority of India Ltd (16/03/2018) 4.64%
Dewan Housing Fin Corpn Ltd (15/03/2018) 4.64%
India Infoline Finance Ltd (28/03/2018) 4.63%
Blue Star Ltd (23/03/2018) 4.63%
Aditya Birla Finance Ltd (26/03/2018) 4.63%
Reliance Jio Infocomm Ltd (06/04/2018) 4.62%
Vedanta Limited (25/04/2018) 4.60%
Reliance Jio Infocomm Ltd (30/05/2018) 4.57%
National Bank For Agri & Rural (01/03/2018) 2.33%
HDB Financial Services Ltd (20/03/2018) 2.32%
HUDCO Ltd (23/03/2018) 2.32%
Rural Electrification Corp Ltd (20/03/2018) 2.32%
Dwarikesh Sugar Industries Ltd (09/03/2018) 2.32%
Aadhar Housing Finance Ltd (19/03/2018) 2.32%
Indiabulls Housing Fin Ltd (28/03/2018) 2.31%
JSW Steel Limited (27/03/2018) 2.31%
Dewan Housing Fin Corpn Ltd (27/03/2018) 2.31%
Bajaj Finance Ltd (28/03/2018) 2.31%
Hero Fincorp Ltd (23/04/2018) 2.30%
Indiabulls Housing Fin Ltd (27/04/2018) 2.30%
India Infoline Housing Fin Ltd (03/05/2018) 2.29%
Export Import Bank of India (30/05/2018) 2.28%
Indiabulls Housing Fin Ltd (29/05/2018) 2.28%
Shapoorji Pallonji & Co Pvt Ltd (08/03/2018) 0.46%
Axis Bank Ltd (08/03/2018) 8.83%
Small Ind Dev Bank of India (07/03/2018) 4.65%
IDFC Bank Ltd (09/04/2018) 4.62%
Punjab National Bank (13/03/2018) 2.32%
IndusInd Bank Ltd (12/03/2018) 0.46%
8.30% LIC Hsg Fin Ltd (27/04/2018) 2.33%
329 Days Tbill (12/03/2018) 1.39%
317 Days Tbill (15/03/2018) 0.46%
312 Days Tbill (16/03/2018) 0.46%
Commercial Paper Total 83.66%
Certificate of Deposit
Certificate of Deposit Total 20.88%
Corporate Bond
Corporate Bond Total 2.33%
Treasury Bill
Treasury Bill Total 2.31%
Cash & Other Receivables -9.18%
Total 100.00%
83.66%
20.88%
2.33%2.31%
-9.18%
~ Crisil Disclaimer: A Crisil credit quality rating on a bond fund reflectsCrisil’s current opinion on the degree of protection offered by the ratedinstrument from losses related to credit defaults. It does not constitute anaudit by Crisil of the fund house, the scheme, or companies in the scheme’sportfolio. Crisil ratings are based on information provided by the issuer orobtained by Crisil from sources it considers reliable. Crisil does notguarantee the completeness or accuracy of the information on which therating is based.ACrisil rating is not a recommendation to buy, sell or hold therated scheme. It does not comment on the market price or suitability for aparticular investor. All Crisil ratings are under surveillance. The assignedrating CrisilAAAmfs is valid only for “MiraeAsset Cash Management Fund”.The rating of Crisil is not an opinion on the Asset Management Company’swillingness or ability to make timely payments to the investor. The rating isalso not an opinion on the stability of the NAV of the Fund, which could varywith market developments. Crisil reserves the right to suspend, withdraw orrevise its rating at any time, on the basis of any new information orunavailability of information or any other circumstances, whichCrisilbelieves may have an impact on the rating.

44.44%
33.02%
9.28%
7.01%
3.7
5%
2.5
0%
41.74%
32.00%
12.44%
7.01%
6.81%
Performance Report
PeriodMASF Scheme Benchmark* Additional Benchmark**
Last 1 year
Last 3 years
Last 5 years
Since Inception
26 June, 2012th
5.49 6.68 5.65
6.45 7.38 6.98
7.03 8.08 7.05
7.21 8.06 7.16
17,605 14,848 15,533
Index Value ( )28 February, 2018th
Date of allotment
Index Value of benchmark is 2849.10 and Crisil 1 Year T-Bill is 5012.48
Scheme Benchmark
NAV as on 28 February, 2018th
1760.50
*CRISIL Liquid Fund Index
**Crisil 1 Year T-Bill
Returns (%)
Additional Benchmark
Value of Rs. 10000 invested(in Rs.) Since Inception
Growth Option
Dividend Monthly Option
Direct Plan RegularPlan
`
` `
`
Savings
1,543.4597 1,484.8288
1,097.47611,170.4488
Net Asset Value (NAV)
Fund Information
Fund Manager
Allotment Date
Benchmark Index
Net AUM ( Cr.)
Entry load
Exit load
Plans Available
Mr. Mahendra Jajoo
05 March, 2008
Crisil Liquid Fund Index
393.26
NA
Nil
Regular Savings and Direct Plan
th
`
Fund Speak 11
MIRAE ASSETSAVINGS FUND - (MASF)(An open ended debt scheme) ICRA AAAmfs#
Monthly Factsheet as on February 2018
Portfolio holdings
Past Performance may or may not sustained in future. For computation of since inception returns (%) the allotment NAV has been taken as 10.00. The performance of otherfunds managed by the same fund managers are given in the respective page of the schemes and on page No. 14.
`
#ICRA Disclaimer: ICRA’s mutual fund rating methodology is based on evaluating the inherent credit quality of the fund’s portfolio. The scores are based on ICRA’s
estimates of credit risk associated with each exposure of the portfolio taking into account its maturity. ICRA rating is not a recommendation to buy, sell or hold the ratedscheme. The assigned rating ICRA AAAmfs is valid only for “Mirae Asset Savings Fund”.
Monthly Average Expense Ratio
Regular Plan
Direct Plan
0.90%
0.23%
Minimum Investment Amount
` `
`
`
5,000/- and in multiples of 1/- thereafter.Minimum Additional Application Amount: 1,000/- perapplication and in multiples of 1/- thereafter.
Quantitative Data
Weighted Average Maturity
Modified Duration 0.67 Years
Yield to Maturity 7.55%
337.59 Days
Macaulay Duration 0.74 Years
Corporate Bond
Corporate Bond Total 41.74%
Commercial Paper
Commercial Paper Total 32.00%
Certificate of Deposit
Certificate of Deposit Total 12.44%
Zero Coupon Bond
Zero Coupon Bond Total 6.81%
Cash & Other Receivables Total 7.01%
Total 100.00%
8.10% Reliance Jio Infocom Ltd (29/04/2019) 6.37%
7.07% NABARD (25/05/2020) 6.34%
7.15% IRFC (16/09/2018) 6.33%
7.78% HDB Fin Serv Ltd (25/10/2019) 3.78%
8.58% Aadhar Housing Fin Ltd (23/06/2020) 3.75%
9.05% Dewan Hs Fin Corp Ltd (09/09/2019) 2.55%
7.68% Indiabulls Hsg (24/07/20) 2.53%
7.9% Piramal Enterprise Ltd (14/09/2020) 2.50%
7.60% ABHFL Ltd (30/07/2021) 2.47%
9.64% Power Grid Corpn Ltd (31/05/2019) 1.30%
8.9% Indbulls Hsg Fin Ltd (26/09/2021) 1.28%
8.15% HDFC Ltd (27/07/2018) 1.27%
7.85% NABARD (31/05/2019) 1.27%
HUDCO Ltd (16/05/2018) 6.26%
Shapoorji Pallonji & Co Pvt Ltd (30/10/2018) 6.03%
HDFC Ltd (18/02/2019) 5.90%
IndoStar Capital Finance Ltd (20/06/2018) 3.72%
Small Ind Dev Bank of India (01/03/2018) 2.54%
Godrej Properties (06/03/2018) 2.54%
JM Financial Products Ltd (22/05/2018) 2.50%
Export Import Bank of India (14/03/2018) 1.27%
Capital First Limited (22/06/2018) 1.24%
Kotak Mahindra Bank Ltd (13/06/2018) 6.23%
HDFC Bank Ltd (29/06/2018) 6.21%
Shriram Tran Fin (29/06/2018) 6.81%
Dividend History
Face value 1000/-.
Past Performance may or may not sustained infuture.Pursuant to payment of dividend the NAV of the dividendoption of the scheme will fall to the extent of payout andstatutory levy (if applicable).
Dividend history is for MASF - Regular Savings Plan -Monthly Dividend Option
`
Record DateDividend ( )` Per Unit Cum
NAV ( )`
26-Dec-17 1.8690 1.7316 1,099.8869
24-Jan-18 2.7428 2.5412 1,101.0967
26-Feb-18 3.7408 3.4657 1,102.4784
Individual Corporate
Allocation
Rating Profile
Corporate Bond
Cash & Other Receivables
Certificate of Deposit
Commercial Paper
Zero Coupon Bond
% Allocation
A1+ AAA AA+
AA+(SO) AACash & Other Receivables
Note:
1. Different Plans under the scheme has different expense structure. The reference and details provided herein areof Regular Saving Plan - Growth Option.
2. Fund manager : Mr. Mahendra Jajoo managing the scheme since 8 .
3. Inception date of MASF is March 05 2008, however since inception returns are calculated from Jan 26, 2012 asthere were no investors in the interim period in the institutional plan.
thSeptember, 2016
Direct Plan Regular Plan
Growth Option
Dividend Option
`
` `
`10.3940 10.2560
10.256010.3940
Net Asset Value (NAV)
Fund Information
Fund Manager
Allotment Date
Benchmark Index
Net AUM ( Cr.)
Entry load
Exit load
Plans Available
Mr. Mahendra Jajoo
24 March, 2017
CRISIL CompositeBond Fund Index
64.40
NA
If redeemed within 6 months (182 days) from the date ofallotment – 0.50%;
If redeemed after 6 months (182 days) from the date ofallotment – Nil
Regular and Direct Plan
th
`
Fund Speak 12
MIRAE ASSETDYNAMIC BOND FUND - (MADBF)( )An open-ended income scheme
Monthly Factsheet as on February 2018
Portfolio Holdings
Monthly Average Expense Ratio
Regular Plan
Direct Plan
2.14%
0.53%
Minimum Investment Amount
` `
`
`
5,000/- and in multiples of 1/-thereafter.Minimum Additional Application Amount: 1,000/- perapplication and in multiples of 1/- thereafter.
Quantitative Data
Weighted Average Maturity 3.45 Years
Modified Duration 2.39
Yield to Maturity 6.89%
Years
Macualay Duration 2.58 Years
Corporate Bond
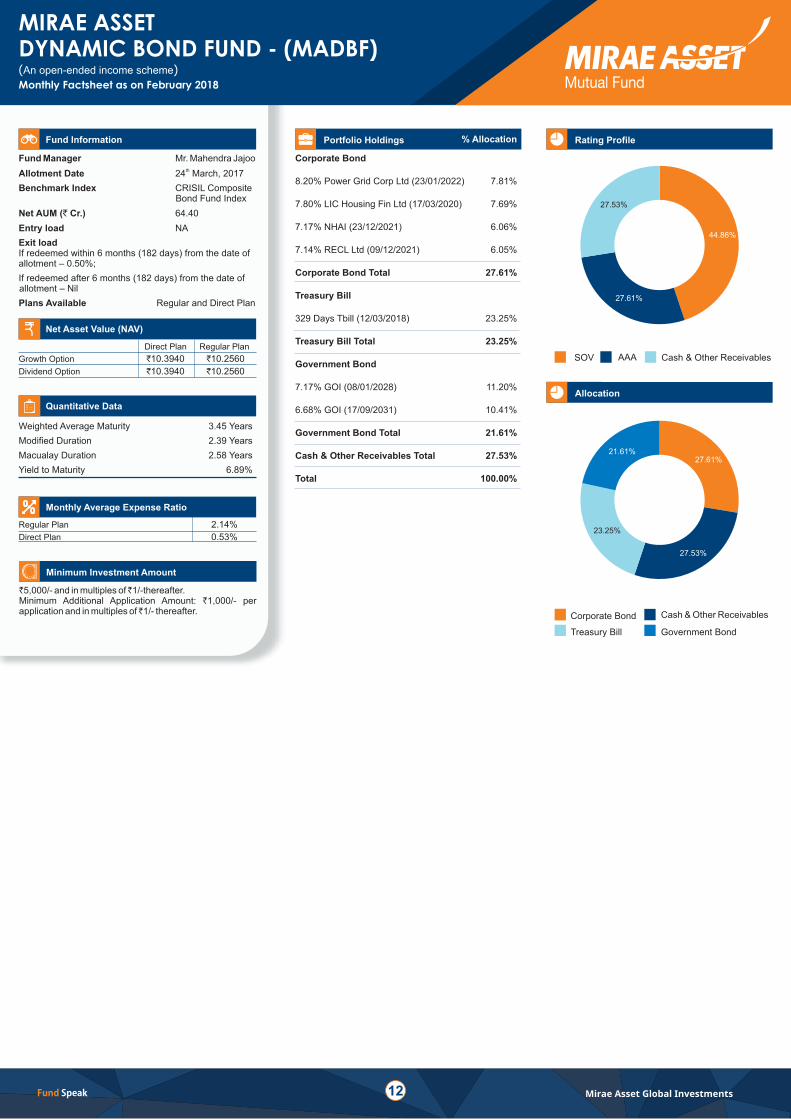
Corporate Bond Total 27.61%
Treasury Bill
Treasury Bill Total 23.25%
Government Bond
Government Bond Total 21.61%
Cash & Other Receivables Total 27.53%
Total 100.00%
8.20% Power Grid Corp Ltd (23/01/2022) 7.81%
7.80% LIC Housing Fin Ltd (17/03/2020) 7.69%
7.17% NHAI (23/12/2021) 6.06%
7.14% RECL Ltd (09/12/2021) 6.05%
329 Days Tbill (12/03/2018) 23.25%
7.17% GOI (08/01/2028) 11.20%
6.68% GOI (17/09/2031) 10.41%
Allocation
Rating Profile
Treasury Bill Government Bond
Corporate Bond Cash & Other Receivables
% Allocation
Cash & Other ReceivablesSOV AAA
44.86%
27.61%
27.53%
27.61%
27.53%
23.25%
21.61%

Fund Speak 13
FUND PERFORMANCEFor all Equity FundsMonthly Factsheet as on February 2018
Performance of funds managed by Mr. Neelesh Surana, Mr. Ankit Jain, Mr. Mahendra Jajoo & Ms. Bharti Sawant (Overseas Investments)
Mirae Asset Great Consumer Fund (MAGCF) - Fund Manager - Mr. Ankit Jain & Ms. Bharti Sawant (Overseas Investments)
Past Performance may or may not sustained in future, for further details please refer page no 14 & 15.
Mirae Asset India Equity Fund (MAIEF)* - Fund Manager - Mr. Neelesh Surana & Mr. Harshad Borawake
Period Scheme Scheme Benchmark* Additional Benchmark**
Returns (%)
Last 1 year
Last 3 years
Last 5 years
Since Inception
Value of Rs. 10000 invested(in Rs.) Since Inception
22.13 20.55 20.46
12.59 9.36 6.86
21.54 16.38 14.28
16.88 10.87 10.01
46,930 28,286 31,788
4 April, 2008thDate of allotment
Scheme Benchmark
NAV as on 28 February, 2018th
46.93
*S&P BSE 200 (TRI)
**S&P BSE Sensex (TRI)
Index Value (28 February, 2018th )
Additional Benchmark
Mirae Asset Emerging Bluechip Fund (MAEBF) - Fund Manager - Mr. Neelesh Surana
Period Scheme Scheme Benchmark* Additional Benchmark**
Returns (%)
Last 1 year
Last 3 years
Last 5 years
Since Inception
Value of Rs. 10000 invested(in Rs.) Since Inception
22.83 20.80 20.46
19.44 15.83 6.86
31.15 22.66 14.28
23.40 13.39 10.46
49,909 30,126 27,349
09 July, 2010th
Date of allotment
Scheme Benchmark
NAV as on 28 February, 2018th
49.91
*Nifty Free Float Midcap 100 (TRI)
**S&P BSE Sensex (TRI)
Index Value (28 February, 2018)th
Additional Benchmark
Mirae Asset Prudence Fund (MAPF) - Mr. Neelesh Surana & Mr Sudhir Kedia (Equity Portion) & Mr. Mahendra Jajoo (Debt Portion)Fund Manager -
Period Scheme Scheme Benchmark* Additional Benchmark**
Returns (%)
Last 1 year
Since Inception
Value of Rs. 10000 invested(in Rs.) Since Inception
16.61 14.71 20.46
12.45 10.86 10.00
13,550 16,599 17,695
29 July, 2015th
Date of allotment
Scheme Benchmark
NAV as on 28 February, 2018th
13.55
*CRISIL Hybrid 35+65 -Aggressive Index@
**S&P BSE Sensex (TRI)
Index Value (28 February, 2018)th
Additional Benchmark
Mirae Asset Tax Saver Fund (MATSF) - Mr. Neelesh SuranaFund Manager -
Period Scheme Scheme Benchmark* Additional Benchmark**
Returns (%)
Last 1 year
Since Inception
Value of Rs. 10000 invested(in Rs.) Since Inception
27.19 20.55 20.46
25.60 16.91 14.85
16,409 15,968 18,734
28 December, 2015th
Date of allotment
Scheme Benchmark
NAV as on 28 February, 2018th
16.41
*S&P BSE 200 (TRI)
**S&P BSE Sensex (TRI)
Index Value (28 February, 2018)th
Additional Benchmark
Period Scheme Scheme Benchmark* Additional Benchmark**
Returns (%)
Last 1 year
Last 3 years
Last 5 years
Since Inception
Value of Rs. 10000 invested(in Rs.) Since Inception
31.93 21.51 20.46
13.41 10.05 6.86
20.87 13.66 14.28
20.30 16.50 17.13
32,494 27,894 25,508
29 March, 2011th
Date of allotment
Scheme Benchmark
NAV as on 28 February, 2018th
33.49
*S&P BSE 200 (65%) & S&P Asia Pacific Emerging BMI (35%) Index (TRI)
**S&P BSE Sensex (TRI)
Index Value (28 February, 2018)th
Additional Benchmark
Index Value of S&P BSE 200 is 5370.34 and S&P BSE Sensex is 48772.48(TRI) (TRI)
Index Value of is 25008.10 and S&P BSE Sensex is 48772.48Scheme benchmark (TRI)
Index Value of is 8665.15 and S&P BSE Sensex is 48772.48Scheme benchmark (TRI)
Index Value of S&P BSE 200 is 5370.34 and S&P BSE Sensex is 48772.48(TRI) (TRI)
Index Value of benchmark is 290.52 and Index value of S&P BSE Sensex is 48772.48(TRI)
*Mirae Asset India Opportunities Fund was renamed as Mirae Asset India Equity Fund with effect from March 01, 2018@
CRISIL Balanced Fund Index has been renamed as CRISIL Hybrid 35+65 –Aggressive Index with effect from January 31, 2018.

Fund Speak 14
FUND PERFORMANCEFor all Debt FundsMonthly Factsheet as on February 2018
Fund Manager Experiences**
Past Performance may or may not sustained in future.
Returns (%) for less than 1 year
calculated on simple annualized basis.
$ For computation of since inception returns (%) the allotment NAV has been taken as 1000.00 for MACMF & MASF and
In case, the start / end date of the concerned period is a non-business date (NBD), the NAV of the previous date is considered for computation of returns.
` `10.00 for all other
schemes.
The calculations of returns shall assume reinvestment of all payouts at the then prevailing NAV. CAGR - CompoundedAnnualised Growth returns. NAV (per unit) is at the end of the period. **AlternateScheme - Benchmark. For MASF the returns are for Regular Savings Plan - Growth Option. Returns for others scheme are provided for Regular Plan Growth Option. Load is not considered forcomputation of return.
Period Scheme Scheme Benchmark*Additional Benchmark**
Last 1 year
Last 3 years
Last 5 years
Since Inception
Value of Rs. 10000 invested(in Rs.) Since Inception
26 June, 2012th
5.49 6.68 5.65
6.45 7.38 6.98
7.03 8.08 7.05
10.47 8.06 7.16
17,605 20,735 14,808
Index Value (28 February, 2018)th
Date of allotment
Scheme Benchmark
NAV as on 28 February, 2018th
1760.50
*CRISIL Liquid Fund Index
Mirae Asset Savings Fund (MASF)
Returns (%)
Period Scheme Scheme Benchmark* Additional Benchmark**
Last 7 days
Last 15 days
Last 30 days
Last 1 year
Last 3 years
Last 5 years
Since Inception
Value of Rs. 10000 invested(in Rs.) Since Inception
12 January, 2009th
6.68 7.07 4.03
7.22 7.13 3.63
6.27 6.60 5.15
6.64 6.68 5.65
7.13 7.38 6.98
7.66 8.08 7.05
6.67 7.44 6.17
18,033 19,256 17,277
Index Value (28 February, 2018th )
Date of allotment
Scheme Benchmark
Additional Benchmark
NAV as on 28 February, 2018th
1803.30
*CRISIL Liquid Fund Index
**CRISIL 1 Year T-Bill
Mirae Asset Cash Management Fund (MACMF)
Performance of funds managed by Mr. Mahendra Jajoo
S&P Disclaimer:
S&P BSE 200 (65%) & S&PAsia Pacific Emerging BMI (35%) Index (the “Index”) are the exclusive property of S&P Opco. LLC, a subsidiary of S&P Dow Jones Indices LLC (“S&P Dow Jones Indices”) and / or itsaffiliates. Mirae Asset Global Investments (India) Pvt. Ltd. has contracted with S&P Down Jones Indices to calculate and maintain the Index. Neither S&P Dow Jones Indices nor any of its affiliates shall be liableto Mirae Asset Global Investments (India) Pvt. Ltd. for any loss or damage, direct, indirect or consequential, arising from (i) any inaccuracy or incompleteness in, or delays, interruptions, errors or omission in thedelivery of, the Index or any data related thereto or (ii) any decision made or action taken by Mirae Asset Global Investments (India) Pvt Ltd in reliance upon such Index and / or data. Neither S&P Dow JonesIndices nor its affiliates shall be liable to MiraeAsset Global Investments (India) Pvt. Ltd. for loss of business revenues, lost profits or any punitive, indirect, consequential, special or similar damages whatsoever,whether in contract, tort or otherwise, even if advised of the possibility of such damages. MiraeAsset Global Investments (India) Pvt. Ltd. expressly acknowledges that S&P Dow Jones Indices and its affiliates donot make any warranties, express or implied, with respect to the Index and / or its related data, including, without limitation, (i) any warranties with respect to the timeliness, sequence, accuracy, completenesscurrentness, merchantability, quality or fitness for a particular purpose of such Index and / or data or (ii) any warranties as to the results to be obtained by the MiraeAsset Global Investments (India) Pvt. Ltd. or anyother person or entity in connection with use of such Index and / or data.
Returns (%)
Additional Benchmark **CRISIL 1 Year T-Bill
�
�
�
�
has over 19 years of experience in Financial Services including Fund Management.
has over 11 years of experience in Fixed Income Fund Management.
has 8 years of experience in Equity ResearchAnalysis
has 6 years of experience in Equity ResearchAnalysis
Neelesh Surana
Mahendra Jajoo
Bharti Sawant
Ankit Jain
�
�
has over 11 years of experience in Fund Management & Investment Analysis
has over 12 years of experience in Investment Analysis & Research
Sudhir Kedia
Harshad Borawake
Index Value of benchmark is 5012.48 and Crisil 1 Year T-Bill is 2849.10
Index Value of benchmark is 5012.48 and Crisil 1 Year T-Bill is 2849.10

~ Crisil Disclaimer: ACrisil credit quality rating on a bond fund reflects Crisil’s current opinion on the degree of protection offered by the rated instrument from losses related to credit defaults. It does not constitute an audit by Crisil ofthe fund house, the scheme, or companies in the scheme’s portfolio. Crisil ratings are based on information provided by the issuer or obtained by Crisil from sources it considers reliable. Crisil does not guarantee the completeness oraccuracy of the information on which the rating is based. A Crisil rating is not a recommendation to buy, sell or hold the rated scheme. It does not comment on the market price or suitability for a particular investor. All Crisil ratings areunder surveillance. The assigned rating CrisilAAAmfs is valid only for “MiraeAsset Cash Management Fund”. The rating of Crisil is not an opinion on theAsset Management Company’s willingness or ability to make timely payments tothe investor. The rating is also not an opinion on the stability of the NAV of the Fund, which could vary with market developments. Crisil reserves the right to suspend, withdraw or revise its rating at any time, on the basis of any newinformation or unavailability of information or any other circumstances, which Crisilbelieves may have an impact on the rating.
Fund Speak 15
Mirae Asset India Equity Fund (MAIEF)*
Asset Allocation
InstrumentsIndicative allocations
(% of total assets)Risk Profile
Minimum Maximum
Indian Equities and Equity Related Securities*Money market instruments/debt securities Instruments**(Including upto 25% of corpus in securitized debt)
65% 100% High
0% 35% Low to Medium
Mirae Asset Emerging Bluechip Fund (MAEBF)
Instruments Indicative allocations(% of total assets)
Risk Profile
Minimum Maximum
Indian Equities and Equity Related Securities* ofcompanies, which are not part of the top 100 stocks bymarket capitalization and have market capitalization ofatleast Rs.100 Crores at the time of investment
Other Indian Equities and Equity Related Securities.*
Money market instruments (including CBLO)/debtsecurities Instruments** (Including upto 20% of corpus insecuritized debt)
65% 100% High
0% 35% Low
0% 35% Low to Medium
Mirae Asset Prudence Fund (MAPF)
Instruments Indicative allocations(% of total assets)
Risk Profile
Minimum Maximum
Equity and Equity Related Instruments*
Debt & Money Market Instruments
Companies which are amongst the top 100 companies bymarket capitalization at the time of investment
Companies which are not amongst the top 100 companiesby market capitalization at the time of investment
65% 80% High
20% 35% Medium
65% 80%
0% 15%
Transparency: The NAVs of all the above funds will be calculated at the close of every working day and shall be published in two daily newspapers and on the AMC / AMFI website.
Instruments Indicative allocations(% of total assets)
Risk Profile
Minimum Maximum
Indian Equities and Equity Related Securities ofcompanies that are likely to benefit either directly orindirectly from consumption led demand.*
Units of Mirae Asset Asia Great Consumer Equity Fund(the underlying fund), and/or in other mutual funds havingsimilar objectives, strategies and attributes of the saidunderlying fund as well as equities and equity relatedsecurities of companies in Asia pacific region which areexpected to benefit from growing consumption activities.
Money market instruments / debt securities Instrumentsand/or units of debt/liquid schemes of domestic MutualFunds.
65% 80% High
20% 35% High
0% 15% Low to Medium
Mirae Asset Great Consumer Fund (MAGCF)
DISCLAIMER
For Equity Funds:Current Monthly Average Expense Ratio for Growth Option(#)(Effective Date 01 October, 2012)Regular Plan:
For Direct Plans (Effective Date 01 January, 2013)#:
st
On the first 100 crores daily net assets 2.50%On the next 300 crores daily net assets 2.25%On the next 300 crores daily net assets 2.00%On the balance of the net assets 1.75%In addition to the above a charge of 20 bps on the daily netassets; Plus, a proportionate charge in respect sales beyond T-15 cities subject to maximum of 30 bps on daily net assets mayalso be chargedExcluding on Investment Management Fee.
The above Monthly Average Expense Ratio will also beapplicable for Direct Plans except that the Direct Plan shall havea lower Monthly Average Expense Ratio excluding distributionexpenses, commission, etc. and no commission for distributionof Units will be paid / charged under Direct Plan.(#) Any change in the Expense Ratio will be updated on AMCWebsite.
Statutory leviesst
@The Volatility, Beta, R Squared, Sharpe Ratio & Information Ratio are calculated on returns from last three years Monthly data points. # Risk free rate: FBIL OVERNIGHT MIBOR as on 28 February 2018.^Basis last rolling 12 month.Dividend is gross dividend. As per current Income Tax Rules, for financial year 2015-16 dividend under equity scheme is tax free in the hands of investors, whereas for Dividend under Debt schemes applicablestatutory levies, if any, needs to be adjusted by theAMC. The fiscal rules / tax laws are subject to change. For further details, please refer to the section titled “Taxation” in the Statement ofAdditional Information ofMirae Asset Mutual Fund. In view of the individual nature of tax consequences, each investor is advised to consult his / her professional tax advisor. For complete dividend history details please refer to ourwebsite www.miraeassetmf.co.in
MiraeAsset Global Investments Company Limited. MiraeAsset Trustee Company Private Limited; MiraeAsset Global Investments (India) PrivateLimited.
th
Statutory Details: Sponsor: Trustee: Investment Manager:
For Liquid / Debt Funds:Current Monthly Average Expense Ratio for GrowthOption (#)(Effective Date 01st October, 2012)Regular / Institutional Plan
For Direct Plans (Effective Date 01 January, 2013)#:
On the first 100 crores daily net assets 2.25%On the next 300 crores daily net assets 2.00%On the next 300 crores daily net assets 1.75%On the balance of the net assets 1.50%In addition to the above a charge of 20 bps on the daily netassets; Plus, a proportionate charge in respect ales beyondT-15 cities subject to maximum of 30 bps on daily net assetsmay also be chargedExcluding on Investment Management Fee.
The above Monthly Average Expense Ratio will also beapplicable for Direct Plans except that the Direct Plan shallhave a lower Monthly Average Expense Ratio excludingdistribution expenses, commission, etc. and no commissionfor distribution of Units will be paid / charged under DirectPlan.(#)Any change in the Expense Ratio will be updated onAMCWebsite.
Statutory leviesst
Mirae Asset Tax Saver Fund - (MATSF)
Instruments Indicative allocations(% of total assets)
Risk Profile
Minimum Maximum
Equity and Equity Related Instruments*
Debt Instruments, Money Market Instruments,
G-Secs, Cash, CBLO, Reverse Repo etc.
80% 100% High
0% 20% Low to Medium
Mirae Asset Savings Fund (MASF)
Instruments Indicative allocations(% of total assets)
Risk Profile
Minimum Maximum
"Money Market Instruments and debt instrumentswithresidual maturity and repricing tenor not exceeding1year."
“Debt Instruments with residual maturity andrepricingtenor exceeding 1 year* (including SecuritizedDebt upto 50% of net assets)."
50% 100% Low
0% 50% Low to Medium
Mirae Asset Cash Management Fund (MACMF)
Instruments Indicative allocations(% of total assets)
Risk Profile
Minimum Maximum
"Money Market Instruments (including Cash, ReverseRepo,CBLO) MIBOR & MIBOR linked instruments."
Debt Instruments with residual maturity upto 91 days only
20% 100% Low
0% 80% Medium
Mirae Asset Dynamic Bond Fund - (MADBF)
Instruments Indicative allocations(% of total assets)
Risk Profile
Minimum Maximum
Money market instruments & Debt securities 0% 100% Low to Medium
Mirae Asset Global Investments (India) Pvt. Ltd.CIN - U65593MH2006FTC165663
Unit No. 606, 6th Floor, Windsor Building, Off C.S.T. Road, Kalina, Santacruz (E), Mumbai - 400 098.
Mutual Fund investments are subject to market risks, read all scheme related documents carefully
Contact youradvisor for details
*Mirae Asset India Opportunities Fund was renamed as Mirae Asset India Equity Fund witheffect from March 01, 2018
Recommended