Fusion of multi-spectral SPOT-5 images and very high resolutiontexture information extracted from digital orthophotos for automatic
classification of complex Alpine areas
CLAUDIO MARIZ{{, DAMIANO GIANELLE*{, LORENZO BRUZZONE{and LORIS VESCOVO{
{Centro di Ecologia Alpina, Fondazione E. Mach, Viote del Monte Bondone, I-38040,
Trento, Italy
{Department of Information Engineering and Computer Science, University of Trento,
Via Sommarive, 14 I-38050, Povo, Trento, Italy
In areas with complex three-dimensional features, slope and aspect interact with
light conditions and significantly affect the spatial structure of images acquired
by remote sensing instruments (for example, by changing the distribution of
shadows and affecting the texture of high resolution imagery). In this scenario,
this paper analyses the potential and the effectiveness of an automatic
classification system to identify three fundamental vegetation classes (forest,
grassland and crops) in the complex topography of the Italian Alps
(Autonomous Province of Trento, Italy). This classification system is based on
the fusion of spectral information provided by the SPOT-5 multi-spectral
channels (Ground Instantaneous Field of View, GIFOV, equal to 10 m) and
textural information extracted from airborne digital orthophotos (GIFOV equal
to 1 m) and is designed to be user-friendly. The texture of the digital orthophotos
was modelled using defined bidirectional variograms, thereby extracting
additional information unavailable in first-order texture analyses. Using
SPOT-5 multi-spectral information alone, the classification accuracy in the
investigated alpine area was equal to 87.5%, but increased to 92.1% when texture
information was included. In particular, the texture information significantly
increased the classification accuracy for crops (from 68.9% to 87.9%), especially
orchards that tend to be classified as lowland deciduous forests, and herbaceous
crops (such as maize) that are often misclassified as grasslands. A further simple
majority analysis increased the ability of detecting grassland, crops and urban
zones. The combination of the majority analysis and the proposed automatic
classification system seems an effective approach to classifying vegetation types
in highly fragmented and complex Alpine landscapes on a regional scale.
1. Introduction
Remote sensing is used widely for land-use classification and forest inventory maps,
as it is a relatively rapid, accurate and cost-effective method when applied to large
areas, especially if integrated with automatic processing techniques. Several previous
studies have investigated the potential of different remote sensors for estimating
land cover and classifying vegetation, including passive multi-spectral and
hyperspectral sensors, as well as active Light Detection and Ranging (LIDAR)
and Synthetic Aperture Radar (SAR) systems (Hyde et al. 2006).
*Corresponding author. Email: [email protected]
International Journal of Remote Sensing
Vol. 30, No. 11, 10 June 2009, 2859–2873
International Journal of Remote SensingISSN 0143-1161 print/ISSN 1366-5901 online # 2009 Taylor & Francis
http://www.tandf.co.uk/journalsDOI: 10.1080/01431160802558600
Downloaded By: [Universita di Trento] At: 11:20 27 June 2009
Depending on the spectral and geometrical characteristics of the available multi-
spectral sensors, classification can be achieved at different levels of detail. If low
resolution multi-spectral data are available, analysis generally is limited to
discriminating between forested and non-forested areas (Sedano et al. 2005).
Instead, medium resolution sensors can increase the level of detail significantly and
analysis can be focused on more specific vegetation classes, as shown by Goodenough
et al. (2003), who used Landsat Enhanced Thematic Mapper Plus (ETM + ) images to
analyse eight different classes. High resolution orbital sensors, such as Quickbird,
Ikonos and SPOT-5, allow the generation of geometrically detailed land-cover maps.
However, due to technological limitations, the high spatial resolution of the images
results in a decreased spectral resolution, which affects the classification accuracy
(Zhang 2001). Consequently, in order to obtain thematic maps characterized by high
accuracy, the development of novel algorithms is essential for allowing the available
texture information to be incorporated into the classification process. In addition, in
order to exploit all the information contained in high resolution images, it is necessary
to consider both spectral reflectance and the three-dimensional spatial organization of
the image (St-Onge and Cavayas 1995). In particular, texture contains important
structural information that should be used in the classification process, since its
variations are related to changes in spatial distribution of the objects in the scene
(Wulder et al. 1998, Atkinson and Lewis 2000).
In fact, many studies have pointed out the usefulness of adding textural
information to the classification process (Nel et al. 1994, Coburn and Roberts 2004,
Ruiz et al. 2004, Zhang et al. 2004), and for the estimation of a number of
biophysical parameters, such as Leaf Area Index (LAI; Wulder et al. 1998), wood
volume and forest structure (St-Onge and Cavayas 1995), crown size and cover
stratification (Cohen et al. 1990), and stem density or mean tree height (St-Onge and
Cavayas 1995, Bruniquel-Pinet and Gastellu-Etchegorry 1998). Other studies have
evaluated the relationships between high-resolution image semivariance image
texture, and tree health (Levesque and King 1999).
Several methods exist for extracting textural information from images, such as
simple local variance measurements (Hsu 1978), second-order spatial statistics
(Cohen et al. 1990) and neural network approaches (Dreyer 1993). These methods
can be divided into structural, model-based and frequency-based approaches (see
also Coburn and Roberts (2004) for greater details). One of the more widely used is
the extraction of second-order statistics using variograms (Cohen et al. 1990, St-
Onge and Cavayas 1997, Bruniquel-Pinet and Gastellu-Etchegorry 1998, Curran
1998, Levesque and King 1999). In general, variograms provide information
unobtainable by first-order texture analysis (St-Onge and Cavayas 1995), although
recently Coburn and Roberts (2004) demonstrated that variance measured over
various window sizes can be considered to be equivalent to the semivariance
measure.
Wulder et al. (1998) suggested that homogeneous stands could be modelled with
first-order texture measures, while heterogeneous stands can be characterized
according to second-order texture measures and a semivariogram approach. These
geostatistical tools allow variation in spatial correlation of the reflectance to be
quantified. In particular, the use of variogram model parameters (such as range and
sill) permits the identification and the quantification of the spatial characteristics of
land surfaces (Chen and Gong 2004), species and cover type (Wulder et al. 1998).
Miranda and Fonseca (1998) used the variogram to define a semivariogram textural
2860 C. Mariz et al.
Downloaded By: [Universita di Trento] At: 11:20 27 June 2009
algorithm (STC) for classifying flooded areas in the Amazon rainforest by using SAR
data.
Variograms have also been used to determine the appropriate spatial resolution
for studying ecological problems, or to evaluate the optimal sample plot size
(Butson and King 1999). Franklin et al. (1996) used semivariograms to generate
windows, which are customized to the scale of observations, in order to demonstrate
improvement in remote estimation of forest parameters and in land-cover
classification. Hese (2001) analysed the potential of directional variogram
parameters in stand forest structure differentiation. However, there is still some
uncertainty in the determination of texture measures, window size and other related
parameters, and more research is needed to develop new methods for selecting
texture parameters suitable for different biophysical environments (Lu and Weng
2007).
The importance of textural information for vegetation classification is particularly
evident in cases where the use of spectral analysis is limited. For example, accurate
estimates of biophysical parameters at full canopy cover have still not been fully
achieved from multi-spectral data, as broad-band spectral vegetation indices tend to
saturate and canopy biophysical characteristics ( e.g. LAI, biomass) have nonlinear
relationships with a number of vegetation indices (such as the Normalized
Difference Vegetation Index, NDVI) under these conditions (Levesque and King
2003). Moreover, when tree canopy cover is low, the understorey component
influences the response measured by a spectral sensor introducing errors in the
computation of the biophysical parameters (Colombo et al. 2003). When these
spectral indices fail, the application of textural indices offers potential for measuring
and monitoring canopy structures (Hudak and Wessman 1998, 2001). In fact, the
combination of spatial and spectral analysis was used successfully to solve this
problem by Wulder et al. (1996, 1998) and Bruniquel-Pinet and Gastellu-Etchegorry
(1998), who showed that the introduction of semivariogram texture improved the
regression relationship between LAI and NDVI, especially at full canopy cover,
when LAI values are greater than three.
The aim of this study was to apply an approach that integrates textural analysis of
digital orthophotos (Ground Instantaneous Field of View (GIFOV) equal to 1 m)
with SPOT-5 multi-spectral imagery information (GIFOV equal to 10 m) to the
classification of vegetation in Alpine areas with a complex topography. The ultimate
goal was to define an automatic classification method that jointly exploits the non-
uniform and non-random spatial distribution of natural vegetation (modelled at
very high geometrical resolution in orthophotos) and spectral information (acquired
from SPOT-5 sensor) for the recognition of four fundamental land cover classes in
Alpine areas: forest, grassland, crops, and urban areas.
2. Materials and methods
2.1 Study area
The study site (ca 52 km2) is located in northern Italy, approximately 10 km south-
east of Trento, in a typical alpine area. The lowest altitudes (300 m above sea level
(asl)) are occupied by crops of grapes, apples and maize and some deciduous forest.
Also included in the site is part of the Piana delle Viote, a wide plateau at 1550 m asl,
dominated by grasslands (meadows and pastures), while the rest of the site is
covered by mixed forest of beech and spruce. This location was selected in order to
Automatic classification of complex Alpine areas 2861
Downloaded By: [Universita di Trento] At: 11:20 27 June 2009
analyse a range of vegetation types in a very complex topography. Slope and aspect
and their interactions with viewing direction and light conditions significantly affect
the appearance of spatial structures in the image. In fact, the solar zenith and
azimuth angles, in combination with slope and aspect, change the amount of the
shadow projected on the ground and thus the shape of the variogram (i.e. change the
value of range and sill).
2.2 Data sources
Two different data sources were considered in our study: a SPOT-5 image and a
digital orthophoto. The SPOT-5 image was acquired on 27 April 2004, with a clear
sky apart from a few small isolated clouds. It has four spectral bands and a spatial
resolution of 10 m. The geographical location of the scene was 46u 059 N (centre
latitude), 10u 439 E (centre longitude). The image was geometrically corrected, and
georeferenced in a Universal Transverse Mercator (UTM) grid.
The digital orthophoto, a very high resolution image (GIFOV equal to 1 m) was
acquired in the red, green and blue bands of the electromagnetic spectrum by a
sensor mounted on an aerial platform in the summer of 2003 and was georeferenced,
orthorectified and geometrically corrected.
One potential problem in integrating information from the two images used here
is that some small areas of the SPOT-5 and the orthophoto images were
incongruous, due to land-use changes that occurred on the ground between the
two acquisition dates. In order to avoid these spurious effects in our analysis, before
running the classification, multi-temporal images were compared and land-use
change areas were excluded from the analysis.
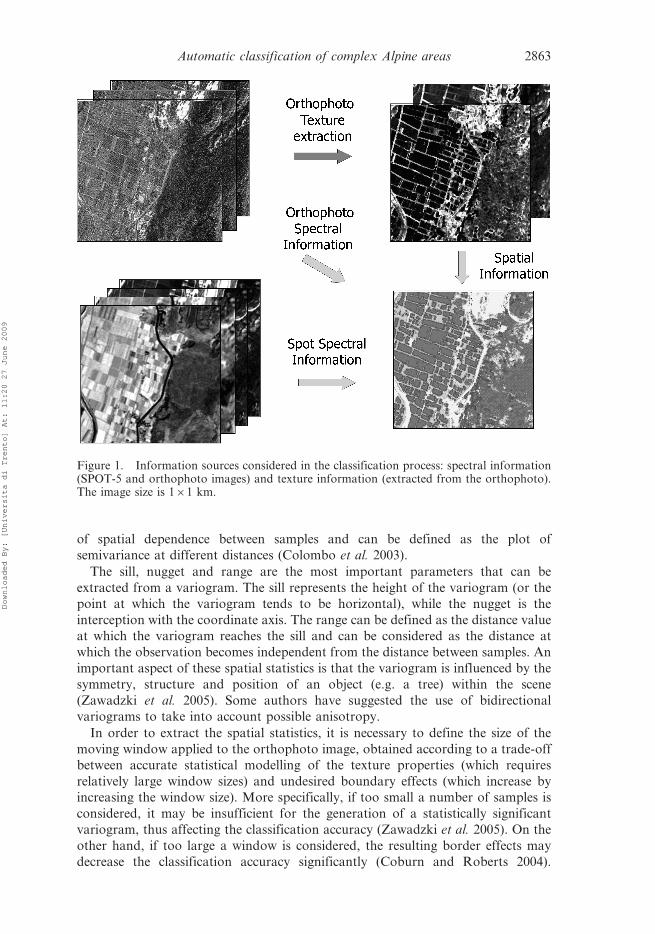
An image with a resolution of 10 m was extracted from the orthophoto to match
that of the SPOT-5 image using a nearest-neighbour resampling algorithm with a 0.1
factor band. The three spectral bands of the resulting orthophoto image, the textural
features (range–sill), and the four SPOT-5 satellite channels were co-registered and a
maximum root square registration error of 10 m was obtained. Figure 1 summarizes
the information sources considered in the classification process.
2.3 Texture analysis
A spatial statistical approach based on the variogram was used to extract the
structural information of the vegetation cover. This tool permits the characteriza-
tion of the spatial structure of the scene, while being easy to implement and
interpret.
The semivariance c can be defined as half the squared difference between the
variable Z (the variance, or in this case, the reflectance) calculated at two precise
locations, x and x + h.
c2~1
2Z xð Þ{Z xzhð Þ½ �2 ð1Þ
The variogram c(h) is calculated with the following equation:
c hð Þ~ 1
2m:Xm
i~1
Z xið Þ{Z xizhð Þ½ �2 ð2Þ
where m is the number of pairs of pixels separated by the same lag(h), and Z(xi) is
the digital value at the xi position. This variable represents a measure of the degree
2862 C. Mariz et al.
Downloaded By: [Universita di Trento] At: 11:20 27 June 2009
of spatial dependence between samples and can be defined as the plot of
semivariance at different distances (Colombo et al. 2003).
The sill, nugget and range are the most important parameters that can be
extracted from a variogram. The sill represents the height of the variogram (or the
point at which the variogram tends to be horizontal), while the nugget is the
interception with the coordinate axis. The range can be defined as the distance value
at which the variogram reaches the sill and can be considered as the distance at
which the observation becomes independent from the distance between samples. An
important aspect of these spatial statistics is that the variogram is influenced by the
symmetry, structure and position of an object (e.g. a tree) within the scene
(Zawadzki et al. 2005). Some authors have suggested the use of bidirectional
variograms to take into account possible anisotropy.
In order to extract the spatial statistics, it is necessary to define the size of the
moving window applied to the orthophoto image, obtained according to a trade-off
between accurate statistical modelling of the texture properties (which requires
relatively large window sizes) and undesired boundary effects (which increase by
increasing the window size). More specifically, if too small a number of samples is
considered, it may be insufficient for the generation of a statistically significant
variogram, thus affecting the classification accuracy (Zawadzki et al. 2005). On the
other hand, if too large a window is considered, the resulting border effects may
decrease the classification accuracy significantly (Coburn and Roberts 2004).
Figure 1. Information sources considered in the classification process: spectral information(SPOT-5 and orthophoto images) and texture information (extracted from the orthophoto).The image size is 161 km.
Automatic classification of complex Alpine areas 2863
Downloaded By: [Universita di Trento] At: 11:20 27 June 2009
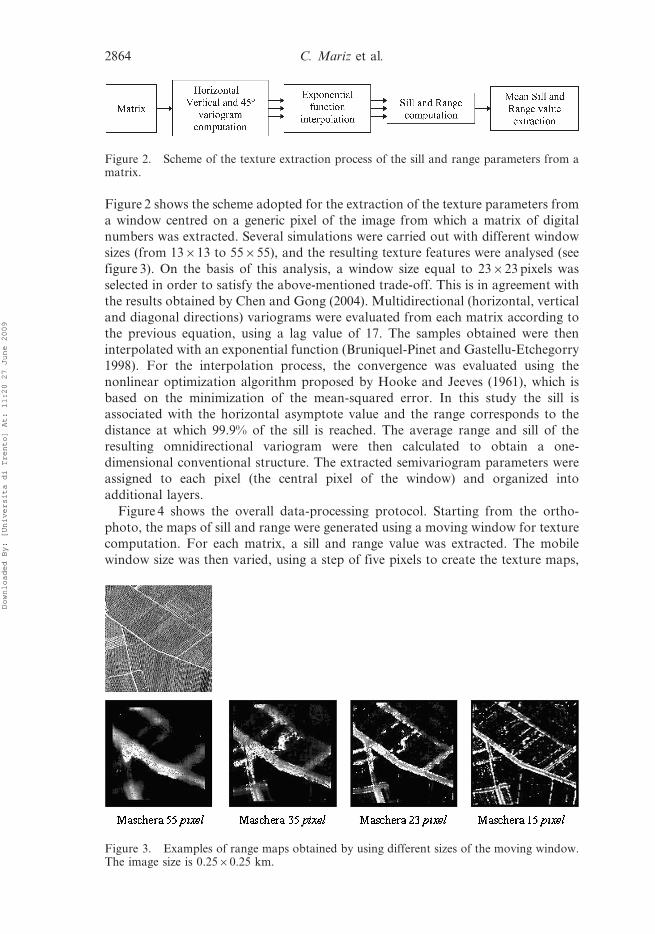
Figure 2 shows the scheme adopted for the extraction of the texture parameters from
a window centred on a generic pixel of the image from which a matrix of digital
numbers was extracted. Several simulations were carried out with different window
sizes (from 13613 to 55655), and the resulting texture features were analysed (see
figure 3). On the basis of this analysis, a window size equal to 23623 pixels was
selected in order to satisfy the above-mentioned trade-off. This is in agreement with
the results obtained by Chen and Gong (2004). Multidirectional (horizontal, vertical
and diagonal directions) variograms were evaluated from each matrix according to
the previous equation, using a lag value of 17. The samples obtained were then
interpolated with an exponential function (Bruniquel-Pinet and Gastellu-Etchegorry
1998). For the interpolation process, the convergence was evaluated using the
nonlinear optimization algorithm proposed by Hooke and Jeeves (1961), which is
based on the minimization of the mean-squared error. In this study the sill is
associated with the horizontal asymptote value and the range corresponds to the
distance at which 99.9% of the sill is reached. The average range and sill of the
resulting omnidirectional variogram were then calculated to obtain a one-
dimensional conventional structure. The extracted semivariogram parameters were
assigned to each pixel (the central pixel of the window) and organized into
additional layers.
Figure 4 shows the overall data-processing protocol. Starting from the ortho-
photo, the maps of sill and range were generated using a moving window for texture
computation. For each matrix, a sill and range value was extracted. The mobile
window size was then varied, using a step of five pixels to create the texture maps,
Figure 2. Scheme of the texture extraction process of the sill and range parameters from amatrix.
Figure 3. Examples of range maps obtained by using different sizes of the moving window.The image size is 0.2560.25 km.
2864 C. Mariz et al.
Downloaded By: [Universita di Trento] At: 11:20 27 June 2009
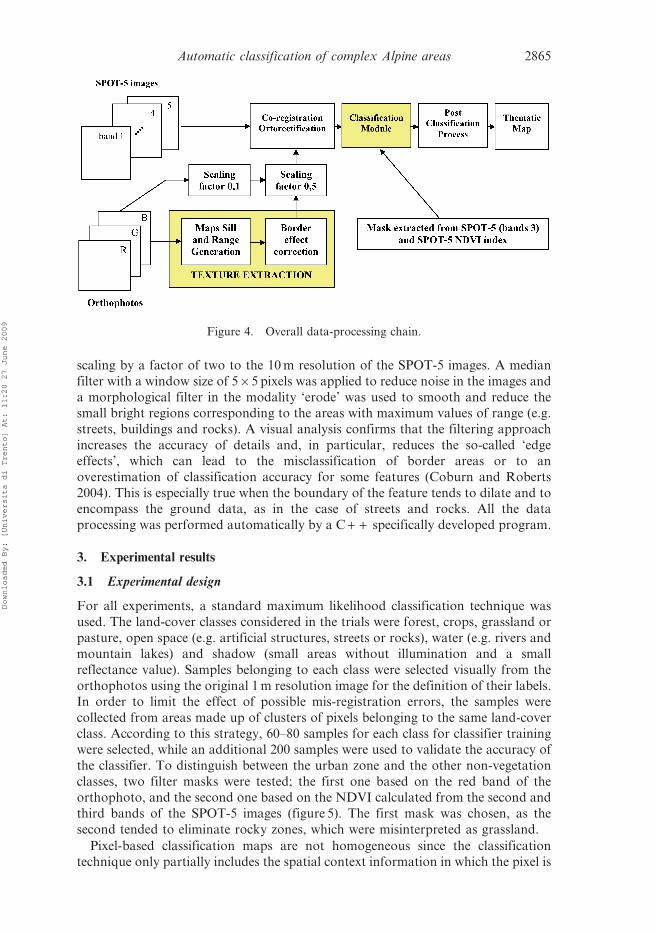
scaling by a factor of two to the 10 m resolution of the SPOT-5 images. A median
filter with a window size of 565 pixels was applied to reduce noise in the images and
a morphological filter in the modality ‘erode’ was used to smooth and reduce the
small bright regions corresponding to the areas with maximum values of range (e.g.
streets, buildings and rocks). A visual analysis confirms that the filtering approach
increases the accuracy of details and, in particular, reduces the so-called ‘edge
effects’, which can lead to the misclassification of border areas or to an
overestimation of classification accuracy for some features (Coburn and Roberts
2004). This is especially true when the boundary of the feature tends to dilate and to
encompass the ground data, as in the case of streets and rocks. All the data
processing was performed automatically by a C + + specifically developed program.
3. Experimental results
3.1 Experimental design
For all experiments, a standard maximum likelihood classification technique was
used. The land-cover classes considered in the trials were forest, crops, grassland or
pasture, open space (e.g. artificial structures, streets or rocks), water (e.g. rivers and
mountain lakes) and shadow (small areas without illumination and a small
reflectance value). Samples belonging to each class were selected visually from the
orthophotos using the original 1 m resolution image for the definition of their labels.
In order to limit the effect of possible mis-registration errors, the samples were
collected from areas made up of clusters of pixels belonging to the same land-cover
class. According to this strategy, 60–80 samples for each class for classifier training
were selected, while an additional 200 samples were used to validate the accuracy of
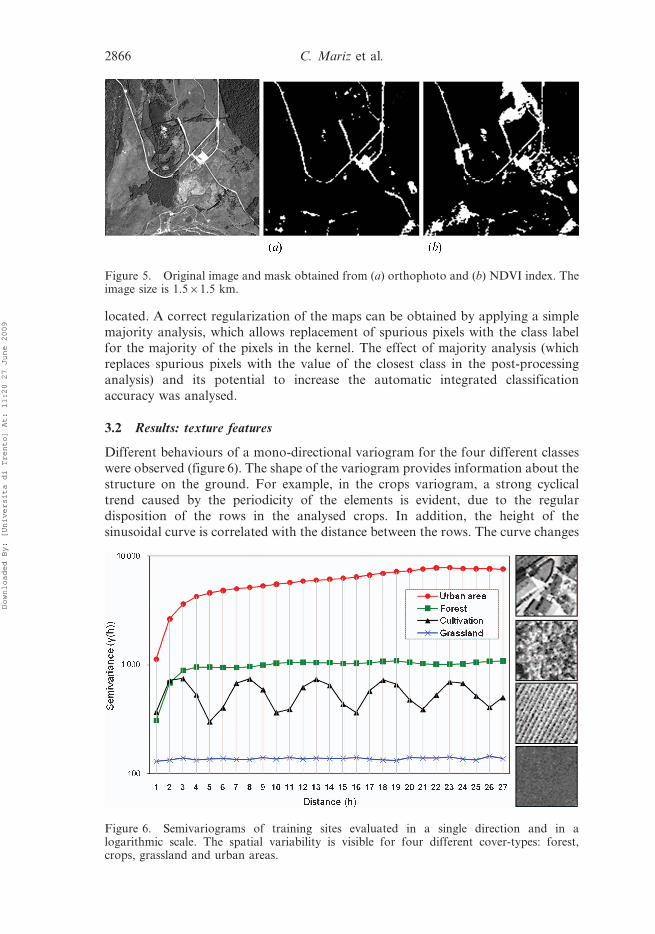
the classifier. To distinguish between the urban zone and the other non-vegetation
classes, two filter masks were tested; the first one based on the red band of the
orthophoto, and the second one based on the NDVI calculated from the second and
third bands of the SPOT-5 images (figure 5). The first mask was chosen, as the
second tended to eliminate rocky zones, which were misinterpreted as grassland.
Pixel-based classification maps are not homogeneous since the classification
technique only partially includes the spatial context information in which the pixel is
Figure 4. Overall data-processing chain.
Automatic classification of complex Alpine areas 2865
Downloaded By: [Universita di Trento] At: 11:20 27 June 2009
located. A correct regularization of the maps can be obtained by applying a simple
majority analysis, which allows replacement of spurious pixels with the class labelfor the majority of the pixels in the kernel. The effect of majority analysis (which
replaces spurious pixels with the value of the closest class in the post-processing
analysis) and its potential to increase the automatic integrated classification
accuracy was analysed.
3.2 Results: texture features
Different behaviours of a mono-directional variogram for the four different classes
were observed (figure 6). The shape of the variogram provides information about the
structure on the ground. For example, in the crops variogram, a strong cyclical
trend caused by the periodicity of the elements is evident, due to the regular
disposition of the rows in the analysed crops. In addition, the height of the
sinusoidal curve is correlated with the distance between the rows. The curve changes
Figure 5. Original image and mask obtained from (a) orthophoto and (b) NDVI index. Theimage size is 1.561.5 km.
Figure 6. Semivariograms of training sites evaluated in a single direction and in alogarithmic scale. The spatial variability is visible for four different cover-types: forest,crops, grassland and urban areas.
2866 C. Mariz et al.
Downloaded By: [Universita di Trento] At: 11:20 27 June 2009
its periodicity depending on the angle between the row direction and the direction at
which the variogram is calculated. As mentioned previously, an exponential
function for the interpolation of samples was used; however, in this particular
situation, a periodic model using a trigonometric function was more appropriate.
The variogram associated with the urban zone has a large variance, and the shape is
irregular. This behaviour is caused by the presence of several objects (trees, streets
and buildings) with different patterns within the same region of interest. In contrast,
the forest presented a unique pattern and generated a variogram where the
semivariance value increases regularly with the increase of the lag, tending to a
horizontal asymptote, probably as a result of isotropy. In fact, the structural
disposition of forest parameters, such as the mean, variance, sill, range and, thus,
the autocorrelation, are the same in all directions. The semivariogram shape
associated with grassland is characterized by a linear horizontal plane and is
associated with very small semivariance values (figure 6).
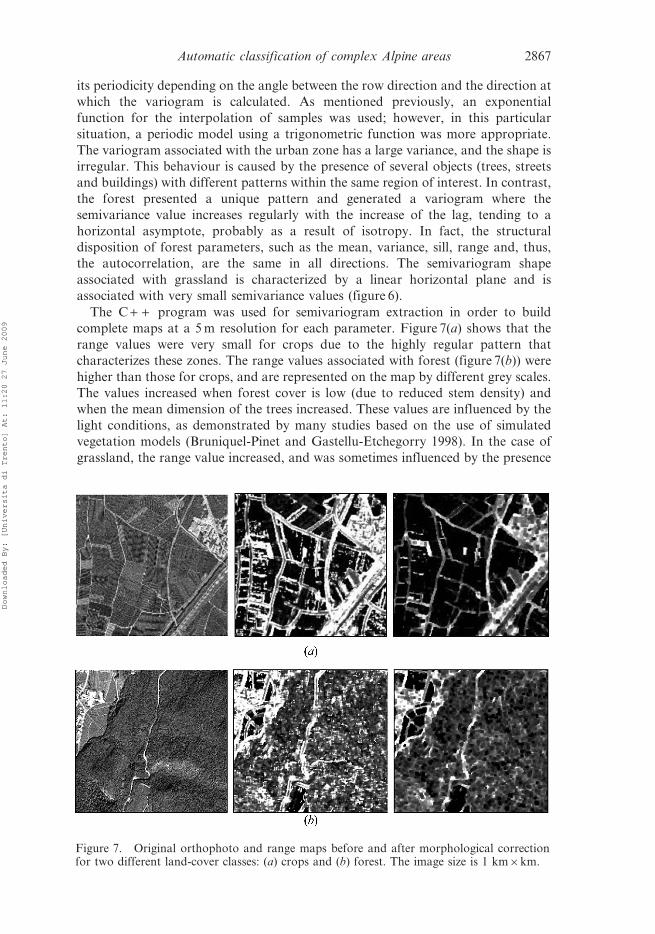
The C + + program was used for semivariogram extraction in order to build
complete maps at a 5 m resolution for each parameter. Figure 7(a) shows that the
range values were very small for crops due to the highly regular pattern that
characterizes these zones. The range values associated with forest (figure 7(b)) were
higher than those for crops, and are represented on the map by different grey scales.
The values increased when forest cover is low (due to reduced stem density) and
when the mean dimension of the trees increased. These values are influenced by the
light conditions, as demonstrated by many studies based on the use of simulated
vegetation models (Bruniquel-Pinet and Gastellu-Etchegorry 1998). In the case of
grassland, the range value increased, and was sometimes influenced by the presence
Figure 7. Original orthophoto and range maps before and after morphological correctionfor two different land-cover classes: (a) crops and (b) forest. The image size is 1 km6km.
Automatic classification of complex Alpine areas 2867
Downloaded By: [Universita di Trento] At: 11:20 27 June 2009
of rocky areas (which are typical of a mountain landscape). The range value
corresponding to all the other classes tended to saturate and, consequently, all the
artificial structures, such as streets and towns, appear white (figure 7). Figure 7 also
shows the reduction of the edge effect obtained with the application of
morphological filtering and indicates that this method provides a reasonable
reconstruction of the original area. Similar results were obtained when correcting for
edge effects between forests and urban zones (figure 7(b)).
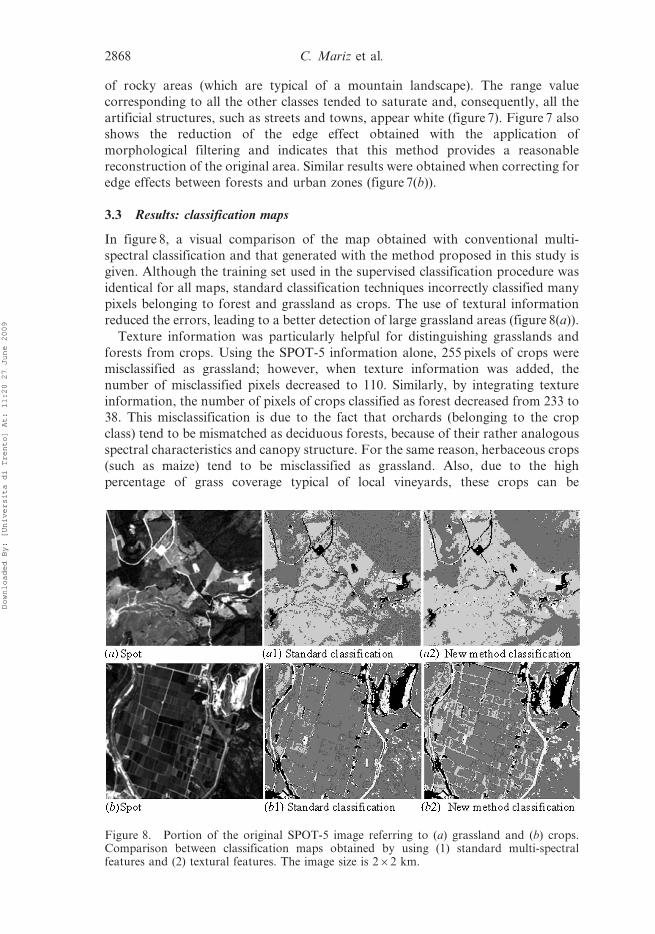
3.3 Results: classification maps
In figure 8, a visual comparison of the map obtained with conventional multi-
spectral classification and that generated with the method proposed in this study is
given. Although the training set used in the supervised classification procedure was
identical for all maps, standard classification techniques incorrectly classified many
pixels belonging to forest and grassland as crops. The use of textural information
reduced the errors, leading to a better detection of large grassland areas (figure 8(a)).
Texture information was particularly helpful for distinguishing grasslands and
forests from crops. Using the SPOT-5 information alone, 255 pixels of crops were
misclassified as grassland; however, when texture information was added, the
number of misclassified pixels decreased to 110. Similarly, by integrating texture
information, the number of pixels of crops classified as forest decreased from 233 to
38. This misclassification is due to the fact that orchards (belonging to the crop
class) tend to be mismatched as deciduous forests, because of their rather analogous
spectral characteristics and canopy structure. For the same reason, herbaceous crops
(such as maize) tend to be misclassified as grassland. Also, due to the high
percentage of grass coverage typical of local vineyards, these crops can be
Figure 8. Portion of the original SPOT-5 image referring to (a) grassland and (b) crops.Comparison between classification maps obtained by using (1) standard multi-spectralfeatures and (2) textural features. The image size is 262 km.
2868 C. Mariz et al.
Downloaded By: [Universita di Trento] At: 11:20 27 June 2009
misclassified easily as grassland. Considering the obvious spatial patterns typical of
vineyards, orchards and herbaceous crops, it is possible to understand the
importance of texture, especially in a complex environment where topography
and fragmented landscapes can affect the reflectance response heavily.
Figure 8(b) shows a specific subset of the SPOT-5 image related to an agricultural
zone. Here, the texture information introduced as input to the classifier increased
the detection of agricultural classes. In this case, it is clear that many pixels
belonging to the forest class were classified correctly only in the second map, which
was integrated with texture data.
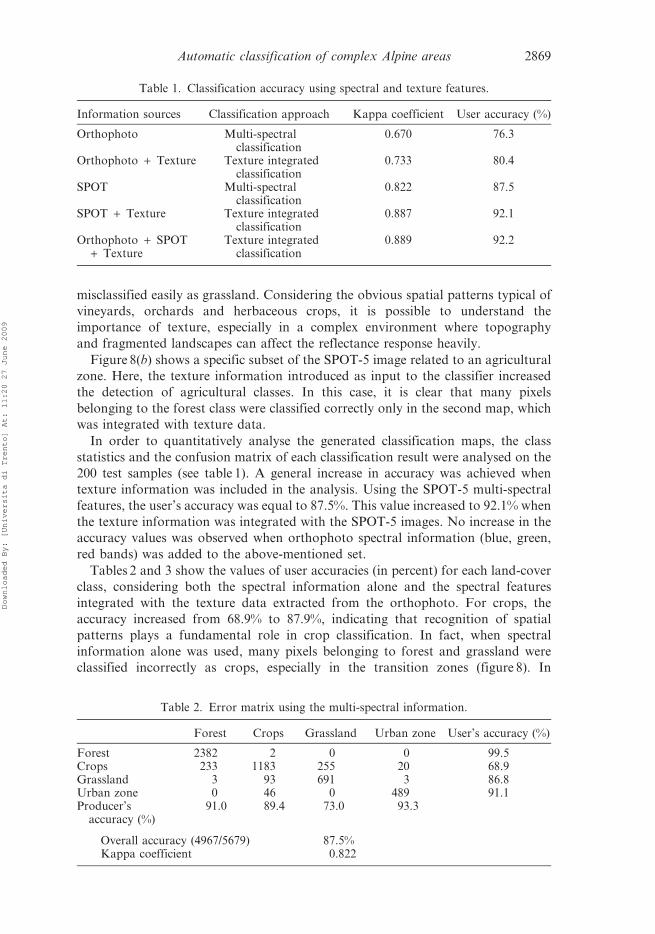
In order to quantitatively analyse the generated classification maps, the class
statistics and the confusion matrix of each classification result were analysed on the
200 test samples (see table 1). A general increase in accuracy was achieved when
texture information was included in the analysis. Using the SPOT-5 multi-spectral
features, the user’s accuracy was equal to 87.5%. This value increased to 92.1% when
the texture information was integrated with the SPOT-5 images. No increase in the
accuracy values was observed when orthophoto spectral information (blue, green,
red bands) was added to the above-mentioned set.
Tables 2 and 3 show the values of user accuracies (in percent) for each land-cover
class, considering both the spectral information alone and the spectral features
integrated with the texture data extracted from the orthophoto. For crops, the
accuracy increased from 68.9% to 87.9%, indicating that recognition of spatial
patterns plays a fundamental role in crop classification. In fact, when spectral
information alone was used, many pixels belonging to forest and grassland were
classified incorrectly as crops, especially in the transition zones (figure 8). In
Table 1. Classification accuracy using spectral and texture features.
Information sources Classification approach Kappa coefficient User accuracy (%)
Orthophoto Multi-spectralclassification
0.670 76.3
Orthophoto + Texture Texture integratedclassification
0.733 80.4
SPOT Multi-spectralclassification
0.822 87.5
SPOT + Texture Texture integratedclassification
0.887 92.1
Orthophoto + SPOT+ Texture
Texture integratedclassification
0.889 92.2
Table 2. Error matrix using the multi-spectral information.
Forest Crops Grassland Urban zone User’s accuracy (%)
Forest 2382 2 0 0 99.5Crops 233 1183 255 20 68.9Grassland 3 93 691 3 86.8Urban zone 0 46 0 489 91.1Producer’s
accuracy (%)91.0 89.4 73.0 93.3
Overall accuracy (4967/5679) 87.5%Kappa coefficient 0.822
Automatic classification of complex Alpine areas 2869
Downloaded By: [Universita di Trento] At: 11:20 27 June 2009
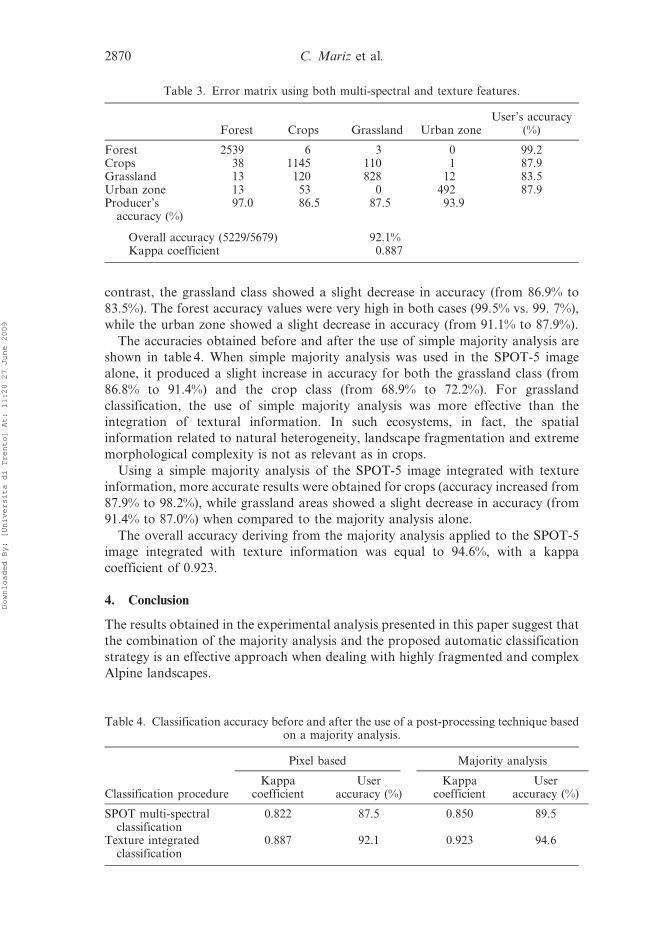
contrast, the grassland class showed a slight decrease in accuracy (from 86.9% to
83.5%). The forest accuracy values were very high in both cases (99.5% vs. 99. 7%),
while the urban zone showed a slight decrease in accuracy (from 91.1% to 87.9%).
The accuracies obtained before and after the use of simple majority analysis are
shown in table 4. When simple majority analysis was used in the SPOT-5 image
alone, it produced a slight increase in accuracy for both the grassland class (from
86.8% to 91.4%) and the crop class (from 68.9% to 72.2%). For grassland
classification, the use of simple majority analysis was more effective than the
integration of textural information. In such ecosystems, in fact, the spatial
information related to natural heterogeneity, landscape fragmentation and extreme
morphological complexity is not as relevant as in crops.
Using a simple majority analysis of the SPOT-5 image integrated with texture
information, more accurate results were obtained for crops (accuracy increased from
87.9% to 98.2%), while grassland areas showed a slight decrease in accuracy (from
91.4% to 87.0%) when compared to the majority analysis alone.
The overall accuracy deriving from the majority analysis applied to the SPOT-5
image integrated with texture information was equal to 94.6%, with a kappa
coefficient of 0.923.
4. Conclusion
The results obtained in the experimental analysis presented in this paper suggest that
the combination of the majority analysis and the proposed automatic classification
strategy is an effective approach when dealing with highly fragmented and complex
Alpine landscapes.
Table 3. Error matrix using both multi-spectral and texture features.
Forest Crops Grassland Urban zoneUser’s accuracy
(%)
Forest 2539 6 3 0 99.2Crops 38 1145 110 1 87.9Grassland 13 120 828 12 83.5Urban zone 13 53 0 492 87.9Producer’s
accuracy (%)97.0 86.5 87.5 93.9
Overall accuracy (5229/5679) 92.1%Kappa coefficient 0.887
Table 4. Classification accuracy before and after the use of a post-processing technique basedon a majority analysis.
Classification procedure
Pixel based Majority analysis
Kappacoefficient
Useraccuracy (%)
Kappacoefficient
Useraccuracy (%)
SPOT multi-spectralclassification
0.822 87.5 0.850 89.5
Texture integratedclassification
0.887 92.1 0.923 94.6
2870 C. Mariz et al.
Downloaded By: [Universita di Trento] At: 11:20 27 June 2009
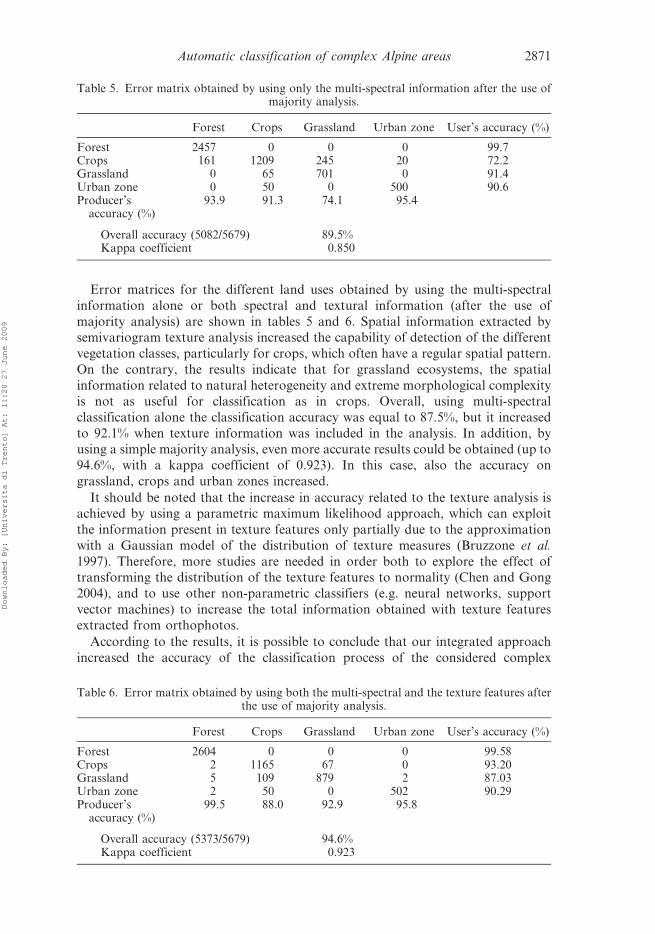
Error matrices for the different land uses obtained by using the multi-spectral
information alone or both spectral and textural information (after the use of
majority analysis) are shown in tables 5 and 6. Spatial information extracted by
semivariogram texture analysis increased the capability of detection of the different
vegetation classes, particularly for crops, which often have a regular spatial pattern.
On the contrary, the results indicate that for grassland ecosystems, the spatial
information related to natural heterogeneity and extreme morphological complexity
is not as useful for classification as in crops. Overall, using multi-spectral
classification alone the classification accuracy was equal to 87.5%, but it increased
to 92.1% when texture information was included in the analysis. In addition, by
using a simple majority analysis, even more accurate results could be obtained (up to
94.6%, with a kappa coefficient of 0.923). In this case, also the accuracy on
grassland, crops and urban zones increased.
It should be noted that the increase in accuracy related to the texture analysis is
achieved by using a parametric maximum likelihood approach, which can exploit
the information present in texture features only partially due to the approximation
with a Gaussian model of the distribution of texture measures (Bruzzone et al.
1997). Therefore, more studies are needed in order both to explore the effect of
transforming the distribution of the texture features to normality (Chen and Gong
2004), and to use other non-parametric classifiers (e.g. neural networks, support
vector machines) to increase the total information obtained with texture features
extracted from orthophotos.
According to the results, it is possible to conclude that our integrated approach
increased the accuracy of the classification process of the considered complex
Table 5. Error matrix obtained by using only the multi-spectral information after the use ofmajority analysis.
Forest Crops Grassland Urban zone User’s accuracy (%)
Forest 2457 0 0 0 99.7Crops 161 1209 245 20 72.2Grassland 0 65 701 0 91.4Urban zone 0 50 0 500 90.6Producer’s
accuracy (%)93.9 91.3 74.1 95.4
Overall accuracy (5082/5679) 89.5%Kappa coefficient 0.850
Table 6. Error matrix obtained by using both the multi-spectral and the texture features afterthe use of majority analysis.
Forest Crops Grassland Urban zone User’s accuracy (%)
Forest 2604 0 0 0 99.58Crops 2 1165 67 0 93.20Grassland 5 109 879 2 87.03Urban zone 2 50 0 502 90.29Producer’s
accuracy (%)99.5 88.0 92.9 95.8
Overall accuracy (5373/5679) 94.6%Kappa coefficient 0.923
Automatic classification of complex Alpine areas 2871
Downloaded By: [Universita di Trento] At: 11:20 27 June 2009
topography areas, leading to a reduction of costs and encouraging frequent
updating of data.
ReferencesATKINSON, P.M. and LEWIS, P., 2000, Geostatistical classification for remote sensing: an
introduction. Computers and Geosciences, 26, pp. 361–371.
BRUNIQUEL-PINEL, V. and GASTELLU-ETCHEGORRY, J., 1998, Sensitivity of texture of high
resolution images of forest to biophysical and acquisition parameters. Remote Sensing
of Environment, 65, pp. 61–85.
BRUZZONE, L., CONESE, C., MASELLI, F. and ROLI, F., 1997, Multisource classification of
complex rural areas by statistical and neural-network approaches. Photogrammetric
Engineering & Remote Sensing, 63, pp. 523–533.
BUTSON, C. and KING, D., 1999, Semivariance analysis of forest structure and remote sensing
data to determine an optimal sample plot size. Proceedings of Fourth International
Airborne Remote Sensing Conference and Exhibition, Ottawa, Ontario, 21–24 June, pp.
155–162.
CHEN, Q. and GONG, P., 2004, Automatic variogram parameter extraction for textural
classification of the panchromatic IKONOS imagery. GeoRS, 42, pp. 1106–1115.
COBURN, C.A. and ROBERTS, A.C.B., 2004, A multiscale texture analysis procedure for
improved forest stand classification. International Journal of Remote Sensing, 25, pp.
4287–4308.
COHEN, W.B., SPIES, T.A. and BRADSHAW, T.A., 1990, Semivariograms of digital imagery for
analysis of conifer canopy structure. Remote Sensing of Environment, 34, pp. 167–178.
COLOMBO, R., BELLINGERI, D., FASOLINI, D. and MARINO, C., 2003, Retrieval of leaf area
index in different vegetation types using high resolution satellite data. Remote Sensing
of Environment, 86, pp. 120–131.
CURRAN, P.J., 1998, The semivariogram in remote sensing: an introduction. Remote Sensing
of Environment, 24, pp. 493–507.
DREYER, P., 1993, Classification of land cover using optimized neural nets on SPOT data.
Photogrammetric Engineering and Remote Sensing, 59, pp. 617–621.
FRANKLIN, S., WULDER, M. and LAVIGNE, M., 1996, Automated derivation of geographic
windows sizes for use in remote sensing digital image texture analysis. Computers &
Geosciences, 22, pp. 665–673.
GOODENOUGH, D.G., DYK, A., NIEMANN, K.O., PEARLMAN, J.S., CHEN, H., HAN, T.,
MURDOCH, M. and WEST, C., 2003, Processing Hyperion and ALI for forest
classification. IEEE Transactions on Geoscience and Remote Sensing, 41, pp.
1321–1331.
HESE, S., 2001, Segmentation of forest stand in very high resolution stereo data. Geoscience
and Remote Sensing Symposium, IEEE 2001 International, 4, pp. 1654–1656.
HOOKE, R. and JEEVES, T.A., 1961, Direct search solution of numerical and statistical
problems. Journal of the ACM, 8, pp. 212–229.
HSU, S.Y., 1978, Texture-Tone analysis for automated Land-use mapping. Photogrammetric
Engineering and Remote Sensing, 44, pp. 1393–1404.
HUDAK, A.T. and WESSMAN, C.A., 1998, Textural analysis of historical aerial photography to
characterize woody plant encroachment in South African Savanna. Remote Sensing of
Environment, 66, pp. 317–330.
HUDAK, A.T. and WESSMAN, C.A., 2001, Textural analysis of high resolution imagery to
quantify bush encroachment in Madikwe Game Reserve, South Africa, 1955–1996.
International Journal of Remote Sensing, 22, pp. 2731–2740.
HYDE, P., DUBAYAH, R., WALKER, W., BLAIR, J.B., HOFTON, M. and HUNSAKER, C., 2006,
Mapping forest structure for wildlife habitat analysis using multi-sensor (LiDAR,
SAR/InSAR, ETM + , Quickbird) synergy. Remote Sensing of Environment, 102, pp.
63–73.
2872 C. Mariz et al.
Downloaded By: [Universita di Trento] At: 11:20 27 June 2009
LEVESQUE, J. and KING, D., 1999, Airborne digital camera image semivariance for evaluation
of forest structural damage at an acid mine site. Remote Sensing of Environment, 68,
pp. 112–124.
LEVESQUE, J. and KING, D., 2003, Spatial analysis of radiometric fractions from high-
resolution multi-spectral imagery for modelling individual tree crown and forest
canopy structure and health. Remote Sensing of Environment, 84, pp. 859–602.
LU, D. and WENG, Q., 2007, A survey of image classification methods and techniques for
improving classification performance. International Journal of Remote Sensing, 28, pp.
823–870.
MIRANDA, F.P. and FONSECA, L.E.N., 1998, Semivariogram textural classification of JERS-1
(Fuyo-1) SAR data obtained over a flooded area of the Amazon rainforest.
International Journal of Remote Sensing, 19, pp. 549–556.
NEL, E.M., WESSMAN, C.A. and VEBLEN, T.T., 1994, Digital and visual analysis of Thematic
Mapper imagery for differentiating old growth from younger spruce-fir stands.
Remote Sensing of Environment, 48, pp. 291–301.
RUIZ, L.A., FDEZ-SARRIA, A. and RECIO, J.A., 2004, Texture feature extraction for
classification of remote sensing data using wavelet decomposition: a comparative
study. In Proceedings of the 20th ISPRS Congress, IAPSR Vol. XXXV (B4), Istanbul,
Turkey, pp. 1109–1114.
SEDANO, F., GONG, P. and FERRAO, M., 2005, Land cover assessment with MODIS imagery
in southern African Miombo ecosystems. Remote Sensing of Environment, 98, pp.
429–441.
ST-ONGE, B. and CAVAYAS, F., 1995, Estimating forest stand structure from high resolution
imagery using the directional semivariogram. International Journal of Remote Sensing,
16, pp. 1999–2021.
ST-ONGE, B. and CAVAYAS, F., 1997, Automated forest structure mapping from high
resolution imagery based on directional semivariogram estimates. Remote Sensing of
Environment, 61, pp. 82–95.
WULDER, M., FRANKLIN, S. and LAVIGNE, M., 1996, Statistical texture proprieties of forest
structure for improved estimates of LAI from CASI. In Proceedings of the 26th
International Symposium on Remote Sensing of the Environment and 18th Annual
Symposium of the Canadian Remote Sensing Society, Vancouver, pp. 111–164.
WULDER, M., LEDREW, E., FRANKLIN, S. and LAVIGNE, M., 1998, Aerial image textural
information in the estimation of northern deciduous and mixed wood forest Leaf
Area Index. Remote Sensing of Environment, 64, pp. 64–76.
ZAWADZKI, J., CIESZEWSKI, C.J., ZASADA, M. and LOWE, R.C., 2005, Applying geostatistics
for investigations of forest ecosystems using remote sensing imagery. Silva Fennica,
39, pp. 599–616.
ZHANG, C., FRANKLIN, S.E. and WULDER, M.A., 2004, Geostatistical and texture analysis of
airborne-acquired images used in forest classification. International Journal of Remote
Sensing, 25, pp. 859–865.
ZHANG, Y., 2001, A spectral and spatial information integrated approach for tree extraction
from high-resolution digital imagery. In Beyond Information Infrastructure,
Proceedings of the Digital Earth 2001 Conference, Fredericton, 24–28 June.
Automatic classification of complex Alpine areas 2873
Downloaded By: [Universita di Trento] At: 11:20 27 June 2009
Recommended