Future NASA High Spatial Resolution Missions Relevant to Volcanology
Informal discussion notes for Tuesday evening meeting of the
IAVCEI Remote Sensing Commission Meeting,IUGG Perugia
Dave Pieri, JPL

Current NASA High Spatial Resolution Missions Relevant to Volcanology
• ASTER (with METI Japan)– Terra spacecraft nominal– ASTER SWIR bands 4-9 are suffering from inefficient focal plane
cooling– Remedies have been tried with limited success– If not corrected, expect ASTER SWIR bands 5-9 will not function
beyond another 4-6 months– ASTER TIR and VNIR bands are nominal
• Landsat 5 and ETM +– Numerous anomalies summarized in Jim Irons’ slides– Limping along
• EO-1– ALI and Hyperion operating nominally(?) Let’s ask Ashley Davies
for update?

Future Hi Spatial Resolution Missions Relevant to Volcanology
• Landsat Continuity Mission—2012 launch– Current study contracts are let– No TIR envisioned because of $$– Jim Irons, NASA GSFC Science Lead
• HyspIRI-TIR—Potential 2012 launch, 36 month operation.– TIR component called for in US NRC Decadal Survey.– Still in nascent study phase.– Simon Hook, JPL, Science Lead

Page 4 4
Status of theLandsat Data Continuity Mission
In-progress discussion slides provided by Jim Irons, NASA GSFC
emphasis (red bold) provided by Dave Pieri, JPL

Page 5 5
Revised Implementation Strategy
• OSTP Director Marburger signed Dec. 23, 2005 memorandum with subject line, “Landsat Data Continuity Strategy Adjustment”
– supercedes previous direction to fly Landsat sensors
aboard NPOESS satellites (Aug. 04, 2004 memorandum)
– Directs NASA to acquire free-flyer spacecraft
– Assigns DOI / USGS the responsibility for operating the
spacecraft
– States goal of developing “a long-term plan to achieve,
technical, financial, and managerial stability for
operational land imaging”

Page 6 6
Decadal Survey
• Executive Summary states:– “Recommendation: NASA should ensure continuity of measurements
of precipitation and land cover by:
• Launching GPM in or before 2012.
• Securing replacement to Landsat 7 data before 2012.”
• The Decadal Survey, pre-publication copy released Jan. 12, recommends in Chapter 6, Human Health and Security: – “Implement an effective Landsat 7 follow-on program including a
slightly enhanced reflective channel selection and an effective thermal band selection”

Page 7 7
LDCM Instrument Schedule
• Jan. 09, 2007 - NASA released request for proposals (RFP) for an Operational Land Imager (OLI) – Proposals were due on Feb. 23
– Evaluations are in progress
– The RFP did NOT include a thermal imaging option
• July 2007 - OLI contract award expected
Page 8 8
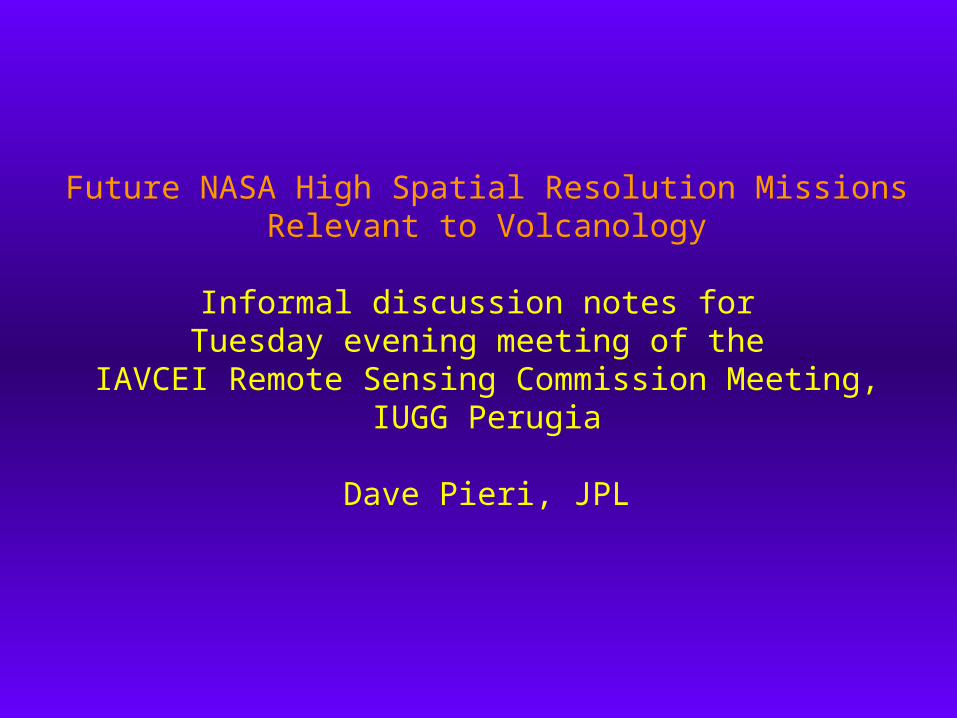
OLI SpecificationsTable 1. Required Spectral Bands and Spatial Resolution
# Band
MinimumLower
Band Edge(nm)
MaximumUpper
Band Edge(nm)
Center
Wavelength
(nm)
MaximumSpatial
Resolution
At Nadir
(m)
1 Coastal/Aerosol
433 453 443 30
2 Blue 450 515 482 30
3 Green 525 600 562 30
4 Red 630 680 655 30
5 NIR 845 885 865 30
6 SWIR 1 1560 1660 1610 30
7 SWIR 2 2100 2300 2200 30
8 Panchromatic 500 680 590 15
9 Cirrus 1360 1390 1375 30

Page 9 9
Thermal InfraRed Sensor (TIRS)
• The OLI RFP does NOT include an option for a TIRS– Despite a heritage of thermal imaging from Landsat satellites, the LDCM
currently carries no requirements for thermal imaging
– The LDCM budget does not currently include funding for a TIRS
• The community of people that use fine scale thermal imagery from the current Landsat satellites are proactively calling for the continuation of thermal imaging from the LDCM– For example, the National Research Council’s Decadal Survey Panel received
a letter (Sept. 14, 2006) signed by 117 water managers and scientists:
• “The accuracy of Landsat-scale TIR evapotranspiration (ET) estimates has improved to the point that consumptive use and water rights can be reliably monitored from space at the scale of a single irrigation system.”
• Addition of a TIRS to the LDCM payload is still under consideration by NASA HQ

Page 10 10
Research to Operations
• Landsat thermal data are now used operationally to monitor water consumption on a field-by-field basis in the U.S. West and internationally– Development of operational energy-
balanced-based evapotranspiration models
• SEBAL
• METRIC
• Water rights regulation and administration are critically tied to identification and quantification of water consumption on a field-by-field basis - Allen, R.G. “The Need to Continue High Resolution Thermal Imagery …”
– Typical irrigated field sizes in the U.S. range from 180 m to 750 m on a side
• Quantification of water use from Landsat using thermal data is the only way to independently and consistently measure water use on a field-by-field basis - Morse, A., and R.G. Allen. “Water and the Critical Need for a Thermal Band on Landsat”
Using 120 m Landsat 5 Thermal DataCourtesy of Richard Allen, Kimberly Research and Extension Center, University of
Idaho

Page 11 11
Thermal Data Continuity
Coverage Spatial Resolution
Temporal Resolution
CurrentDataSources
FutureDataSources
Global 10-20 km Hourly AIRSGOESMSG
CrISGOESMSG
Regional 1-5 km 2-4 times daily
MODIS AVHRRATSR
VIIRSAVHRRATSR
Local 30–100 m Once every 8-16 days
ASTERLandsat
Land Surface Temperature and Emissivity Earth System Data Record (LSTE-ESDR)
Land Surface Temperature and Emissivity Earth System Data Record (LSTE-ESDR)
Table from S. Hook
!!!!
Page 12 12
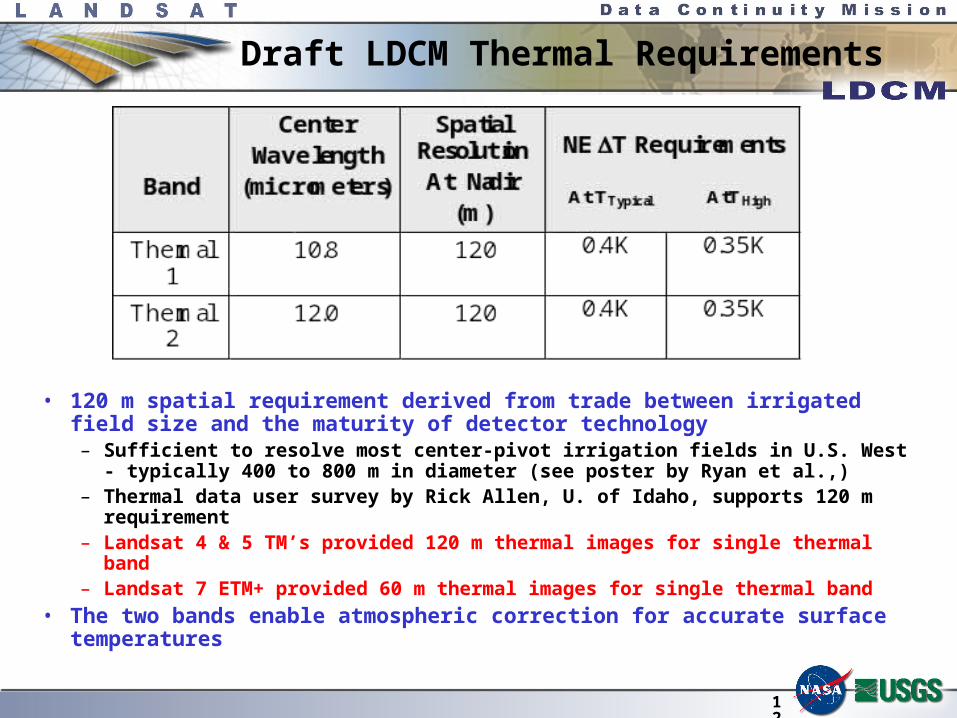
• 120 m spatial requirement derived from trade between irrigated field size and the maturity of detector technology
– Sufficient to resolve most center-pivot irrigation fields in U.S. West - typically 400 to 800 m in diameter (see poster by Ryan et al.,)
– Thermal data user survey by Rick Allen, U. of Idaho, supports 120 m requirement– Landsat 4 & 5 TM’s provided 120 m thermal images for single thermal band– Landsat 7 ETM+ provided 60 m thermal images for single thermal band
• The two bands enable atmospheric correction for accurate surface temperatures
Draft LDCM Thermal Requirements
Page 13 13
LDCM Spacecraft Schedule
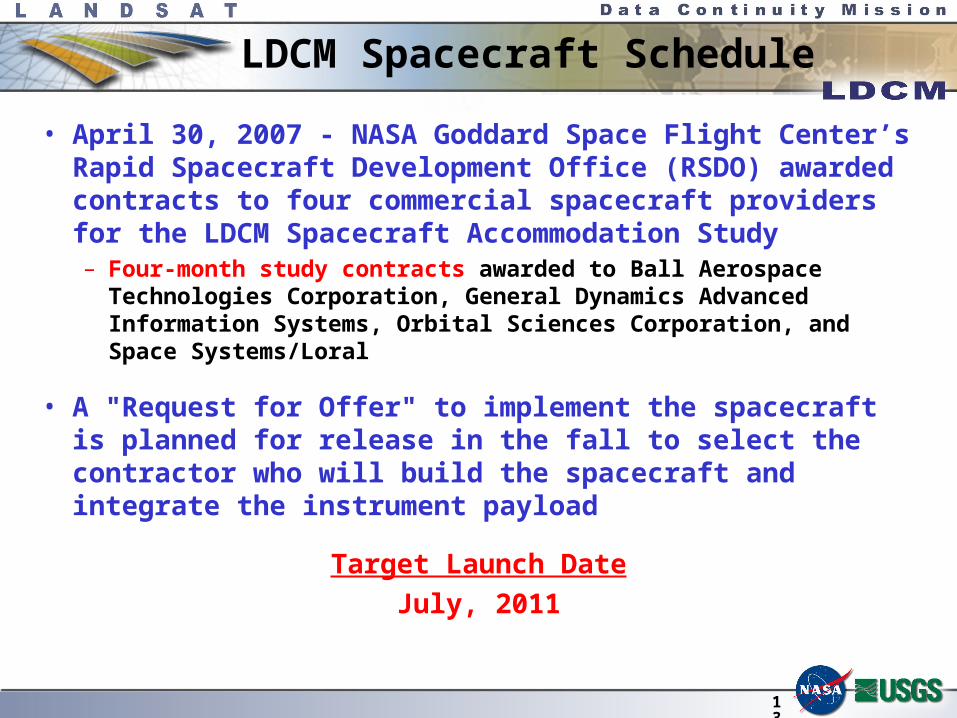
• April 30, 2007 - NASA Goddard Space Flight Center’s Rapid Spacecraft Development Office (RSDO) awarded contracts to four commercial spacecraft providers for the LDCM Spacecraft Accommodation Study– Four-month study contracts awarded to Ball Aerospace Technologies
Corporation, General Dynamics Advanced Information Systems, Orbital Sciences Corporation, and Space Systems/Loral
• A "Request for Offer" to implement the spacecraft is planned for release in the fall to select the contractor who will build the spacecraft and integrate the instrument payload
Target Launch Date
July, 2011

Page 14 14
Landsat Science Team
• USGS convened the first meeting of the USGS-sponsored science team for Jan. 09 - 11 at USGS EROS in Sioux Falls, SD– Co-chaired by the USGS Landsat Project Scientist, Tom Loveland,
and the NASA LDCM Project Scientist, Jim Irons
– USGS selected 17 science team members in Oct.
• 8 funded PI’s from academia and private industry
• 6 unfunded civil servant PI’s and 3 unfunded international PI’s
– Team selected Curtis Woodcock, Boston U., as Team Leader
• Curtis signed and sent the thermal imaging letter to NASA Administrator and USGS Director on behalf of Science Team
• Second meeting convened June 12 - 14 in Corvallis, Oregon
Page 15 15
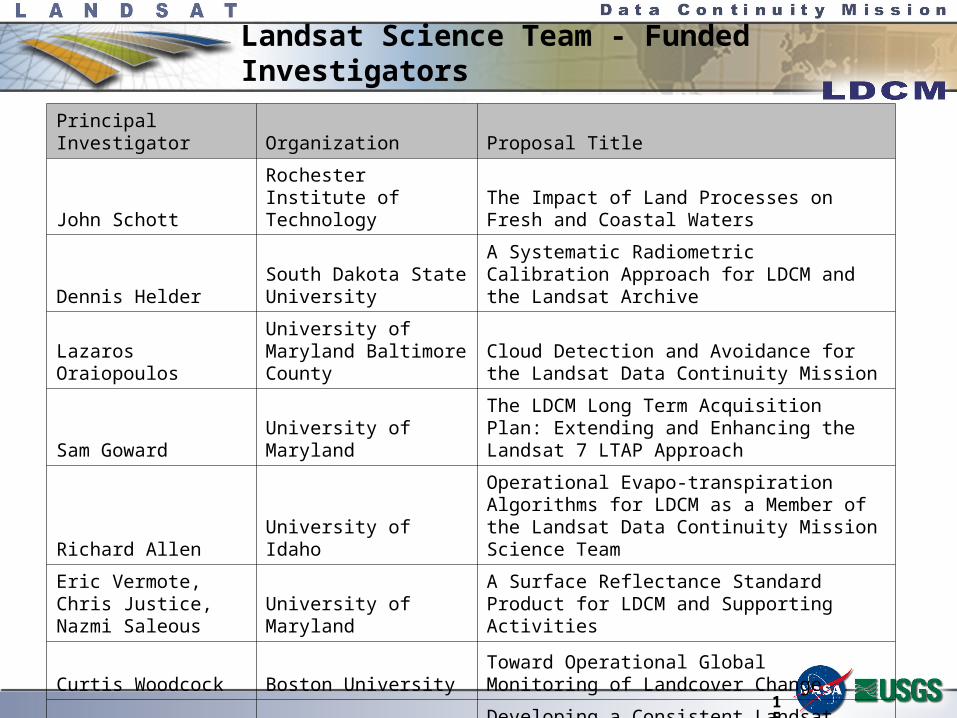
Landsat Science Team - Funded Investigators
Principal Investigator Organization Proposal Title
John SchottRochester Institute of Technology
The Impact of Land Processes on Fresh and Coastal Waters
Dennis HelderSouth Dakota State University
A Systematic Radiometric Calibration Approach for LDCM and the Landsat Archive
Lazaros OraiopoulosUniversity of Maryland Baltimore County
Cloud Detection and Avoidance for the Landsat Data Continuity Mission
Sam Goward University of MarylandThe LDCM Long Term Acquisition Plan: Extending and Enhancing the Landsat 7 LTAP Approach
Richard Allen University of Idaho
Operational Evapo-transpiration Algorithms for LDCM as a Member of the Landsat Data Continuity Mission Science Team
Eric Vermote, Chris Justice, Nazmi Saleous University of Maryland
A Surface Reflectance Standard Product for LDCM and Supporting Activities
Curtis Woodcock Boston UniversityToward Operational Global Monitoring of Landcover Change
Feng GaoEarth Resources Technology
Developing a Consistent Landsat Data Set from MSS, TM/ETM+ and International Sources for Land Cover Change Detection

Page 16 16
Landsat Science Team - International & Federal
Principal Investigator Organization Proposal Title
Michael Wulder Canadian Forest ServiceLarge-Area Land Cover Mapping and Dynamics: Landsat Imagery to Information
Eileen Helmer
U.S. Forest Service International Institute of Tropical Forestry
Cloud-Free Landsat Image Mosaics for Monitoring Tropical Forest Ecosystems
Martha AndersonUSDA Agricultural Research Service
Mapping Drought and Evapo-transpiration at High Spatial Resolution Using Landsat Thermal and Surface Reflectance Band Imagery
Alan Belward, Frederic Achard, Philippe Mayaux EC Joint Research Center
Natural Resources Management - Meeting Millennium Development Goals
Warren CohenU.S. Forest Service Pacific Northwest Research Station
Landsat and Vegetation Change: Towards 50 Years of Observation and Characterization
Robert Bindshadler NASA GoddardAdvancing Ice Sheet Research with the Next Generation Landsat Sensor
Prasad ThenkabailInternational Water Management Institute
Global Irrigated Area Mapping using Landsat 30-m for the Years 2000 and 1975
Rama Nemani NASA Ames Developing Biophysical Products for Landsat
Jim Vogelmann SAIC/EROS
Monitoring Forest and Rangeland Change Using Landsat Continuity and Alternative Sources of Satellite Data
Page 17 17
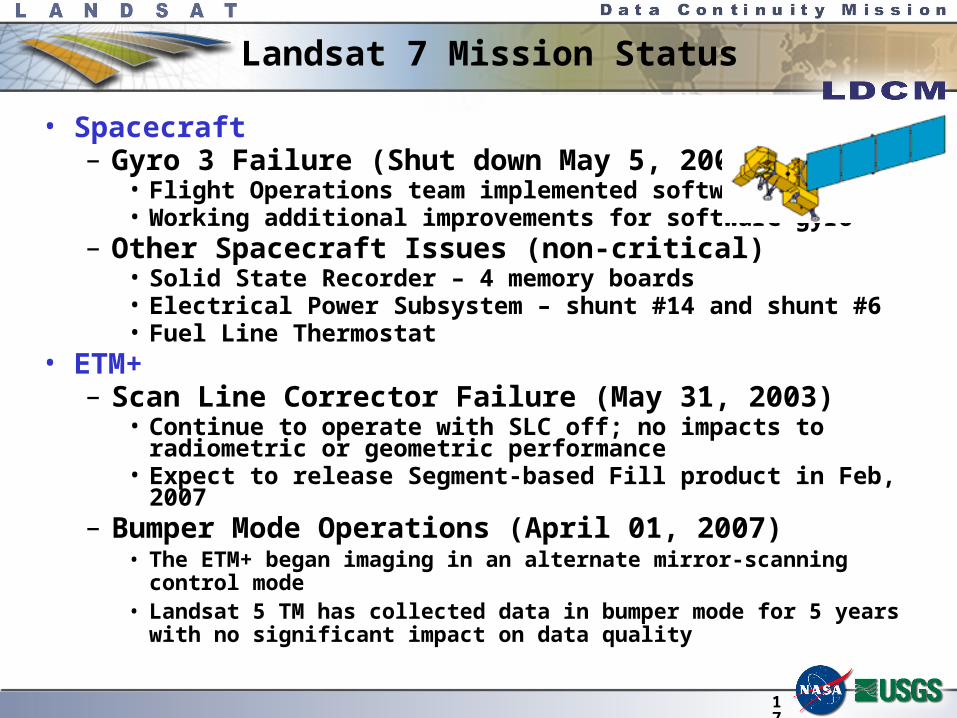
Landsat 7 Mission Status
• Spacecraft– Gyro 3 Failure (Shut down May 5, 2004)
• Flight Operations team implemented software gyro• Working additional improvements for software gyro
– Other Spacecraft Issues (non-critical)• Solid State Recorder – 4 memory boards • Electrical Power Subsystem – shunt #14 and shunt #6• Fuel Line Thermostat
• ETM+– Scan Line Corrector Failure (May 31, 2003)
• Continue to operate with SLC off; no impacts to radiometric or geometric performance
• Expect to release Segment-based Fill product in Feb, 2007– Bumper Mode Operations (April 01, 2007)
• The ETM+ began imaging in an alternate mirror-scanning control mode• Landsat 5 TM has collected data in bumper mode for 5 years with no
significant impact on data quality

Page 18 18
Landsat 7 Spacecraft Status
705 Km altitude Circular/Polar Orbit Launched April 15, 1999
ETM+
• 5/31/2003 SLC Failure• 2007 likely end of SAM Mode
Solar Array • 5/14/2002 EPS Circuit #14 Failure• 5/16/2005 EPS Circuit # 6 Failure• (Each circuit represents 1/16 of
capability, 12/16 needed)Solid State Recorder
• 11/15/1999 SSR PWA #23 Loss• 02/11/2001 SSR PWA #12 Loss• 12/07/2005 SSR PWA #02 Loss• 08/02/2006 SSR PWA #13 Loss• (Each PWA is 4% loss of
capacity, likely recoverable)
Attitude Control System
• 05/05/2004 Gyro 3 Shut Off
Reaction Control System • 1/7/04 Fuel line #4 thermostat #1a failure.• 2/24/05 Fuel line #4 thermostat #1b failure
Gimbaled X-band Antennas(04/26/2000 GXA/ETM+ Interaction discovered)

Page 19 19
Landsat 5 Mission Status
• Spacecraft– Solar Array Drive Malfunction
• Fixed array operations – Aug 2006
– X-band Transmission (March 2006)• Power spikes associated with TWTA (Traveling Wave Tube Amplifier)• New turn on procedure to avoid spikes
• TM– Functioning normally in bumper-mode

Page 20 20
Landsat-5 Flight Segment Overview
HIGH GAIN ANTENNA• 8/85 Transmitter A failure
MULTI-SPECTRAL SCANNER• 8/95 Band 4 failure
SOLAR ARRAY DRIVE / PANELS• 01/05 Primary Solar Array Drive failure• 11/05 Redundant Solar Array Drive Malfunction• 08/06 Transitioned to Fixed Array Operations
COARSE SUN SENSORS
GPS ANTENNA• Not Operational
OMNI ANTENNAS
ACS MODULE• 07/03 FHST#1 Degradation• Skew wheel tack anomaly 10/92• 11/92 Earth Sensor 1 failure• 02/02 Earth Sensor 2 failure• Intermittent operations possible
PROPULSION MODULE• 3/84 Primary Thruster D failure
POWER MODULE• 05/04 Battery 1 failure / Removed from power circuits
THEMATIC MAPPER• 10/94 Power Supply 1 stuck switch• 06/02 TM switched to bumper mode
WIDEBAND COMM. MODULE• 07/88 Ku-band TWTA Prime failure (OCP)• 07/92 Ku-band TWTA Redundant failure (OCP)• 08/87 X-band TWTA Prime failure (OCP) • 03/06 X-band TWTA Redundant Anomaly
X-BAND ANTENNA
DIRECT ACCESS S-BAND• 03/94 Side A FWD Power Sensor failure
COMM & DATA HANDLING MODULETransmitter A failure

Page 21 21
U.S.G.S. EROS Landsat Archive Overview(Marketable Scenes through September 25, 2006)
• ETM+: Landsat 7– 654,932 scenes– 608TB RCC and L0Ra Data– Archive grows by 260GB Daily
• TM: Landsat 4 & Landsat 5– 671,646 scenes– 336TB of RCC and L0Ra Data– Archive Grows by 40GB Daily
• MSS: Landsat 1 through 5– 641,555 scenes– 14TB of Data
Archive reached 2 million scenes on Feb. 20, 2007

Page 22 22
Pilot Project: Web Enabled Standard ETM+ Product
• The USGS is posting Level 1Gt (orthorectified, radiometrically corrected) Landsat 7 ETM+ scences on an FTP site for downloading at no cost as a pilot project
• Available via the USGS Global Visualization Viewer– URL: http://glovis.usgs.gov/– Information at URL:
http://www.usgs.gov/newsroom/article.asp?ID=1676
• Pilot Datasets– US only – includes Alaska and Hawaii– L7 ETM+ SLC-off only – 2003 to present (and ongoing)– < 10% cloud cover, 9 quality

HyspIRI Thermal Infrared Multispectral Scanner
NASA Mission Concept Study
Working Slides provided by Simon Hook, JPL(NASA Center Science Lead)
Red emphasis added by Dave Pieri, JPL

HyspIRI Thermal Infrared Multispectral Scanner NASA Mission Concept Study
Science Questions:
Q1. Volcanoes: What are the changes in the behavior of active volcanoes? Can we quantify the amount of material released into the atmosphere by volcanoes and estimate its impact on Earth's climate? How can we help predict and mitigate volcanic hazards?
Q2. Wildfires: What is the impact of global biomass burning on the terrestrial biosphere and atmosphere, and how is this impact changing over time?
Q3. Urbanization: How does urbanization affect the local, regional and global environment? Can we characterize this effect to help mitigate its impact on human health and welfare?
Q4. Water Use and Availability: As global freshwater supplies become increasingly limited, how can we better characterize trends in local and regional water use and moisture availability to help conserve this critical resource?
Q5. Land surface composition and change: What is the composition and temperature of the exposed surface of the Earth? How do these factors change over time and affect land use and habitability?
TIR Multispectral Scanner: 45.3kg / 41.9W
Instrument cost (FY07$M ): 40-54M
Schedule: 4 year phase A-D, 3 years operations
All components have flown in space
Measurement:
• 7 bands between 7-5-12 um and 1 band between 3-5 um
• 45 m resolution, 5 days revisit
• Global land and shallow water
Volcanoes
Urbanization
Water Use and Availability
Surface Temp. Evapotransp.
Andean volcano heats up
0
0.1
0.2
0.3
0.4
0.5
0.6
0.7
0.8
0.9
1
3.00 4.00 5.00 6.00 7.00 8.00 9.00 10.00 11.00 12.00 13.00
Wavelength (um)
Re
lati
ve
Sp
ec
tra
l Re
sp
on
se
H1 (m21)H2 (m28)H3 (a10)H4 (a11)H5 (a12)H6H7H8 (m32)
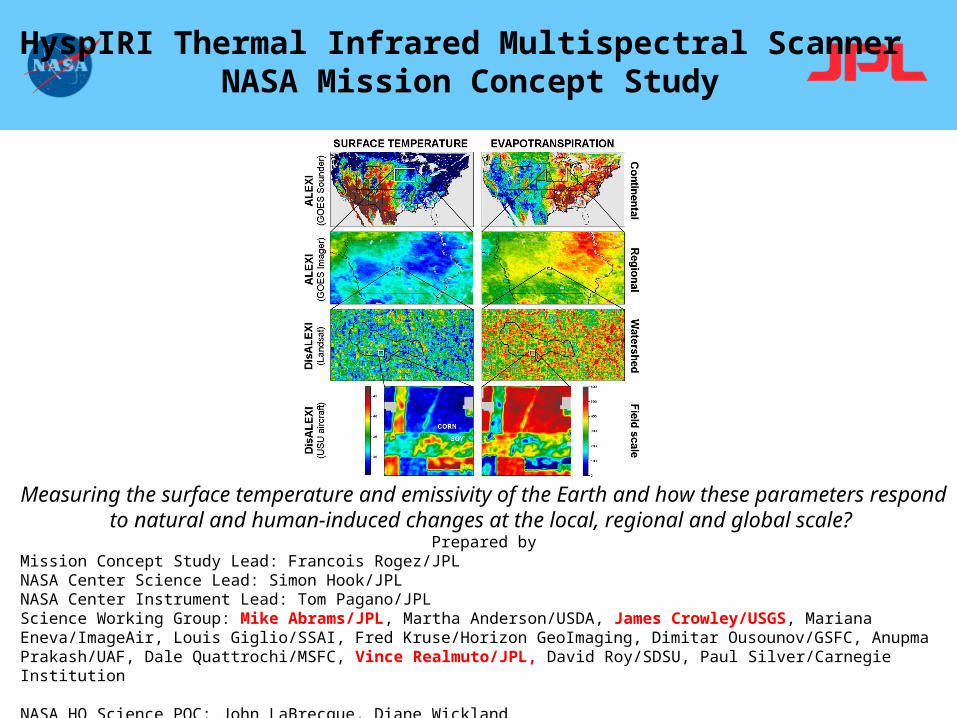
Measuring the surface temperature and emissivity of the Earth and how these parameters respond to natural and human-induced changes at the local, regional and global scale?
Prepared byMission Concept Study Lead: Francois Rogez/JPLNASA Center Science Lead: Simon Hook/JPLNASA Center Instrument Lead: Tom Pagano/JPLScience Working Group: Mike Abrams/JPL, Martha Anderson/USDA, James Crowley/USGS, Mariana Eneva/ImageAir, Louis Giglio/SSAI, Fred Kruse/Horizon GeoImaging, Dimitar Ousounov/GSFC, Anupma Prakash/UAF, Dale Quattrochi/MSFC, Vince Realmuto/JPL, David Roy/SDSU, Paul Silver/Carnegie Institution
NASA HQ Science POC: John LaBrecque, Diane Wickland
HyspIRI Thermal Infrared Multispectral Scanner NASA Mission Concept Study

Executive SummaryHyspIRI Thermal Infrared Multispectral Scanner
NASA Mission Concept Study
This mission provides the surface temperature and emissivity of the Earth at high spatial resolution (45m) and high temporal resolutions (weekly) for studies at the local, regional and global scale.
These measurements will be used to address key science questions in five research areas: 1) Volcanoes, 2) Wildfires, 3) Urbanization, 4) Water Use and Availability, 5) Land Surface Composition and Change
The science, measurements, and algorithms enabling this mission have been consistently demonstrated with spaceborne, airborne and ground experiments.
The HyspIRI-TIR instrument and mission have high relevant heritage, moderate risk and modest cost.
This mission addresses a set of compelling science questions that have beenrepeatedly identified as critical to science and society by independentassessments and scientific panels. Recent examples include: the NRCDecadal Survey, the 4th assessment of the IPCC and the Millennium EcosystemAssessment (2005).
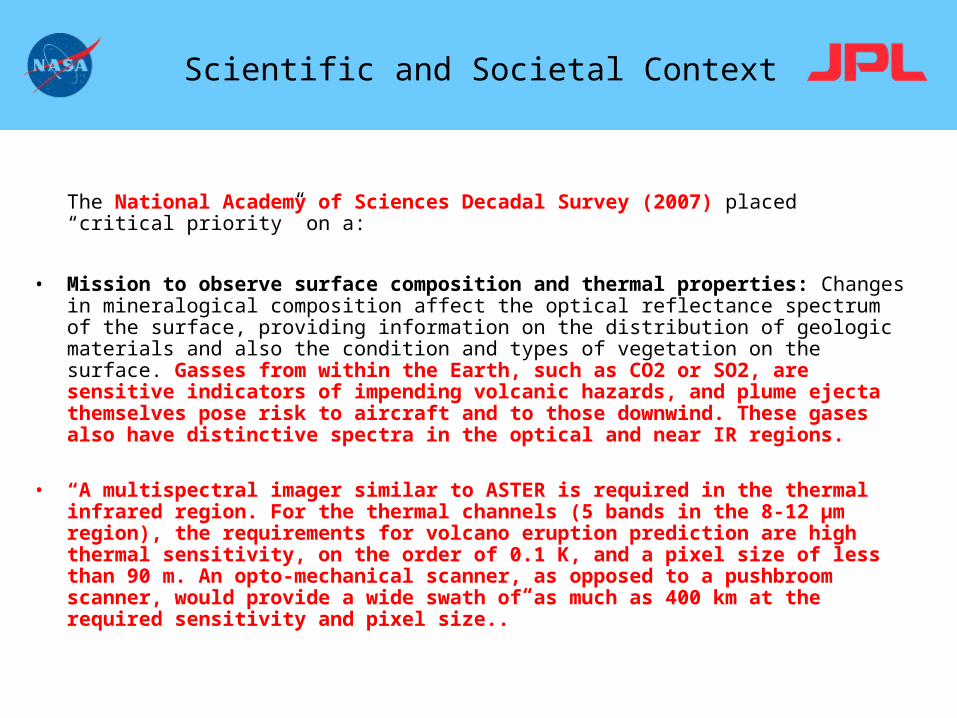
The National Academy of Sciences Decadal Survey (2007) placed “critical priority” on a:
• Mission to observe surface composition and thermal properties: Changes in mineralogical composition affect the optical reflectance spectrum of the surface, providing information on the distribution of geologic materials and also the condition and types of vegetation on the surface. Gasses from within the Earth, such as CO2 or SO2, are sensitive indicators of impending volcanic hazards, and plume ejecta themselves pose risk to aircraft and to those downwind. These gases also have distinctive spectra in the optical and near IR regions.
• “A multispectral imager similar to ASTER is required in the thermal infrared region. For the thermal channels (5 bands in the 8-12 μm region), the requirements for volcano eruption prediction are high thermal sensitivity, on the order of 0.1 K, and a pixel size of less than 90 m. An opto-mechanical scanner, as opposed to a pushbroom scanner, would provide a wide swath of as much as 400 km at the required sensitivity and pixel size..”
Scientific and Societal Context

• Q1. Volcanoes– What are the changes in the behavior of active volcanoes? Can we quantify the amount of material released into the atmosphere by volcanoes and
estimate its impact on Earth's climate? How can we help predict and mitigate volcanic hazards?
• Q2. Wildfires – What is the impact of global biomass burning on the terrestrial biosphere and atmosphere, and how is this impact changing over time?
• Q3. Urbanization– How does urbanization affect the local, regional and global environment? Can we characterize this effect to help mitigate its impact on human health and welfare?
• Q4. Water Use and Availability– As global freshwater supplies become increasingly limited, how can we better characterize trends in local and regional water use and moisture availability to help
conserve this critical resource?
• Q5. Land surface composition and change– What is the composition and temperature of the exposed surface of the Earth? How do these factors change over time and affect land use and habitability?
Science Questions
Overarching
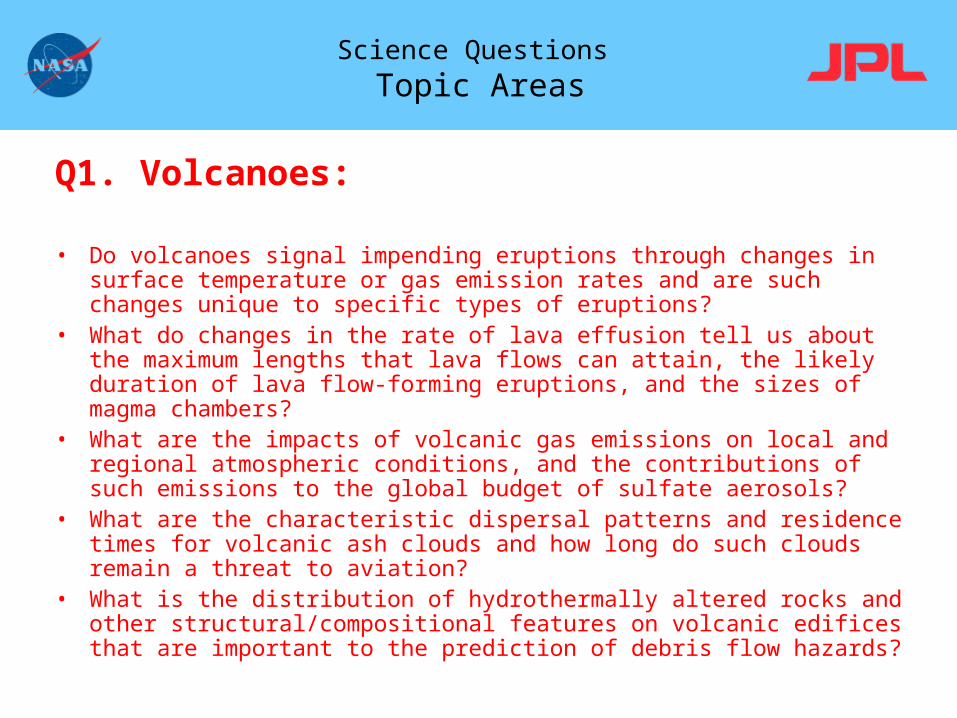
Q1. Volcanoes:
• Do volcanoes signal impending eruptions through changes in surface temperature or gas emission rates and are such changes unique to specific types of eruptions?
• What do changes in the rate of lava effusion tell us about the maximum lengths that lava flows can attain, the likely duration of lava flow-forming eruptions, and the sizes of magma chambers?
• What are the impacts of volcanic gas emissions on local and regional atmospheric conditions, and the contributions of such emissions to the global budget of sulfate aerosols?
• What are the characteristic dispersal patterns and residence times for volcanic ash clouds and how long do such clouds remain a threat to aviation?
• What is the distribution of hydrothermally altered rocks and other structural/compositional features on volcanic edifices that are important to the prediction of debris flow hazards?
Science Questions
Topic Areas
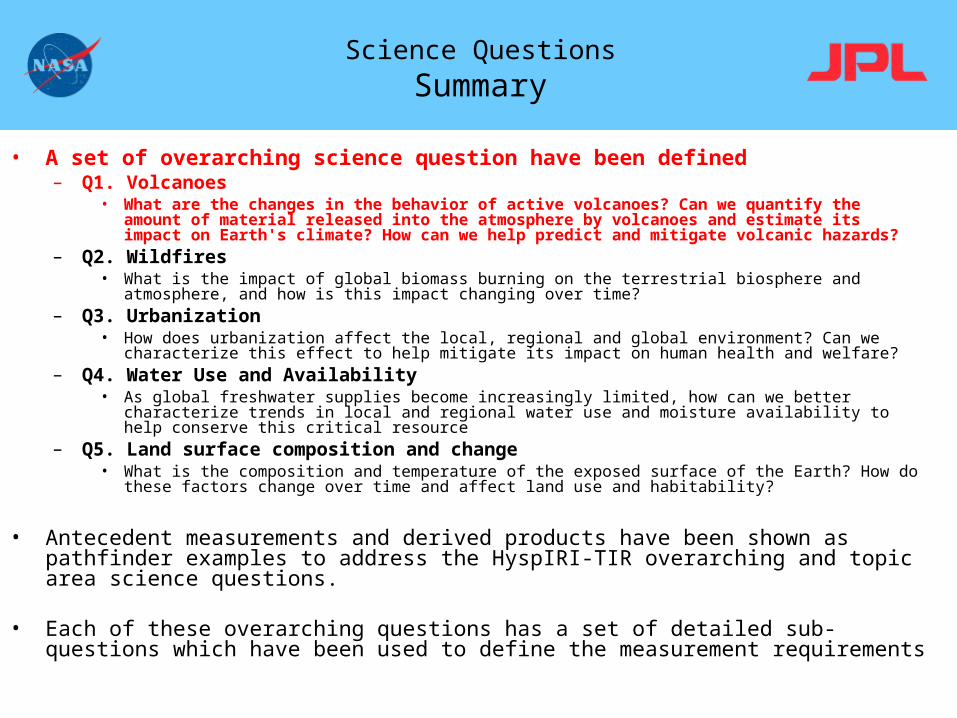
• A set of overarching science question have been defined– Q1. Volcanoes
• What are the changes in the behavior of active volcanoes? Can we quantify the amount of material released into the atmosphere by volcanoes and estimate its impact on Earth's climate? How can we help predict and mitigate volcanic hazards?
– Q2. Wildfires • What is the impact of global biomass burning on the terrestrial biosphere and atmosphere, and how is this impact
changing over time?– Q3. Urbanization
• How does urbanization affect the local, regional and global environment? Can we characterize this effect to help mitigate its impact on human health and welfare?
– Q4. Water Use and Availability• As global freshwater supplies become increasingly limited, how can we better characterize trends in local and
regional water use and moisture availability to help conserve this critical resource– Q5. Land surface composition and change
• What is the composition and temperature of the exposed surface of the Earth? How do these factors change over time and affect land use and habitability?
• Antecedent measurements and derived products have been shown as pathfinder examples to address the HyspIRI-TIR overarching and topic area science questions.
• Each of these overarching questions has a set of detailed sub-questions which have been used to define the measurement requirements
Science Questions
Summary

Science Measurements
Approach
• Measure the global land and coastal/shallow water (> -50m).
• 5 day equatorial revisit to generate monthly, seasonal and annual products.
• 45 m spatial resolution
Spatial 1000 m
• 7 bands between 7.5-12 µm and 1 band between 3-5 µm
• 3-5 µm band saturates at 1100K
• 7-12 µm bands saturate at 400K
HyspIRI-TIR at 45 m
0
0.1
0.2
0.3
0.4
0.5
0.6
0.7
0.8
0.9
1
3.00 4.00 5.00 6.00 7.00 8.00 9.00 10.00 11.00 12.00 13.00
Wavelength (um)
Rel
ativ
e S
pec
tral
Res
po
nse
H1 (m21)H2 (m28)H3 (a10)H4 (a11)H5 (a12)H6H7H8 (m32)

Mission Concept
HyspIRI-TIR Overview
• Duration: 4 years implementation, 3 years science
• Coverage: Global land and coast/shallow water every 5 days
• Day and Night imaging (1 day and night image at a given location obtained every 5 days
• Data download using dual-polarization X-band at high-latitude stations
• Instrument: 67W, 100kg, 1.6X1.6X1 m
• Spacecraft: LEO RSDO bus (SA-200HP)
• Launch: Taurus-class launch vehicle.ElectronicsModule
Sunshade
ScanMirror
Blackbody(V-Groove)
CassegrainTelescope
ThermallyIsolated &ControlledOptical Bench
PassiveRadiator
ActiveCryo-Cooler

HyspIRI-TIR Instrument Concept
• Spatial– 623 km Orbit– 45 m IFOV, MTF = 0.2 @ fNy
– Swath: 600 km (±25.5º), Paddle Mirror Scanner
• Multispectral– 8 Bands– 3.9 – 12.7 m– Dielectric Bandpass Filters
• Radiometric– NEdT < 0.2K– 20 cm Aperture
• Calibration– Full Aperture Blackbody– Chopper for Low Frequency Noise
wl_min wl_max wl_cent bw
(um) (um) (um) (um)
3.93 3.99 3.96 0.06
8.125 8.475 8.3 0.35
8.475 8.825 8.65 0.35
8.925 9.275 9.1 0.35
10.25 10.95 10.6 0.7
10.78 11.28 11.03 0.5
11.77 12.27 12.02 0.5
Heritage: MODIS, Landsat, M3
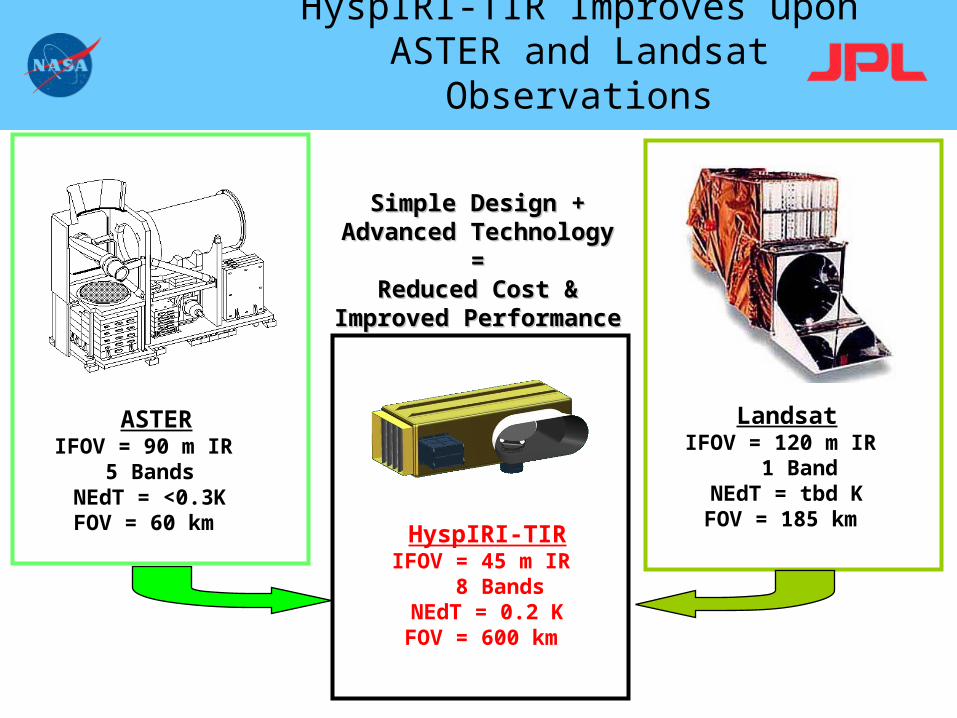
HyspIRI-TIR Improves upon ASTER and Landsat Observations
HyspIRI-TIRIFOV = 45 m IR
8 BandsNEdT = 0.2 KFOV = 600 km
Simple Design +Simple Design +Advanced Technology Advanced Technology
==Reduced Cost &Reduced Cost &
Improved PerformanceImproved Performance
ASTERIFOV = 90 m IR
5 BandsNEdT = <0.3KFOV = 60 km
LandsatIFOV = 120 m IR
1 BandNEdT = tbd KFOV = 185 km

Spatial and Radiometric Performance Improvement
0
0.05
0.1
0.15
0.2
0.25
0.3
0.35
0.4
0.45
0.5
8.3 8.65 9.1 10.6 11.03 12.02
Band
NE
dT
ETM+
HyspIRI-TIR
ASTER-TIR
NEdT (K)Spatial Resolution
0
20
40
60
80
100
120
140
ETM ASTER HyspIRI
IFOV
(m)
Spatial (IFOV)

Mission Concept
Instrument Calibration
• Every scan will be calibrated with a V-Groove design blackbody. • Once a month (fixed Moon phase), the spacecraft attitude will be adjusted during the eclipsed part of the orbit to
make the Moon cross the instrument field-of-view.• Every month calibration data from a small number of continuously operating test sites will be acquired. • Periodically (few times per year, calibration data will be acquired from other sites of interest, e.g. hot
targets.
Onboard CalibrationLunar CalibrationGround Calibration
Blackbody
B10 B11 B12
B13 B14

Programmatic
Schedule
Method:
•TeamX project schedule for a mission with new engineering but no new technology development.
•Instrument schedule based on recent experience with M3.
Mission Schedule: 4 years implementation and 3 years on-orbit science

Science Measurements
Key SNR and Uniformity Requirements
Benchmark Radiances Required SNR
Hyperspectral Imager
Backup Slide

SpectralRange 380 to 2500 nm in the solar reflected spectrumSampling <= 10 nm {uniform over range}Response <= 10 nm (full-width-at-half-maximum) {uniform over range}Accuracy <0.5 nm
RadiometricRange & Sampling 0 to 1.5 X max benchmark radiance, 14 bits measuredAccuracy >95% absolute radiometric, 98% on-orbit reflectance, 99.5% stabilityPrecision (NEdT) See spectral plots at benchmark radiancesLinearity >99% characterized to 0.1 %Polarization <2% sensitivity, characterized to 0.5 %Scattered Light <1:200 characterized to 0.1%
SpatialRange >145 km (12 degrees at 700 km altitude)Cross-Track Samples >2400Sampling <=60 mResponse <=60 m sampling (FWHM)
UniformitySpectral Cross-Track >95% cross-track uniformity {<0.5 nm min-max over swath}Spectral-IFOV-Variation >95% spectral IFOV uniformity {<5% variation over spectral range}
Hyperspectral Imager
Science MeasurementsSummary Measurement Characteristics
Backup Slide
Dave’s Unofficial Conclusions
• There exists community wide concern about the potential lack of continuity in the Landsat line…
• Also expressions of concern (specifically from European colleagues) regarding lack of defined ASTER follow-on.
• As yet there appears to be no strong commitment by NASA to advocate or provide provide instruments for cutting edge volcanological observations, despite the demonstrated utility and productivity of the Landsat mission line, and ASTER (and EO-1) missions in this area. Other disciplines requiring comparable data will also suffer. However, NASA response to NRC Decadal Survey is at least a step in the right direction. The overall NASA climate for new solid earth science or natural hazards missions, nevertheless, seems grim for now.
• There may be a narrow window of opportunity (6 months or less?) for US and international colleagues (e.g., this Remote Sensing Commission) to at least weigh-in with NASA on the necessity for acquiring data relevant to volcanological science and natural hazards in general.
• Opportunities to encourage multi-lateral mission initiatives? (Compelling and broad rationales required.)
Recommended