
FUZZY DATABASE FOR MEDICAL DIAGNOSIS
by
Rehana Parvin
BSc, AIUB, Dhaka, Bangladesh, 2004
A thesis
presented to Ryerson University
in partial fulfilment of the
requirements for the degree of
Master of Science
in the Program of
Computer Science
Toronto, Ontario, Canada, 2014
c©Rehana Parvin 2014

AUTHOR’S DECLARATION FOR ELECTRONIC SUBMISSION OF A THESIS
I hereby declare that I am the sole author of this thesis. This is a true copy of the
thesis, including any required final revisions, as accepted by my examiners.
I authorize Ryerson University to lend this thesis to other institutions or indi-
viduals for the purpose of scholarly research.
I further authorize Ryerson University to reproduce this thesis by photocopying or
by other means, in total or in part, at the request of other institutions or individuals
for the purpose of scholarly research.
I understand that my thesis may be made electronically available to the public.
REHANA PARVIN
ii
FUZZY DATABASE FOR MEDICAL DIAGNOSIS
Rehana Parvin
MSc, Computer Science, Ryerson University, 2014
ABSTRACT
A challenge of working with traditional database systems with large amounts
of data is that decision making requires numerous comparisons. Health-related
database systems are examples of such databases, which contain millions of data
entries and require fast data processing to examine related information to make
complex decisions. In this thesis, a fuzzy database system is developed by integra-
tion of fuzzy inference system (FIS) and fuzzy schema design, and implementing
it by SQL in three different health-care contexts; the assessments of heart disease,
diabetes mellitus, and liver disorders. The fuzzy database system is implemented
with the potential of having any form of data and tested with different types of data
value, including crisp, linguistic, and null (i.e., missing) data. The developed sys-
tem can explore crisp and linguistic data with loosely defined boundary conditions
for decision-making. FIS and neural network-based solutions are implemented in
MATLAB for the mentioned contexts for the comparison and validation with the
dataset used in published works.
iii

Acknowledgments
I would like to express my gratitude to my supervisor, Dr. Abdolreza Abhari,
for his enthusiastic support and excellent supervision. He has been extremely help-
ful and patient. Without his kind cooperation and ongoing support, completion of
this proposal would not have been possible. He created the novel idea used in this
research and directed all the system designs and software implementation. Any
further development of this research results or use of the implemented software
should be authorized by Dr.Abhari.
I would also like to thank the administrative assistants and technical staffs of the
Department of Computer Science at Ryerson University for their cooperation and
assistance.
My gratitude also goes to Dr. Hooman Tahayori post doctoral fellow in the De-
partment of Computer Science at Ryerson University, family physician Dr. Mark
Waxman, and physicians Dr. Brian Hanlon, Dr. Alykhan Jamal, and Dr. Anisur
Rahman, as well as to other consultants who assisted with the developed system. I
am also grateful to my friends in the distributed systems and multimedia process-
ing lab (DSMP) who helped me whenever in need.
I dedicate this thesis to my family- my husband, my son and my parents for their
ongoing support and encouragement in making my study period more enjoyable.
iv

To my family for their kindness and encouragement.
v

Contents
Declaration . . . . . . . . . . . . . . . . . . . . . . . . . . . . . . . . . . . . . iiAbstract . . . . . . . . . . . . . . . . . . . . . . . . . . . . . . . . . . . . . . . iiiAcknowledgments . . . . . . . . . . . . . . . . . . . . . . . . . . . . . . . . ivDedication . . . . . . . . . . . . . . . . . . . . . . . . . . . . . . . . . . . . . vTable of Contents . . . . . . . . . . . . . . . . . . . . . . . . . . . . . . . . . viiList of Abbreviations . . . . . . . . . . . . . . . . . . . . . . . . . . . . . . . viii
1 Introduction 11.1 Introduction . . . . . . . . . . . . . . . . . . . . . . . . . . . . . . . . . 11.2 Problem Statement . . . . . . . . . . . . . . . . . . . . . . . . . . . . . 21.3 Methodology . . . . . . . . . . . . . . . . . . . . . . . . . . . . . . . . 41.4 Objectives . . . . . . . . . . . . . . . . . . . . . . . . . . . . . . . . . . 51.5 Research Contributions . . . . . . . . . . . . . . . . . . . . . . . . . . . 61.6 Thesis Organization . . . . . . . . . . . . . . . . . . . . . . . . . . . . . 7
2 Preliminaries and Related Works 92.1 Traditional Database Systems and Data Boundary Problems . . . . . 92.2 Fuzzy Logic . . . . . . . . . . . . . . . . . . . . . . . . . . . . . . . . . 112.3 Membership Function . . . . . . . . . . . . . . . . . . . . . . . . . . . 122.4 Crisp and Fuzzy Sets . . . . . . . . . . . . . . . . . . . . . . . . . . . . 142.5 Types of Fuzzy Sets . . . . . . . . . . . . . . . . . . . . . . . . . . . . . 152.6 Properties of Fuzzy Sets . . . . . . . . . . . . . . . . . . . . . . . . . . 16
2.6.1 Operations on Fuzzy Sets . . . . . . . . . . . . . . . . . . . . . 182.7 Linguistic Variables and Linguistic Values . . . . . . . . . . . . . . . . 20
2.7.1 Fuzzy IF-THEN Rules . . . . . . . . . . . . . . . . . . . . . . . 202.8 Fuzzy Inference System . . . . . . . . . . . . . . . . . . . . . . . . . . 212.9 Related works . . . . . . . . . . . . . . . . . . . . . . . . . . . . . . . . 252.10 Related Works of Fuzzy Inference System . . . . . . . . . . . . . . . . 27
2.10.1 Fuzzy Inference System in General Application . . . . . . . . 272.10.2 Related Works of Fuzzy Inference System in Medical Diag-
nostic Systems . . . . . . . . . . . . . . . . . . . . . . . . . . . . 28
vi
Contents
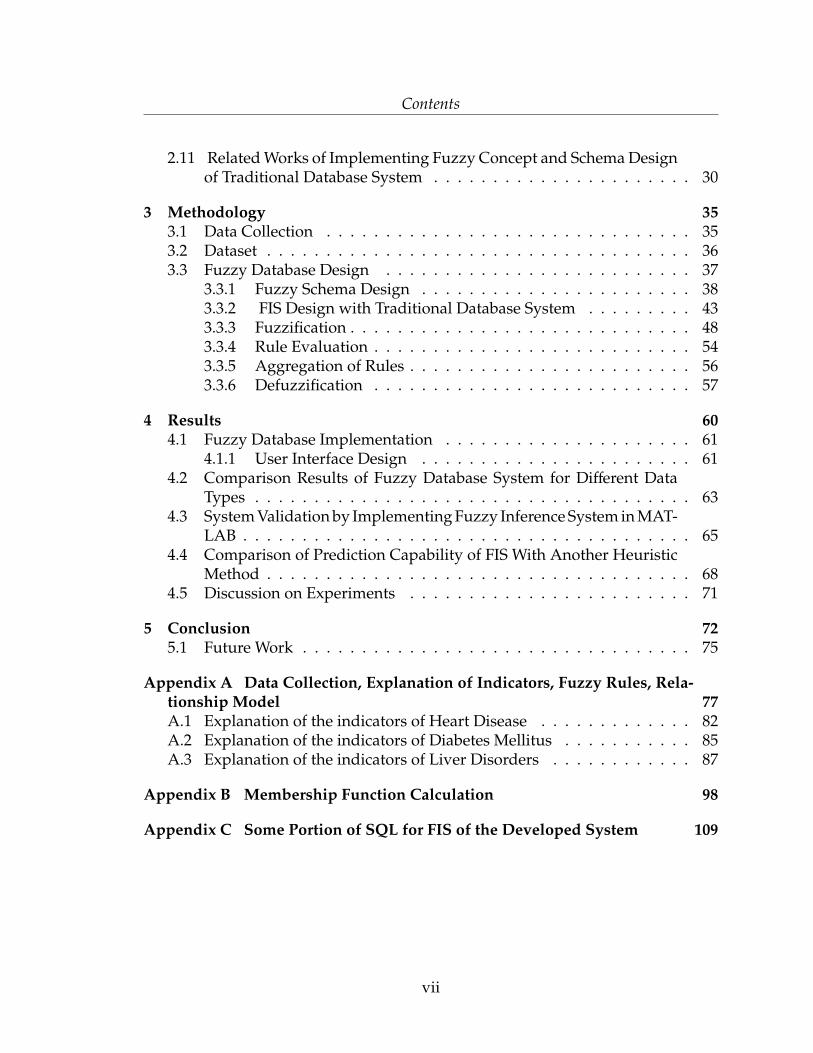
2.11 Related Works of Implementing Fuzzy Concept and Schema Designof Traditional Database System . . . . . . . . . . . . . . . . . . . . . . 30
3 Methodology 353.1 Data Collection . . . . . . . . . . . . . . . . . . . . . . . . . . . . . . . 353.2 Dataset . . . . . . . . . . . . . . . . . . . . . . . . . . . . . . . . . . . . 363.3 Fuzzy Database Design . . . . . . . . . . . . . . . . . . . . . . . . . . 37
3.3.1 Fuzzy Schema Design . . . . . . . . . . . . . . . . . . . . . . . 383.3.2 FIS Design with Traditional Database System . . . . . . . . . 433.3.3 Fuzzification . . . . . . . . . . . . . . . . . . . . . . . . . . . . . 483.3.4 Rule Evaluation . . . . . . . . . . . . . . . . . . . . . . . . . . . 543.3.5 Aggregation of Rules . . . . . . . . . . . . . . . . . . . . . . . . 563.3.6 Defuzzification . . . . . . . . . . . . . . . . . . . . . . . . . . . 57
4 Results 604.1 Fuzzy Database Implementation . . . . . . . . . . . . . . . . . . . . . 61
4.1.1 User Interface Design . . . . . . . . . . . . . . . . . . . . . . . 614.2 Comparison Results of Fuzzy Database System for Different Data
Types . . . . . . . . . . . . . . . . . . . . . . . . . . . . . . . . . . . . . 634.3 System Validation by Implementing Fuzzy Inference System in MAT-
LAB . . . . . . . . . . . . . . . . . . . . . . . . . . . . . . . . . . . . . . 654.4 Comparison of Prediction Capability of FIS With Another Heuristic
Method . . . . . . . . . . . . . . . . . . . . . . . . . . . . . . . . . . . . 684.5 Discussion on Experiments . . . . . . . . . . . . . . . . . . . . . . . . 71
5 Conclusion 725.1 Future Work . . . . . . . . . . . . . . . . . . . . . . . . . . . . . . . . . 75
Appendix A Data Collection, Explanation of Indicators, Fuzzy Rules, Rela-tionship Model 77A.1 Explanation of the indicators of Heart Disease . . . . . . . . . . . . . 82A.2 Explanation of the indicators of Diabetes Mellitus . . . . . . . . . . . 85A.3 Explanation of the indicators of Liver Disorders . . . . . . . . . . . . 87
Appendix B Membership Function Calculation 98
Appendix C Some Portion of SQL for FIS of the Developed System 109
vii

List of Abbreviations
• ALP: Alkaine Phosphate
• BMI: Body Mass Index
• BP: Blood Pressure
• BS: Blood Sugar
• COG: Center of Gravity
• Cho: Cholesterol
• DM: Diabetes Mellitus
• DPF: Diabetes Pedigree Function
• ECG: Electrocardiography
• FOU: Footprint of Uncertainty
• FL: Fuzzy Logic
• FIS: Fuzzy Inference System
• Gammagt: Gamma Glut Amyl Tranpeptidise
viii
List of Abbreviations
• HB: Heart Beat
• INS: Insulin
• LD: Liver Disorder
• MF: Membership Function
• MCV: Mean Corpuscular Volume
• SQL Structural Query Language
ix

Chapter 1
Introduction
1.1 Introduction
As a result of the rapid development of technology, data are becoming increas-
ingly abundant. Large collections of data stored in a database system are usually of
differing types and varying accuracy. Dealing with large collections of information
(i.e., big data) in database management systems has become a serious problem for
analysts in all fields, including the medical professions. In the medical field, it
is necessary to have the right information to diagnose the condition properly, but
sometimes the data are not exact and may occur as words rather than numbers
(i.e, linguistic terms). In a traditional database system using conventional search
methods, information retrieved in response to a query is absolute, either true or
false. As a result, it is impossible to get any information if a query fails to satisfy
the condition. The condition is specified for the solution to a set of differential
situations in the query to retrieve the information from the database. Also, in
1
Chapter 1: Introduction
cases where decisions are based on several components (i.e., attributes used in the
database), it is difficult to keep all the information if the searching strategy fails to
satisfy the query conditions.
Again, a database system includes collections of tables for storing the data. In order
to retrieve information, the tables may need to join on demand. This joining of
tables in the database system may consume large amounts of time and resources.
Research of the storage, management, and retrieval of data continues to develop
to meet the growing demands of improved accuracy and efficiency. Studies have
shown that using a fuzzy capability with a database system can provide a more
suitable database system for the user [1] [2] [3] [4].
Fuzzy logic and fuzzy set theory are used to support fuzzy capability in a
database system. Medical diagnostic systems based on traditional database man-
agement must deal with the boundary conditions that are not properly defined,
and data that may be crisp, linguistic, or a combination of both or even include null
values. As a result, the integration of fuzzy capabilities for such database systems
has become a topic of interest.
1.2 Problem Statement
In this thesis, the term “traditional database management system” refers to a
common database system utilizing an SQL-like language for querying data. The
term “Medical database systems” refers to the systems that need to operate on
databases containing medical data. The use of a traditional database system for
medical diagnostics creates a problem when decision-making is made with SQL-
2
Chapter 1: Introduction
like queries due to the inaccurate and heterogeneous data.
Traditional database search systems use AND, OR, NOT operators. Such op-
erators are not ideal when applied to perception-based information (such as lin-
guistic data), and complicating the processes of generating accurate diagnostics.
Perception-based data are usually expressed using linguistic terms, such as
“young”, “middle aged”, “old” etc., where boundary conditions are not clearly
defined; for example, a person who is 30 years old may be considered as a “young”
or a “middle aged” person. Also, when null values appear in traditional database
systems, it is difficult to provide information that will allow them to be processed.
Perception-based data in a traditional database system requires queries with mul-
tiple conditions to quantify the linguistic ranges. This requires numerous compar-
isons to be made under different conditions to achieve the desired result. Such a
system would be highly inefficient. However, in some cases, if the user defines
the criteria to clarify retrieving data from perception-based data (for example, by
stating that “29 years old” is “young”), there is a possibility of having small errors
in data values (for example, the above definition could mean “29 years and 1 month
old” is not “young”). Hence, in traditional database systems, if a query does not
meet the condition, it is not possible to obtain accurate information; this is often
what happens when perception-based data in database systems are used.
The current research advocates the use of fuzzy logic and fuzzy set theory
by employing fuzzy inference system and fuzzy schema design, to resolve the
inefficiency and inaccuracy that occur in medical database systems, processing
perception-based data.
3
Chapter 1: Introduction
1.3 Methodology
This research objective is to develop an effective system to manage and retrieve
data in medical database systems. Such systems are characterized by extensive
data collections, loosely defined boundary conditions and the need for multiple
comparisons. In the literature, two approaches are used to obtain a fuzzy capability
in the database system. One is to create a fuzzy inference system using SQL in its
current form to query crisp data reported in [5], and the other is to provide some
extensions for SQL language reported in [6]. The fundamental differences between
a fuzzy database and a traditional database to be how linguistic and null data are
quantified.
In a fuzzy database system, there are two types of information. One has impre-
cise values, and the other has linguistic variables. In the case of imprecise values,
a fuzzy database has some known approximate values, and data lie between those
values. For example, the age of John maybe 27, 28 or 29, i.e., the age of John is
between 27-29, and the exact age of John is unknown. In the case of linguistic
variables, data are represented by linguistic terms such as tall, short.
This study developed a fuzzy database system by using the concepts of a fuzzy
inference system and fuzzy schema design, and integrated them based on existing
data available in the traditional database system.
In order to query the data with fuzzy capability, a common SQL-based database
system, Microsoft Access 2007, was used. In this research, the same SQL logical
operators are used to create the fuzzy rules for the FIS design. Range values were
used to represent the linguistic variables. The developed fuzzy system and neural
4
Chapter 1: Introduction
network were implemented in MATLAB for comparison purposes. The system
was validated with real data from the UCI machine learning datasets [7], [8], [9];
a data source commonly used by researchers for validation purposes. The fuzzy
database system was developed to support the boundary conditions effectively,
whether the data were numerical (i.e., crisp values), linguistic, a combination or
null data type.
Scope: The main focus of the research completed for this thesis is to incorporate
fuzzy logic in the database system by combining a fuzzy inference system and a
fuzzy schema design. The system was developed to be capable of dealing with
the data that already existed in a common SQL-based database system, such as
Microsoft Access 2007. The scope of this research was limited to three medical
applications: heart disease, diabetes mellitus, and liver disorders. Validation and
accuracy was determined using UCI machine learning dataset, and the associated
data range information was provided by [10] [11] [12].
1.4 Objectives
The objective of this study was to incorporate fuzzy logic and fuzzy set theory
into a traditional database system. The adopted methodology was to develop a
fuzzy database system to manage the boundary conditions efficiently when cal-
culating a decision from heterogeneous data. The system can be used when the
information in the existing database systems fail to satisfy the query conditions,
where there is a possibility of getting information to some degree of precision. The
goal of this system is much more beneficial than simply providing information.
5
Chapter 1: Introduction
The goal is to increase accuracy and efficiency. To enable medical database systems
to interpret ambiguous information. The developed fuzzy database system should
be able to obtain information when data are missing. Achieving these objectives
included the following tasks:
• To prepare the range values from the data collected from the domain experts
( i.e., physicians).
• To construct the formulation by using the range values to get the membership
functions for all the three applications: heart disease, diabetes mellitus, and
liver disorders.
• To develop a fuzzy database system by combining fuzzy inference system
and fuzzy schema design for the diagnosis of heart disease, diabetes mellitus,
and liver disorders by SQL, a standard used in SQL-based database system
such as Microsoft Access.
• To query the data for the cases when the data are in the form of numbers,
linguistic terms, a combination of numbers, null for all the three applications.
• To develop all the three applications using neural network and FIS in MAT-
LAB to compare the prediction capability between them.
1.5 Research Contributions
This study focuses on designing a fuzzy database system using existing data
provided by (source of medical data), assessable through an SQL-based traditional
6

Chapter 1: Introduction
database system in order to obtain more accurate diagnoses for specific medical
conditions. The major contributions of this study are outlined as follows:
1. Developed a fuzzy database system by integrating a novel fuzzy inference
system (FIS) and fuzzy schema design by SQL of common database systems
that is able to provide diagnosis of a patient ( i.e., decision-making) when a
variety of data exists in various forms including numbers (crisp), linguistic,
mixture of both, or null (missing data) for the three specific diseases: heart
disease, diabetes mellitus and liver disorders.
2. Developed FIS and neural network-based designs for the three applications
in MATLAB in order to make a comparison of the prediction capabilities
between the two approaches, using real data reported in the literature.
1.6 Thesis Organization
The chapters of this thesis are presented as follows:
Chapter 2: This chapter starts with the introductory information related to this
thesis which includes an examination of traditional database system, Structural
Query Language (SQL), fuzzy logic, fuzzy inference system, schema design, and
associated research.
Chapter 3: This chapter details the methodology for building the system, the data
collection, dataset description, methodology of the developed system, steps in-
volved in the system design, algorithms of FIS design, and input/output.
Chapter 4: This chapter describes the results of this study, the user interface design
7

Chapter 1: Introduction
for the heart disease application, diabetes mellitus, and liver disorders. Graphs of
the results are presented at the end of the chapter.
Chapter 5: A conclusion of the thesis summarizes the research findings and pro-
vides guidelines for future directions.
8
Chapter 2
Preliminaries and Related Works
This chapter describes preliminary information including problems with tradi-
tional database systems with regards to boundary data, fuzzy set, fuzzy inference
system, fuzzy database design, and concludes with a section for related works.
2.1 Traditional Database Systems and Data Boundary
Problems
In this study, the traditional database refers to a common database system used
for storing information. SQL like language is used for storing, adding, deleting
and retrieving information through a database system.
SQL is a powerful tool used in traditional database systems. SQL plays a vital
role querying crisp and precise information. In traditional database management
systems data are based on boolean logic (i.e., absolute) and queries retrieving data
depend on boolean conditions. Problems occur when users query information that
9
Chapter 2: Preliminaries and Related Works
exceed the boundary conditions of SQL, surpassing SQL’s querying ability. For
example, in a traditional database of patients‘ records, suppose we are tasked with
identifying records of only the young patients (i.e., Patient age is between 19 and
25) who were discharged and paid more than $2000 (i.e., Discharged rate is Dis
rate above $2000). The searching strategy using traditional database system can be
identified by the SQL query as the following:
Select * from DischargedPatients
Where Dis_rate > 2000 and
Age between 19 and 25;
In the above example, the discharged rate situation is not a problem; however, a
complex problem is determining how the system defines a young patient. If the
patient‘s age is 25 years and 2 months, then reasonable to believe that the person is
a young patient and should be selected from the DischargedPatients. But because
of having absolute restrictions in the age boundary conditions, only patients age
19 and 25 are considered. A patient 25 and 2 months would be rejected.
Because Age is a perception-based, there are two issues that arise when querying
for age. If 2 months are added to fix this query, the query will change, and consider
the period between 19 and 25 years and 2 months as young. As a result, anyone
whose age is 25 years and 2 months or less would be retrieved as a young patient.
A problem arises when a user stores the patients information that exceed the
boundary condition of the above query. For example, if a 26 years old patient is
added to the system the query will not identify this patient who is 26 years old
as a young person even though someone else may consider a 26 years old person
10
Chapter 2: Preliminaries and Related Works
as a young patient. The other issue arises when there are linguistic values in the
data. Then it is not possible to provide any information based on such values. In
order to overcome these problems, fuzzy set theory can be applied to the database
system. Using fuzzy sets in the database system provides the feasibility of having
information in a range between true and false, which is measured by membership
functions. It enables the consideration of boundary conditions and linguistic values
in the database systems. In the following sections, the fundamentals of fuzzy theory
are explained.
2.2 Fuzzy Logic
Fuzzy logic (FL) is a multi-valued logic that has been used to solve many
complex challenges including clinical diagnostics. FL handles approximate values
in place of fixed and precise values. Professor Lotfi A. Zadeh first introduced the
terms “fuzzy sets” and “fuzzy logic” in the mid -1960’s [13] [14].
According to Zadeh, fuzzy logic is an addition of the classic logic. Classic logic
is based on boolean logic, where the information is either true or false. In classic
logic the membership of a component belonging to a set is represented by 0 if it
does not belong to the set, and 1 if it is in the set, i.e. {0, 1}. On the other hand, in
fuzzy logic this set is extended to the interval of [0, 1].
11
Chapter 2: Preliminaries and Related Works
2.3 Membership Function
A membership function (MF) is a distribution that maps each and every point in
the input space (i.e., universe of discourse which represents the set of the entities)
to a membership value between 0 and 1. There are different types of membership
functions of fuzzy set such as triangular membership function, trapezoidal mem-
bership function, Gaussian membership function, and etc.[15]. The types of MF
depend on the concept that is being represented, and the context of it’s use. This
study used triangular and trapezoidal membership functions.
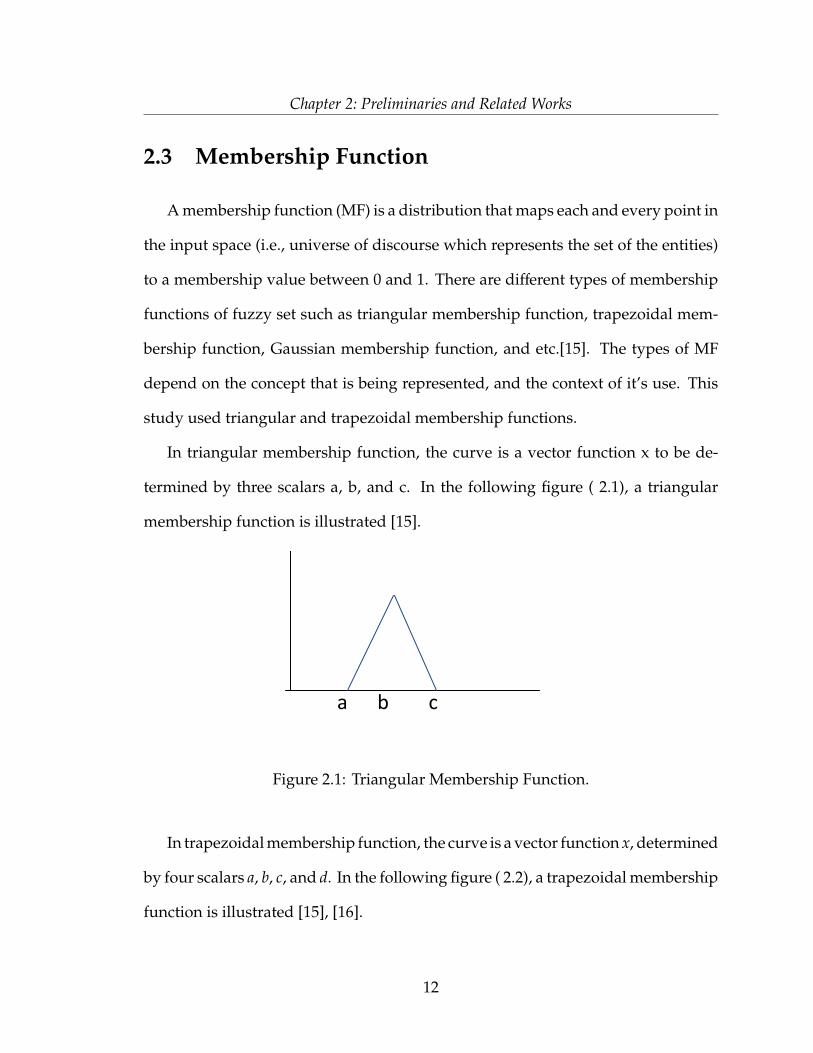
In triangular membership function, the curve is a vector function x to be de-
termined by three scalars a, b, and c. In the following figure ( 2.1), a triangular
membership function is illustrated [15].
a b c
Figure 2.1: Triangular Membership Function.
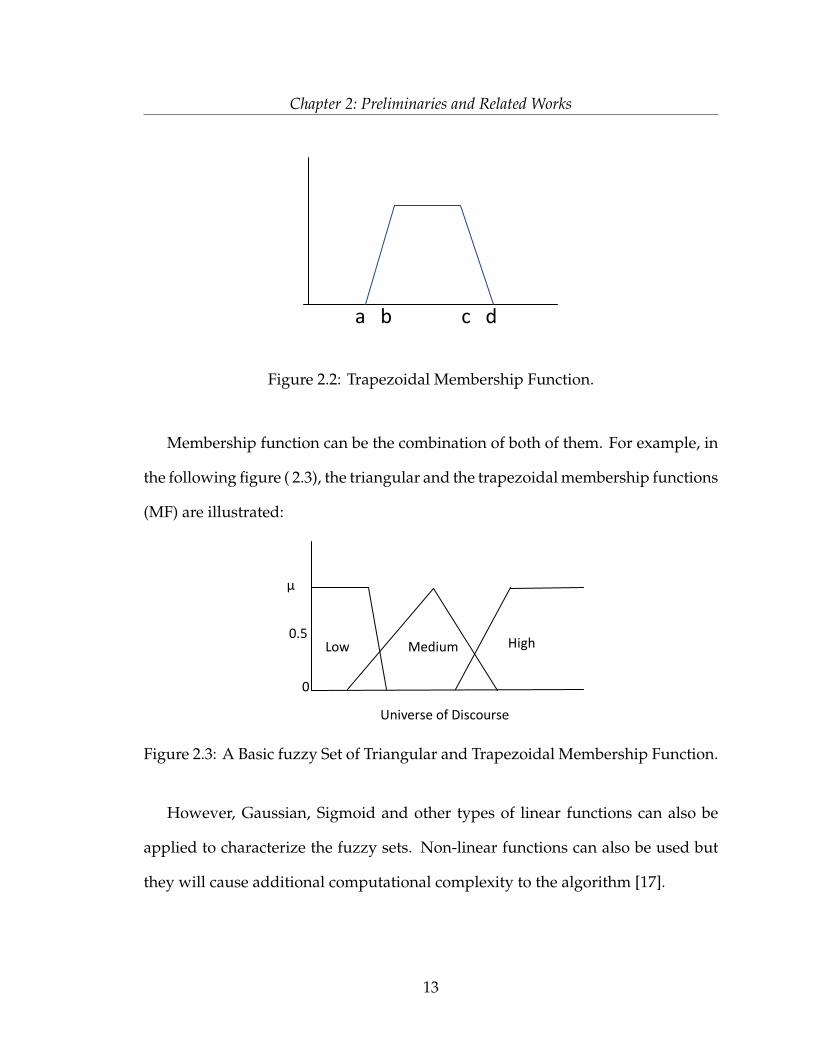
In trapezoidal membership function, the curve is a vector function x, determined
by four scalars a, b, c, and d. In the following figure ( 2.2), a trapezoidal membership
function is illustrated [15], [16].
12
Chapter 2: Preliminaries and Related Works
a b c d
Figure 2.2: Trapezoidal Membership Function.
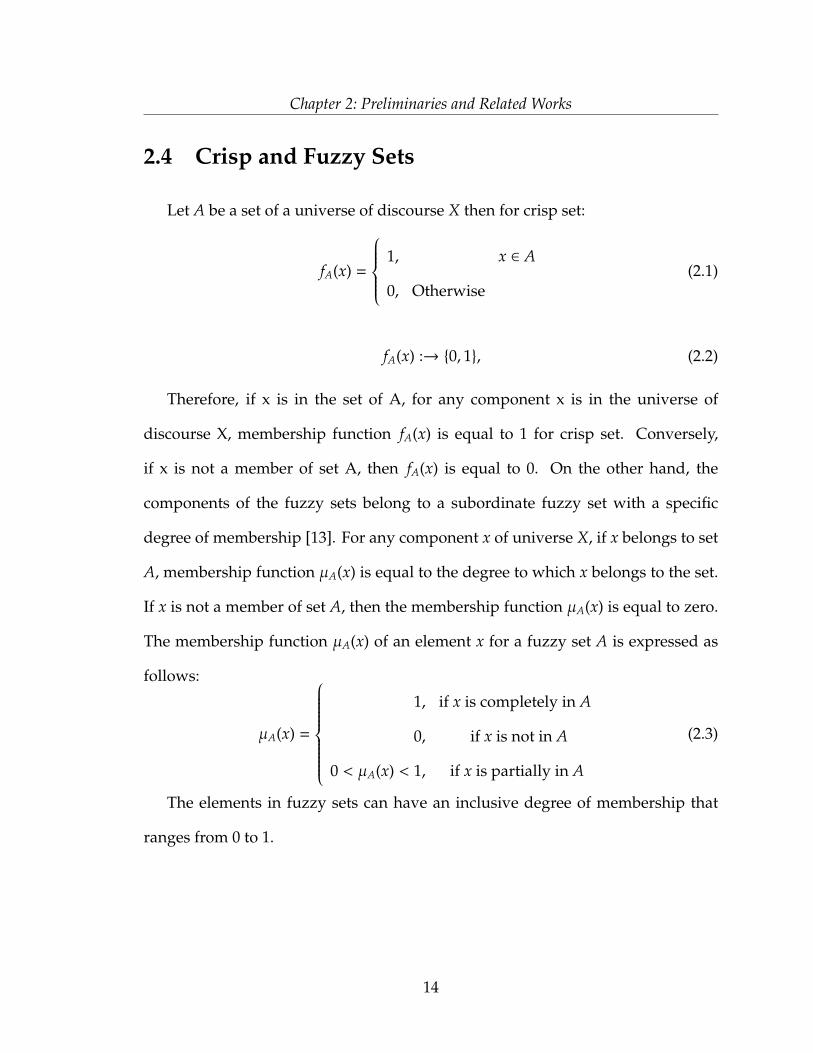
Membership function can be the combination of both of them. For example, in
the following figure ( 2.3), the triangular and the trapezoidal membership functions
(MF) are illustrated:
0.5 0
High
Universe of Discourse
Medium Low
µ
Figure 2.3: A Basic fuzzy Set of Triangular and Trapezoidal Membership Function.
However, Gaussian, Sigmoid and other types of linear functions can also be
applied to characterize the fuzzy sets. Non-linear functions can also be used but
they will cause additional computational complexity to the algorithm [17].
13
Chapter 2: Preliminaries and Related Works
2.4 Crisp and Fuzzy Sets
Let A be a set of a universe of discourse X then for crisp set:
fA(x) =
1, x ∈ A
0, Otherwise(2.1)
fA(x) :→ {0, 1}, (2.2)
Therefore, if x is in the set of A, for any component x is in the universe of
discourse X, membership function fA(x) is equal to 1 for crisp set. Conversely,
if x is not a member of set A, then fA(x) is equal to 0. On the other hand, the
components of the fuzzy sets belong to a subordinate fuzzy set with a specific
degree of membership [13]. For any component x of universe X, if x belongs to set
A, membership function µA(x) is equal to the degree to which x belongs to the set.
If x is not a member of set A, then the membership function µA(x) is equal to zero.
The membership function µA(x) of an element x for a fuzzy set A is expressed as
follows:
µA(x) =
1, if x is completely in A
0, if x is not in A
0 < µA(x) < 1, if x is partially in A
(2.3)
The elements in fuzzy sets can have an inclusive degree of membership that
ranges from 0 to 1.
14
Chapter 2: Preliminaries and Related Works
2.5 Types of Fuzzy Sets
There are mainly two types of fuzzy sets: type-1 fuzzy sets (T1FS) and type-2
fuzzy sets (T2FS). T1FS were first introduced by L. A. Zadeh in 1965 [13]. However,
type-1 fuzzy sets failed to model uncertainty properly. Uncertainty indicates the
degree of truth of the value in attribute. For example, the age of John is 36 right
now, might be 80% true. The issues with T1FS led to the introduction of T2FS.
In order to model uncertainty and imprecision in a superior way, type-2 fuzzy set
was initially presented by Lotfi Zadeh, and the concepts were presented by Mendel
and Liang [18]. In case of T2FS, the degree of membership is type-1 fuzzy set. The
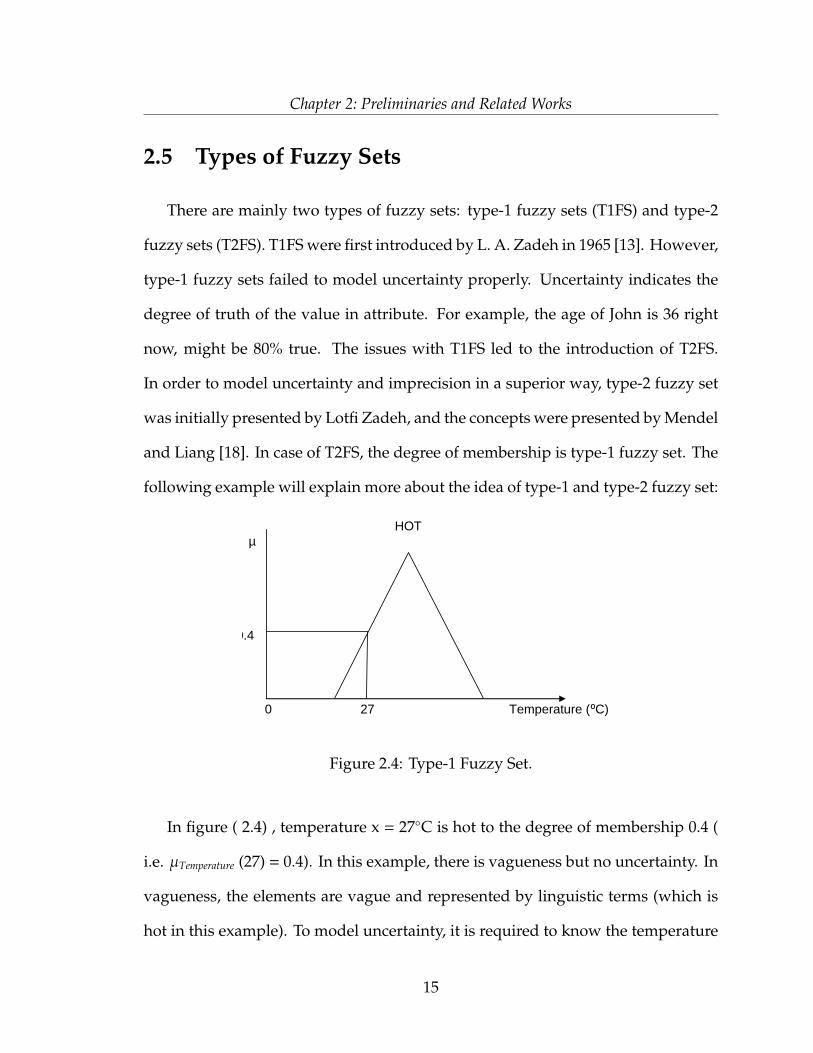
following example will explain more about the idea of type-1 and type-2 fuzzy set:
0.4
0 27 Temperature (⁰C)
µ
HOT
Figure 2.4: Type-1 Fuzzy Set.
In figure ( 2.4) , temperature x = 27◦C is hot to the degree of membership 0.4 (
i.e. µTemperature (27) = 0.4). In this example, there is vagueness but no uncertainty. In
vagueness, the elements are vague and represented by linguistic terms (which is
hot in this example). To model uncertainty, it is required to know the temperature
15

Chapter 2: Preliminaries and Related Works
is hot to a degree about 0.4. In order to model uncertainty properly, type-2 fuzzy
set (T2FS) is introduced. The example of type-1 fuzzy set shown in figure ( 2.4) can
be replaced by the following figure ( 2.5) using type-2 fuzzy set.
0 27 Temperature (⁰C)
0.4
1
Figure 2.5: Type-2 Fuzzy Set.
Figure ( 2.5) shows that for type-2 fuzzy set, the membership function is an
interval i.e. type-1 fuzzy set. For the above example of temperature x = 27◦C, the
membership function for x = 27◦C is [0.4, 1].
In type-2 fuzzy set, the membership function is three dimensional. The third
dimension is called the footprint of uncertainty (FOU) and it is the membership
value at each point of the two dimensional domain. FOU is represented by lower
bound and upper bound membership function, both of which are type-1 fuzzy set.
For the above example, x = 27◦C has lower MF 0.4 and upper MF 1.
2.6 Properties of Fuzzy Sets
The properties of fuzzy sets and crisp sets are similar [16]. Classical or crisp
sets are a unique case of fuzzy sets in which membership values are a subset of
16
Chapter 2: Preliminaries and Related Works
the interval [0, 1]. The following rules, which are common in crisp set theory, also
apply to fuzzy set theory. Here, A, B, C represents three random fuzzy sets [19][16].
Commutatively:
A ∪ B = B ∪ A
B ∩ A = A ∩ B
Associativity:
A ∪ (B ∪ A) = (A ∪ B) ∪ C
A ∩ (B ∩ C) = (A ∩ B) ∩ C
Distributivity:
A ∪ (B ∪ C) = (A ∪ B) ∩ (A ∪ C)
Indempotency:
A ∪ A = A
A ∩ A = A
The union and intersection between the same set returns the same result.
Identity:
A ∪ φ = A
A ∪ X = A
Here, φ indicates the null set and X indicates the universal set.
A ∩ φ = φ
A ∩ X = X
17

Chapter 2: Preliminaries and Related Works
Transitivity:
A ⊆ B ⊆ C then A ⊆ C
Here, A, B and C have invariant reflexive symmetric relations i.e. if A is related to
B and B is related to C then A is also related to C.
Reflexity of Complementation:
(Ac)c = A
De Morgan’s Laws:
(A ∪ B)c = Ac∩ Bc
(A ∩ B)c = Ac∪ Bc
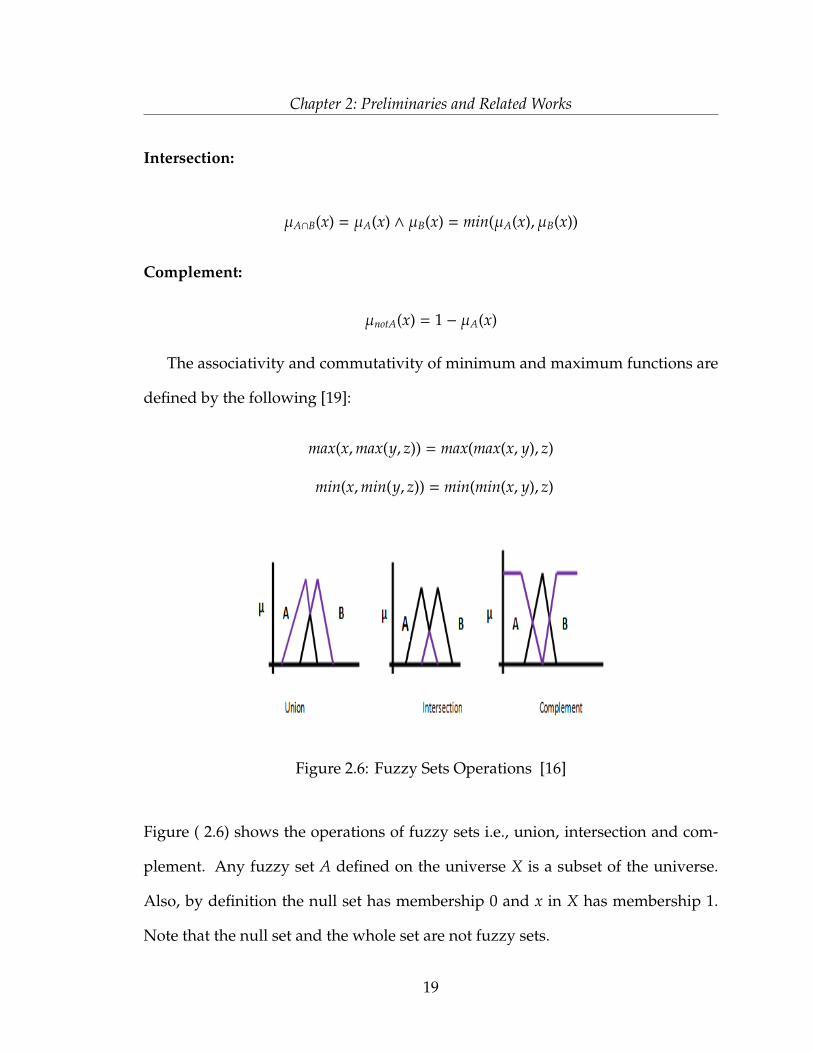
2.6.1 Operations on Fuzzy Sets
There are mainly three operations on fuzzy sets, which are complement, in-
tersection and union. Let A and B be two fuzzy sets defined on the universe of
discourse X to the interval [0,1]. A fuzzy set A is defined by its membership function
µ(A) and for the fuzzy set B, which is defined by its membership function µ(B) over
X. The function-theoretical operations of union, intersection and complements are
defined as follows:
Union:
µA∪B(x) = µA(x) ∨ µB(x) = max(µA(x), µB(x))
18
Chapter 2: Preliminaries and Related Works
Intersection:
µA∩B(x) = µA(x) ∧ µB(x) = min(µA(x), µB(x))
Complement:
µnotA(x) = 1 − µA(x)
The associativity and commutativity of minimum and maximum functions are
defined by the following [19]:
max(x,max(y, z)) = max(max(x, y), z)
min(x,min(y, z)) = min(min(x, y), z)
Figure 2.6: Fuzzy Sets Operations [16]
Figure ( 2.6) shows the operations of fuzzy sets i.e., union, intersection and com-
plement. Any fuzzy set A defined on the universe X is a subset of the universe.
Also, by definition the null set has membership 0 and x in X has membership 1.
Note that the null set and the whole set are not fuzzy sets.
19
Chapter 2: Preliminaries and Related Works
2.7 Linguistic Variables and Linguistic Values
A linguistic variable is a fuzzy variable [20]. In mathematics, variables deal
with numerical values, whereas in fuzzy logic applications, non-numeric linguistic
variables are usually used to assist the progress of the expression of rules and
facts. In linguistic variables, the values come from natural language or artificial
language such as words or sentences [21]. For example, ”Age is Young” indicates
the linguistic variable “Age” accepts “Young” which is linguistic value.
2.7.1 Fuzzy IF-THEN Rules
The rules are the heart of the fuzzy inference system. After defining the linguistic
variables and values, the rules of the fuzzy system can be formulated. The rules
are used to map fuzzy inputs to fuzzy outputs.
Fuzzy rules have three parts: antecedent, proposition and consequence(s). One
antecedent may have more than one of the (AND) or (OR) operators. The fuzzy
IF-THEN rule looks like the following:
Rule: 1 IF x is A1 OR y is B1 THEN z is C1.
Rule: 2 IF x is A2 AND y is B2 THEN z is C2.
Rule: 3 IF x is A3 THEN z is C3.
Where A, B and C are the linguistic values and x, y, and z are the linguistic variables.
20
Chapter 2: Preliminaries and Related Works
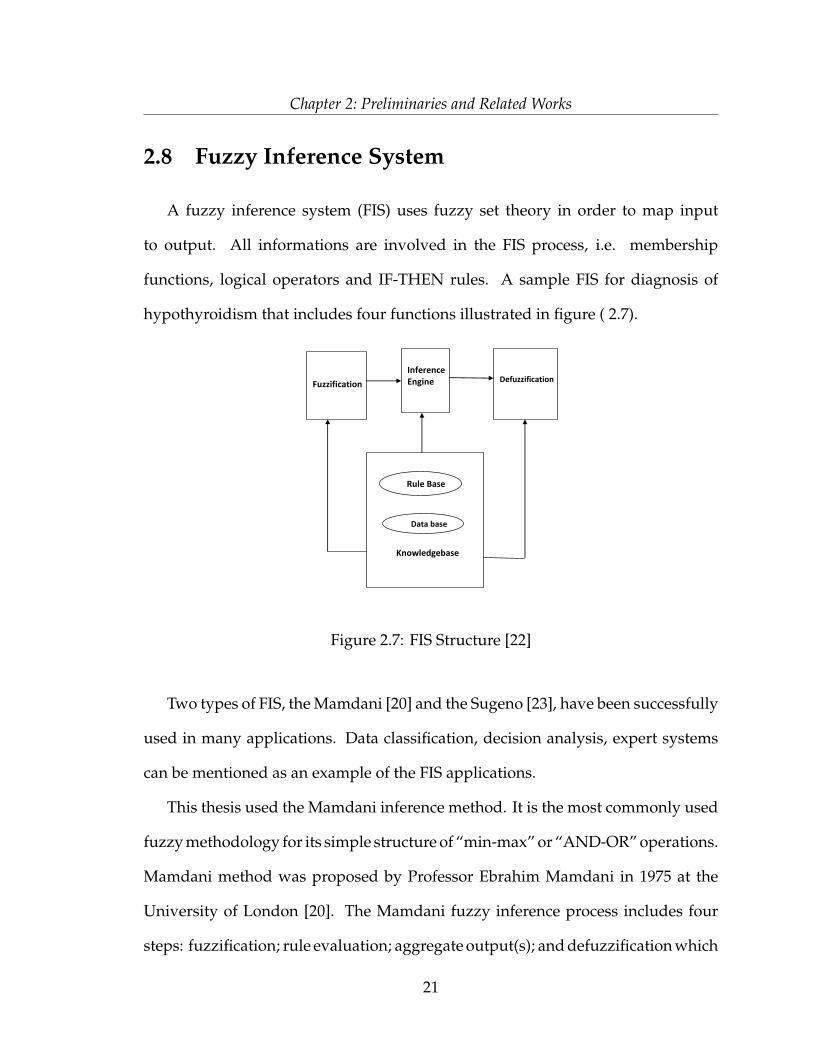
2.8 Fuzzy Inference System
A fuzzy inference system (FIS) uses fuzzy set theory in order to map input
to output. All informations are involved in the FIS process, i.e. membership
functions, logical operators and IF-THEN rules. A sample FIS for diagnosis of
hypothyroidism that includes four functions illustrated in figure ( 2.7).
Rule Base
Data base
Knowledgebase
Fuzzification
Defuzzification
Inference Engine
Figure 2.7: FIS Structure [22]
Two types of FIS, the Mamdani [20] and the Sugeno [23], have been successfully
used in many applications. Data classification, decision analysis, expert systems
can be mentioned as an example of the FIS applications.
This thesis used the Mamdani inference method. It is the most commonly used
fuzzy methodology for its simple structure of “min-max” or “AND-OR” operations.
Mamdani method was proposed by Professor Ebrahim Mamdani in 1975 at the
University of London [20]. The Mamdani fuzzy inference process includes four
steps: fuzzification; rule evaluation; aggregate output(s); and defuzzification which
21
Chapter 2: Preliminaries and Related Works
are described below [24] [25]:
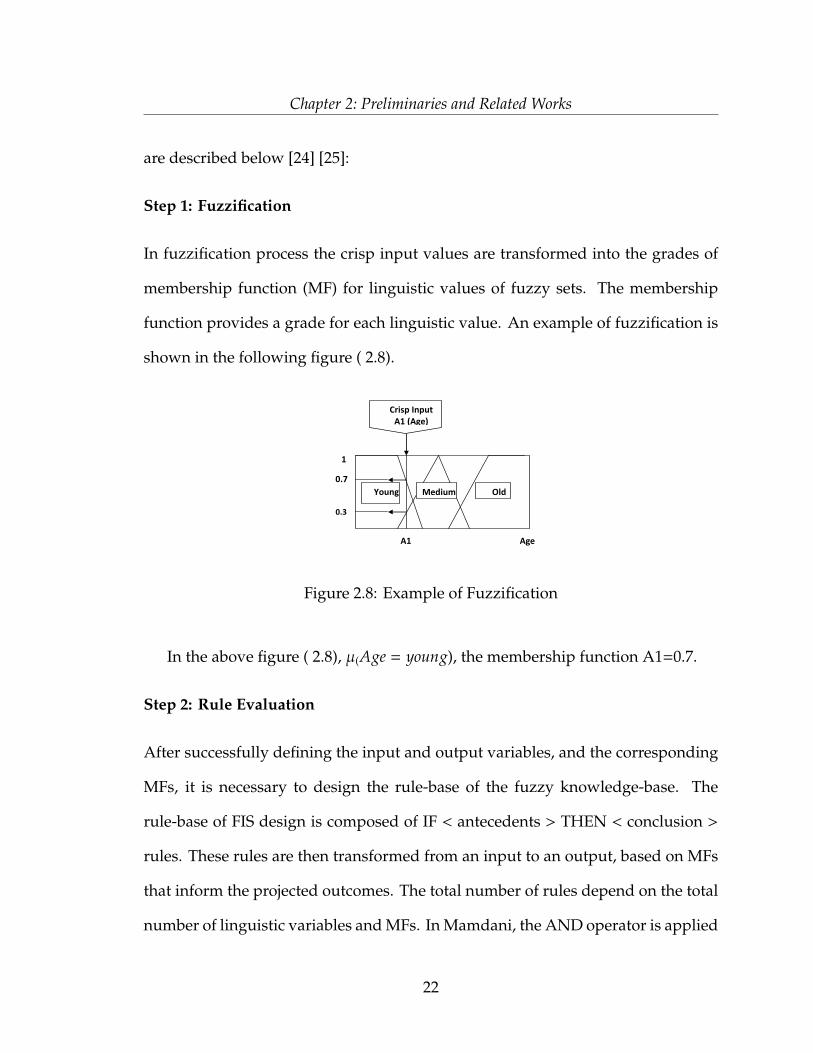
Step 1: Fuzzification
In fuzzification process the crisp input values are transformed into the grades of
membership function (MF) for linguistic values of fuzzy sets. The membership
function provides a grade for each linguistic value. An example of fuzzification is
shown in the following figure ( 2.8).
Crisp Input A1 (Age)
Young Medium Old
A1 Age
0.3
0.7
1
Figure 2.8: Example of Fuzzification
In the above figure ( 2.8), µ(Age = young), the membership function A1=0.7.
Step 2: Rule Evaluation
After successfully defining the input and output variables, and the corresponding
MFs, it is necessary to design the rule-base of the fuzzy knowledge-base. The
rule-base of FIS design is composed of IF < antecedents > THEN < conclusion >
rules. These rules are then transformed from an input to an output, based on MFs
that inform the projected outcomes. The total number of rules depend on the total
number of linguistic variables and MFs. In Mamdani, the AND operator is applied
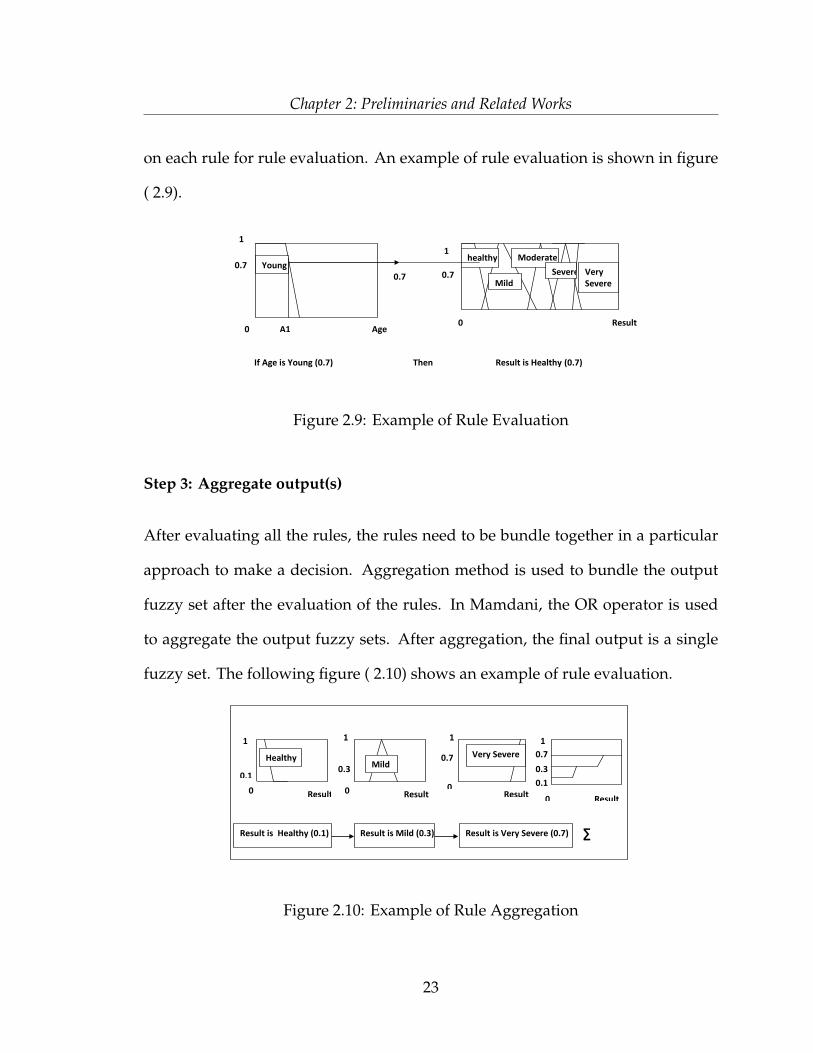
22
Chapter 2: Preliminaries and Related Works
on each rule for rule evaluation. An example of rule evaluation is shown in figure
( 2.9).
If Age is Young (0.7) Then Result is Healthy (0.7)
Young healthy
Mild
Moderate
Severe Very Severe
Age A1 Result
0.7
0 0
1
1
0.7 0.7
Figure 2.9: Example of Rule Evaluation
Step 3: Aggregate output(s)
After evaluating all the rules, the rules need to be bundle together in a particular
approach to make a decision. Aggregation method is used to bundle the output
fuzzy set after the evaluation of the rules. In Mamdani, the OR operator is used
to aggregate the output fuzzy sets. After aggregation, the final output is a single
fuzzy set. The following figure ( 2.10) shows an example of rule evaluation.
0.3
0
1 1 1 1
0.1
0.7 0.7
0 0 0.1
0.3
Result Result Result Result
∑
0
Result is Healthy (0.1) Result is Mild (0.3) Result is Very Severe (0.7)
Healthy Mild
Very Severe
Figure 2.10: Example of Rule Aggregation
23
Chapter 2: Preliminaries and Related Works
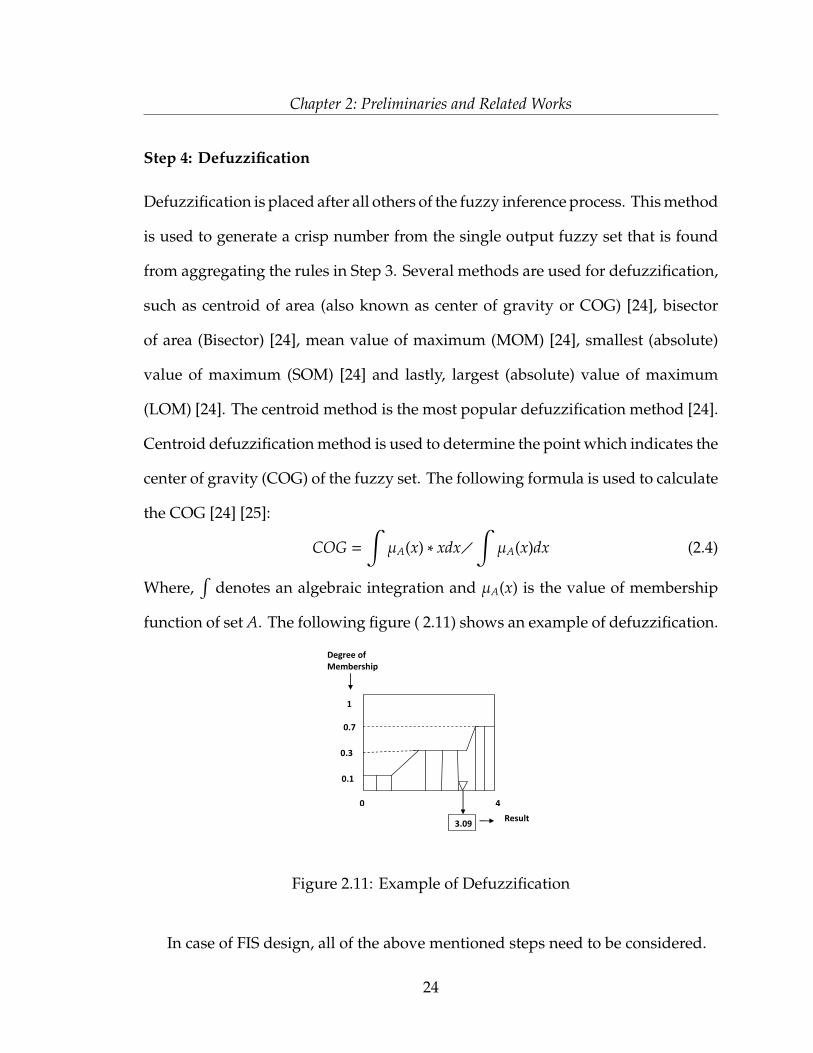
Step 4: Defuzzification
Defuzzification is placed after all others of the fuzzy inference process. This method
is used to generate a crisp number from the single output fuzzy set that is found
from aggregating the rules in Step 3. Several methods are used for defuzzification,
such as centroid of area (also known as center of gravity or COG) [24], bisector
of area (Bisector) [24], mean value of maximum (MOM) [24], smallest (absolute)
value of maximum (SOM) [24] and lastly, largest (absolute) value of maximum
(LOM) [24]. The centroid method is the most popular defuzzification method [24].
Centroid defuzzification method is used to determine the point which indicates the
center of gravity (COG) of the fuzzy set. The following formula is used to calculate
the COG [24] [25]:
COG =
∫µA(x) ∗ xdx�
∫µA(x)dx (2.4)
Where,∫
denotes an algebraic integration and µA(x) is the value of membership
function of set A. The following figure ( 2.11) shows an example of defuzzification.
0.3
0.7
0.1
1
0 4
3.09 Result
Degree of Membership
Figure 2.11: Example of Defuzzification
In case of FIS design, all of the above mentioned steps need to be considered.
24
Chapter 2: Preliminaries and Related Works
The elements of the conceptual schema includes tables, views, constraints, do-
mains definition, and other constructs which describe the schema.
Now, for the definition of fuzzy database system, it can be said as the database
system that use fuzzy logic to support vague, imprecise and uncertain information.
On other words, the database with fuzzy capabilities is called fuzzy database [4]
[15].
2.9 Related works
Relational Model and Extensions of SQL to Support Fuzziness
This section describes various database models such as fuzzy relational databases
and previous works related to the extensions of SQL in traditional database sys-
tems to support fuzziness.
Fuzzy relational database model incorporates imperfect information and com-
plex objects by relaxing first normal form and authorizing attributes to be multi-
valued. In relational database system, it is necessary for the attributes to have
atomic value, and each attribute value needs to contain only a single value from
the domain. However, in order to support fuzziness, which allows the attributes
to be multivalued, the criteria of first normal form in the relational database model
needs to be removed. In this aspect, several non first-normal-forms relational
databases was introduced.
In [26] an extension of fuzzy relational database model was developed based
on similarity. This model was replaced by general proximity relation in [27]. The
general proximity relation provides the degree of closeness between the elements
25

Chapter 2: Preliminaries and Related Works
of a scalar domain based on the properties of reflexivity and symmetry (fuzzy set
properties). The proximity relation was extended in [28] by higher characterization
of the proximity relation.
There are several extensions to object oriented database models to support fuzzi-
ness in database management system. In [29] the FOOD model was introduced
based on similarity. Similarity indicates the likeness between the tuple values
listed in the table. The relational database systems have one or more relations in
the format of two-dimensions (i.e., row and column). The row indicates the tuple
and the column indicates the domain of the corresponding field. The similarity
is measured by the value between 0 and 1. For example, if black and blue color
are compared, when the tuple value is black and the column value is also black,
the similarity of black/black is 1 because black and black are exactly similar. On
the other hand, if the tuple value is blue and the column value is black, then the
similarity may be 0.8 because black and blue are not exactly matched.
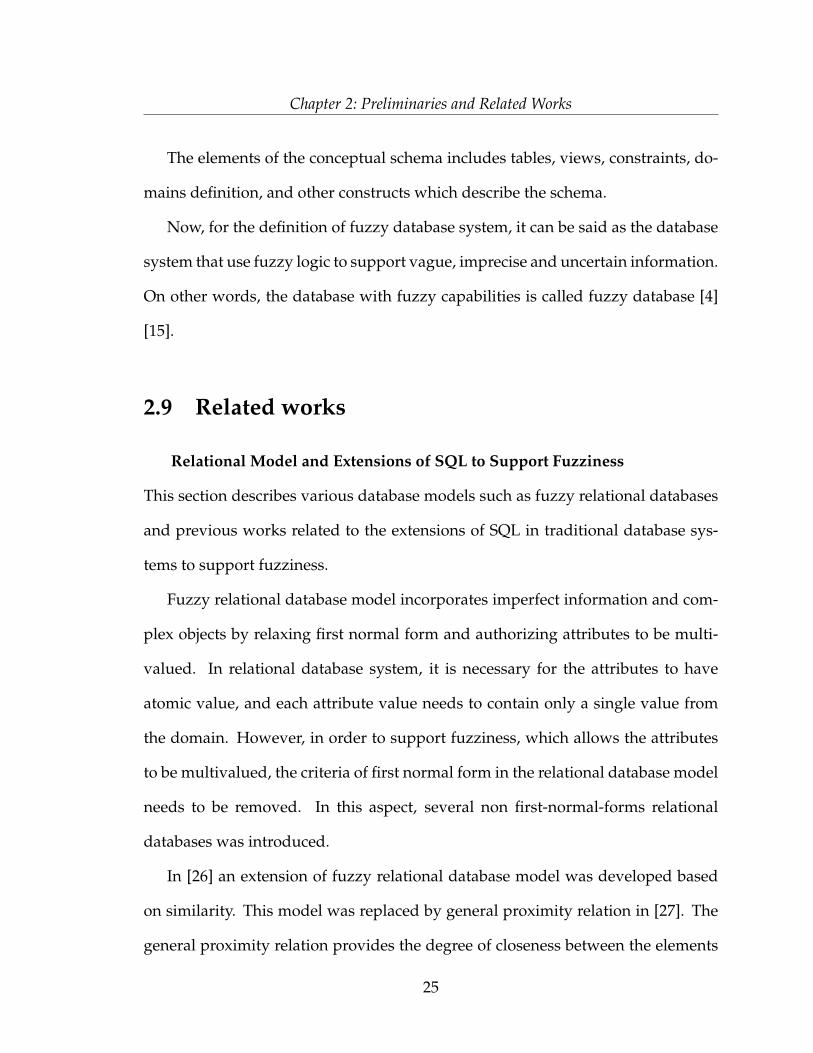
Existing extensions of SQL to support fuzziness in databases include FQUERY
[30], ISKREOT [31], FSQL [32][2], SQLf [6] and SOFTSQL [33]. Of these, SQLf
[6] is the most well-known one because it provides extended SQL statements by
advocating the use of fuzzy predicates, and also supports the features of SQL:1999.
A fuzzy predicate is the same as the fuzzy sets, and expresses the degree of the
arguments that fit with the predicate. For example, if the height of Joe is 6 feet,
then the fuzzy predicate “tall” is satisfied with a degree of 0.85 (i.e. µHeight = 0.85),
which indicates the membership degree to the fuzzy set of tall people. Thus, SQLf
allows users to write flexible query by using linguistic terms. Figure ( 2.12) shows
26
Chapter 2: Preliminaries and Related Works
the fuzzy SQL execution.
Classification Level
Normal Relation
Fuzzy Relation
Final Fuzzy Relation
Normal Relation
UN Bounded
Query
Fuzzy Operation
Result
Figure 2.12: Fuzzy SQL Execution [34]
2.10 Related Works of Fuzzy Inference System
2.10.1 Fuzzy Inference System in General Application
In this section, a simple fuzzy inference system for hotel advisory system (HAS)
is described. Nagi et al [5] developed a fuzzy expert system for hotel selection
named hotel advisory system (HAS). The system is divided into three modules.
The modules are fuzzy hotel search module, hotel detail information, and hotel
virtual visit module. Each module is used for a specific task. A user interface was
designed for the user to enter the data and returned the information to the user.
The system used fuzzy inference system to provide linguistic terms such as cheap,
moderate, expensive for hotel price, and the fuzzy rules of the system were used
to find the cost of the hotel stay. This fuzzy expert system is more convenient and
easier for the user to choose the hotel based on their demand such as cheaper hotel,
expensive hotel. The system was tested by the potential users and hotel experts.
27
Chapter 2: Preliminaries and Related Works
It can be used to improve the operations by reducing the cost of enquires, and
providing quick information about the hotel search.
2.10.2 Related Works of Fuzzy Inference System in Medical Di-
agnostic Systems
This section examines the literature relating to the FIS used to develop diagnosis
systems.
There are many published papers where FIS has been used to develop different ap-
plications, most of them are based on a fuzzy inference engine using the MATLAB
toolbox. However, many of these relate to the diagnosis of various diseases.
Adeli et al. [10] proposed an expert system for the heart disease diagnosis using
fuzzy logic. In this paper, the crisp value was fuzzified in order to get fuzzy values.
Using those fuzzy values, the fuzzy rules were prepared. The expert system used
those fuzzy values and fuzzy rules to obtain the output fuzzy set. The fuzzy output
was then defuzzified to get a single output, which is a crisp value. This crisp value
indicates the stage of heart disease.
Durai et al. [35] designed a lung cancer diagnosis using fuzzy rule based infer-
ence system. In this system, the dataset was prepared by consulting the domain
expert. The data includes symptoms, stages and treatment facilities that can be
used to diagnose lung cancer efficiently.
Soni et al. [36] designed what they called an “Intelligent and Effective Heart
Disease Prediction System using weighted associative classifiers”. They imple-
mented the system using Java as front end and MS Access as the back end tool. In
28

Chapter 2: Preliminaries and Related Works
case of prediction the authors considered two cases: people with heart disease and
people with no heart disease.
Neshat et al. [11] developed a diagnosis system for liver disorders using a
fuzzy expert system in MATLAB. In their developed system, they considered two
cases to diagnose liver disorders: people with a healthy liver, and people with an
unhealthy liver.
Kadhim et al. [37] implemented a back pain diagnosis method using a fuzzy
expert system. In their system, a decision tree is created for sequence of the deci-
sion. In the developed system, the fuzzy rules were prepared by the experts.
Kalpana et al. [12] developed a diabetes diagnosis system using fuzzy assess-
ment methodology in MATLAB. The system is used to diagnose the diabetes of
young people aged between 26 and 30. They considered two cases in diagnosing
diabetes, which were young people with diabetes and young people with no dia-
betes.
The paper presented by R.Parvin and Abhari [38], and published by Medical
Processes Modeling and Simulation related conference provides the foundation of
the framework proposed by this study. The experiments performed by R. Parvin
and Abhari smooth the path for this study.
This research follows the hotel FIS in [5] to implement the fuzzy inference sys-
tem in SQL to provide the user a diagnosis result same as the hotel advisory system
provides the hotel information based on the rate of the hotel. This study also used
the concepts presented in Adeli et al. [10] for heart disease application, Kalpana et
al. [12] for diabetes mellitus, and Neshat et al. [11] for liver disorders in order to
29
Chapter 2: Preliminaries and Related Works
select the datasets, inputs, outputs, fuzzy rules, and to develop the fuzzy inference
system in MATLAB for validation purpose of the applications. The inputs and
output (i.e., data) of fuzzy inference system are the attributes that are related to the
problems to solve by the fuzzy inference system. For example, for the fuzzy infer-
ence system developed in [10], [12], and [11] used the indicators (such as cholesterol
for heart disease) that are responsible in developing the disease. The sensitivity
of selecting number of inputs was done by implementing the heart disease appli-
cation in MATLAB once with the same number of inputs, output, and fuzzy rules
used in [10] and once again with the number of inputs provided in the dataset. The
results obtained from the both was compared to observe the sensitivity of selecting
the number of inputs. The fuzzy inference system presented in [10] [11], and [12]
was developed in MATLAB.
This research used Microsoft Access 2007 to implement the system and extended
the work adding other features of database design such as schema, null values.
2.11 Related Works of Implementing Fuzzy Concept
and Schema Design of Traditional Database Sys-
tem
This section presents the related work of implementing fuzzy concept in schema
design of the database system.
N. Mallikharjuna Rao et al. [34] designed a mobile database model using a
fuzzy database. The idea of using fuzzy database in retrieving information from
30
Chapter 2: Preliminaries and Related Works
a mobile database is to reduce the time complexity in querying the data as well as
to provide fuzzy query in natural language to retrieve the information according
to the user demands. In case of regular database system, some of the schema de-
signs for the mobile database were subscriber profile database, mobile switching
center database, visitor location register database, home location register database,
equipment register database, and authentication register database. These schema
designs were then changed into fuzzy schema design by defining fuzzy sets for
some of the attributes. For example, the subscriber schema design in relational
database system has the attributes subscriber name, subscriber address, photo at-
tachment, SIM number, HLR (home location register ) address, and Location area (
which indicates the movement of the subscriber from one place to another place).
In the case of fuzzy database design for the same subscriber schema design, only
for the HLR and location area were defined with fuzzy sets to provide the flexibil-
ity to the subscriber to select any address from the fuzzy sets. In the same way,
some of the other attributes in the mentioned schema designs of mobile database
were defined with the fuzzy sets to convert the relational database system with
the fuzzy database system. The concept of using fuzzy capability to the mobile
database would help to retrieve information efficiently from the heavy load of data
and inserted new information in the centralized database system.
Sergaki et al. [39] developed a fuzzy database system for the maintenance of
planning in a power system. The main challenges in maintaining power system are
the size and complexity of power plants. In such cases where the components are
complex, classification of the objects can be used to make the components simple.
31

Chapter 2: Preliminaries and Related Works
In the power planning system the output is operational condition. By using classi-
fication, operational conditions can be divided into the fuzzy sets of light, heavy,
normal, and emergency. The system used three mechanisms named classification,
composition, and generalization to develop fuzzy relational database system for
the power maintenance planning of the power system. The schema designs for
the planning system were user input, labels, power plant equipment, data types,
criteria-1, and criteria. Each schema was designed to store different information.
For example, the datatype schema consisted of two attributes named input1 and
input2. When the data were interval (fuzzy data) then both of the attributes were
used to store the data. In other cases, only input1 attribute was used to represent
the data. The userinput schema design was used for the interface design to get the
input from the user. The classes (i.e. classifications of inputs) were related to each
other by three relationships aggregation, inheritance, and association. The linguis-
tic terms used in developing the fuzzy relational database system for the power
plant provides more flexibility in handling and evaluating the fuzzy information.
The idea of using classification of the inputs presented in this paper (similar
to the linguistic terms used in this research) is implemented in the fuzzy schema
design of this system. To develop a fuzzy relational database system, Sergaki et al.
[39] used Microsoft Access.
In [40] a study of using fuzzy logic in database is described. A fuzzy approach
is used in searching of the used cars from Czech Republic. For example, the schema
design for searching a specific car model was id, price, year, km, engine body type.
The searching option for a specific car model using different criteria was compared.
32
Chapter 2: Preliminaries and Related Works
For example, in traditional database system, the car was searched by combining
different criteria such as price, km, and both of them ( price and km). Also, the
same search was done using the range values (fuzzy logic) in price and km. The
searching results obtained from the traditional database system and fuzzy database
system showed that fuzzy database can offer users the best searching options with
a full overview. The concept of using range values (fuzzy logic) was used in the
fuzzy schema design of this system. Using fuzzy logic in the schema design of this
system will allow the user to search for a diagnosis using the linguistic terms (e.g.
Age = young).
In [41] a test database was used to compare the performance of traditional and
fuzzy database. The fuzzy schema design for the account of a banking database sys-
tem was considered which contains information of account number, branch name
and balance. In the case of traditional database all the attributes of the account
were crisp. For fuzzy database, the only fuzzy attribute was balance. The fuzzy
set for balance had three linguistic terms “ High”, “Moderate”, and “low”. Each
linguistic term has the membership function. The performance of a query depends
on the data structure and database size which may have millions of data and re-
quires considerable time to find a precise record from the database. Since database
size is increasing day by day, so it is necessary to decrease the time complexity in
retrieving information to make a database more convenient. A binary search tree
algorithm was used to compare the query cost over a traditional database system
and a fuzzy database system. At first, the account information was retrieved by
using a traditional database system. Then the fuzzy query was used to retrieve the
33
Chapter 2: Preliminaries and Related Works
same information of the same account. The experimental results showed that the
fuzzy query retrieve information more efficiently compared to the classical query.
In [42] the fuzzy schema design for customer relationships uses fuzzy classifi-
cation query language as described in the paper. In this system, the combination
of fuzzy logic with relational database system are used. Classifying the data into
fuzzy data is helpful to process the containing human words. The concepts of
classifying the data in fuzzy data presented in this paper is used in this research in
order to implement the fuzzy schema design.
Chapter Summary:
In this chapter, preliminary concepts and related works are introduced. The
related works were described in three different categories. Firstly, different rela-
tional database models and extension of SQL to support fuzziness were described.
A sample of general FIS was used for general application such as hotel selection.
Related works of fuzzy inference system in medical diagnosis were described. Re-
lated works of fuzzy database model using a traditional database system along
with a related work for the fuzzy schema design are provided. The next chapter,
addresses the methodologies used for the research activities.
34

Chapter 3
Methodology
This chapter describes the methodology used in developing the fuzzy database
system, which includes fuzzy inference system, fuzzy database schema design, and
an integration of both by Microsoft Access.
3.1 Data Collection
There are six primary methods to elicit knowledge from people for the construc-
tion of a MF. The methods are polling, interval estimation, direct rating, reverse
rating, membership exemplification and pairwise comparison [43].
This research used a direct rating method because it was the most direct means of
collecting data for constructing a membership function. In this method, the data
(subject) are presented in a series of data (objects) to the domain experts and asked
to rate the membership function for each. In order to construct a membership func-
tion, the responses taken from several physicians were aggregated. The lowest and
35
Chapter 3: Methodology
highest value were considered to make the ranges for membership function calcu-
lation. The lowest is used as the minimum and highest as the maximum values.
All collected data would fall within the range, removing any chance of losing data.
The data collections for heart disease, diabetes mellitus, and liver disorders are
provided in Appendix A, table A.1, A.2, A.3, A.4 and A.5.
3.2 Dataset
In order to compare and validate the findings, the system was tested on the most
widely used heart dataset [7], liver disorders dataset [9], and Pima Indian diabetes
dataset [8] from UCI machine learning dataset available for the researchers.
In heart data set, there are 303 records and 13 attributes. All of them were used
in this study. Adeli et al. [10] used 11 attributes from heart disease dataset for
building membership functions. In liver disorders dataset, there are 368 records
and 8 attributes. This research used all of them. Neshat et al. [11] also uses these
attributes from liver disorders dataset. In diabetes dataset, there are 768 records
and 8 attributes. This study continued with using all of them. M.Kalpana et al. [12]
used 6 attributes from diabetes dataset. The attributes selected for a specific disease
are also called indicators interchangeably. The indicators of a disease are the main
contributors in developing that disease. This research used all of the attributes to
be able to compare the developed fuzzy database system with the original dataset
results.
36
Chapter 3: Methodology
3.3 Fuzzy Database Design
In this research, a fuzzy database system for medical diagnosis was designed,
which is able to deal with a variety of data as follows:
• Data available in traditional database system, where all the data are crisp.
• Data that are in linguistic terms.
• Data that are a combination (mixture) of both.
In all of the above cases, it is possible to have null values. Null values represents
missing data. This study also considered the cases of having null. In FIS design,
the data were not defined as fuzzy initially. Then it was linked to a procedure to
be able to use with fuzzy data. When there is no accurate data, the fuzzy database
schema design will be able to retrieve information using linguistic terms. In cases
when some data are crisp and some linguistic, the combination of the FIS and fuzzy
schema design are able to provide information. While designing the system, the
cases of having null values were also considered.
37
Chapter 3: Methodology
Primary Key- DataType Foreign Key- Data Type Entity Name- DataType
Table_ Name2
Primary Key- DataType Entity Name- DataType
Table_Name1 Relationship
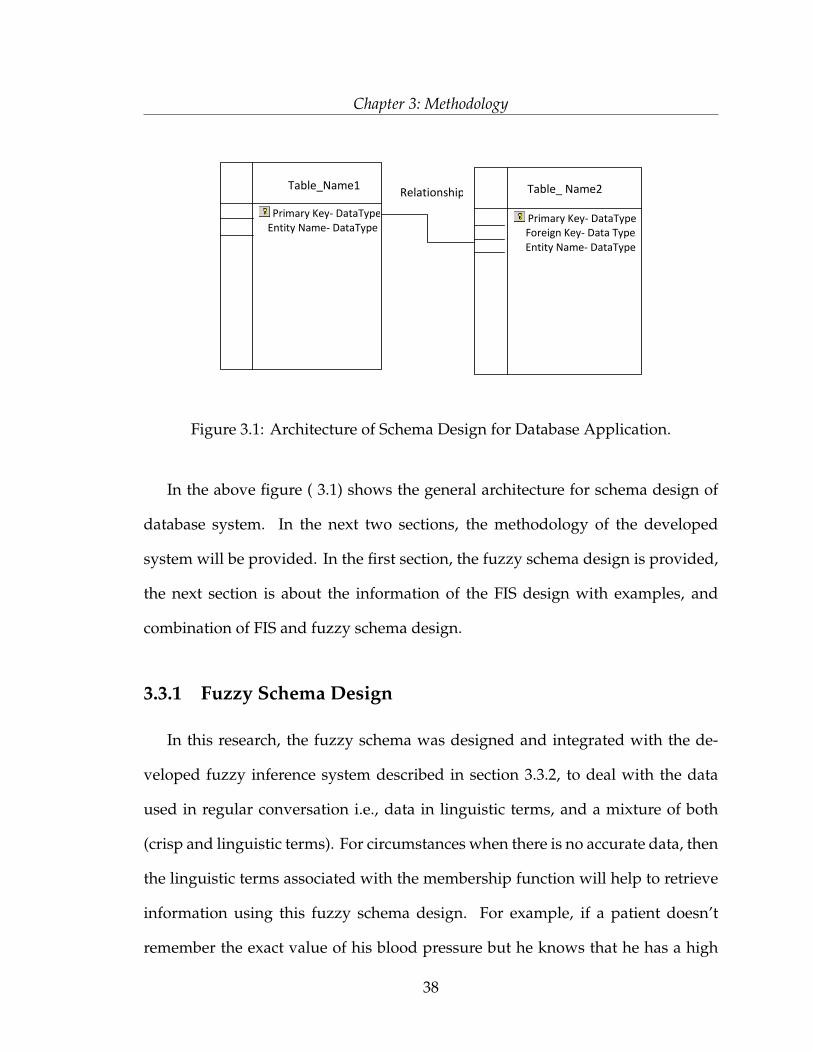
Figure 3.1: Architecture of Schema Design for Database Application.
In the above figure ( 3.1) shows the general architecture for schema design of
database system. In the next two sections, the methodology of the developed
system will be provided. In the first section, the fuzzy schema design is provided,
the next section is about the information of the FIS design with examples, and
combination of FIS and fuzzy schema design.
3.3.1 Fuzzy Schema Design
In this research, the fuzzy schema was designed and integrated with the de-
veloped fuzzy inference system described in section 3.3.2, to deal with the data
used in regular conversation i.e., data in linguistic terms, and a mixture of both
(crisp and linguistic terms). For circumstances when there is no accurate data, then
the linguistic terms associated with the membership function will help to retrieve
information using this fuzzy schema design. For example, if a patient doesn’t
remember the exact value of his blood pressure but he knows that he has a high
38
Chapter 3: Methodology
blood pressure, the membership function associated with the linguistic term “high
blood pressure” will be able to retrieve the data for the high blood pressure.
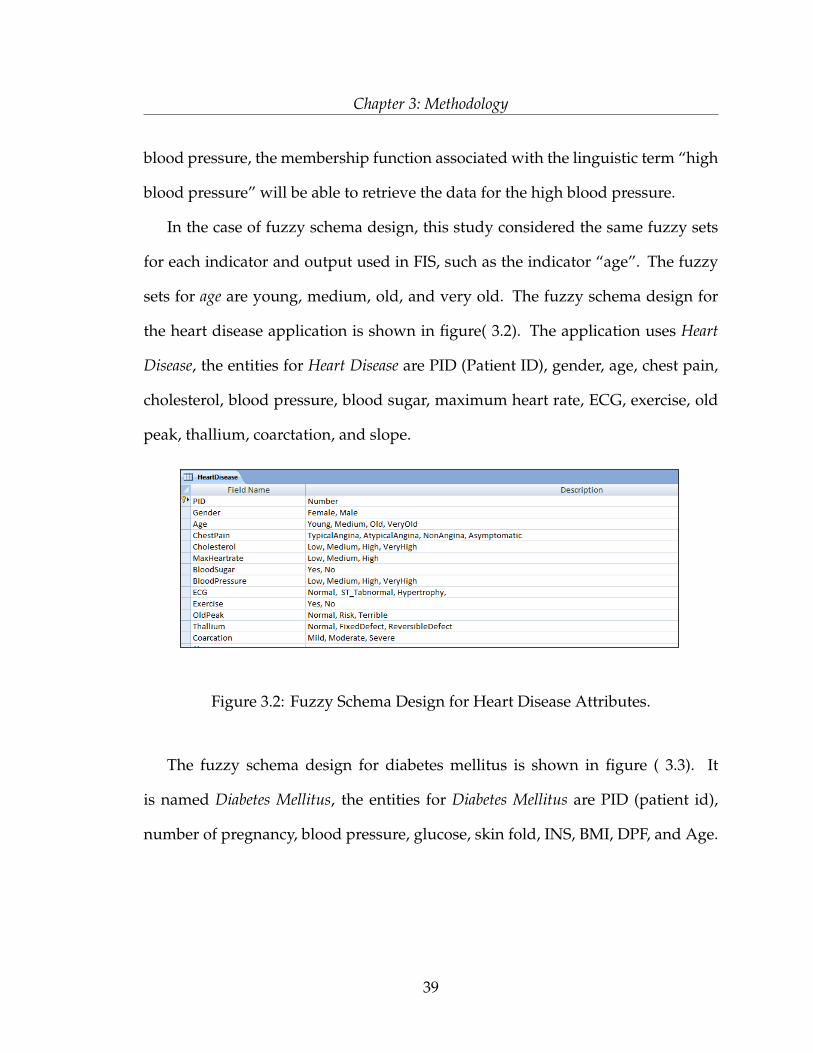
In the case of fuzzy schema design, this study considered the same fuzzy sets
for each indicator and output used in FIS, such as the indicator “age”. The fuzzy
sets for age are young, medium, old, and very old. The fuzzy schema design for
the heart disease application is shown in figure( 3.2). The application uses Heart
Disease, the entities for Heart Disease are PID (Patient ID), gender, age, chest pain,
cholesterol, blood pressure, blood sugar, maximum heart rate, ECG, exercise, old
peak, thallium, coarctation, and slope.
Figure 3.2: Fuzzy Schema Design for Heart Disease Attributes.
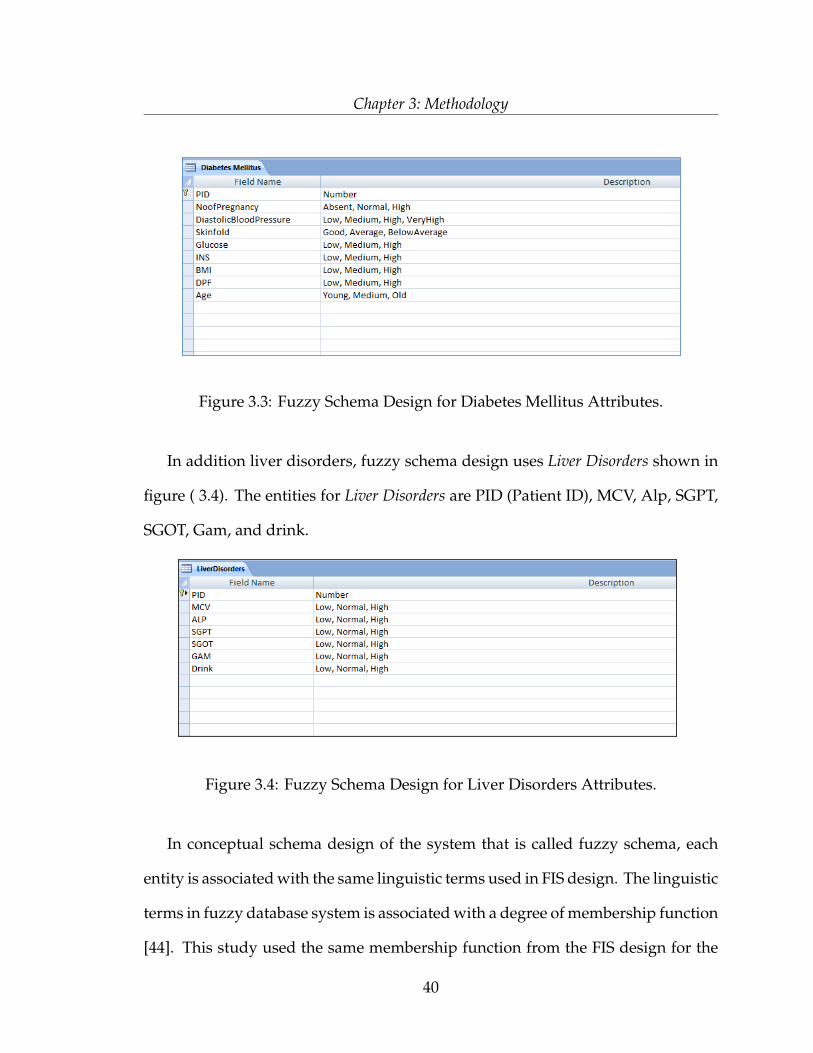
The fuzzy schema design for diabetes mellitus is shown in figure ( 3.3). It
is named Diabetes Mellitus, the entities for Diabetes Mellitus are PID (patient id),
number of pregnancy, blood pressure, glucose, skin fold, INS, BMI, DPF, and Age.
39
Chapter 3: Methodology
Figure 3.3: Fuzzy Schema Design for Diabetes Mellitus Attributes.
In addition liver disorders, fuzzy schema design uses Liver Disorders shown in
figure ( 3.4). The entities for Liver Disorders are PID (Patient ID), MCV, Alp, SGPT,
SGOT, Gam, and drink.
Figure 3.4: Fuzzy Schema Design for Liver Disorders Attributes.
In conceptual schema design of the system that is called fuzzy schema, each
entity is associated with the same linguistic terms used in FIS design. The linguistic
terms in fuzzy database system is associated with a degree of membership function
[44]. This study used the same membership function from the FIS design for the
40

Chapter 3: Methodology
fuzzy schema to use the linguistic terms (fuzzy sets). Therefore, the designed
fuzzy schema is able to handle all types of data: crisp, linguistic, mixture, and null.
For example, a sample query for heart disease application from a database of 10
patient’s records can be:
find all the young patients with high cholesterol who have a severe heart disease condition,
which can be translated into the following SQL command in order to retrieve the
information:
Select PID, Age, Cholesterol, Diagnosis
form HeartDisease
Where (( Age = ‘‘young") And (Cholesterol = ‘‘High")
And (Diagnosis = ‘‘Severe"));
The following information is shown in table ( 3.1) in return of the above query.
Table 3.1: Result of the Query
PID Age Cholesterol Diagnosis
2 Young High Severe
6 Young High Severe
7 Young High Severe
The above retrieved information shows that there are three patients out of 10
records satisfy the query conditions. The PID indicates the patient’s identification
number.
In order to retrieve information in both crisp and linguistic terms, the above men-
tioned query can be written in the following way, which is similar to human natural
41
Chapter 3: Methodology
language.
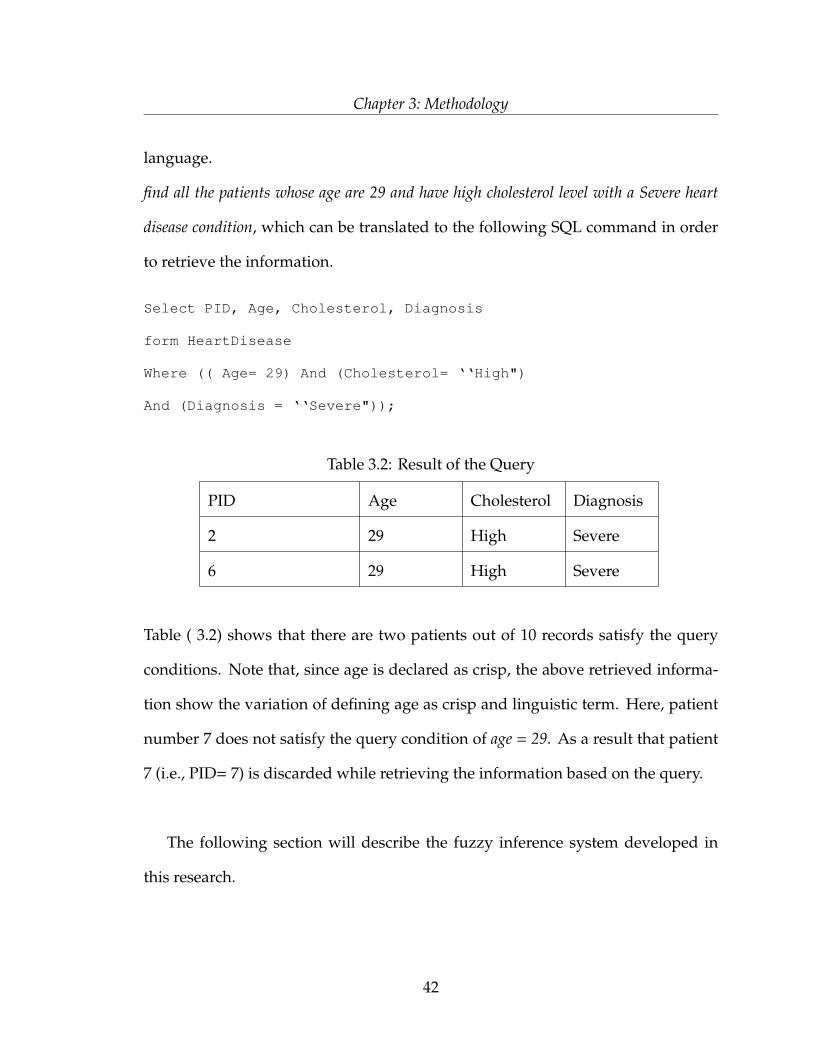
find all the patients whose age are 29 and have high cholesterol level with a Severe heart
disease condition, which can be translated to the following SQL command in order
to retrieve the information.
Select PID, Age, Cholesterol, Diagnosis
form HeartDisease
Where (( Age= 29) And (Cholesterol= ‘‘High")
And (Diagnosis = ‘‘Severe"));
Table 3.2: Result of the Query
PID Age Cholesterol Diagnosis
2 29 High Severe
6 29 High Severe
Table ( 3.2) shows that there are two patients out of 10 records satisfy the query
conditions. Note that, since age is declared as crisp, the above retrieved informa-
tion show the variation of defining age as crisp and linguistic term. Here, patient
number 7 does not satisfy the query condition of age = 29. As a result that patient
7 (i.e., PID= 7) is discarded while retrieving the information based on the query.
The following section will describe the fuzzy inference system developed in
this research.
42

Chapter 3: Methodology
3.3.2 FIS Design with Traditional Database System
In order to develop fuzzy database system, initially a fuzzy inference system
with traditional database system is developed, which way able to deal with the data
available in the traditional database system, where all the data are crisp, then fuzzy
schema described in previous section with membership function calculation for
linguistic terms, it was integrated. Here, the algorithm of FIS degisn for traditional
database are explained.
In this study, three different applications, which are heart disease, diabetes mellitus,
and liver disorders are developed. As described in chapter 2, FIS structure consists
of four steps: fuzzification, rule evaluation, aggregation, and defuzzification. This
study followed Mamdani method to develop the system. The FIS design for the
above mentioned three medical applications were developed using an SQL-based
traditional database system. The membership functions of the inputs, the fuzzy
rules, the aggregating rules, and the defuzzification were generated using the SQL.
The parts of the SQL design and snapshot of the SQL are provided in Appendix C.
In order to develop the FIS design the following steps were followed:
• Identify the indicators of each disease and define the fuzzy sets for each
indicator.
• Prepare the range value for each of the indicator.
• Construct the equation using the range value.
• Define membership function for the fuzzy sets using the equation.
43
Chapter 3: Methodology
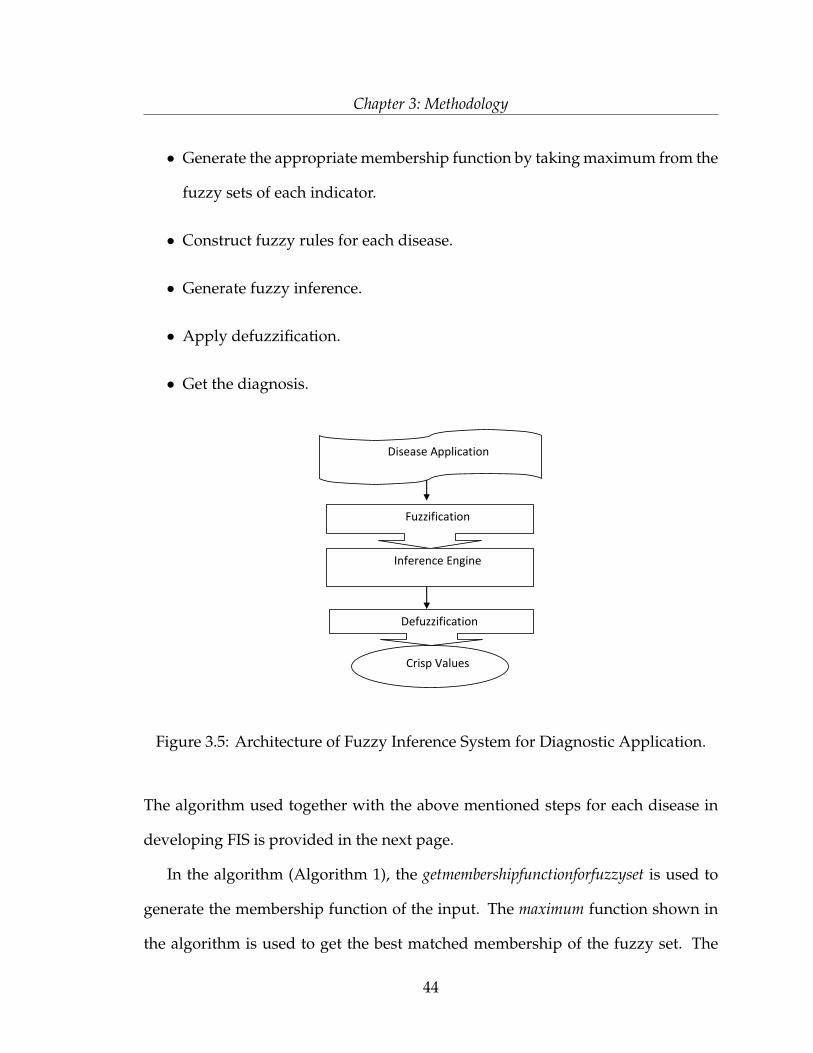
• Generate the appropriate membership function by taking maximum from the
fuzzy sets of each indicator.
• Construct fuzzy rules for each disease.
• Generate fuzzy inference.
• Apply defuzzification.
• Get the diagnosis.
Disease Application
Fuzzification
Inference Engine
Defuzzification
Crisp Values
Figure 3.5: Architecture of Fuzzy Inference System for Diagnostic Application.
The algorithm used together with the above mentioned steps for each disease in
developing FIS is provided in the next page.
In the algorithm (Algorithm 1), the getmembershipfunctionforfuzzyset is used to
generate the membership function of the input. The maximum function shown in
the algorithm is used to get the best matched membership of the fuzzy set. The
44

Chapter 3: Methodology
Algorithm 1 Algorithm for Inclusion of Fuzzy Inference System in SQLRequire: Crisp Value for Input.
begin
for each input do
if crisp value ≥ range values // check the range of the input
A = GetMembershipFunctionForFuzzySet (Input) //Generating the membership
function for the fuzzy sets of the inputs.
else if crisp value ≤ range values
B = GetMembershipFunctionForFuzzySet (Input) // Generating the membership
function for the fuzzy sets of the inputs.
end if
end else if
end for
for each input fuzzy set
Linguisticterm = Maximum(membershipfunctionfuzzysets) // Generate Linguistic
variable based on Maximum (The applications are developed using Maximum
concept of fuzzy logic)
End for
for each Lingustic term
C = GetRelatedRule // Generate Rules
end for
45

Chapter 3: Methodology
Algorithm for Inclusion of Fuzzy Inference System in SQL(Continued)
for each Rules
D = MembershipFunctionofInput * MembershipofOutputfuzzyset // Calculate Rule
strength
end for
E = Fuzzy Union(D) // Generate final Output Fuzzy Set
F =∫
(membershipFunction*Outputvariable)/∫
MembershipFunction //Defuzzification
G = Linguisticterm(F) // Final Diagnosis
end
getrelatedrule is used to generate the rules based on the input, and the fuzzyunion is
used to generate the final fuzzy set.
The next describes the methodology of the developed system for the applica-
tions. Heart disease impacts the natural structure and functions of the heart. Many
indicators are involved in causing heart disease. The indicator indicates the chance
of getting a disease. The major indicators of heart disease are those that signif-
icantly increase the risks to heart and blood vessels (the cardiovascular system).
The possibility of developing a heart disease depends on the number of indicators
one has exposed. Some of the indicators in heart disease such as increasing age,
and gender are related to birth and cannot be changed. Age and gender are the
influencers of the cholesterol level [45]. Heart disease diagnosis with appropriate
stages requires consideration of some other indicators such as chest pain, blood
pressure, blood sugar, maximum heart rate, electrocardiography (ECG), exercise,
old peak, thallium scan, coarctation of the aorta, slope like as age, gender and
46
Chapter 3: Methodology
cholesterol [45]. These thirteen indicators are the inputs of the heart disease ap-
plication because these indicators are the main contributors in developing heart
disease. The output of the system is the heart disease diagnosis. The explanation
of each input for the heart disease application has been provided in Appendix A,
A.1.
Diabetes Mellitus (DM) is a combination of diseases classified by the high blood
glucose levels. High blood glucose level is a symptom of defective insulin receptors
or lack of insulin producing islet cells [46]. The indicators for DM are the inputs of
the developed system. In case of DM, the indicators are glucose concentration in
blood after 2-hours of having breakfast, serum insulin (INS) in blood after 2 hours
of having breakfast, number of pregnancy (for female), diastolic blood pressure,
triceps skin fold thickness, body mass index (BMI), diabetes pedigree function
(DPF), and age [46]. The output of the system for DM is the condition of DM, i.e.
diabetes mellitus or no diabetes mellitus. The explanation of each input for the
diabetes mellitus application has been provided in Appendix A , A.2.
The liver is the largest organ in the body. The liver is involved in a number of
roles of converting food into energy and eliminating alcohol and poisons from the
blood. If any of the normal functionality fails, it is considered to be a liver disorder
(L D). The indicators of L D are the inputs of the system. In case of L D, the indica-
tors are mean corpuscular volume (MCV), alkaline phosphates (Alp), Sgpt alamine
aminotransferase, Sgot aspertate aminotransferase, Gammagt gamma-glut amyl
Tran peptidase, and drinks per day. The explanation of each input for the L D has
been provided in Appendix A, A.3. The following sections will describe the fuzzy
47
Chapter 3: Methodology
inference system step by step.
3.3.3 Fuzzification
This is the first step of fuzzy inference system. The fuzzy sets for the indicators,
and the output of each disease along with the membership function were defined
in fuzzification.
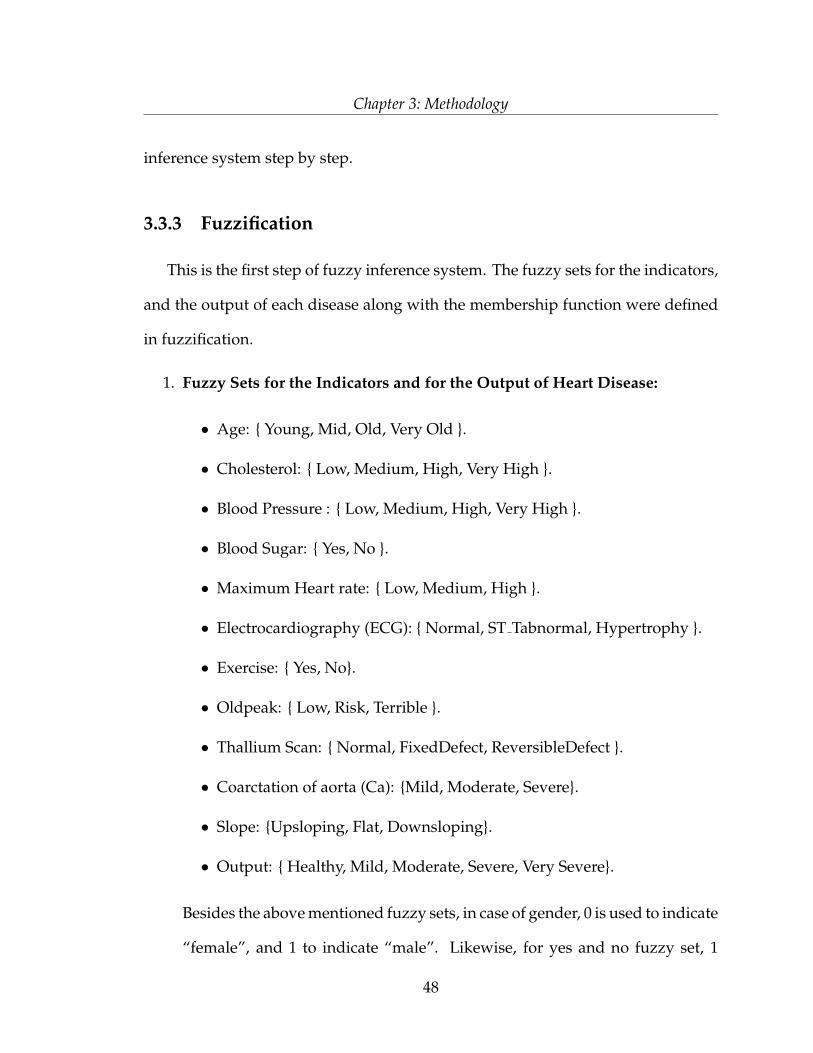
1. Fuzzy Sets for the Indicators and for the Output of Heart Disease:
• Age: { Young, Mid, Old, Very Old }.
• Cholesterol: { Low, Medium, High, Very High }.
• Blood Pressure : { Low, Medium, High, Very High }.
• Blood Sugar: { Yes, No }.
• Maximum Heart rate: { Low, Medium, High }.
• Electrocardiography (ECG): { Normal, ST Tabnormal, Hypertrophy }.
• Exercise: { Yes, No}.
• Oldpeak: { Low, Risk, Terrible }.
• Thallium Scan: { Normal, FixedDefect, ReversibleDefect }.
• Coarctation of aorta (Ca): {Mild, Moderate, Severe}.
• Slope: {Upsloping, Flat, Downsloping}.
• Output: { Healthy, Mild, Moderate, Severe, Very Severe}.
Besides the above mentioned fuzzy sets, in case of gender, 0 is used to indicate
“female”, and 1 to indicate “male”. Likewise, for yes and no fuzzy set, 1
48
Chapter 3: Methodology
indicates “yes” and 0 indicates “no”. In case of chest pain, there are four types
of chest pain: atypical angina, typical angina, non angina, and asymptomatic.
The chest pain is indicated by using: atypical angina = 1, typical angina = 2,
non angina = 3, and asymptomatic = 4. A patient can have only one type of
chest pain at any given time. In terms of the slope, it is indicated by using: up
sloping = 1, flat = 2 and down sloping = 3. The output fuzzy set for healthy
= 0, mild =1, moderate = 2, severe =3, and very severe = 4. This research
modified the ranges used in [10] for the output fuzzy set. The reason behind
the modification was that the figure of the output membership function in
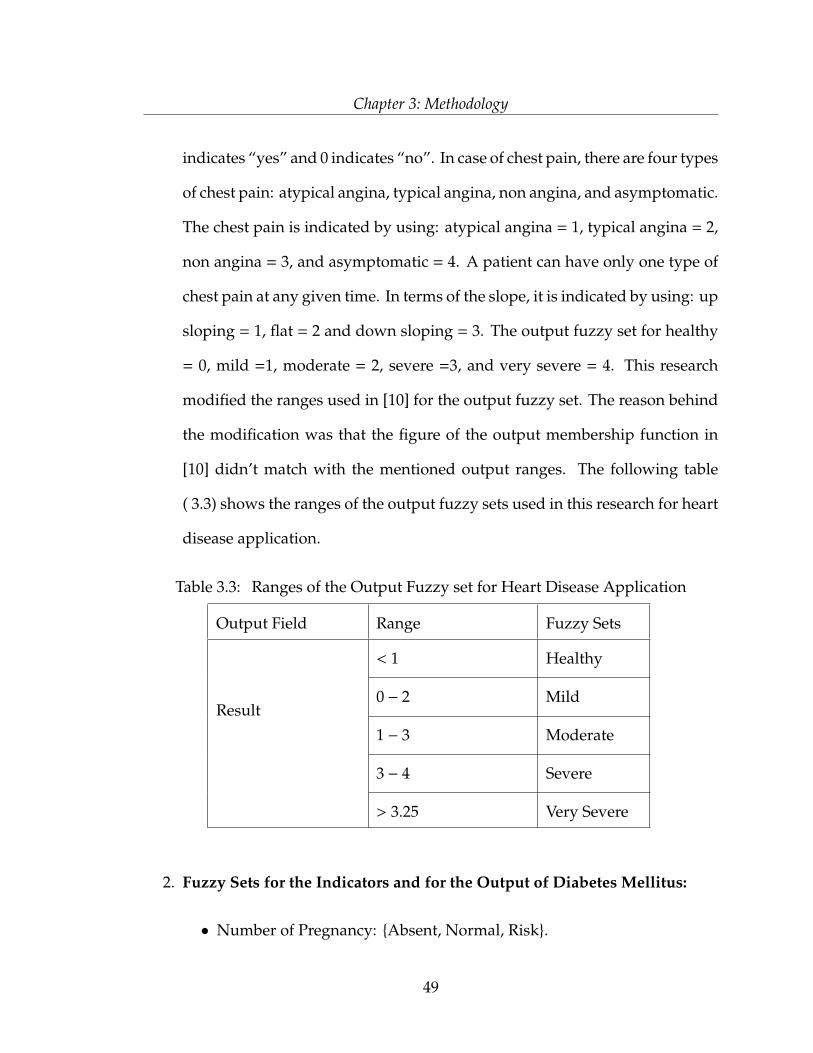
[10] didn’t match with the mentioned output ranges. The following table
( 3.3) shows the ranges of the output fuzzy sets used in this research for heart
disease application.
Table 3.3: Ranges of the Output Fuzzy set for Heart Disease Application
Output Field Range Fuzzy Sets
Result
< 1 Healthy
0 − 2 Mild
1 − 3 Moderate
3 − 4 Severe
> 3.25 Very Severe
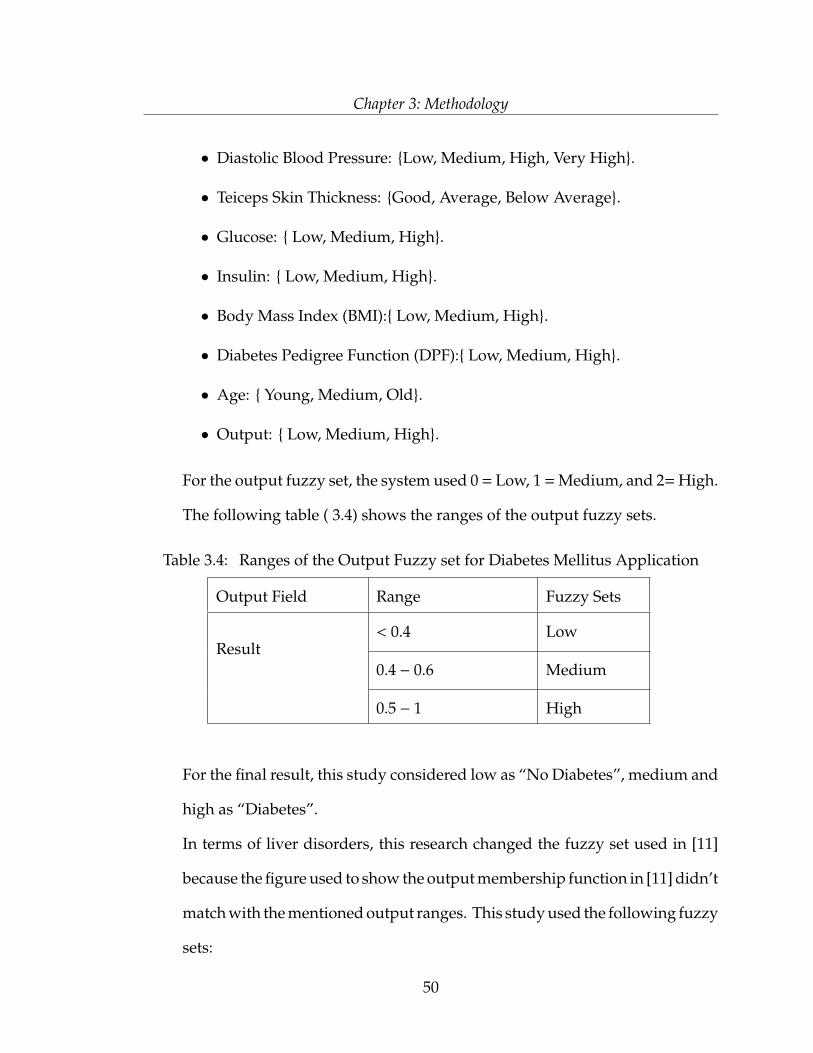
2. Fuzzy Sets for the Indicators and for the Output of Diabetes Mellitus:
• Number of Pregnancy: {Absent, Normal, Risk}.
49
Chapter 3: Methodology
• Diastolic Blood Pressure: {Low, Medium, High, Very High}.
• Teiceps Skin Thickness: {Good, Average, Below Average}.
• Glucose: { Low, Medium, High}.
• Insulin: { Low, Medium, High}.
• Body Mass Index (BMI):{ Low, Medium, High}.
• Diabetes Pedigree Function (DPF):{ Low, Medium, High}.
• Age: { Young, Medium, Old}.
• Output: { Low, Medium, High}.
For the output fuzzy set, the system used 0 = Low, 1 = Medium, and 2= High.
The following table ( 3.4) shows the ranges of the output fuzzy sets.
Table 3.4: Ranges of the Output Fuzzy set for Diabetes Mellitus Application
Output Field Range Fuzzy Sets
Result< 0.4 Low
0.4 − 0.6 Medium
0.5 − 1 High
For the final result, this study considered low as “No Diabetes”, medium and
high as “Diabetes”.
In terms of liver disorders, this research changed the fuzzy set used in [11]
because the figure used to show the output membership function in [11] didn’t
match with the mentioned output ranges. This study used the following fuzzy
sets:
50
Chapter 3: Methodology
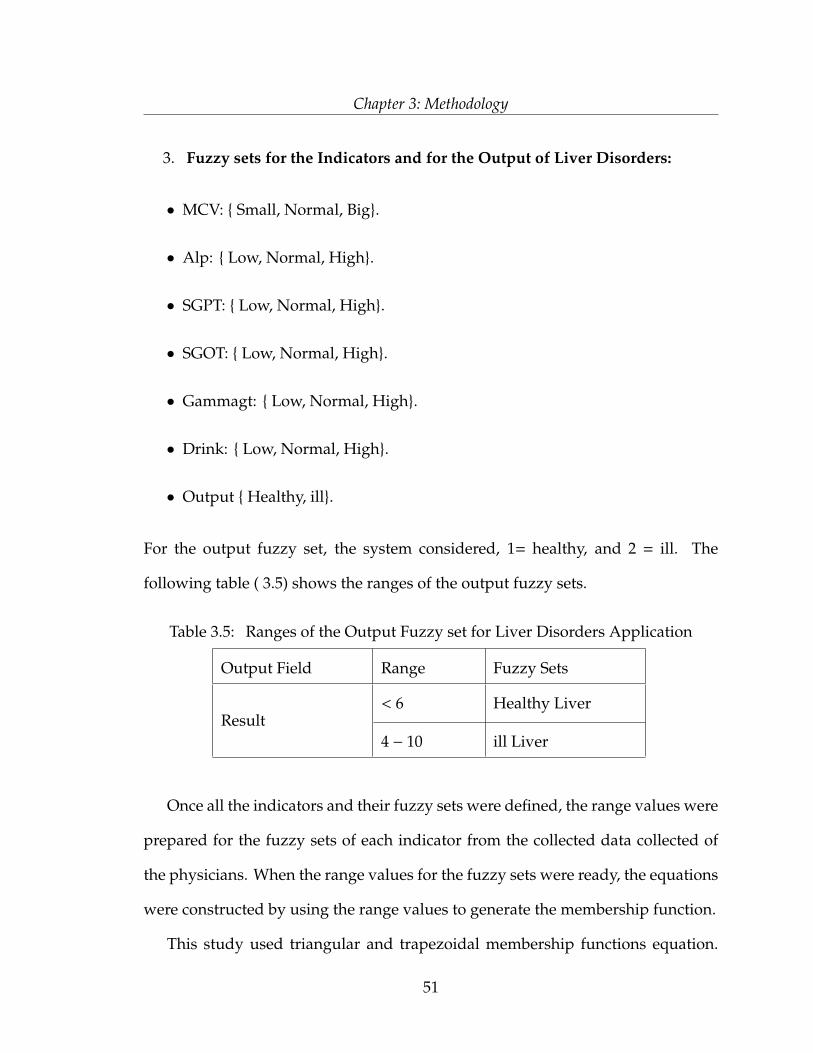
3. Fuzzy sets for the Indicators and for the Output of Liver Disorders:
• MCV: { Small, Normal, Big}.
• Alp: { Low, Normal, High}.
• SGPT: { Low, Normal, High}.
• SGOT: { Low, Normal, High}.
• Gammagt: { Low, Normal, High}.
• Drink: { Low, Normal, High}.
• Output { Healthy, ill}.
For the output fuzzy set, the system considered, 1= healthy, and 2 = ill. The
following table ( 3.5) shows the ranges of the output fuzzy sets.
Table 3.5: Ranges of the Output Fuzzy set for Liver Disorders Application
Output Field Range Fuzzy Sets
Result< 6 Healthy Liver
4 − 10 ill Liver
Once all the indicators and their fuzzy sets were defined, the range values were
prepared for the fuzzy sets of each indicator from the collected data collected of
the physicians. When the range values for the fuzzy sets were ready, the equations
were constructed by using the range values to generate the membership function.
This study used triangular and trapezoidal membership functions equation.
51
Chapter 3: Methodology
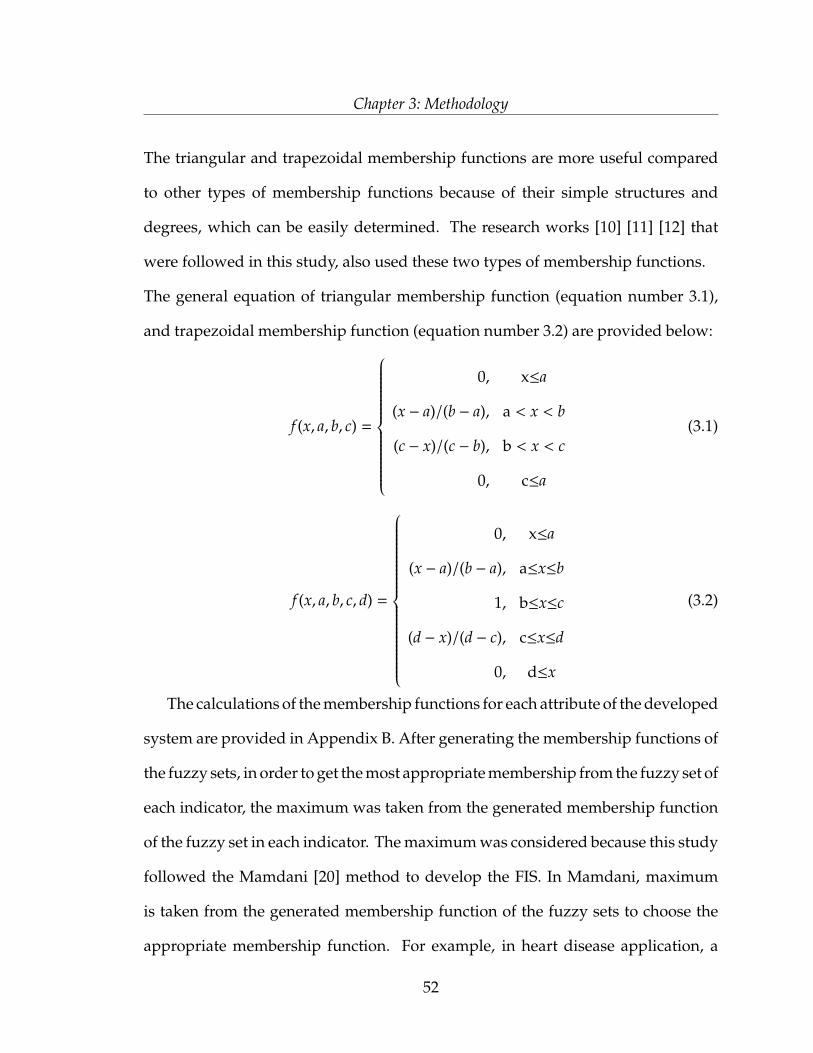
The triangular and trapezoidal membership functions are more useful compared
to other types of membership functions because of their simple structures and
degrees, which can be easily determined. The research works [10] [11] [12] that
were followed in this study, also used these two types of membership functions.
The general equation of triangular membership function (equation number 3.1),
and trapezoidal membership function (equation number 3.2) are provided below:
f (x, a, b, c) =
0, x≤a
(x − a)/(b − a), a < x < b
(c − x)/(c − b), b < x < c
0, c≤a
(3.1)
f (x, a, b, c, d) =
0, x≤a
(x − a)/(b − a), a≤x≤b
1, b≤x≤c
(d − x)/(d − c), c≤x≤d
0, d≤x
(3.2)
The calculations of the membership functions for each attribute of the developed
system are provided in Appendix B. After generating the membership functions of
the fuzzy sets, in order to get the most appropriate membership from the fuzzy set of
each indicator, the maximum was taken from the generated membership function
of the fuzzy set in each indicator. The maximum was considered because this study
followed the Mamdani [20] method to develop the FIS. In Mamdani, maximum
is taken from the generated membership function of the fuzzy sets to choose the
appropriate membership function. For example, in heart disease application, a
52
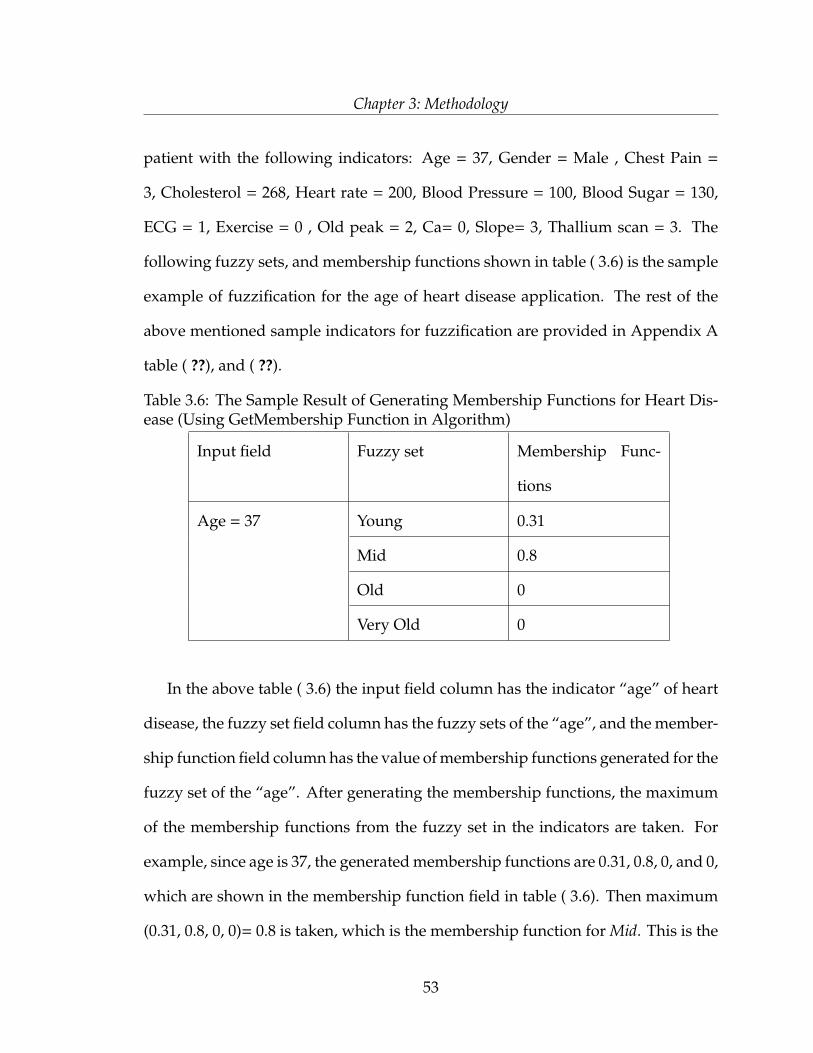
Chapter 3: Methodology
patient with the following indicators: Age = 37, Gender = Male , Chest Pain =
3, Cholesterol = 268, Heart rate = 200, Blood Pressure = 100, Blood Sugar = 130,
ECG = 1, Exercise = 0 , Old peak = 2, Ca= 0, Slope= 3, Thallium scan = 3. The
following fuzzy sets, and membership functions shown in table ( 3.6) is the sample
example of fuzzification for the age of heart disease application. The rest of the
above mentioned sample indicators for fuzzification are provided in Appendix A
table ( ??), and ( ??).
Table 3.6: The Sample Result of Generating Membership Functions for Heart Dis-ease (Using GetMembership Function in Algorithm)
Input field Fuzzy set Membership Func-
tions
Age = 37 Young 0.31
Mid 0.8
Old 0
Very Old 0
In the above table ( 3.6) the input field column has the indicator “age” of heart
disease, the fuzzy set field column has the fuzzy sets of the “age”, and the member-
ship function field column has the value of membership functions generated for the
fuzzy set of the “age”. After generating the membership functions, the maximum
of the membership functions from the fuzzy set in the indicators are taken. For
example, since age is 37, the generated membership functions are 0.31, 0.8, 0, and 0,
which are shown in the membership function field in table ( 3.6). Then maximum
(0.31, 0.8, 0, 0)= 0.8 is taken, which is the membership function for Mid. This is the
53
Chapter 3: Methodology
fuzzification of the system because Mid is the fuzzy result.
Similarly, the membership functions for the fuzzy set of each indicator for heart
disease, diabetes mellitus, and liver disorders were executed. The sample example
for diabetes mellitus, assume a patient with the following indicators: Number of
pregnancy = 6, Glucose = 119, diastolic blood pressure = 72, Triceps skin fold thick-
ness = 35, INS = 0, BMI = 29, DPF = 0.2, Age = 29, are shown in Appendix A table
( ??) ( ??). In addition to liver disorders, a patient with the following indicators:
MCV = 85, Alp= 92, SGPT = 45, SGOT = 27, Gammagt = 31, Drink = 0, the fuzzy
sets, and membership functions are shown in Appendix A table ( ??).
3.3.4 Rule Evaluation
After obtaining the linguistic terms of the indicators, the next step is to generate
the fuzzy rules. For heart disease application, this study used 50 rules. Adeli et al.
[10] used 44 rules. The paper is related to the developed heart disease application.
In terms of Diabetes mellitus application, it has 25 rules. Kalpana et al [12] used 15
rules. Liver disorders application has the rule set of Neshat et al. [11], which are 18
in total. In this study, a few rules of each disease were changed in consultation with
the physicians (domain experts), whose opinion were used for the range selection.
For example, Adeli et al. [10] used the rule “If Chest Pain is angina then result is
healthy”, which is not correct. Hence, angina is the symptom of heart disease [45].
Most of the fuzzy rules of this research followed by the paper. The rule set for
each disease are provided in Appendix A table ( A.6), ( A.7), ( A.8), ( A.9), ( A.10),
( A.11), ( A.13), and ( A.14).
54
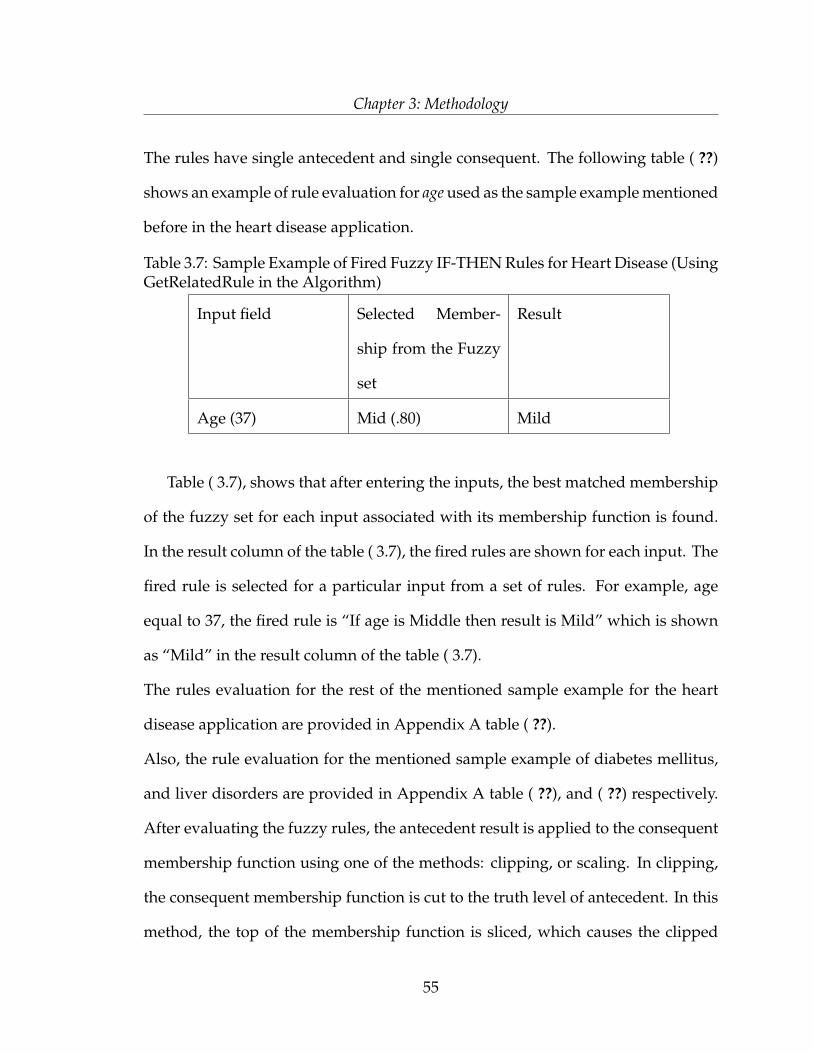
Chapter 3: Methodology
The rules have single antecedent and single consequent. The following table ( ??)
shows an example of rule evaluation for age used as the sample example mentioned
before in the heart disease application.
Table 3.7: Sample Example of Fired Fuzzy IF-THEN Rules for Heart Disease (UsingGetRelatedRule in the Algorithm)
Input field Selected Member-
ship from the Fuzzy
set
Result
Age (37) Mid (.80) Mild
Table ( 3.7), shows that after entering the inputs, the best matched membership
of the fuzzy set for each input associated with its membership function is found.
In the result column of the table ( 3.7), the fired rules are shown for each input. The
fired rule is selected for a particular input from a set of rules. For example, age
equal to 37, the fired rule is “If age is Middle then result is Mild” which is shown
as “Mild” in the result column of the table ( 3.7).
The rules evaluation for the rest of the mentioned sample example for the heart
disease application are provided in Appendix A table ( ??).
Also, the rule evaluation for the mentioned sample example of diabetes mellitus,
and liver disorders are provided in Appendix A table ( ??), and ( ??) respectively.
After evaluating the fuzzy rules, the antecedent result is applied to the consequent
membership function using one of the methods: clipping, or scaling. In clipping,
the consequent membership function is cut to the truth level of antecedent. In this
method, the top of the membership function is sliced, which causes the clipped
55
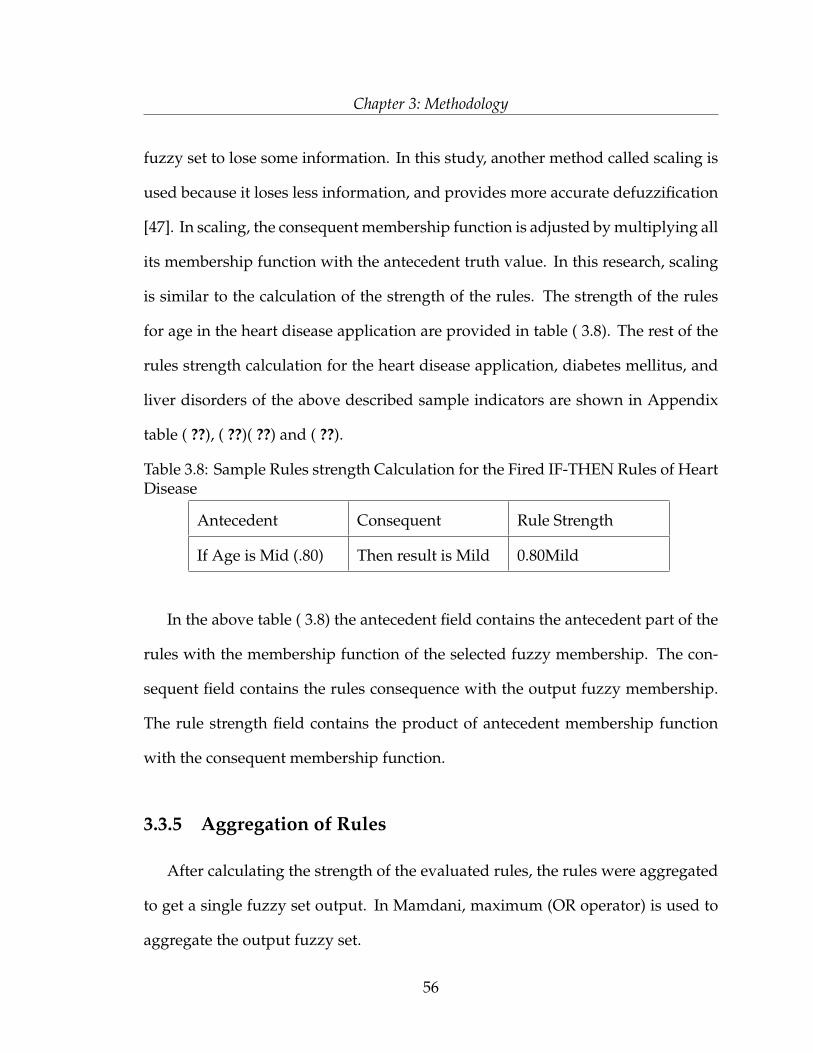
Chapter 3: Methodology
fuzzy set to lose some information. In this study, another method called scaling is
used because it loses less information, and provides more accurate defuzzification
[47]. In scaling, the consequent membership function is adjusted by multiplying all
its membership function with the antecedent truth value. In this research, scaling
is similar to the calculation of the strength of the rules. The strength of the rules
for age in the heart disease application are provided in table ( 3.8). The rest of the
rules strength calculation for the heart disease application, diabetes mellitus, and
liver disorders of the above described sample indicators are shown in Appendix
table ( ??), ( ??)( ??) and ( ??).
Table 3.8: Sample Rules strength Calculation for the Fired IF-THEN Rules of HeartDisease
Antecedent Consequent Rule Strength
If Age is Mid (.80) Then result is Mild 0.80Mild
In the above table ( 3.8) the antecedent field contains the antecedent part of the
rules with the membership function of the selected fuzzy membership. The con-
sequent field contains the rules consequence with the output fuzzy membership.
The rule strength field contains the product of antecedent membership function
with the consequent membership function.
3.3.5 Aggregation of Rules
After calculating the strength of the evaluated rules, the rules were aggregated
to get a single fuzzy set output. In Mamdani, maximum (OR operator) is used to
aggregate the output fuzzy set.
56
Chapter 3: Methodology
3.3.6 Defuzzification
This section describes the last step of FIS design named defuzzificaton. De-
fuzzification is used to get a single output from the output fuzzy set. This research
used centroid defuzzification method. The formula of centroid method has been
provided in chapter 2. The center point of the output distribution are found by
using the formula of the defuzzification. After defuzzification, a single crisp value
was obtained. The crisp value is then fuzzified with the output membership func-
tion. The final output fuzzy set after aggregation, defuzzzification, and the final
diagnosis of the three applications for the sample indicators mentioned before are
shown in table ( 3.9).
57
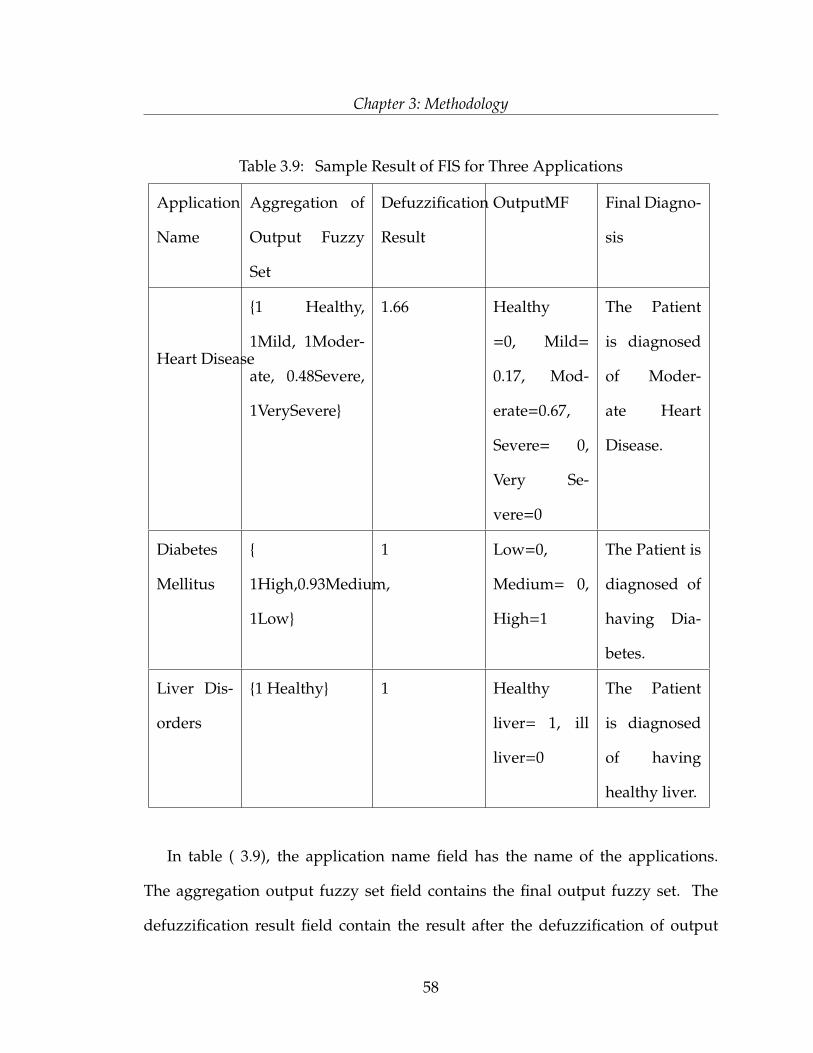
Chapter 3: Methodology
Table 3.9: Sample Result of FIS for Three Applications
Application
Name
Aggregation of
Output Fuzzy
Set
Defuzzification
Result
OutputMF Final Diagno-
sis
Heart Disease
{1 Healthy,
1Mild, 1Moder-
ate, 0.48Severe,
1VerySevere}
1.66 Healthy
=0, Mild=
0.17, Mod-
erate=0.67,
Severe= 0,
Very Se-
vere=0
The Patient
is diagnosed
of Moder-
ate Heart
Disease.
Diabetes
Mellitus
{
1High,0.93Medium,
1Low}
1 Low=0,
Medium= 0,
High=1
The Patient is
diagnosed of
having Dia-
betes.
Liver Dis-
orders
{1 Healthy} 1 Healthy
liver= 1, ill
liver=0
The Patient
is diagnosed
of having
healthy liver.
In table ( 3.9), the application name field has the name of the applications.
The aggregation output fuzzy set field contains the final output fuzzy set. The
defuzzification result field contain the result after the defuzzification of output
58

Chapter 3: Methodology
fuzzy set. The output MF contains the fuzzy set of the output. Lastly, the final
diagnosis field has the diagnosis result based on the output membership function.
The next two consideration of this study are dealing with the mixture data, and
the missing data. In case of mixture data, the integration of the system will help to
deal with that data. The part of the crisp data in the system will gather information
dealing with the FIS design. In addition to the part of the linguistic terms, the
system will gather information dealing with the schema design.
The last consideration of this study in order to develop fuzzy database system
is to get decision from the missing data. Null values are identified as missing data
in this thesis, which means that the data are not zero but unknown. In such cases,
the fuzzy rule evaluation will not generate the fuzzy rules for the null data. For
example, if there is a missing data in a particular field, then the fuzzy rules for that
field will be null , and the diagnose result is calculated without the null field.
Chapter Summary:
In this chapter, the information that are relevant to the implementation of the
main components FIS, and schema design of fuzzy database system are provided.
The examples that are provided in FIS design and schema design will help in
understanding the process of the system. The next chapter will describe the FIS and
neural network in MATLAB to compare the prediction capability. The following
chapter will show the outcomes of fuzzy database system for medical applications
using crisp, linguistic term, mixture, and null values.
59
Chapter 4
Results
In the previous chapter, the main components of fuzzy database system were
developed, which are fuzzy inference system referred to as FIS and fuzzy schema
design to deal with linguistic terms. In this chapter, the user interface linked
with the system is described. User interface designed for the integration of FIS
and fuzzy schema for three different medical diagnostic systems (heart disease,
diabetes mellitus, and liver disorders) using Microsoft Access 2007. In this chapter,
FIS using the fuzzy rules and neural network are also implemented in MATLAB
R2010a, in order to make a comparison of prediction capability between the two
different prediction systems (i.e., FIS and neural network). Finally, a comparison
of FIS implemented on MATLAB with the fuzzy database system is provided. For
comparisons of the results (accuracy) of these applications abbreviation such as
FIS, fuzzy schema design and MATLAB are used in this chapter.
60
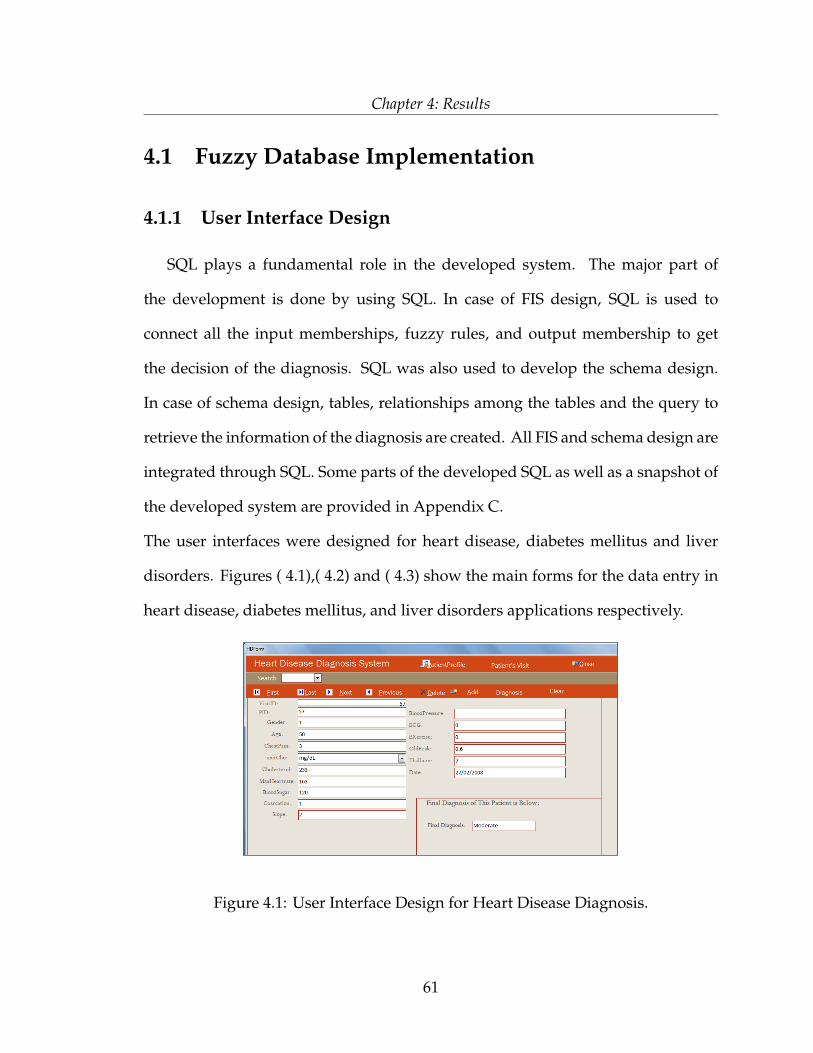
Chapter 4: Results
4.1 Fuzzy Database Implementation
4.1.1 User Interface Design
SQL plays a fundamental role in the developed system. The major part of
the development is done by using SQL. In case of FIS design, SQL is used to
connect all the input memberships, fuzzy rules, and output membership to get
the decision of the diagnosis. SQL was also used to develop the schema design.
In case of schema design, tables, relationships among the tables and the query to
retrieve the information of the diagnosis are created. All FIS and schema design are
integrated through SQL. Some parts of the developed SQL as well as a snapshot of
the developed system are provided in Appendix C.
The user interfaces were designed for heart disease, diabetes mellitus and liver
disorders. Figures ( 4.1),( 4.2) and ( 4.3) show the main forms for the data entry in
heart disease, diabetes mellitus, and liver disorders applications respectively.
Figure 4.1: User Interface Design for Heart Disease Diagnosis.
61
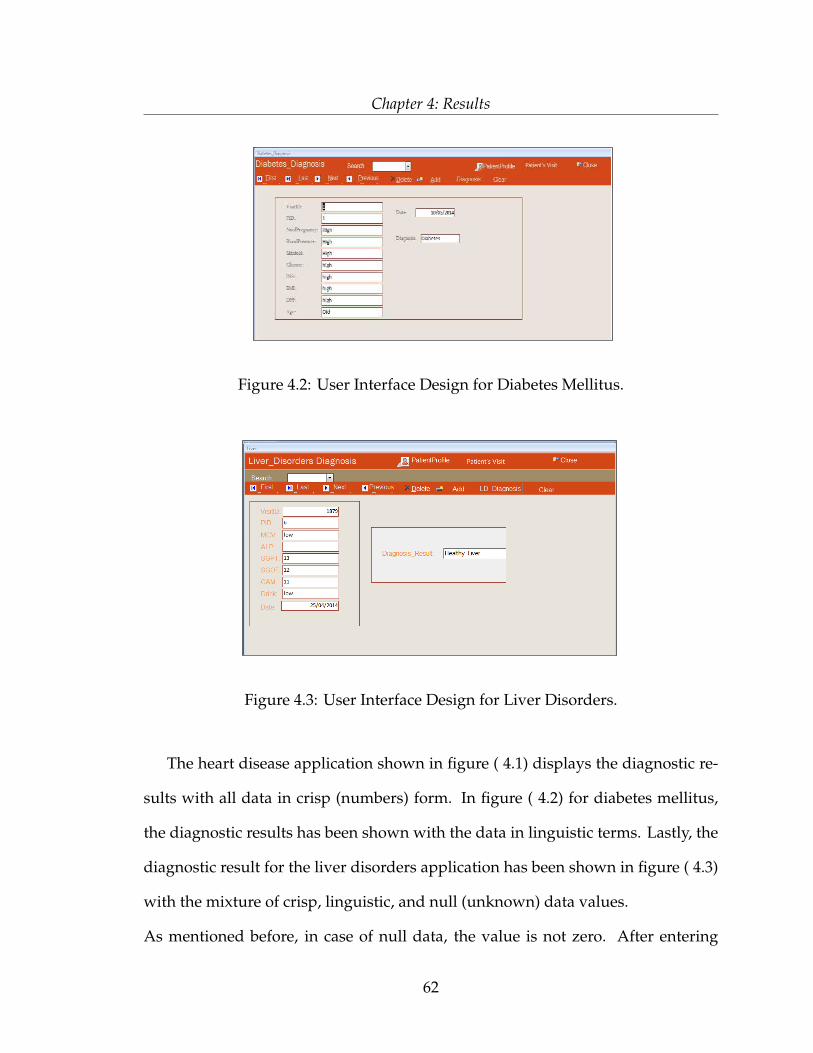
Chapter 4: Results
Figure 4.2: User Interface Design for Diabetes Mellitus.
Figure 4.3: User Interface Design for Liver Disorders.
The heart disease application shown in figure ( 4.1) displays the diagnostic re-
sults with all data in crisp (numbers) form. In figure ( 4.2) for diabetes mellitus,
the diagnostic results has been shown with the data in linguistic terms. Lastly, the
diagnostic result for the liver disorders application has been shown in figure ( 4.3)
with the mixture of crisp, linguistic, and null (unknown) data values.
As mentioned before, in case of null data, the value is not zero. After entering
62
Chapter 4: Results
the inputs including the situation of having null data (for example, in figure ( 4.3)
ALP field) when saved the inputs, the results are calculated without generating the
fuzzy rules for the null field.
4.2 Comparison Results of Fuzzy Database System for
Different Data Types
The accuracy of the three applications are calculated considering the cases,
when the data are crisp, linguistic, mixture of both as well as for null using the
heart dataset [7], liver disorders dataset [9], and Pima Indian diabetes dataset [8].
For the performance metric, this study determined accuracy using the following
formula:
Accuracy = (TotalNumbero f MatchedRecords/TotalNumbero f Records) ∗ 100. (4.1)
The following table ( 4.1)shows the accuracy calculation.
63
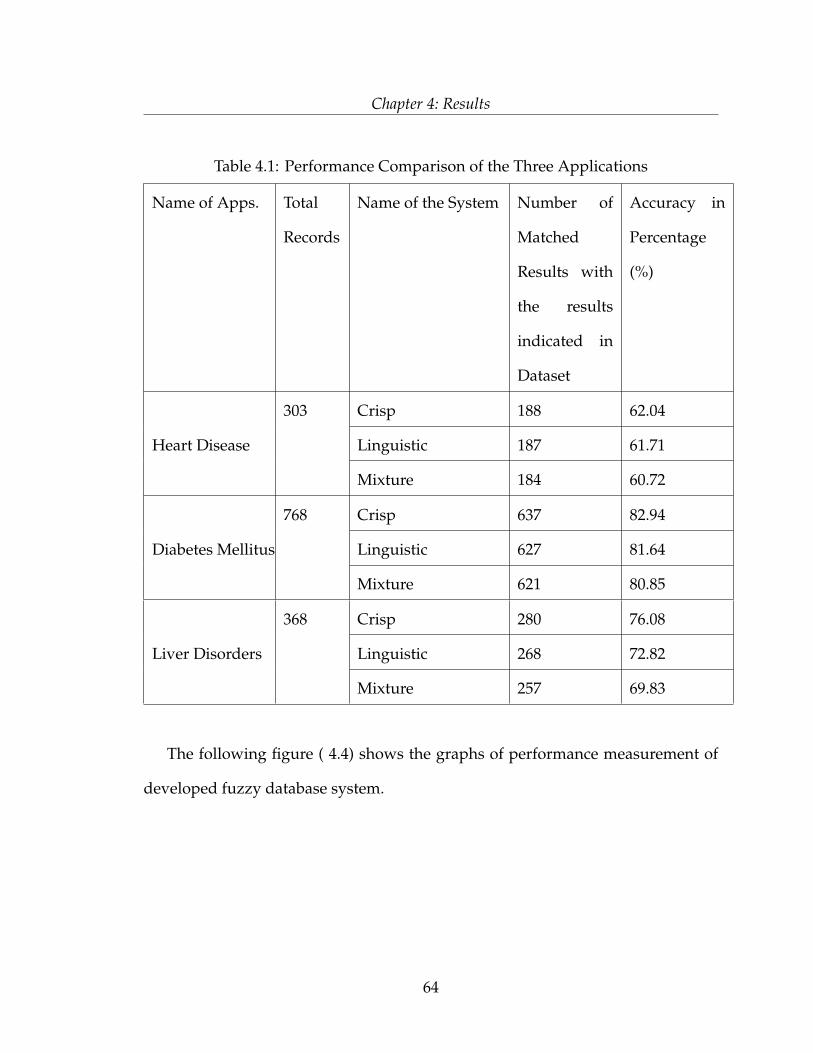
Chapter 4: Results
Table 4.1: Performance Comparison of the Three Applications
Name of Apps. Total
Records
Name of the System Number of
Matched
Results with
the results
indicated in
Dataset
Accuracy in
Percentage
(%)
Heart Disease
303 Crisp 188 62.04
Linguistic 187 61.71
Mixture 184 60.72
Diabetes Mellitus
768 Crisp 637 82.94
Linguistic 627 81.64
Mixture 621 80.85
Liver Disorders
368 Crisp 280 76.08
Linguistic 268 72.82
Mixture 257 69.83
The following figure ( 4.4) shows the graphs of performance measurement of
developed fuzzy database system.
64
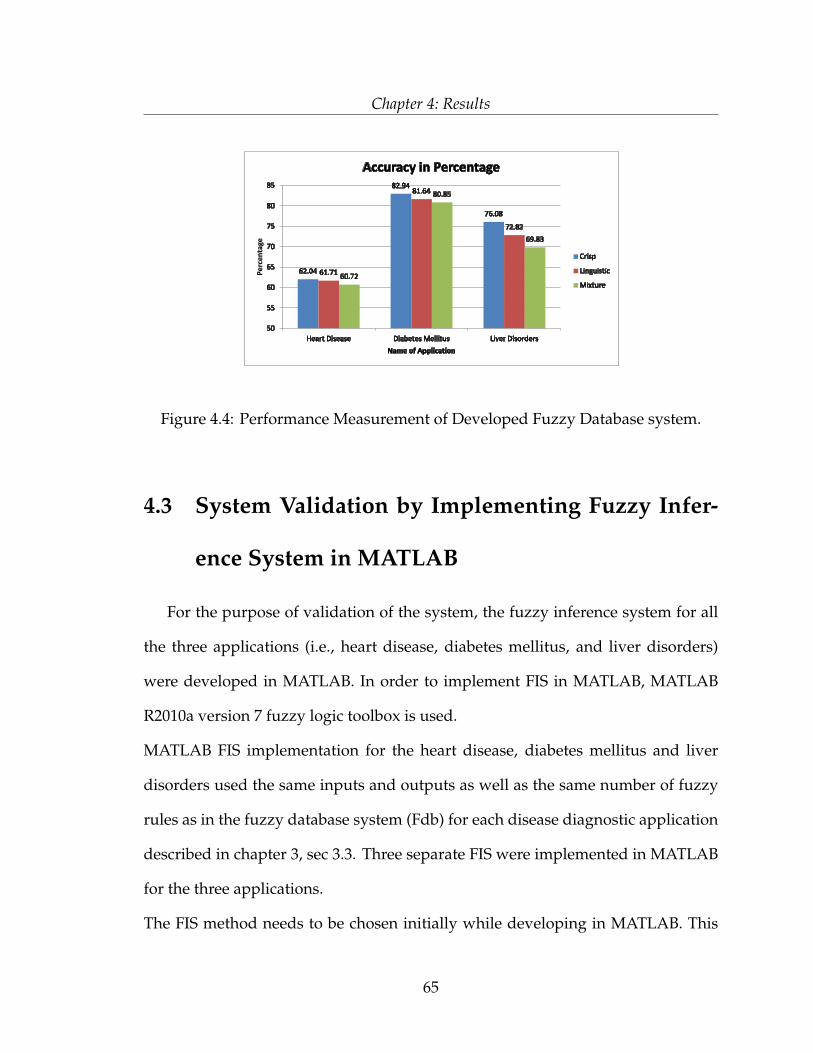
Chapter 4: Results
Figure 4.4: Performance Measurement of Developed Fuzzy Database system.
4.3 System Validation by Implementing Fuzzy Infer-
ence System in MATLAB
For the purpose of validation of the system, the fuzzy inference system for all
the three applications (i.e., heart disease, diabetes mellitus, and liver disorders)
were developed in MATLAB. In order to implement FIS in MATLAB, MATLAB
R2010a version 7 fuzzy logic toolbox is used.
MATLAB FIS implementation for the heart disease, diabetes mellitus and liver
disorders used the same inputs and outputs as well as the same number of fuzzy
rules as in the fuzzy database system (Fdb) for each disease diagnostic application
described in chapter 3, sec 3.3. Three separate FIS were implemented in MATLAB
for the three applications.
The FIS method needs to be chosen initially while developing in MATLAB. This
65
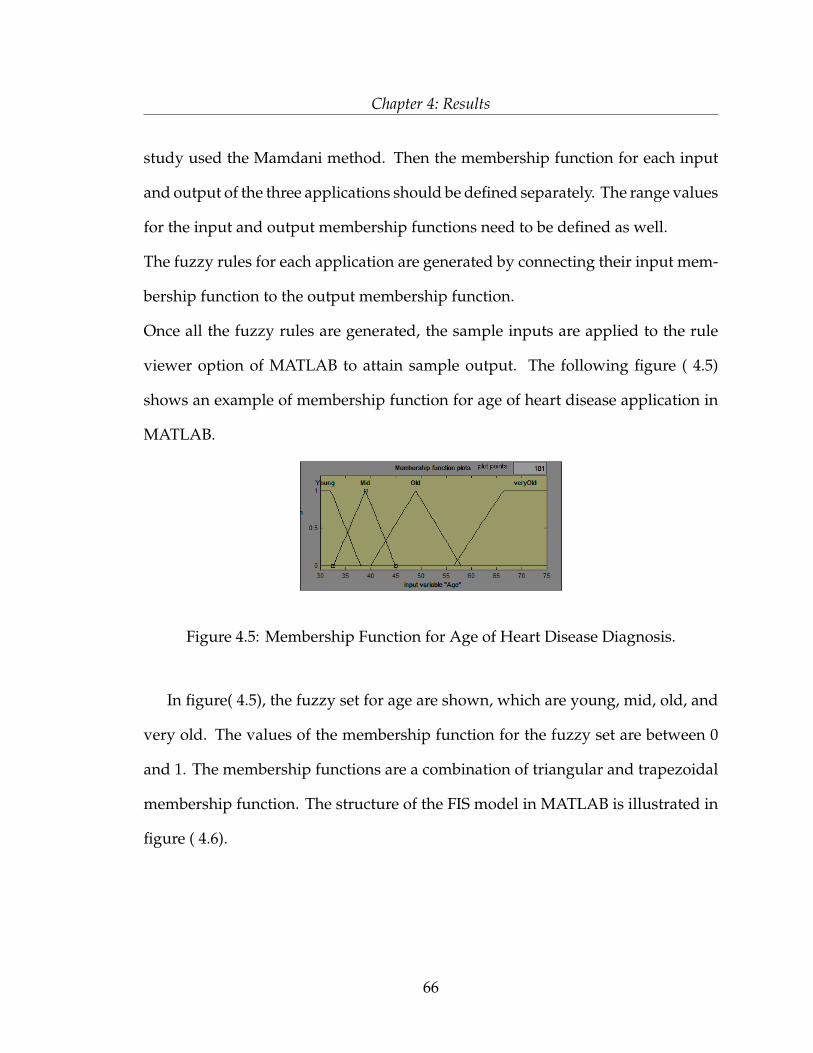
Chapter 4: Results
study used the Mamdani method. Then the membership function for each input
and output of the three applications should be defined separately. The range values
for the input and output membership functions need to be defined as well.
The fuzzy rules for each application are generated by connecting their input mem-
bership function to the output membership function.
Once all the fuzzy rules are generated, the sample inputs are applied to the rule
viewer option of MATLAB to attain sample output. The following figure ( 4.5)
shows an example of membership function for age of heart disease application in
MATLAB.
Figure 4.5: Membership Function for Age of Heart Disease Diagnosis.
In figure( 4.5), the fuzzy set for age are shown, which are young, mid, old, and
very old. The values of the membership function for the fuzzy set are between 0
and 1. The membership functions are a combination of triangular and trapezoidal
membership function. The structure of the FIS model in MATLAB is illustrated in
figure ( 4.6).
66
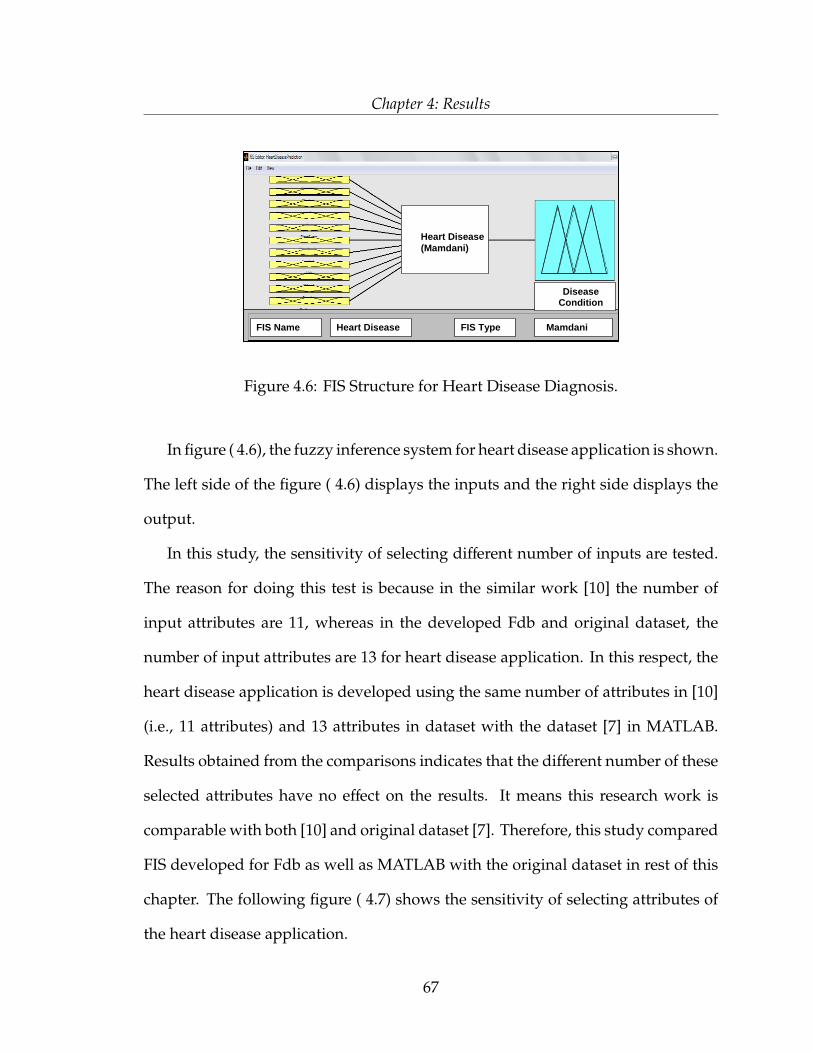
Chapter 4: Results
Heart Disease
(Mamdani)
Disease Condition
FIS Name Heart Disease FIS Type Mamdani
Figure 4.6: FIS Structure for Heart Disease Diagnosis.
In figure ( 4.6), the fuzzy inference system for heart disease application is shown.
The left side of the figure ( 4.6) displays the inputs and the right side displays the
output.
In this study, the sensitivity of selecting different number of inputs are tested.
The reason for doing this test is because in the similar work [10] the number of
input attributes are 11, whereas in the developed Fdb and original dataset, the
number of input attributes are 13 for heart disease application. In this respect, the
heart disease application is developed using the same number of attributes in [10]
(i.e., 11 attributes) and 13 attributes in dataset with the dataset [7] in MATLAB.
Results obtained from the comparisons indicates that the different number of these
selected attributes have no effect on the results. It means this research work is
comparable with both [10] and original dataset [7]. Therefore, this study compared
FIS developed for Fdb as well as MATLAB with the original dataset in rest of this
chapter. The following figure ( 4.7) shows the sensitivity of selecting attributes of
the heart disease application.
67
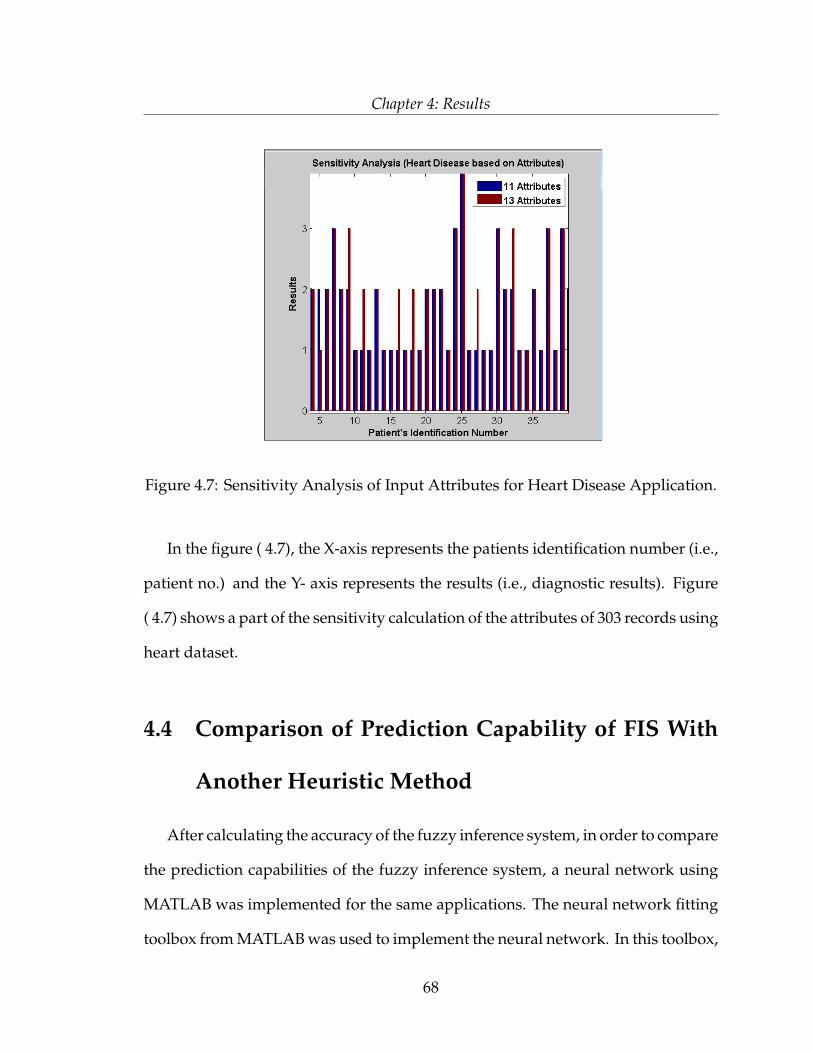
Chapter 4: Results
Figure 4.7: Sensitivity Analysis of Input Attributes for Heart Disease Application.
In the figure ( 4.7), the X-axis represents the patients identification number (i.e.,
patient no.) and the Y- axis represents the results (i.e., diagnostic results). Figure
( 4.7) shows a part of the sensitivity calculation of the attributes of 303 records using
heart dataset.
4.4 Comparison of Prediction Capability of FIS With
Another Heuristic Method
After calculating the accuracy of the fuzzy inference system, in order to compare
the prediction capabilities of the fuzzy inference system, a neural network using
MATLAB was implemented for the same applications. The neural network fitting
toolbox from MATLAB was used to implement the neural network. In this toolbox,
68
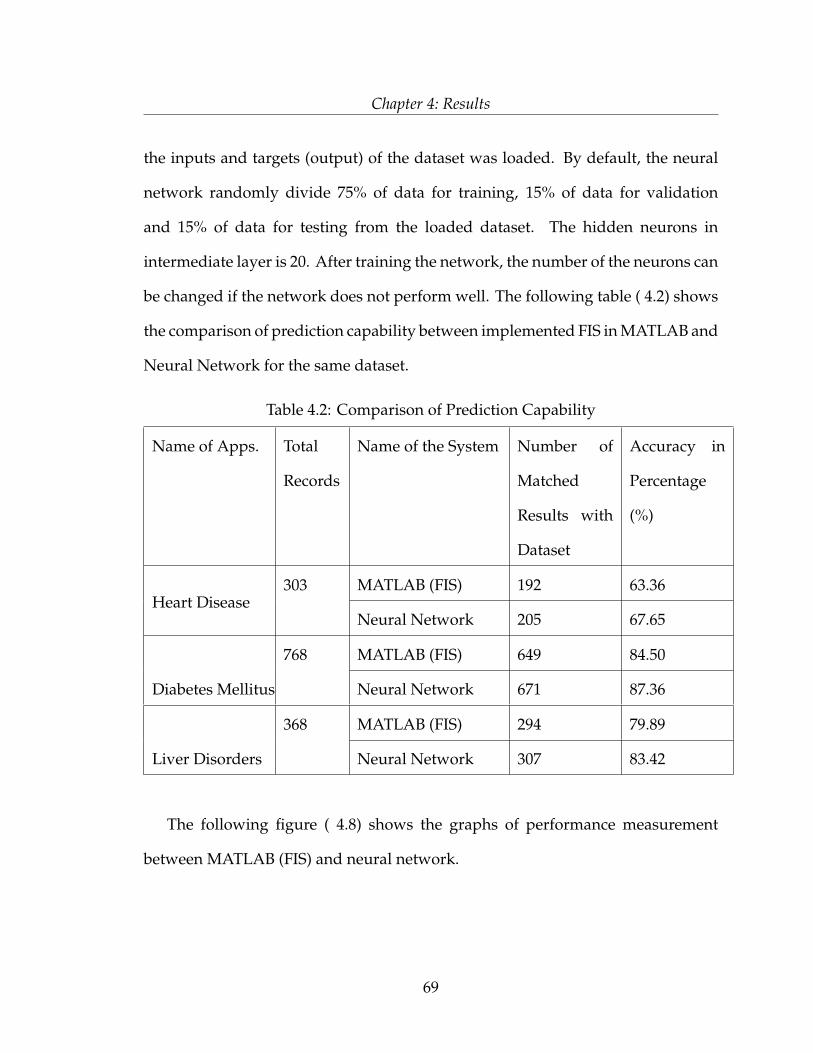
Chapter 4: Results
the inputs and targets (output) of the dataset was loaded. By default, the neural
network randomly divide 75% of data for training, 15% of data for validation
and 15% of data for testing from the loaded dataset. The hidden neurons in
intermediate layer is 20. After training the network, the number of the neurons can
be changed if the network does not perform well. The following table ( 4.2) shows
the comparison of prediction capability between implemented FIS in MATLAB and
Neural Network for the same dataset.
Table 4.2: Comparison of Prediction Capability
Name of Apps. Total
Records
Name of the System Number of
Matched
Results with
Dataset
Accuracy in
Percentage
(%)
Heart Disease303 MATLAB (FIS) 192 63.36
Neural Network 205 67.65
Diabetes Mellitus
768 MATLAB (FIS) 649 84.50
Neural Network 671 87.36
Liver Disorders
368 MATLAB (FIS) 294 79.89
Neural Network 307 83.42
The following figure ( 4.8) shows the graphs of performance measurement
between MATLAB (FIS) and neural network.
69
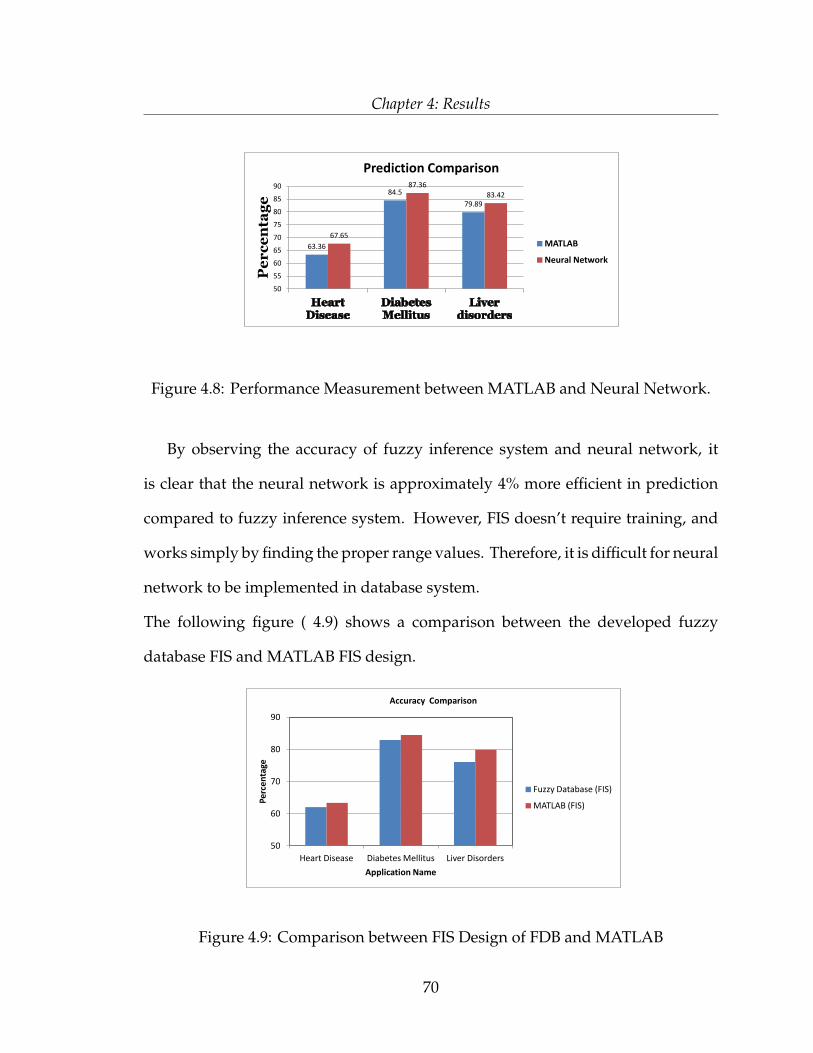
Chapter 4: Results
63.36
84.5
79.89
67.65
87.36
83.42
50
55
60
65
70
75
80
85
90
Pe
rc
en
tag
e
Prediction Comparison
MATLAB
Neural Network
Figure 4.8: Performance Measurement between MATLAB and Neural Network.
By observing the accuracy of fuzzy inference system and neural network, it
is clear that the neural network is approximately 4% more efficient in prediction
compared to fuzzy inference system. However, FIS doesn’t require training, and
works simply by finding the proper range values. Therefore, it is difficult for neural
network to be implemented in database system.
The following figure ( 4.9) shows a comparison between the developed fuzzy
database FIS and MATLAB FIS design.
50
60
70
80
90
Heart Disease Diabetes Mellitus Liver Disorders
Per
cen
tage
Application Name
Accuracy Comparison
Fuzzy Database (FIS)
MATLAB (FIS)
Figure 4.9: Comparison between FIS Design of FDB and MATLAB
70

Chapter 4: Results
Again, by comparing the accuracy of fuzzy inference system in developed
fuzzy database system and fuzzy inference system in MATLAB, we found that
MATLAB is 2.23% more accurate than developed fuzzy database system. However,
in database system, MATLAB can not be used.
4.5 Discussion on Experiments
This section will provide a small discussion on the experimented results of the
developed system. While compared the cases of only crisp data (numbers), the
cases of only linguistic terms, the cases of a mixture data, or null, the developed
Fdb has shown the accuracy (in heart disease application) of 62.04% for crisp data
and 61.71% accuracy of cases of datasets containing only linguistic terms, and
60.72% accuracy for mixed datasets (crisp, linguistic and null).
In diabetes mellitus application, the accuracy for crisp data is 82.94%, for lin-
guistic terms is 81.64%, and in the case of mixture, it is 80.85%.
For liver disorders application accuracy was 76.08% for crisp data, 72.82% ac-
curacy for linguistic, and 69.83% accurate for mixed datasets (containing crisp,
linguistic and null).
To be able to validate the FIS used in Fdb, the FIS is implemented with the same
number of input /output, fuzzy rules in MATLAB and compared with the original
dataset.
71
Chapter 5
Conclusion
Fuzzy logic in database systems can be used to support vague, imprecise and
uncertain information as well as perception based data. The main focus of this
study is to use fuzzy logic for enhancing the ability of retrieving accurate infor-
mation even if there is a lack of data in the database system. This study aims to
address loosely defined boundary condition, which requires several comparisons
for retrieving accurate data in the traditional database system.
The fuzzy database system was developed by the integration of fuzzy inference
system and fuzzy schema design, for the application of heart disease, diabetes
mellitus, and liver disorders. In terms of implementation, the system used SQL,
which is available on any standard SQL-based database system such as Microsoft
Access 2007. Microsoft Access 2007 was used for implementation because of its
simple structure and user friendly environment. The developed fuzzy database
system considered the cases for the crisp data, linguistic, mixture of both, or null
data. The benefit of considering null is that the developed system will be able to
72
Chapter 5: Conclusion
process information even when there is missing data. Using fuzzy logic in database
helps users to define a range of values that enable the system to be able to consider
boundary ambiguity in data values while retrieving information.
The implemented fuzzy database system was tested in the three applications
heart disease, diabetes mellitus, and liver disorders by considering all the above
mentioned cases. For these applications three comprehensive user friendly inter-
faces were designed. The system was tested by using the UCI machine learning
dataset named heart, Pima Indian diabetes and liver disorders, which were used
in most of the related researches.
The role of the developed fuzzy inference system and fuzzy schema design are
to provide the diagnostic results when the data are in form of crisp or linguistic
terms. The integration of both (FIS and fuzzy schema design) helped to retrieve
the information, when the data are a mixture of both, or null. In the cases where
there is incomplete data to diagnose, the developed fuzzy database system will be
able to provide by determining the missing data or capturing the linguistic terms
with the available data.
By comparing cases of only crisp data (numbers), cases of only linguistic terms,
or when the data are a mixture or null, the developed system has shown the accu-
racy (in heart disease application) of 62.04% for crisp data while 61.7% accuracy of
cases of datasets containing only linguistic terms, and 60.72% accuracy for mixed
datasets (crisp, linguistic and null).
With regards to diabetes mellitus application, the accuracy for the data in form
of crisp data is 82.94%, for linguistic terms is 81.64%, and in the case of mixture,
73

Chapter 5: Conclusion
the accuracy is 80.85%.
For liver disorders application accuracy was 76.08% for crisp data, 72.82% ac-
curacy for linguistic, and 69.83% accurate for mixed datasets (containing crisp,
linguistic and null).
In order to compare the prediction capability of fuzzy inference system (FIS)
with other methods, in this research neural network was used. Neural network
is found to be approximately 4% more accurate compared to FIS. While compar-
ing the accuracy, FIS for the heart disease application has 63.36% whereas neural
network has 67.65%. In the case of diabetes mellitus application, FIS has 84.50%,
and neural network has 87.36% accuracy. For liver disorders application FIS has
79.89%, and neural network has 83.42% accuracy.
However, training poses complications when implementing a neural network
in a database system. The results of this research are tested with the application
of heart disease, diabetes mellitus, and liver disorders, and implemented by a
database system named Microsoft Access. This study used small number of fuzzy
rules based on the above mentioned applications.
In summary, the contributions are as follows:
• Developed a fuzzy inference system (FIS) by SQL which is a language for
common database systems and employing a new formulation of the range
values for the fuzzy sets.
• Developed a fuzzy database system, able to provide diagnosis of a patient (
i.e., can make a decision) when a variety of data exists in various forms includ-
ing numbers (crisp), linguistic, mixture of both, or null (missing data) for the
74
Chapter 5: Conclusion
three specific diseases: heart disease, diabetes mellitus and liver disorders.
• Developed FIS and neural network-based designs for the three applications
in MATLAB in order to make a comparison of the prediction capabilities of
the two approaches, using real data reported in the literature.
5.1 Future Work
As a future research direction, this research can be an initial step for dealing
with fuzziness in the database systems. This study used Mamdani fuzzy inference
system to develop the FIS. Another research direction can be the use of other
fuzzy inference system named Sugeno method. In the case of data collection, this
research used direct rating method. Thus, it is possible to extend the research by
choosing other types of data collection methods (mentioned in section 3.1). In
terms of membership function, this research used triangular membership function
and trapezoidal membership function. Future research can be done by choosing
other types of membership functions explained in chapter 2. While designing
the FIS, this study defuzzified the result by centroid defuzzification method. It is
worthy to perform future research by using other types of defuzzification methods
explained in chapter 2 section 2.8 to observe the differences between the results
of using different defuzzification approaches. In addition to testing the system
with different fuzzy approaches, the fuzzy rules used for each disease can be
modified or added by new fuzzy rules to provide better accuracy. However, the
next step for this works including natural language parser to query information
75
Chapter 5: Conclusion
more like human language. In the case of implementation, the system was
developed using Microsoft Access 2007. It is possible to do the research with
other database platform such as Oracle and test its functionality with regards to
reliability and other capabilities. To work with a traditional database system, this
study implemented FIS and schema design with SQL. In the future, other fuzzy
tools such as fsql, sqlf can be used to observe the difference and outcomes of
different implementation languages.
This research can have an inclination to keep fuzziness in traditional database
system without using any fuzzy tools. In the case of FIS design, the maximum
number of fuzzy rules were 50 and minimum number of fuzzy rules were 18 based
on the developed applications. In the future, the system with large fuzzy rule sets
can be implemented. Therefore, the system can also be extended for more research
with complex diseases such as cancer. The developed FIS system can be used in
database systems containing available data of the three mentioned diseases but
can also be developed for other applications such as financial planners and many
more, can be incorporated FIS to be more functional that provide further directions
to this work.
76
Appendix A
Data Collection, Explanation of
Indicators, Fuzzy Rules, Relationship
Model
The data were collected while consulting with a representative group of physi-
cians. After collecting the information from them, the following Table ( A.3)
( A.4)( A.5) are created in order to prepare the range of the data for heart dis-
ease, diabetes mellitus, and liver disorders to build the membership function in
applications.
77
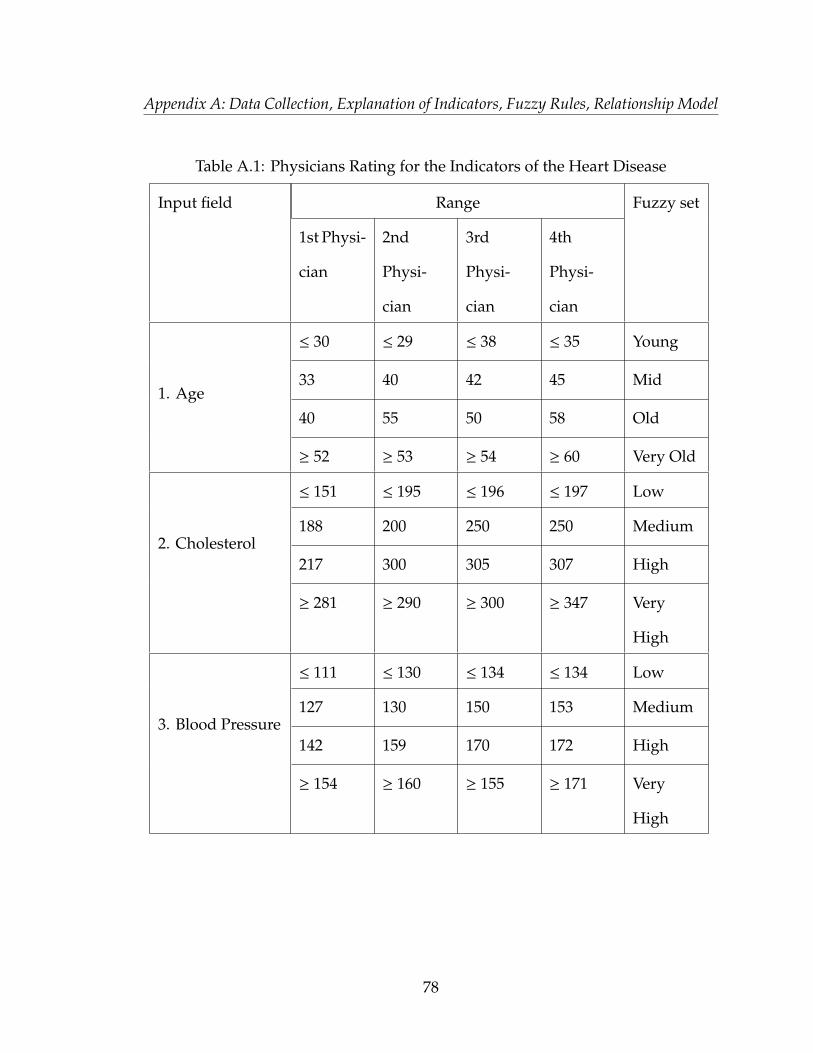
Appendix A: Data Collection, Explanation of Indicators, Fuzzy Rules, Relationship Model
Table A.1: Physicians Rating for the Indicators of the Heart Disease
Input field Range Fuzzy set
1st Physi-
cian
2nd
Physi-
cian
3rd
Physi-
cian
4th
Physi-
cian
1. Age
≤ 30 ≤ 29 ≤ 38 ≤ 35 Young
33 40 42 45 Mid
40 55 50 58 Old
≥ 52 ≥ 53 ≥ 54 ≥ 60 Very Old
2. Cholesterol
≤ 151 ≤ 195 ≤ 196 ≤ 197 Low
188 200 250 250 Medium
217 300 305 307 High
≥ 281 ≥ 290 ≥ 300 ≥ 347 Very
High
3. Blood Pressure
≤ 111 ≤ 130 ≤ 134 ≤ 134 Low
127 130 150 153 Medium
142 159 170 172 High
≥ 154 ≥ 160 ≥ 155 ≥ 171 Very
High
78
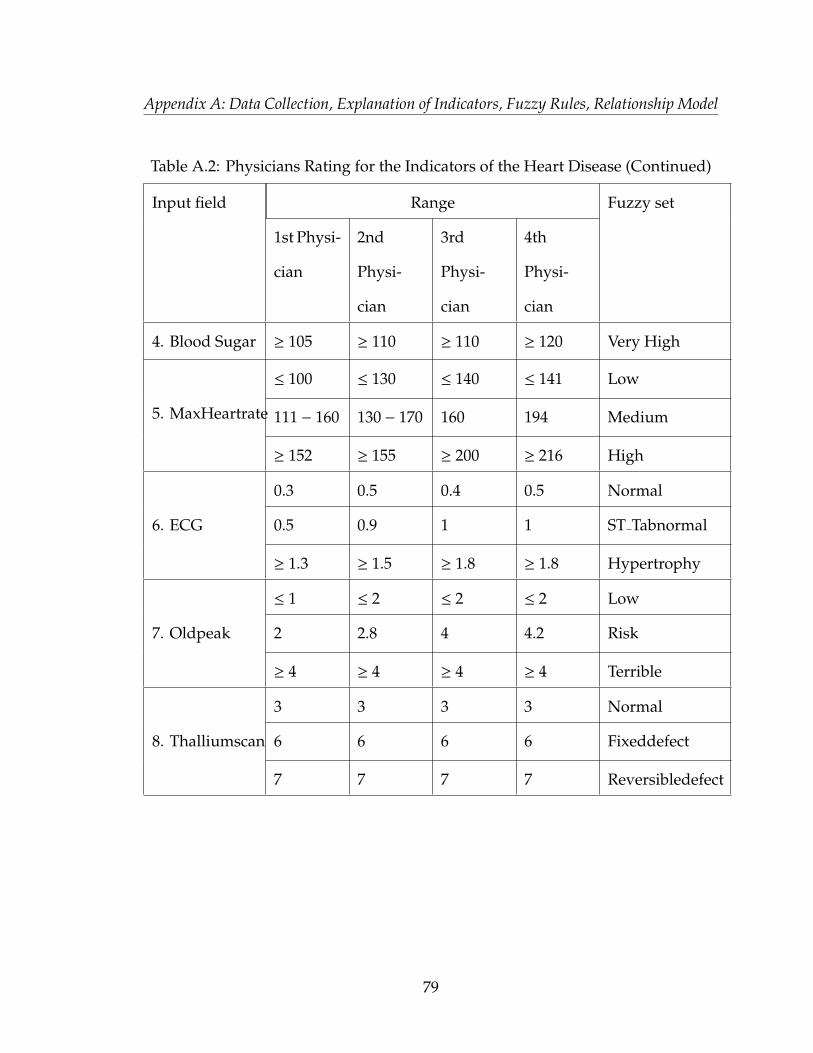
Appendix A: Data Collection, Explanation of Indicators, Fuzzy Rules, Relationship Model
Table A.2: Physicians Rating for the Indicators of the Heart Disease (Continued)
Input field Range Fuzzy set
1st Physi-
cian
2nd
Physi-
cian
3rd
Physi-
cian
4th
Physi-
cian
4. Blood Sugar ≥ 105 ≥ 110 ≥ 110 ≥ 120 Very High
5. MaxHeartrate
≤ 100 ≤ 130 ≤ 140 ≤ 141 Low
111 − 160 130 − 170 160 194 Medium
≥ 152 ≥ 155 ≥ 200 ≥ 216 High
6. ECG
0.3 0.5 0.4 0.5 Normal
0.5 0.9 1 1 ST Tabnormal
≥ 1.3 ≥ 1.5 ≥ 1.8 ≥ 1.8 Hypertrophy
7. Oldpeak
≤ 1 ≤ 2 ≤ 2 ≤ 2 Low
2 2.8 4 4.2 Risk
≥ 4 ≥ 4 ≥ 4 ≥ 4 Terrible
8. Thalliumscan
3 3 3 3 Normal
6 6 6 6 Fixeddefect
7 7 7 7 Reversibledefect
79
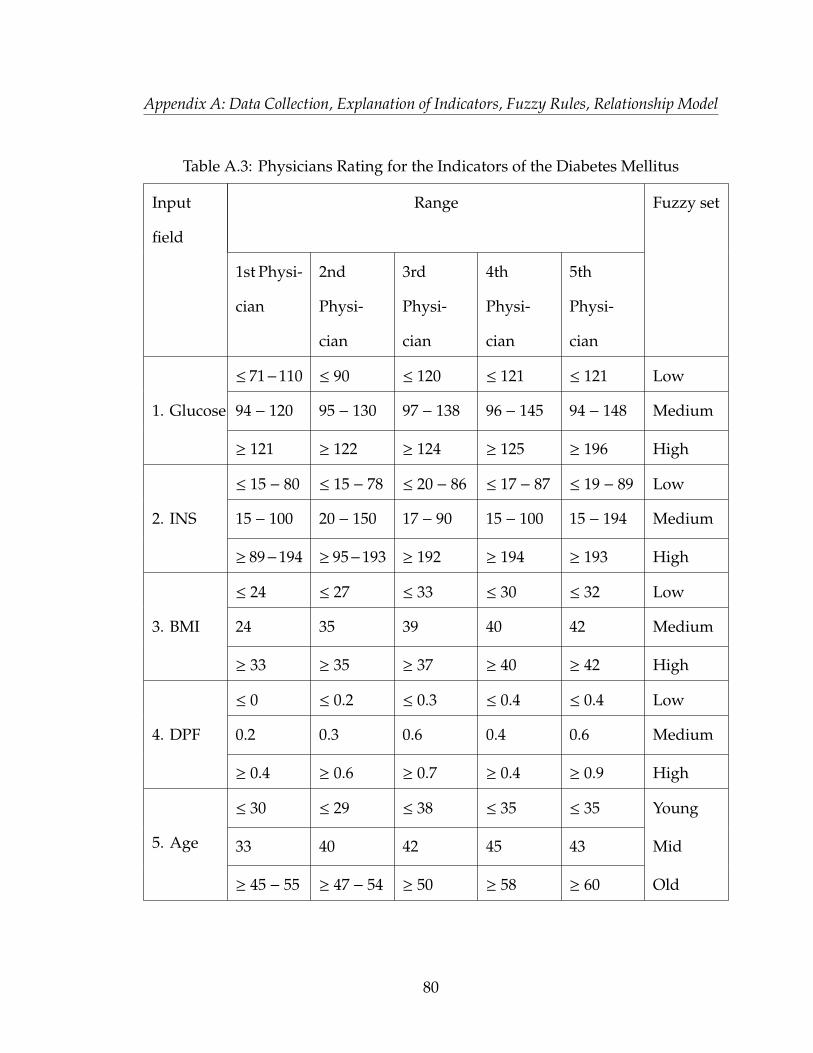
Appendix A: Data Collection, Explanation of Indicators, Fuzzy Rules, Relationship Model
Table A.3: Physicians Rating for the Indicators of the Diabetes Mellitus
Input
field
Range Fuzzy set
1st Physi-
cian
2nd
Physi-
cian
3rd
Physi-
cian
4th
Physi-
cian
5th
Physi-
cian
1. Glucose
≤ 71−110 ≤ 90 ≤ 120 ≤ 121 ≤ 121 Low
94 − 120 95 − 130 97 − 138 96 − 145 94 − 148 Medium
≥ 121 ≥ 122 ≥ 124 ≥ 125 ≥ 196 High
2. INS
≤ 15 − 80 ≤ 15 − 78 ≤ 20 − 86 ≤ 17 − 87 ≤ 19 − 89 Low
15 − 100 20 − 150 17 − 90 15 − 100 15 − 194 Medium
≥ 89−194 ≥ 95−193 ≥ 192 ≥ 194 ≥ 193 High
3. BMI
≤ 24 ≤ 27 ≤ 33 ≤ 30 ≤ 32 Low
24 35 39 40 42 Medium
≥ 33 ≥ 35 ≥ 37 ≥ 40 ≥ 42 High
4. DPF
≤ 0 ≤ 0.2 ≤ 0.3 ≤ 0.4 ≤ 0.4 Low
0.2 0.3 0.6 0.4 0.6 Medium
≥ 0.4 ≥ 0.6 ≥ 0.7 ≥ 0.4 ≥ 0.9 High
5. Age
≤ 30 ≤ 29 ≤ 38 ≤ 35 ≤ 35 Young
33 40 42 45 43 Mid
≥ 45 − 55 ≥ 47 − 54 ≥ 50 ≥ 58 ≥ 60 Old
80
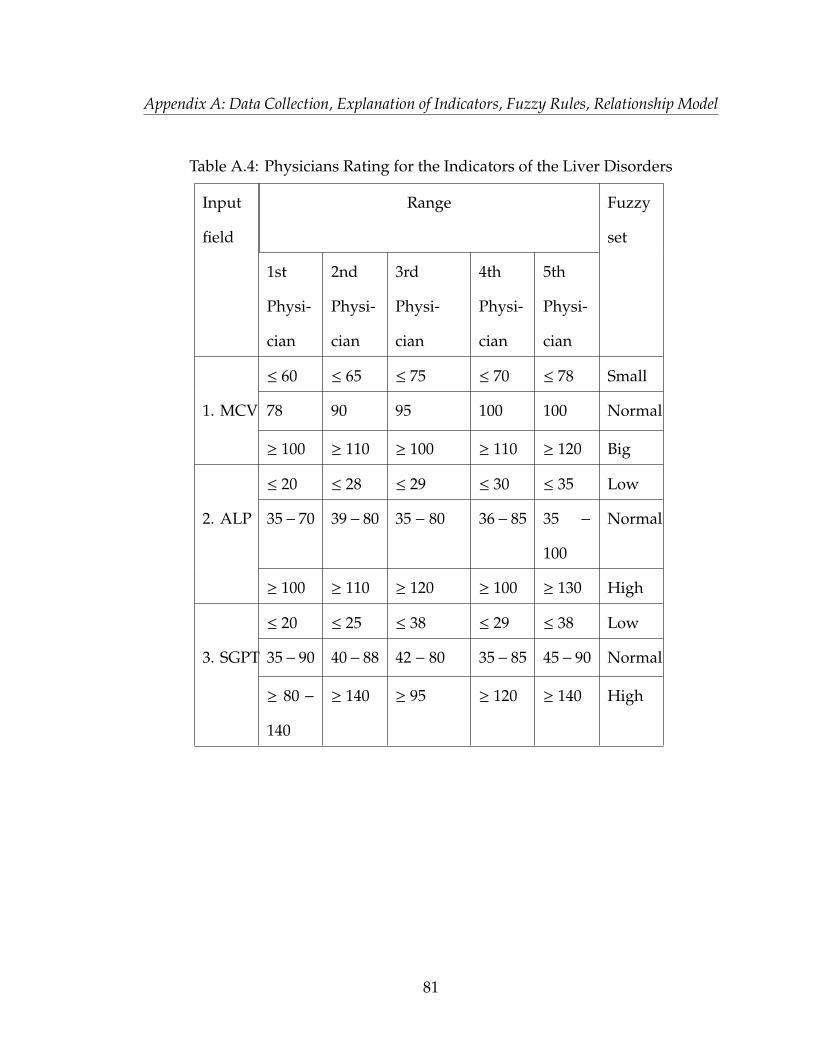
Appendix A: Data Collection, Explanation of Indicators, Fuzzy Rules, Relationship Model
Table A.4: Physicians Rating for the Indicators of the Liver Disorders
Input
field
Range Fuzzy
set
1st
Physi-
cian
2nd
Physi-
cian
3rd
Physi-
cian
4th
Physi-
cian
5th
Physi-
cian
1. MCV
≤ 60 ≤ 65 ≤ 75 ≤ 70 ≤ 78 Small
78 90 95 100 100 Normal
≥ 100 ≥ 110 ≥ 100 ≥ 110 ≥ 120 Big
2. ALP
≤ 20 ≤ 28 ≤ 29 ≤ 30 ≤ 35 Low
35− 70 39− 80 35 − 80 36− 85 35 −
100
Normal
≥ 100 ≥ 110 ≥ 120 ≥ 100 ≥ 130 High
3. SGPT
≤ 20 ≤ 25 ≤ 38 ≤ 29 ≤ 38 Low
35− 90 40− 88 42 − 80 35− 85 45− 90 Normal
≥ 80 −
140
≥ 140 ≥ 95 ≥ 120 ≥ 140 High
81
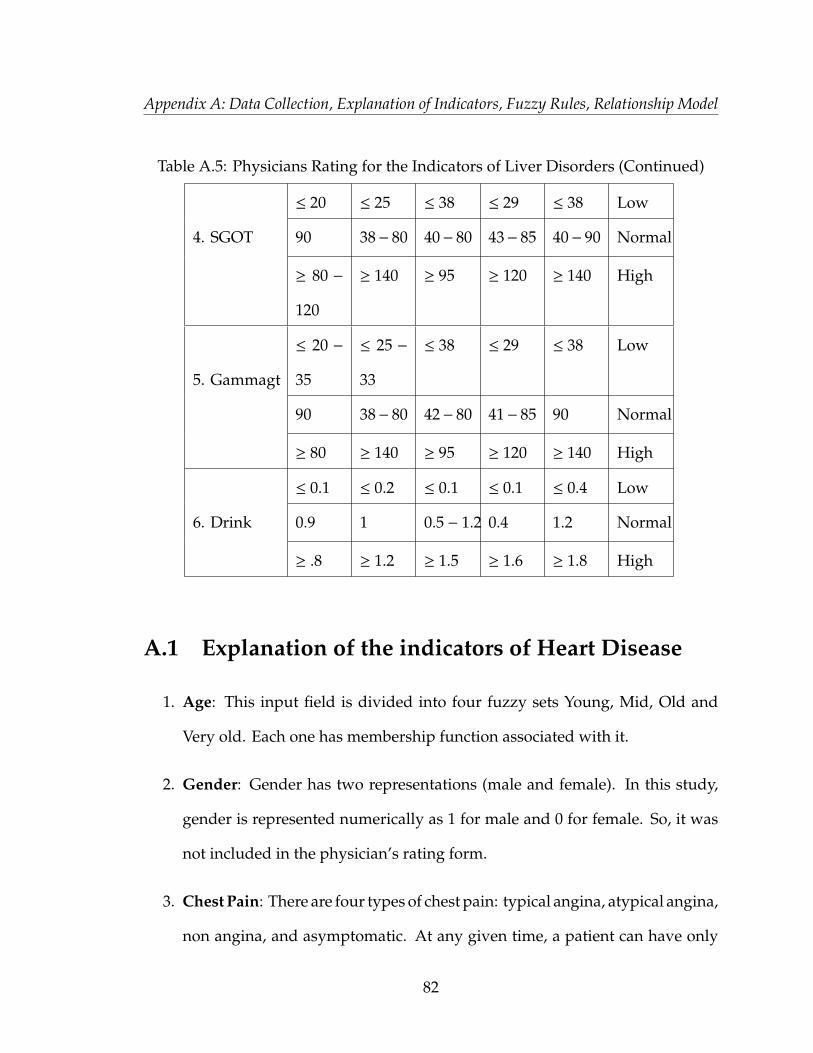
Appendix A: Data Collection, Explanation of Indicators, Fuzzy Rules, Relationship Model
Table A.5: Physicians Rating for the Indicators of Liver Disorders (Continued)
4. SGOT
≤ 20 ≤ 25 ≤ 38 ≤ 29 ≤ 38 Low
90 38− 80 40− 80 43− 85 40− 90 Normal
≥ 80 −
120
≥ 140 ≥ 95 ≥ 120 ≥ 140 High
5. Gammagt
≤ 20 −
35
≤ 25 −
33
≤ 38 ≤ 29 ≤ 38 Low
90 38− 80 42− 80 41− 85 90 Normal
≥ 80 ≥ 140 ≥ 95 ≥ 120 ≥ 140 High
6. Drink
≤ 0.1 ≤ 0.2 ≤ 0.1 ≤ 0.1 ≤ 0.4 Low
0.9 1 0.5 − 1.2 0.4 1.2 Normal
≥ .8 ≥ 1.2 ≥ 1.5 ≥ 1.6 ≥ 1.8 High
A.1 Explanation of the indicators of Heart Disease
1. Age: This input field is divided into four fuzzy sets Young, Mid, Old and
Very old. Each one has membership function associated with it.
2. Gender: Gender has two representations (male and female). In this study,
gender is represented numerically as 1 for male and 0 for female. So, it was
not included in the physician’s rating form.
3. Chest Pain: There are four types of chest pain: typical angina, atypical angina,
non angina, and asymptomatic. At any given time, a patient can have only
82
Appendix A: Data Collection, Explanation of Indicators, Fuzzy Rules, Relationship Model
one chest pain. To describe chest pain, this thesis used: Typical Angina = 1,
Atypical Angina = 2, Non Angina = 3, and Asymptomatic = 4. This term also
was not included in the physician’s form.
4. Cholesterol: Types of cholesterol are-low density lipoprotein (LDL) and high
density lipoprotein (HDL). HDL is considered to be “good cholesterol,” and
LDL is considered “bad cholesterol”. Mainly, LDL is responsible in causing
heart disease [45]. This study considered levels of LDL for cholesterol in the
development of the diagnostic system. This field has four fuzzy sets low,
medium, high and very high.
5. Blood Pressure: Blood pressure is another contributing indicator, increasing
the heart’s workload, and causing the heart thicken and stiffen [45]. This
thickness and stiffness decrease normal functionality of heart. Types of blood
pressure include systolic, diastolic and mean types. Abnormal Systolic blood
pressure is commonly associated to heart disease. This thesis considered
systolic blood pressure. This field has four fuzzy sets low, medium, high and
very high.
6. Blood Sugar: Blood sugar is another marker in the development of heart
disease [45]. Uncontrolled blood sugar is the reason behind the high risk of
developing heart disease. This data field has two fuzzy sets yes and no. If
the patient has blood sugar ≥ 120, then the fuzzy set is yes. If it is <120, then
the fuzzy set is no. To indicate “yes” and “no” this thesis used: Yes = 1, and
no = 0.
83
Appendix A: Data Collection, Explanation of Indicators, Fuzzy Rules, Relationship Model
7. Maximum Heart rate: Heart rate means the number of heart beats in a unit
of time, such as per minute [48]. It is also known as pulse. In case of heart
disease, the maximum heart rate in 24 hours of a person is considered. This
field has three fuzzy sets low, medium and high.
8. Electrocardiography: ECG measures the electrical activity of the heart mus-
cle. It is measured by several waves that appear on a graph paper, such as
T wave, Q wave, P wave, S wave. There are two cases in ECG. One is nor-
mal and the other is abnormal [49]. The fuzzy sets for this field are Normal,
ST Tabnormal and Hypertrophy.
9. Exercise : This field indicates whether the patient needs an exercise test or not.
In this test, the patient needs to stress the heart by exercising on a treadmill
making the heart rate fast and hard. In relation to ECG, if the ECG finding is
normal but the patient has angina related chest pain, will require the exercise
test. Exercise has two fuzzy sets “yes” and “no”. To indicate yes and no this
thesis used “yes” = 1, and “no” = 0.
10. Oldpeak: “OldPeak” means ST depression induced by exercise, relative to
the test. ST depression is related to the ECG field. In the developed system,
assuming that the S wave and T wave of the patient were down in the ECG
graph paper. It provides the information of the present condition of S wave
and T wave of ECG [49]. It has three fuzzy sets low, risk and terrible.
11. Thallium Scan: A thallium scan measures the number of hours it takes for
a heart image to appear on the screen of a gamma camera [50]. It detects
84
Appendix A: Data Collection, Explanation of Indicators, Fuzzy Rules, Relationship Model
radioactive dye in the body. It has three fuzzy sets normal, fixed defect and
reversible defect. Usually it takes 3 hours for the heart image to appear. In
a fixed defect it appears within 6 hours, and 7 hours for reversible defect.
Normal = 3, Fixed defect = 6, and Reversible defect = 7.
12. Coarctation of the aorta: The coarctation of the aorta means the narrowness
of the aorta. The branching blood vessels are responsible to deliver oxygen-
rich blood in the body. If the coarctation of the aorta occurs, then it is hard
for the heart to deliver the blood due to the narrowness of the arteries. It is
generally present at birth and may not be possible to detect until adulthood
[51]. It has three fuzzy sets mild, moderate, and severe. To indicate mild,
moderate, and severe this thesis used mild = 0 or 1, moderate = 2, and severe
= 3. This term was not included in the physician’s rating form.
13. Slope : Sloping means to climb the stairs. It is also related to heart disease.
It has three fuzzy sets up-sloping, flat and down-sloping. To indicate up-
sloping, flat, and down-sloping this thesis used up-sloping = 1, flat = 2, and
down-sloping = 3. This term also was not included in the physician’s rating
form.
A.2 Explanation of the indicators of Diabetes Mellitus
1. Number of pregnancy: It is categorized as absent, low and risk. If a person
is male then number of pregnancy will be absent.
2. Diastolic blood pressure: Similar blood pressure described in heart disease.
85
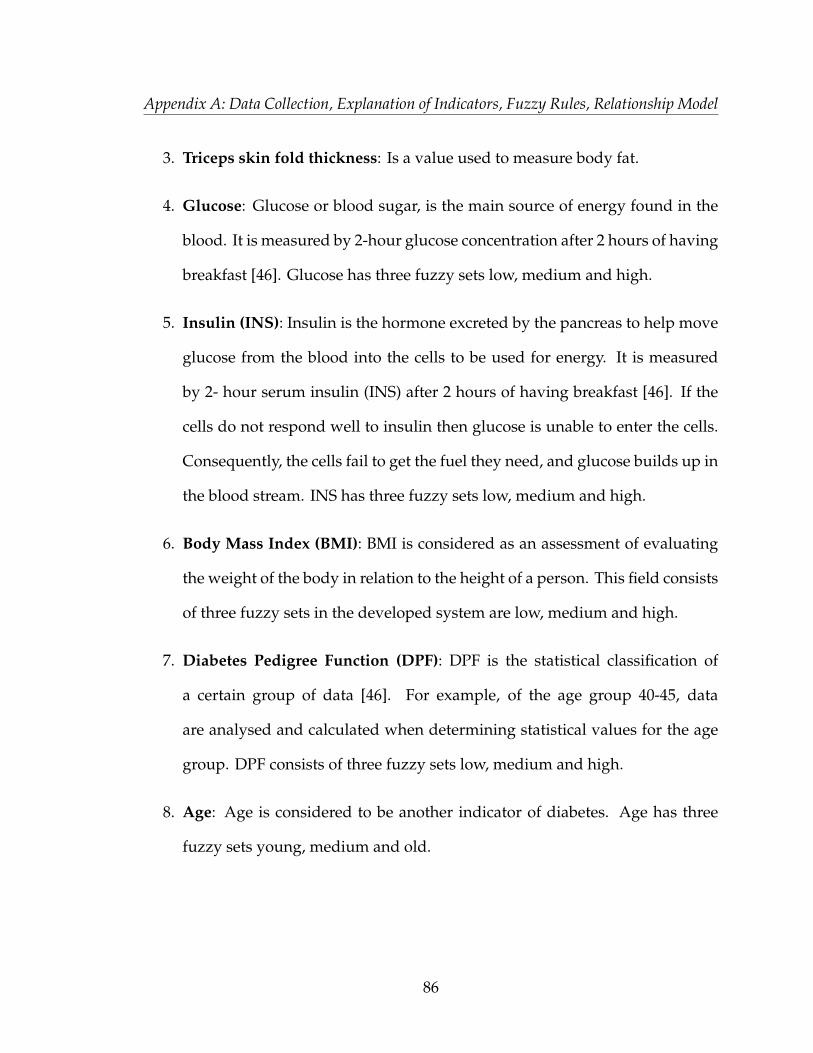
Appendix A: Data Collection, Explanation of Indicators, Fuzzy Rules, Relationship Model
3. Triceps skin fold thickness: Is a value used to measure body fat.
4. Glucose: Glucose or blood sugar, is the main source of energy found in the
blood. It is measured by 2-hour glucose concentration after 2 hours of having
breakfast [46]. Glucose has three fuzzy sets low, medium and high.
5. Insulin (INS): Insulin is the hormone excreted by the pancreas to help move
glucose from the blood into the cells to be used for energy. It is measured
by 2- hour serum insulin (INS) after 2 hours of having breakfast [46]. If the
cells do not respond well to insulin then glucose is unable to enter the cells.
Consequently, the cells fail to get the fuel they need, and glucose builds up in
the blood stream. INS has three fuzzy sets low, medium and high.
6. Body Mass Index (BMI): BMI is considered as an assessment of evaluating
the weight of the body in relation to the height of a person. This field consists
of three fuzzy sets in the developed system are low, medium and high.
7. Diabetes Pedigree Function (DPF): DPF is the statistical classification of
a certain group of data [46]. For example, of the age group 40-45, data
are analysed and calculated when determining statistical values for the age
group. DPF consists of three fuzzy sets low, medium and high.
8. Age: Age is considered to be another indicator of diabetes. Age has three
fuzzy sets young, medium and old.
86

Appendix A: Data Collection, Explanation of Indicators, Fuzzy Rules, Relationship Model
A.3 Explanation of the indicators of Liver Disorders
1. Mean Corpuscular Volume (MCV): MCV is a measurement of the average
cell size of the red blood. The MCV is said to be a part of a touchstone
total blood count. It is estimated by the division between the total volume
of packed red cells and the total red blood cells [52]. The unit of MCV is in
femtoliters (fl). It has three fuzzy sets low, normal and high.
2. Alkphos (ALP): ALP is a hydrolyse enzyme. It is responsible for removing
phosphates from many types of molecules, including nucleotide protein and
alkaloid [52]. ALP has three fuzzy sets low, normal and high.
3. SGPT: Serum glutamic pyruvic transaminase (SGPT) is an enzyme. Nor-
mally, it exists in liver and heart cells. When the liver or heart is damaged,
then SGPT is released into the blood [52]. Thus, SGPT blood levels are ele-
vated with liver damage. There are three fuzzy sets low, normal and high.
4. SGOT: Similar to SGPT, serum glutamic oxaloacetic transaminase (SGOT) is
an enzyme that normally presents in liver and heart cells [52]. Like SGPT, it
is released into the blood when the liver or heart is damaged. Thus, SGOT
blood levels are elevated with liver damage. In the system, there are three
fuzzy sets low, normal and high.
5. Gammagt: Gammagt is another enzyme that transfers gamma glut amyl
functional group existed in many tissues, most notably the liver [52]. It has
significance in medicine as a diagnostic marker. In the system, it has three
fuzzy sets low, normal and high.
87

Appendix A: Data Collection, Explanation of Indicators, Fuzzy Rules, Relationship Model
6. Drink: Drinking means consuming alcohol such as beer, wine etc. In case
of moderate drinking, the liver can process the alcohol somewhat safely.
However, excessive drinking dissipates the liver, causing serious outcomes.
It can be the cause of clogging the liver with fat. As a consequence, liver cells
lose efficiency, to perform their necessary tasks resulting in impairment of an
individual’s nutritional health. It is measured by a blood alcohol test [52]. In
the developed system, it has three fuzzy sets low, normal and high.
88
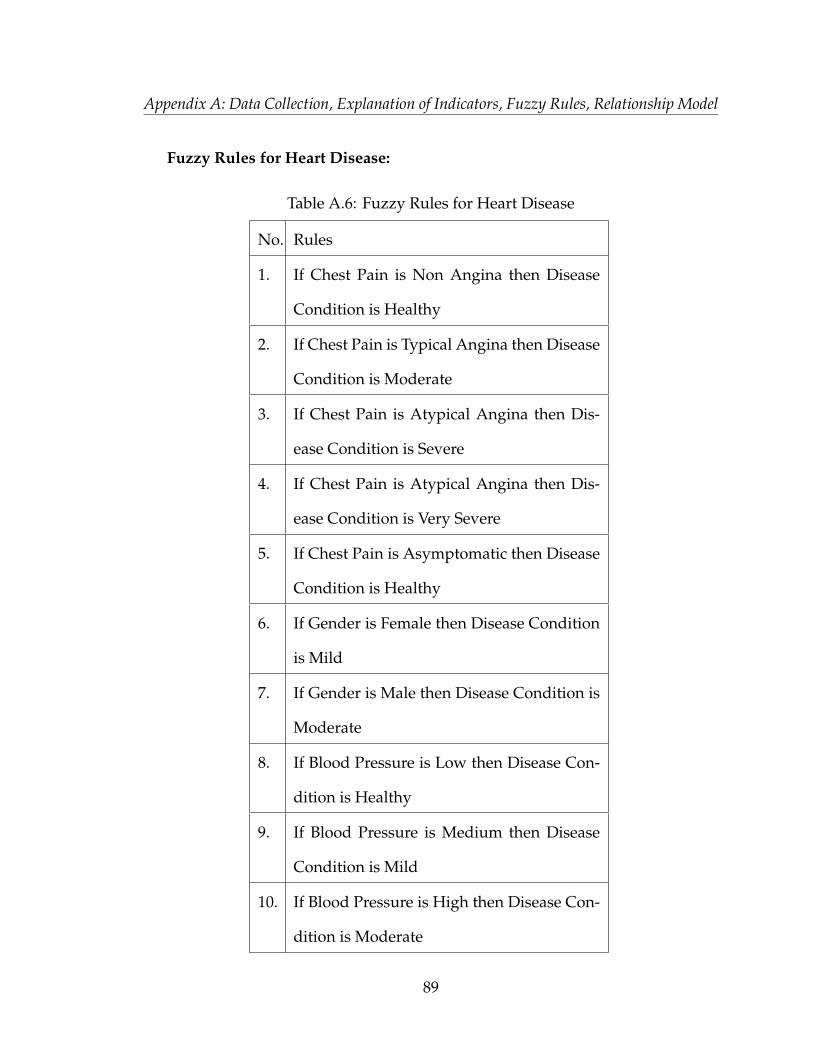
Appendix A: Data Collection, Explanation of Indicators, Fuzzy Rules, Relationship Model
Fuzzy Rules for Heart Disease:
Table A.6: Fuzzy Rules for Heart Disease
No. Rules
1. If Chest Pain is Non Angina then Disease
Condition is Healthy
2. If Chest Pain is Typical Angina then Disease
Condition is Moderate
3. If Chest Pain is Atypical Angina then Dis-
ease Condition is Severe
4. If Chest Pain is Atypical Angina then Dis-
ease Condition is Very Severe
5. If Chest Pain is Asymptomatic then Disease
Condition is Healthy
6. If Gender is Female then Disease Condition
is Mild
7. If Gender is Male then Disease Condition is
Moderate
8. If Blood Pressure is Low then Disease Con-
dition is Healthy
9. If Blood Pressure is Medium then Disease
Condition is Mild
10. If Blood Pressure is High then Disease Con-
dition is Moderate
89
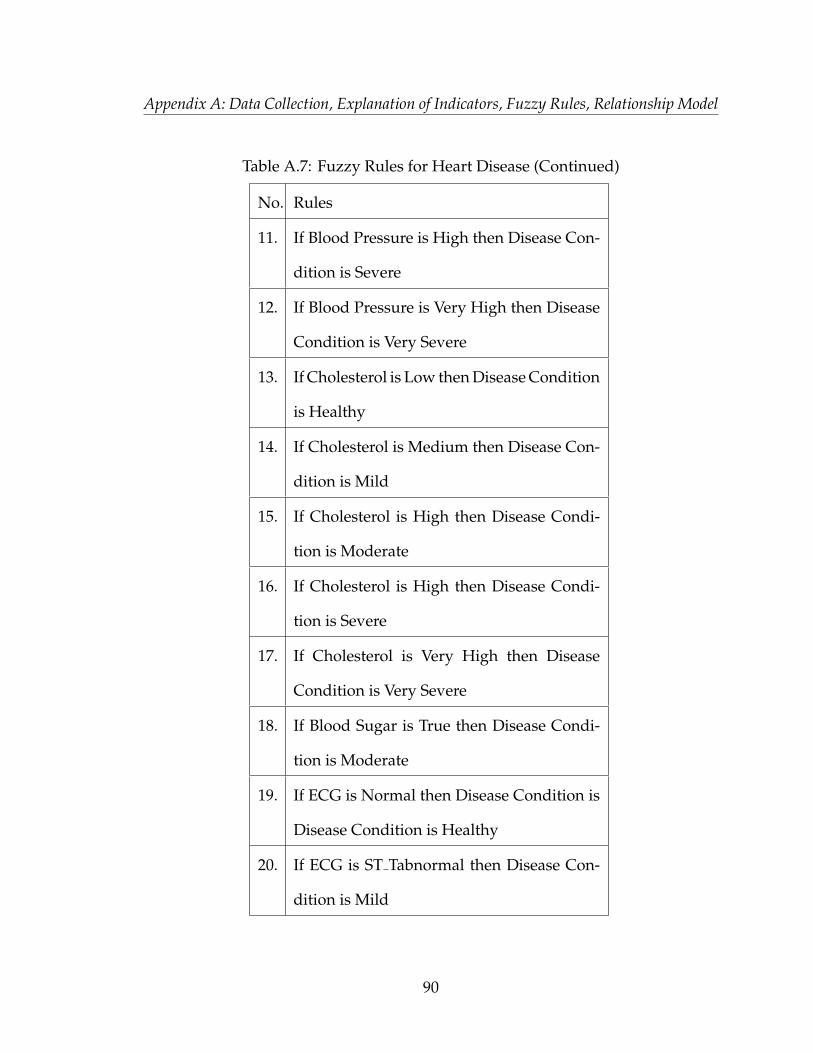
Appendix A: Data Collection, Explanation of Indicators, Fuzzy Rules, Relationship Model
Table A.7: Fuzzy Rules for Heart Disease (Continued)
No. Rules
11. If Blood Pressure is High then Disease Con-
dition is Severe
12. If Blood Pressure is Very High then Disease
Condition is Very Severe
13. If Cholesterol is Low then Disease Condition
is Healthy
14. If Cholesterol is Medium then Disease Con-
dition is Mild
15. If Cholesterol is High then Disease Condi-
tion is Moderate
16. If Cholesterol is High then Disease Condi-
tion is Severe
17. If Cholesterol is Very High then Disease
Condition is Very Severe
18. If Blood Sugar is True then Disease Condi-
tion is Moderate
19. If ECG is Normal then Disease Condition is
Disease Condition is Healthy
20. If ECG is ST Tabnormal then Disease Con-
dition is Mild
90
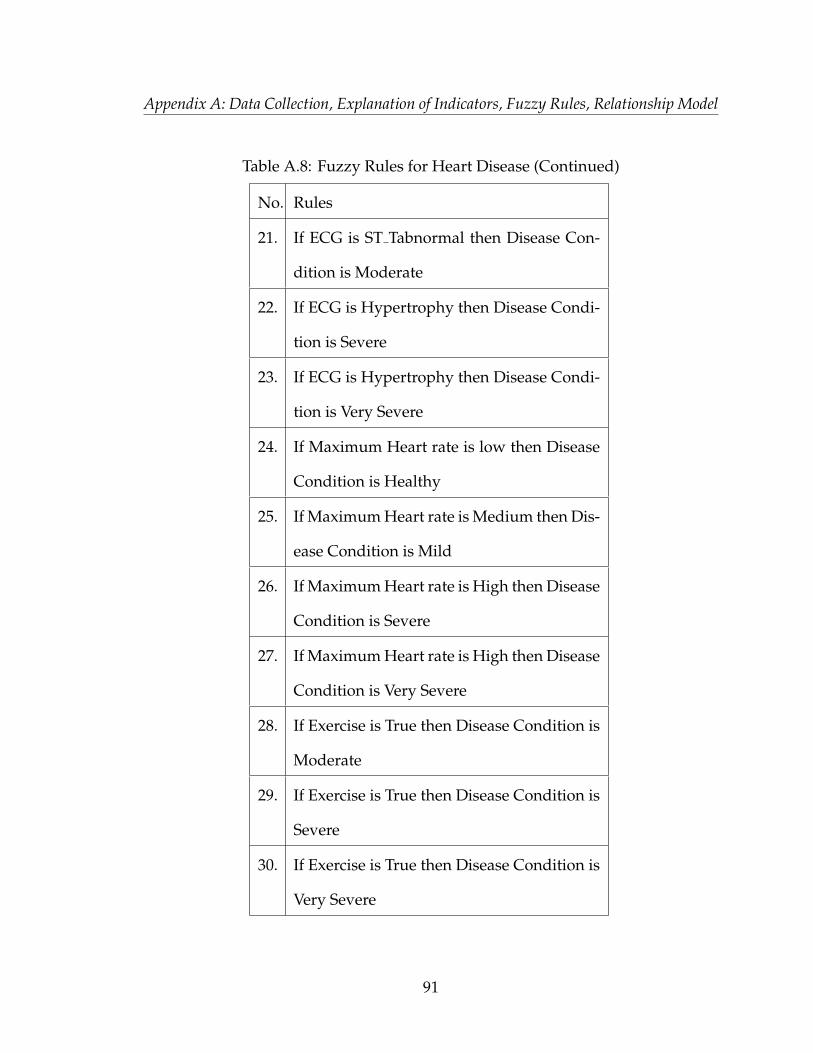
Appendix A: Data Collection, Explanation of Indicators, Fuzzy Rules, Relationship Model
Table A.8: Fuzzy Rules for Heart Disease (Continued)
No. Rules
21. If ECG is ST Tabnormal then Disease Con-
dition is Moderate
22. If ECG is Hypertrophy then Disease Condi-
tion is Severe
23. If ECG is Hypertrophy then Disease Condi-
tion is Very Severe
24. If Maximum Heart rate is low then Disease
Condition is Healthy
25. If Maximum Heart rate is Medium then Dis-
ease Condition is Mild
26. If Maximum Heart rate is High then Disease
Condition is Severe
27. If Maximum Heart rate is High then Disease
Condition is Very Severe
28. If Exercise is True then Disease Condition is
Moderate
29. If Exercise is True then Disease Condition is
Severe
30. If Exercise is True then Disease Condition is
Very Severe
91
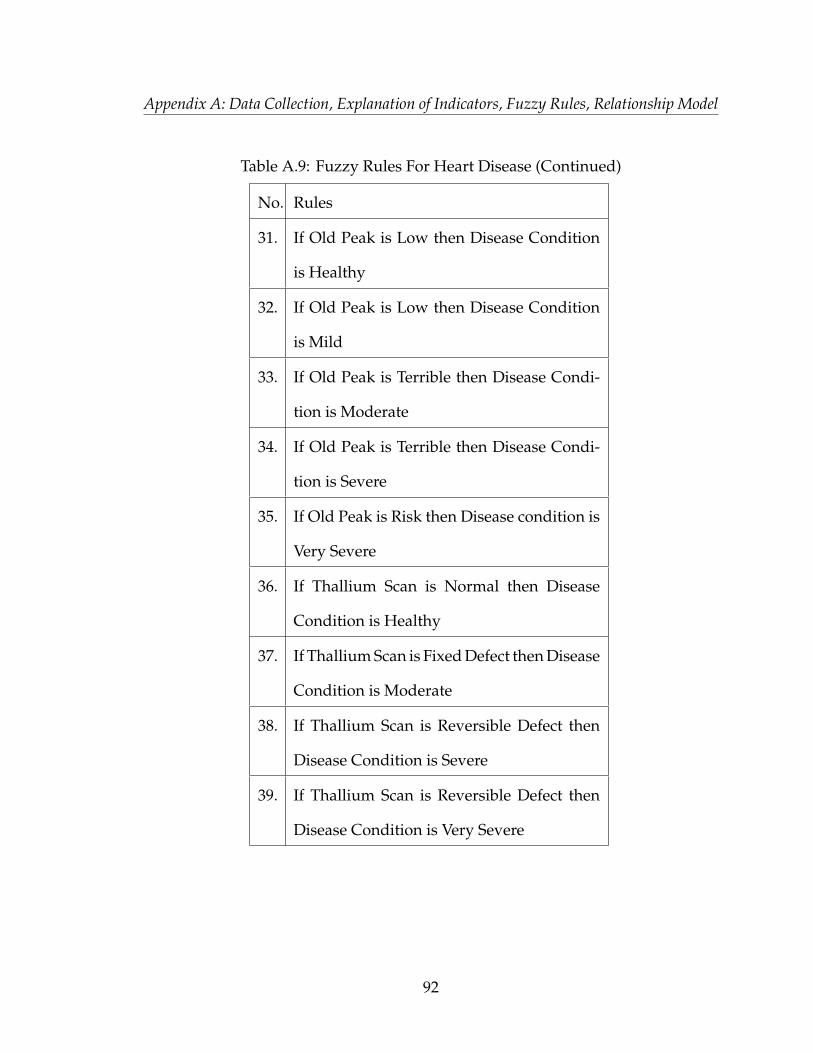
Appendix A: Data Collection, Explanation of Indicators, Fuzzy Rules, Relationship Model
Table A.9: Fuzzy Rules For Heart Disease (Continued)
No. Rules
31. If Old Peak is Low then Disease Condition
is Healthy
32. If Old Peak is Low then Disease Condition
is Mild
33. If Old Peak is Terrible then Disease Condi-
tion is Moderate
34. If Old Peak is Terrible then Disease Condi-
tion is Severe
35. If Old Peak is Risk then Disease condition is
Very Severe
36. If Thallium Scan is Normal then Disease
Condition is Healthy
37. If Thallium Scan is Fixed Defect then Disease
Condition is Moderate
38. If Thallium Scan is Reversible Defect then
Disease Condition is Severe
39. If Thallium Scan is Reversible Defect then
Disease Condition is Very Severe
92
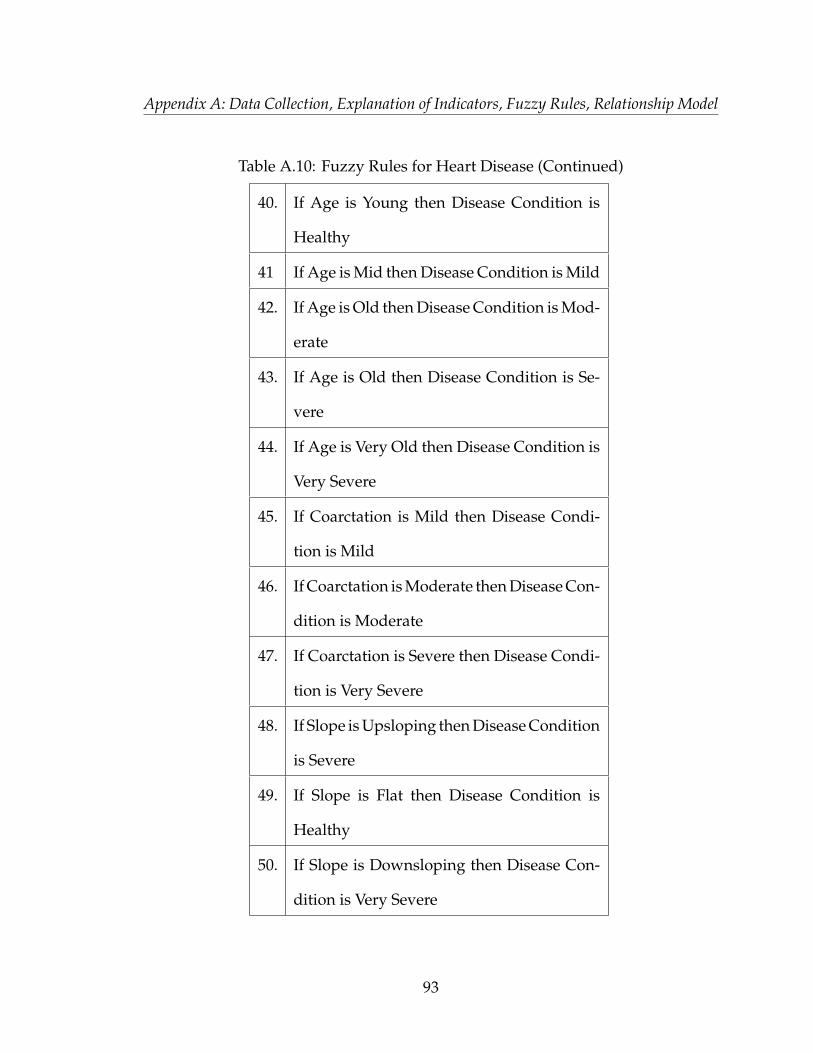
Appendix A: Data Collection, Explanation of Indicators, Fuzzy Rules, Relationship Model
Table A.10: Fuzzy Rules for Heart Disease (Continued)
40. If Age is Young then Disease Condition is
Healthy
41 If Age is Mid then Disease Condition is Mild
42. If Age is Old then Disease Condition is Mod-
erate
43. If Age is Old then Disease Condition is Se-
vere
44. If Age is Very Old then Disease Condition is
Very Severe
45. If Coarctation is Mild then Disease Condi-
tion is Mild
46. If Coarctation is Moderate then Disease Con-
dition is Moderate
47. If Coarctation is Severe then Disease Condi-
tion is Very Severe
48. If Slope is Upsloping then Disease Condition
is Severe
49. If Slope is Flat then Disease Condition is
Healthy
50. If Slope is Downsloping then Disease Con-
dition is Very Severe
93
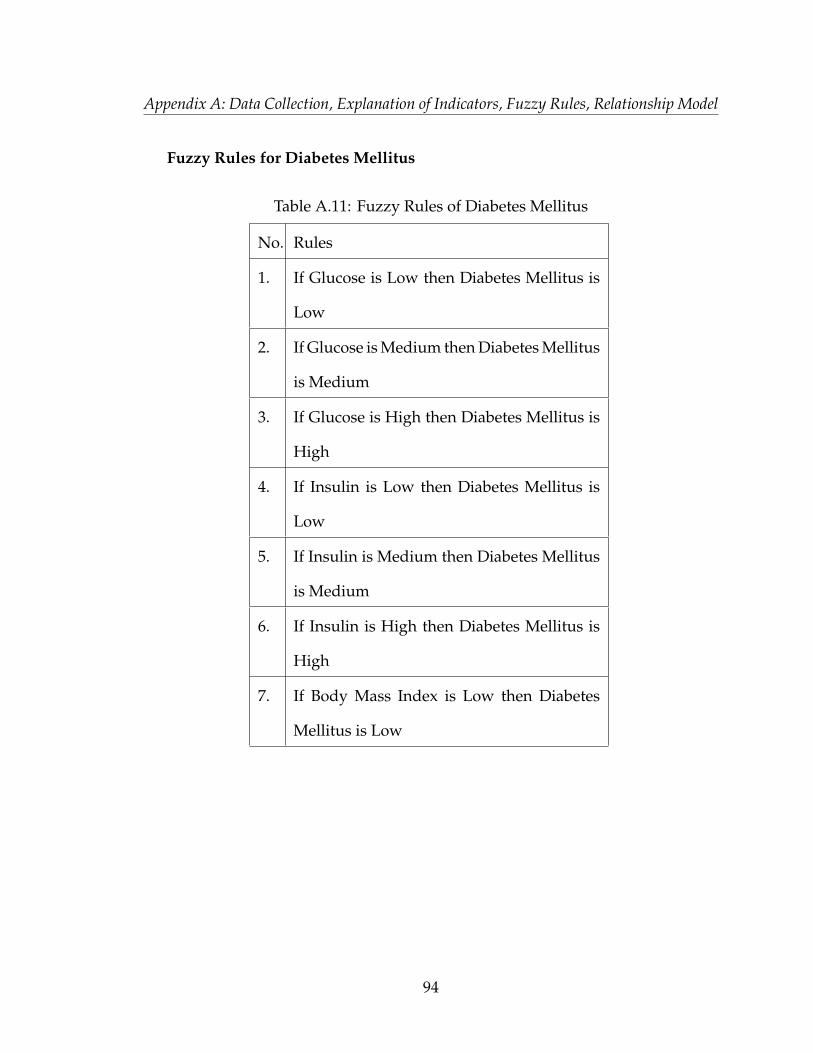
Appendix A: Data Collection, Explanation of Indicators, Fuzzy Rules, Relationship Model
Fuzzy Rules for Diabetes Mellitus
Table A.11: Fuzzy Rules of Diabetes Mellitus
No. Rules
1. If Glucose is Low then Diabetes Mellitus is
Low
2. If Glucose is Medium then Diabetes Mellitus
is Medium
3. If Glucose is High then Diabetes Mellitus is
High
4. If Insulin is Low then Diabetes Mellitus is
Low
5. If Insulin is Medium then Diabetes Mellitus
is Medium
6. If Insulin is High then Diabetes Mellitus is
High
7. If Body Mass Index is Low then Diabetes
Mellitus is Low
94

Appendix A: Data Collection, Explanation of Indicators, Fuzzy Rules, Relationship Model
Table A.12: Fuzzy Rules for Diabetes Mellitus (C0ntinued)
No. Rules
8. If Body Mass Index is Medium then Diabetes
Mellitus is Medium
9. If Body Mass Index is High then Diabetes
Mellitus is High
10. If Diabetes Pedigree Function is Low then
Diabetes is Low
11. If Diabetes Pedigree Function is Medium
then Diabetes Mellitus is Medium
12. If Diabetes Pedigree Function is High then
Diabetes Mellitus is High
13. If Age is Young then Diabetes Mellitus is
Low
14. If Age is Medium then Diabetes Mellitus is
Medium
15. If Age is Old then Diabetes Mellitus is High
16. If Number of pregnancy is absent then Dia-
betes Mellitus is Low
17. If Number of pregnancy is Normal then Di-
abetes Mellitus is Medium
95
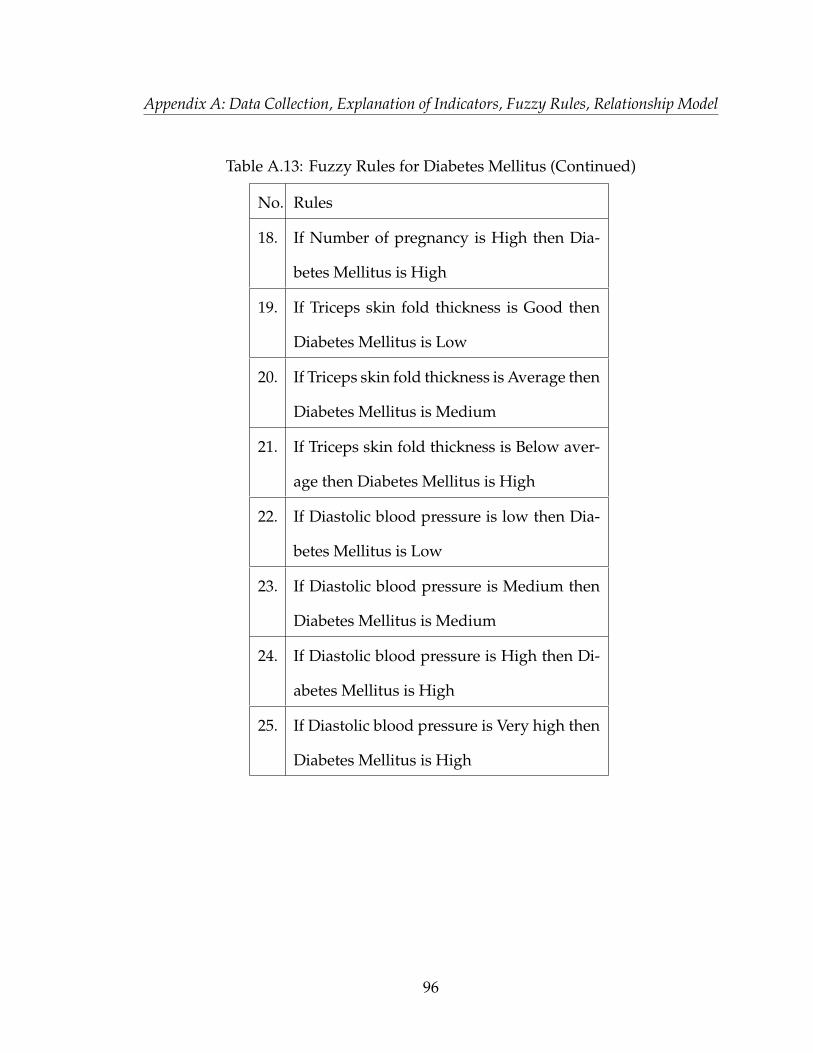
Appendix A: Data Collection, Explanation of Indicators, Fuzzy Rules, Relationship Model
Table A.13: Fuzzy Rules for Diabetes Mellitus (Continued)
No. Rules
18. If Number of pregnancy is High then Dia-
betes Mellitus is High
19. If Triceps skin fold thickness is Good then
Diabetes Mellitus is Low
20. If Triceps skin fold thickness is Average then
Diabetes Mellitus is Medium
21. If Triceps skin fold thickness is Below aver-
age then Diabetes Mellitus is High
22. If Diastolic blood pressure is low then Dia-
betes Mellitus is Low
23. If Diastolic blood pressure is Medium then
Diabetes Mellitus is Medium
24. If Diastolic blood pressure is High then Di-
abetes Mellitus is High
25. If Diastolic blood pressure is Very high then
Diabetes Mellitus is High
96
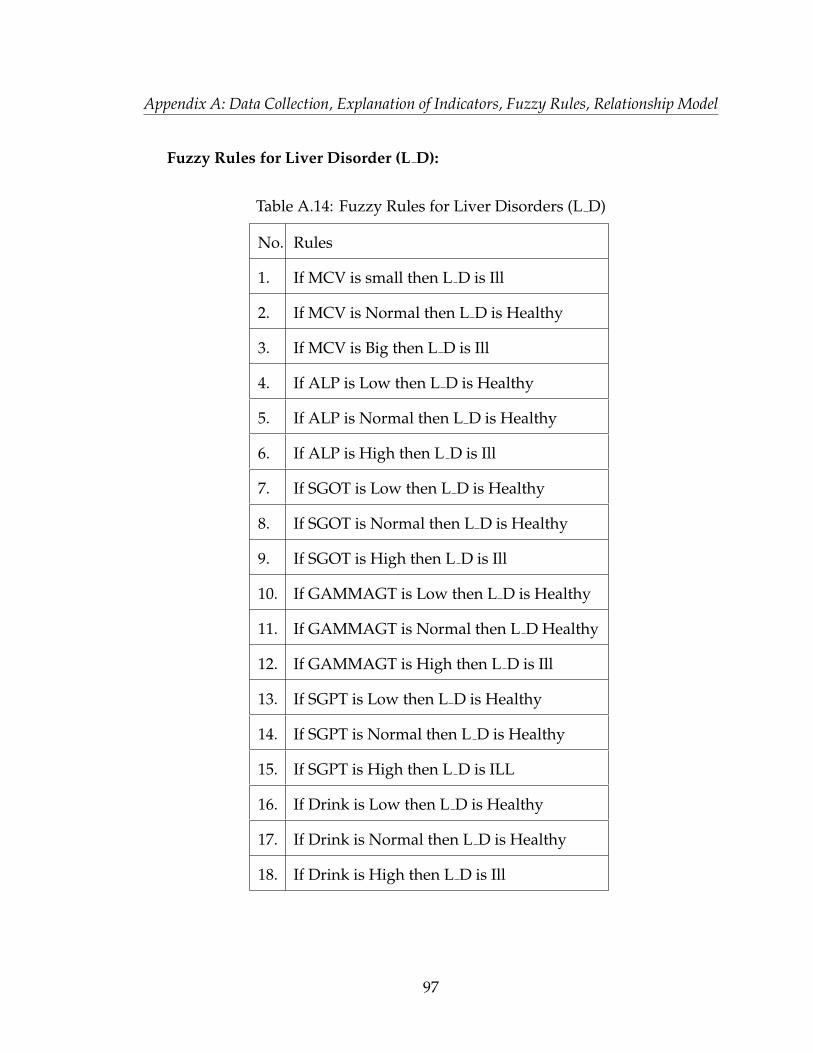
Appendix A: Data Collection, Explanation of Indicators, Fuzzy Rules, Relationship Model
Fuzzy Rules for Liver Disorder (L D):
Table A.14: Fuzzy Rules for Liver Disorders (L D)
No. Rules
1. If MCV is small then L D is Ill
2. If MCV is Normal then L D is Healthy
3. If MCV is Big then L D is Ill
4. If ALP is Low then L D is Healthy
5. If ALP is Normal then L D is Healthy
6. If ALP is High then L D is Ill
7. If SGOT is Low then L D is Healthy
8. If SGOT is Normal then L D is Healthy
9. If SGOT is High then L D is Ill
10. If GAMMAGT is Low then L D is Healthy
11. If GAMMAGT is Normal then L D Healthy
12. If GAMMAGT is High then L D is Ill
13. If SGPT is Low then L D is Healthy
14. If SGPT is Normal then L D is Healthy
15. If SGPT is High then L D is ILL
16. If Drink is Low then L D is Healthy
17. If Drink is Normal then L D is Healthy
18. If Drink is High then L D is Ill
97

Appendix B
Membership Function Calculation
Membership Function Calculation of Heart Disease Indicators:
1. The membership function for age is calculated as follows:
µyoung(Age) =
1, if Age < 29
(38 − Age)/9, if 29 ≤ Age < 38
0, Otherwise
(B.1)
µMid(Age) =
1, if Age = 38
(Age − 33)/5, if 33 ≤ Age < 38
(45 − Age)/7, if 38 ≤ Age < 45
0, Otherwise
(B.2)
µOld(Age) =
1, if Age = 48
(Age − 40)/8, if 40 ≤ Age < 48
(58 − Age)/10, if 48 ≤ Age < 58
0, Otherwise
(B.3)
98
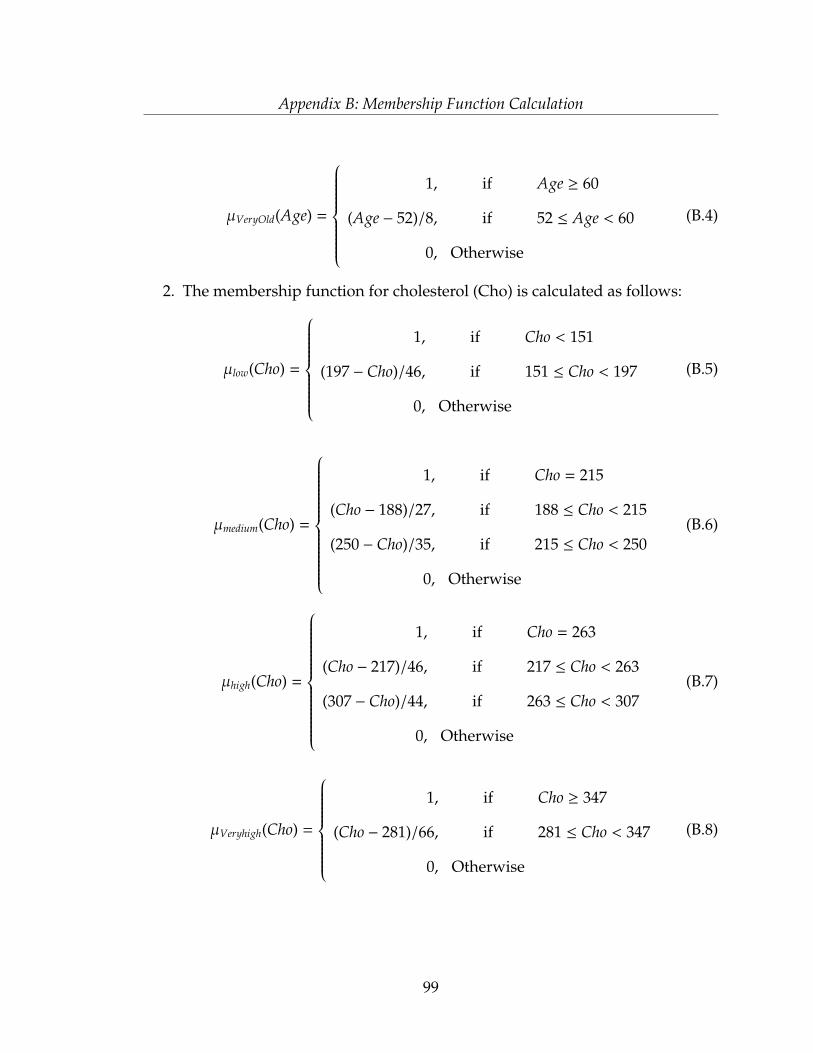
Appendix B: Membership Function Calculation
µVeryOld(Age) =
1, if Age ≥ 60
(Age − 52)/8, if 52 ≤ Age < 60
0, Otherwise
(B.4)
2. The membership function for cholesterol (Cho) is calculated as follows:
µlow(Cho) =
1, if Cho < 151
(197 − Cho)/46, if 151 ≤ Cho < 197
0, Otherwise
(B.5)
µmedium(Cho) =
1, if Cho = 215
(Cho − 188)/27, if 188 ≤ Cho < 215
(250 − Cho)/35, if 215 ≤ Cho < 250
0, Otherwise
(B.6)
µhigh(Cho) =
1, if Cho = 263
(Cho − 217)/46, if 217 ≤ Cho < 263
(307 − Cho)/44, if 263 ≤ Cho < 307
0, Otherwise
(B.7)
µVeryhigh(Cho) =
1, if Cho ≥ 347
(Cho − 281)/66, if 281 ≤ Cho < 347
0, Otherwise
(B.8)
99
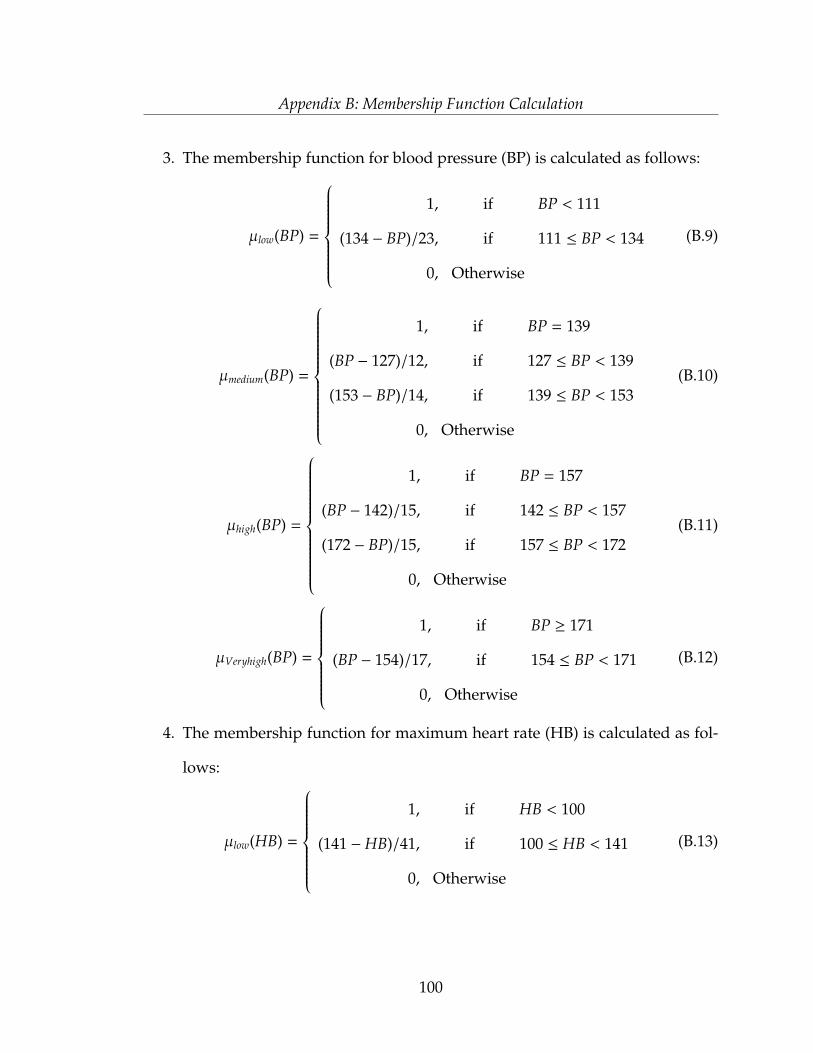
Appendix B: Membership Function Calculation
3. The membership function for blood pressure (BP) is calculated as follows:
µlow(BP) =
1, if BP < 111
(134 − BP)/23, if 111 ≤ BP < 134
0, Otherwise
(B.9)
µmedium(BP) =
1, if BP = 139
(BP − 127)/12, if 127 ≤ BP < 139
(153 − BP)/14, if 139 ≤ BP < 153
0, Otherwise
(B.10)
µhigh(BP) =
1, if BP = 157
(BP − 142)/15, if 142 ≤ BP < 157
(172 − BP)/15, if 157 ≤ BP < 172
0, Otherwise
(B.11)
µVeryhigh(BP) =
1, if BP ≥ 171
(BP − 154)/17, if 154 ≤ BP < 171
0, Otherwise
(B.12)
4. The membership function for maximum heart rate (HB) is calculated as fol-
lows:
µlow(HB) =
1, if HB < 100
(141 −HB)/41, if 100 ≤ HB < 141
0, Otherwise
(B.13)
100
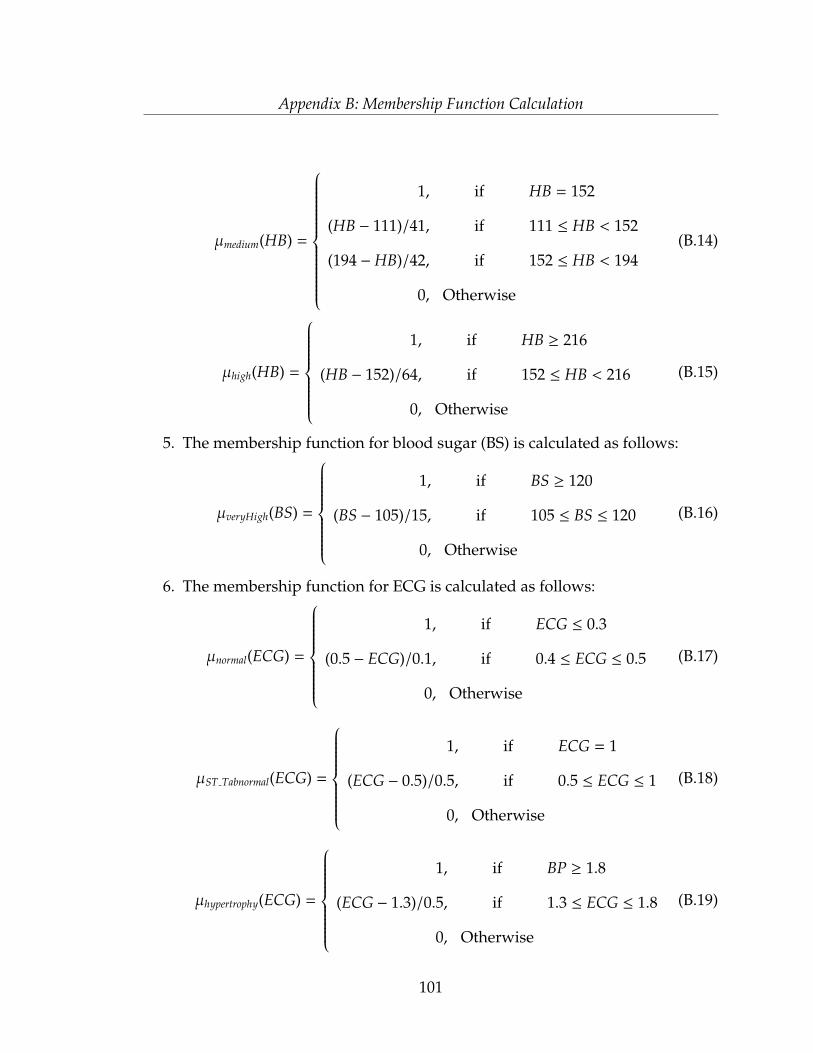
Appendix B: Membership Function Calculation
µmedium(HB) =
1, if HB = 152
(HB − 111)/41, if 111 ≤ HB < 152
(194 −HB)/42, if 152 ≤ HB < 194
0, Otherwise
(B.14)
µhigh(HB) =
1, if HB ≥ 216
(HB − 152)/64, if 152 ≤ HB < 216
0, Otherwise
(B.15)
5. The membership function for blood sugar (BS) is calculated as follows:
µveryHigh(BS) =
1, if BS ≥ 120
(BS − 105)/15, if 105 ≤ BS ≤ 120
0, Otherwise
(B.16)
6. The membership function for ECG is calculated as follows:
µnormal(ECG) =
1, if ECG ≤ 0.3
(0.5 − ECG)/0.1, if 0.4 ≤ ECG ≤ 0.5
0, Otherwise
(B.17)
µST Tabnormal(ECG) =
1, if ECG = 1
(ECG − 0.5)/0.5, if 0.5 ≤ ECG ≤ 1
0, Otherwise
(B.18)
µhypertrophy(ECG) =
1, if BP ≥ 1.8
(ECG − 1.3)/0.5, if 1.3 ≤ ECG ≤ 1.8
0, Otherwise
(B.19)
101
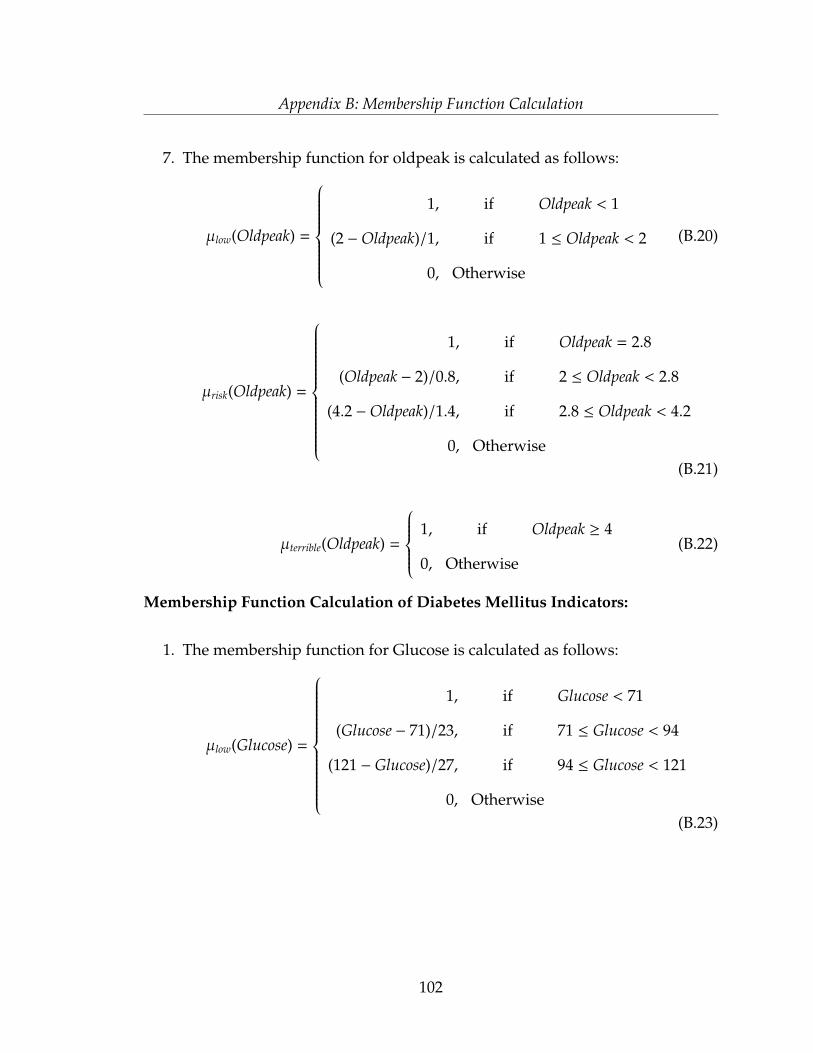
Appendix B: Membership Function Calculation
7. The membership function for oldpeak is calculated as follows:
µlow(Oldpeak) =
1, if Oldpeak < 1
(2 −Oldpeak)/1, if 1 ≤ Oldpeak < 2
0, Otherwise
(B.20)
µrisk(Oldpeak) =
1, if Oldpeak = 2.8
(Oldpeak − 2)/0.8, if 2 ≤ Oldpeak < 2.8
(4.2 −Oldpeak)/1.4, if 2.8 ≤ Oldpeak < 4.2
0, Otherwise(B.21)
µterrible(Oldpeak) =
1, if Oldpeak ≥ 4
0, Otherwise(B.22)
Membership Function Calculation of Diabetes Mellitus Indicators:
1. The membership function for Glucose is calculated as follows:
µlow(Glucose) =
1, if Glucose < 71
(Glucose − 71)/23, if 71 ≤ Glucose < 94
(121 − Glucose)/27, if 94 ≤ Glucose < 121
0, Otherwise(B.23)
102
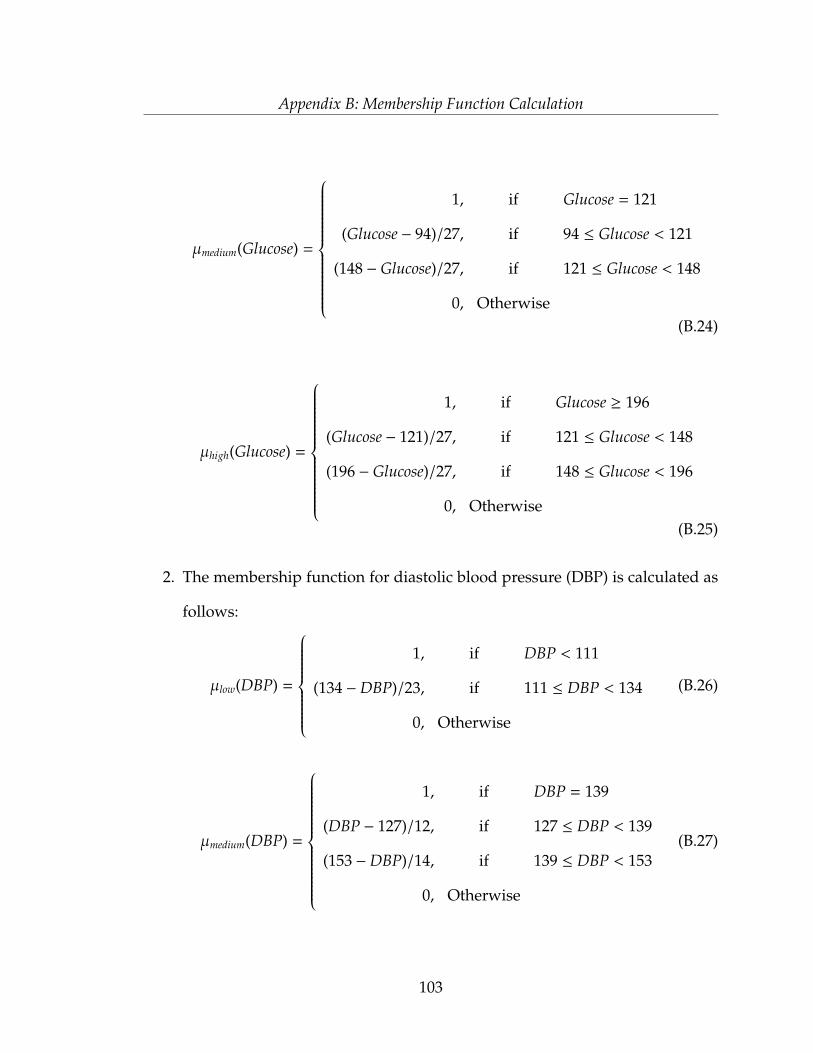
Appendix B: Membership Function Calculation
µmedium(Glucose) =
1, if Glucose = 121
(Glucose − 94)/27, if 94 ≤ Glucose < 121
(148 − Glucose)/27, if 121 ≤ Glucose < 148
0, Otherwise(B.24)
µhigh(Glucose) =
1, if Glucose ≥ 196
(Glucose − 121)/27, if 121 ≤ Glucose < 148
(196 − Glucose)/27, if 148 ≤ Glucose < 196
0, Otherwise(B.25)
2. The membership function for diastolic blood pressure (DBP) is calculated as
follows:
µlow(DBP) =
1, if DBP < 111
(134 −DBP)/23, if 111 ≤ DBP < 134
0, Otherwise
(B.26)
µmedium(DBP) =
1, if DBP = 139
(DBP − 127)/12, if 127 ≤ DBP < 139
(153 −DBP)/14, if 139 ≤ DBP < 153
0, Otherwise
(B.27)
103
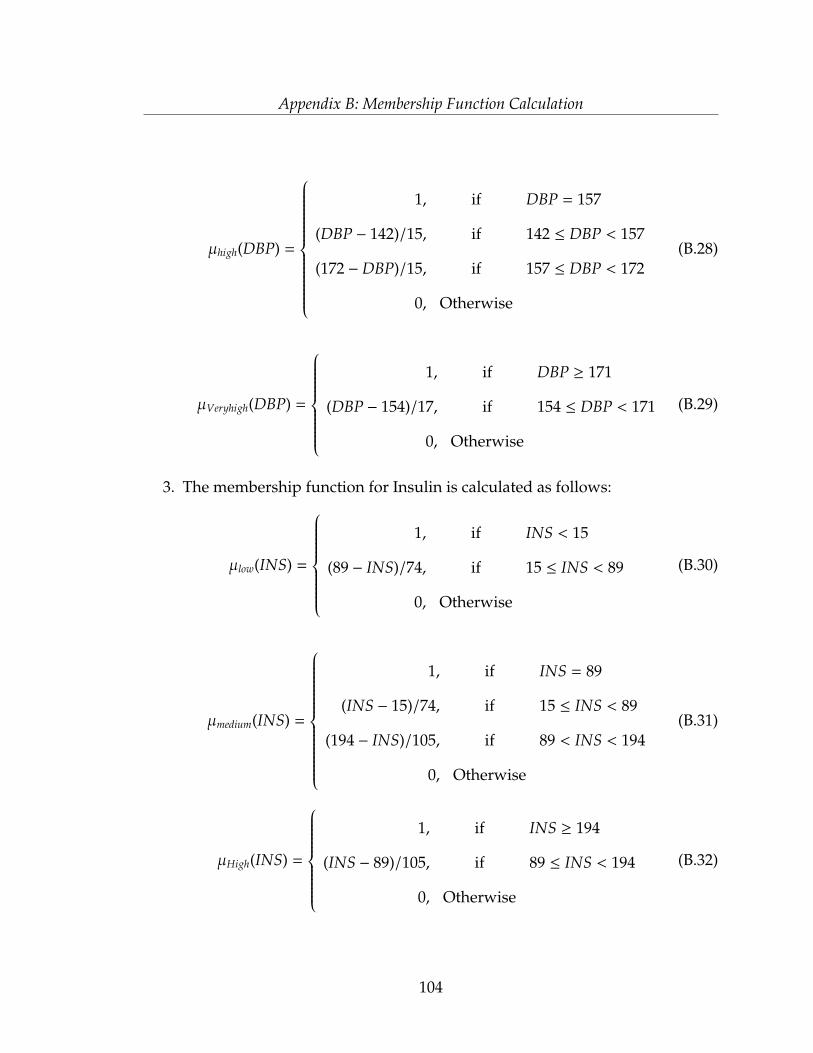
Appendix B: Membership Function Calculation
µhigh(DBP) =
1, if DBP = 157
(DBP − 142)/15, if 142 ≤ DBP < 157
(172 −DBP)/15, if 157 ≤ DBP < 172
0, Otherwise
(B.28)
µVeryhigh(DBP) =
1, if DBP ≥ 171
(DBP − 154)/17, if 154 ≤ DBP < 171
0, Otherwise
(B.29)
3. The membership function for Insulin is calculated as follows:
µlow(INS) =
1, if INS < 15
(89 − INS)/74, if 15 ≤ INS < 89
0, Otherwise
(B.30)
µmedium(INS) =
1, if INS = 89
(INS − 15)/74, if 15 ≤ INS < 89
(194 − INS)/105, if 89 < INS < 194
0, Otherwise
(B.31)
µHigh(INS) =
1, if INS ≥ 194
(INS − 89)/105, if 89 ≤ INS < 194
0, Otherwise
(B.32)
104
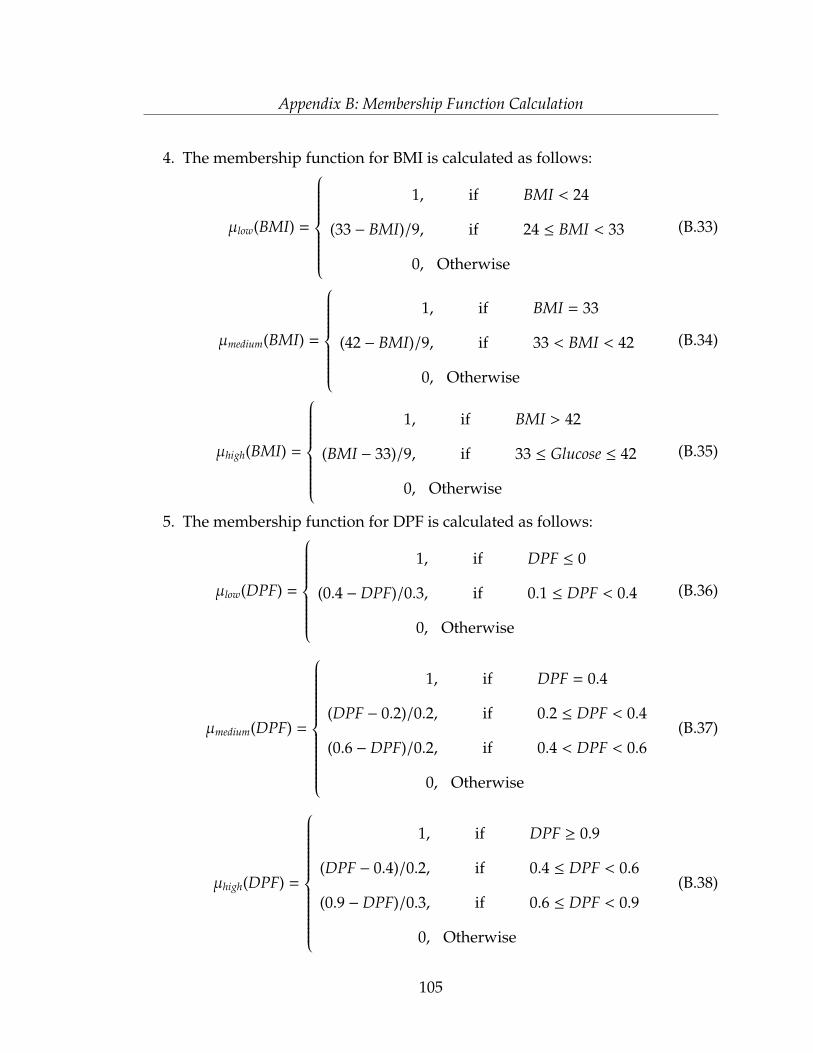
Appendix B: Membership Function Calculation
4. The membership function for BMI is calculated as follows:
µlow(BMI) =
1, if BMI < 24
(33 − BMI)/9, if 24 ≤ BMI < 33
0, Otherwise
(B.33)
µmedium(BMI) =
1, if BMI = 33
(42 − BMI)/9, if 33 < BMI < 42
0, Otherwise
(B.34)
µhigh(BMI) =
1, if BMI > 42
(BMI − 33)/9, if 33 ≤ Glucose ≤ 42
0, Otherwise
(B.35)
5. The membership function for DPF is calculated as follows:
µlow(DPF) =
1, if DPF ≤ 0
(0.4 −DPF)/0.3, if 0.1 ≤ DPF < 0.4
0, Otherwise
(B.36)
µmedium(DPF) =
1, if DPF = 0.4
(DPF − 0.2)/0.2, if 0.2 ≤ DPF < 0.4
(0.6 −DPF)/0.2, if 0.4 < DPF < 0.6
0, Otherwise
(B.37)
µhigh(DPF) =
1, if DPF ≥ 0.9
(DPF − 0.4)/0.2, if 0.4 ≤ DPF < 0.6
(0.9 −DPF)/0.3, if 0.6 ≤ DPF < 0.9
0, Otherwise
(B.38)
105

Appendix B: Membership Function Calculation
6. The membership function for Age is calculated as follows:
µyoung(Age) =
1, if Age ≤ 26
(Age − 29)/6, if 29 < Age ≤ 35
0, Otherwise
(B.39)
µMedium(Age) =
1, if Age = 38
(Age − 33)/12, if 33 ≤ Age < 45
0, Otherwise
(B.40)
µOld(Age) =
0, if Age < 45
(50 − Age)/5, if 45 ≤ Age < 50
1, Otherwise
(B.41)
Membership Function Calculation of Liver Disorders Indicators:
1. The membership function for MCV is calculated as follows:
µSmall(MCV) =
1, if MCV < 60
(78 −MCV)/18, if 60 ≤MCV < 78
0, Otherwise
(B.42)
µnormal(MCV) =
1, if MCV = 90
(100 −MCV)/22, if 78 ≤MCV < 100
0, Otherwise
(B.43)
µBig(MCV) =
1, if MCV ≥ 120
(120 −MCV)/20, if 100 ≤MCV < 120
0, Otherwise
(B.44)
106
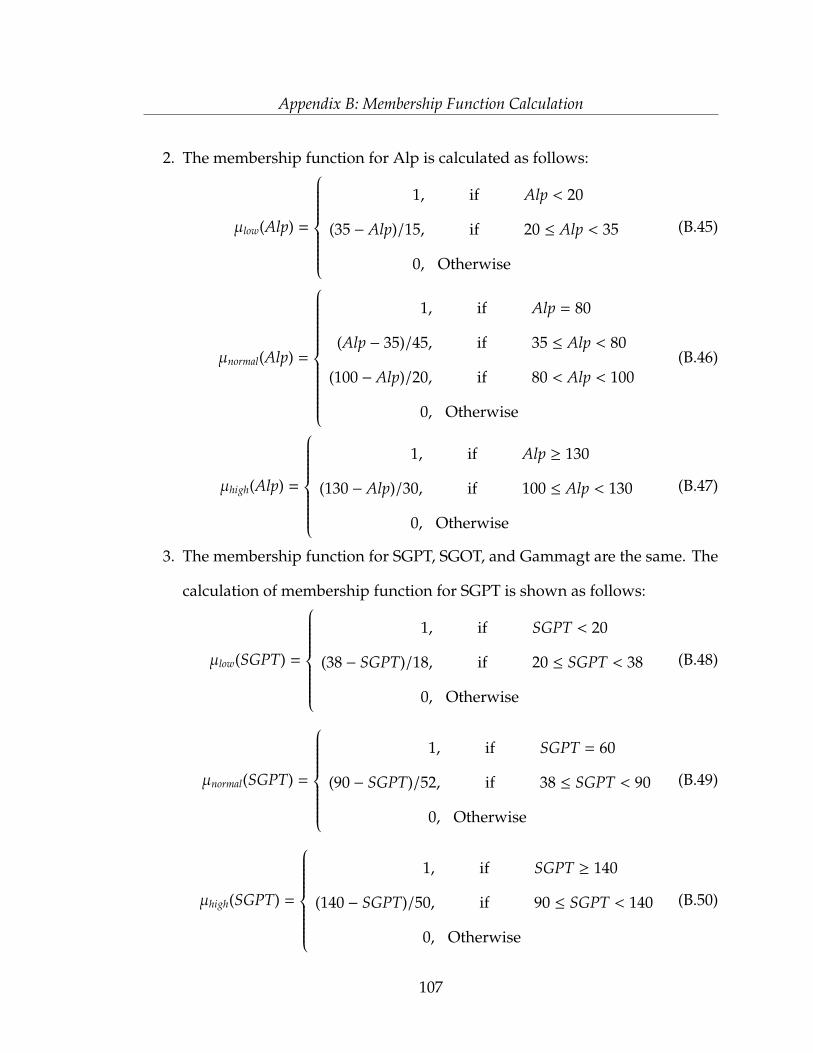
Appendix B: Membership Function Calculation
2. The membership function for Alp is calculated as follows:
µlow(Alp) =
1, if Alp < 20
(35 − Alp)/15, if 20 ≤ Alp < 35
0, Otherwise
(B.45)
µnormal(Alp) =
1, if Alp = 80
(Alp − 35)/45, if 35 ≤ Alp < 80
(100 − Alp)/20, if 80 < Alp < 100
0, Otherwise
(B.46)
µhigh(Alp) =
1, if Alp ≥ 130
(130 − Alp)/30, if 100 ≤ Alp < 130
0, Otherwise
(B.47)
3. The membership function for SGPT, SGOT, and Gammagt are the same. The
calculation of membership function for SGPT is shown as follows:
µlow(SGPT) =
1, if SGPT < 20
(38 − SGPT)/18, if 20 ≤ SGPT < 38
0, Otherwise
(B.48)
µnormal(SGPT) =
1, if SGPT = 60
(90 − SGPT)/52, if 38 ≤ SGPT < 90
0, Otherwise
(B.49)
µhigh(SGPT) =
1, if SGPT ≥ 140
(140 − SGPT)/50, if 90 ≤ SGPT < 140
0, Otherwise
(B.50)
107
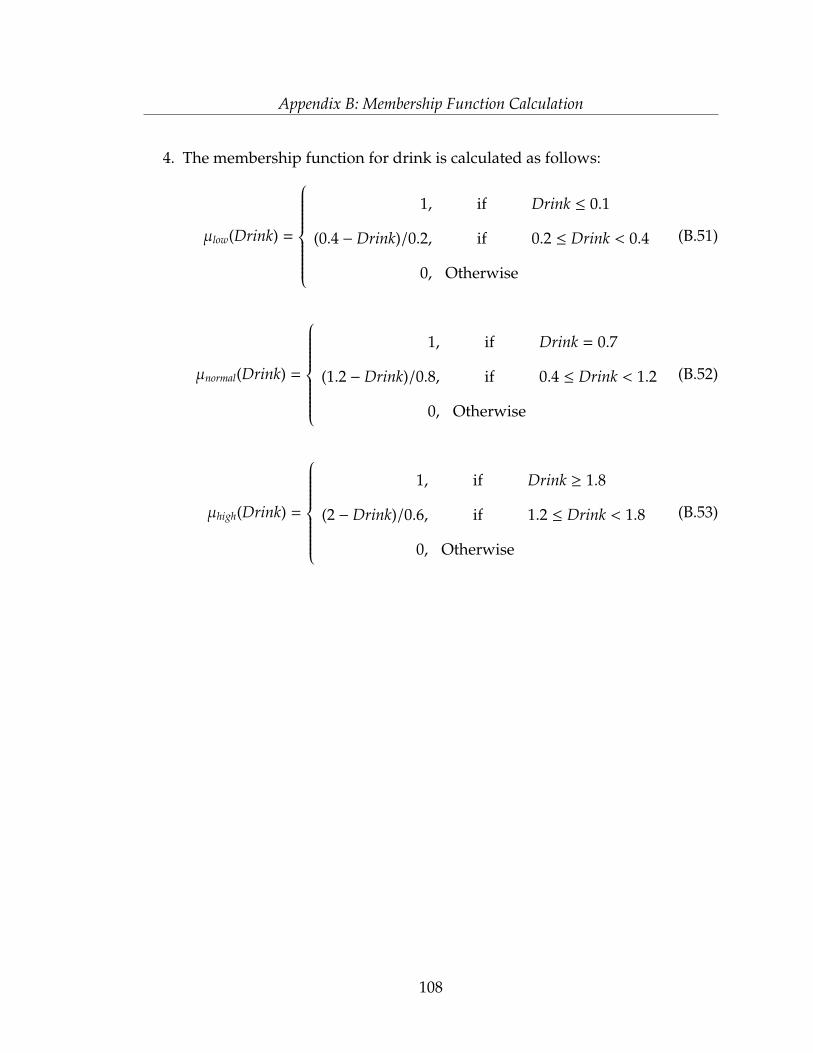
Appendix B: Membership Function Calculation
4. The membership function for drink is calculated as follows:
µlow(Drink) =
1, if Drink ≤ 0.1
(0.4 −Drink)/0.2, if 0.2 ≤ Drink < 0.4
0, Otherwise
(B.51)
µnormal(Drink) =
1, if Drink = 0.7
(1.2 −Drink)/0.8, if 0.4 ≤ Drink < 1.2
0, Otherwise
(B.52)
µhigh(Drink) =
1, if Drink ≥ 1.8
(2 −Drink)/0.6, if 1.2 ≤ Drink < 1.8
0, Otherwise
(B.53)
108

Appendix C
Some Portion of SQL for FIS of the
Developed System
Here, some portion of SQL and snapshot of the developed systems are pro-
vided, which is related to the developed fuzzy database system. The system was
developed using Microsoft Access 2007. SQL is the most important part of the
developed system. Below are some portion of the developed system to generate
the membership function.
SELECT Table1.Age, IIf([Age]<=29,1,
IIf([Age] Between 29 And 38,
Format((38-[Age])/9,"#.00"),0)) AS YoungMF,
IIf([Age]=38,1,
IIf([Age] Between 33 And 38,
Format(([Age]-33)/5,"#.00"),
IIf([Age] Between 38 And 45,
109
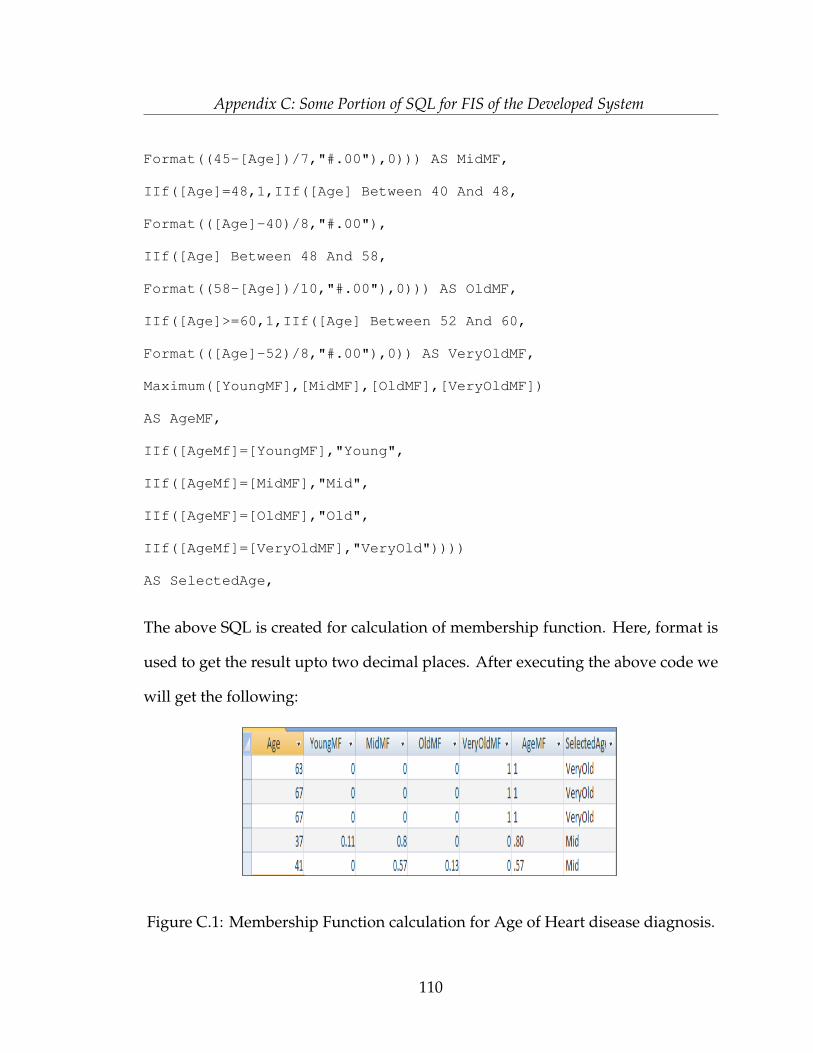
Appendix C: Some Portion of SQL for FIS of the Developed System
Format((45-[Age])/7,"#.00"),0))) AS MidMF,
IIf([Age]=48,1,IIf([Age] Between 40 And 48,
Format(([Age]-40)/8,"#.00"),
IIf([Age] Between 48 And 58,
Format((58-[Age])/10,"#.00"),0))) AS OldMF,
IIf([Age]>=60,1,IIf([Age] Between 52 And 60,
Format(([Age]-52)/8,"#.00"),0)) AS VeryOldMF,
Maximum([YoungMF],[MidMF],[OldMF],[VeryOldMF])
AS AgeMF,
IIf([AgeMf]=[YoungMF],"Young",
IIf([AgeMf]=[MidMF],"Mid",
IIf([AgeMF]=[OldMF],"Old",
IIf([AgeMf]=[VeryOldMF],"VeryOld"))))
AS SelectedAge,
The above SQL is created for calculation of membership function. Here, format is
used to get the result upto two decimal places. After executing the above code we
will get the following:
Figure C.1: Membership Function calculation for Age of Heart disease diagnosis.
110
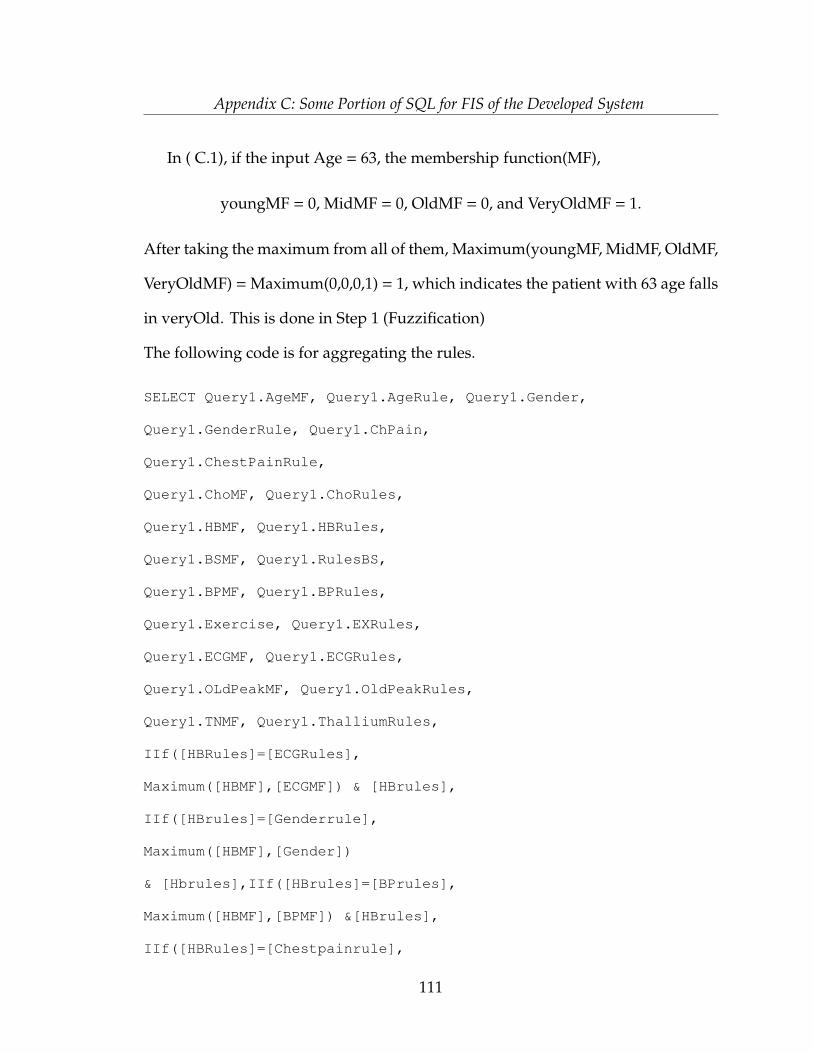
Appendix C: Some Portion of SQL for FIS of the Developed System
In ( C.1), if the input Age = 63, the membership function(MF),
youngMF = 0, MidMF = 0, OldMF = 0, and VeryOldMF = 1.
After taking the maximum from all of them, Maximum(youngMF, MidMF, OldMF,
VeryOldMF) = Maximum(0,0,0,1) = 1, which indicates the patient with 63 age falls
in veryOld. This is done in Step 1 (Fuzzification)
The following code is for aggregating the rules.
SELECT Query1.AgeMF, Query1.AgeRule, Query1.Gender,
Query1.GenderRule, Query1.ChPain,
Query1.ChestPainRule,
Query1.ChoMF, Query1.ChoRules,
Query1.HBMF, Query1.HBRules,
Query1.BSMF, Query1.RulesBS,
Query1.BPMF, Query1.BPRules,
Query1.Exercise, Query1.EXRules,
Query1.ECGMF, Query1.ECGRules,
Query1.OLdPeakMF, Query1.OldPeakRules,
Query1.TNMF, Query1.ThalliumRules,
IIf([HBRules]=[ECGRules],
Maximum([HBMF],[ECGMF]) & [HBrules],
IIf([HBrules]=[Genderrule],
Maximum([HBMF],[Gender])
& [Hbrules],IIf([HBrules]=[BPrules],
Maximum([HBMF],[BPMF]) &[HBrules],
IIf([HBRules]=[Chestpainrule],
111
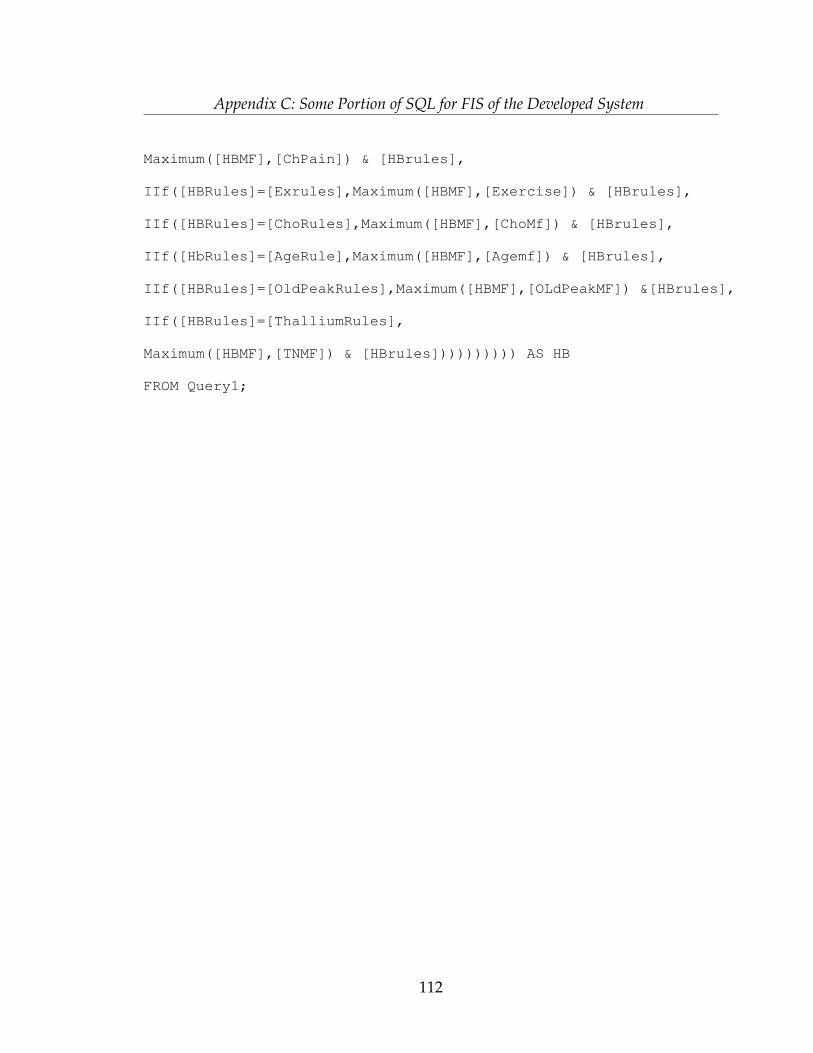
Appendix C: Some Portion of SQL for FIS of the Developed System
Maximum([HBMF],[ChPain]) & [HBrules],
IIf([HBRules]=[Exrules],Maximum([HBMF],[Exercise]) & [HBrules],
IIf([HBRules]=[ChoRules],Maximum([HBMF],[ChoMf]) & [HBrules],
IIf([HbRules]=[AgeRule],Maximum([HBMF],[Agemf]) & [HBrules],
IIf([HBRules]=[OldPeakRules],Maximum([HBMF],[OLdPeakMF]) &[HBrules],
IIf([HBRules]=[ThalliumRules],
Maximum([HBMF],[TNMF]) & [HBrules]))))))))) AS HB
FROM Query1;
112

Bibliography
[1] N. Hiroshi, T. Sogoh, and M. Arao, “fuzzy database language and library-
fuzzy extension to sql,” in Proceedings of Fuzzy Systems, 1993., Second IEEE
International Conference on., vol. 1, 1983, pp. 477 – 482.
[2] J. Miguel Medina, O. Pons, and M. Amparo Vila, “Gefred: a generalized model
of fuzzy relational databases,” in Proceedings of Information Sciences, Informatics
and Computer Science Intelligent Systems Applications, vol. 76, no. 1, 1994, pp.
87–109.
[3] M. Hudec, “Fuzzy improvement of the sql,” Yugoslav Journal of Operations
Research, vol. 21, no. 2, pp. 239–251, 2011.
[4] J. Galindo, Angelica Urrutia, and Mario Piattini, Fuzzy Databases: Modeling,
Design and Implementation. Idea Group Inc (IGI), 2006.
[5] E. Nagi and F. Wat, “Design and development of a fuzzy expert system for
hotel selection.” Omega: The International Journal of Management Science, vol. 31,
no. 4, pp. 275– 286, 2003.
[6] P. Bosc and O. Pivert, “Sqlf: a relational database language for fuzzy query-
113
Bibliography
ing,” in Proceedings of Fuzzy Systems, IEEE Transactions on, vol. 3, no. 1, 1995,
pp. 1–17.
[7] R. Detrano, “V.A. Medical center, Long Each and Clevand Clinic
Foundation,” 1990, accessed: April 2014. [Online]. Available: http:
//www.archieve.ics.uci.edu/ml/datasets/Heart+Disease
[8] V. Sigillito, “National Institute of Diabetes and Digestive and Kidney
Diseases,” 1990, accessed: April 2014. [Online]. Available: http:
//www.archive.ics.uci.edu/ml/datasets/pima-Indian-diabetes
[9] R. S. Forsyth, “BUPA Medical Research Ltd,” 1990, accessed: April 2014.
[Online]. Available: https://archive.ics.uci.edu/ml/datasets/Liver+Disorders
[10] A. Adeli and M.Neshat, “A fuzzy expert system for heart disease diagnosis.”
in Proceedings of the International Multi Conference of Engineers and Computer
Scientists, vol. 1, 2010, pp. 1–6.
[11] M. Neshat, M. Yaghobi, M. B. Naghibi, and A. Esmaelzadeh, “Fuzzy expert
system design for diagnosis of liver disorders.” in Proceedings of 2008 IEEE
International Symposium on Knowledge Acquisition and Modeling Workshop pro-
ceedings, vol. 6, 2008, pp. 252–256.
[12] M. Kalpana and Dr. A. V Senthil Kumar, “Fuzzy expert system for diagnosis
of diabetes using fuzzy determination mechanism.” International Journal of
Science and Applied Information Technology, vol. 2, no. 1, pp. 354–361, 2011.
114
Bibliography
[13] L. A. Zadeh, “Fuzzy sets,” in Proceedings of Information and Control, vol. 8, no. 3,
1965, pp. 338 – 353.
[14] L. A. Zadeh, “Outline of a new approach to the analysis of complex and
decision process,” in Proceedings of IEEE Transactions on Systems, Man, and
Cybernetics, vol. 1, 1973, pp. 28–44.
[15] G. Jose, Handbook of Research on Fuzzy Information Processing in Databases. In-
formation Science Reference, 2008.
[16] J. Mohammad, N. Vadiee, and T. Ross, Fuzzy Logic and Control: Software and
Hardware Applications. Prentice Hall, 1993, vol. 2.
[17] A. A. El-Bagdady, Fuzzy Inference System (FIS) based decision- making algorithms
for CMM Measurement in Quality Control. University of Michigan - Dearborn,
1997, vol. 2.
[18] L. Qilian and J. M. Mendel, “Interval type-2 fuzzy logic systems: Theory and
design.” in Proceedings of Fuzzy Systems, IEEE Transactions on, vol. 8, no. 5, 2000,
pp. 535–550.
[19] T. Mitsuishi, N. Endou, and Y. Shidama, “The concept of fuzzy set and mem-
bership function and basic properties of fuzzy set operation.” Journal of Foma-
lized Mathematics, vol. 12, no. 200, pp. 1–6, 2003.
[20] E. H. Mamdani and S. Assilian, “An experiment in linguistic synthesis with a
fuzzy logic controller.” International Journal of Man-Machine Studies, vol. 7, pp.
1–13, 1975.
115
Bibliography
[21] L. A. Zadeh, “The concept of a linguistic variable and its application to ap-
proximate reasoning-i.” in Proceedings of Information Sciences:Informatics and
Computer Science Intelligent Systems Applications, vol. 8, no. 1, 1975, pp. 119–
249.
[22] P. B. Khanale and R. P. Ambilwade, “A fuzzy inference system for diagnosis
of hypothyroidism.” Journal of Artificial Intelligence, vol. 4, pp. 45–54, 2011.
[23] M. Sugeno, Industrial Application of Fuzzy Control. North-Holland, 1985.
[24] M. Negnevitsky, Artificial Intelligence: A Guide to Intelligent Systems. Addison
Wesley/Pearson, 2001.
[25] S. Naaz, A. Alam, and Ranjit Biswas, “Effect of different defuzzification meth-
ods in a fuzzy based load balancing application.” IJCSI International Journal of
Computer Science Issues, vol. 8, no. 1, pp. 261–267, 2011.
[26] B. P. Buckles and F. E. Petty, “A fuzzy representation of data for relational
databases.” Fuzzy Sets and Systems: An International Journal in Information Sci-
ence and Engineering, vol. 7, no. 3, pp. 213–226, 1982.
[27] S. Shenoi and A. Melton, “Proximity relations in the fuzzy relational database
model.” Fuzzy Sets and Systems: An International Journal in Information Science
and Engineering, vol. 100, pp. 51– 62, 1999.
[28] S. K. De, R. Biswas, and A. R. Roy, “On extended fuzzy relational database
model with proximity relations.” Fuzzy Sets and Systems: An International
Journal in Information Science and Engineering, vol. 117, no. 2, pp. 195–201, 2001.
116
Bibliography
[29] A. Yazici, R. George, and D. Aksoy, “Design and implementation issues in
fuzzy object-oriented data model.” in Proceedings of Information Sciences: In-
formatics and Computer Science Intelligent Systems Applications, vol. 108, no. 1,
1998, pp. 241–260.
[30] J. Kacpryzyk and S. Zadrozny, “Fuzzy querying for microsoft access.” in Pro-
ceedings of Fuzzy Systems, 1994. IEEE World Congress on Computational Intelli-
gence, Proceedings of the Third IEEE Conference on, vol. 1, 1994, pp. 167–171.
[31] G. SauLan Loo and K. Lee, “An interface to databases for flexible query an-
swering: A fuzzy-set approach,” in Proceedings of Database and Expert Systems
Applications, Springer Berlin Heidelberg, vol. 1873, 2000, pp. 654–663.
[32] J. Galindo, “New characteristics in FSQL, a fuzzy SQL for fuzzy databases.”
WSEAS Transactions on Information Science and Applications, vol. 2, no. 2, pp.
161 – 169, 2005.
[33] G. Bordogna and G. Psaila., “Customizable Flexible Querying for Classical
Relational Databases.” Handbook of Research on Fuzzy Information Processing in
Databases, vol. 1, pp. 197–217, 2008.
[34] N. Mallikharjuna Rao, M. M. Naidu, and P.Seetharam, “Mobile database mod-
eling using fuzzy databases.” in Proceedings of 2011 International Conference on
Emerging Trends in Electrical and Computer Technology (ICETECT 2011), vol. 8,
2011, pp. 1026–1031.
[35] L., K., Durai, M.A., and N.Ch.Sriman Narayan lyengar, “Fuzzy rule based
117

Bibliography
inference system for detection and diagnosis of lung cancer.” International
Journal of Latest Trends in Computing ((IJLTC)), vol. 2, pp. 165–169, 2011.
[36] J. Soni, U. Ansari, D. Sharma, and S. Sunita, “Intelligent and effective heart
disease prediction system using weighted associative classifiers.” International
Journal on Computer Science and Engineering (IJCSE), vol. 3, no. 6, pp. 2385– 2392,
2011.
[37] M. Kadhim, M. Alam, and H. Kaur, “Design and implementation of fuzzy
expert system for back pain diagnosis.” International Journal of Innovative Tech-
nology and Creative Engineering (IJITCE), vol. 1, no. 9, pp. 16–22, 2011.
[38] R. Parvin and A. Abhari, “Fuzzy database for heart disease diagnosis,” in
Proceedings of Medical Processes Modeling and Simulation (MPMS)of the 2012
Autumn Simulation Multi-Conference (SCS/AutumnSim’12), 2012.
[39] A. Sergaki and K. Kalaitzakis, “A fuzzy knowledge based method for main-
tenance planning in a power system.” in Proceedings of Relaiability Engineering
and System Safety, vol. 77, no. 1, 2002, pp. 19–30.
[40] V. Bezdek, “Possible use of fuzzy logic in database,” Journal of Systems Integra-
tion, vol. 2, no. 2, pp. 31–46, 2011.
[41] A. H. M. Hoque, M. S. Ali, M. Aktaruzzaman, S. K. Mondol, and B. Islam,
“Performance comparison of fuzzy queries on fuzzy database and classical
database.” in Proceedings of 5th International Conference on Electrical and Com-
puter Engineering ICECE 2008, vol. 20, 2008, pp. 654 – 658.
118
Bibliography
[42] A. Meier, N. Werro, M. Albrecht, and M. Sarakinos, “Using a fuzzy classifica-
tion query language for customer relationship management,” in Proceedings of
the 31st international conference on Very large data bases, vol. 1, 2005, pp. 1089–
1096.
[43] I. B. Turksen, “Measurement of membership functions and their acquisition.”
in Fuzzy Sets and Systems, vol. 40, no. 1, 1991, pp. 5–38.
[44] S. Soni and O.P.Vyas, “Fuzzy weighted associative classifier: A predictive
technique for health care data mining.” International Journal of Computer Science,
Engineering and Information Technology (IJCSEIT), vol. 2, no. 1, pp. 11–22, 2012.
[45] “American Heart Association.” 2013, accessed: April 2014. [Online].
Available: http://www.heart.org/HEARTORG/Conditions/
[46] “American Diabetes Association,” 1995-2013, accessed: April 2014. [Online].
Available: http://www.diabetes.org/diabetes-basics/
[47] S. Sanyal, S. Iyengar, A. A. Roy, N. N. Karnik, N. M. Mengale, S. B. Menon, and
W. G. Feng, “Defuzzification method for a faster and more accurate control,”
in Proceedings of TENCON 2010 - 2010 IEEE Region 10 Conference, vol. 4, 2010,
pp. 316–318.
[48] C. Nordquist, “Medical News Today,” 2013, accessed: April 2014. [Online].
Available: http://www.medicalnewstoday.com/articles/235710.php
[49] M. K. Grauer, “ECG Interpretation,” 2010, accessed: April
119
Bibliography
2014. [Online]. Available: http://ecg-interpretation.blogspot.ca/2010/12/
ecg-interpretation-review-10-peaked-t.html
[50] “Mayo Foundation for Medical Education and Research.” 1998-2014,
accessed: April 2014. [Online]. Available: http://www.mayoclinic.org/
tests-procedures/nuclear-stress-test/
[51] “Coarctation of the aorta. american heart association.” accessed:
April 2014. [Online]. Available: http://www.heart.org/HEARTORG/
Conditions/CongenitalHeartDefects/AboutCongenitalHeartDefects/
Coarctation-of-the-Aorta-CoA UCM 307022 Article.jsp
[52] “MedlinePlus, A service of the U.S. National Library, NIH National
Institutes of Health,” 2013, accessed: April 2014. [Online]. Available:
http://www.nlm.nih.gov/medlineplus/liverdiseases.html
120
Recommended