FY2011
Trends in Fisheries
FY2012
Fishery Policy
(White Paper on Fisheries: Summary)
This document is a report on the state of
fisheries and the policy enacted during FY2011 in
accordance with the provisions of Article 10,
Paragraph 1 of the Fisheries Basic Act (Act No.
89 of 2001) as well as the policy to be enacted in
FY2012 in accordance with the provisions of
Paragraph 2 of said Article.
Table of Contents
Chapter I: [Special Feature] The Great East Japan Earthquake—The Future of Japan’s
Fishing Industry in Light of Reconstruction Efforts
○ FY2011: Trends in Fisheries
Chapter II: Review of Japan's Fisheries since FY2010
Section 1: Massive damage from the Great East Japan Earthquake and Tsunami
(1) An overview of the damage
(2) Damage to the fishing industry
Section 2: Recovery and reconstruction efforts in the fishing industry
(1) Emergency response in the wake of the disaster
(2) Implementation of full-scale recovery and reconstruction measures
(3) Recovery and reconstruction efforts in the affected communities
(4) Progress of recovery and reconstruction
Section 3: The impact of the disaster on Japan's fishing industry
(1) The roles of the affected area’s fishing industry
(2) The impact on the domestic distribution of fish and fishery products
(3) The impact on the fishery processing industry
(4) Increased imports to offset decreased domestic supplies
(5) The impact on the supply and demand of production materials in fisheries and aquaculture
Section 4: Impact of the nuclear power plant accident on the fishing industry and its response
(1) Overview of the accident and efforts towards its containment
(2) Status of radioactive substances in the oceans, rivers, lakes, and marshes
(3) Ensuring the safety of fish and fishery products
(4) Damage caused to fish and fishery products and responses
Section 5: The future of Japan's fishing industry in light of recovery and reconstruction efforts
(1) Strengthening ties between consumers and fishers
(2) Adopting new operating methods and promoting initiatives to supply high quality fish and fishery
products
(3) Strengthening disaster prevention and promoting disaster mitigation in fishing communities
(4) Ensuring the safety of fish and fishery products against radioactive substances and regaining the trust of
consumers
Introduction: The New Basic Plan for Fisheries
Section 1: Trends in fish and fishery product consumption, supply, and demand
(1) Trends in fish and fishery product supply and demand
(2) Trends in fish and fishery product consumption
(3) Trends in fish and fishery product imports and exports
(4) Japan's self-sufficiency rate of fish and fishery products for human consumption
----------------------------1
--------------------------------------------------------------------------------------------- 1
--------------------------------------------------------------------------------------------- 1
-------------------------------------- 2
--------------------------------------------------------------------- 2
-------------------------------------------- 2
------------------------------------------------ 3
------------------------------------------------------------------------------ 4
--------------------------------------------- 5
--------------------------------------------------------------------- 5
-------------------------------------------- 5
------------------------------------------------------------------------- 6
---------------------------------------------------------- 6
----------------- 6
------------------ 7
------------------------------------------------------ 7
----------------------------------- 8
----------------------------------------------------------------------- 8
-------------------------------------------------------- 9
------------- 10
-------------------------------------------------------------- 10
--------------------------------------------------------------------------------------------------------------------- 10
------------- 11
-------------------------------------------------------------------------------------------------------------------- 11
----------------------------------------------------------------------- 12
---------------------- 12
----------------------------------------------------------- 12
--------------------------------------------------------------------- 12
------------------------------------------------------------ 14
-------------------------- 14
Section 2: Trends in Japan's fishing industry
(1) Trends in fisheries and aquaculture
(2) Developments related to business management of fisheries and aquaculture
(3) Ensuring the safety of fishing operations
(4) Trends in fishery cooperatives
(5) Trends in fish and fishery product distribution and processing
Section 3: Trends concerning Japan's fishery resources and fishing grounds
(1) Fishery resources in Japan's surrounding waters
(2) Implementation of resource management frameworks
(3) Fishery enforcement to ensure compliance with resource management rules
(4) Aquatic environment that nurtures fishery resources
(5) Damage to fisheries by wildlife and harmful organisms
Section 4: International affairs surrounding the fishing industry
(1) State of world fisheries and aquaculture production
(2) Status of world fish and fishery product consumption
(3) Status of international fish and fishery product trade
(4) Japan’s relations in international fisheries
Section 5: Development of vigorous fishing communities
(1) Current state of fishing communities
(2) Upgrading of the roles and functions of fishing ports
(3) Revitalization of fisheries and fishing communities that make use of local resources
Prize Winners at the FY2011 Agriculture, Forestry and Fisheries Festival (Fishery Division)
○ FY2012 Fishery Policy
---------------------------------------------------------------------------- 15
---------------------------------------------------------------------------------------- 15
----------------- 16
------------------------------------------------------------------------------- 17
--------------------------------------------------------------------------------------------- 17
--------------------------------------------------- 18
----------------------------- 19
----------------------------------------------------------------------- 19
----------------------------------------------------------------- 19
---------------------------------- 21
--------------------------------------------------------------- 21
--------------------------------------------------------- 21
----------------------------------------------- 22
------------------------------------------------------------------- 22
--------------------------------------------------------------- 22
------------------------------------------------------------------ 23
-------------------------------------------------------------------------------- 23
-------------------------------------------------------- 24
------------------------------------------------------------------------------ 24
----------------------------------------------------------------- 25
------------------------- 25
--------------- 26
------------------------------------------------------------------------------------------------ 27

○ The damage caused to fishery-related facilities (as of March 5, 2012) has reached 1.2637 trillion yen. The
damage in three prefectures, Miyagi, Iwate, and Fukushima, was particularly large, at 668 billion yen, 397.3
billion yen, and 82.4 billion yen, respectively, or 91% of the nationwide total.
○ Fishery-related facilities suffered massive damage, including: (1) fishing ports; (2) fishing vessels; (3) aquaculture
facilities and products; (4) communal facilities (markets, fueling stations, ice making and refrigeration facilities,
salmon hatcheries, seedling production facilities, etc.); and (5) fishery processing plants
○ Debris washed into the sea by the tsunami has adversely affected fishery and aquaculture operations in
many ways.
○ Coastal ecosystems may have been significantly affected by the tsunami and subsidence. Fishery and
marine research institutions have joined forces to comprehensively study and analyze the recovery of
seaweed beds and tidal flats as well as the impact of hazardous substances on the ecosystem.
Fishing port pier destroyed by the
earthquake and tsunami
(Ishinomaki City, Miyagi Prefecture)
*1: Damage was compiled from prefectural reports and are current as of March 5, 2012.
*2: The 7 affected prefectures are Hokkaido, Aomori, Iwate, Miyagi, Fukushima, Ibaraki, and Chiba.
*3: In addition to the damage listed here, there was approximately 160 billion yen in damage to fishery product processing plants
and ice making/refrigeration facilities owned by private companies (Source: Hearings with fishery product processors' associations)
(1) An overview of the damage
○ A magnitude 9.0 earthquake struck off the Sanriku coast on March 11, 2011. The earthquake generated a
tsunami that caused serious damage to the nation’s fishing industry, primarily in the seven prefectures from
Hokkaido to Chiba along the Pacific coast.
○ The tectonic shift that coincided with the earthquake caused land subsidence in the Tohoku and Kanto regions
along the Pacific coast. Fishing ports, markets, and processing plants suffered water damage and flooding.
(2) Damage to the fishing industry
Fishery-related damage caused by the Great East Japan Earthquake and Tsunami (as of March 5, 2012)
Major types of damaged
property
Nationwide 7 Affected Prefectures
Extent of damage Damage (in billion
yen) Extent of damage
Damage (in billion
yen)
Fishing port facilities 319 ports 823.0 319 ports 823.0
Fishing vessels 28,612 vessels 182.2 28,479 vessels 181.2
Aquaculture facilities
and products 133.5 125.4
(Aquaculture facilities) (73.8) (71.9)
(Aquaculture products) (59.7) (53.4)
Communal facilities 1,725 facilities 124.9 1,714 facilities 124.7
Total 1,263.7 1,254.4
Total damage: 1.2637 trillion yen (7 affected prefectures: 1.2544 trillion yen)
Fishing vessel swept ashore by the tsunami
(Kesennuma City, Miyagi Prefecture)
Fish landing facility damaged by the
tsunami
(Miyako City, Iwate Prefecture)
Section 1: Massive damage from the Great East Japan Earthquake and Tsunami
1
Chapter I: [Special Feature] The Great East Japan Earthquake
—The Future of Japan's Fishing Industry in Light of Reconstruction

○ The Ministry of Agriculture, Forestry and Fisheries (MAFF) established the MAFF Earthquake Response
Headquarters on March 11, immediately following the earthquake.
○ The Fisheries Agency’s fishery patrol and research vessels worked with the private sector to transport relief
supplies to the affected areas as part of MAFF's relief efforts.
○ Since the earthquake, fishery-related entities around Japan have provided a variety of support to the affected
areas, including the transportation of emergency relief supplies, the supply of fuel oil by fishery organizations,
and the cooperation of fishery processors in providing food aid.
○ In addition to early recovery initiatives, full-scale reconstruction efforts using funds from the FY2011 supplementary budget
were implemented in accordance with the Fisheries Recovery Master Plan (June 28) and the Basic Disaster Recovery
Policy for the Great East Japan Earthquake (July 29).
Furthermore, the FY2012 budget includes various items focusing on policies aimed at resuming fishery industry operations.
Fishery educational
institutions from around
Japan used their training
vessels to deliver
supplies to the affected
areas.
(Photo: National
Fisheries University's
Koyomaru. In addition to
transporting relief
supplies, the ship’s
dining hall and baths
were provided for
disaster victims’ use).
The Fisheries Agency’s
fishery patrol vessels
formed a convoy with
private boats in order to
provide focused
assistance to isolated
villages around the Oshika
Peninsula in Miyagi
Prefecture.
(Photo: The whale
research fleet's flagship,
Nisshinmaru, loads relief
supplies onto a purse
seiner’s skiff boat.)
Before After
Flooding due
to subsidence
Pier raising
(Kesennuma Fishing Port, Miyagi Prefecture)
Pier raising
Renovation of an ice making facility (Miyako Fishery Cooperative, Iwate Prefecture)
Before After
(1) Emergency response in the wake of the disaster
(2) Implementation of full-scale recovery and reconstruction measures
Reconstruction with Budgeted Projects (Example)
Comprehensive and integrated reconstruction of various sectors constituting the fishing industry
1. Fishing ports ○ Secure the functions necessary for the whole region at an early stage, while sharing
functions among fishing ports
(1) Fishing ports serving as the national production/distribution bases for fish products
(2) Fishing ports serving as the production/distribution bases for local fishing industry
(3) Other fishing ports
7. Fisheries cooperatives ○ Restructure organizations of fisheries cooperatives
that support local fisheries
○ Ensure the soundness of JF marine banks through
capital injections
2. Fishing grounds and resources ○ Support removal of debris from fishing grounds in which early resumption
of fishing activities should be prioritized
○ Continuous research on the fishing ground environment
6. Fishery business management ○ Secure employment opportunities for affected fishers through
removal of debris, etc. ○ Promote coordination between local fishers and private
companies
8. Fishing communities ○ Promote disaster-resistant fishing communities while
respecting the wishes of local residents ○ Secure optimum disaster prevention capabilities
according to the circumstances of fishing communities ○ Promote implementation of more ecological operations
and the creation of a sixth industry 4. Aquaculture and stock enhancement ○ Promote joint or collaborative operations in order to foster highly productive
aquaculture operators ○ Reconstruct system for producing and releasing seedlings of salmon, etc.
3. Fishing vessels and fisheries management ○ Promote modernization and rationalization of fishing vessels and fleets ○ Introduce fishing vessels for joint use, and promote joint and
collaborative operations ○ Ensure supply of fish products through measures to respond to fuel
price hikes, etc.
5. Fishery processing and distribution ○ Promote integration of facilities or formation of facility complex according to local wishes ○ Support creation of a sixth industry and the improvement of quality and sanitation management ○ Restructure landing area markets in a manner consistent with the reconstruction of fishing ports
Promote reconstruction of Japan’s
fisheries as a whole by taking care of
various sectors constituting the fishing
industry and considering the local wishes
Response to the nuclear power plant accident ○ Strengthen national government’s efforts for tackling the
accident, including promoting inspections for
radioactive materials contained in fish products
○ Disseminate food safety information overseas
Section 2: Recovery and reconstruction efforts in the fishing industry
2
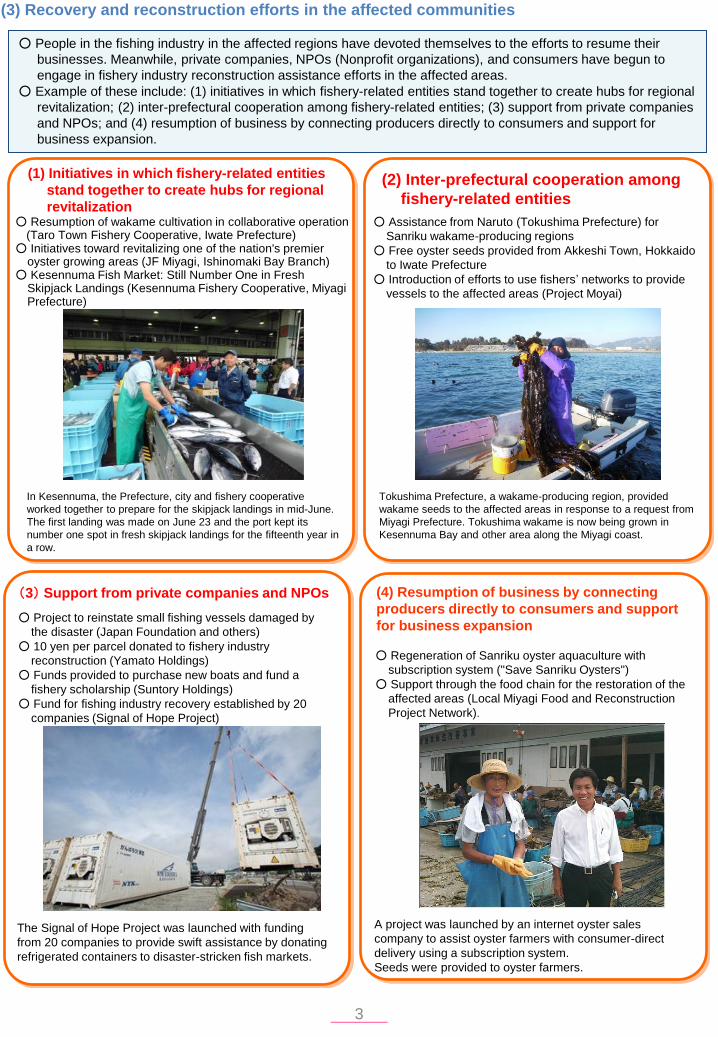
(3) Recovery and reconstruction efforts in the affected communities
○ People in the fishing industry in the affected regions have devoted themselves to the efforts to resume their
businesses. Meanwhile, private companies, NPOs (Nonprofit organizations), and consumers have begun to
engage in fishery industry reconstruction assistance efforts in the affected areas.
○ Example of these include: (1) initiatives in which fishery-related entities stand together to create hubs for regional
revitalization; (2) inter-prefectural cooperation among fishery-related entities; (3) support from private companies
and NPOs; and (4) resumption of business by connecting producers directly to consumers and support for
business expansion.
(1) Initiatives in which fishery-related entities
stand together to create hubs for regional
revitalization ○ Resumption of wakame cultivation in collaborative operation
(Taro Town Fishery Cooperative, Iwate Prefecture) ○ Initiatives toward revitalizing one of the nation's premier
oyster growing areas (JF Miyagi, Ishinomaki Bay Branch) ○ Kesennuma Fish Market: Still Number One in Fresh
Skipjack Landings (Kesennuma Fishery Cooperative, Miyagi Prefecture)
In Kesennuma, the Prefecture, city and fishery cooperative
worked together to prepare for the skipjack landings in mid-June.
The first landing was made on June 23 and the port kept its
number one spot in fresh skipjack landings for the fifteenth year in
a row.
(2) Inter-prefectural cooperation among
fishery-related entities
○ Assistance from Naruto (Tokushima Prefecture) for
Sanriku wakame-producing regions
○ Free oyster seeds provided from Akkeshi Town, Hokkaido
to Iwate Prefecture
○ Introduction of efforts to use fishers’ networks to provide
vessels to the affected areas (Project Moyai)
Tokushima Prefecture, a wakame-producing region, provided
wakame seeds to the affected areas in response to a request from
Miyagi Prefecture. Tokushima wakame is now being grown in
Kesennuma Bay and other area along the Miyagi coast.
(3) Support from private companies and NPOs
○ Project to reinstate small fishing vessels damaged by
the disaster (Japan Foundation and others)
○ 10 yen per parcel donated to fishery industry
reconstruction (Yamato Holdings)
○ Funds provided to purchase new boats and fund a
fishery scholarship (Suntory Holdings)
○ Fund for fishing industry recovery established by 20
companies (Signal of Hope Project)
The Signal of Hope Project was launched with funding
from 20 companies to provide swift assistance by donating
refrigerated containers to disaster-stricken fish markets.
(4) Resumption of business by connecting
producers directly to consumers and support
for business expansion
○ Regeneration of Sanriku oyster aquaculture with
subscription system ("Save Sanriku Oysters")
○ Support through the food chain for the restoration of the
affected areas (Local Miyagi Food and Reconstruction
Project Network).
A project was launched by an internet oyster sales
company to assist oyster farmers with consumer-direct
delivery using a subscription system.
Seeds were provided to oyster farmers.
3
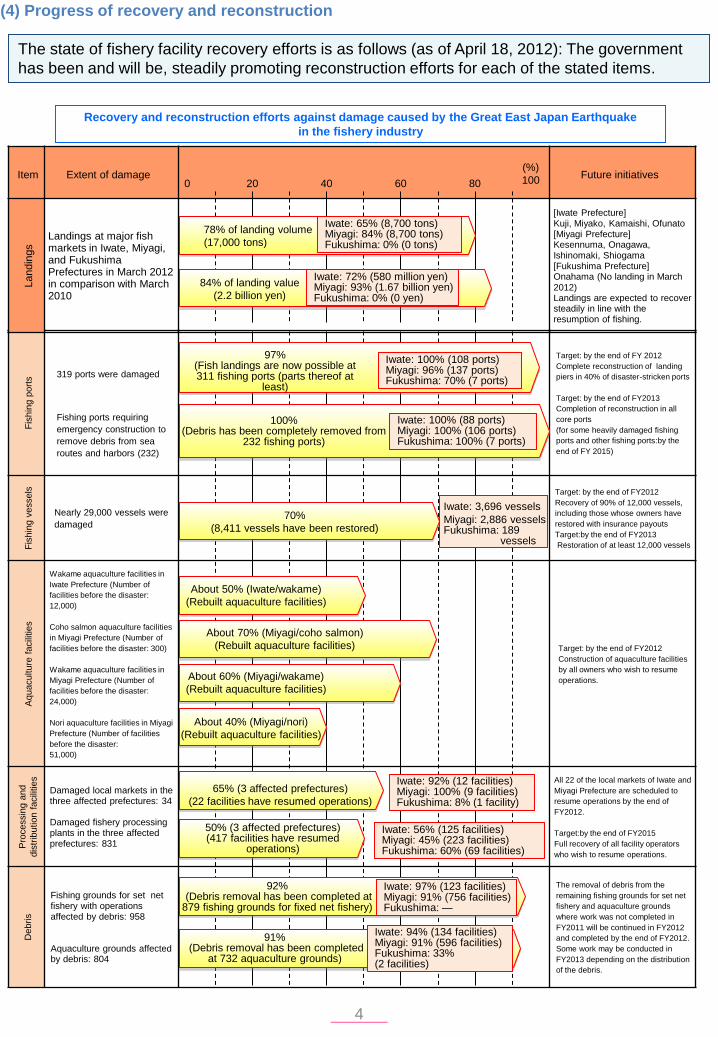
The state of fishery facility recovery efforts is as follows (as of April 18, 2012): The government
has been and will be, steadily promoting reconstruction efforts for each of the stated items.
(4) Progress of recovery and reconstruction F
ishin
g p
ort
s
319 ports were damaged
Fishing ports requiring
emergency construction to
remove debris from sea
routes and harbors (232)
Target: by the end of FY 2012
Complete reconstruction of landing
piers in 40% of disaster-stricken ports
Target: by the end of FY2013
Completion of reconstruction in all
core ports
(for some heavily damaged fishing
ports and other fishing ports:by the
end of FY 2015)
Fis
hin
g v
essels
Nearly 29,000 vessels were
damaged
Target: by the end of FY2012
Recovery of 90% of 12,000 vessels,
including those whose owners have
restored with insurance payouts
Target:by the end of FY2013
Restoration of at least 12,000 vessels
Aquaculture
facili
ties
Wakame aquaculture facilities in
Iwate Prefecture (Number of
facilities before the disaster:
12,000)
Coho salmon aquaculture facilities
in Miyagi Prefecture (Number of
facilities before the disaster: 300)
Wakame aquaculture facilities in
Miyagi Prefecture (Number of
facilities before the disaster:
24,000)
Nori aquaculture facilities in Miyagi
Prefecture (Number of facilities
before the disaster:
51,000)
Target: by the end of FY2012
Construction of aquaculture facilities
by all owners who wish to resume
operations.
Pro
cessin
g a
nd
dis
trib
ution f
acili
ties
Damaged local markets in the three affected prefectures: 34 Damaged fishery processing plants in the three affected prefectures: 831
All 22 of the local markets of Iwate and
Miyagi Prefecture are scheduled to
resume operations by the end of
FY2012.
Target:by the end of FY2015
Full recovery of all facility operators
who wish to resume operations.
Debris
Fishing grounds for set net fishery with operations affected by debris: 958 Aquaculture grounds affected by debris: 804
The removal of debris from the
remaining fishing grounds for set net
fishery and aquaculture grounds
where work was not completed in
FY2011 will be continued in FY2012
and completed by the end of FY2012.
Some work may be conducted in
FY2013 depending on the distribution
of the debris.
Item Extent of damage Future initiatives
Landin
gs Landings at major fish
markets in Iwate, Miyagi, and Fukushima Prefectures in March 2012 in comparison with March 2010
[Iwate Prefecture] Kuji, Miyako, Kamaishi, Ofunato [Miyagi Prefecture] Kesennuma, Onagawa, Ishinomaki, Shiogama [Fukushima Prefecture] Onahama (No landing in March 2012) Landings are expected to recover steadily in line with the resumption of fishing.
0 20 40 60 80
(%)
100
Recovery and reconstruction efforts against damage caused by the Great East Japan Earthquake
in the fishery industry
84% of landing value
(2.2 billion yen)
Iwate: 65% (8,700 tons) Miyagi: 84% (8,700 tons) Fukushima: 0% (0 tons)
Iwate: 72% (580 million yen) Miyagi: 93% (1.67 billion yen) Fukushima: 0% (0 yen)
About 40% (Miyagi/nori)
(Rebuilt aquaculture facilities)
Iwate: 3,696 vessels
Miyagi: 2,886 vessels Fukushima: 189
vessels
97% (Fish landings are now possible at 311 fishing ports (parts thereof at
least)
Iwate: 100% (108 ports) Miyagi: 96% (137 ports) Fukushima: 70% (7 ports)
100% (Debris has been completely removed from
232 fishing ports)
Iwate: 100% (88 ports) Miyagi: 100% (106 ports) Fukushima: 100% (7 ports)
Iwate: 97% (123 facilities) Miyagi: 91% (756 facilities) Fukushima: —
92% (Debris removal has been completed at 879 fishing grounds for fixed net fishery)
91% (Debris removal has been completed
at 732 aquaculture grounds)
Iwate: 94% (134 facilities) Miyagi: 91% (596 facilities) Fukushima: 33% (2 facilities)
50% (3 affected prefectures) (417 facilities have resumed
operations)
Iwate: 56% (125 facilities) Miyagi: 45% (223 facilities) Fukushima: 60% (69 facilities)
Iwate: 92% (12 facilities) Miyagi: 100% (9 facilities) Fukushima: 8% (1 facility)
78% of landing volume
(17,000 tons)
70%
(8,411 vessels have been restored)
About 50% (Iwate/wakame)
(Rebuilt aquaculture facilities)
About 70% (Miyagi/coho salmon)
(Rebuilt aquaculture facilities)
65% (3 affected prefectures)
(22 facilities have resumed operations)
About 60% (Miyagi/wakame)
(Rebuilt aquaculture facilities)
4
38%
Hokkaido
Aomori
Iwate
Miyagi
2010 Aquaculture
production volume 1.11 million tons
Other
53%
Hokkaido
Aomori
Iwate
Miyagi Fukushima
Ibaraki Chiba
2010 Ocean fishery catch volume
4.12 million tons
Other
Source: Drafted by the Fisheries Agency based on Japan Fisheries
Information Center (JAFIC) documents
Source: Ministry of Internal Affairs and Communications, Retail
Price Survey
Note: Survey only covers the months of March through October.
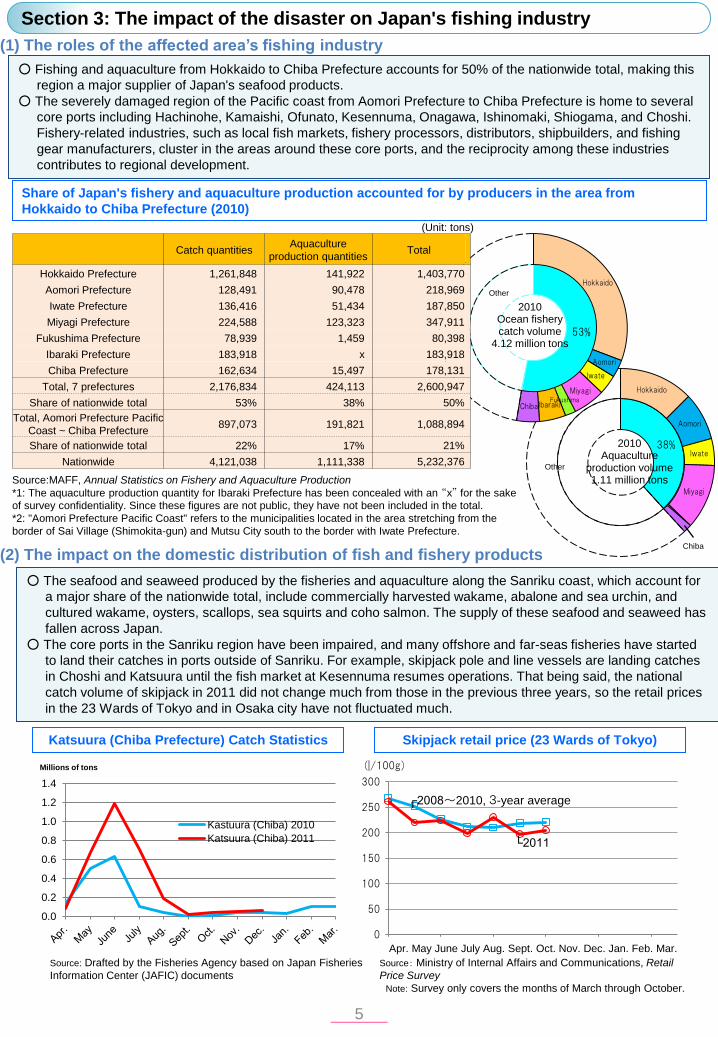
(1) The roles of the affected area’s fishing industry
(2) The impact on the domestic distribution of fish and fishery products
Source:MAFF, Annual Statistics on Fishery and Aquaculture Production
*1: The aquaculture production quantity for Ibaraki Prefecture has been concealed with an “x” for the sake
of survey confidentiality. Since these figures are not public, they have not been included in the total.
*2: "Aomori Prefecture Pacific Coast" refers to the municipalities located in the area stretching from the
border of Sai Village (Shimokita-gun) and Mutsu City south to the border with Iwate Prefecture.
Catch quantities Aquaculture
production quantities Total
Hokkaido Prefecture 1,261,848 141,922 1,403,770
Aomori Prefecture 128,491 90,478 218,969
Iwate Prefecture 136,416 51,434 187,850
Miyagi Prefecture 224,588 123,323 347,911
Fukushima Prefecture 78,939 1,459 80,398
Ibaraki Prefecture 183,918 x 183,918
Chiba Prefecture 162,634 15,497 178,131
Total, 7 prefectures 2,176,834 424,113 2,600,947
Share of nationwide total 53% 38% 50%
Total, Aomori Prefecture Pacific
Coast ~ Chiba Prefecture 897,073 191,821 1,088,894
Share of nationwide total 22% 17% 21%
Nationwide 4,121,038 1,111,338 5,232,376
(Unit: tons)
○ Fishing and aquaculture from Hokkaido to Chiba Prefecture accounts for 50% of the nationwide total, making this
region a major supplier of Japan's seafood products.
○ The severely damaged region of the Pacific coast from Aomori Prefecture to Chiba Prefecture is home to several
core ports including Hachinohe, Kamaishi, Ofunato, Kesennuma, Onagawa, Ishinomaki, Shiogama, and Choshi.
Fishery-related industries, such as local fish markets, fishery processors, distributors, shipbuilders, and fishing
gear manufacturers, cluster in the areas around these core ports, and the reciprocity among these industries
contributes to regional development.
○ The seafood and seaweed produced by the fisheries and aquaculture along the Sanriku coast, which account for
a major share of the nationwide total, include commercially harvested wakame, abalone and sea urchin, and
cultured wakame, oysters, scallops, sea squirts and coho salmon. The supply of these seafood and seaweed has
fallen across Japan.
○ The core ports in the Sanriku region have been impaired, and many offshore and far-seas fisheries have started
to land their catches in ports outside of Sanriku. For example, skipjack pole and line vessels are landing catches
in Choshi and Katsuura until the fish market at Kesennuma resumes operations. That being said, the national
catch volume of skipjack in 2011 did not change much from those in the previous three years, so the retail prices
in the 23 Wards of Tokyo and in Osaka city have not fluctuated much.
Share of Japan's fishery and aquaculture production accounted for by producers in the area from
Hokkaido to Chiba Prefecture (2010)
Katsuura (Chiba Prefecture) Catch Statistics Skipjack retail price (23 Wards of Tokyo)
0
50
100
150
200
250
300
4 5 6 7 8 9 10 11 12 1 2 3月
(|/100g)
┌2008~2010, 3-year average
└2011
Section 3: The impact of the disaster on Japan's fishing industry
5
0.0
0.2
0.4
0.6
0.8
1.0
1.2
1.4
Kastuura (Chiba) 2010
Katsuura (Chiba) 2011
Millions of tons
Apr. May June July Aug. Sept. Oct. Nov. Dec. Jan. Feb. Mar.
Chiba
(3) The impact on the fishery processing industry
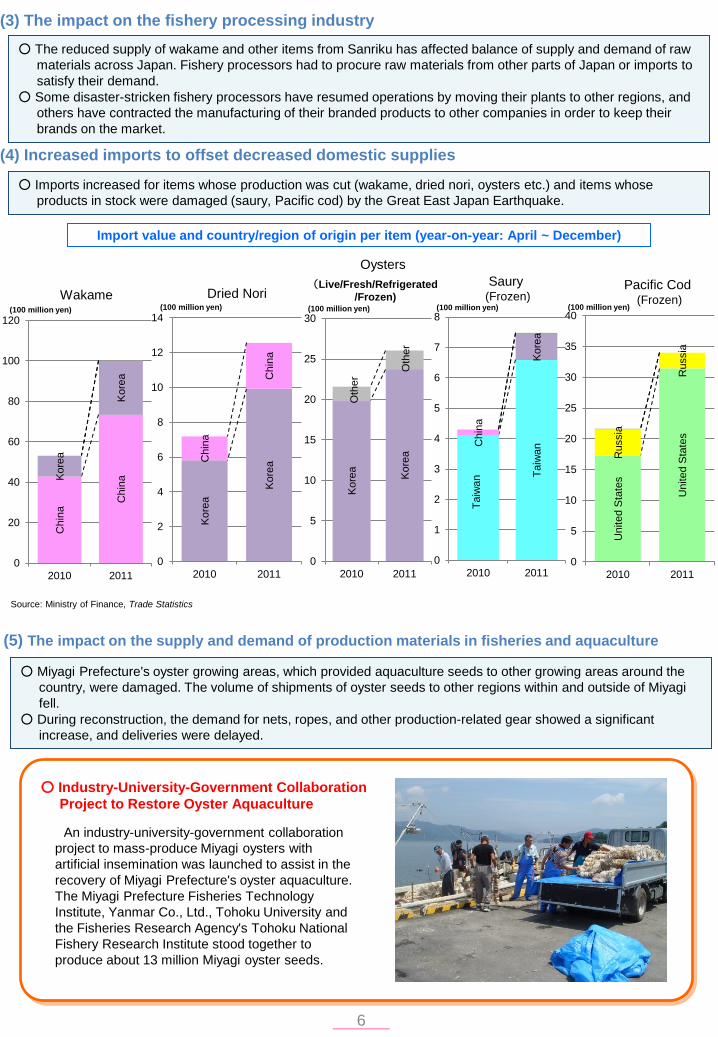
(4) Increased imports to offset decreased domestic supplies
(5) The impact on the supply and demand of production materials in fisheries and aquaculture
Source: Ministry of Finance, Trade Statistics
An industry-university-government collaboration
project to mass-produce Miyagi oysters with
artificial insemination was launched to assist in the
recovery of Miyagi Prefecture's oyster aquaculture.
The Miyagi Prefecture Fisheries Technology
Institute, Yanmar Co., Ltd., Tohoku University and
the Fisheries Research Agency's Tohoku National
Fishery Research Institute stood together to
produce about 13 million Miyagi oyster seeds.
○ Industry-University-Government Collaboration
Project to Restore Oyster Aquaculture
○ The reduced supply of wakame and other items from Sanriku has affected balance of supply and demand of raw
materials across Japan. Fishery processors had to procure raw materials from other parts of Japan or imports to
satisfy their demand.
○ Some disaster-stricken fishery processors have resumed operations by moving their plants to other regions, and
others have contracted the manufacturing of their branded products to other companies in order to keep their
brands on the market.
○ Imports increased for items whose production was cut (wakame, dried nori, oysters etc.) and items whose
products in stock were damaged (saury, Pacific cod) by the Great East Japan Earthquake.
Import value and country/region of origin per item (year-on-year: April ~ December)
○ Miyagi Prefecture's oyster growing areas, which provided aquaculture seeds to other growing areas around the
country, were damaged. The volume of shipments of oyster seeds to other regions within and outside of Miyagi
fell.
○ During reconstruction, the demand for nets, ropes, and other production-related gear showed a significant
increase, and deliveries were delayed.
6
United S
tate
s
United S
tate
s
Russia
Russia
0
5
10
15
20
25
30
35
40
2010 2011
Ta
iwan Ta
iwan Chin
a
Kore
a
0
1
2
3
4
5
6
7
8
2010 2011
Kore
a
Kore
a
Oth
er
Oth
er
0
5
10
15
20
25
30
2010 2011
Kore
a
Kore
a C
hin
a
Chin
a
0
2
4
6
8
10
12
14
2010 2011
Chin
a C
hin
a
Kore
a
Kore
a
0
20
40
60
80
100
120
2010 2011
Pacific Cod (Frozen)
Saury (Frozen) Dried Nori Wakame
Oysters
(Live/Fresh/Refrigerated
/Frozen) (100 million yen) (100 million yen) (100 million yen) (100 million yen) (100 million yen)
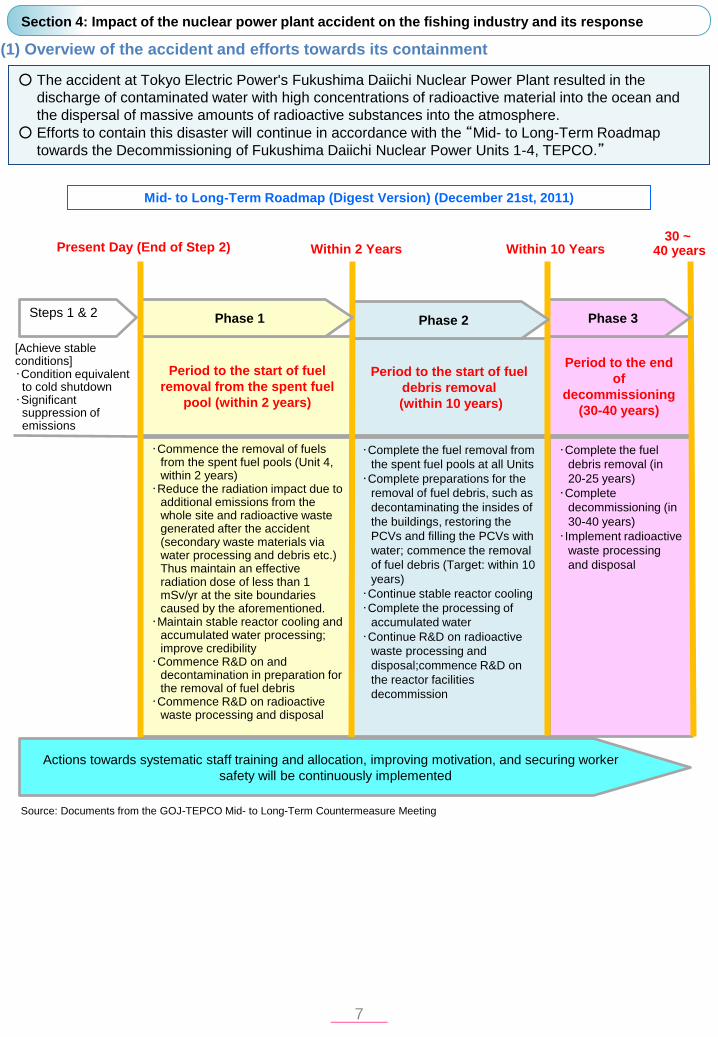
(1) Overview of the accident and efforts towards its containment
○ The accident at Tokyo Electric Power's Fukushima Daiichi Nuclear Power Plant resulted in the
discharge of contaminated water with high concentrations of radioactive material into the ocean and
the dispersal of massive amounts of radioactive substances into the atmosphere.
○ Efforts to contain this disaster will continue in accordance with the “Mid- to Long-Term Roadmap
towards the Decommissioning of Fukushima Daiichi Nuclear Power Units 1-4, TEPCO.”
Mid- to Long-Term Roadmap (Digest Version) (December 21st, 2011)
Source: Documents from the GOJ-TEPCO Mid- to Long-Term Countermeasure Meeting
Period to the start of fuel
removal from the spent fuel
pool (within 2 years)
・Commence the removal of fuels from the spent fuel pools (Unit 4, within 2 years)
・Reduce the radiation impact due to additional emissions from the whole site and radioactive waste generated after the accident (secondary waste materials via water processing and debris etc.) Thus maintain an effective radiation dose of less than 1 mSv/yr at the site boundaries caused by the aforementioned.
・Maintain stable reactor cooling and accumulated water processing; improve credibility
・Commence R&D on and decontamination in preparation for the removal of fuel debris
・Commence R&D on radioactive waste processing and disposal
Period to the start of fuel
debris removal
(within 10 years)
・Complete the fuel removal from
the spent fuel pools at all Units
・Complete preparations for the
removal of fuel debris, such as
decontaminating the insides of
the buildings, restoring the
PCVs and filling the PCVs with
water; commence the removal
of fuel debris (Target: within 10
years)
・Continue stable reactor cooling
・Complete the processing of
accumulated water
・Continue R&D on radioactive
waste processing and
disposal;commence R&D on
the reactor facilities
decommission
Period to the end
of
decommissioning
(30-40 years)
・Complete the fuel
debris removal (in
20-25 years)
・Complete
decommissioning (in
30-40 years)
・Implement radioactive
waste processing
and disposal
Within 2 Years Within 10 Years 30 ~
40 years
Phase 3 Phase 2 Phase 1 Steps 1 & 2
Actions towards systematic staff training and allocation, improving motivation, and securing worker
safety will be continuously implemented
[Achieve stable conditions] ・Condition equivalent
to cold shutdown ・Significant
suppression of emissions
Present Day (End of Step 2)
Section 4: Impact of the nuclear power plant accident on the fishing industry and its response
7
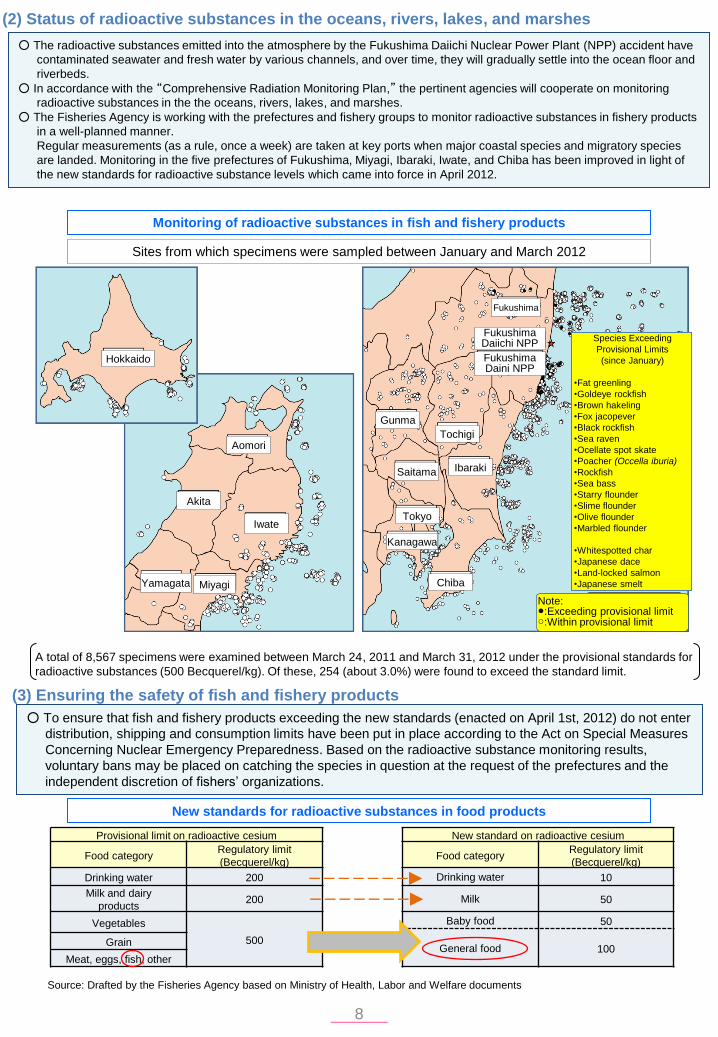
A total of 8,567 specimens were examined between March 24, 2011 and March 31, 2012 under the provisional standards for
radioactive substances (500 Becquerel/kg). Of these, 254 (about 3.0%) were found to exceed the standard limit.
(2) Status of radioactive substances in the oceans, rivers, lakes, and marshes
(3) Ensuring the safety of fish and fishery products
○ The radioactive substances emitted into the atmosphere by the Fukushima Daiichi Nuclear Power Plant (NPP) accident have
contaminated seawater and fresh water by various channels, and over time, they will gradually settle into the ocean floor and
riverbeds.
○ In accordance with the “Comprehensive Radiation Monitoring Plan,” the pertinent agencies will cooperate on monitoring
radioactive substances in the the oceans, rivers, lakes, and marshes.
○ The Fisheries Agency is working with the prefectures and fishery groups to monitor radioactive substances in fishery products
in a well-planned manner.
Regular measurements (as a rule, once a week) are taken at key ports when major coastal species and migratory species
are landed. Monitoring in the five prefectures of Fukushima, Miyagi, Ibaraki, Iwate, and Chiba has been improved in light of
the new standards for radioactive substance levels which came into force in April 2012.
Monitoring of radioactive substances in fish and fishery products
Sites from which specimens were sampled between January and March 2012
Aomori
Hokkaido
Species Exceeding
Provisional Limits
(since January)
•Fat greenling
•Goldeye rockfish
•Brown hakeling
•Fox jacopever
•Black rockfish
•Sea raven
•Ocellate spot skate
•Poacher (Occella iburia)
•Rockfish
•Sea bass
•Starry flounder
•Slime flounder
•Olive flounder
•Marbled flounder
•Whitespotted char
•Japanese dace
•Land-locked salmon
•Japanese smelt
○ To ensure that fish and fishery products exceeding the new standards (enacted on April 1st, 2012) do not enter
distribution, shipping and consumption limits have been put in place according to the Act on Special Measures
Concerning Nuclear Emergency Preparedness. Based on the radioactive substance monitoring results,
voluntary bans may be placed on catching the species in question at the request of the prefectures and the
independent discretion of fishers’ organizations.
New standards for radioactive substances in food products
Provisional limit on radioactive cesium New standard on radioactive cesium
Food category Regulatory limit
(Becquerel/kg) Food category
Regulatory limit
(Becquerel/kg)
Drinking water 200 Drinking water 10
Milk and dairy
products 200 Milk 50
Vegetables
500
Baby food 50
General food 100 Grain
Meat, eggs, fish, other
8
Source: Drafted by the Fisheries Agency based on Ministry of Health, Labor and Welfare documents
Akita
Iwate
Yamagata Miyagi
Fukushima
Fukushima Daiichi NPP
Fukushima Daini NPP
Gunma
Tochigi
Ibaraki Saitama
Tokyo
Kanagawa
Chiba
Note: ●:Exceeding provisional limit ○:Within provisional limit
(2) Northern
Sanriku, offshore
(3) Southern
Sanriku, offshore
(4)Fukushima,
offshore
(5) Hitachi-
Kashima, offshore
(1) Hokkaido/Aomori Prefecture,
offshore Pacific
(6) Boso, offshore
Chiba Prefecture
Nojimazaki, Due
East Line
200 nautical miles
from the mainland
Aomori Prefecture/Iwate
Prefecture
Border, Due East Line
Iwate Prefecture/Miyagi
Prefecture Border, Due
East Line
Fukushima Prefecture/Ibaraki
Prefecture
Border, Due East Line
Miyagi Prefecture/Fukushima
Prefecture
Border, Due East Line
Ibaraki Prefecture/Chiba
Prefecture
Border, Due East Line
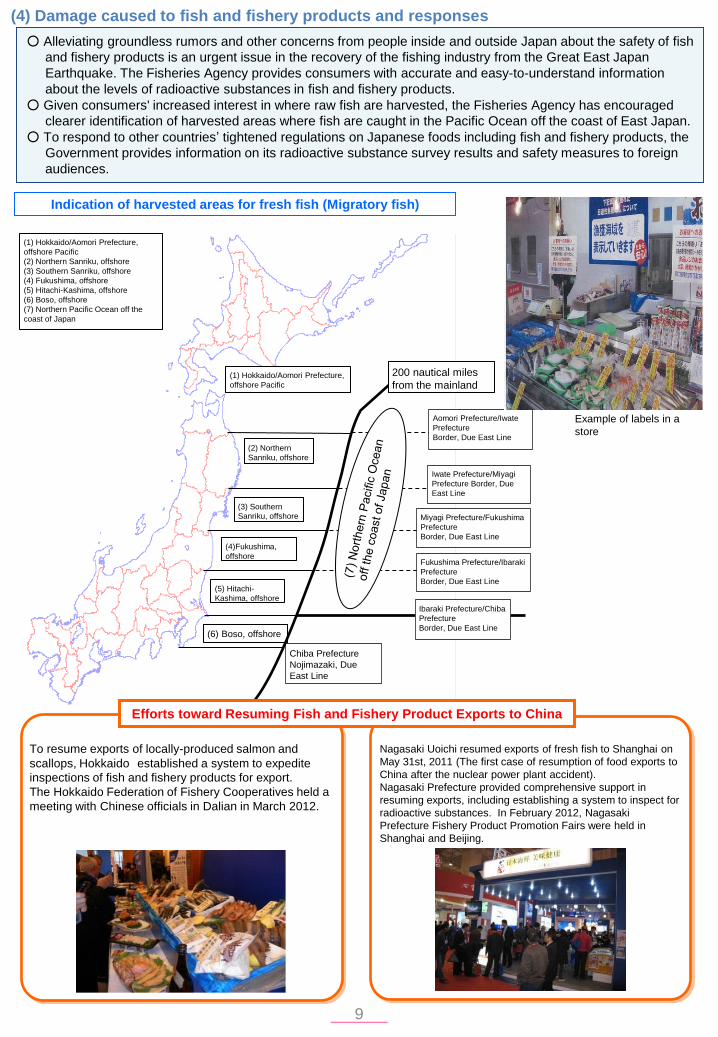
(4) Damage caused to fish and fishery products and responses
○ Alleviating groundless rumors and other concerns from people inside and outside Japan about the safety of fish
and fishery products is an urgent issue in the recovery of the fishing industry from the Great East Japan
Earthquake. The Fisheries Agency provides consumers with accurate and easy-to-understand information
about the levels of radioactive substances in fish and fishery products.
○ Given consumers' increased interest in where raw fish are harvested, the Fisheries Agency has encouraged
clearer identification of harvested areas where fish are caught in the Pacific Ocean off the coast of East Japan.
○ To respond to other countries’ tightened regulations on Japanese foods including fish and fishery products, the
Government provides information on its radioactive substance survey results and safety measures to foreign
audiences.
Indication of harvested areas for fresh fish (Migratory fish)
Example of labels in a
store
(1) Hokkaido/Aomori Prefecture,
offshore Pacific
(2) Northern Sanriku, offshore
(3) Southern Sanriku, offshore
(4) Fukushima, offshore
(5) Hitachi-Kashima, offshore
(6) Boso, offshore
(7) Northern Pacific Ocean off the
coast of Japan
Efforts toward Resuming Fish and Fishery Product Exports to China
To resume exports of locally-produced salmon and
scallops, Hokkaido established a system to expedite
inspections of fish and fishery products for export.
The Hokkaido Federation of Fishery Cooperatives held a
meeting with Chinese officials in Dalian in March 2012.
Nagasaki Uoichi resumed exports of fresh fish to Shanghai on
May 31st, 2011 (The first case of resumption of food exports to
China after the nuclear power plant accident).
Nagasaki Prefecture provided comprehensive support in
resuming exports, including establishing a system to inspect for
radioactive substances. In February 2012, Nagasaki
Prefecture Fishery Product Promotion Fairs were held in
Shanghai and Beijing.
9
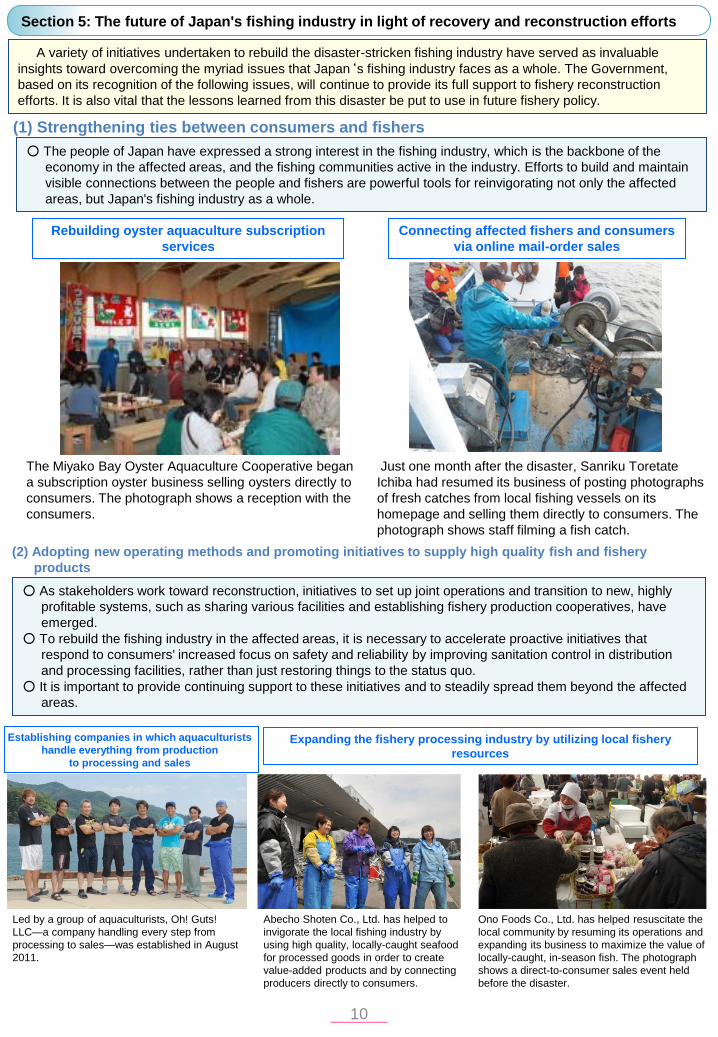
A variety of initiatives undertaken to rebuild the disaster-stricken fishing industry have served as invaluable
insights toward overcoming the myriad issues that Japan‘s fishing industry faces as a whole. The Government,
based on its recognition of the following issues, will continue to provide its full support to fishery reconstruction
efforts. It is also vital that the lessons learned from this disaster be put to use in future fishery policy.
Abecho Shoten Co., Ltd. has helped to
invigorate the local fishing industry by
using high quality, locally-caught seafood
for processed goods in order to create
value-added products and by connecting
producers directly to consumers.
Just one month after the disaster, Sanriku Toretate
Ichiba had resumed its business of posting photographs
of fresh catches from local fishing vessels on its
homepage and selling them directly to consumers. The
photograph shows staff filming a fish catch.
Led by a group of aquaculturists, Oh! Guts!
LLC—a company handling every step from
processing to sales—was established in August
2011.
The Miyako Bay Oyster Aquaculture Cooperative began
a subscription oyster business selling oysters directly to
consumers. The photograph shows a reception with the
consumers.
(1) Strengthening ties between consumers and fishers
(2) Adopting new operating methods and promoting initiatives to supply high quality fish and fishery
products
Ono Foods Co., Ltd. has helped resuscitate the
local community by resuming its operations and
expanding its business to maximize the value of
locally-caught, in-season fish. The photograph
shows a direct-to-consumer sales event held
before the disaster.
○ The people of Japan have expressed a strong interest in the fishing industry, which is the backbone of the
economy in the affected areas, and the fishing communities active in the industry. Efforts to build and maintain
visible connections between the people and fishers are powerful tools for reinvigorating not only the affected
areas, but Japan's fishing industry as a whole.
Rebuilding oyster aquaculture subscription
services
Connecting affected fishers and consumers
via online mail-order sales
○ As stakeholders work toward reconstruction, initiatives to set up joint operations and transition to new, highly
profitable systems, such as sharing various facilities and establishing fishery production cooperatives, have
emerged.
○ To rebuild the fishing industry in the affected areas, it is necessary to accelerate proactive initiatives that
respond to consumers' increased focus on safety and reliability by improving sanitation control in distribution
and processing facilities, rather than just restoring things to the status quo.
○ It is important to provide continuing support to these initiatives and to steadily spread them beyond the affected
areas.
Establishing companies in which aquaculturists
handle everything from production
to processing and sales
Expanding the fishery processing industry by utilizing local fishery
resources
Section 5: The future of Japan's fishing industry in light of recovery and reconstruction efforts
10
Voluntary ban on landing of the said species
(Fish and Fishery product monitoring)
Supplied to the market as usual
* This is an illustration of the basic policy. Some fishers’ groups may make their own decisions about the radiation levels subject to voluntary bans.
Species exceeding the standard
level Species at or below the standard
level
Shipment and consumption restrictions imposed as per the Act on Special Measures Concerning Nuclear Emergency Preparedness
Species exceeding the standard level is found in a certain extent of water
Tsunami overturns or scatters
breakwaters
Tsu
na
mi-
resis
tan
t
bre
akw
ate
r
Wave
overtopping
Earth
pressure
Riprap
piles up
Example
Lateral force
of wave
overtopping
Anti-scouring
Suppress sliding and falling with
passive earth
pressure and anti-scouring
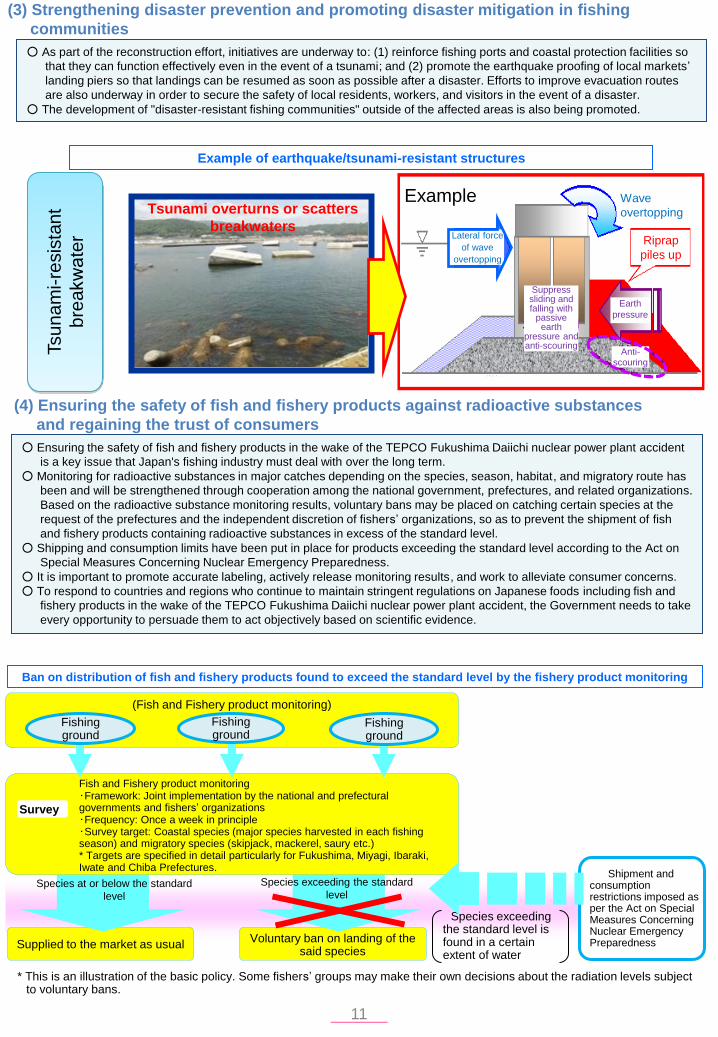
(3) Strengthening disaster prevention and promoting disaster mitigation in fishing
communities
(4) Ensuring the safety of fish and fishery products against radioactive substances
and regaining the trust of consumers
○ As part of the reconstruction effort, initiatives are underway to: (1) reinforce fishing ports and coastal protection facilities so
that they can function effectively even in the event of a tsunami; and (2) promote the earthquake proofing of local markets’
landing piers so that landings can be resumed as soon as possible after a disaster. Efforts to improve evacuation routes
are also underway in order to secure the safety of local residents, workers, and visitors in the event of a disaster.
○ The development of "disaster-resistant fishing communities" outside of the affected areas is also being promoted.
Example of earthquake/tsunami-resistant structures
○ Ensuring the safety of fish and fishery products in the wake of the TEPCO Fukushima Daiichi nuclear power plant accident
is a key issue that Japan's fishing industry must deal with over the long term.
○ Monitoring for radioactive substances in major catches depending on the species, season, habitat, and migratory route has
been and will be strengthened through cooperation among the national government, prefectures, and related organizations.
Based on the radioactive substance monitoring results, voluntary bans may be placed on catching certain species at the
request of the prefectures and the independent discretion of fishers’ organizations, so as to prevent the shipment of fish
and fishery products containing radioactive substances in excess of the standard level.
○ Shipping and consumption limits have been put in place for products exceeding the standard level according to the Act on
Special Measures Concerning Nuclear Emergency Preparedness.
○ It is important to promote accurate labeling, actively release monitoring results, and work to alleviate consumer concerns.
○ To respond to countries and regions who continue to maintain stringent regulations on Japanese foods including fish and
fishery products in the wake of the TEPCO Fukushima Daiichi nuclear power plant accident, the Government needs to take
every opportunity to persuade them to act objectively based on scientific evidence.
Ban on distribution of fish and fishery products found to exceed the standard level by the fishery product monitoring
Fish and Fishery product monitoring ・Framework: Joint implementation by the national and prefectural governments and fishers’ organizations ・Frequency: Once a week in principle ・Survey target: Coastal species (major species harvested in each fishing season) and migratory species (skipjack, mackerel, saury etc.) * Targets are specified in detail particularly for Fukushima, Miyagi, Ibaraki, Iwate and Chiba Prefectures.
Fishing ground
Fishing ground
Fishing ground
Survey
11

Chapter II: Review of Japan's Fisheries since FY2010
(1) Trends in fish and fishery product supply and demand
FY2000 FY2010 (Estimates)
(2) Trends in fish and fishery product consumption
(Expanding gap in the levels of meat and fish and fishery product consumption)
○ The New Basic Plan for Fisheries formulated in March 2012 defines recovery from the Great East Japan
Earthquake as its top priority. It also calls for: (a) the full utilization of fishery resources primarily from the
waters surrounding Japan, positioning resource management/fishery income compensation measures as a
core policy; (b) the promotion of measures, including the creation of sixth industries and the improvement
of sanitation control, in order to enhance processing, distribution, and consumption; and (c) the
development of safe fishing communities.
○ The Plan sets the self-sufficiency rate of fish and fishery products for human consumption in 2022 at 70%.
○ The supply of fish and fishery product for domestic human consumption in FY2010 fell 20%
compared to FY2000.
Changes in the structure of production and consumption of fish and fishery products
Source: MAFF, Food Supply and Demand (FY2000); FY2010 Fisheries Agency survey
Source: Ministry of Health, Labor and Welfare, National Nutrition Survey (2000-2002); National Health and Nutrition Examination Survey (2003-2010)
○ Daily fish and fishery product consumption per capita continues to decline. In 2006, meat consumption
surpassed fish consumption for the first time. The gap between meat and fish consumption grew in
2009 and 2010.
Daily levels of meat and fish consumption per capita
Introduction: The New Basic Plan for Fisheries
Section 1: Trends in fish and fishery product consumption, supply, and demand
12
78.2 76.3 77.5 76.9 77.9 80.2 80.4
82.6
77.7
82.9 82.5
92.0 94.0
88.2 86.7 82.6 84.0
80.2
80.2
78.5
74.2 72.5
50
60
70
80
90
100
2000 2001 2002 2003 2004 2005 2006 2007 2008 2009 2010
Meat
Fish
g per capita/day
Unit: 10,000 tons Unit: 10,000 tons
Domestic
production 574
For food 452
For uses other
than food 122
Export 26 For food 25
For uses other than food 1
For uses other than food Domestic consumption
Supplies 228
Supplies for domestic
consumption 1,081
For food Supplies for
domestic consumption
853
Import 588
For food 425 For uses other than food 163
Increase in inventory
54 For food -2
For uses other
than food 56
Annual supplies of edible seafood (per capita)
[Live weight equivalent] 67.2kg
[Edible portion] 37.2kg
Export 73 For food 70
For uses other than food 3
For uses other than food Domestic consumption
Supplies 206
Supplies for domestic
consumption 886
For food Supplies for
domestic consumption
680
Import 484
For food 327 For uses other than food 157
Increase in inventory
-1 For food -14
For uses other
than food 13
Annual supplies of edible seafood (per capita)
[Live weight equivalent] 53.1kg
[Edible portion] 29.5kg
Domestic
production 474
For food 409
For uses other
than food 65
Source: Standard Tables of Food Composition in Japan, 2010
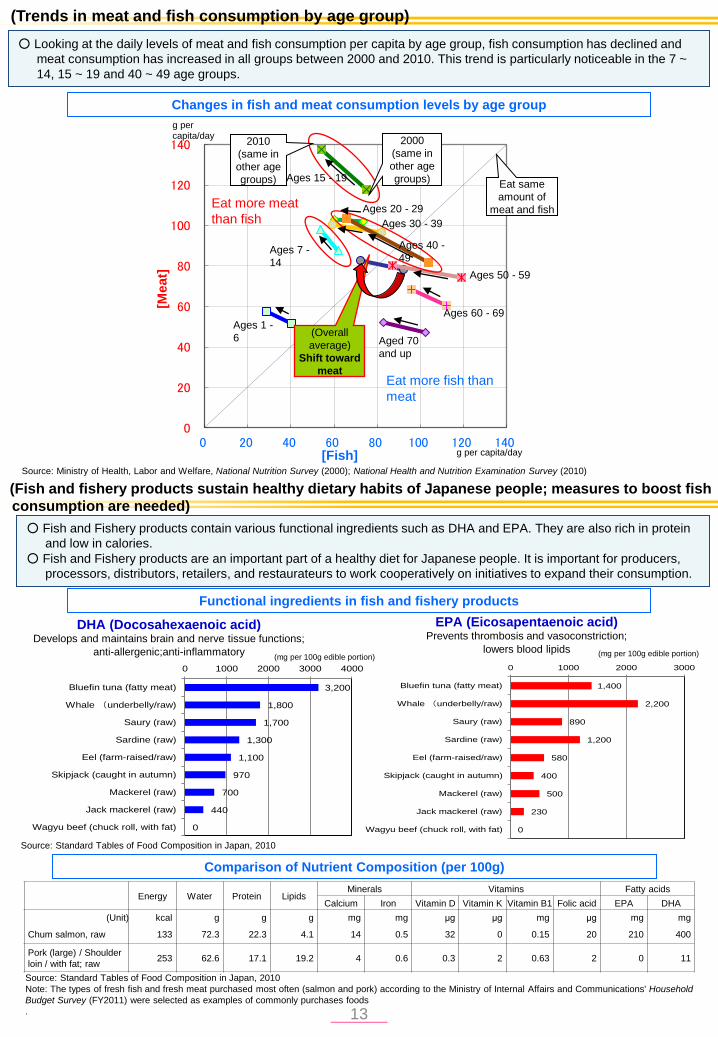
(Trends in meat and fish consumption by age group)
○ Looking at the daily levels of meat and fish consumption per capita by age group, fish consumption has declined and
meat consumption has increased in all groups between 2000 and 2010. This trend is particularly noticeable in the 7 ~
14, 15 ~ 19 and 40 ~ 49 age groups.
Changes in fish and meat consumption levels by age group
Source: Ministry of Health, Labor and Welfare, National Nutrition Survey (2000); National Health and Nutrition Examination Survey (2010)
0
20
40
60
80
100
120
140
0 20 40 60 80 100 120 140
g per capita/day
g per capita/day
Eat more fish than
meat
Eat more meat
than fish
Ages 1 -
6
Ages 7 -
14
Ages 20 - 29
Ages 50 - 59
Ages 60 - 69
Aged 70
and up
(Overall
average)
Shift toward
meat
2000
(same in
other age
groups)
2010
(same in
other age
groups)
Ages 30 - 39
Ages 40 -
49
Ages 15 - 19 Eat same
amount of
meat and fish
[Meat]
[Fish]
(Fish and fishery products sustain healthy dietary habits of Japanese people; measures to boost fish
consumption are needed)
○ Fish and Fishery products contain various functional ingredients such as DHA and EPA. They are also rich in protein
and low in calories.
○ Fish and Fishery products are an important part of a healthy diet for Japanese people. It is important for producers,
processors, distributors, retailers, and restaurateurs to work cooperatively on initiatives to expand their consumption.
Functional ingredients in fish and fishery products
EPA (Eicosapentaenoic acid) Prevents thrombosis and vasoconstriction;
lowers blood lipids (mg per 100g edible portion)
DHA (Docosahexaenoic acid) Develops and maintains brain and nerve tissue functions;
anti-allergenic;anti-inflammatory (mg per 100g edible portion)
Energy Water Protein Lipids
Minerals Vitamins Fatty acids
Calcium Iron Vitamin D Vitamin K Vitamin B1 Folic acid EPA DHA
(Unit) kcal g g g mg mg μg μg mg μg mg mg
Chum salmon, raw 133 72.3 22.3 4.1 14 0.5 32 0 0.15 20 210 400
Pork (large) / Shoulder
loin / with fat; raw 253 62.6 17.1 19.2 4 0.6 0.3 2 0.63 2 0 11
Source: Standard Tables of Food Composition in Japan, 2010
Note: The types of fresh fish and fresh meat purchased most often (salmon and pork) according to the Ministry of Internal Affairs and Communications' Household
Budget Survey (FY2011) were selected as examples of commonly purchases foods
.
Comparison of Nutrient Composition (per 100g)
13
3,200
1,800
1,700
1,300
1,100
970
700
440
0
0 1000 2000 3000 4000
Bluefin tuna (fatty meat)
Whale underbelly/raw)
Saury (raw)
Sardine (raw)
Eel (farm-raised/raw)
Skipjack (caught in autumn)
Mackerel (raw)
Jack mackerel (raw)
Wagyu beef (chuck roll, with fat)
1,400
2,200
890
1,200
580
400
500
230
0
0 1000 2000 3000
Bluefin tuna (fatty meat)
Whale underbelly/raw)
Saury (raw)
Sardine (raw)
Eel (farm-raised/raw)
Skipjack (caught in autumn)
Mackerel (raw)
Jack mackerel (raw)
Wagyu beef (chuck roll, with fat)
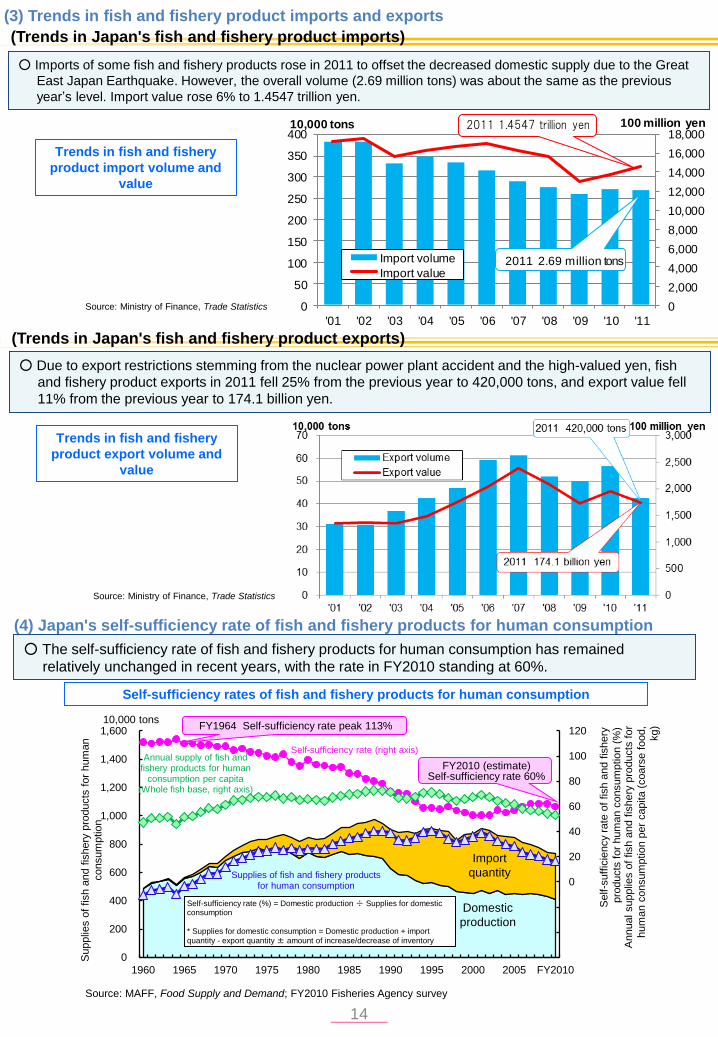
(3) Trends in fish and fishery product imports and exports
○ Imports of some fish and fishery products rose in 2011 to offset the decreased domestic supply due to the Great
East Japan Earthquake. However, the overall volume (2.69 million tons) was about the same as the previous
year’s level. Import value rose 6% to 1.4547 trillion yen.
Trends in fish and fishery
product import volume and
value
(Trends in Japan's fish and fishery product imports)
Source: Ministry of Finance, Trade Statistics
○ Due to export restrictions stemming from the nuclear power plant accident and the high-valued yen, fish
and fishery product exports in 2011 fell 25% from the previous year to 420,000 tons, and export value fell
11% from the previous year to 174.1 billion yen.
Trends in fish and fishery
product export volume and
value
(Trends in Japan's fish and fishery product exports)
Source: Ministry of Finance, Trade Statistics
○ The self-sufficiency rate of fish and fishery products for human consumption has remained
relatively unchanged in recent years, with the rate in FY2010 standing at 60%.
(4) Japan's self-sufficiency rate of fish and fishery products for human consumption
Self-sufficiency rates of fish and fishery products for human consumption
Source: MAFF, Food Supply and Demand; FY2010 Fisheries Agency survey
14
-60
-40
-20
0
20
40
60
80
100
120
0
200
400
600
800
1,000
1,200
1,400
1,600
1960 1965 1970 1975 1980 1985 1990 1995 2000 2005 FY2010
Import
quantity
Self-sufficiency rate (right axis)
10,000 tons
Supplie
s o
f fish a
nd f
ishery
pro
ducts
for
hum
an
consum
ptio
n
FY2010 (estimate) Self-sufficiency rate 60%
FY1964 Self-sufficiency rate peak 113%
Domestic
production
Annual supply of fish and fishery products for human
consumption per capita (Whole fish base, right axis)
Supplies of fish and fishery products for human consumption
Annual supplie
s o
f fish a
nd f
ishery
pro
ducts
for
hum
an c
onsum
ptio
n p
er
capita (
coars
e f
ood,
kg)
Self-sufficiency rate (%) = Domestic production ÷ Supplies for domestic consumption
* Supplies for domestic consumption = Domestic production + import
quantity - export quantity ± amount of increase/decrease of inventory
Self-s
uff
icie
ncy r
ate
of
fish a
nd f
ishery
pro
ducts
for
hum
an c
onsum
ptio
n (
%)
0
2,000
4,000
6,000
8,000
10,000
12,000
14,000
16,000
18,000
0
50
100
150
200
250
300
350
400
'01 '02 '03 '04 '05 '06 '07 '08 '09 '10 '11
100 million yen10,000 tons
Import volume
Import value
2011 1.4547 trillion yen
2011 2.69 million tons
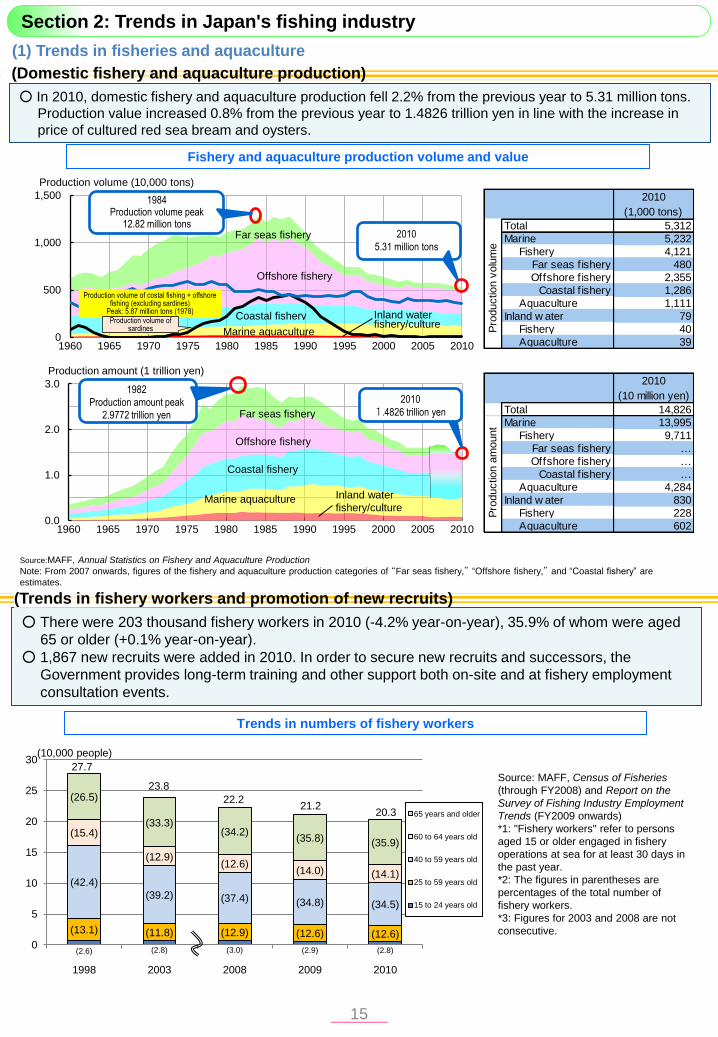
(1) Trends in fisheries and aquaculture
○ In 2010, domestic fishery and aquaculture production fell 2.2% from the previous year to 5.31 million tons.
Production value increased 0.8% from the previous year to 1.4826 trillion yen in line with the increase in
price of cultured red sea bream and oysters.
(Domestic fishery and aquaculture production)
Fishery and aquaculture production volume and value
Source:MAFF, Annual Statistics on Fishery and Aquaculture Production
Note: From 2007 onwards, figures of the fishery and aquaculture production categories of “Far seas fishery,” “Offshore fishery,” and “Coastal fishery” are
estimates.
○ There were 203 thousand fishery workers in 2010 (-4.2% year-on-year), 35.9% of whom were aged
65 or older (+0.1% year-on-year).
○ 1,867 new recruits were added in 2010. In order to secure new recruits and successors, the
Government provides long-term training and other support both on-site and at fishery employment
consultation events.
(Trends in fishery workers and promotion of new recruits)
Trends in numbers of fishery workers
Source: MAFF, Census of Fisheries
(through FY2008) and Report on the
Survey of Fishing Industry Employment
Trends (FY2009 onwards)
*1: "Fishery workers" refer to persons
aged 15 or older engaged in fishery
operations at sea for at least 30 days in
the past year.
*2: The figures in parentheses are
percentages of the total number of
fishery workers.
*3: Figures for 2003 and 2008 are not
consecutive.
Section 2: Trends in Japan's fishing industry
15
0
500
1,000
1,500
1960 1965 1970 1975 1980 1985 1990 1995 2000 2005 2010
Far seas fishery
Offshore fishery
Coastal fishery
Marine aquaculture
Inland water fishery/culture
Production volume (10,000 tons)
Production volume of costal fishing + offshore fishing (excluding sardines)
Peak: 5.87 million tons (1978) Production volume of
sardines
(2.6) (2.8) (3.0) (2.9) (2.8)
(13.1) (11.8) (12.9) (12.6) (12.6)
(42.4)
(39.2) (37.4) (34.8) (34.5)
(15.4)
(12.9) (12.6)
(14.0) (14.1)
(26.5)
(33.3) (34.2)
(35.8) (35.9)
0
5
10
15
20
25
30
1998 2003 2008 2009 2010
65 years and older
60 to 64 years old
40 to 59 years old
25 to 59 years old
15 to 24 years old
27.7
23.8
22.2
(10,000 people)
21.2 20.3
1984 Production volume peak
12.82 million tons 2010
5.31 million tons
2010
(1,000 tons)
Total 5,312
Marine 5,232
Fishery 4,121
Far seas f ishery 480
Offshore f ishery 2,355
Coastal f ishery 1,286
Aquaculture 1,111
Inland w ater 79
Fishery 40
Aquaculture 39
2010
(10 million yen)
Total 14,826
Marine 13,995
Fishery 9,711
Far seas f ishery …
Offshore f ishery …
Coastal f ishery …
Aquaculture 4,284
Inland w ater 830
Fishery 228
Aquaculture 602
Pro
ductio
n v
olu
me
Pro
ductio
n a
mount
0.0
1.0
2.0
3.0
1960 1965 1970 1975 1980 1985 1990 1995 2000 2005 2010
Production amount (1 trillion yen)
Offshore fishery
Far seas fishery
Coastal fishery
Marine aquaculture Inland water
fishery/culture
1982
Production amount peak
2.9772 trillion yen
2010
1.4826 trillion yen
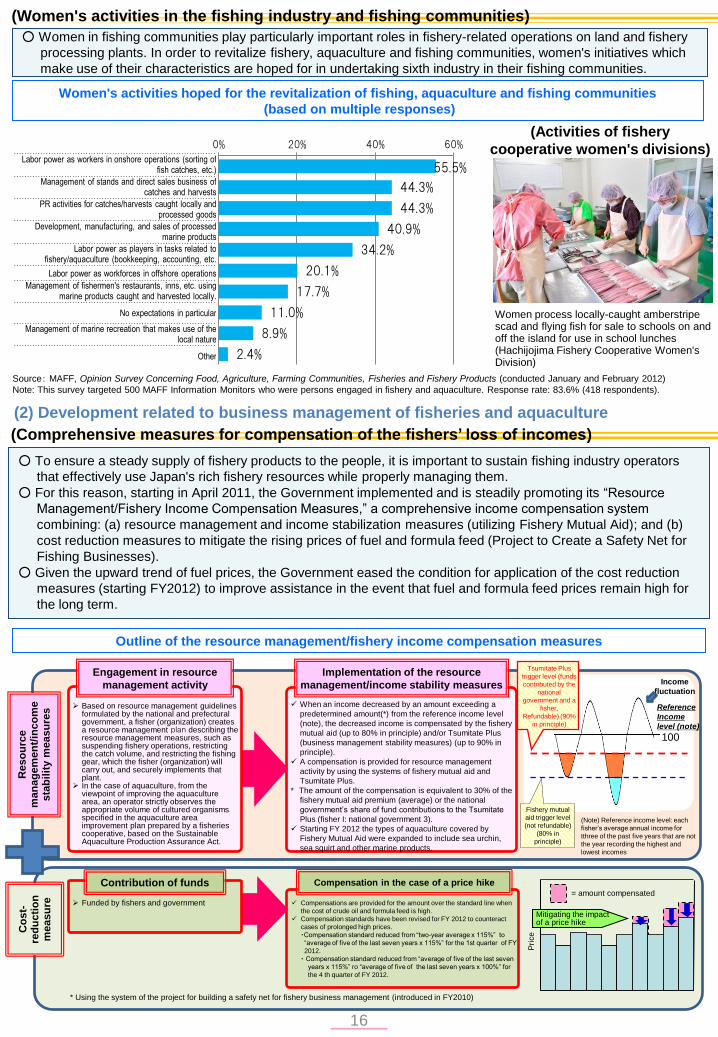
55.5%
44.3%
44.3%
40.9%
34.2%
20.1%
17.7%
11.0%
8.9%
2.4%
0% 20% 40% 60%
Source: MAFF, Opinion Survey Concerning Food, Agriculture, Farming Communities, Fisheries and Fishery Products (conducted January and February 2012)
Note: This survey targeted 500 MAFF Information Monitors who were persons engaged in fishery and aquaculture. Response rate: 83.6% (418 respondents).
(2) Development related to business management of fisheries and aquaculture
○ Women in fishing communities play particularly important roles in fishery-related operations on land and fishery
processing plants. In order to revitalize fishery, aquaculture and fishing communities, women's initiatives which
make use of their characteristics are hoped for in undertaking sixth industry in their fishing communities.
(Women's activities in the fishing industry and fishing communities)
Women's activities hoped for the revitalization of fishing, aquaculture and fishing communities
(based on multiple responses)
Women process locally-caught amberstripe scad and flying fish for sale to schools on and off the island for use in school lunches (Hachijojima Fishery Cooperative Women's Division)
(Activities of fishery
cooperative women's divisions)
(Comprehensive measures for compensation of the fishers’ loss of incomes)
○ To ensure a steady supply of fishery products to the people, it is important to sustain fishing industry operators
that effectively use Japan's rich fishery resources while properly managing them.
○ For this reason, starting in April 2011, the Government implemented and is steadily promoting its “Resource
Management/Fishery Income Compensation Measures,” a comprehensive income compensation system
combining: (a) resource management and income stabilization measures (utilizing Fishery Mutual Aid); and (b)
cost reduction measures to mitigate the rising prices of fuel and formula feed (Project to Create a Safety Net for
Fishing Businesses).
○ Given the upward trend of fuel prices, the Government eased the condition for application of the cost reduction
measures (starting FY2012) to improve assistance in the event that fuel and formula feed prices remain high for
the long term.
Outline of the resource management/fishery income compensation measures
16
Labor power as workers in onshore operations (sorting of fish catches, etc.)
Management of stands and direct sales business of catches and harvests
PR activities for catches/harvests caught locally and processed goods
Development, manufacturing, and sales of processed marine products
Labor power as players in tasks related to fishery/aquaculture (bookkeeping, accounting, etc.
Labor power as workforces in offshore operations
Management of fishermen's restaurants, inns, etc. using marine products caught and harvested locally.
No expectations in particular
Management of marine recreation that makes use of the local nature
Other
Reso
urc
e
man
ag
em
en
t/in
co
me
sta
bil
ity m
easu
res
Implementation of the resource
management/income stability measures
Compensations are provided for the amount over the standard line when
the cost of crude oil and formula feed is high.
Compensation standards have been revised for FY 2012 to counteract
cases of prolonged high prices.
・Compensation standard reduced from “two-year average x 115%” to
“average of five of the last seven years x 115%” for the 1st quarter of FY
2012.
・ Compensation standard reduced from “average of five of the last seven
years x 115%” ro “average of five of the last seven years x 100%” for
the 4 th quarter of FY 2012.
Compensation in the case of a price hike
Tsumitate Plus
trigger level (funds
contributed by the
national
government and a
fisher,
Refundable) (90%
in principle)
Income
fluctuation
100
Reference
Income
level (note)
Pri
ce
= amount compensated
Mitigating the impact of a price hike
(Note) Reference income level: each
fisher’s average annual income for
tthree of the past five years that are not
the year recording the highest and
lowest incomes
When an income decreased by an amount exceeding a
predetermined amount(*) from the reference income level
(note), the decreased income is compensated by the fishery
mutual aid (up to 80% in principle) and/or Tsumitate Plus
(business management stability measures) (up to 90% in
principle).
A compensation is provided for resource management
activity by using the systems of fishery mutual aid and
Tsumitate Plus.
* The amount of the compensation is equivalent to 30% of the
fishery mutual aid premium (average) or the national
government’s share of fund contributions to the Tsumitate
Plus (fisher I: national government 3).
Starting FY 2012 the types of aquaculture covered by
Fishery Mutual Aid were expanded to include sea urchin,
sea squirt and other marine products.
Contribution of funds
Funded by fishers and government
Based on resource management guidelines formulated by the national and prefectural government, a fisher (organization) creates a resource management plan describing the resource management measures, such as suspending fishery operations, restricting the catch volume, and restricting the fishing gear, which the fisher (organization) will carry out, and securely implements that plant.
In the case of aquaculture, from the viewpoint of improving the aquaculture area, an operator strictly observes the appropriate volume of cultured organisms specified in the aquaculture area improvement plan prepared by a fisheries cooperative, based on the Sustainable Aquaculture Production Assurance Act.
Engagement in resource
management activity
Co
st-
red
uc
tio
n
measu
re
Fishery mutual
aid trigger level
(not refundable)
(80% in
principle)
* Using the system of the project for building a safety net for fishery business management (introduced in FY2010)
(4) Trends in fishery cooperatives
(3) Ensuring the safety of fishing operations
Campaign on life jacket usage
promotion (workshop in session)
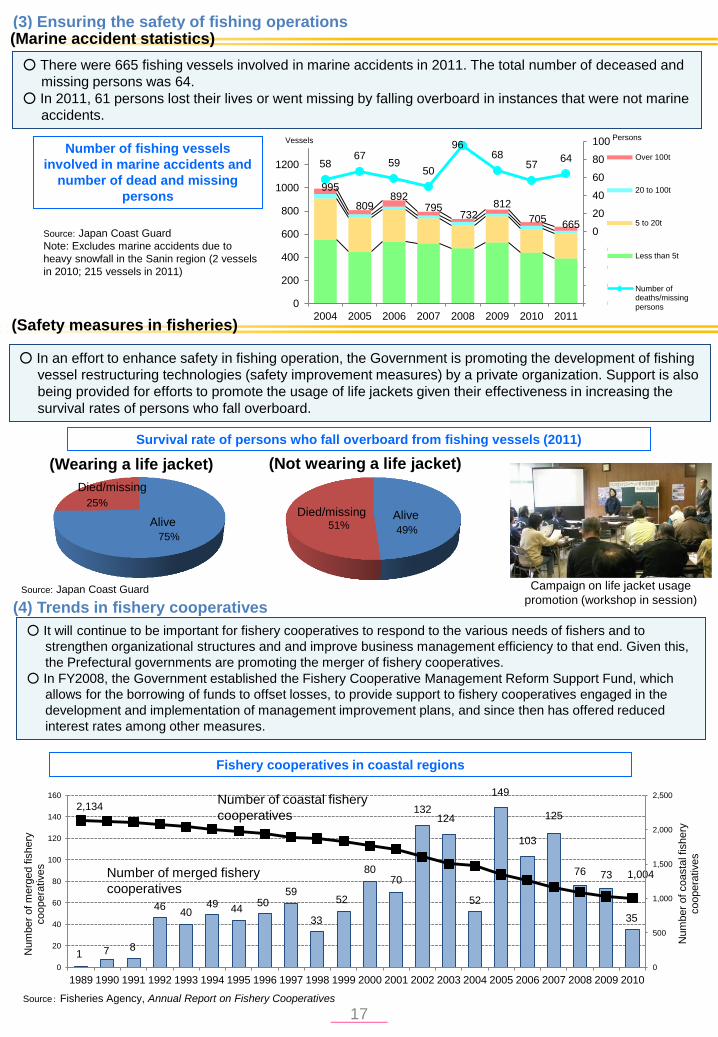
○ There were 665 fishing vessels involved in marine accidents in 2011. The total number of deceased and
missing persons was 64.
○ In 2011, 61 persons lost their lives or went missing by falling overboard in instances that were not marine
accidents.
(Marine accident statistics)
Number of fishing vessels
involved in marine accidents and
number of dead and missing
persons
○ In an effort to enhance safety in fishing operation, the Government is promoting the development of fishing
vessel restructuring technologies (safety improvement measures) by a private organization. Support is also
being provided for efforts to promote the usage of life jackets given their effectiveness in increasing the
survival rates of persons who fall overboard.
(Safety measures in fisheries)
Source: Japan Coast Guard
Note: Excludes marine accidents due to
heavy snowfall in the Sanin region (2 vessels
in 2010; 215 vessels in 2011)
Survival rate of persons who fall overboard from fishing vessels (2011)
Source: Japan Coast Guard
(Wearing a life jacket) (Not wearing a life jacket)
○ It will continue to be important for fishery cooperatives to respond to the various needs of fishers and to
strengthen organizational structures and and improve business management efficiency to that end. Given this,
the Prefectural governments are promoting the merger of fishery cooperatives.
○ In FY2008, the Government established the Fishery Cooperative Management Reform Support Fund, which
allows for the borrowing of funds to offset losses, to provide support to fishery cooperatives engaged in the
development and implementation of management improvement plans, and since then has offered reduced
interest rates among other measures.
Fishery cooperatives in coastal regions
Source: Fisheries Agency, Annual Report on Fishery Cooperatives
17
1,004
75%
25%
Alive
Died/missing
49% 51% Alive Died/missing
995
809 892
795 732
812
705 665
58 67
59 50
96 68
57 64
-80
-60
-40
-20
0
20
40
60
80
100
0
200
400
600
800
1000
1200
1400
2004 2005 2006 2007 2008 2009 2010 2011
Over 100t
20 to 100t
5 to 20t
Less than 5t
Number ofdeaths/missingpersons
Vessels Persons
1 7 8
46 40
49 44 50
59
33
52
80 70
132 124
52
149
103
125
76 73
35
2,134
0
500
1,000
1,500
2,000
2,500
0
20
40
60
80
100
120
140
160
1989 1990 1991 1992 1993 1994 1995 1996 1997 1998 1999 2000 2001 2002 2003 2004 2005 2006 2007 2008 2009 2010
Num
ber
of coasta
l fishery
coopera
tives
Num
ber
of m
erg
ed fis
hery
coopera
tives
Number of merged fishery
cooperatives
Number of coastal fishery
cooperatives
(5) Trends in fish and fishery product distribution and processing
(The status of fish and fishery product distribution)
○ Most fishery products are sorted and loaded in wholesale fishery markets near the ports where they were
landed, after which they are shipped to wholesale markets at the point of consumption. Products typically
reach consumers after passing through two wholesale markets.
○ Most wholesale fishery markets have small trade volumes and poor pricing power. Therefore, it is crucial to
merge markets and concentrate facilities in order to enhance market function, invigorate trade and
increase the income of fishers.
General distribution channel for fish and fishery products
Wholesale market in the producing region
Wholesale market in the consuming region
Producers Wholesalers
Local shippers Or
Local intermediaries
Wholesalers Intermediaries Consumer
(Harvest/haul)
Retail shops
Food
wholesalers
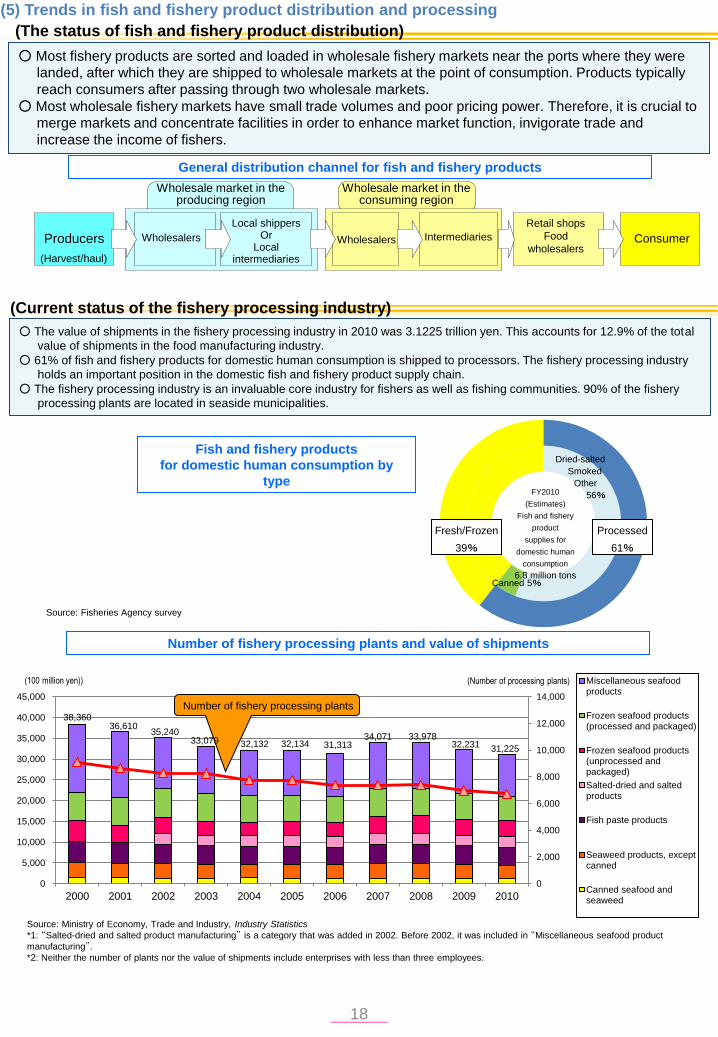
○ The value of shipments in the fishery processing industry in 2010 was 3.1225 trillion yen. This accounts for 12.9% of the total
value of shipments in the food manufacturing industry.
○ 61% of fish and fishery products for domestic human consumption is shipped to processors. The fishery processing industry
holds an important position in the domestic fish and fishery product supply chain.
○ The fishery processing industry is an invaluable core industry for fishers as well as fishing communities. 90% of the fishery
processing plants are located in seaside municipalities.
(Current status of the fishery processing industry)
Fish and fishery products
for domestic human consumption by
type
Source: Fisheries Agency survey
Number of fishery processing plants and value of shipments
Source: Ministry of Economy, Trade and Industry, Industry Statistics
*1: “Salted-dried and salted product manufacturing” is a category that was added in 2002. Before 2002, it was included in “Miscellaneous seafood product
manufacturing”.
*2: Neither the number of plants nor the value of shipments include enterprises with less than three employees.
18
FY2010
(Estimates)
Fish and fishery
product
supplies for
domestic human
consumption
6.8 million tons
Fresh/Frozen
39%
Processed
61%
Canned 5%
Dried-salted
Smoked
Other
56%
0
2,000
4,000
6,000
8,000
10,000
12,000
14,000
0
5,000
10,000
15,000
20,000
25,000
30,000
35,000
40,000
45,000
2000 2001 2002 2003 2004 2005 2006 2007 2008 2009 2010
Miscellaneous seafoodproducts
Frozen seafood products(processed and packaged)
Frozen seafood products(unprocessed andpackaged)
Salted-dried and saltedproducts
Fish paste products
Seaweed products, exceptcanned
Canned seafood andseaweed
(100 million yen))
32,132 32,134 31,313 34,071 33,978
32,231
(Number of processing plants)
31,225
Number of fishery processing plants 38,360
36,610 35,240
33,079
(1) Fishery resources in waters surrounding Japan
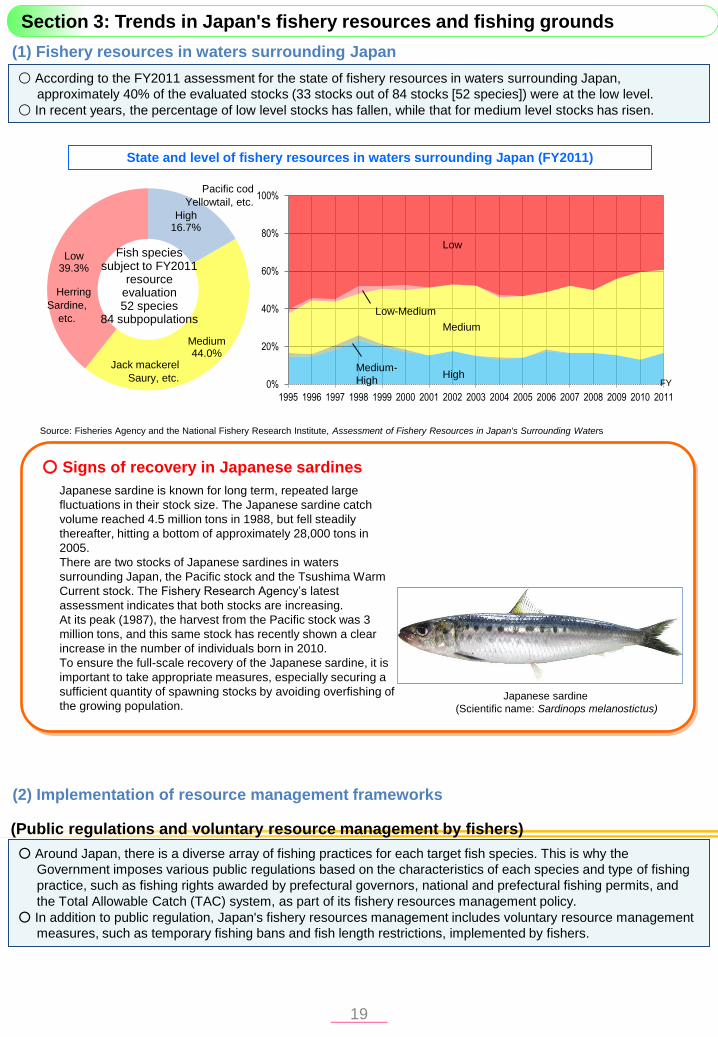
Japanese sardine
(Scientific name: Sardinops melanostictus)
○ According to the FY2011 assessment for the state of fishery resources in waters surrounding Japan,
approximately 40% of the evaluated stocks (33 stocks out of 84 stocks [52 species]) were at the low level.
○ In recent years, the percentage of low level stocks has fallen, while that for medium level stocks has risen.
State and level of fishery resources in waters surrounding Japan (FY2011)
Source: Fisheries Agency and the National Fishery Research Institute, Assessment of Fishery Resources in Japan's Surrounding Waters
Japanese sardine is known for long term, repeated large
fluctuations in their stock size. The Japanese sardine catch
volume reached 4.5 million tons in 1988, but fell steadily
thereafter, hitting a bottom of approximately 28,000 tons in
2005.
There are two stocks of Japanese sardines in waters
surrounding Japan, the Pacific stock and the Tsushima Warm
Current stock. The Fishery Research Agency’s latest
assessment indicates that both stocks are increasing.
At its peak (1987), the harvest from the Pacific stock was 3
million tons, and this same stock has recently shown a clear
increase in the number of individuals born in 2010.
To ensure the full-scale recovery of the Japanese sardine, it is
important to take appropriate measures, especially securing a
sufficient quantity of spawning stocks by avoiding overfishing of
the growing population.
○ Signs of recovery in Japanese sardines
(2) Implementation of resource management frameworks
(Public regulations and voluntary resource management by fishers)
○ Around Japan, there is a diverse array of fishing practices for each target fish species. This is why the
Government imposes various public regulations based on the characteristics of each species and type of fishing
practice, such as fishing rights awarded by prefectural governors, national and prefectural fishing permits, and
the Total Allowable Catch (TAC) system, as part of its fishery resources management policy.
○ In addition to public regulation, Japan's fishery resources management includes voluntary resource management
measures, such as temporary fishing bans and fish length restrictions, implemented by fishers.
Section 3: Trends in Japan's fishery resources and fishing grounds
19
High 16.7%
Medium 44.0%
Low 39.3%
Herring
Sardine,
etc.
Fish species subject to FY2011
resource evaluation 52 species
84 subpopulations
0%
20%
40%
60%
80%
100%
1995 1996 1997 1998 1999 2000 2001 2002 2003 2004 2005 2006 2007 2008 2009 2010 2011
Low
High
Medium
Low-Medium
Medium-
High FY
Pacific cod
Yellowtail, etc.
Jack mackerel
Saury, etc.
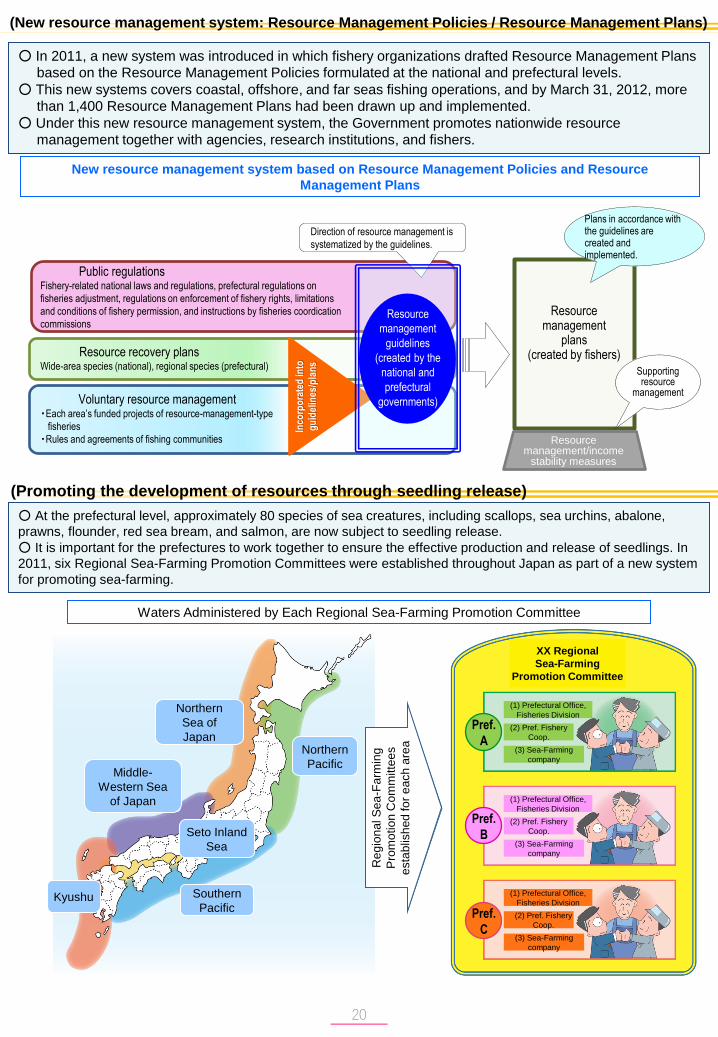
(New resource management system: Resource Management Policies / Resource Management Plans)
○ In 2011, a new system was introduced in which fishery organizations drafted Resource Management Plans
based on the Resource Management Policies formulated at the national and prefectural levels.
○ This new systems covers coastal, offshore, and far seas fishing operations, and by March 31, 2012, more
than 1,400 Resource Management Plans had been drawn up and implemented.
○ Under this new resource management system, the Government promotes nationwide resource
management together with agencies, research institutions, and fishers.
New resource management system based on Resource Management Policies and Resource
Management Plans
(Promoting the development of resources through seedling release)
XX Regional
Sea-Farming
Promotion Committee
○ At the prefectural level, approximately 80 species of sea creatures, including scallops, sea urchins, abalone,
prawns, flounder, red sea bream, and salmon, are now subject to seedling release.
○ It is important for the prefectures to work together to ensure the effective production and release of seedlings. In
2011, six Regional Sea-Farming Promotion Committees were established throughout Japan as part of a new system
for promoting sea-farming.
Waters Administered by Each Regional Sea-Farming Promotion Committee
Re
gio
na
l S
ea
-Fa
rmin
g
Pro
mo
tio
n C
om
mitte
es
esta
blis
hed
fo
r e
ach
are
a
(1) Prefectural Office,
Fisheries Division
(3) Sea-Farming
company
(2) Pref. Fishery
Coop.
Pref.
A
Pref.
C
Pref.
B
(1) Prefectural Office,
Fisheries Division
(3) Sea-Farming
company
(2) Pref. Fishery
Coop.
(1) Prefectural Office,
Fisheries Division
(3) Sea-Farming
company
(2) Pref. Fishery
Coop.
Northern
Sea of
Japan
Middle-
Western Sea
of Japan
Kyushu Southern
Pacific
Seto Inland
Sea
Northern
Pacific
20
Public regulations Fishery-related national laws and regulations, prefectural regulations on
fisheries adjustment, regulations on enforcement of fishery rights, limitations
and conditions of fishery permission, and instructions by fisheries coordication
commissions
Resource recovery plans Wide-area species (national), regional species (prefectural)
Voluntary resource management ・Each area’s funded projects of resource-management-type
fisheries
・Rules and agreements of fishing communities
Direction of resource management is
systematized by the guidelines.
Resource management
plans (created by fishers)
Plans in accordance with the guidelines are created and implemented.
Inco
rpo
rate
d in
to
gu
idel
ines
/pla
ns
Supporting resource
management
Resource
management
guidelines
(created by the
national and
prefectural
governments)
Resource management/income
stability measures
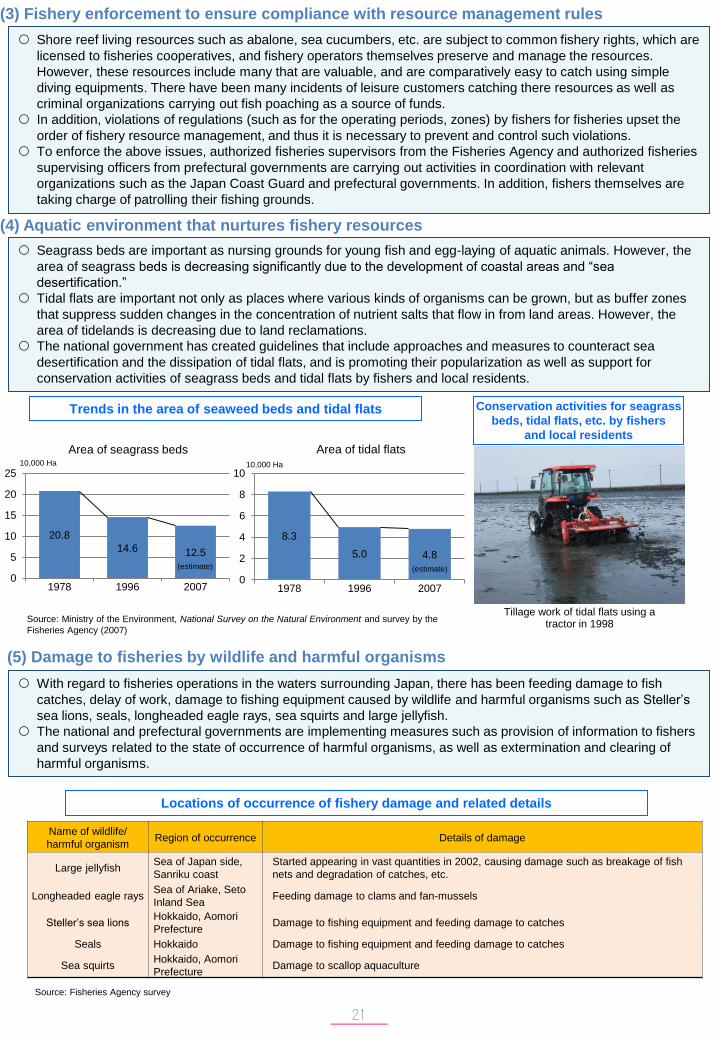
(3) Fishery enforcement to ensure compliance with resource management rules
(4) Aquatic environment that nurtures fishery resources
(5) Damage to fisheries by wildlife and harmful organisms
Shore reef living resources such as abalone, sea cucumbers, etc. are subject to common fishery rights, which are
licensed to fisheries cooperatives, and fishery operators themselves preserve and manage the resources.
However, these resources include many that are valuable, and are comparatively easy to catch using simple
diving equipments. There have been many incidents of leisure customers catching there resources as well as
criminal organizations carrying out fish poaching as a source of funds.
In addition, violations of regulations (such as for the operating periods, zones) by fishers for fisheries upset the
order of fishery resource management, and thus it is necessary to prevent and control such violations.
To enforce the above issues, authorized fisheries supervisors from the Fisheries Agency and authorized fisheries
supervising officers from prefectural governments are carrying out activities in coordination with relevant
organizations such as the Japan Coast Guard and prefectural governments. In addition, fishers themselves are
taking charge of patrolling their fishing grounds.
Seagrass beds are important as nursing grounds for young fish and egg-laying of aquatic animals. However, the
area of seagrass beds is decreasing significantly due to the development of coastal areas and “sea
desertification.”
Tidal flats are important not only as places where various kinds of organisms can be grown, but as buffer zones
that suppress sudden changes in the concentration of nutrient salts that flow in from land areas. However, the
area of tidelands is decreasing due to land reclamations.
The national government has created guidelines that include approaches and measures to counteract sea
desertification and the dissipation of tidal flats, and is promoting their popularization as well as support for
conservation activities of seagrass beds and tidal flats by fishers and local residents.
Conservation activities for seagrass
beds, tidal flats, etc. by fishers
and local residents
Trends in the area of seaweed beds and tidal flats
Source: Ministry of the Environment, National Survey on the Natural Environment and survey by the
Fisheries Agency (2007)
Tillage work of tidal flats using a tractor in 1998
With regard to fisheries operations in the waters surrounding Japan, there has been feeding damage to fish
catches, delay of work, damage to fishing equipment caused by wildlife and harmful organisms such as Steller’s
sea lions, seals, longheaded eagle rays, sea squirts and large jellyfish.
The national and prefectural governments are implementing measures such as provision of information to fishers
and surveys related to the state of occurrence of harmful organisms, as well as extermination and clearing of
harmful organisms.
Locations of occurrence of fishery damage and related details
Name of wildlife/
harmful organism Region of occurrence Details of damage
Large jellyfish Sea of Japan side,
Sanriku coast
Started appearing in vast quantities in 2002, causing damage such as breakage of fish
nets and degradation of catches, etc.
Longheaded eagle rays Sea of Ariake, Seto
Inland Sea Feeding damage to clams and fan-mussels
Steller’s sea lions Hokkaido, Aomori
Prefecture Damage to fishing equipment and feeding damage to catches
Seals Hokkaido Damage to fishing equipment and feeding damage to catches
Sea squirts Hokkaido, Aomori
Prefecture Damage to scallop aquaculture
Source: Fisheries Agency survey
21
20.8
14.6 12.5
0
5
10
15
20
25
1978 1996 2007
8.3
5.0 4.8
0
2
4
6
8
10
1978 1996 2007
Area of seagrass beds Area of tidal flats 10,000 Ha 10,000 Ha
(estimate) (estimate)
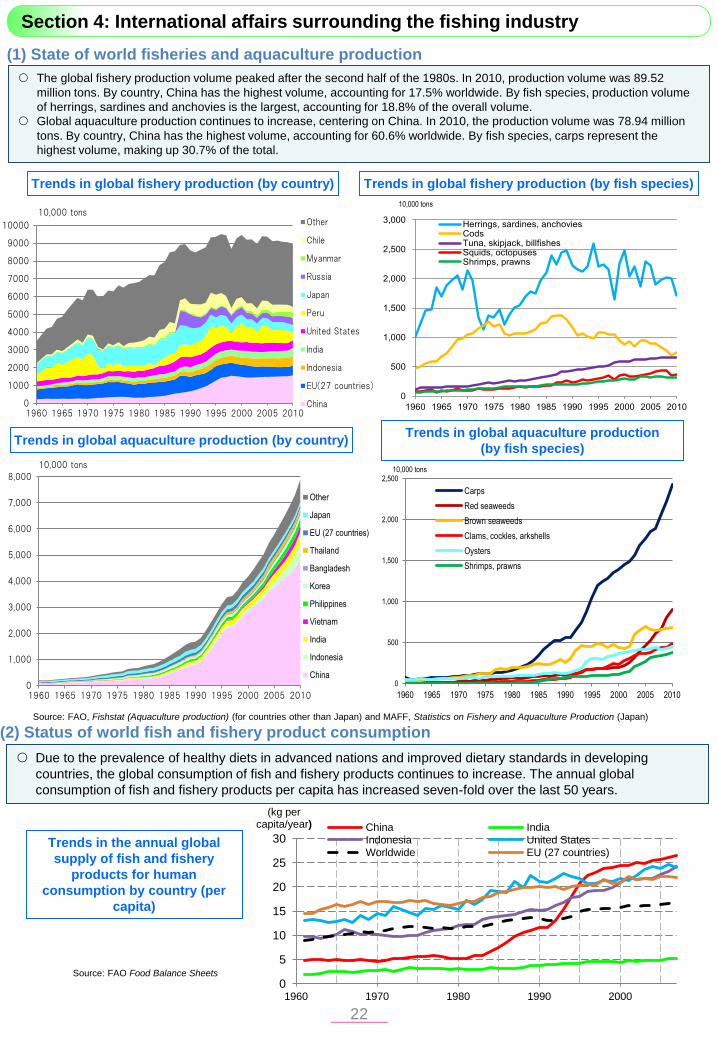
(1) State of world fisheries and aquaculture production
(2) Status of world fish and fishery product consumption
The global fishery production volume peaked after the second half of the 1980s. In 2010, production volume was 89.52
million tons. By country, China has the highest volume, accounting for 17.5% worldwide. By fish species, production volume
of herrings, sardines and anchovies is the largest, accounting for 18.8% of the overall volume.
Global aquaculture production continues to increase, centering on China. In 2010, the production volume was 78.94 million
tons. By country, China has the highest volume, accounting for 60.6% worldwide. By fish species, carps represent the
highest volume, making up 30.7% of the total.
Trends in global fishery production (by country) Trends in global fishery production (by fish species)
Trends in global aquaculture production (by country) Trends in global aquaculture production
(by fish species)
Source: FAO, Fishstat (Aquaculture production) (for countries other than Japan) and MAFF, Statistics on Fishery and Aquaculture Production (Japan)
Source: FAO Food Balance Sheets
Due to the prevalence of healthy diets in advanced nations and improved dietary standards in developing
countries, the global consumption of fish and fishery products continues to increase. The annual global
consumption of fish and fishery products per capita has increased seven-fold over the last 50 years.
Trends in the annual global
supply of fish and fishery
products for human
consumption by country (per
capita)
Section 4: International affairs surrounding the fishing industry
22
0
500
1,000
1,500
2,000
2,500
1960 1965 1970 1975 1980 1985 1990 1995 2000 2005 2010
Carps
Red seaweeds
Brown seaweeds
Clams, cockles, arkshells
Oysters
Shrimps, prawns
10,000 tons
10,000 tons
0
500
1,000
1,500
2,000
2,500
3,000
1960 1965 1970 1975 1980 1985 1990 1995 2000 2005 2010
Herrings, sardines, anchoviesCodsTuna, skipjack, billfishesSquids, octopusesShrimps, prawns
0
5
10
15
20
25
30
1960 1970 1980 1990 2000
(kg per capita/year) China India
Indonesia United States
Worldwide EU (27 countries)
0
1000
2000
3000
4000
5000
6000
7000
8000
9000
10000
1960 1965 1970 1975 1980 1985 1990 1995 2000 2005 2010
10,000 tons Other
Chile
Myanmar
Russia
Japan
Peru
United States
India
Indonesia
EU(27 countries)
China
0
1,000
2,000
3,000
4,000
5,000
6,000
7,000
8,000
1960 1965 1970 1975 1980 1985 1990 1995 2000 2005 2010
10,000 tons
Other
Japan
EU (27 countries)
Thailand
Bangladesh
Korea
Philippines
Vietnam
India
Indonesia
China
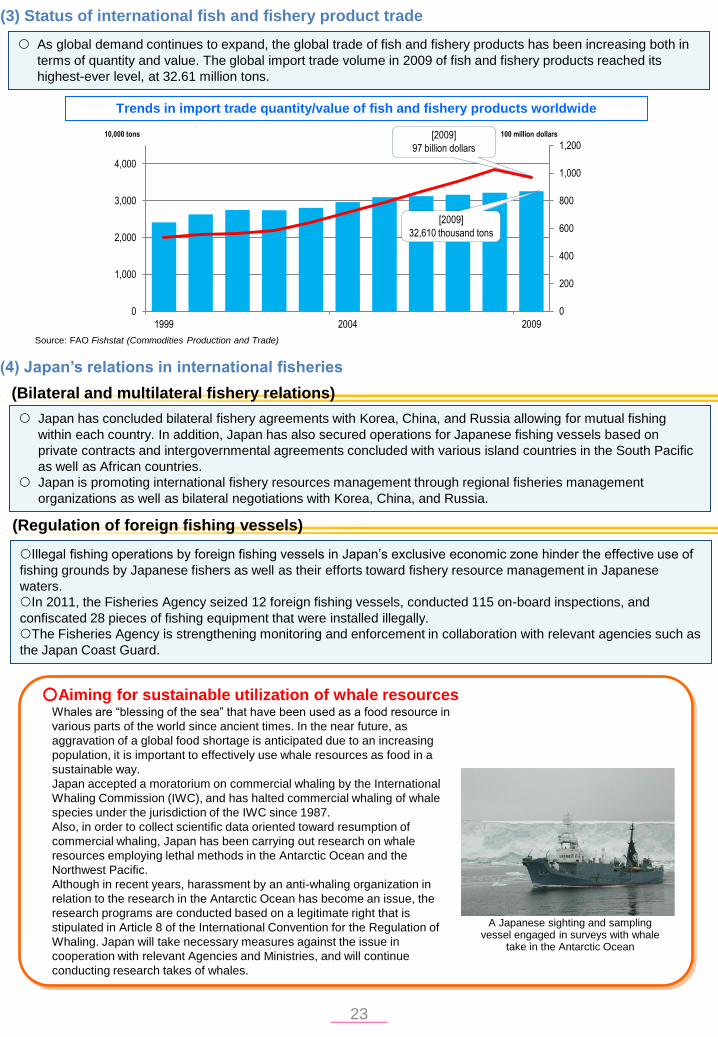
Whales are “blessing of the sea” that have been used as a food resource in
various parts of the world since ancient times. In the near future, as
aggravation of a global food shortage is anticipated due to an increasing
population, it is important to effectively use whale resources as food in a
sustainable way.
Japan accepted a moratorium on commercial whaling by the International
Whaling Commission (IWC), and has halted commercial whaling of whale
species under the jurisdiction of the IWC since 1987.
Also, in order to collect scientific data oriented toward resumption of
commercial whaling, Japan has been carrying out research on whale
resources employing lethal methods in the Antarctic Ocean and the
Northwest Pacific.
Although in recent years, harassment by an anti-whaling organization in
relation to the research in the Antarctic Ocean has become an issue, the
research programs are conducted based on a legitimate right that is
stipulated in Article 8 of the International Convention for the Regulation of
Whaling. Japan will take necessary measures against the issue in
cooperation with relevant Agencies and Ministries, and will continue
conducting research takes of whales.
○Aiming for sustainable utilization of whale resources
(3) Status of international fish and fishery product trade
(4) Japan’s relations in international fisheries
As global demand continues to expand, the global trade of fish and fishery products has been increasing both in
terms of quantity and value. The global import trade volume in 2009 of fish and fishery products reached its
highest-ever level, at 32.61 million tons.
Trends in import trade quantity/value of fish and fishery products worldwide
Source: FAO Fishstat (Commodities Production and Trade)
Japan has concluded bilateral fishery agreements with Korea, China, and Russia allowing for mutual fishing
within each country. In addition, Japan has also secured operations for Japanese fishing vessels based on
private contracts and intergovernmental agreements concluded with various island countries in the South Pacific
as well as African countries.
Japan is promoting international fishery resources management through regional fisheries management
organizations as well as bilateral negotiations with Korea, China, and Russia.
(Bilateral and multilateral fishery relations)
Illegal fishing operations by foreign fishing vessels in Japan’s exclusive economic zone hinder the effective use of
fishing grounds by Japanese fishers as well as their efforts toward fishery resource management in Japanese
waters.
In 2011, the Fisheries Agency seized 12 foreign fishing vessels, conducted 115 on-board inspections, and
confiscated 28 pieces of fishing equipment that were installed illegally.
The Fisheries Agency is strengthening monitoring and enforcement in collaboration with relevant agencies such as
the Japan Coast Guard.
(Regulation of foreign fishing vessels)
A Japanese sighting and sampling vessel engaged in surveys with whale
take in the Antarctic Ocean
23
0
200
400
600
800
1,000
1,200
0
1,000
2,000
3,000
4,000
1999 2004 2009
100 million dollars 10,000 tons [2009]
97 billion dollars
[2009]
32,610 thousand tons
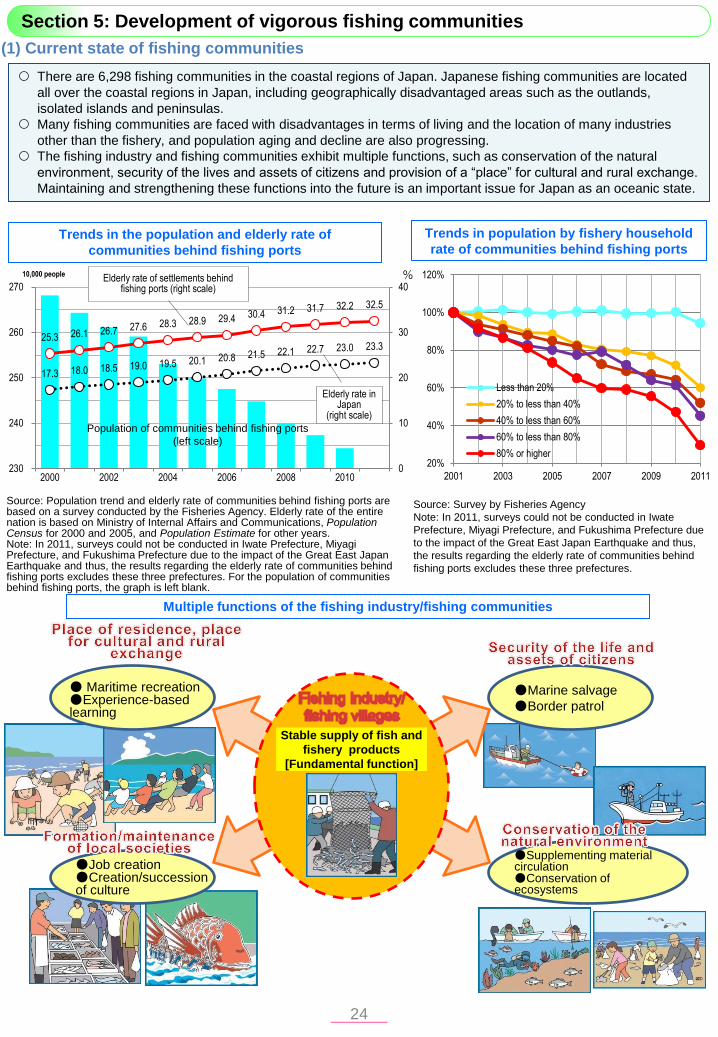
(1) Current state of fishing communities
Section 5: Development of vigorous fishing communities
There are 6,298 fishing communities in the coastal regions of Japan. Japanese fishing communities are located
all over the coastal regions in Japan, including geographically disadvantaged areas such as the outlands,
isolated islands and peninsulas.
Many fishing communities are faced with disadvantages in terms of living and the location of many industries
other than the fishery, and population aging and decline are also progressing.
The fishing industry and fishing communities exhibit multiple functions, such as conservation of the natural
environment, security of the lives and assets of citizens and provision of a “place” for cultural and rural exchange.
Maintaining and strengthening these functions into the future is an important issue for Japan as an oceanic state.
Trends in the population and elderly rate of
communities behind fishing ports
Trends in population by fishery household
rate of communities behind fishing ports
Source: Population trend and elderly rate of communities behind fishing ports are based on a survey conducted by the Fisheries Agency. Elderly rate of the entire nation is based on Ministry of Internal Affairs and Communications, Population Census for 2000 and 2005, and Population Estimate for other years. Note: In 2011, surveys could not be conducted in Iwate Prefecture, Miyagi Prefecture, and Fukushima Prefecture due to the impact of the Great East Japan Earthquake and thus, the results regarding the elderly rate of communities behind fishing ports excludes these three prefectures. For the population of communities behind fishing ports, the graph is left blank.
Source: Survey by Fisheries Agency
Note: In 2011, surveys could not be conducted in Iwate
Prefecture, Miyagi Prefecture, and Fukushima Prefecture due
to the impact of the Great East Japan Earthquake and thus,
the results regarding the elderly rate of communities behind
fishing ports excludes these three prefectures.
Multiple functions of the fishing industry/fishing communities
● Maritime recreation ●Experience-based learning
●Job creation ●Creation/succession of culture
●Marine salvage
●Border patrol
●Supplementing material circulation ●Conservation of ecosystems
Stable supply of fish and
fishery products
[Fundamental function]
24
→
Table/Figur
e: Direct
Insertion
25.3 26.1 26.7 27.6 28.3 28.9 29.4 30.4 31.2 31.7 32.2 32.5
17.3 18.0 18.5 19.0 19.5 20.1 20.8 21.5 22.1 22.7 23.0 23.3
230
240
250
260
270
0
10
20
30
40
2000 2002 2004 2006 2008 2010
10,000 people % Elderly rate of settlements behind fishing ports (right scale)
Elderly rate in Japan
(right scale)
Population of communities behind fishing ports
(left scale)
20%
40%
60%
80%
100%
120%
2001 2003 2005 2007 2009 2011
Less than 20%
20% to less than 40%
40% to less than 60%
60% to less than 80%
80% or higher

(3) Revitalization of fisheries and fishing communities that make use of local resources
(2) Upgrading of the roles and functions of fishing ports
There are 2,914 fishing ports in Japan.
At each fishing port, roles are divided according to its scope of use and the configuration of the local fishing industry, and the
function of stable supply of marine products is exhibited in the overall region based on cooperation.
The national government and local public entities are promoting efforts toward upgrading the functions of fishing harbors.
(Current state of fishing ports)
Functions of various fishing ports
(New long-term plan for development of fishing ports and fishing grounds)
In the new long-term plan for development of fishing ports and fishing grounds that was formulated in March 2012, priorities
over the next five years consist of: (a) promotion of a safe region that is resistant to disasters; (b) promotion of a powerful
fishing industry that can support stable supply and internationalization of marine products; and (c) promotion of the
development of a marine environment that aims for abundant ecosystems. The amount of projects and results to aim for are
clearly stated in this plan.
To enable revitalization of fisheries and fishing communities, it is important to make use of local resources such as fresh f ish
and fishery products from fishing communities, the outstanding natural environment, traditional cultures, and to increase their
attractiveness.
Fishery cooperatives throughout Japan are making efforts toward revitalizing fishing communities by making use of local
resources.
In order to increase the vitality of fishing communities and ensure employment and income for fishers, activities toward
development of sixth industry that utilizes local resources need to be further promoted.
State of activities toward revitalization of fishing communities
Number of fishery
cooperatives
(or number of facilities)
Number of participants
(1,000 people)
(or users)
Activities to promote fish consumption 271 1,042
Fishery experience 200 121
Efforts toward revitalization of activities other than fishery
experience, promotion of fish consumption 62 103
Marine product stands run by fishery cooperatives 298 12,476
Source: MAFF, Census of Fisheries (2008) 25
Installation of fishing reefs Large-scale upwelling fishing
ground
Fishing ground
Fishing ground
Fishing ground
Aquaculture
Farm
Fishing port used mainly by local fishery operators
(Class 1 fishing ports)
Shipping to
consuming
regions
Class 2 fishing ports
Landing distribution facility
with hygiene management
Fishing port that serves as a distribution base
(Class 3 fishing ports) Creation of seagrass
beds
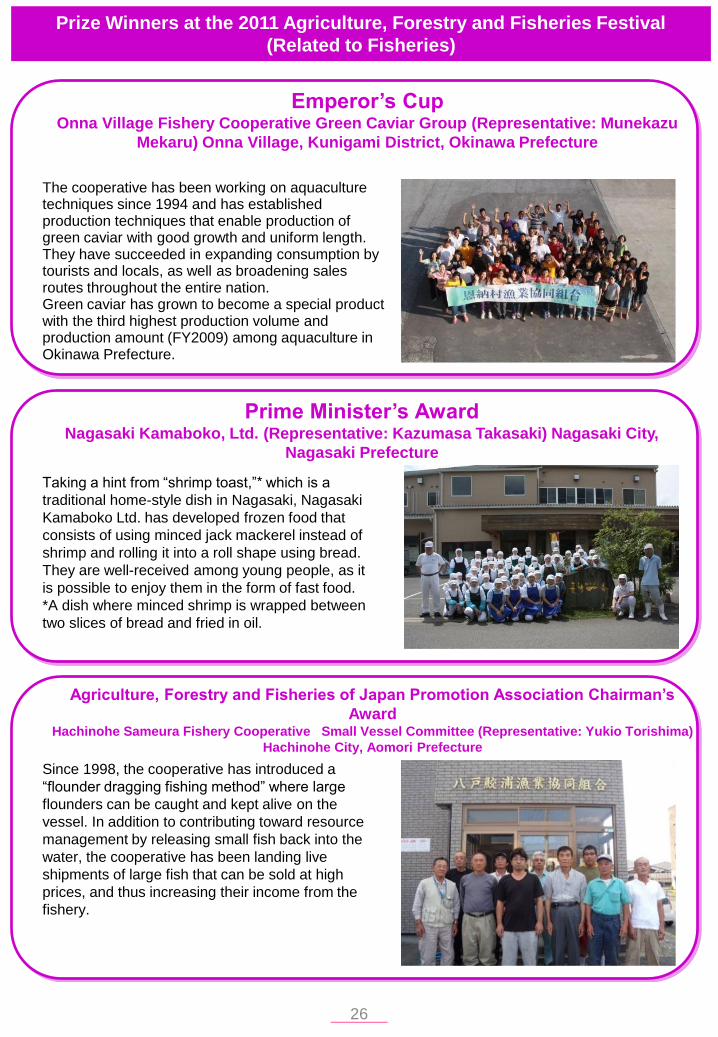
Prize Winners at the 2011 Agriculture, Forestry and Fisheries Festival
(Related to Fisheries)
The cooperative has been working on aquaculture techniques since 1994 and has established production techniques that enable production of green caviar with good growth and uniform length. They have succeeded in expanding consumption by tourists and locals, as well as broadening sales routes throughout the entire nation. Green caviar has grown to become a special product with the third highest production volume and production amount (FY2009) among aquaculture in Okinawa Prefecture.
Emperor’s Cup Onna Village Fishery Cooperative Green Caviar Group (Representative: Munekazu
Mekaru) Onna Village, Kunigami District, Okinawa Prefecture
Prime Minister’s Award Nagasaki Kamaboko, Ltd. (Representative: Kazumasa Takasaki) Nagasaki City,
Nagasaki Prefecture
Agriculture, Forestry and Fisheries of Japan Promotion Association Chairman’s
Award
Hachinohe Sameura Fishery Cooperative Small Vessel Committee (Representative: Yukio Torishima)
Hachinohe City, Aomori Prefecture
Taking a hint from “shrimp toast,”* which is a
traditional home-style dish in Nagasaki, Nagasaki
Kamaboko Ltd. has developed frozen food that
consists of using minced jack mackerel instead of
shrimp and rolling it into a roll shape using bread.
They are well-received among young people, as it
is possible to enjoy them in the form of fast food.
*A dish where minced shrimp is wrapped between
two slices of bread and fried in oil.
Since 1998, the cooperative has introduced a
“flounder dragging fishing method” where large
flounders can be caught and kept alive on the
vessel. In addition to contributing toward resource
management by releasing small fish back into the
water, the cooperative has been landing live
shipments of large fish that can be sold at high
prices, and thus increasing their income from the
fishery.
26
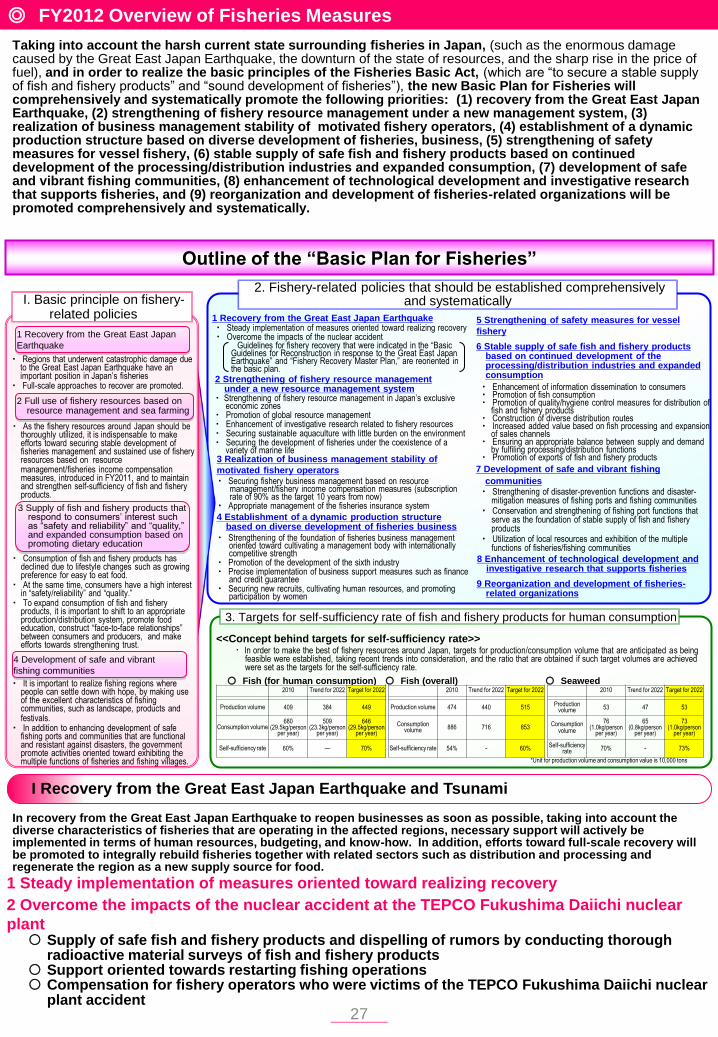
◎ FY2012 Overview of Fisheries Measures
7 Development of safe and vibrant fishing
communities
1 Recovery from the Great East Japan Earthquake
6 Stable supply of safe fish and fishery products based on continued development of the processing/distribution industries and expanded consumption 2 Strengthening of fishery resource management
under a new resource management system
3 Realization of business management stability of
motivated fishery operators
9 Reorganization and development of fisheries-related organizations
5 Strengthening of safety measures for vessel
fishery
8 Enhancement of technological development and investigative research that supports fisheries
4 Establishment of a dynamic production structure based on diverse development of fisheries business
・ Strengthening of disaster-prevention functions and disaster-mitigation measures of fishing ports and fishing communities
・ Conservation and strengthening of fishing port functions that serve as the foundation of stable supply of fish and fishery products
・ Utilization of local resources and exhibition of the multiple functions of fisheries/fishing communities
・ Steady implementation of measures oriented toward realizing recovery ・ Overcome the impacts of the nuclear accident
・ Enhancement of information dissemination to consumers ・ Promotion of fish consumption ・ Promotion of quality/hygiene control measures for distribution of
fish and fishery products ・ Construction of diverse distribution routes ・ Increased added value based on fish processing and expansion
of sales channels ・ Ensuring an appropriate balance between supply and demand
by fulfiling processing/distribution functions ・ Promotion of exports of fish and fishery products
・ Strengthening of fishery resource management in Japan’s exclusive economic zones
・ Promotion of global resource management ・ Enhancement of investigative research related to fishery resources ・ Securing sustainable aquaculture with little burden on the environment ・ Securing the development of fisheries under the coexistence of a
variety of marine life
・ Securing fishery business management based on resource management/fishery income compensation measures (subscription rate of 90% as the target 10 years from now)
・ Appropriate management of the fisheries insurance system
・ Strengthening of the foundation of fisheries business management oriented toward cultivating a management body with internationally competitive strength
・ Promotion of the development of the sixth industry ・ Precise implementation of business support measures such as finance
and credit guarantee ・ Securing new recruits, cultivating human resources, and promoting
participation by women
Guidelines for fishery recovery that were indicated in the “Basic Guidelines for Reconstruction in response to the Great East Japan Earthquake” and “Fishery Recovery Master Plan,” are reoriented in the basic plan.
Outline of the “Basic Plan for Fisheries”
1 Recovery from the Great East Japan
Earthquake
2 Full use of fishery resources based on resource management and sea farming
3 Supply of fish and fishery products that respond to consumers’ interest such as “safety and reliability” and “quality,” and expanded consumption based on promoting dietary education
4 Development of safe and vibrant
fishing communities
・ Regions that underwent catastrophic damage due to the Great East Japan Earthquake have an important position in Japan’s fisheries
・ Full-scale approaches to recover are promoted.
・ As the fishery resources around Japan should be thoroughly utilized, it is indispensable to make efforts toward securing stable development of fisheries management and sustained use of fishery resources based on resource
management/fisheries income compensation measures, introduced in FY2011, and to maintain and strengthen self-sufficiency of fish and fishery products.
・ Consumption of fish and fishery products has declined due to lifestyle changes such as growing preference for easy to eat food.
・ At the same time, consumers have a high interest in “safety/reliability” and “quality.”
・ To expand consumption of fish and fishery products, it is important to shift to an appropriate production/distribution system, promote food education, construct “face-to-face relationships” between consumers and producers, and make efforts towards strengthening trust.
・ It is important to realize fishing regions where people can settle down with hope, by making use of the excellent characteristics of fishing communities, such as landscape, products and
festivals. ・ In addition to enhancing development of safe
fishing ports and communities that are functional and resistant against disasters, the government promote activities oriented toward exhibiting the multiple functions of fisheries and fishing villages.
<<Concept behind targets for self-sufficiency rate>>
○ Fish (for human consumption) ○ Fish (overall) ○ Seaweed
*Unit for production volume and consumption value is 10,000 tons
・In order to make the best of fishery resources around Japan, targets for production/consumption volume that are anticipated as being feasible were established, taking recent trends into consideration, and the ratio that are obtained if such target volumes are achieved were set as the targets for the self-sufficiency rate.
2. Fishery-related policies that should be established comprehensively and systematically I. Basic principle on fishery-
related policies
3. Targets for self-sufficiency rate of fish and fishery products for human consumption
2010 Trend for 2022 Target for 2022 2010 Trend for 2022 Target for 2022 2010 Trend for 2022 Target for 2022
Production volume 409 384 449 Production volume 474 440 515 Production
volume 53 47 53
Consumption volume 680
(29.5kg/person per year)
509 (23.3kg/person
per year)
646 (29.5kg/person
per year)
Consumption volume 886 716 853
Consumption volume
76 (1.0kg/person
per year)
65 (0.8kg/person
per year)
73 (1.0kg/person
per year)
Self-sufficiency rate 60% — 70% Self-sufficiency rate 54% - 60% Self-sufficiency
rate 70% - 73%
I Recovery from the Great East Japan Earthquake and Tsunami
1 Steady implementation of measures oriented toward realizing recovery
2 Overcome the impacts of the nuclear accident at the TEPCO Fukushima Daiichi nuclear
plant
Taking into account the harsh current state surrounding fisheries in Japan, (such as the enormous damage caused by the Great East Japan Earthquake, the downturn of the state of resources, and the sharp rise in the price of fuel), and in order to realize the basic principles of the Fisheries Basic Act, (which are “to secure a stable supply of fish and fishery products” and “sound development of fisheries”), the new Basic Plan for Fisheries will comprehensively and systematically promote the following priorities: (1) recovery from the Great East Japan Earthquake, (2) strengthening of fishery resource management under a new management system, (3) realization of business management stability of motivated fishery operators, (4) establishment of a dynamic production structure based on diverse development of fisheries, business, (5) strengthening of safety measures for vessel fishery, (6) stable supply of safe fish and fishery products based on continued development of the processing/distribution industries and expanded consumption, (7) development of safe and vibrant fishing communities, (8) enhancement of technological development and investigative research that supports fisheries, and (9) reorganization and development of fisheries-related organizations will be promoted comprehensively and systematically.
In recovery from the Great East Japan Earthquake to reopen businesses as soon as possible, taking into account the diverse characteristics of fisheries that are operating in the affected regions, necessary support will actively be implemented in terms of human resources, budgeting, and know-how. In addition, efforts toward full-scale recovery will be promoted to integrally rebuild fisheries together with related sectors such as distribution and processing and regenerate the region as a new supply source for food.
Supply of safe fish and fishery products and dispelling of rumors by conducting thorough radioactive material surveys of fish and fishery products
Support oriented towards restarting fishing operations Compensation for fishery operators who were victims of the TEPCO Fukushima Daiichi nuclear
plant accident 27
→
Figure:
Direct
Insertion
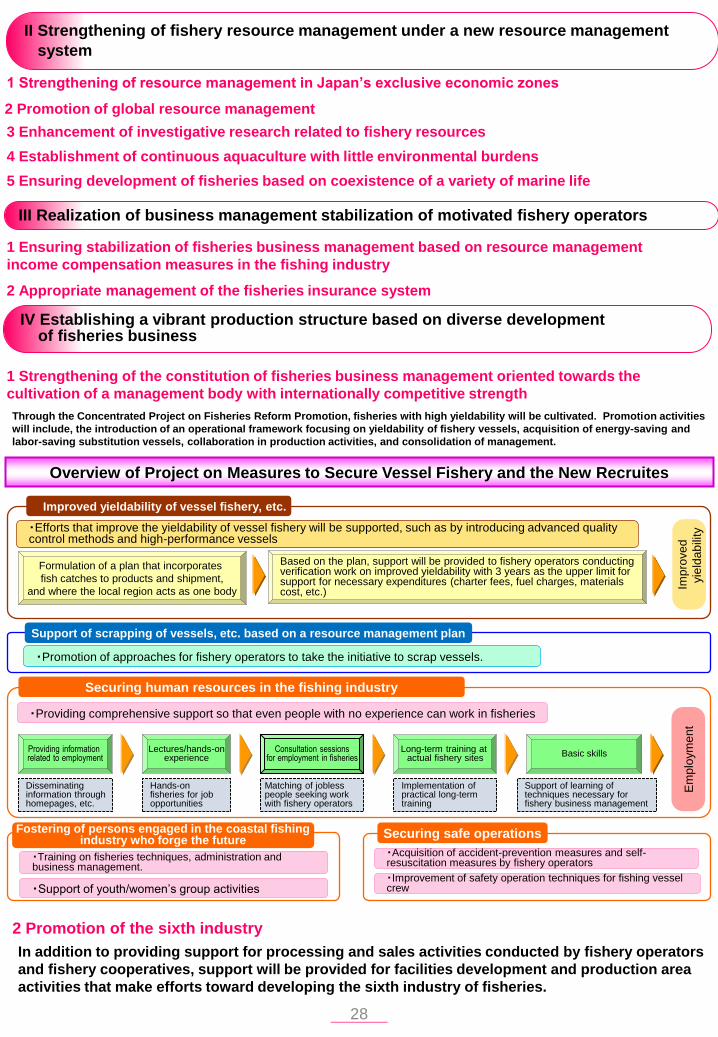
II Strengthening of fishery resource management under a new resource management
system
1 Strengthening of resource management in Japan’s exclusive economic zones
2 Promotion of global resource management
3 Enhancement of investigative research related to fishery resources
4 Establishment of continuous aquaculture with little environmental burdens
5 Ensuring development of fisheries based on coexistence of a variety of marine life
III Realization of business management stabilization of motivated fishery operators
1 Ensuring stabilization of fisheries business management based on resource management
income compensation measures in the fishing industry
2 Appropriate management of the fisheries insurance system
IV Establishing a vibrant production structure based on diverse development of fisheries business
1 Strengthening of the constitution of fisheries business management oriented towards the
cultivation of a management body with internationally competitive strength
Through the Concentrated Project on Fisheries Reform Promotion, fisheries with high yieldability will be cultivated. Promotion activities
will include, the introduction of an operational framework focusing on yieldability of fishery vessels, acquisition of energy-saving and
labor-saving substitution vessels, collaboration in production activities, and consolidation of management.
2 Promotion of the sixth industry
In addition to providing support for processing and sales activities conducted by fishery operators
and fishery cooperatives, support will be provided for facilities development and production area
activities that make efforts toward developing the sixth industry of fisheries.
Securing human resources in the fishing industry
Providing information related to employment
Long-term training at actual fishery sites
Lectures/hands-on experience
Disseminating information through homepages, etc.
Hands-on fisheries for job opportunities
Matching of jobless people seeking work with fishery operators
Implementation of practical long-term training
Consultation sessions for employment in fisheries
Basic skills
Support of learning of techniques necessary for fishery business management
・Providing comprehensive support so that even people with no experience can work in fisheries
Fostering of persons engaged in the coastal fishing industry who forge the future
・Training on fisheries techniques, administration and business management.
・Support of youth/women’s group activities
Em
plo
ym
en
t
Securing safe operations
・Acquisition of accident-prevention measures and self-resuscitation measures by fishery operators
・Improvement of safety operation techniques for fishing vessel crew
Support of scrapping of vessels, etc. based on a resource management plan
・Promotion of approaches for fishery operators to take the initiative to scrap vessels.
Improved yieldability of vessel fishery, etc.
・Efforts that improve the yieldability of vessel fishery will be supported, such as by introducing advanced quality control methods and high-performance vessels
Formulation of a plan that incorporates
fish catches to products and shipment,
and where the local region acts as one body
Based on the plan, support will be provided to fishery operators conducting verification work on improved yieldability with 3 years as the upper limit for support for necessary expenditures (charter fees, fuel charges, materials cost, etc.)
Imp
rove
d
yie
lda
bili
ty
Overview of Project on Measures to Secure Vessel Fishery and the New Recruites
28
→
Figure:
Direct
Insertion
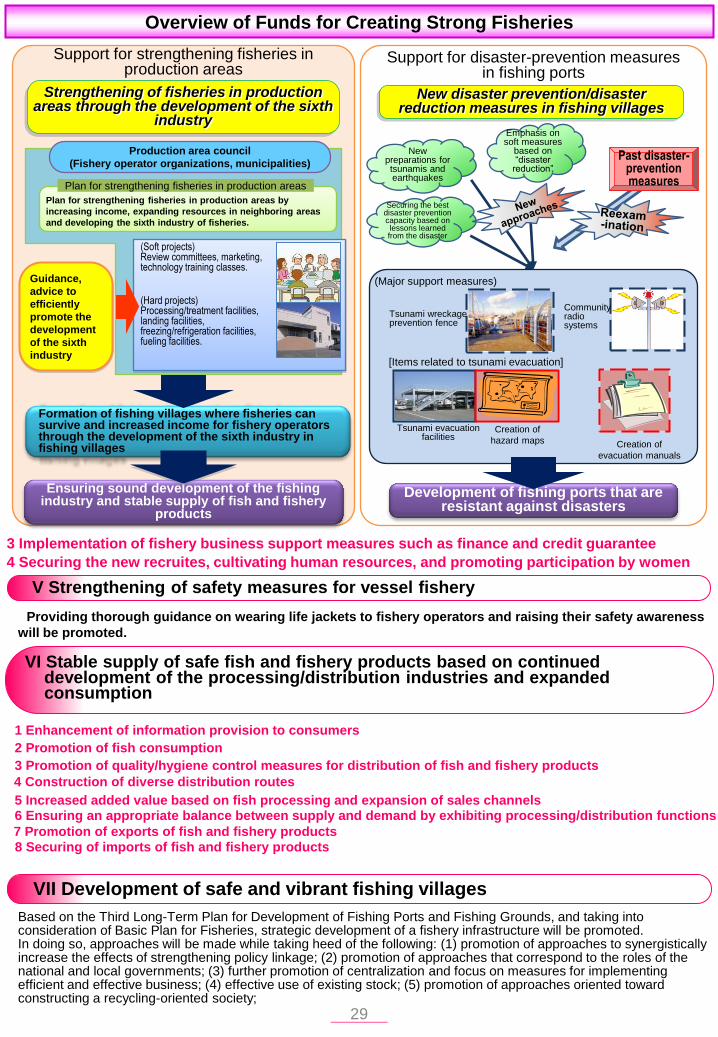
Overview of Funds for Creating Strong Fisheries
Support for strengthening fisheries in production areas
Support for disaster-prevention measures in fishing ports
New disaster prevention/disaster reduction measures in fishing villages
Strengthening of fisheries in production areas through the development of the sixth
industry
Production area council
(Fishery operator organizations, municipalities)
New preparations for tsunamis and earthquakes
Past disaster-prevention measures
Securing the best disaster prevention capacity based on lessons learned from the disaster
Emphasis on soft measures
based on “disaster
reduction”
Guidance,
advice to
efficiently
promote the
development
of the sixth
industry
Formation of fishing villages where fisheries can survive and increased income for fishery operators through the development of the sixth industry in fishing villages
Ensuring sound development of the fishing industry and stable supply of fish and fishery
products
(Soft projects) Review committees, marketing, technology training classes.
(Hard projects) Processing/treatment facilities, landing facilities, freezing/refrigeration facilities, fueling facilities.
Plan for strengthening fisheries in production areas by
increasing income, expanding resources in neighboring areas
and developing the sixth industry of fisheries.
Plan for strengthening fisheries in production areas
Development of fishing ports that are resistant against disasters
(Major support measures)
Tsunami wreckage prevention fence
Community radio systems
Creation of
evacuation manuals
Tsunami evacuation facilities
Creation of
hazard maps
[Items related to tsunami evacuation]
VI Stable supply of safe fish and fishery products based on continued development of the processing/distribution industries and expanded consumption
3 Implementation of fishery business support measures such as finance and credit guarantee
4 Securing the new recruites, cultivating human resources, and promoting participation by women
V Strengthening of safety measures for vessel fishery
Providing thorough guidance on wearing life jackets to fishery operators and raising their safety awareness
will be promoted.
Based on the Third Long-Term Plan for Development of Fishing Ports and Fishing Grounds, and taking into consideration of Basic Plan for Fisheries, strategic development of a fishery infrastructure will be promoted. In doing so, approaches will be made while taking heed of the following: (1) promotion of approaches to synergistically increase the effects of strengthening policy linkage; (2) promotion of approaches that correspond to the roles of the national and local governments; (3) further promotion of centralization and focus on measures for implementing efficient and effective business; (4) effective use of existing stock; (5) promotion of approaches oriented toward constructing a recycling-oriented society;
VII Development of safe and vibrant fishing villages
29
→
Figure:
Direct
Insertion
1 Enhancement of information provision to consumers
2 Promotion of fish consumption
3 Promotion of quality/hygiene control measures for distribution of fish and fishery products
4 Construction of diverse distribution routes
5 Increased added value based on fish processing and expansion of sales channels 6 Ensuring an appropriate balance between supply and demand by exhibiting processing/distribution functions
7 Promotion of exports of fish and fishery products 8 Securing of imports of fish and fishery products

○Taking into consideration of the Great East Japan Earth quake, the Third Long-Term Plan for Development of Fishing Ports has been established. This plan places a priority on recovery of marine resources and hygiene management of fishing ports that serve as a distribution base, and will promote the reinforcement of safety measures for fishing ports against earthquakes and tsunamis.
・Aging of fishing port facilities ・Preparations against storm surges/ tidal waves
caused by low pressure, and earthquake/tsunami disasters
・Measures for extending the life of fishing port facilities ・Safety measures for fishing ports in response to
storm surges/tidal waves and earthquake/tsunamis
Safety measures for fishing
ports
Measures against aging Safety/disaster prevention measures for fishing ports
Development of fishing ports
as distribution bases ・Safety/reliability of fish and fishery products ・Hygiene control measures for hub fishing ports that are linked to approaches for export promotion
・Hygiene control measures for fishing ports that serve as distribution hubs, such as specified type III fishing ports
・Strengthening of distribution and processing functions
Goods disposal sites with hygiene management
Fishing ports that serve as distribution hubs
Development of marine
environment
Preservation and creation of seagrass beds
Large-scale upwelling fishing grounds
・Development of frontier fishing grounds ・Preservation/creation of seagrass beds and
tidelands, and wide-area development of fishing grounds
・Approximately 40% of fishery resources evaluated are at low level ・Decline in seagrass beds/tidal flats
(6) use of private funds and energy; (7) ensuring transparency and rigorous administration of business evaluations;
and (8) appropriate implementation of cost reduction and quality assurance of public works projects.
Overview of fisheries infrastructure development projects
1 Strengthening of disaster-prevention functions and disaster-mitigation measures of fishing
ports and fishing villages
2 Conservation and strengthening of fishing port functions that serve as the foundation of stable
supply of fish and fishery products
3 Utilization of local resources and exhibition of the multiple functions of fisheries/fishing villages
VIII Enhancement of technological development and investigative research that supports fisheries
1 Development and popularization of new technology that paves the way for the future of fisheries
2 Steady implementation of basic surveys and research such as marine environment monitoring.
IX Reorganization and development of fisheries-related organizations
1 Reorganization of fisheries-related organizations.
2 Securing the business infrastructure of fisheries insurance organizations
X Other important measures
1 Approaches toward WTO negotiations.
2 Promotion of the creation and use of statistics that support policy needs
XI Necessary items for comprehensively and systematically promoting fisheries-related measures
1 Expansion of measures based on the experience of the Great East Japan Earthquake
2 Efficient promotion of measures based on coordination with relevant Ministries.
3 Expansion of measures from a public perspective based on the needs of consumers and the
public
4 Promotion of the exhibition of independence, originality and ingenuity of business operators
and production regions
5 Efficient and focused administration of fiscal measures
30
→
Figure:
Direct
Insertion
Recommended