Copyright Mizuho Research Institute Ltd. All Rights Reserved.
February 14, 2017
FY2016, FY2017, FY2018 Economic Outlook- While the global economy is on growth track, US policy agenda and European political developments are risk factors -
1
Key points of our forecast
The global economy is forecast to follow an expansion track in 2017 and 2018, driven by the recovery of the USeconomy and upturn of the commodity-producing economies.
The current global economic recovery stems from (1) the improvement of the IT cycle, (2) the upturn of China’s importsalong with the recovery of its domestic demand, and (3) the rise of commodity prices.
The sustainability of the expansion depends upon the direction of US policy measures and rests upon the premise thatdue fiscal expansion and deregulation are implemented.
The pursuit of excessively protectionist policies would serve as downside risks to the global economy. “Borderadjustment” by the US may have a negative impact upon the global economy via the decline of exports.
Even though the US policy mix (fiscal expansion and interest rate hike) is a dollar-strengthening factor, an excessivestrengthening of the dollar may lead to greater EM risks through capital flight and rise of interest rates.
Given a number of key events such as the German and French elections and Brexit notification, European politicaldevelopments also provide sources of concern.
The Japanese economy will pick up in FY2017. The recovery of overseas economies, the improvement of the inventorycycle, and the implementation of public investment along with the economic stimulus measures will serve as positivefactors. Japan’s economic growth will continue in FY2018 as the driver of growth shifts from external to domesticdemand.
Japan’s core inflation rate will rise to the 1%-level. However, the improvement of the underlying trend in inflationexcluding the impact of energy prices will remain moderate. The Bank of Japan (BOJ) will most likely keep monetarypolicy on hold while gradually reducing the amount of government bond purchases.
2
I. The Global Economy
The global economy is growing
3
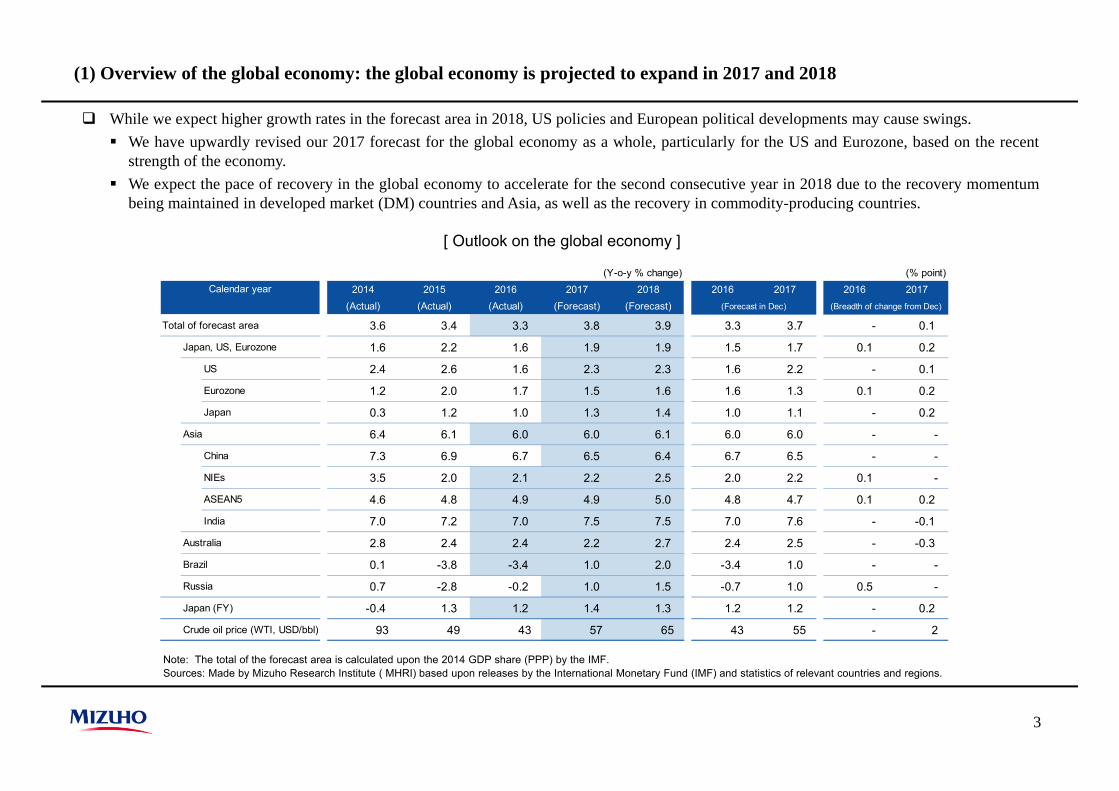
[ Outlook on the global economy ]
While we expect higher growth rates in the forecast area in 2018, US policies and European political developments may cause swings. We have upwardly revised our 2017 forecast for the global economy as a whole, particularly for the US and Eurozone, based on the recent
strength of the economy. We expect the pace of recovery in the global economy to accelerate for the second consecutive year in 2018 due to the recovery momentum
being maintained in developed market (DM) countries and Asia, as well as the recovery in commodity-producing countries.
Note: The total of the forecast area is calculated upon the 2014 GDP share (PPP) by the IMF.Sources: Made by Mizuho Research Institute ( MHRI) based upon releases by the International Monetary Fund (IMF) and statistics of relevant countries and regions.
(Y-o-y % change) (% point)2014 2015 2016 2017 2018 2016 2017 2016 2017
(Actual) (Actual) (Actual) (Forecast) (Forecast)
Total of forecast area 3.6 3.4 3.3 3.8 3.9 3.3 3.7 - 0.1
Japan, US, Eurozone 1.6 2.2 1.6 1.9 1.9 1.5 1.7 0.1 0.2
US 2.4 2.6 1.6 2.3 2.3 1.6 2.2 - 0.1
Eurozone 1.2 2.0 1.7 1.5 1.6 1.6 1.3 0.1 0.2
Japan 0.3 1.2 1.0 1.3 1.4 1.0 1.1 - 0.2
Asia 6.4 6.1 6.0 6.0 6.1 6.0 6.0 - -
China 7.3 6.9 6.7 6.5 6.4 6.7 6.5 - -
NIEs 3.5 2.0 2.1 2.2 2.5 2.0 2.2 0.1 -
ASEAN5 4.6 4.8 4.9 4.9 5.0 4.8 4.7 0.1 0.2
India 7.0 7.2 7.0 7.5 7.5 7.0 7.6 - -0.1
Australia 2.8 2.4 2.4 2.2 2.7 2.4 2.5 - -0.3
Brazil 0.1 -3.8 -3.4 1.0 2.0 -3.4 1.0 - -
Russia 0.7 -2.8 -0.2 1.0 1.5 -0.7 1.0 0.5 -
Japan (FY) -0.4 1.3 1.2 1.4 1.3 1.2 1.2 - 0.2
Crude oil price (WTI, USD/bbl) 93 49 43 57 65 43 55 - 2
Calendar year
(Breadth of change from Dec)(Forecast in Dec)
(1) Overview of the global economy: the global economy is projected to expand in 2017 and 2018
4
(2) Overview of the global economy: the recovery is gaining momentum
Source: Made by MHRI based upon Markit
[ The Global Manufacturing PMI and the Li Keqiang Index ] [ OECD Leading Indicators ]
97
98
99
100
101
102
2011 12 13 14 15 16
US EurozoneJapan China
(yy)
(Long-term average = 100)
Indicates animprovement
Source: Made by MHRI based upon OECD
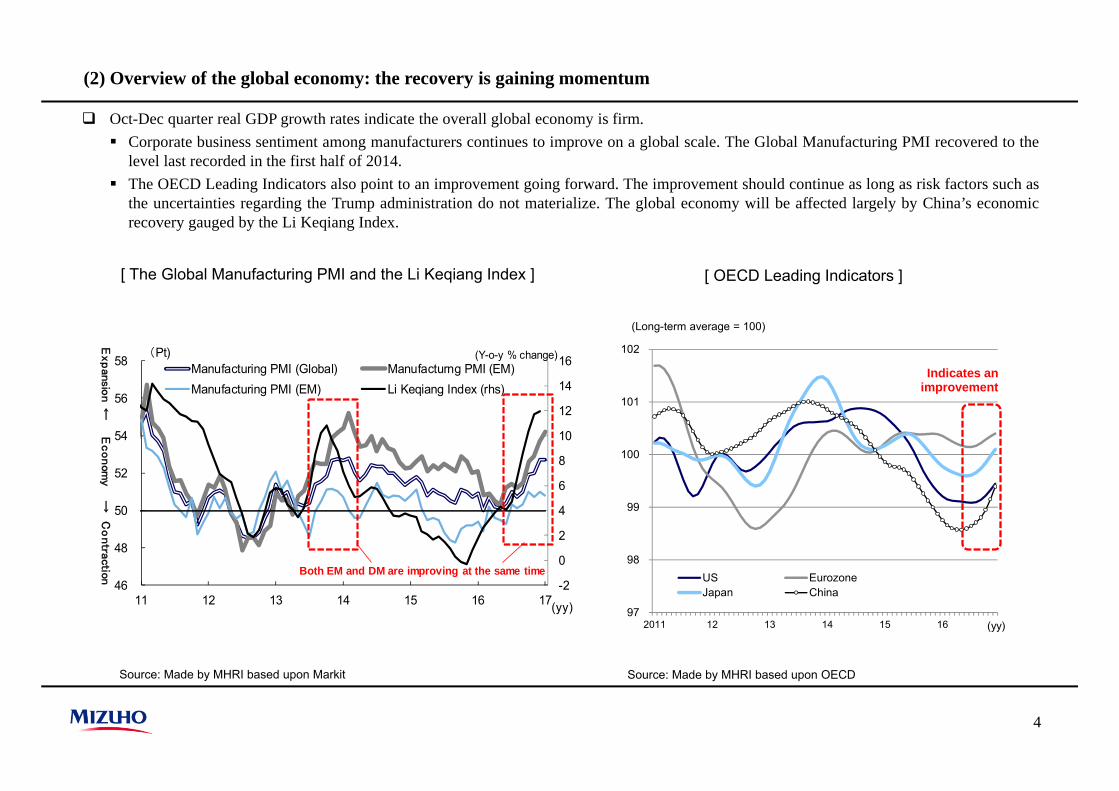
Oct-Dec quarter real GDP growth rates indicate the overall global economy is firm. Corporate business sentiment among manufacturers continues to improve on a global scale. The Global Manufacturing PMI recovered to the
level last recorded in the first half of 2014. The OECD Leading Indicators also point to an improvement going forward. The improvement should continue as long as risk factors such as
the uncertainties regarding the Trump administration do not materialize. The global economy will be affected largely by China’s economicrecovery gauged by the Li Keqiang Index.
-2
0
2
4
6
8
10
12
14
16
46
48
50
52
54
56
58
11 12 13 14 15 16 17
(Pt)
(yy)
Manufacturing PMI (Global) Manufacturng PMI (EM)Manufacturing PMI (EM) Li Keqiang Index (rhs)
Expansio
n←
Econom
y→
Contraction
(Y-o-y % change)
Both EM and DM are improving at the same time
Despite the 3Ls (low growth, low inflation, low interest rates), economic growth and long-term interest rates are showing signs of change
[ Global economic growth and inflation rate ] [ DM long-term interest rates ]
Note: The inflation rate refers to the CPI. The inflation rate forecast is based upon the IMF. Source: Made by MHRI based upon IMF
Note: Long-term interest rates refer to the yields on 10-yr government bonds of each of the countries. Forecasts are by MHRI.
Source: Made by MHRI based upon Bloomberg
5
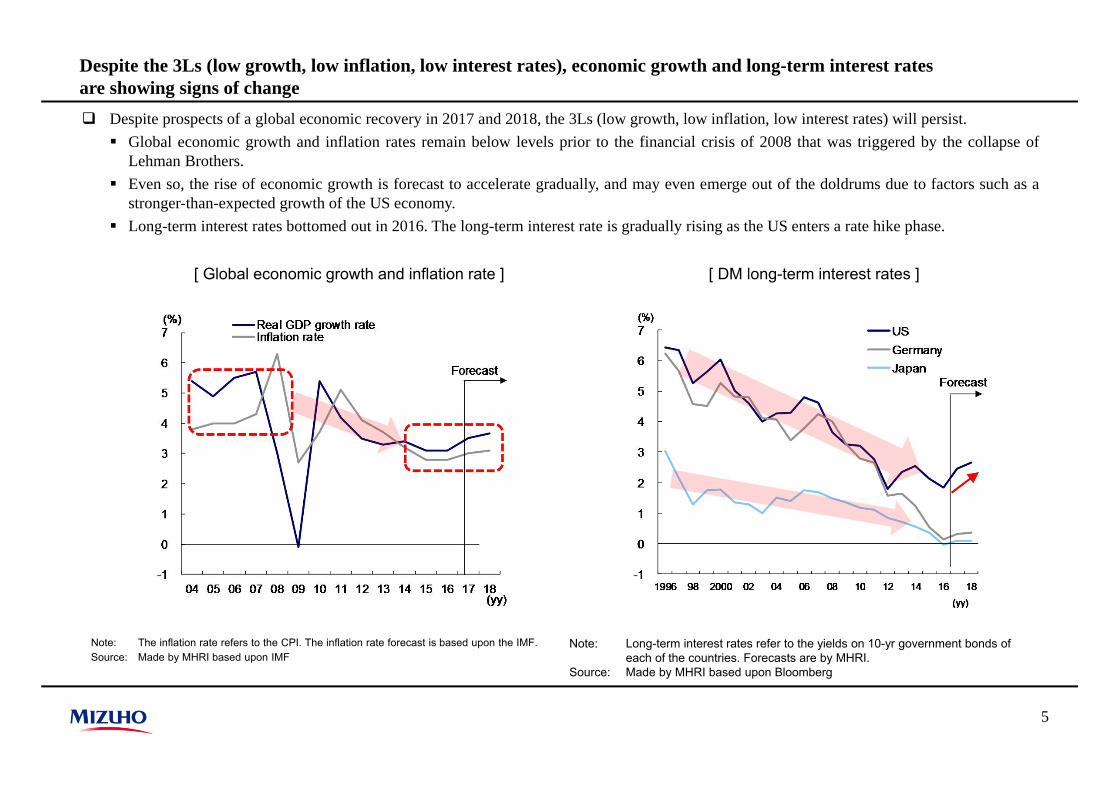
Despite prospects of a global economic recovery in 2017 and 2018, the 3Ls (low growth, low inflation, low interest rates) will persist. Global economic growth and inflation rates remain below levels prior to the financial crisis of 2008 that was triggered by the collapse of
Lehman Brothers. Even so, the rise of economic growth is forecast to accelerate gradually, and may even emerge out of the doldrums due to factors such as a
stronger-than-expected growth of the US economy. Long-term interest rates bottomed out in 2016. The long-term interest rate is gradually rising as the US enters a rate hike phase.
6
Policy: the global economy is being underpinned by fiscal policy amid rising awareness of monetary policy limitations
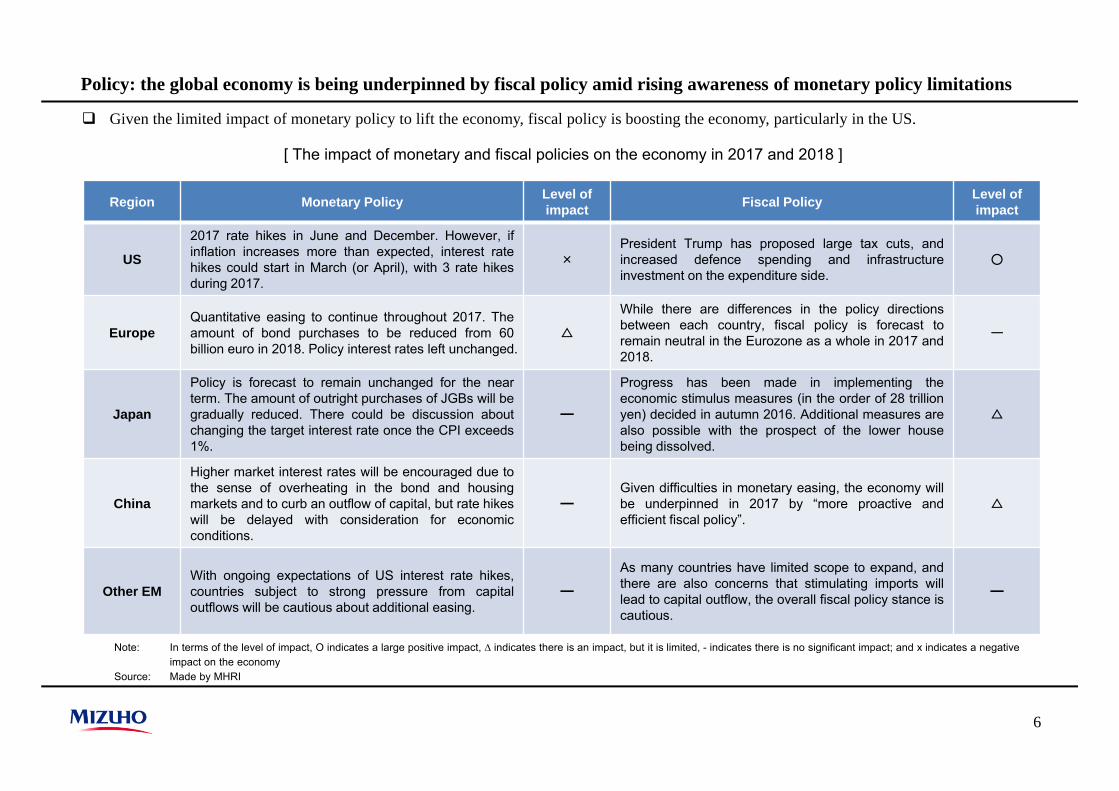
Given the limited impact of monetary policy to lift the economy, fiscal policy is boosting the economy, particularly in the US.
Note: In terms of the level of impact, O indicates a large positive impact, ∆ indicates there is an impact, but it is limited, - indicates there is no significant impact; and x indicates a negative impact on the economy
Source: Made by MHRI
[ The impact of monetary and fiscal policies on the economy in 2017 and 2018 ]
Region Monetary Policy Level of impact Fiscal Policy Level of
impact
US
2017 rate hikes in June and December. However, ifinflation increases more than expected, interest ratehikes could start in March (or April), with 3 rate hikesduring 2017.
×President Trump has proposed large tax cuts, andincreased defence spending and infrastructureinvestment on the expenditure side.
○
EuropeQuantitative easing to continue throughout 2017. Theamount of bond purchases to be reduced from 60billion euro in 2018. Policy interest rates left unchanged.
△
While there are differences in the policy directionsbetween each country, fiscal policy is forecast toremain neutral in the Eurozone as a whole in 2017 and2018.
ー
Japan
Policy is forecast to remain unchanged for the nearterm. The amount of outright purchases of JGBs will begradually reduced. There could be discussion aboutchanging the target interest rate once the CPI exceeds1%.
━
Progress has been made in implementing theeconomic stimulus measures (in the order of 28 trillionyen) decided in autumn 2016. Additional measures arealso possible with the prospect of the lower housebeing dissolved.
△
China
Higher market interest rates will be encouraged due tothe sense of overheating in the bond and housingmarkets and to curb an outflow of capital, but rate hikeswill be delayed with consideration for economicconditions.
━Given difficulties in monetary easing, the economy willbe underpinned in 2017 by “more proactive andefficient fiscal policy”.
△
Other EMWith ongoing expectations of US interest rate hikes,countries subject to strong pressure from capitaloutflows will be cautious about additional easing.
━
As many countries have limited scope to expand, andthere are also concerns that stimulating imports willlead to capital outflow, the overall fiscal policy stance iscautious.
━
7
US: companies are showing signs of regaining their animal spirits
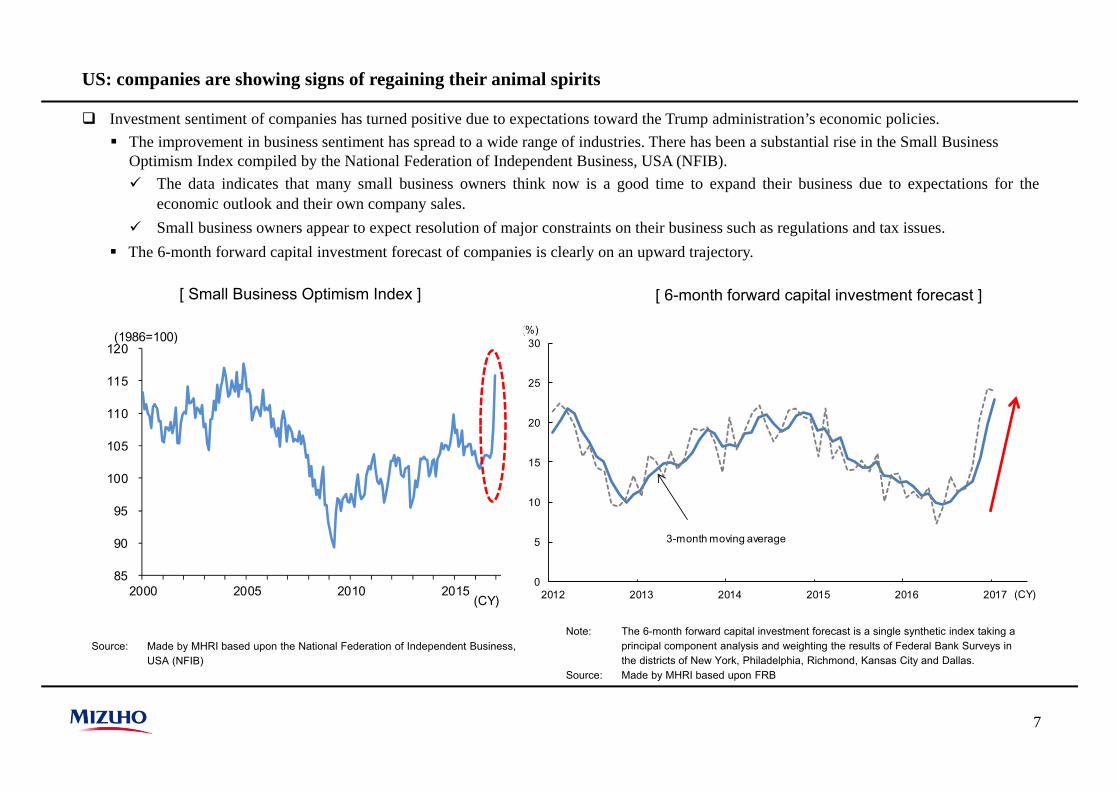
Investment sentiment of companies has turned positive due to expectations toward the Trump administration’s economic policies. The improvement in business sentiment has spread to a wide range of industries. There has been a substantial rise in the Small Business
Optimism Index compiled by the National Federation of Independent Business, USA (NFIB). The data indicates that many small business owners think now is a good time to expand their business due to expectations for the
economic outlook and their own company sales. Small business owners appear to expect resolution of major constraints on their business such as regulations and tax issues.
The 6-month forward capital investment forecast of companies is clearly on an upward trajectory.
Source: Made by MHRI based upon the National Federation of Independent Business,USA (NFIB)
[ Small Business Optimism Index ] [ 6-month forward capital investment forecast ]
Note: The 6-month forward capital investment forecast is a single synthetic index taking a principal component analysis and weighting the results of Federal Bank Surveys in the districts of New York, Philadelphia, Richmond, Kansas City and Dallas.
Source: Made by MHRI based upon FRB
0
5
10
15
20
25
30
2012 2013 2014 2015 2016 2017
(%)
(CY)
3-month moving average
(CY)
(1986=100)
85
90
95
100
105
110
115
120
2000 2005 2010 2015
8
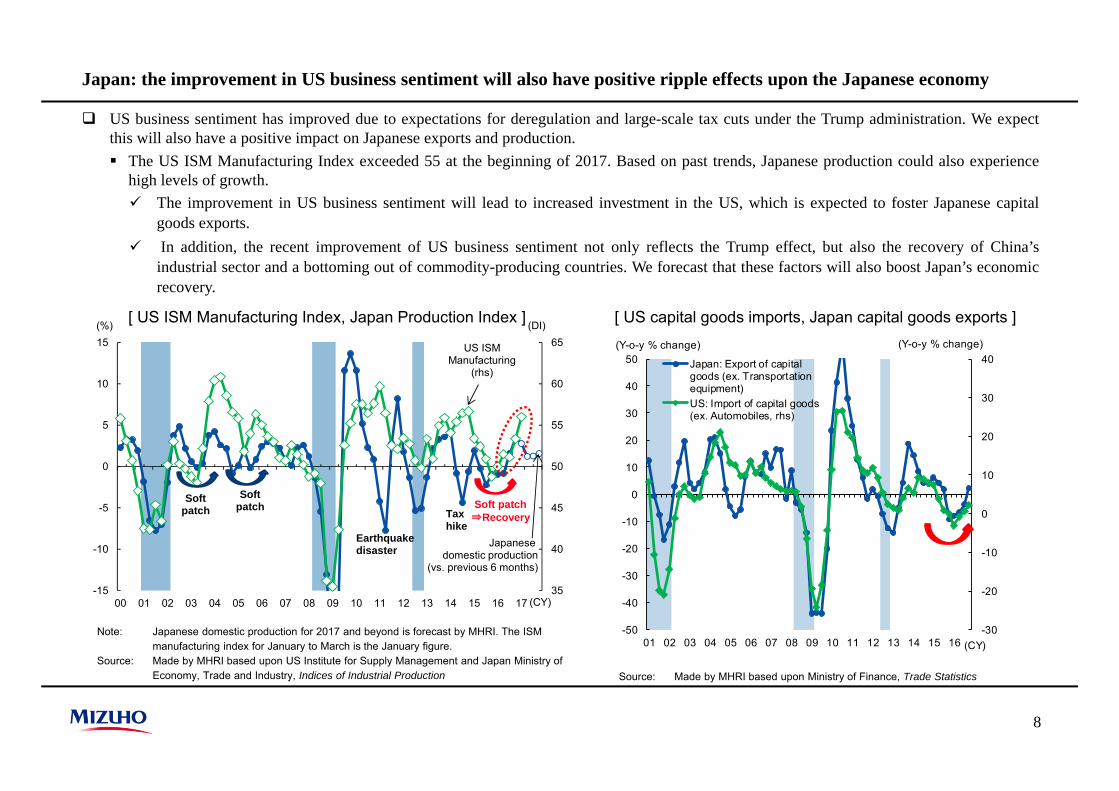
Japan: the improvement in US business sentiment will also have positive ripple effects upon the Japanese economy
US business sentiment has improved due to expectations for deregulation and large-scale tax cuts under the Trump administration. We expectthis will also have a positive impact on Japanese exports and production. The US ISM Manufacturing Index exceeded 55 at the beginning of 2017. Based on past trends, Japanese production could also experience
high levels of growth. The improvement in US business sentiment will lead to increased investment in the US, which is expected to foster Japanese capital
goods exports. In addition, the recent improvement of US business sentiment not only reflects the Trump effect, but also the recovery of China’s
industrial sector and a bottoming out of commodity-producing countries. We forecast that these factors will also boost Japan’s economicrecovery.
Note: Japanese domestic production for 2017 and beyond is forecast by MHRI. The ISM manufacturing index for January to March is the January figure.
Source: Made by MHRI based upon US Institute for Supply Management and Japan Ministry of Economy, Trade and Industry, Indices of Industrial Production
[ US capital goods imports, Japan capital goods exports ]
Source: Made by MHRI based upon Ministry of Finance, Trade Statistics
-30
-20
-10
0
10
20
30
40
-50
-40
-30
-20
-10
0
10
20
30
40
50
01 02 03 04 05 06 07 08 09 10 11 12 13 14 15 16
Japan: Export of capitalgoods (ex. Transportationequipment)US: Import of capital goods(ex. Automobiles, rhs)
(Y-o-y % change) (Y-o-y % change)
(CY)
35
40
45
50
55
60
65
-15
-10
-5
0
5
10
15
00 01 02 03 04 05 06 07 08 09 10 11 12 13 14 15 16 17
(%) (DI)
Japanese domestic production
(vs. previous 6 months)
US ISM Manufacturing
(rhs)
Softpatch
Earthquake disaster
Taxhike
Softpatch Soft patch
⇒Recovery
(CY)
[ US ISM Manufacturing Index, Japan Production Index ]
9
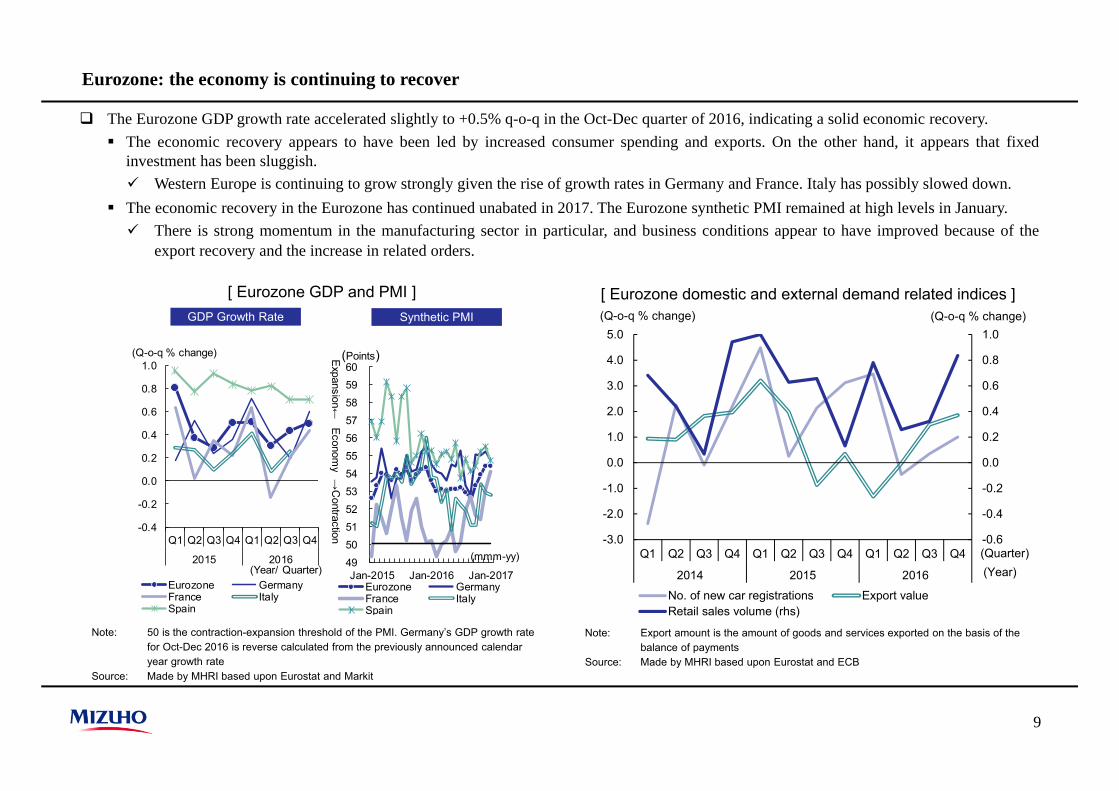
Eurozone: the economy is continuing to recover
The Eurozone GDP growth rate accelerated slightly to +0.5% q-o-q in the Oct-Dec quarter of 2016, indicating a solid economic recovery. The economic recovery appears to have been led by increased consumer spending and exports. On the other hand, it appears that fixed
investment has been sluggish. Western Europe is continuing to grow strongly given the rise of growth rates in Germany and France. Italy has possibly slowed down.
The economic recovery in the Eurozone has continued unabated in 2017. The Eurozone synthetic PMI remained at high levels in January. There is strong momentum in the manufacturing sector in particular, and business conditions appear to have improved because of the
export recovery and the increase in related orders.
Note: 50 is the contraction-expansion threshold of the PMI. Germany’s GDP growth rate for Oct-Dec 2016 is reverse calculated from the previously announced calendar year growth rate
Source: Made by MHRI based upon Eurostat and Markit
[ Eurozone GDP and PMI ] [ Eurozone domestic and external demand related indices ]
Note: Export amount is the amount of goods and services exported on the basis of the balance of payments
Source: Made by MHRI based upon Eurostat and ECB
GDP Growth Rate Synthetic PMI
-0.4
-0.2
0.0
0.2
0.4
0.6
0.8
1.0
Q1 Q2 Q3 Q4 Q1 Q2 Q3 Q4
2015 2016
Eurozone GermanyFrance ItalySpain
(Q-o-q % change)
(Year/ Quarter)495051525354555657585960
Jan-2015 Jan-2016 Jan-2017Eurozone GermanyFrance ItalySpain
(Points)Expansion←
Economy→
Contraction
(mmm-yy)-0.6
-0.4
-0.2
0.0
0.2
0.4
0.6
0.8
1.0
-3.0
-2.0
-1.0
0.0
1.0
2.0
3.0
4.0
5.0
Q1 Q2 Q3 Q4 Q1 Q2 Q3 Q4 Q1 Q2 Q3 Q4
2014 2015 2016
No. of new car registrations Export valueRetail sales volume (rhs)
(Quarter)
(Q-o-q % change) (Q-o-q % change)
(Year)
10
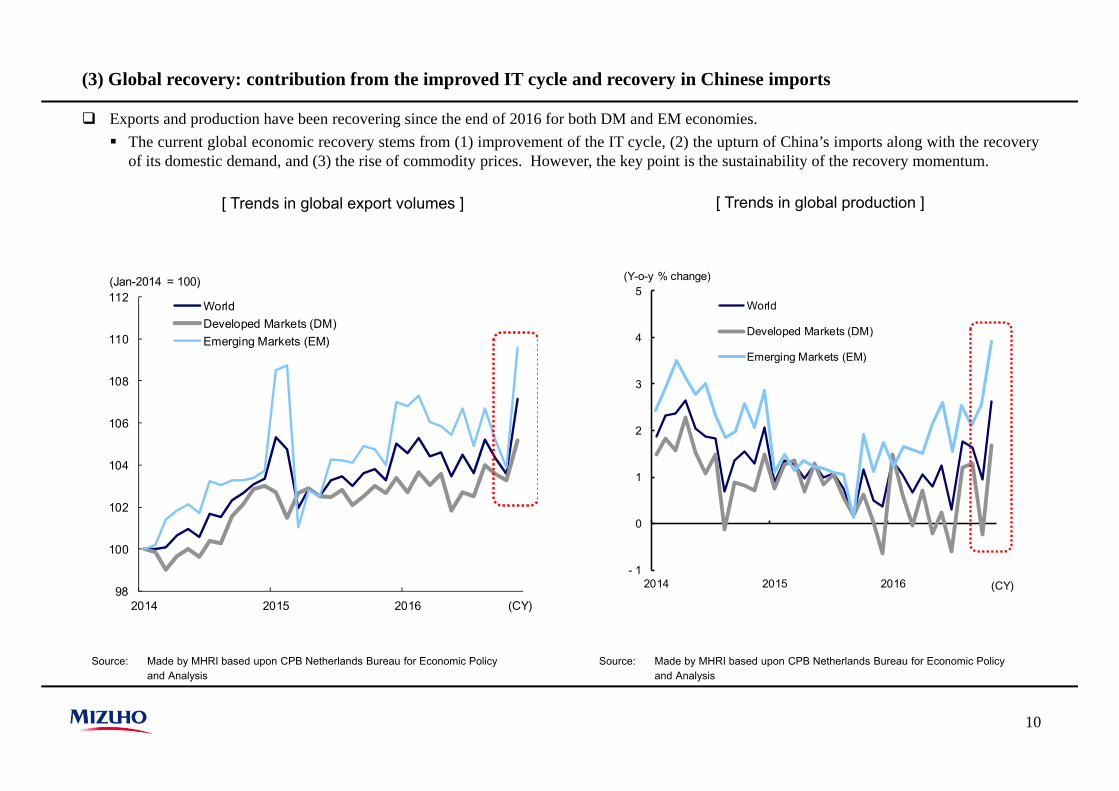
(3) Global recovery: contribution from the improved IT cycle and recovery in Chinese imports
Exports and production have been recovering since the end of 2016 for both DM and EM economies. The current global economic recovery stems from (1) improvement of the IT cycle, (2) the upturn of China’s imports along with the recovery
of its domestic demand, and (3) the rise of commodity prices. However, the key point is the sustainability of the recovery momentum.
Source: Made by MHRI based upon CPB Netherlands Bureau for Economic Policyand Analysis
[ Trends in global export volumes ] [ Trends in global production ]
Source: Made by MHRI based upon CPB Netherlands Bureau for Economic Policyand Analysis
- 1
0
1
2
3
4
5
2014 2015 2016
World
Developed Markets (DM)
Emerging Markets (EM)
(Y-o-y % change)
(CY)98
100
102
104
106
108
110
112
2014 2015 2016
WorldDeveloped Markets (DM)Emerging Markets (EM)
(Jan-2014 = 100)
(CY)
11
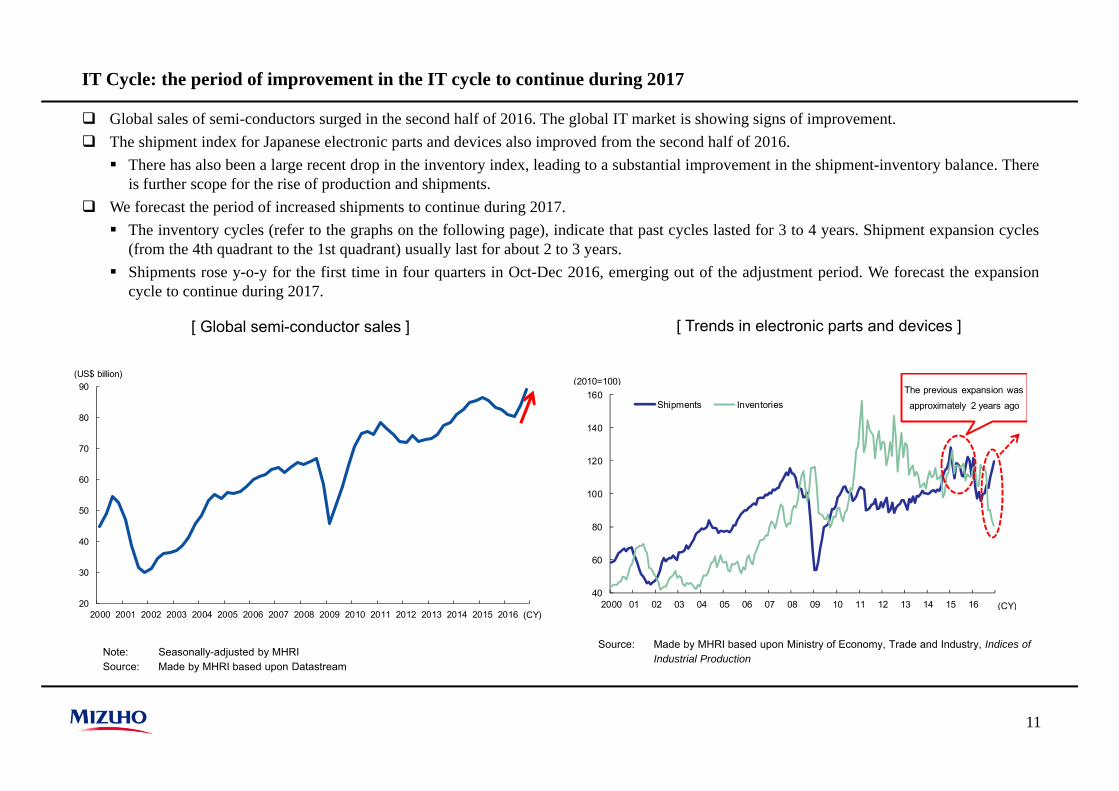
IT Cycle: the period of improvement in the IT cycle to continue during 2017
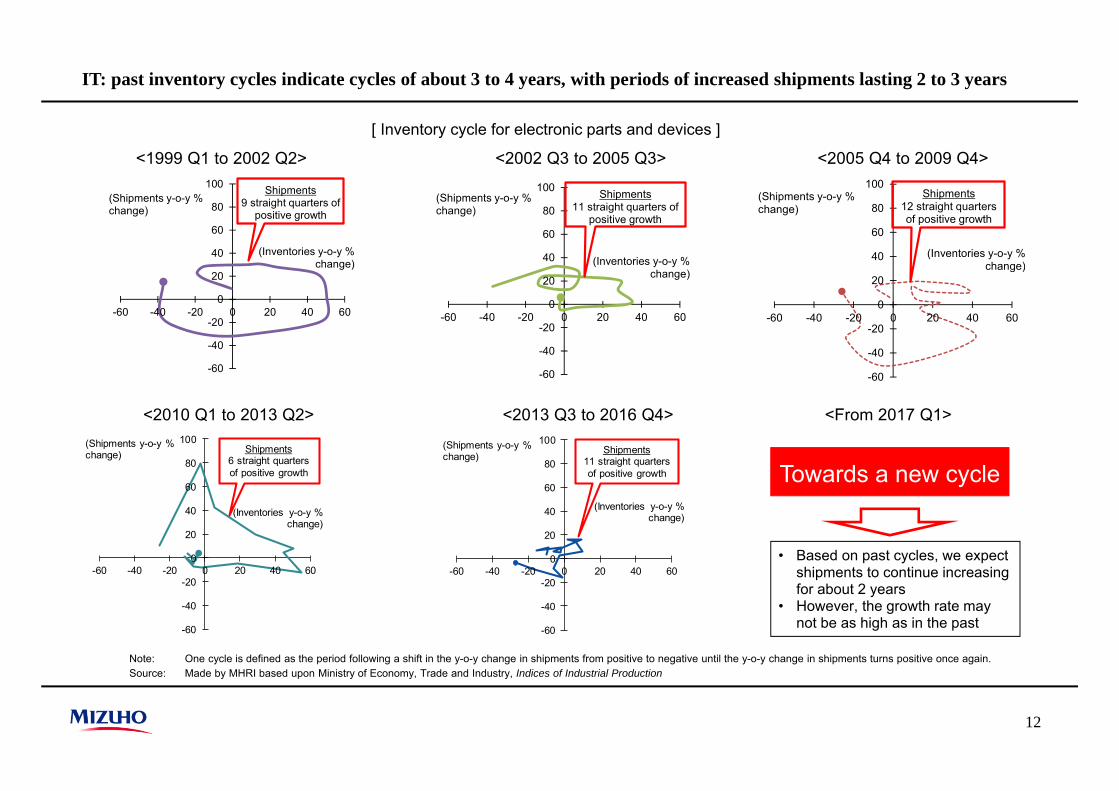
Global sales of semi-conductors surged in the second half of 2016. The global IT market is showing signs of improvement. The shipment index for Japanese electronic parts and devices also improved from the second half of 2016. There has also been a large recent drop in the inventory index, leading to a substantial improvement in the shipment-inventory balance. There
is further scope for the rise of production and shipments. We forecast the period of increased shipments to continue during 2017. The inventory cycles (refer to the graphs on the following page), indicate that past cycles lasted for 3 to 4 years. Shipment expansion cycles
(from the 4th quadrant to the 1st quadrant) usually last for about 2 to 3 years. Shipments rose y-o-y for the first time in four quarters in Oct-Dec 2016, emerging out of the adjustment period. We forecast the expansion
cycle to continue during 2017.
Note: Seasonally-adjusted by MHRISource: Made by MHRI based upon Datastream
[ Global semi-conductor sales ] [ Trends in electronic parts and devices ]
Source: Made by MHRI based upon Ministry of Economy, Trade and Industry, Indices of Industrial Production
20
30
40
50
60
70
80
90
2000 2001 2002 2003 2004 2005 2006 2007 2008 2009 2010 2011 2012 2013 2014 2015 2016
(US$ billion)
(CY)
40
60
80
100
120
140
160
2000 01 02 03 04 05 06 07 08 09 10 11 12 13 14 15 16
Shipments Inventories
(2010=100)
(CY)
The previous expansion was approximately 2 years ago
12
IT: past inventory cycles indicate cycles of about 3 to 4 years, with periods of increased shipments lasting 2 to 3 years
[ Inventory cycle for electronic parts and devices ]
Note: One cycle is defined as the period following a shift in the y-o-y change in shipments from positive to negative until the y-o-y change in shipments turns positive once again.Source: Made by MHRI based upon Ministry of Economy, Trade and Industry, Indices of Industrial Production
Towards a new cycle
• Based on past cycles, we expect shipments to continue increasing for about 2 years
• However, the growth rate may not be as high as in the past
<1999 Q1 to 2002 Q2> <2002 Q3 to 2005 Q3> <2005 Q4 to 2009 Q4>
<2010 Q1 to 2013 Q2> <2013 Q3 to 2016 Q4> <From 2017 Q1>
-60
-40
-20
0
20
40
60
80
100
-60 -40 -20 0 20 40 60
(Shipments y-o-y % change)
(Inventories y-o-y %change)
Shipments6 straight quartersof positive growth
-60
-40
-20
0
20
40
60
80
100
-60 -40 -20 0 20 40 60
(Shipments y-o-y % change)
(Inventories y-o-y % change)
Shipments11 straight quarters of positive growth
-60
-40
-20
0
20
40
60
80
100
-60 -40 -20 0 20 40 60
(Shipments y-o-y % change)
(Inventories y-o-y % change)
Shipments9 straight quarters of
positive growth
-60
-40
-20
0
20
40
60
80
100
-60 -40 -20 0 20 40 60
(Shipments y-o-y % change)
(Inventories y-o-y % change)
Shipments11 straight quarters of
positive growth
-60
-40
-20
0
20
40
60
80
100
-60 -40 -20 0 20 40 60
(Shipments y-o-y % change)
(Inventories y-o-y % change)
Shipments12 straight quarters of positive growth
13
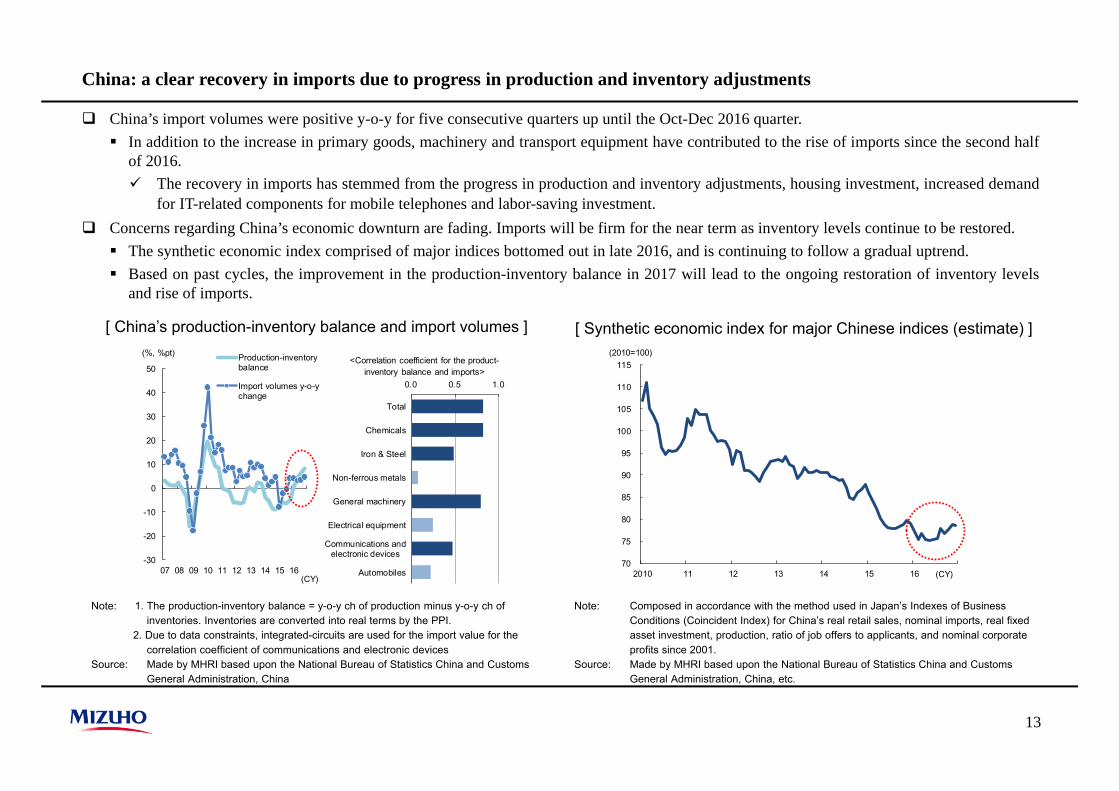
China: a clear recovery in imports due to progress in production and inventory adjustments
China’s import volumes were positive y-o-y for five consecutive quarters up until the Oct-Dec 2016 quarter. In addition to the increase in primary goods, machinery and transport equipment have contributed to the rise of imports since the second half
of 2016. The recovery in imports has stemmed from the progress in production and inventory adjustments, housing investment, increased demand
for IT-related components for mobile telephones and labor-saving investment. Concerns regarding China’s economic downturn are fading. Imports will be firm for the near term as inventory levels continue to be restored. The synthetic economic index comprised of major indices bottomed out in late 2016, and is continuing to follow a gradual uptrend. Based on past cycles, the improvement in the production-inventory balance in 2017 will lead to the ongoing restoration of inventory levels
and rise of imports.
[ China’s production-inventory balance and import volumes ] [ Synthetic economic index for major Chinese indices (estimate) ]
Note: Composed in accordance with the method used in Japan’s Indexes of Business Conditions (Coincident Index) for China’s real retail sales, nominal imports, real fixed asset investment, production, ratio of job offers to applicants, and nominal corporate profits since 2001.
Source: Made by MHRI based upon the National Bureau of Statistics China and Customs General Administration, China, etc.
Note: 1. The production-inventory balance = y-o-y ch of production minus y-o-y ch of inventories. Inventories are converted into real terms by the PPI.
2. Due to data constraints, integrated-circuits are used for the import value for the correlation coefficient of communications and electronic devices
Source: Made by MHRI based upon the National Bureau of Statistics China and Customs General Administration, China
70
75
80
85
90
95
100
105
110
115
2010 11 12 13 14 15 16
(2010=100)
(CY)
0.0 0.5 1.0
Total
Chemicals
Iron & Steel
Non-ferrous metals
General machinery
Electrical equipment
Communications andelectronic devices
Automobiles
<Correlation coefficient for the product-inventory balance and imports>
-30
-20
-10
0
10
20
30
40
50
07 08 09 10 11 12 13 14 15 16
Production-inventorybalance
Import volumes y-o-ychange
(%, %pt)
(CY)
14
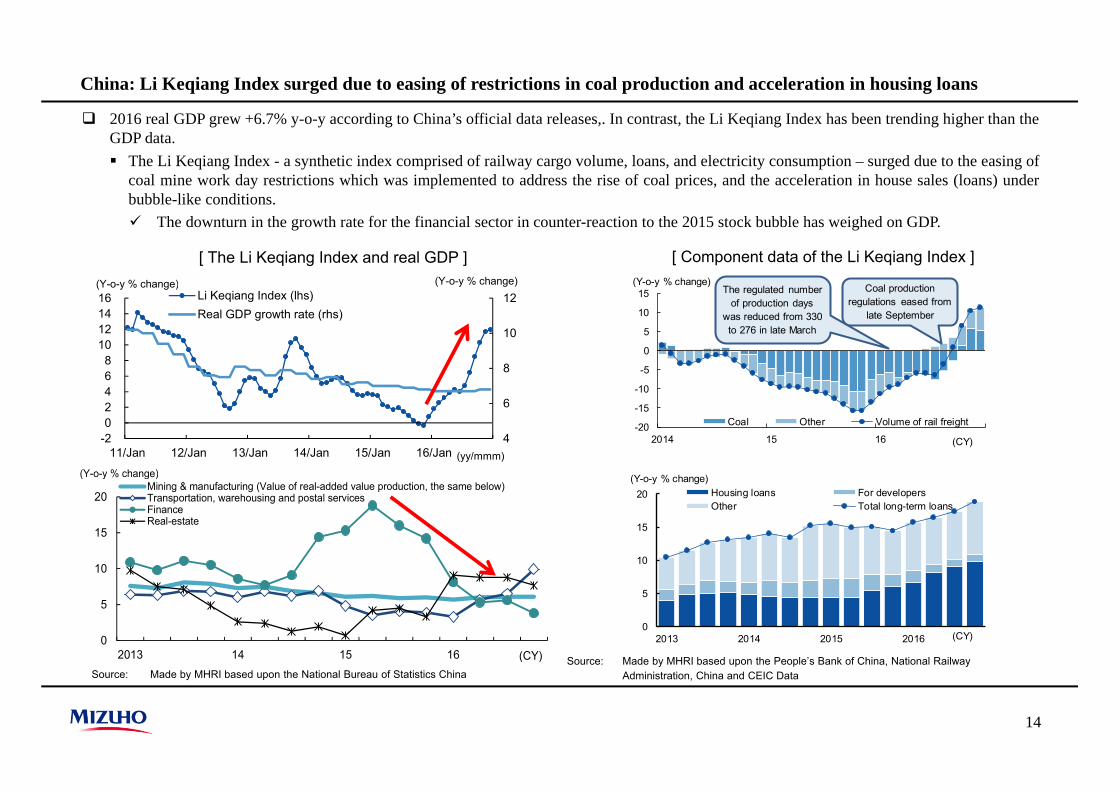
China: Li Keqiang Index surged due to easing of restrictions in coal production and acceleration in housing loans
2016 real GDP grew +6.7% y-o-y according to China’s official data releases,. In contrast, the Li Keqiang Index has been trending higher than theGDP data. The Li Keqiang Index - a synthetic index comprised of railway cargo volume, loans, and electricity consumption – surged due to the easing of
coal mine work day restrictions which was implemented to address the rise of coal prices, and the acceleration in house sales (loans) underbubble-like conditions. The downturn in the growth rate for the financial sector in counter-reaction to the 2015 stock bubble has weighed on GDP.
Source: Made by MHRI based upon the National Bureau of Statistics China
[ Component data of the Li Keqiang Index ]
Source: Made by MHRI based upon the People’s Bank of China, National Railway Administration, China and CEIC Data
[ The Li Keqiang Index and real GDP ]
-20
-15
-10
-5
0
5
10
15
2014 15 16
Coal Other Volume of rail freight
The regulated number of production days
was reduced from 330 to 276 in late March
(CY)
(Y-o-y % change) Coal productionregulations eased from
late September
0
5
10
15
20
2013 2014 2015 2016
Housing loans For developersOther Total long-term loans
(Y-o-y % change)
(CY)
4
6
8
10
12
-202468
10121416
11/Jan 12/Jan 13/Jan 14/Jan 15/Jan 16/Jan
Li Keqiang Index (lhs)Real GDP growth rate (rhs)
(Y-o-y % change)
(yy/mmm)
(Y-o-y % change)
0
5
10
15
20
2013 14 15 16
Mining & manufacturing (Value of real-added value production, the same below)Transportation, warehousing and postal servicesFinanceReal-estate
(Y-o-y % change)
(CY)
15
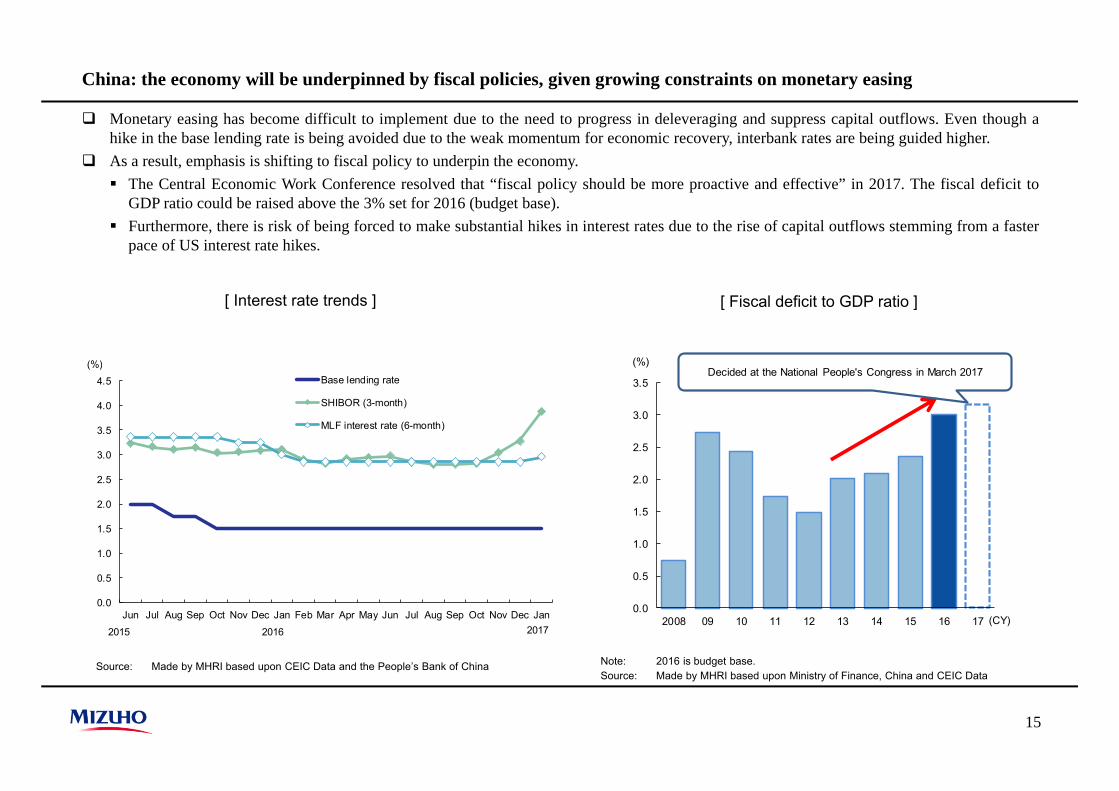
China: the economy will be underpinned by fiscal policies, given growing constraints on monetary easing
Monetary easing has become difficult to implement due to the need to progress in deleveraging and suppress capital outflows. Even though ahike in the base lending rate is being avoided due to the weak momentum for economic recovery, interbank rates are being guided higher.
As a result, emphasis is shifting to fiscal policy to underpin the economy. The Central Economic Work Conference resolved that “fiscal policy should be more proactive and effective” in 2017. The fiscal deficit to
GDP ratio could be raised above the 3% set for 2016 (budget base). Furthermore, there is risk of being forced to make substantial hikes in interest rates due to the rise of capital outflows stemming from a faster
pace of US interest rate hikes.
Source: Made by MHRI based upon CEIC Data and the People’s Bank of China
[ Interest rate trends ] [ Fiscal deficit to GDP ratio ]
Note: 2016 is budget base.Source: Made by MHRI based upon Ministry of Finance, China and CEIC Data
0.0
0.5
1.0
1.5
2.0
2.5
3.0
3.5
4.0
4.5
Jun Jul Aug Sep Oct Nov Dec Jan Feb Mar Apr May Jun Jul Aug Sep Oct Nov Dec Jan
Base lending rate
SHIBOR (3-month)
MLF interest rate (6-month)
(%)
2015 2016 2017
0.0
0.5
1.0
1.5
2.0
2.5
3.0
3.5
2008 09 10 11 12 13 14 15 16 17
(%)
(CY)
Decided at the National People's Congress in March 2017
16
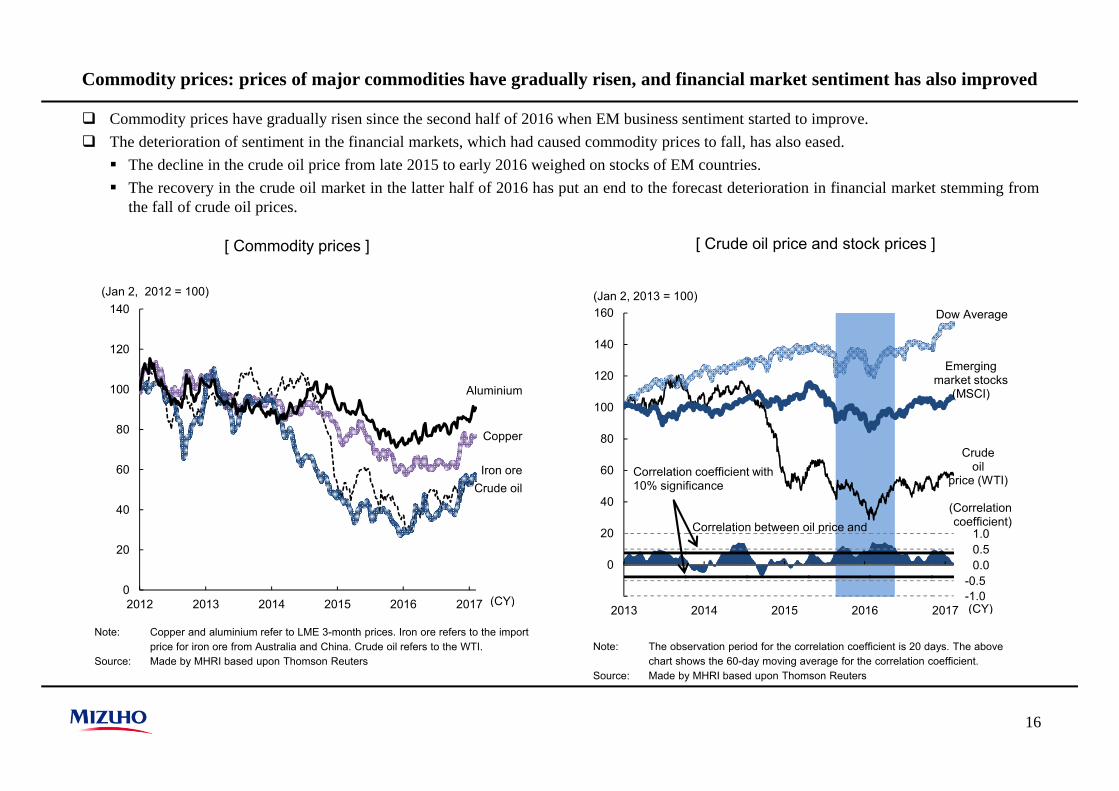
Commodity prices: prices of major commodities have gradually risen, and financial market sentiment has also improved
Commodity prices have gradually risen since the second half of 2016 when EM business sentiment started to improve. The deterioration of sentiment in the financial markets, which had caused commodity prices to fall, has also eased. The decline in the crude oil price from late 2015 to early 2016 weighed on stocks of EM countries. The recovery in the crude oil market in the latter half of 2016 has put an end to the forecast deterioration in financial market stemming from
the fall of crude oil prices.
[ Commodity prices ] [ Crude oil price and stock prices ]
Note: The observation period for the correlation coefficient is 20 days. The above chart shows the 60-day moving average for the correlation coefficient.
Source: Made by MHRI based upon Thomson Reuters
Note: Copper and aluminium refer to LME 3-month prices. Iron ore refers to the import price for iron ore from Australia and China. Crude oil refers to the WTI.
Source: Made by MHRI based upon Thomson Reuters
Crude oil
Copper
Iron ore
Aluminium
0
20
40
60
80
100
120
140
2012 2013 2014 2015 2016 2017
(Jan 2, 2012 = 100)
(CY)
Crude oil
price (WTI)
Dow Average
Emerging market stocks
(MSCI)
1.00.50.0
-0.5-1.0
0
20
40
60
80
100
120
140
160
2013 2014 2015 2016 2017
(Jan 2, 2013 = 100)
(CY)
Correlation between oil price and (Correlationcoefficient)
Correlation coefficient with 10% significance
17
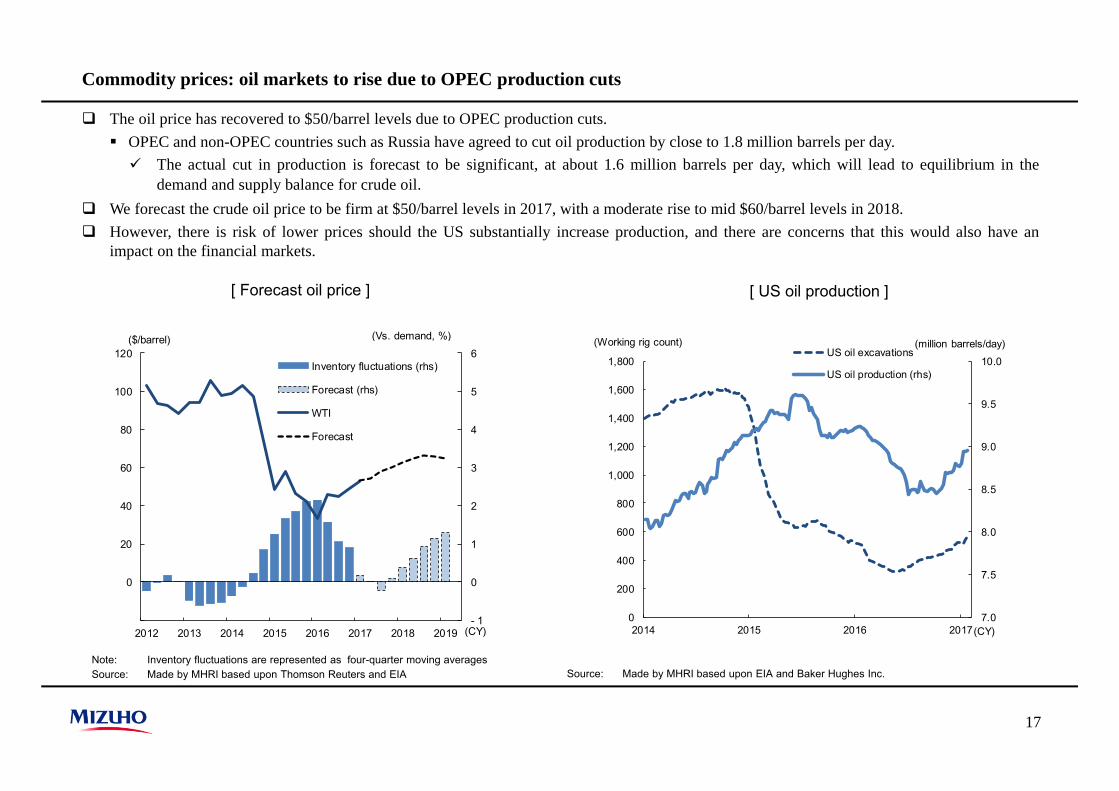
Commodity prices: oil markets to rise due to OPEC production cuts
The oil price has recovered to $50/barrel levels due to OPEC production cuts. OPEC and non-OPEC countries such as Russia have agreed to cut oil production by close to 1.8 million barrels per day. The actual cut in production is forecast to be significant, at about 1.6 million barrels per day, which will lead to equilibrium in the
demand and supply balance for crude oil. We forecast the crude oil price to be firm at $50/barrel levels in 2017, with a moderate rise to mid $60/barrel levels in 2018. However, there is risk of lower prices should the US substantially increase production, and there are concerns that this would also have an
impact on the financial markets.
Note: Inventory fluctuations are represented as four-quarter moving averagesSource: Made by MHRI based upon Thomson Reuters and EIA
[ Forecast oil price ] [ US oil production ]
Source: Made by MHRI based upon EIA and Baker Hughes Inc.
- 1
0
1
2
3
4
5
6
-20
0
20
40
60
80
100
120
2012 2013 2014 2015 2016 2017 2018 2019
Inventory fluctuations (rhs)
Forecast (rhs)
WTI
Forecast
($/barrel) (Vs. demand, %)
(CY)7.0
7.5
8.0
8.5
9.0
9.5
10.0
0
200
400
600
800
1,000
1,200
1,400
1,600
1,800
2014 2015 2016 2017
US oil excavations
US oil production (rhs)
(Working rig count) (million barrels/day)
(CY)
18
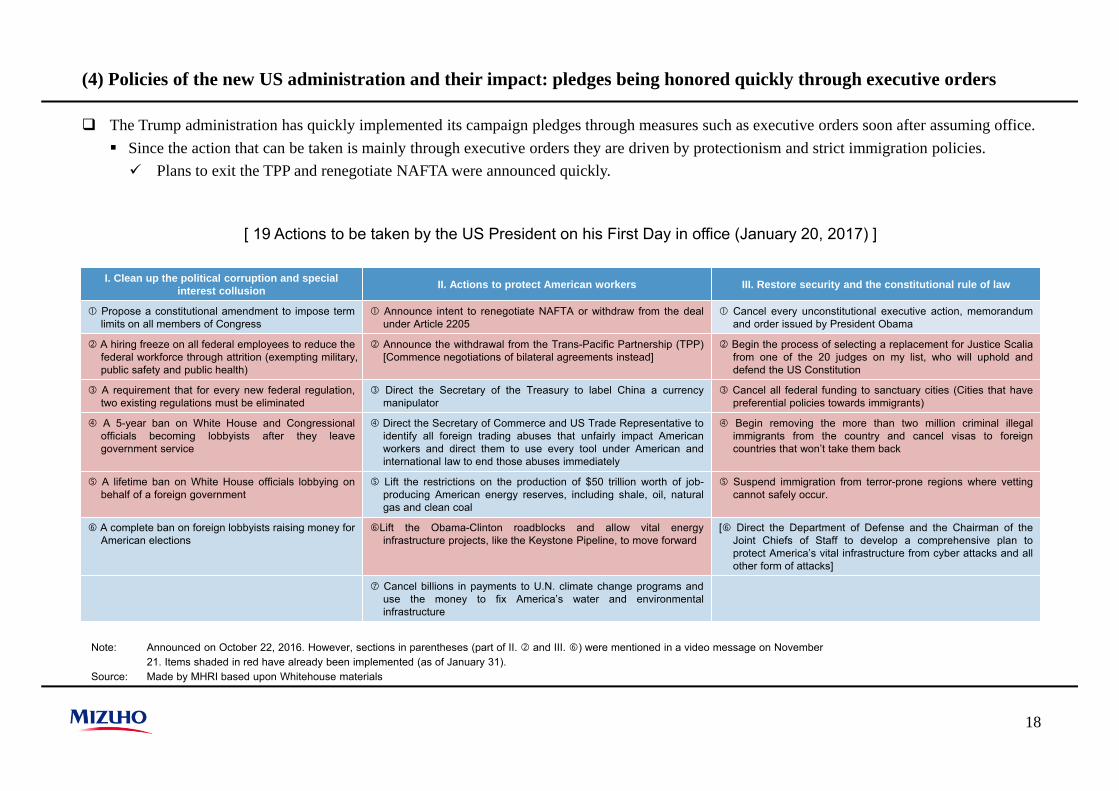
(4) Policies of the new US administration and their impact: pledges being honored quickly through executive orders
The Trump administration has quickly implemented its campaign pledges through measures such as executive orders soon after assuming office. Since the action that can be taken is mainly through executive orders they are driven by protectionism and strict immigration policies. Plans to exit the TPP and renegotiate NAFTA were announced quickly.
[ 19 Actions to be taken by the US President on his First Day in office (January 20, 2017) ]
Note: Announced on October 22, 2016. However, sections in parentheses (part of II. and III. ) were mentioned in a video message on November 21. Items shaded in red have already been implemented (as of January 31).
Source: Made by MHRI based upon Whitehouse materials
I. Clean up the political corruption and special interest collusion II. Actions to protect American workers III. Restore security and the constitutional rule of law
Propose a constitutional amendment to impose termlimits on all members of Congress
Announce intent to renegotiate NAFTA or withdraw from the dealunder Article 2205
Cancel every unconstitutional executive action, memorandumand order issued by President Obama
A hiring freeze on all federal employees to reduce thefederal workforce through attrition (exempting military,public safety and public health)
Announce the withdrawal from the Trans-Pacific Partnership (TPP)[Commence negotiations of bilateral agreements instead]
Begin the process of selecting a replacement for Justice Scaliafrom one of the 20 judges on my list, who will uphold anddefend the US Constitution
A requirement that for every new federal regulation,two existing regulations must be eliminated
Direct the Secretary of the Treasury to label China a currencymanipulator
Cancel all federal funding to sanctuary cities (Cities that havepreferential policies towards immigrants)
A 5-year ban on White House and Congressionalofficials becoming lobbyists after they leavegovernment service
Direct the Secretary of Commerce and US Trade Representative toidentify all foreign trading abuses that unfairly impact Americanworkers and direct them to use every tool under American andinternational law to end those abuses immediately
Begin removing the more than two million criminal illegalimmigrants from the country and cancel visas to foreigncountries that won’t take them back
A lifetime ban on White House officials lobbying onbehalf of a foreign government
Lift the restrictions on the production of $50 trillion worth of job-producing American energy reserves, including shale, oil, naturalgas and clean coal
Suspend immigration from terror-prone regions where vettingcannot safely occur.
A complete ban on foreign lobbyists raising money forAmerican elections
Lift the Obama-Clinton roadblocks and allow vital energyinfrastructure projects, like the Keystone Pipeline, to move forward
[ Direct the Department of Defense and the Chairman of theJoint Chiefs of Staff to develop a comprehensive plan toprotect America’s vital infrastructure from cyber attacks and allother form of attacks]
Cancel billions in payments to U.N. climate change programs anduse the money to fix America’s water and environmentalinfrastructure
19
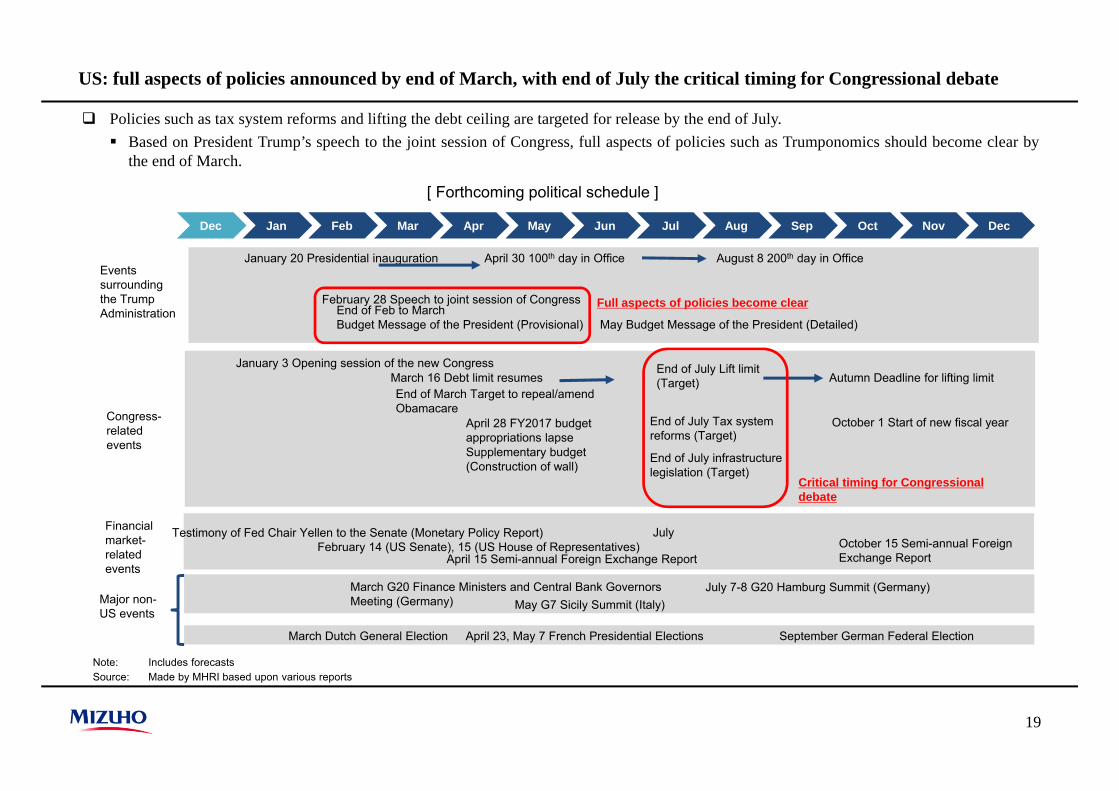
US: full aspects of policies announced by end of March, with end of July the critical timing for Congressional debate
Policies such as tax system reforms and lifting the debt ceiling are targeted for release by the end of July. Based on President Trump’s speech to the joint session of Congress, full aspects of policies such as Trumponomics should become clear by
the end of March.
Note: Includes forecastsSource: Made by MHRI based upon various reports
[ Forthcoming political schedule ]
Jan Feb Mar Apr May Jun Jul Aug Sep Oct Nov DecDec
April 15 Semi-annual Foreign Exchange ReportOctober 15 Semi-annual Foreign Exchange Report
Testimony of Fed Chair Yellen to the Senate (Monetary Policy Report)
March G20 Finance Ministers and Central Bank Governors Meeting (Germany)
July 7-8 G20 Hamburg Summit (Germany)May G7 Sicily Summit (Italy)
April 23, May 7 French Presidential Elections September German Federal ElectionMarch Dutch General Election
Major non-US events
October 1 Start of new fiscal year
March 16 Debt limit resumes
Congress-related events
Autumn Deadline for lifting limitJanuary 3 Opening session of the new Congress
February 28 Speech to joint session of Congress
April 30 100th day in Office August 8 200th day in OfficeEvents surrounding the Trump Administration
January 20 Presidential inauguration
Full aspects of policies become clear
Critical timing for Congressional debate
End of March Target to repeal/amend Obamacare
End of July Tax system reforms (Target)
End of July infrastructure legislation (Target)
February 14 (US Senate), 15 (US House of Representatives)
April 28 FY2017 budget appropriations lapseSupplementary budget (Construction of wall)
End of July Lift limit (Target)
End of Feb to MarchBudget Message of the President (Provisional) May Budget Message of the President (Detailed)
Financial market-related events
July
20
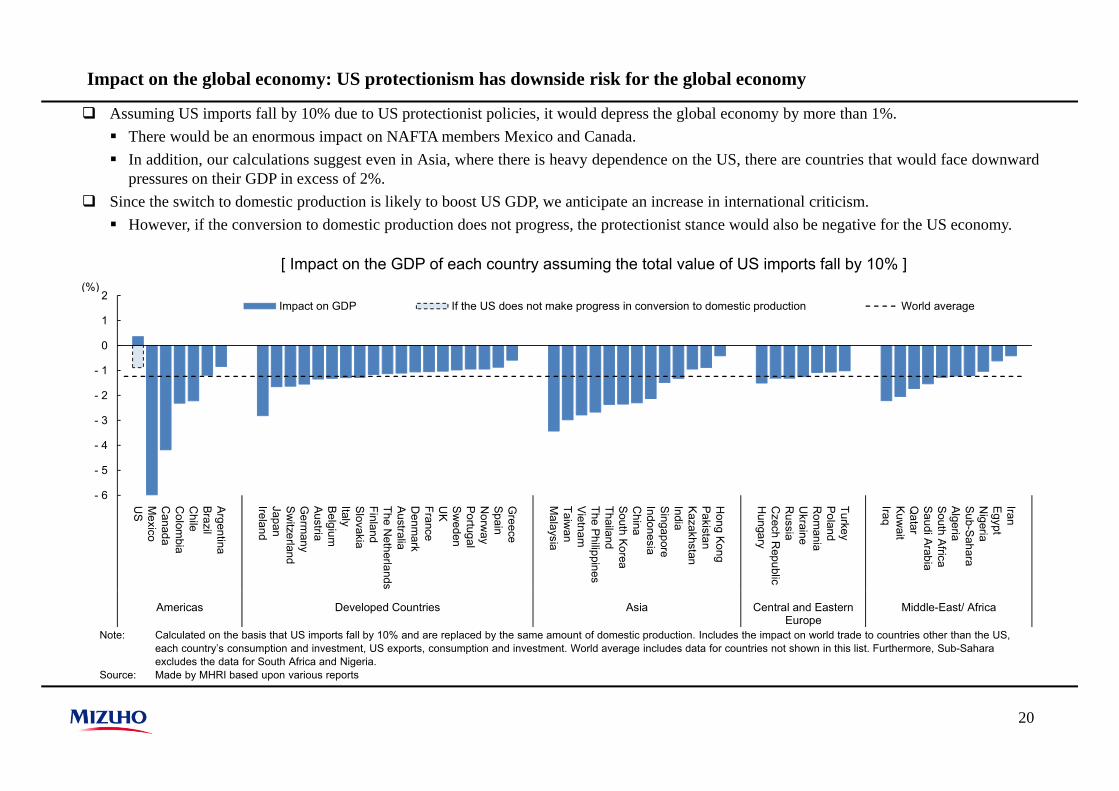
Assuming US imports fall by 10% due to US protectionist policies, it would depress the global economy by more than 1%. There would be an enormous impact on NAFTA members Mexico and Canada. In addition, our calculations suggest even in Asia, where there is heavy dependence on the US, there are countries that would face downward
pressures on their GDP in excess of 2%. Since the switch to domestic production is likely to boost US GDP, we anticipate an increase in international criticism. However, if the conversion to domestic production does not progress, the protectionist stance would also be negative for the US economy.
[ Impact on the GDP of each country assuming the total value of US imports fall by 10% ]
Impact on the global economy: US protectionism has downside risk for the global economy
Note: Calculated on the basis that US imports fall by 10% and are replaced by the same amount of domestic production. Includes the impact on world trade to countries other than the US, each country’s consumption and investment, US exports, consumption and investment. World average includes data for countries not shown in this list. Furthermore, Sub-Sahara excludes the data for South Africa and Nigeria.
Source: Made by MHRI based upon various reports
- 6
- 5
- 4
- 3
- 2
- 1
0
1
2
US
Mexico
Canada
Colom
biaC
hileBrazilA
rgentina
IrelandJapanS
witzerland
Germ
anyAustriaB
elgiumItalySlovakiaFinlandThe N
etherlandsA
ustraliaD
enmark
FranceU
KS
weden
Portugal
Norw
aySpainG
reece
Malaysia
Taiwan
Vietnam
The PhilippinesThailandSouth KoreaC
hinaIndonesiaS
ingaporeIndiaKazakhstanPakistanH
ong Kong
Hungary
Czech R
epublicR
ussiaU
kraineR
omania
Poland
Turkey
IraqK
uwait
Qatar
Saudi A
rabiaSouth AfricaA
lgeriaS
ub-Sahara
Nigeria
Egypt
Iran
Americas Developed Countries Asia Central and EasternEurope
Middle-East/ Africa
Impact on GDP If the US does not make progress in conversion to domestic production World average
(%)
21
Economic recovery in FY2017
II. The Japanese Economy
22
The First Preliminary Quarterly Estimates of GDP (“1st QE”) for the Oct-Dec quarter of 2016 revealed that theJapanese economy recorded growth in positive territory for the fourth quarter in a row. Despite the sluggish recovery ofpersonal consumption, economic conditions are picking up mainly with respect to exports and capital investment,reflecting the upturn of the overseas economies.
The Japanese economy will pick up in FY2017. The recovery of overseas economies, the improvement of the domesticinventory cycle, the rise of capital investment related to the 2020 Tokyo Olympic Games and productivity improvement,and the implementation of public investment accompanying Japan’s economic stimulus measures will serve to push upgrowth. Even though personal consumption will continue to lack strength, adjustment pressures upon durable goodswill ease, and serve to maintain the recovery. The pace of economic growth in FY2017 is forecast to rise to +1.4% fromthe previous fiscal year (+1.2%).
The Japanese economy will continue to grow above its potential rate of growth as the engine of growth shifts fromexternal demand to domestic demand. Personal consumption will also be boosted by the improvement of real wages.FY2018 economic growth is projected to stand at +1.3%.
There are still significant downside risks due to uncertainties regarding political and economic developments overseas.Keep a close eye upon protectionists developments in the US, direction of major elections in Europe and economicpolicy following the National Congress of the Communist Party of China.
Given the upturn of the year-on-year (y-o-y) change of energy prices into positive territory, the core inflation rate shouldrise to the 1%-level in the second half of FY2017. On the other hand, the improvement of the underlying trend ininflation excluding the impact of energy prices should only remain modest.
The Japanese economy: the economy is picking up, reflecting the upturn of overseas economies
Japanese economy to recover in FY2017 due to the upturn in overseas economies and improved inventory cycle
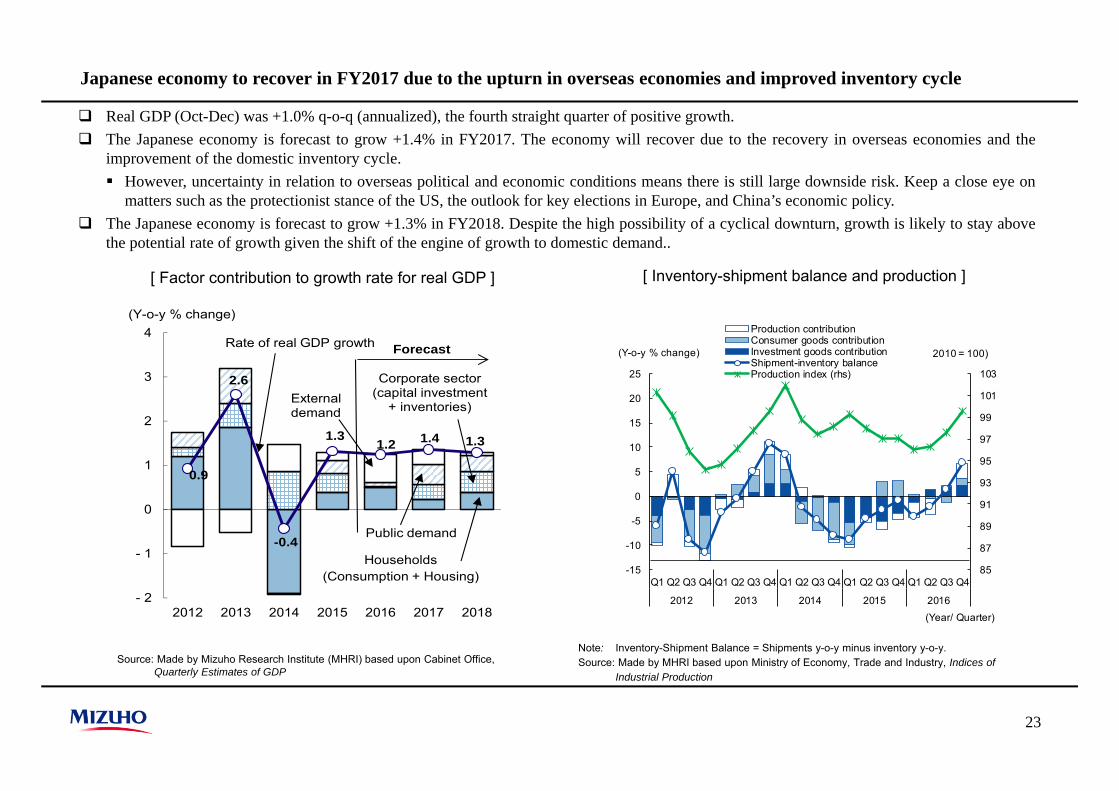
Real GDP (Oct-Dec) was +1.0% q-o-q (annualized), the fourth straight quarter of positive growth. The Japanese economy is forecast to grow +1.4% in FY2017. The economy will recover due to the recovery in overseas economies and the
improvement of the domestic inventory cycle. However, uncertainty in relation to overseas political and economic conditions means there is still large downside risk. Keep a close eye on
matters such as the protectionist stance of the US, the outlook for key elections in Europe, and China’s economic policy. The Japanese economy is forecast to grow +1.3% in FY2018. Despite the high possibility of a cyclical downturn, growth is likely to stay above
the potential rate of growth given the shift of the engine of growth to domestic demand..
[ Factor contribution to growth rate for real GDP ]
Source: Made by Mizuho Research Institute (MHRI) based upon Cabinet Office, Quarterly Estimates of GDP
[ Inventory-shipment balance and production ]
Note: Inventory-Shipment Balance = Shipments y-o-y minus inventory y-o-y.Source: Made by MHRI based upon Ministry of Economy, Trade and Industry, Indices of
Industrial Production
85
87
89
91
93
95
97
99
101
103
-15
-10
-5
0
5
10
15
20
25
Q1 Q2 Q3 Q4 Q1 Q2 Q3 Q4 Q1 Q2 Q3 Q4 Q1 Q2 Q3 Q4 Q1 Q2 Q3 Q4
2012 2013 2014 2015 2016
Production contributionConsumer goods contributionInvestment goods contributionShipment-inventory balanceProduction index (rhs)
(Y-o-y % change) 2010 = 100)
(Year/ Quarter)
23
0.9
2.6
-0.4
1.3 1.2 1.4 1.3
- 2
- 1
0
1
2
3
4
2012 2013 2014 2015 2016 2017 2018
Households(Consumption + Housing)
Public demand
External demand
Corporate sector(capital investment
+ inventories)
Rate of real GDP growth Forecast
(Y-o-y % change)
24
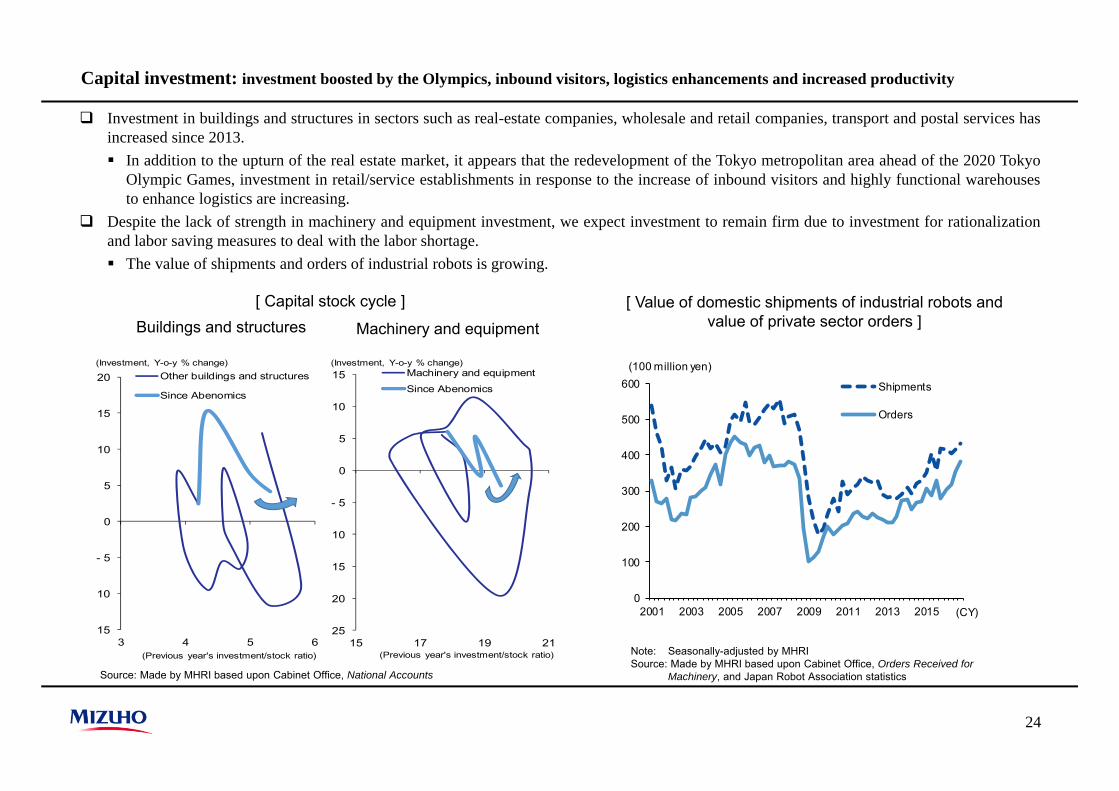
Capital investment: investment boosted by the Olympics, inbound visitors, logistics enhancements and increased productivity
Investment in buildings and structures in sectors such as real-estate companies, wholesale and retail companies, transport and postal services hasincreased since 2013. In addition to the upturn of the real estate market, it appears that the redevelopment of the Tokyo metropolitan area ahead of the 2020 Tokyo
Olympic Games, investment in retail/service establishments in response to the increase of inbound visitors and highly functional warehousesto enhance logistics are increasing.
Despite the lack of strength in machinery and equipment investment, we expect investment to remain firm due to investment for rationalizationand labor saving measures to deal with the labor shortage. The value of shipments and orders of industrial robots is growing.
[ Capital stock cycle ]
Source: Made by MHRI based upon Cabinet Office, National Accounts
[ Value of domestic shipments of industrial robots and value of private sector orders ]
Note: Seasonally-adjusted by MHRISource: Made by MHRI based upon Cabinet Office, Orders Received for
Machinery, and Japan Robot Association statistics
Buildings and structures Machinery and equipment
0
100
200
300
400
500
600
2001 2003 2005 2007 2009 2011 2013 2015
Shipments
Orders
(100 million yen)
(CY)15
10
- 5
0
5
10
15
20
3 4 5 6
Other buildings and structures
Since Abenomics
(Investment, Y-o-y % change)
(Previous year's investment/stock ratio)
25
20
15
10
- 5
0
5
10
15
15 17 19 21
Machinery and equipment
Since Abenomics
(Investment, Y-o-y % change)
(Previous year's investment/stock ratio)
25
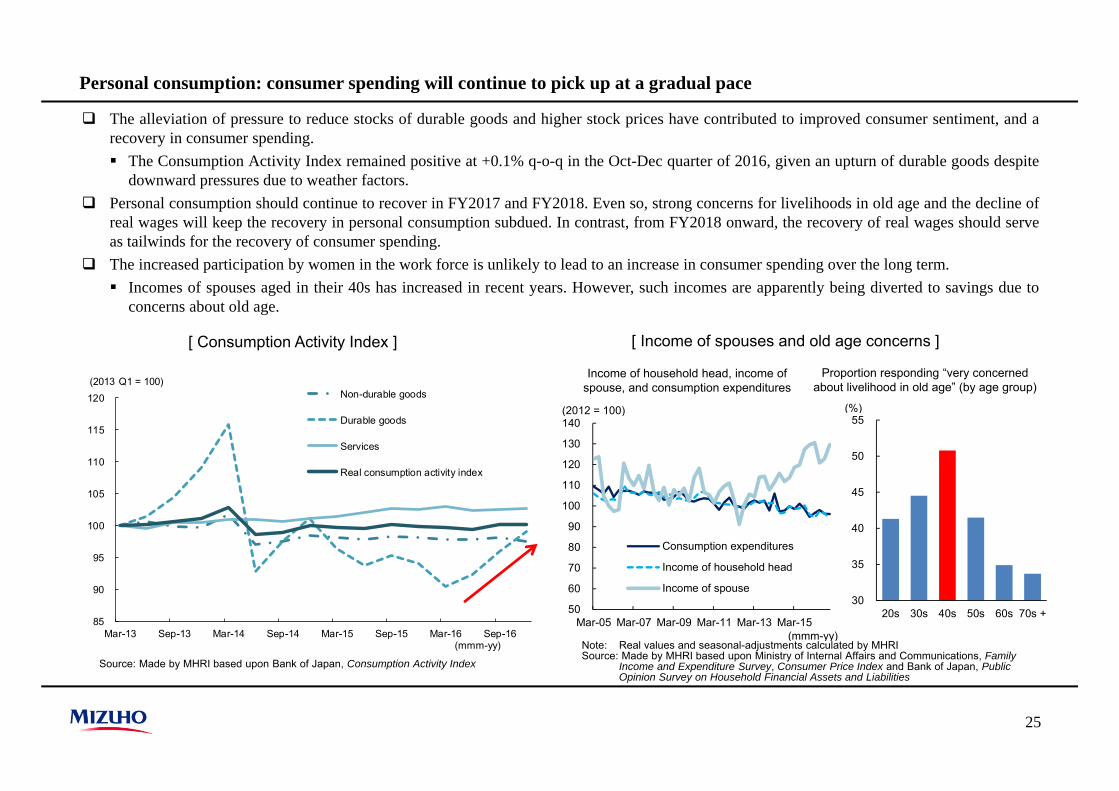
Personal consumption: consumer spending will continue to pick up at a gradual pace
The alleviation of pressure to reduce stocks of durable goods and higher stock prices have contributed to improved consumer sentiment, and arecovery in consumer spending. The Consumption Activity Index remained positive at +0.1% q-o-q in the Oct-Dec quarter of 2016, given an upturn of durable goods despite
downward pressures due to weather factors. Personal consumption should continue to recover in FY2017 and FY2018. Even so, strong concerns for livelihoods in old age and the decline of
real wages will keep the recovery in personal consumption subdued. In contrast, from FY2018 onward, the recovery of real wages should serveas tailwinds for the recovery of consumer spending.
The increased participation by women in the work force is unlikely to lead to an increase in consumer spending over the long term. Incomes of spouses aged in their 40s has increased in recent years. However, such incomes are apparently being diverted to savings due to
concerns about old age.
[ Consumption Activity Index ] [ Income of spouses and old age concerns ]
Source: Made by MHRI based upon Bank of Japan, Consumption Activity Index
Note: Real values and seasonal-adjustments calculated by MHRISource: Made by MHRI based upon Ministry of Internal Affairs and Communications, Family
Income and Expenditure Survey, Consumer Price Index and Bank of Japan, Public Opinion Survey on Household Financial Assets and Liabilities
Income of household head, income of spouse, and consumption expenditures
Proportion responding “very concerned about livelihood in old age” (by age group)
85
90
95
100
105
110
115
120
Mar-13 Sep-13 Mar-14 Sep-14 Mar-15 Sep-15 Mar-16 Sep-16
Non-durable goods
Durable goods
Services
Real consumption activity index
(2013 Q1 = 100)
(mmm-yy)
50
60
70
80
90
100
110
120
130
140
Mar-05 Mar-07 Mar-09 Mar-11 Mar-13 Mar-15
Consumption expenditures
Income of household head
Income of spouse
(2012 = 100)
(mmm-yy)
30
35
40
45
50
55
20s 30s 40s 50s 60s 70s +
(%)
26
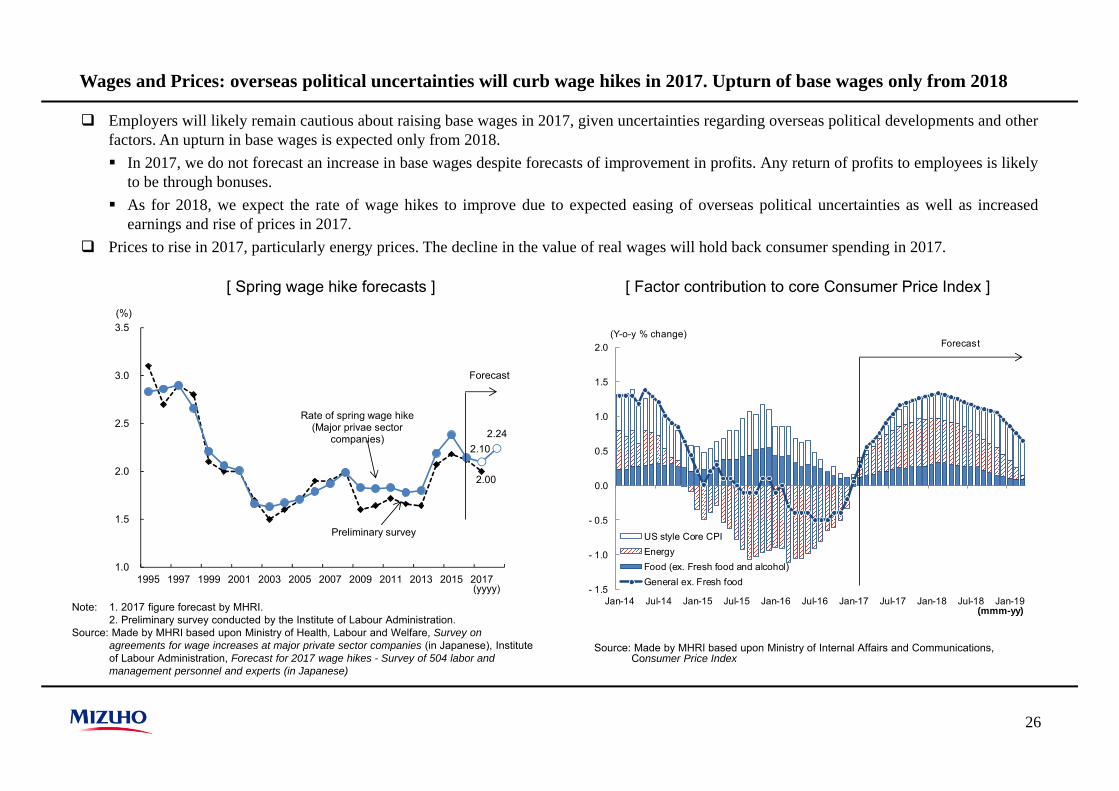
Wages and Prices: overseas political uncertainties will curb wage hikes in 2017. Upturn of base wages only from 2018
Employers will likely remain cautious about raising base wages in 2017, given uncertainties regarding overseas political developments and otherfactors. An upturn in base wages is expected only from 2018. In 2017, we do not forecast an increase in base wages despite forecasts of improvement in profits. Any return of profits to employees is likely
to be through bonuses. As for 2018, we expect the rate of wage hikes to improve due to expected easing of overseas political uncertainties as well as increased
earnings and rise of prices in 2017. Prices to rise in 2017, particularly energy prices. The decline in the value of real wages will hold back consumer spending in 2017.
[ Spring wage hike forecasts ]
Note: 1. 2017 figure forecast by MHRI.2. Preliminary survey conducted by the Institute of Labour Administration.
Source: Made by MHRI based upon Ministry of Health, Labour and Welfare, Survey on agreements for wage increases at major private sector companies (in Japanese), Institute of Labour Administration, Forecast for 2017 wage hikes - Survey of 504 labor and management personnel and experts (in Japanese)
[ Factor contribution to core Consumer Price Index ]
Source: Made by MHRI based upon Ministry of Internal Affairs and Communications, Consumer Price Index
- 1.5
- 1.0
- 0.5
0.0
0.5
1.0
1.5
2.0
Jan-14 Jul-14 Jan-15 Jul-15 Jan-16 Jul-16 Jan-17 Jul-17 Jan-18 Jul-18 Jan-19(mmm-yy)
US style Core CPIEnergyFood (ex. Fresh food and alcohol)General ex. Fresh food
Forecast(Y-o-y % change)
2.00
2.102.24
1.0
1.5
2.0
2.5
3.0
3.5
1995 1997 1999 2001 2003 2005 2007 2009 2011 2013 2015 2017
(%)
(yyyy)
Rate of spring wage hike(Major privae sector
companies)
Preliminary survey
Forecast
27
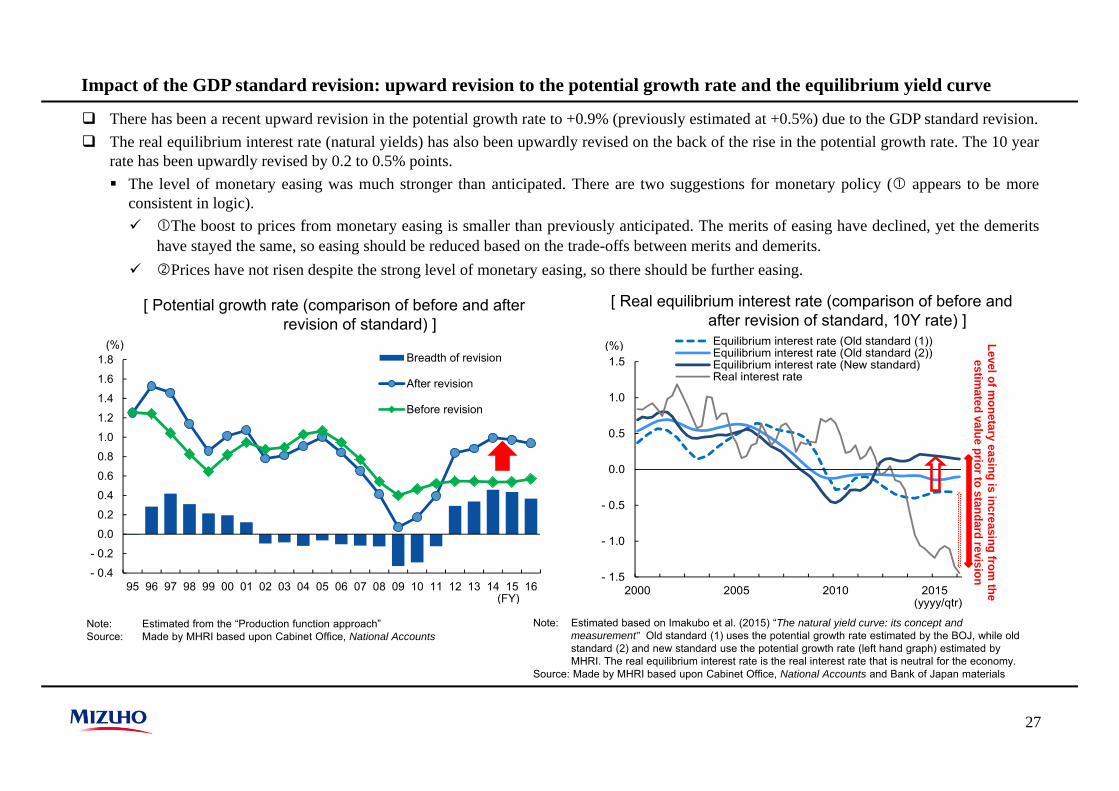
Impact of the GDP standard revision: upward revision to the potential growth rate and the equilibrium yield curve
There has been a recent upward revision in the potential growth rate to +0.9% (previously estimated at +0.5%) due to the GDP standard revision. The real equilibrium interest rate (natural yields) has also been upwardly revised on the back of the rise in the potential growth rate. The 10 year
rate has been upwardly revised by 0.2 to 0.5% points. The level of monetary easing was much stronger than anticipated. There are two suggestions for monetary policy ( appears to be more
consistent in logic). The boost to prices from monetary easing is smaller than previously anticipated. The merits of easing have declined, yet the demerits
have stayed the same, so easing should be reduced based on the trade-offs between merits and demerits. Prices have not risen despite the strong level of monetary easing, so there should be further easing.
Note: Estimated from the “Production function approach”Source: Made by MHRI based upon Cabinet Office, National Accounts
[ Potential growth rate (comparison of before and after revision of standard) ]
[ Real equilibrium interest rate (comparison of before and after revision of standard, 10Y rate) ]
Note: Estimated based on Imakubo et al. (2015) “The natural yield curve: its concept and measurement” Old standard (1) uses the potential growth rate estimated by the BOJ, while old standard (2) and new standard use the potential growth rate (left hand graph) estimated by MHRI. The real equilibrium interest rate is the real interest rate that is neutral for the economy.
Source: Made by MHRI based upon Cabinet Office, National Accounts and Bank of Japan materials
- 0.4
- 0.2
0.0
0.2
0.4
0.6
0.8
1.0
1.2
1.4
1.6
1.8
95 96 97 98 99 00 01 02 03 04 05 06 07 08 09 10 11 12 13 14 15 16
Breadth of revision
After revision
Before revision
(%)
(FY)
- 1.5
- 1.0
- 0.5
0.0
0.5
1.0
1.5
2000 2005 2010 2015
Equilibrium interest rate (Old standard (1))Equilibrium interest rate (Old standard (2))Equilibrium interest rate (New standard)Real interest rate
(yyyy/qtr)
(%) Level of monetary easing is increasing
from the
estimated value prior to standard revision
28
Risks: protectionism would have negative effects, particularly for automobiles
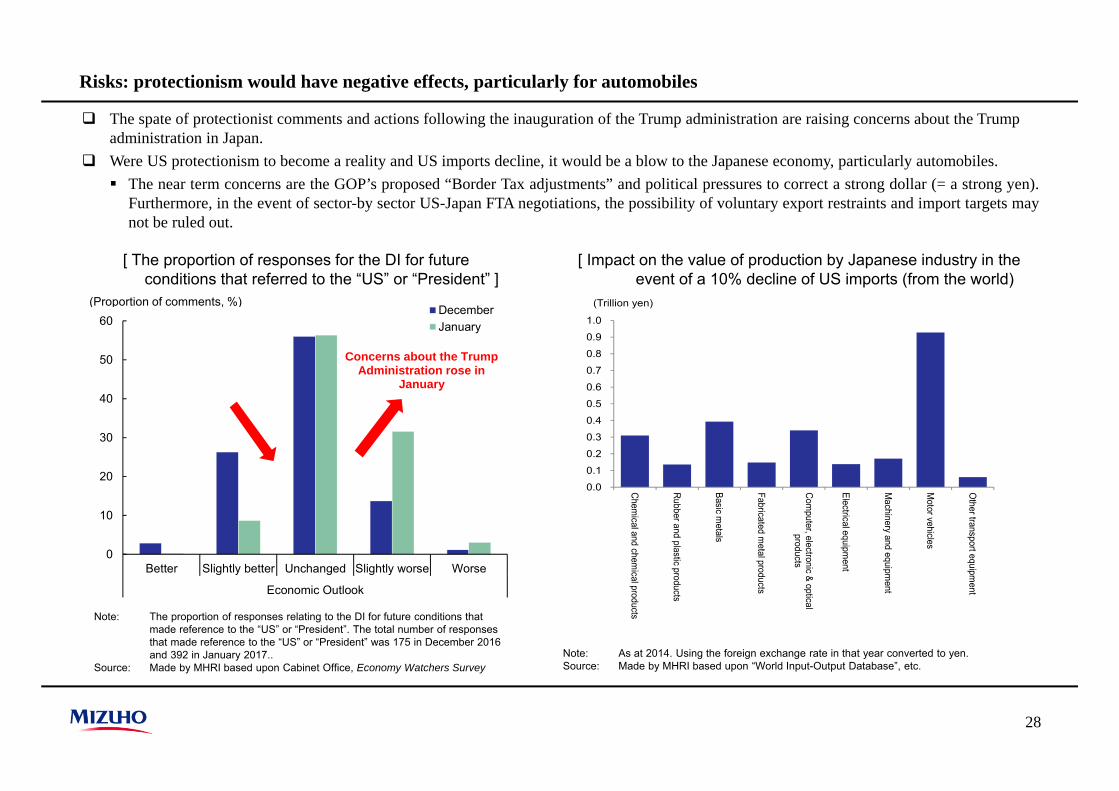
The spate of protectionist comments and actions following the inauguration of the Trump administration are raising concerns about the Trump administration in Japan.
Were US protectionism to become a reality and US imports decline, it would be a blow to the Japanese economy, particularly automobiles. The near term concerns are the GOP’s proposed “Border Tax adjustments” and political pressures to correct a strong dollar (= a strong yen).
Furthermore, in the event of sector-by sector US-Japan FTA negotiations, the possibility of voluntary export restraints and import targets maynot be ruled out.
[ The proportion of responses for the DI for future conditions that referred to the “US” or “President” ]
[ Impact on the value of production by Japanese industry in the event of a 10% decline of US imports (from the world)
Note: The proportion of responses relating to the DI for future conditions that made reference to the “US” or “President”. The total number of responses that made reference to the “US” or “President” was 175 in December 2016 and 392 in January 2017..
Source: Made by MHRI based upon Cabinet Office, Economy Watchers Survey
0
10
20
30
40
50
60
Better Slightly better Unchanged Slightly worse Worse
Economic Outlook
DecemberJanuary
(Proportion of comments, %)
Concerns about the Trump Administration rose in
January
0.0
0.1
0.2
0.3
0.4
0.5
0.6
0.7
0.8
0.9
1.0
Chemical and chem
ical products
Rubber and plastic products
Basic metals
Fabricated metal products
Computer, electronic & optical
products
Electrical equipment
Machinery and equipm
ent
Motor vehicles
Other transport equipm
ent
(Trillion yen)
Note: As at 2014. Using the foreign exchange rate in that year converted to yen.Source: Made by MHRI based upon “World Input-Output Database”, etc.
29
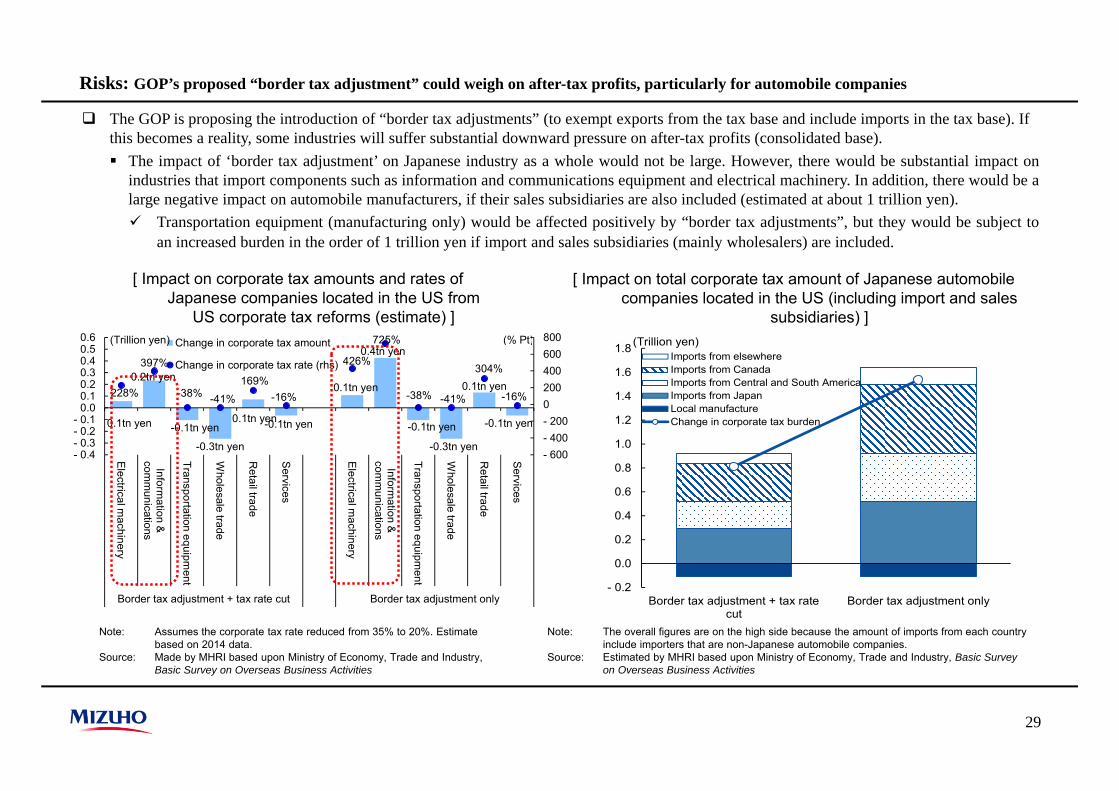
Risks: GOP’s proposed “border tax adjustment” could weigh on after-tax profits, particularly for automobile companies
The GOP is proposing the introduction of “border tax adjustments” (to exempt exports from the tax base and include imports in the tax base). If this becomes a reality, some industries will suffer substantial downward pressure on after-tax profits (consolidated base). The impact of ‘border tax adjustment’ on Japanese industry as a whole would not be large. However, there would be substantial impact on
industries that import components such as information and communications equipment and electrical machinery. In addition, there would be alarge negative impact on automobile manufacturers, if their sales subsidiaries are also included (estimated at about 1 trillion yen). Transportation equipment (manufacturing only) would be affected positively by “border tax adjustments”, but they would be subject to
an increased burden in the order of 1 trillion yen if import and sales subsidiaries (mainly wholesalers) are included.
[ Impact on corporate tax amounts and rates of Japanese companies located in the US from
US corporate tax reforms (estimate) ]
[ Impact on total corporate tax amount of Japanese automobile companies located in the US (including import and sales
subsidiaries) ]
Note: The overall figures are on the high side because the amount of imports from each country include importers that are non-Japanese automobile companies.
Source: Estimated by MHRI based upon Ministry of Economy, Trade and Industry, Basic Survey on Overseas Business Activities
Note: Assumes the corporate tax rate reduced from 35% to 20%. Estimate based on 2014 data.
Source: Made by MHRI based upon Ministry of Economy, Trade and Industry, Basic Survey on Overseas Business Activities
0.1tn yen
0.2tn yen
-0.1tn yen
-0.3tn yen
0.1tn yen-0.1tn yen
0.1tn yen
0.4tn yen
-0.1tn yen
-0.3tn yen
0.1tn yen
-0.1tn yen
228%
397%
-38% -41%
169%-16%
426%
725%
-38% -41%
304%
-16%
- 600- 400- 2000200400600800
- 0.4- 0.3- 0.2- 0.1
0.00.10.20.30.40.50.6
Electrical machinery
Information &
comm
unications
Transportation equipment
Wholesale trade
Retail trade
Services
Electrical machinery
Information &
comm
unications
Transportation equipment
Wholesale trade
Retail trade
Services
Border tax adjustment + tax rate cut Border tax adjustment only
Change in corporate tax amount
Change in corporate tax rate (rhs)
(Trillion yen) (% Pt)
- 0.2
0.0
0.2
0.4
0.6
0.8
1.0
1.2
1.4
1.6
1.8
Border tax adjustment + tax ratecut
Border tax adjustment only
Imports from elsewhereImports from CanadaImports from Central and South AmericaImports from JapanLocal manufactureChange in corporate tax burden
(Trillion yen)
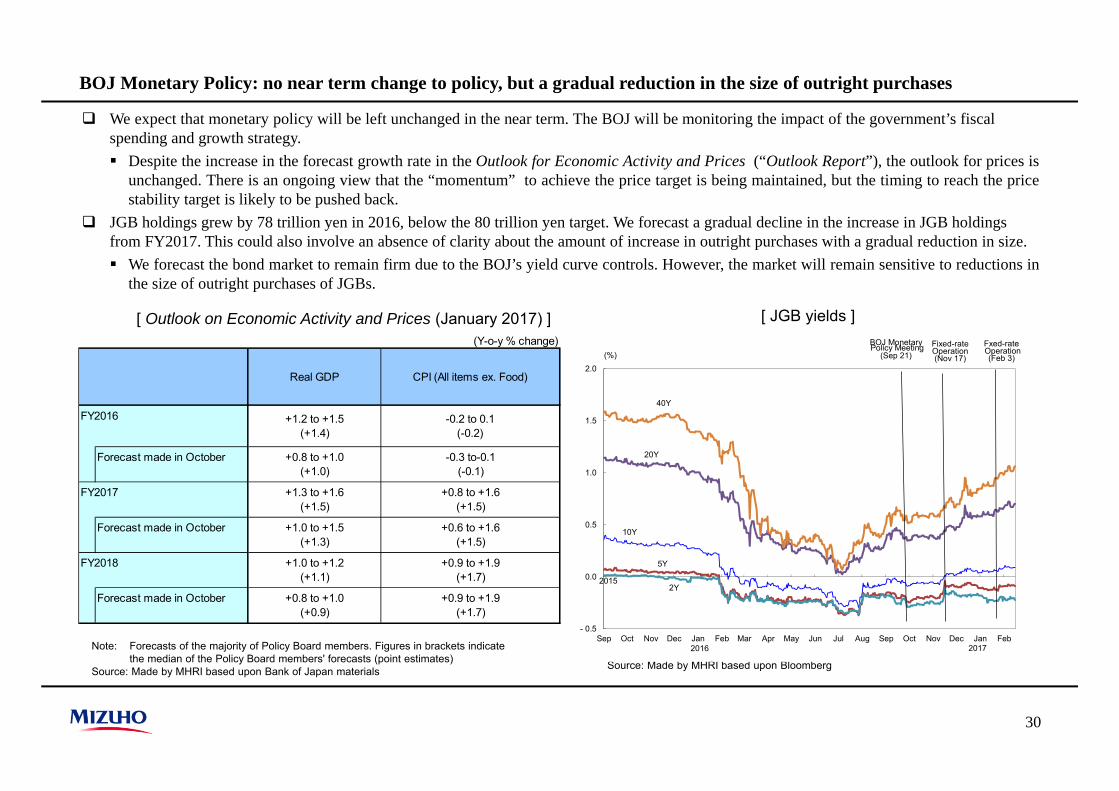
BOJ Monetary Policy: no near term change to policy, but a gradual reduction in the size of outright purchases
We expect that monetary policy will be left unchanged in the near term. The BOJ will be monitoring the impact of the government’s fiscal spending and growth strategy. Despite the increase in the forecast growth rate in the Outlook for Economic Activity and Prices (“Outlook Report”), the outlook for prices is
unchanged. There is an ongoing view that the “momentum” to achieve the price target is being maintained, but the timing to reach the pricestability target is likely to be pushed back.
JGB holdings grew by 78 trillion yen in 2016, below the 80 trillion yen target. We forecast a gradual decline in the increase in JGB holdings from FY2017. This could also involve an absence of clarity about the amount of increase in outright purchases with a gradual reduction in size. We forecast the bond market to remain firm due to the BOJ’s yield curve controls. However, the market will remain sensitive to reductions in
the size of outright purchases of JGBs.
30
[ Outlook on Economic Activity and Prices (January 2017) ]
Note: Forecasts of the majority of Policy Board members. Figures in brackets indicate the median of the Policy Board members' forecasts (point estimates)
Source: Made by MHRI based upon Bank of Japan materials Source: Made by MHRI based upon Bloomberg
[ JGB yields ]
- 0.5
0.0
0.5
1.0
1.5
2.0
Sep Oct Nov Dec Jan Feb Mar Apr May Jun Jul Aug Sep Oct Nov Dec Jan Feb
(%)
10Y
5Y
20Y
2015
2016
40Y
BOJ MonetaryPolicy Meeting
(Sep 21)
2Y
Fixed-rateOperation(Nov 17)
2017
Fxed-rateOperation(Feb 3)
(Y-o-y % change)
FY2016
Forecast made in October
FY2017
Forecast made in October
FY2018
Forecast made in October
+0.9 to +1.9(+1.7)
+0.9 to +1.9(+1.7)
Real GDP
-0.2 to 0.1(-0.2)
-0.3 to-0.1(-0.1)
+0.8 to +1.6(+1.5)
+0.6 to +1.6(+1.5)
CPI (All items ex. Food)
+1.2 to +1.5(+1.4)
+0.8 to +1.0(+1.0)
+1.3 to +1.6(+1.5)
+1.0 to +1.5(+1.3)
+1.0 to +1.2(+1.1)
+0.8 to +1.0(+0.9)
31
Sustained growth due to export recovery, despite slowdown in China
III. Asian Economies
32
Asian Economies: Asia also recovering because of China’s improved production-inventory balance and the recovery in Chinese imports
In the Oct-Dec quarter of 2016, China’s real GDP growth rate stood at +6.8% y-o-y, a slight acceleration from the previous quarter (+6.7%y-o-y). Imports have clearly recovered with the improvement in the production-inventory balance due to progress in productionadjustments and increase of housing investment and IT-related demand for domestic mobile telephones.
Apart from the slowdown in housing investment due to policies to curb housing purchases, the ongoing adjustment for industries withexcess production capacity are negative factors. On the other hand, the positive impact of support from fiscal policies such asinfrastructure investment and the improvements in the production-inventory balance should contribute to the stability of the Chineseeconomy.
With the exception of downturns caused by temporary factors, the Asian economies (ex. China) picked up in the Oct-Dec quarter of 2016driven by IT and commodity exports.
Apart from the ongoing recovery in exports, particularly to the US, domestic demand has been firm in ASEAN countries such as thePhilippines and Vietnam, which have been successful in areas such as investment promotion policies. In 2018. we expect a slightacceleration of growth of the Asian economies including China. However, there are concerns that the recovery could be dampened if theprotectionist stance of the US intensifies.
33
Export recovery until 2018, with slight acceleration in Asian economies
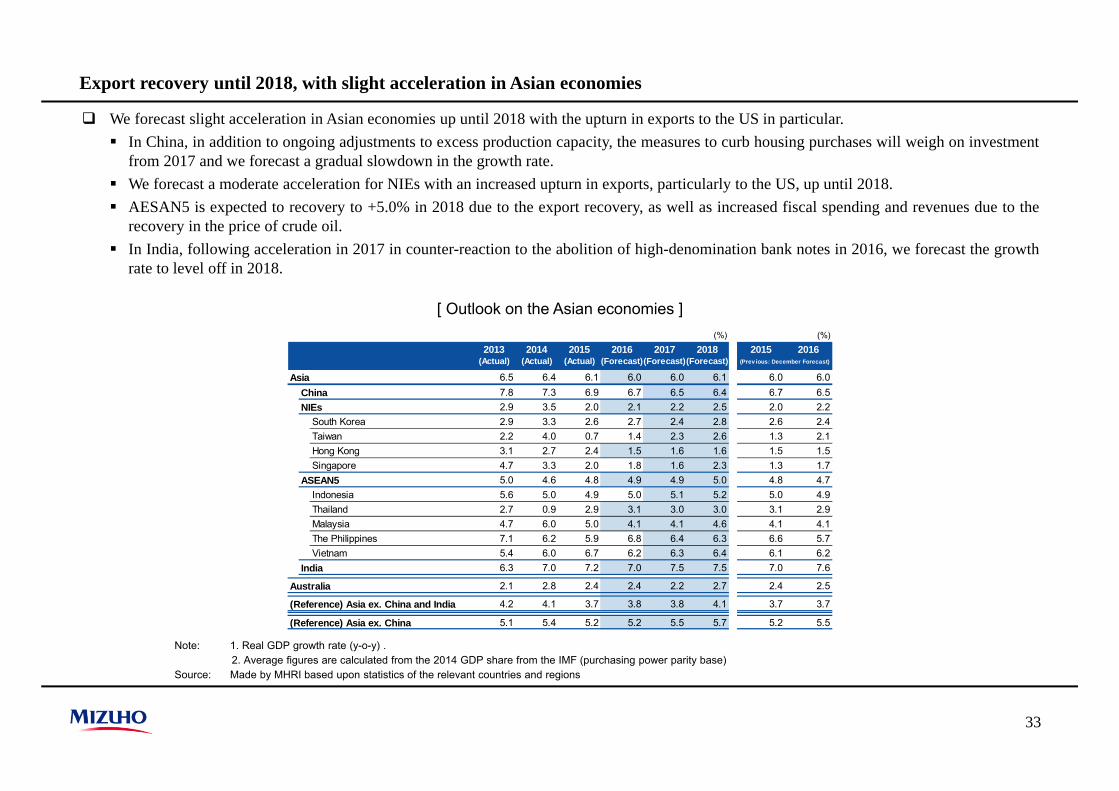
We forecast slight acceleration in Asian economies up until 2018 with the upturn in exports to the US in particular. In China, in addition to ongoing adjustments to excess production capacity, the measures to curb housing purchases will weigh on investment
from 2017 and we forecast a gradual slowdown in the growth rate. We forecast a moderate acceleration for NIEs with an increased upturn in exports, particularly to the US, up until 2018. AESAN5 is expected to recovery to +5.0% in 2018 due to the export recovery, as well as increased fiscal spending and revenues due to the
recovery in the price of crude oil. In India, following acceleration in 2017 in counter-reaction to the abolition of high-denomination bank notes in 2016, we forecast the growth
rate to level off in 2018.
[ Outlook on the Asian economies ](%) (%)
2013 2014 2015 2016 2017 2018 2015 2016(Actual) (Actual) (Actual) (Forecast)(Forecast)(Forecast)
6.5 6.4 6.1 6.0 6.0 6.1 6.0 6.0China 7.8 7.3 6.9 6.7 6.5 6.4 6.7 6.5NIEs 2.9 3.5 2.0 2.1 2.2 2.5 2.0 2.2
South Korea 2.9 3.3 2.6 2.7 2.4 2.8 2.6 2.4Taiwan 2.2 4.0 0.7 1.4 2.3 2.6 1.3 2.1Hong Kong 3.1 2.7 2.4 1.5 1.6 1.6 1.5 1.5Singapore 4.7 3.3 2.0 1.8 1.6 2.3 1.3 1.7
ASEAN5 5.0 4.6 4.8 4.9 4.9 5.0 4.8 4.7Indonesia 5.6 5.0 4.9 5.0 5.1 5.2 5.0 4.9Thailand 2.7 0.9 2.9 3.1 3.0 3.0 3.1 2.9Malaysia 4.7 6.0 5.0 4.1 4.1 4.6 4.1 4.1The Philippines 7.1 6.2 5.9 6.8 6.4 6.3 6.6 5.7Vietnam 5.4 6.0 6.7 6.2 6.3 6.4 6.1 6.2
India 6.3 7.0 7.2 7.0 7.5 7.5 7.0 7.6
Australia 2.1 2.8 2.4 2.4 2.2 2.7 2.4 2.5
(Reference) Asia ex. China and India 4.2 4.1 3.7 3.8 3.8 4.1 3.7 3.7
(Reference) Asia ex. China 5.1 5.4 5.2 5.2 5.5 5.7 5.2 5.5
Asia
(Prev ious: December Forecast)
Note: 1. Real GDP growth rate (y-o-y) . 2. Average figures are calculated from the 2014 GDP share from the IMF (purchasing power parity base)
Source: Made by MHRI based upon statistics of the relevant countries and regions
34
Asia: recent economic recovery, and forecast for ongoing recovery in exports
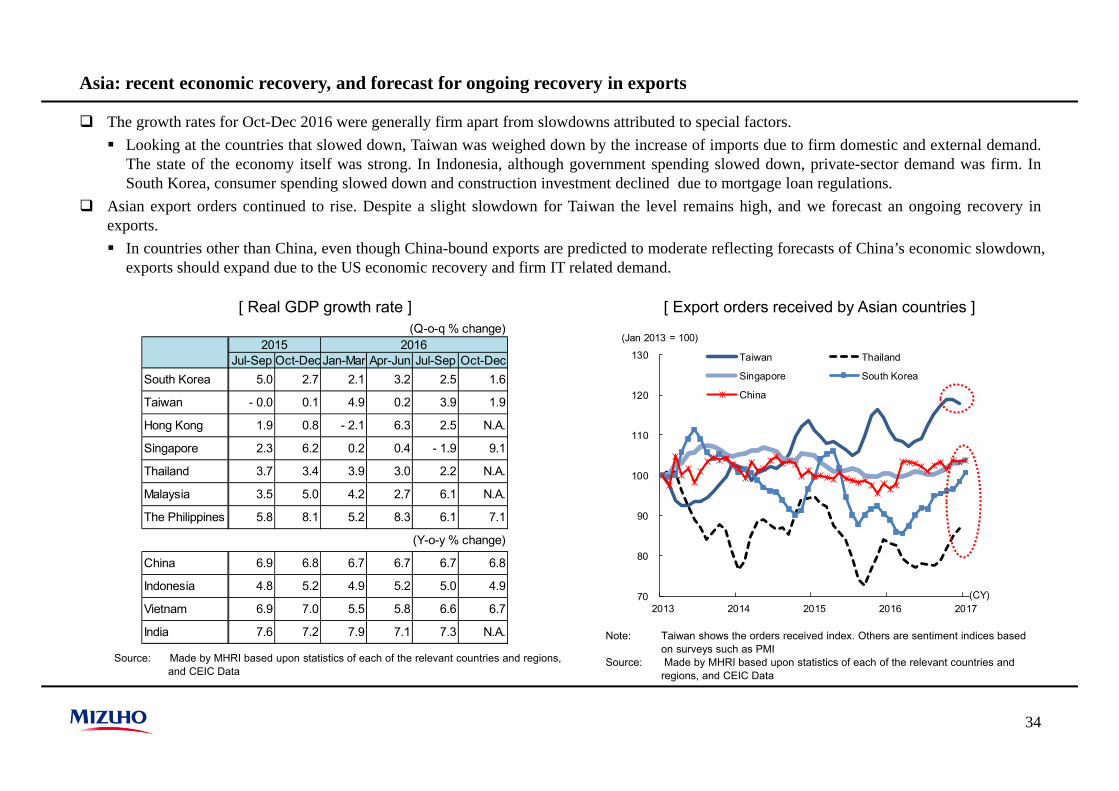
The growth rates for Oct-Dec 2016 were generally firm apart from slowdowns attributed to special factors. Looking at the countries that slowed down, Taiwan was weighed down by the increase of imports due to firm domestic and external demand.
The state of the economy itself was strong. In Indonesia, although government spending slowed down, private-sector demand was firm. InSouth Korea, consumer spending slowed down and construction investment declined due to mortgage loan regulations.
Asian export orders continued to rise. Despite a slight slowdown for Taiwan the level remains high, and we forecast an ongoing recovery inexports. In countries other than China, even though China-bound exports are predicted to moderate reflecting forecasts of China’s economic slowdown,
exports should expand due to the US economic recovery and firm IT related demand.
[ Real GDP growth rate ] [ Export orders received by Asian countries ]
Source: Made by MHRI based upon statistics of each of the relevant countries and regions, and CEIC Data
Note: Taiwan shows the orders received index. Others are sentiment indices based on surveys such as PMI
Source: Made by MHRI based upon statistics of each of the relevant countries and regions, and CEIC Data
70
80
90
100
110
120
130
2013 2014 2015 2016 2017
Taiwan Thailand
Singapore South Korea
China
(Jan 2013 = 100)
(CY)
(Q-o-q % change)
Jul-Sep Oct-Dec Jan-Mar Apr-Jun Jul-Sep Oct-DecSouth Korea 5.0 2.7 2.1 3.2 2.5 1.6
Taiwan - 0.0 0.1 4.9 0.2 3.9 1.9
Hong Kong 1.9 0.8 - 2.1 6.3 2.5 N.A.
Singapore 2.3 6.2 0.2 0.4 - 1.9 9.1
Thailand 3.7 3.4 3.9 3.0 2.2 N.A.
Malaysia 3.5 5.0 4.2 2.7 6.1 N.A.
The Philippines 5.8 8.1 5.2 8.3 6.1 7.1
(Y-o-y % change)
China 6.9 6.8 6.7 6.7 6.7 6.8
Indonesia 4.8 5.2 4.9 5.2 5.0 4.9
Vietnam 6.9 7.0 5.5 5.8 6.6 6.7
India 7.6 7.2 7.9 7.1 7.3 N.A.
20162015
35
China: new financial risks are smoldering with growing vulnerability to higher interest rates
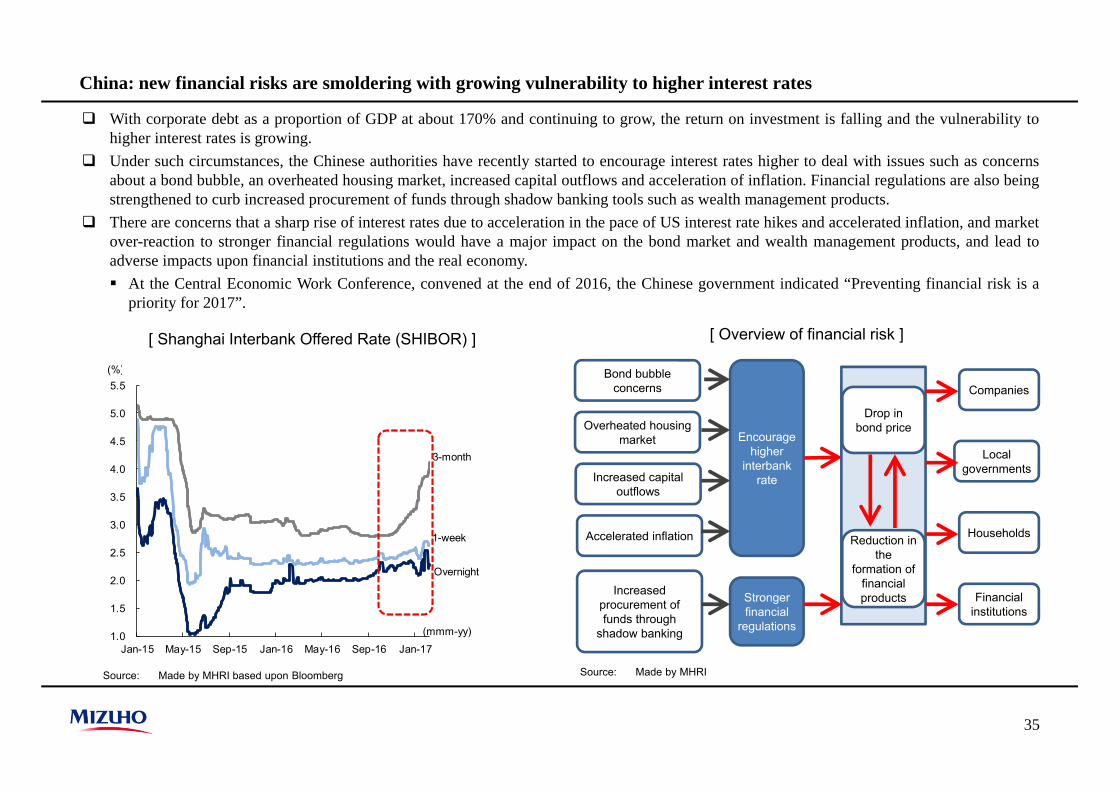
With corporate debt as a proportion of GDP at about 170% and continuing to grow, the return on investment is falling and the vulnerability tohigher interest rates is growing.
Under such circumstances, the Chinese authorities have recently started to encourage interest rates higher to deal with issues such as concernsabout a bond bubble, an overheated housing market, increased capital outflows and acceleration of inflation. Financial regulations are also beingstrengthened to curb increased procurement of funds through shadow banking tools such as wealth management products.
There are concerns that a sharp rise of interest rates due to acceleration in the pace of US interest rate hikes and accelerated inflation, and marketover-reaction to stronger financial regulations would have a major impact on the bond market and wealth management products, and lead toadverse impacts upon financial institutions and the real economy. At the Central Economic Work Conference, convened at the end of 2016, the Chinese government indicated “Preventing financial risk is a
priority for 2017”.
[ Shanghai Interbank Offered Rate (SHIBOR) ] [ Overview of financial risk ]
Source: Made by MHRI based upon Bloomberg Source: Made by MHRI
Overheated housing market
Increased capital outflows
Accelerated inflation
Increased procurement of funds through
shadow banking
Encourage higher
interbank rate
Stronger financial
regulations
Companies
Local governments
Households
Financial institutions
Drop in bond price
Reduction in the
formation of financial products
Bond bubble concerns
1.0
1.5
2.0
2.5
3.0
3.5
4.0
4.5
5.0
5.5
Jan-15 May-15 Sep-15 Jan-16 May-16 Sep-16 Jan-17
(%)
(mmm-yy)
3-month
1-week
Overnight
36
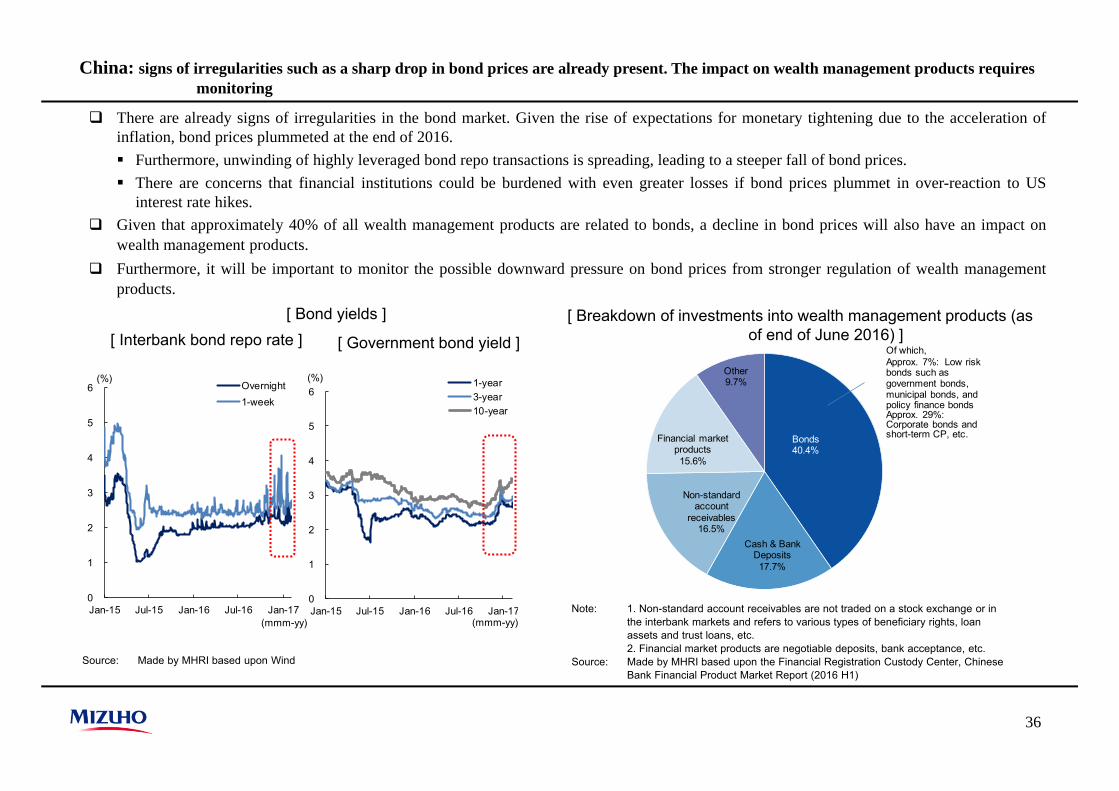
China: signs of irregularities such as a sharp drop in bond prices are already present. The impact on wealth management products requires monitoring
There are already signs of irregularities in the bond market. Given the rise of expectations for monetary tightening due to the acceleration ofinflation, bond prices plummeted at the end of 2016. Furthermore, unwinding of highly leveraged bond repo transactions is spreading, leading to a steeper fall of bond prices. There are concerns that financial institutions could be burdened with even greater losses if bond prices plummet in over-reaction to US
interest rate hikes. Given that approximately 40% of all wealth management products are related to bonds, a decline in bond prices will also have an impact on
wealth management products. Furthermore, it will be important to monitor the possible downward pressure on bond prices from stronger regulation of wealth management
products.
Source: Made by MHRI based upon Wind
[ Bond yields ] [ Breakdown of investments into wealth management products (as of end of June 2016) ]
Note: 1. Non-standard account receivables are not traded on a stock exchange or in the interbank markets and refers to various types of beneficiary rights, loan assets and trust loans, etc.2. Financial market products are negotiable deposits, bank acceptance, etc.
Source: Made by MHRI based upon the Financial Registration Custody Center, Chinese Bank Financial Product Market Report (2016 H1)
[ Interbank bond repo rate ] [ Government bond yield ]
0
1
2
3
4
5
6
Jan-15 Jul-15 Jan-16 Jul-16 Jan-17
Overnight1-week
(%)
(mmm-yy)
0
1
2
3
4
5
6
Jan-15 Jul-15 Jan-16 Jul-16 Jan-17
1-year3-year10-year
(mmm-yy)
(%)
Bonds40.4%
Cash & Bank Deposits17.7%
Non-standard account
receivables16.5%
Financial market products15.6%
Other9.7%
Of which,Approx. 7%: Low risk bonds such as government bonds, municipal bonds, and policy finance bondsApprox. 29%: Corporate bonds and short-term CP, etc.
37
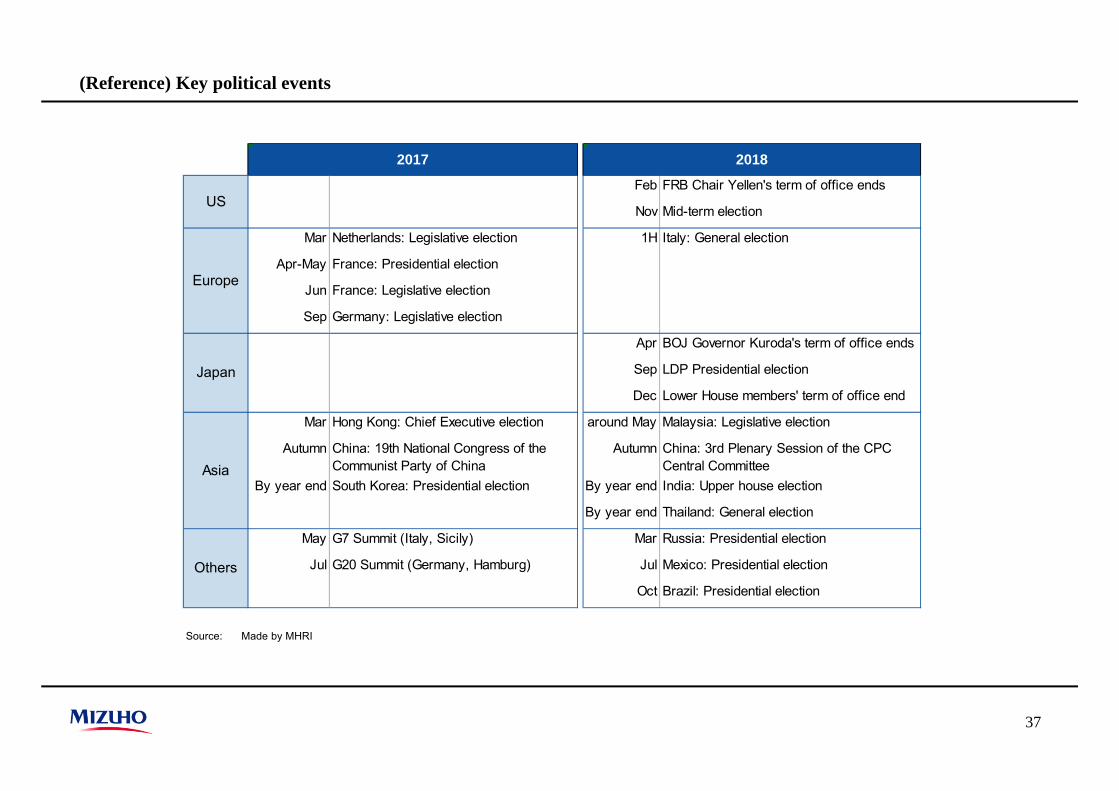
(Reference) Key political events
Source: Made by MHRI
Feb FRB Chair Yellen's term of office ends
Nov Mid-term election
Mar Netherlands: Legislative election 1H Italy: General election
Apr-May France: Presidential election
Jun France: Legislative election
Sep Germany: Legislative election
Apr BOJ Governor Kuroda's term of office ends
Sep LDP Presidential election
Dec Lower House members' term of office end
Mar Hong Kong: Chief Executive election around May Malaysia: Legislative election
Autumn China: 19th National Congress of theCommunist Party of China
Autumn China: 3rd Plenary Session of the CPCCentral Committee
By year end South Korea: Presidential election By year end India: Upper house election
By year end Thailand: General election
May G7 Summit (Italy, Sicily) Mar Russia: Presidential election
Jul G20 Summit (Germany, Hamburg) Jul Mexico: Presidential election
Oct Brazil: Presidential election
Asia
Others
2017 2018
US
Europe
Japan
Mizuho Research Institute Ltd.This publication is compiled solely for the purpose of providing readers with information and is in no waymeant to solicit transactions. Although this publication is compiled on the basis of sources which webelieve to be reliable and correct, Mizuho Research Institute does not warrant its accuracy and certainty.Readers are requested to exercise their own judgment in the use of this publication. Please also note thatthe contents of this publication may be subject to change without prior notice.
38
Recommended