Seaborne Coal Markets to 2030
Pittsburgh, PASeptember 20-21, 2012
This material was used by McKinsey & Company during an oral presentation; it is not a complete record of the discussion.
Platts Coal Marketing Days
G L O B A L C O A L O U T L O O K

1|McKinsey & Company
Seaborne Coal has a healthy future …
▪ Seaborne trade is growing faster than total demand
Energy coal
▪ India will need an extra 250-350 mtpa by 2020 and
China 500-1,000 mtpa by 2030.
▪ Few countries can supply at >100 mtpa scale – Australia– Indonesia– US– Russia
Met coal
▪ Steel demand growth will slow, but seaborne met coal demand will accelerate
▪ Best positioned suppliers:
– Australia
– US/Canada
– Mozambique
▪ Supply/demand balance remains unstable.

2|McKinsey & Company
India is at an inflection point
SOURCE: McKinsey India Coal Model
Inconceivable for the coal and power sectors to continue on the current business-
as-usual trajectories
▪ Domestic coal supply: Production from CIL and captive blocks will fall severely short
of demand
▪ Power and coal demand: Fulfilling power demand even at a modest GDP growth of
~6% will imply higher reliance on imported coal, most of which is not viable at current
power purchase prices (PPAs)
▪ Ports and railways infrastructure: Even at modest levels of coal import, the port and
rail infrastructure in the eastern region will bottleneck supplies
We expect discontinuities in several of these drivers, with significant implications
for imported coal
▪ A step change in power price realization (either through PPAs, merchant prices or cost
pass-through pricing), enabling a much higher imported coal component
▪ A significant (and with lead time) ramp-up in domestic coal supply partially mitigating
the imported coal dependence
▪ Significant power shortage, hampering India’s growth

3|McKinsey & Company
230 to 340 mtpa of Indian import need by 2020
* At 9,400 BTU/lb
SOURCE: McKinsey India Coal Model
Domestic supply scenarios
Mtpa @ 6,300 BTU/lb
▪ Minor
improvement in
CIL/SCCL policy
and execution
S1
▪ CIL/SCCL
mechanize
▪ ~ 50 pending
blocks into prod.
S2
▪ Coal supply declared ‘crisis’
▪ Accelerated development of 80 blocks
S3
Demand scenarios, Mtpa @ 6,300 BTU/lb
▪156 GW new plants
▪185 GW inland plants
delayed without coal
▪720 Mtps needed
D2
▪223 GW new plants
▪116 GW plants without
equipt. orders delayed
▪1,020 Mtpa needed
D1
430 Mtpa
import need*230
340 130
250 40
650
350300
520
300 220
380
230 150
Govt Private Total
Govt Private Total
Govt Private Total
Most
likely

4|McKinsey & Company
China is a real unknown – may need 500-1,000 mtpaof imports by 2030
0
500
1,000
1,500
2,000
2,500
3,000
China generation capacityGW
Coal
Hydro/nuke/other
Gas
302520151005
7.0
EIA Outlook
0
500
1,000
1,500
2,000
2,500
3,000
China generation capacityGW
Coal
Hydro/nuke/other
Gas
302520151005
‘30 coal consumptionBillion tonnes, 5800 kcal/kJ
Wood Mackenzie forecast
SOURCE: US Energy Information Administration, Wood Mackenzie, World Energy Council, McKinsey analysis
‘30 Reserve/production ratio(excludes imports, discoveries)
~5
‘30 coal consumptionBillion tonnes, 5800 kcal/kJ
4.6
‘30 Reserve/production ratio(excludes imports, discoveries)
~10
2010-30 CAGRPercent
3%
4%
2%
2010-30 CAGRPercent
7%
7%
4%

5|McKinsey & Company
Few countries could increase exports by 100+ mtpa
SOURCE: McKinsey analysis
▪ Incremental Australian and Russian supply face medium-risk transportation constraints
▪ Beyond 150 Mtpa, Indonesian supply is highly uncertain– Rapidly growing
domestic demand– Government limits
and taxes on exports
▪ Incremental US supply remains highly uncertain given the political constraints on new Pacific port construction
2030
2.2
Other
0.1
Russia
0.2
US
0.3
Indonesia
0.3
Australia
0.5
2012
0.7
Low uncertainty
Medium uncertainty
High uncertainty
Incremental seaborne energy coal supply capacity (2012 – 2030)Billion tonnes / year

6|McKinsey & Company
Steel demand to slow to ~4% as per capita consumption starts to peak
0
100
200
300
400
500
600
700
800
2050403020102000
Western Europe
NAFTA
China
Japan, Korea, Taiwan
Forecast
SOURCE: McKinsey analysis
Potential peak levels of 600-650 kg finished steel per capita,
resulting in finished steel consumption of ~850-900 mt Long term maturity
levels of 450-550 kg per capita, or ~630-770 mtof steel consumption
China finished steel demand, kg/capita

7|McKinsey & Company
As China steel consumption begins to peak, demand growth shifts to India and other developing markets
1 CIS, MENA, Latin America, Subsaharan Africa, Other Asia
136
129
129
128
98
127
144
151
154
181
199
203
China
ROW 1
India
Developed Asia
North America
Europe
25
2,180
886
597
217
20
1,931
815
485
160
3.4% p.a.
1,640
718
383
102
15
1,315
586
280
62
2010
Apparent demand for finished steel productsMillion metric tons
CAGR
2010 - 15 2015 - 20 2020 - 25
6.310.5 9.3
0.43.2 1.9
1.05.2 2.6
-0.2-0.9 -0.1
4.26.5 4.8
1.74.2 2.6
4.5 3.3 2.5Global
BASE CASE
SOURCE: World Steel Association; McKinsey Integrated Steel Making Raw Materials Demand model
8|McKinsey & Company
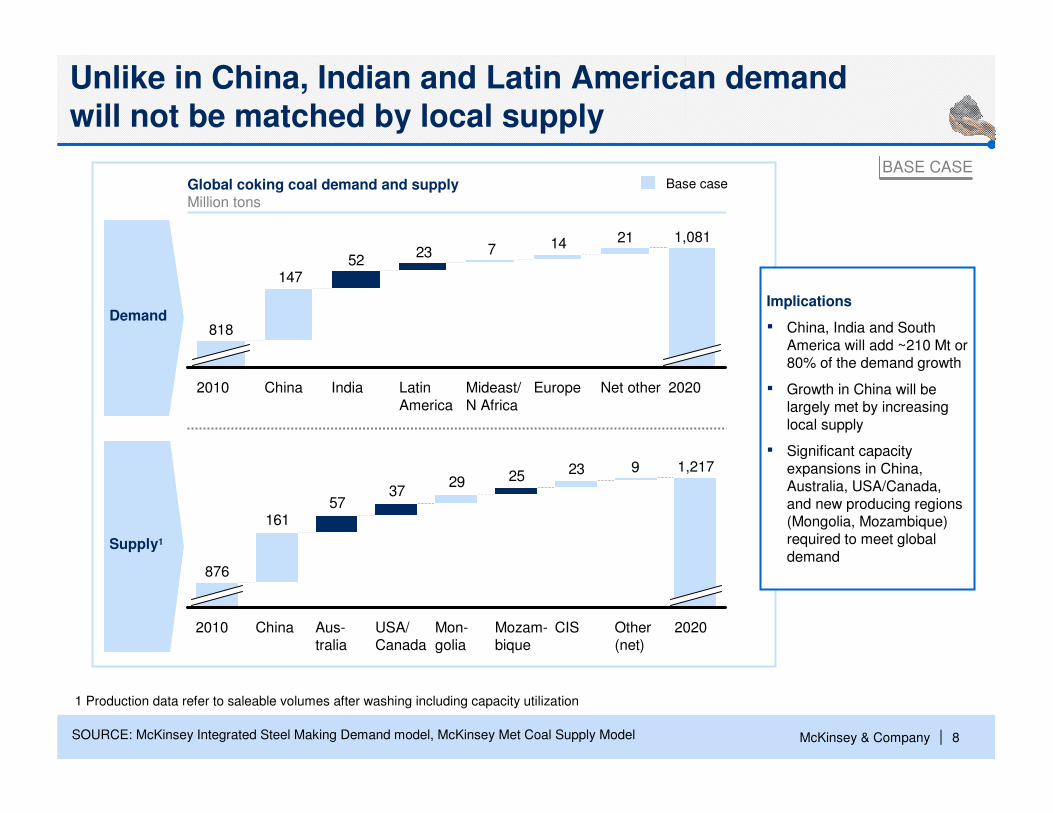
211472352
147
2020
1,081
Net otherEuropeMideast/
N Africa
Latin
America
IndiaChina2010
818
923252937
57161
2020
1,217
Other (net)
CISMozam-bique
Mon-golia
USA/Canada
Aus-tralia
China2010
876
Base case
Unlike in China, Indian and Latin American demand will not be matched by local supply
1 Production data refer to saleable volumes after washing including capacity utilization
Implications
▪ China, India and South
America will add ~210 Mt or 80% of the demand growth
▪ Growth in China will be largely met by increasing
local supply
▪ Significant capacity
expansions in China, Australia, USA/Canada,
and new producing regions (Mongolia, Mozambique) required to meet global
demand
Demand
Supply1
Global coking coal demand and supplyMillion tons
BASE CASE
SOURCE: McKinsey Integrated Steel Making Demand model, McKinsey Met Coal Supply Model

9|McKinsey & Company
CA
N-T
3
0
CA
N-T
1
AU
S-T
5
AU
S-T
3
NZ
IND
O
VE
NC
OL
MO
Z
AU
S-T
2
RU
S
AU
S-T
1
50
200
250
0
AU
S-T
4
100
150
CA
N-T
2
10 4020 30 8050 7060 22090 110100 210120 140130 200150 190160 180170
Seaborne cost curve steep and unstable, with high prices when high cost US coal required to close the market
Brownfield pricing regime
+5/+25% premium over C90 seaborne cash cost of U.S.
Greenfield pricing regime
+25/+45% premium over C90 seaborne cash cost of U.S.
SupplyMtpy
Washed seaborne coking coal cost curveCash cost, USD / metric tonne FOB
90th percentile
cash cost
SOURCE: McKinsey Met Coal Supply Model
Mining cash cost
Inland freight
(rail/barge and port)
Quality discount to
HCC benchmark
US producers:

10|McKinsey & Company
Appendix

11|McKinsey & Company
Steel demand to slow to ~4%
Low case
Base case
High case
25
2,200
2,800
2030
7.0% pa
2,400
2,600
2,000
1,800
1,600
1,400
1,200
1,000
800
600
0
1.2% pa
2015
1,391
100520009590851981
Apparent demand for finished steel productsMillion metric tons, CAGRs 1981 - 2000, 2000 - 08
Historical Forecast
6.3%
4.5%
2.6%
3.3%
3.3%
3.2%
‘10-'15
CAGR, Percent
'15-'20
Financial crisis – sharp break from previous trend, demand growing again but from a lower base
Inflection point – rise of emerging market industrialization, led by China
SOURCE: World Steel Association; McKinsey Integrated Steel Making Raw Materials Demand model

12|McKinsey & CompanySOURCE: McCloskey; China customs
OtherChina
2532
30
2011
211
166
5
2005
211
171
187
06
179
07
182
152
08
183
179
3
09
179
10
176
3173
170
3
3 1 2 2 17
▪ Historically coking coal demand in China was mostly satisfied by domestic supply and had limited impact on seaborne export market
▪ In 2009, driven by lower price, coastal/riverside steel mills (Baosteel, Wugang, Angang, Hebei Iron & Steel, Shagang), started to import metallurgical coal
▪ Given better quality of imported met coal, these imports were “sticky”throughout 2011 but started declining as the share of overland imports increased
China became a significant seaborne coking coal importer in 2009and but reduced seaborne imports again in 2011
15
Seaborne coking coal demand (excl. imports from Mongolia)Million tons
11
% China share

13|McKinsey & CompanySOURCE: McCloskey; China customs
68 54 50 47 68 55
▪ Strong increase of coking coal imports in 2009 substantially driven by seaborne imports from Australia
▪ Starting in 2010 and even stronger in 2011, seaborne imports from Australia were replaced particularly by non-seaborne imports from Mongolia and seaborne imports from North America
In 2011, seaborne imports into China were largely substituted bynon-seaborne imports from Mongolia
88
Chinese coking coal importsMillion tons
% Seaborne share
8
3
7
20
15
0
5
10
15
20
25
30
35
40
45
50
5
2002
2005
7
3102
2011
45
10
8
10
47
17
06 09
34
23
4
4
4
08
7
1114
07
6
201
7
Non-sea-borne
Sea-borne
1 Russia, Indonesia, New Zealand and other
Australia
Canada + US
Other seaborne1
Mongolia

14|McKinsey & CompanySOURCE: China Customs; McKinsey analysis
20 25
2418 22
1413
29
5262
131510000
112
17
2
126
10
111
09
86
10
08
33
201107
41
22
06
3120
7
2005
1622
7
0 21 5
5
102
Chinese seaborne1 thermal coal import
Mtpa (@ 6000 kcal/kg)
1 Excludes road/rail imports from Mongolia and North Korea
2 Primary export destinations (both historical and forecast) are Japan, S Korea and Taiwan
CHINA THERMAL AND COKING COAL TRADE EVOLUTION
Others
Russia
Australia
Vietnam
Indonesia
Import
share
%
4.2 4.9 5.10.9 1.6 2.2 1.4
Exports2
Mtpa
22 18 1166 59 51 42
Net import
Mtpa
64 93 115(50) (28) (9) (9)
China coal imports reached ~125 mt in 2011 and have shown strong growth since 2008 but still represent just 5% of China’s thermal demand
▪ In 2009, imports tripled,
with significant imports
from Australia for the
first time
▪ China moved from a net
export position to large
net seaborne imports in
one year
▪ Rapid rise in imports
because of freight
differentials and
delivered price arbitrage

15|McKinsey & Company
Continued yr-on-yr declining power demand growth has contributed to
increasing inventories both in ports and at power plants
SOURCE: CCTD; Sxcoal; McKinsey
8
10
12
14
16
18
20
22
24
26
28
30
J F M DNOSAJJMA
Coal inventory in 7 key Northern portsMillion metric ton
-30
-20
-10
0
10
20
30
40
50
60
70
80
-30
-20
-10
0
10
20
30
40
50
60
70
80
Coal demand growthPercent YoY
Power generation growthPercent YoY
JS MM S N JJ N JMJJ J SJM S MNJN MMM MM J20092008 2010
Thermal power generation monthly growth
Coal app. demand monthly growth
CHINA THERMAL COAL DEMAND - INVENTORIES
▪ Inventory in key ports e.g., Qinhuangdao, Tianjin, have reached record highs in July; warehouses are so full that
incoming trains cannot unload coal and are forced to stay idle with coal on board
▪ Coal inventories at power plants level are also at record high levels, there are only very few buyers for the record stockpile of coal
2012
2011
2010
2009
2008
20122011
16|McKinsey & Company
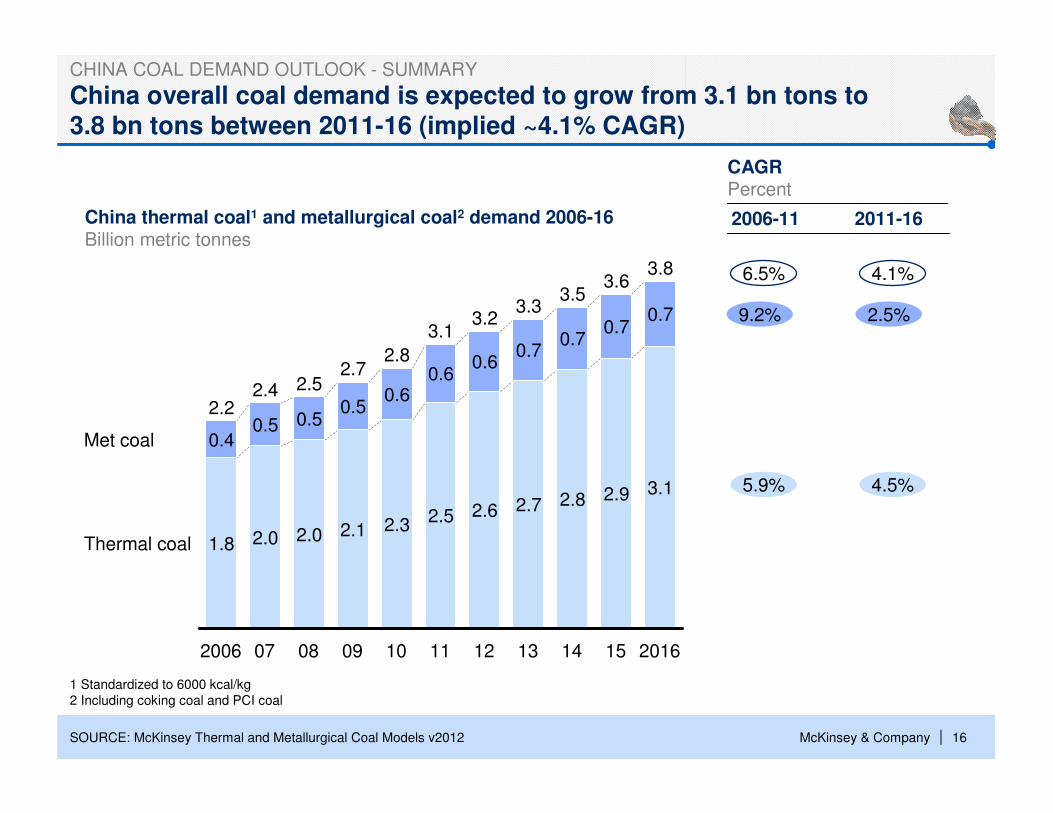
China overall coal demand is expected to grow from 3.1 bn tons to 3.8 bn tons between 2011-16 (implied ~4.1% CAGR)
China thermal coal1 and metallurgical coal2 demand 2006-16Billion metric tonnes
CHINA COAL DEMAND OUTLOOK - SUMMARY
2.8
0.7
13
3.3
2.7
0.7
12
3.2
2.6
0.6
11
3.1
2.9
Thermal coal
Met coal
2016
3.8
3.1
0.7
15
3.6
0.7
14
2.5
0.6
10
2.8
2.3
0.6
3.5
2.7
2.1
0.5
08
2.5
2.0
0.5
09
2.4
2.0
0.5
2006
2.2
1.8
0.4
07
SOURCE: McKinsey Thermal and Metallurgical Coal Models v2012
2.5%
4.5%
CAGRPercent
2011-162006-11
4.1%
9.2%
5.9%
6.5%
1 Standardized to 6000 kcal/kg
2 Including coking coal and PCI coal

17|McKinsey & Company
Southern Africa has seven significant coal deposits, with thelargest located in South Africa
Mozambique
Angola
Malawi
Zambia
Namibia
Lesotho
Zimbabwe
Botswana
South Africa
Swaziland
Madagascar
8
67
5
4
21
SOURCE: Team analysis
Location of major coal reserves in Southern Africa
DepositsReservestons, billion
Qualitykcal/kg
Thermal % Deposits
Reservestons, billion
Qualitykcal/kg
Thermal %
1 Witbank 17 5900-6200 85 6 Zambezi basin 26 5800-6926 60
2 Waterberg 6 5900-6200 100 7 Maamba
deposits
0.7 6100-6300 100
4 Moatzie basin 23 5300-7800 408 Imaloto
coal basin0.7 4200 100
5 Mmamabula coal deposits
200 4700-6448 100 9 Aranos coal basin
0.4 - -
9
PRELIMINARY
3 South Africa other 8 5900-6200 -
3

18|McKinsey & Company
Steel intensity for selected economies
1 Crude steel equivalent
SOURCE: WSA; Global Insight; IMF; USGS; McKinsey
0
100
200
300
400
500
600
700
800
900
1,000
1,100
1,200
1,300
0 5,000 10,000 15,000 20,000 25,000 30,000 35,000 40,000
Steel consumption1
kg/capita
Real GDP (2000)USD/capita
India (1970 - 2011)
Taiwan (1970 - 2011)
USA (1900 - 2011)
Japan (1955 - 2011)
South Korea (1970 - 2011)
EU-15 (1948 - 2011)
Germany (1946 - 2011)
Heavy
industryexport
economies
Developedand
diversified
economies
China
(1970 –
2011)
Russia (1994 –
2011)
Low asset
intensityeconomies
Mexico (1967 - 2011)
Recommended


![2+* /-,4176 a P|Gw]Tki8Nqn9CE+d.QPn9 YC C O? nK ;?](https://img.pdfslide.net/doc/110x75/5e59e615d5302a300c3f40ed/2-4176-a-pgwtki8nqn9cedqpn9-yc-c-o-nk-.jpg)