GAS TRANSMISSION THROUGH MICROPOROUS MEMBRANES
Except where reference is made to the work of others, the work described in this dissertation is my own or was done in collaboration with my advisory committee. This
dissertation does not include proprietary or classified information.
Tacibaht Turel Certificate of Approval: ___________________________ Gisela Buschle-Diller Professor Polymer and Fiber Engineering
___________________________ Yasser Gowayed, Chair Professor Polymer and Fiber Engineering
___________________________ Peter Schwartz Professor Polymer and Fiber Engineering
___________________________ George T. Flowers Interim Dean Graduate School
GAS TRANSMISSION THROUGH MICROPOROUS MEMBRANES
Tacibaht Turel
A Dissertation
Submitted to
the Graduate Faculty of
Auburn University
In Partial Fulfillment of the
Requirements for the
Degree of
Doctor of Philosophy
Auburn, Alabama December 19, 2008
iii
GAS TRANSMISSION THROUGH MICROPOROUS MEMBRANES
Tacibaht Turel
Permission is granted to Auburn University to make copies of this dissertation at its discretion upon request of individuals or institutions and at their expense. The author
reserves all publication rights.
Signature of Author
Date of Graduation

iv
VITA
Tacibaht Turel, daughter of Nejla Turel and F. Tamer Turel, was born November 30,
1975, in Elazig, Turkey. She graduated from Elazig Anatolia High School in 1993. She
graduated from Ege University, Izmir, Turkey, with a Bachelor of Science degree in
Textile Engineering in June, 1997. After working in various apparel manufacturing
companies in Turkey, she entered Graduate School, Auburn University, in May 2001.
She completed a M.Sc. degree in Textile Engineering in December 2002. She completed
a Ph.D. degree in Polymer and Fiber Engineering in December 2008.

v
DISSERTATION ABSTRACT
GAS TRANSMISSION THROUGH MICROPOROUS MEMBRANES
Tacibaht Turel
Doctor of Philosophy, December 19, 2008 (M.Sc., Auburn University, December 19, 2002)
(B.Sc., Ege University, Turkey, 1997)
170 Typed Pages
Directed by Yasser Gowayed
An ideal protective clothing material should be a good barrier against harmful gases
or vapor while allowing moisture vapor and air passage through the material. In the study
and design of barrier materials, one of the critical issues is to balance these requirements,
which may sometimes be mutually exclusive. Therefore it is critical to understand the
macroscopic and microscopic structure of the attack mechanisms as well as the barrier
materials and the transport phenomena in such systems.
In this study, air and gas transmission through barrier systems consisting of porous
membranes was investigated experimentally and a molecular-level probabilistic model
was constructed to evaluate the effect of various parameters on the gas flow. The effect of
membrane parameters such as porosity, pore size distribution, thickness as well as gas
parameters such as molecule diameters were examined at single layer as well as multiple
layers. To understand the gas behavior for harmful chemicals and to ensure safety during
vi
experimental studies, mimics of such gases were obtained which were comparable to the
actual gases in shape, molecular weight and other chemical properties. Air, ammonia and
several mimic gases of harmful chemical agents were studied. Beta-pinene was used as a
mimic of sarin and prenol was used as a mimic of nitrogen mustard. Gas transmission
experiments were conducted on polyester, nylon and polypropylene membranes each of
which had different porosity and pore size distributions. Experiments were done at
different pressure values and a comparison was made between permeability testing
machines based on volumetric and manometric principles as to their ability to
accommodate high permeability membranes. Physical and chemical adsorption of such
gases on porous membranes was also investigated after the addition of active elements on
the membrane surfaces which can interact with the gas molecules. An experimental setup
was developed to measure concentration changes upon passage of the gas through active
and non-active membranes by which way the effect of active elements on gas
transmission rates could be examined.
Probabilistic and mathematical models were proposed to predict gas transmission
rates of such membranes and gas permeation experiments were simulated utilizing the
proposed models. Modeling results were compared to experimental data and to macro-
level gas transmission models available in literature. The results were found to be in
acceptable correlation with experiments for membranes with a well-known morphology.
The pressure of the system, porosity and adsorption capacity of the materials, as well as
size of the gas molecules and their interaction energies between the surfaces were found
to be important parameters which affect permeability.

vii
ACKNOWLEDGEMENTS
I would like to thank Dr. Yasser Gowayed for his invaluable guidance,
understanding, support, wisdom, patience and faith in me during the last five years.
I would also like to thank Dr. Ebraheem Shady, who has been a very valuable
source of knowledge, for all his support and help during this study.
I am very grateful to Dr. Gisela Buschle-Diller for her gracious support in many
ways during the course of this study.
I am very thankful to Dr. Tamer Awad for his help during the final part of my
work. I would also like to thank all my professors and fellow graduate students at
Auburn University for their help, patience and support at different stages of my
studies as well as my family and friends without whose support I could not have
completed this work.
I would like to thank National Textile Center and Department of Homeland
Security for providing financial support.

viii
Style manual or journal used Guide to Preparation and Submission
of Theses and Dissertations, Textile
Research Journal
_____________________________________________________________________
Computer software used Matlab, Gaussian, Pymol, Griffin
_____________________________________________________________________
ix
TABLE OF CONTENTS
LIST OF FIGURES....................................................................................................xiii
LIST OF TABLES ...................................................................................................xvii
CHAPTER I .................................................................................................................. 1
LITERATURE REVIEW.............................................................................................. 1
1.1. Introduction ................................................................................................... 1
1.1.1. Purpose and objectives .......................................................................... 2
1.2. Membranes as Barrier Materials ................................................................... 3
1.3. Definitions of Important Parameters in Transport Through Porous Media .. 5
1.4. Types of Transport Through Membranes...................................................... 7
1.5. Principles of Gas Transport through Membranes ....................................... 10
1.5.1. Molecule-wall collisions ..................................................................... 14
1.5.2. Molecular collisions and viscous vs. Knudsen flow ........................... 15
1.5.3. Diffusion in Knudsen regime .............................................................. 16
1.5.4. Knudsen – Poiseulle transition model................................................. 18
1.6. Flow rate of gases through larger openings and tubes ................................ 20
1.7. Chemical and Physical Adsorption of Gases .............................................. 22
1.8. Evaporation of Liquids................................................................................ 26
1.9. Microscale Models for Permeation of Gases through Protective Materials 28
1.9.1. Mathematical models for fibrous materials......................................... 28
1.9.2. Mathematical models for membranes ................................................. 30
x
1.9.3. Molecular simulations and modeling .................................................. 33
1.9.4. Adsorption studies............................................................................... 34
1.10. References ................................................................................................... 36
CHAPTER II ............................................................................................................... 41
GAS TRANSMISSION RATE THROUGH MICROPOROUS MEMBRANES ...... 41
2.1. Introduction ................................................................................................. 41
2.2. Experimental Work ..................................................................................... 44
2.2.1. Microporous membranes..................................................................... 44
2.2.2. Evaluation of gas transmission rate..................................................... 47
2.2.3. Evaluation of porosity and pore diameter ........................................... 49
2.3. Probabilistic Model ..................................................................................... 49
2.4. Results and Discussion................................................................................ 51
2.5. Conclusions ................................................................................................. 63
2.6. References ................................................................................................... 64
CHAPTER III.............................................................................................................. 67
TRANSPORT BEHAVIOR OF MIMICS of WARFARE AGENTS THROUGH
POROUS MEMBRANES........................................................................................... 67
3.1. Introduction ................................................................................................. 67
3.2. Materials...................................................................................................... 69
3.3. Experimental Work ..................................................................................... 75
3.4. Evaporation Model...................................................................................... 78
3.5. Results and Discussion................................................................................ 83
3.5.1. Experimental results............................................................................ 83
xi
3.5.2. Comparison of experimental data to modeling results........................ 86
3.6. Conclusions ................................................................................................. 90
3.7. References ................................................................................................... 91
CHAPTER IV ............................................................................................................. 93
CHEMICAL ADSORPTION BEHAVIOR OF MICROPOROUS MEMBRANES
WITH ACTIVE ELEMENTS..................................................................................... 93
4.1. Introduction ................................................................................................. 94
4.2. Adsorption Phenomena ............................................................................... 95
4.3. Membrane and Gas Properties .................................................................... 97
4.4. Modeling of Chemical and Physical Adsorption ........................................ 98
4.4.1. Energy calculations ............................................................................. 98
4.4.2. Probabilistic chemi-sorption model .................................................. 102
4.5. Experimental Setup ................................................................................... 105
4.6. Results and Discussion.............................................................................. 108
4.6.1. Calibration Measurements for Concentration ........................................... 108
4.6.2. Concentration experiments with Gas Chromatography .................... 110
4.6.3. Comparison of permeation rates by the chemi-sorption model ........ 117
4.7. Conclusions ............................................................................................... 119
4.8. References ................................................................................................. 120
CHAPTER V............................................................................................................. 122
CONCLUSIONS AND FUTURE WORK ............................................................... 122
5.1. Conclusions ............................................................................................... 122
5.2. Future Work and Improvements ............................................................... 124
xii
APPENDIX A ........................................................................................................... 126
TESTING INSTRUMENTS FOR MATERIAL PROPERTIES .............................. 126
A.1. LYSSY Air Permeability Tester ............................................................... 126
A.2. Gurley Permeability Tester ....................................................................... 127
A.3. Scanning Electron Microscope (SEM)...................................................... 128
A.4. Capillary Flow Porometer ......................................................................... 130
APPENDIX B ........................................................................................................... 131
ADDITIONAL EXPERIMENTS AND RESULTS ................................................. 131
B.1. Permeability Results with Treated PET and Nylon Membranes............... 131
B.2. Permeation Tests with Gurley................................................................... 133
B.3. Comparison of Results with Gurley and LYSSY Permeability Testers.... 134
APPENDIX C ........................................................................................................... 136
SOURCE CODES..................................................................................................... 136
C.1. Matlab Code for Permeation of Gases through Porous Membranes......... 136
C.2. Matlab Code for Permeation of Mimics through Porous Membranes ...... 139
C.3. Matlab Code for Permeation of Gases through Membranes with Active
Elements ................................................................................................................ 143
C.4. Subroutines................................................................................................ 148
C.4.1. Chemisorption ................................................................................... 148
C.4.2. Porecount........................................................................................... 149
C.4.3. Porosity.............................................................................................. 150
C.4.4. Knudsen............................................................................................. 150
C.4.5. Trajectory .......................................................................................... 151

xiii
LIST OF FIGURES Figure 1.1. Flow mechanisms (a) viscous flow, (b) Knudsen flow, (c) surface flow
(molecular sieving), (d) solution-diffusion ................................................................. 10
Figure 1.2. Knudsen number vs. flow distribution [4] ................................................ 12
Figure 1.3. Required energy levels for adsorption [redrawn from Ref. 3]................. 24
Figure 1.4. Effect of Kinetic Energy vs. Surface Potential Energy on the molecules
inside the pore ............................................................................................................. 26
Figure 2.1. SEM images of microporous membranes: (a) PET (b) B130, and (c) nylon
..................................................................................................................................... 45
Figure 2.2. Cross-section SEM images of double layer PET membranes with
incorporated microparticles......................................................................................... 46
Figure 2.3. LYSSY L100-5000, air permeability measurement chambers [7] ........... 47
Figure 2.4. CSI-135, view of the permeation cell [8] ................................................. 47
Figure 2.5. The sketch of a possible molecular trajectory .......................................... 50
Figure 2.6. Air transmission rate of microporous membranes .................................... 52
Figure 2.7. Transmission rate of ammonia through microporous membranes............ 53
Figure 2.8. Comparison of air and ammonia transmission rates through PET ........... 54
Figure 2.9. Air transmission rate through double layered PET membranes ............... 55
Figure 2.10. Interaction energy profiles for air and ammonia with PET ................... 57

xiv
Figure 2.11. Interaction energy profiles for air and ammonia molecules and PET
surface covered with a thin layer of epoxy ................................................................. 58
Figure 2.12. Comparison of experimental data and numerical models for the
permeation of air through PET membrane.................................................................. 59
Figure 2.13. Comparison of experimental data and numerical models for the
permeation of air through nylon membrane................................................................ 59
Figure 2.14. Comparison of experimental data and numerical models for the
permeation of air through B130 membrane ................................................................ 60
Figure 2.15. Comparison of experimental data for permeation of ammonia and the
probabilistic model for uncoated PET microporous membrane, with and without the
interaction energy between molecules and the surface ............................................... 62
Figure 2.16. Comparison of experimental results and model for double layered PET
.................................................................................................................................... .63
Figure 3.1. Sarin Gas................................................................................................... 71
Figure 3.2. Beta-pinene (mimic for sarin)................................................................... 71
Figure 3.3. Nitrogen Mustard...................................................................................... 72
Figure 3.4. Prenol (3-methyl 2-buten 1-ol) (mimic for mustard)................................ 72
Figure 3.5. Vapor pressure of β-pinene [7, 10] ........................................................... 74
Figure 3.6. Vapor pressure of prenol [7, 10]............................................................... 74
Figure 3.7. SEM images of microporous membranes: (a) PET (b) nylon .................. 75
Figure 3.8. Schematic of bottom chamber (left) and its image (right) with
thermocouples wires.................................................................................................... 76
Figure 3.9. Modified setup for measurement of permeation of mimics...................... 77

xv
Figure 3.10. Slug movement versus Pressure relationship......................................... 81
Figure 3.11. Pressure versus time during slug movement due to evaporation of
mimics ......................................................................................................................... 81
Figure 3.12. GTR vs. Temperature for β-pinene ........................................................ 83
Figure 3.13. GTR vs. Temperature for Prenol ............................................................ 84
Figure 3.14. Comparison of beta-pinene and prenol through PET ............................. 85
Figure 3.15. GTR versus temperature for evaporation of beta-pinene through PET
membrane .................................................................................................................... 87
Figure 3.16. GTR versus temperature for evaporation of beta-pinene through nylon
membrane .................................................................................................................... 87
Figure 3.17. GTR versus temperature for evaporation of prenol through PET
membrane .................................................................................................................... 88
Figure 3.18. GTR versus temperature for evaporation of prenol with nylon.............. 89
Figure 4.1. Chemical structure of XL-I-77 ................................................................. 97
Figure 4.2. Adsorption of NH3 on modified PET with 5-azido-3-oxapentanesulfonate
..................................................................................................................................... 98
Figure 4.3. Interaction energy between the gases and the surface covered with PGMA
..................................................................................................................................... 99
Figure 4.4. Interaction energy between ammonia and the surface with active element
(5-azido-3-oxapentanesulfonate)............................................................................... 100
Figure 4.5. Interaction energy between mustard gas and prenol and the surface with
active element (XL-I-177)......................................................................................... 100
Figure 4.6. Interaction energy for ammonia.............................................................. 101
xvi
Figure 4.7. Determination of chemisorptions field ................................................... 103
Figure 4.8. Ammonia reaction with benzoyl chloride............................................... 106
Figure 4.9. Schematic view of adsorption testing setup............................................ 107
Figure 4.11. (a)The actual mass spectrum of benzamide from calibration experiments,
(b) expected mass spectrum for benzamide .............................................................. 108
Figure 4.12. Calibration curve for benzamide concentration measurements ............ 109
Figure 4.13. Chromatography results for pure benzoyl chloride (a) and pure
benzamide (b) in methanol........................................................................................ 111
Figure 4.14. Gas Chromatography peaks for benzamide inside the reaction solution
with 10 µl BOC and 238.6 ml/min ammonia passing through untreated PET ......... 113
Figure 4.15. Gas Chromatography and mass spectrum for benzamide inside the
reaction solution with 5 µl BOC and 238.6 ml/min ammonia passing through
untreated PET............................................................................................................ 114
Figure 4.16. Gas Chromatography and mass spectrum for benzamide inside the
reaction solution with 5 µl BOC and 238.6 ml/min ammonia passing through active
PET............................................................................................................................ 115
Figure 4.17. Comparison of models for air and ammonia with and without adsorption
on PET....................................................................................................................... 118
Figure A.1. The LYSSY 100-5000 Permeability Tester and the humidity control .. 127
Figure A.2. Rotary pump (left) and heated/refrigerated circulator (right) ................ 127
Figure A.3. Model 58-03 Gurley Densometer .......................................................... 128
Figure A.4. (a) MF715, (b) W-gray, (c) Aptra Classic, (d) B130, (e) W-wide, (f) UV8
................................................................................................................................... 129

xvii
Figure B.1. Gas transmission rate of PET with and without treatment at two different
pressures .................................................................................................................... 132
Figure B.2. Gas transmission rate of nylon with and without treatment at different
temperatures .............................................................................................................. 132
Figure B.3. Gurley experiments for PET, nylon and B130 membranes ................... 133
Figure B.4. Permeance of PET for single, double and three layers .......................... 134
Figure B.5. LYSSY and Gurley comparison............................................................. 135
xviii
LIST OF TABLES
Table 2.1. Geometric properties of microporous membranes ............................... 44
Table 3.1. Molecular diameter of air components, toxic agents and their mimics73
Table 3.2. Geometric properties of microporous membranes ............................... 75
Table 4.1. Concentration differences between untreated and active PET microporous
membranes………. ............................................................................................. 116
1
CHAPTER I
LITERATURE REVIEW
1.1. Introduction
Chemical Protective Clothing (CPC) is used to isolate the skin from direct contact
with potentially harmful chemicals and minimize the risk of injury. In warfare, protective
clothing must act as a barrier to chemical and biological warfare agents and prevent the
hazardous chemicals or bacteria from reaching to the skin. The hazardous chemicals may
be in gas, liquid or solid form and the protective materials must be designed based on the
type of chemicals to which they will most likely be exposed.
The performance of CPC mainly depends on the resistance of fabric to chemical
permeation; however, there are other factors that can be very critical for specific purposes
of clothing, such as a battle dress or a hazardous material suit which may require different
protection levels. Studies show that protective clothing materials which have good barrier
performances hinder the performance of the wearer, due to heavy weight, heat stress and
limited breathability [15, 32, 37, 43]. On the other hand, increased breathability may
reduce the protection level. Therefore, it is very critical to analyze these requirements,
which appear to be mutually-exclusive, to determine the most appropriate materials and
design for chemical protective clothing. To understand how an individual can be
protected from the harmful effects of the chemicals, it is necessary to understand the

2
macroscopic and microscopic structure of the attack mechanisms as well as the barrier
materials.
Comfort is directly related to stiffness, heaviness, and air, heat and moisture transfer
properties of the fabric. Barrier and comfort parameters must be understood at the fiber,
yarn, fabric as well as at the garment level [47]. For instance at the fabric level,
important parameters for consideration, beside barrier effectiveness, include comfort
limit, resistance to abrasion and contamination of the material [5, 56, 9]. Barrier
effectiveness of a textile material is closely related to the fabric structure, its porosity,
pore size and thickness [35]. There is a diverse range of technical issues involved in
developing comfortable barriers. Barker et al. [5] defined the comfort limit as “the range
of body activity levels within which an individual wearing a clothing system is predicted
to be thermophysiologically comfortable”.
An ideal protective clothing material should not allow passage of harmful gases or
vapors, while allowing moisture vapor to move out at any pressure. Shortly, an ideal
protective material should have high moisture vapor permeability and low gas
permeability [46].
1.1.1. Purpose and objectives
The main question in the study of protective textiles against hazardous chemicals is
how to manufacture materials which have effective barrier properties as well as a
sufficient comfort level. Therefore, the primary objective of this study is to provide a
better understanding of the barrier and comfort relationship in protective materials. To do
that, a multi-layer structure consisting of fabric and microporous membrane layers is
proposed for consideration and air and gas transmission through these materials is studied
3
experimentally. Since the barrier ability of the fabric is negligibly small compared to that
of the membrane layers, the gas transmission studies are focused on the microporous
membranes. Therefore, the objectives of this study can be listed as follows:
• To study gas transmission as well as transmission of mimics of hazardous
chemical gases through microporous membranes experimentally
• To study microporous membranes with active elements for chemical blockage
of the gases and its effect on transmission rates experimentally
• To construct a model which can evaluate the transport phenomenon through
both virgin and activated membranes at single and multiple layers for gases
and mimics
• To compare experimental findings with the model and finally,
• To provide a guide for developing rules and standards for the design of
breathable and effective chemical protective clothing materials.
1.2. Membranes as Barrier Materials
Chemicals may affect a protective material in three different processes; degradation,
penetration and permeation. Degredation is the change or deterioration in the material
properties caused by surface contact by the chemical. Penetration is usually considered
the flow of a liquid or gas on a non-molecular level through the seams, holes or larger
pores, while permeation is the flow of fluids through the material on a molecular level.
Permeation can occur in the form of adsorption, diffusion or desorption [54].
Polymeric membranes and films are commonly used for protection against liquid and
gas penetration. Those membranes are laminated or bonded to other textiles –typically

4
non-wovens- to provide strength and durability. Membranes or films can be porous
(permeable) or monolithic (impermeable). A porous film permits movement of vapor via
microscopic channels across the material. In a monolithic film, on the other hand, vapor
transmission occurs mainly by molecular diffusion.
A more detailed categorization of barrier materials can be listed as follows [46, 47]:
1. Permeable: most fabrics and materials containing activated carbon-layers to adsorb
toxic vapors.
2. Semi-permeable: membrane structures with low air permeability and high water-
vapor permeability.
3. Selectively-permeable: structures that allow permeation of smaller molecules and
water-vapor, while preventing the passage of larger organic molecules.
4. Impermeable: Hazardous Material response suits which are completely impermeable
such as those made of Tyvek-reinforced polypropylene film laminates or aluminized
Kevlar fabrics.
Membranes can also be categorized based on different criteria in different studies.
The most common way is to group them depending on the structure of the pores.
Membranes with a pore size less than 0.7 nm are considered as fully dense membranes.
Membranes with pore sizes greater than 50 nm are considered macroporous membranes
[41]. In some studies membranes with pores between 200 and 3000 nm are considered
microporous membranes [13]. Although most studies have their own categorization of
micro and macroporous membranes, International Union of Pure and Applied Chemistry
divides these membranes into two further categories and defines membranes with pore

5
sizes between 2 nm and 50 nm as mesoporous and with pore sizes not exceeding 2 nm as
microporous [7, 52].
Although most membranes used in this study can be considered macroporous based
on this categorization, they were mentioned as microporous membranes throughout this
dissertation as they were understood in many of the studies as well as by the
manufacturer. Since they are usually layered with fabrics which have very large openings
in comparison, we believe it is appropriate to consider fabric openings as macro pores,
while membrane pores are comparatively considered micro.
1.3. Definitions of Important Parameters in Transport Through Porous Media
Many researchers have studied aspects of air or gas permeation through protective
materials, however the permeation through micro pores in the case of a multi-layer
assembly has not been sufficiently understood.
There are many factors which affect the transport of gas or vapor through porous
materials. In impermeable membranes, the type of polymer and membrane thickness are
the most important factors in determining the transmission rates, while for microporous
membranes, gas and vapor transmission is closely related to porosity, the overall
thickness and the mean pore diameter [36]. Similarly, in textile fabrics, the role of
porosity and pore geometry is significant in determining the transport behavior [35].
Porosity is defined as “the ratio of the volume of air or void contained within the
boundaries of the material to the total volume (solid material plus air or void) expressed
as a percentage [1]”. It has also been defined as the ratio of the geometrical area of the
opening on the surface to the total area of the material [24]. In fabrics, porosity can be
calculated using an optical image analysis system, which transmits light through the
6
fabric and calculates the open area of the pores [35]. In this case, it is possible to talk
about an optical porosity. Shelekhin et al. [48] considered the abovementioned definitions
of porosity as total porosity and introduced the term throughout porosity for membranes
which contain inlet and outlet boundaries, i.e. isolated and dead-end pores, throughout
their thickness.
When the length of the diffusion path is higher than the length of a straight capillary,
a tortuosity factor is considered. Tortuosity (τ) is an empirical coefficient which is
expected to be as 1<τ<∞ for uniform pore distributions and can be less than 1 when
different pore structures are present [44]. Tortuosity is not only affected by the length of
the passages but also by the amount of throughout porosity.
Gas transmission rate (GTR) is defined as “the quantity of a given gas passing
through a unit area of a surface in unit time under the conditions of the test” and
expressed in mol/(m2.s) [2]. Test conditions that influence the transport of the gas
includes temperature, partial pressure of the gas on both sides, relative humidity, etc.
Permeance is another term used in the study of gas transport through porous materials
and is the ratio of gas transmission rate to the pressure difference on two sides of a film
or membrane. Permeance is expressed as mol/(m2.s.Pa). Permeability is the product of
the permeance and the thickness and its unit is mol/(m.s.Pa). Permeability may not be a
meaningful parameter for materials which are not homogenous throughout the bulk of the
material, in terms of thickness and other properties [2]. Therefore, GTR is used
throughout this study to describe transport behavior of gases through porous media for
the stated pressure and temperature values.
7
1.4. Types of Transport Through Membranes
Molecular transport of fluid through polymeric membranes occurs by random
molecular motion. Beside the free volume, pore size and pore size distribution, there are
many other factors affecting the transport process in membranes such as the nature of the
polymer. Segmental mobility or molecular weight of the polymer contributes to the
transport process. Nature of the penetrating gas or liquid such as the size or shape of the
molecules is also an important factor. Fillers, nature of crosslinks, effect of plasticizers,
temperature and concentration are other factors affecting the transport of molecules
through different types of membranes [13].
There are three membrane-based transport processes:
a) liquid-vapor separation by pervaporation,
b) vapor permeation and
c) gas permeation.
a) Liquid-Vapor Separation (Pervaporation)
Pervaporation process is explained by two models:
- The solution-diffusion model and
- The pore flow model
The first approach involves three steps: sorption, diffusion and permeation; and they
are concentration dependent processes. Second approach assumes that there are
cylindrical pores on the surface of the membrane and the permeation occurs in three steps
where the liquid permeates through pores into a liquid-vapor phase boundary, evaporates
8
at that point and permeates as vapor through the pore outlet [17]. Although the solution-
diffusion model is widely accepted, studies showed that this model can not be used to
describe the transport behavior of all polymeric membranes [11]. These models are more
suitable for non-porous or fully dense membranes.
Depending on the type of fluid and the membrane material, the transport process is
driven by concentration or pressure differences. For instance, if there is no pressure
difference across the sample, transport is driven by concentration differences. In dense
membranes, this occurs in the form of pure diffusion. If there is a pressure difference, it
occurs in the form of convection through the pores [21].
b) Water-Vapor Transport
Water vapor transport through porous textiles/polymer/membrane laminates is
explained in two categories; concentration-dependent permeability or temperature
dependent permeability. According to temperature-dependent permeability, water vapor
transport increases at high temperatures and decreases at low temperatures.
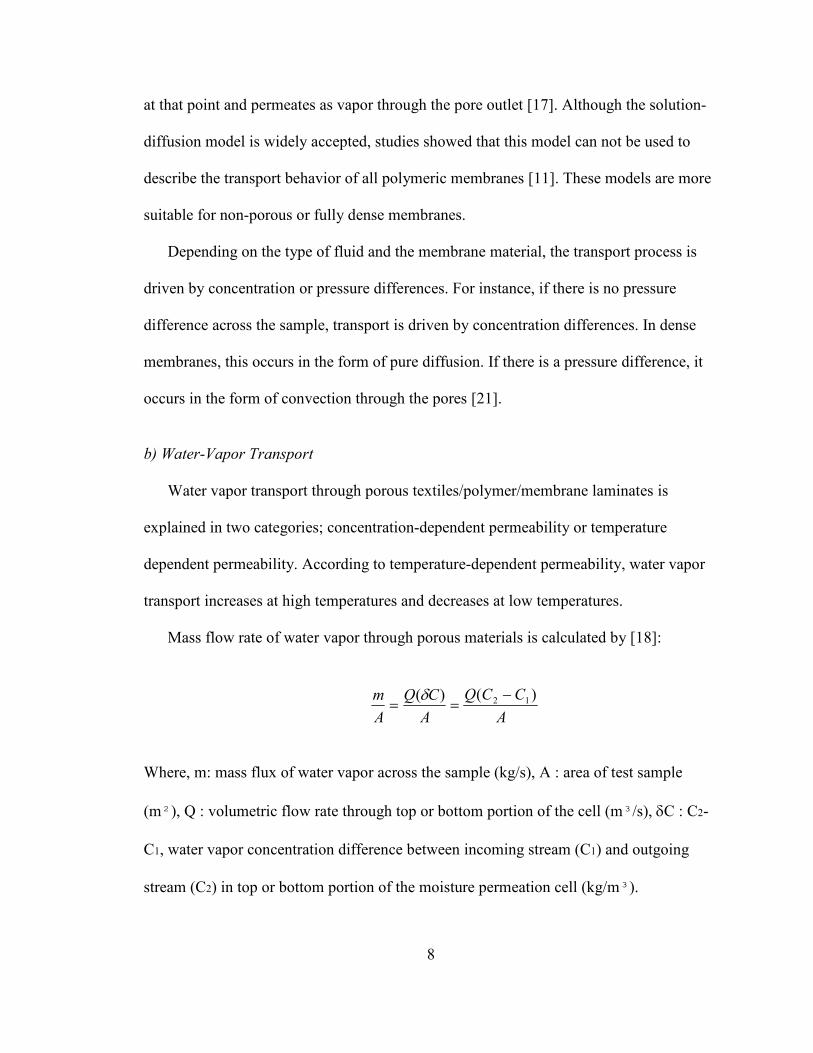
Mass flow rate of water vapor through porous materials is calculated by [18]:
A
CCQ
A
CQ
A
m )()( 12 −==
δ
Where, m: mass flux of water vapor across the sample (kg/s), A : area of test sample
(m²), Q : volumetric flow rate through top or bottom portion of the cell (m³/s), δC : C2-
C1, water vapor concentration difference between incoming stream (C1) and outgoing
stream (C2) in top or bottom portion of the moisture permeation cell (kg/m³).

9
c) Gas Permeation
In general terms, transport through membranes occurs either in the form of a viscous
type flow (convective/non-diffusive) or diffusion. Convective flow occurs in porous
membranes, while diffusion occurs in dense or non-porous membranes.
In the case of diffusion, the flow can be studied as a solution-diffusion flow [28],
where sorption of the gas takes place. When the diffusion is described in terms of a
solution-diffusion process, Fick’s Law of Diffusion z
cDJ
∂∂
−= is used. For semi-
crystalline polymers, sorption occurs in the impermeable section of the polymer while
diffusion occurs in the porous regions [13]. The sorption behavior can be described using
Henry’s law with a Henry-type isotherm or with a Langmuir-type isotherm based on the
membrane type and the absorption mechanisms.
Kamada et al. [28] divide the non-diffusive flow into two groups for membranes used
in gas separation, depending on the membrane characteristics; i) Knudsen flow, ii)
surface flow. In gas separation technology, selectivity of the membrane for different
gases is an important characteristic. The flow is considered a Knudsen flow where gas
permeability is very high, but selectivity is very low, or a surface flow where there is high
permeability and high selectivity.
Convective (non-diffusive) flow can generally be studied in three different categories
[17]:
- Viscous (Poiseuille) flow,
- Knudsen flow and
- Surface flow.

10
In fibrous materials such as fabrics, the diffusive transport through the fibers was
found to be too small compared to convective flow through the voids between the fibers
so that only convective flow was taken into account when modeling permeation [21, 60].
Similarly, in most porous membranes, convective transfer (flow through the pores) of
mass or heat is more important than transport due to solution-diffusion (sorption), since
the value of the latter is much lower as compared to flow through the pores [21].
Mechanisms of flow of gas molecules through pores and dense membranes are shown
in Figure 1 for the main four types of flow.
Figure 1.1. Flow mechanisms (a) viscous flow, (b) Knudsen flow, (c) surface flow
(molecular sieving), (d) solution-diffusion
1.5. Principles of Gas Transport through Membranes
The mean free path of the gas plays an important role in the nature of the transport
process through microporous membranes.
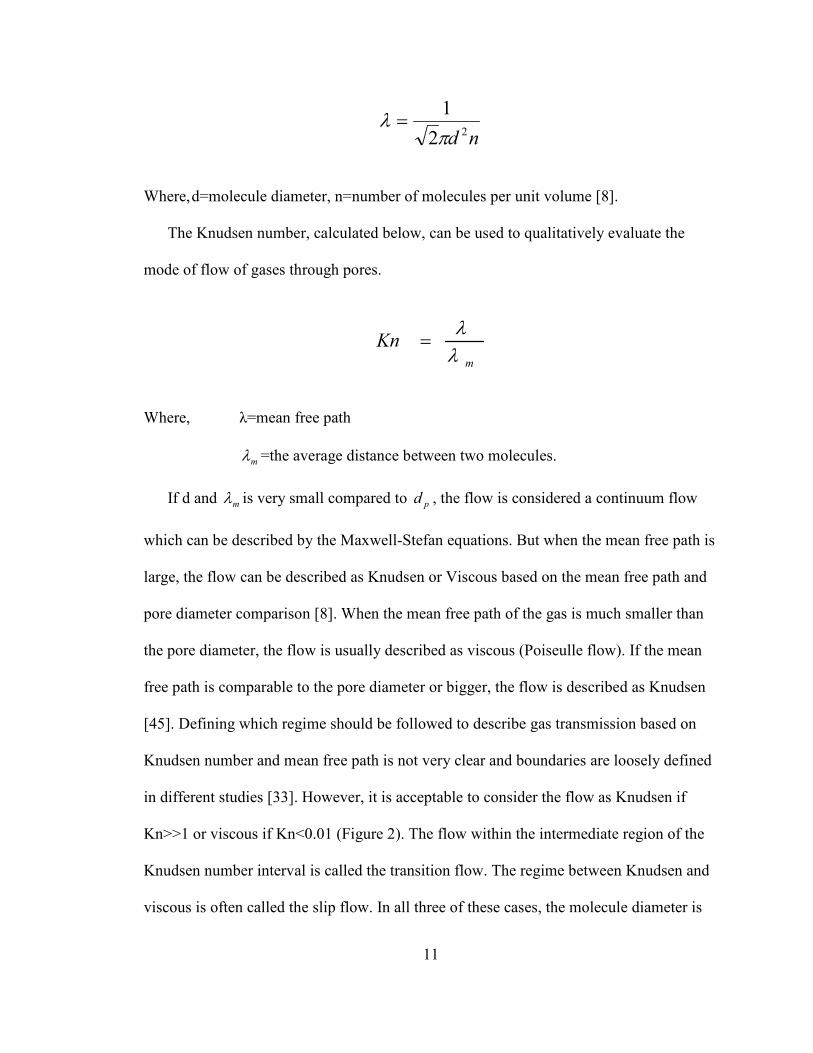
Mean free path λ is defined as the average distance a molecule travels between two
collisions and calculated as:
11
nd 221π
λ =
Where, d=molecule diameter, n=number of molecules per unit volume [8].
The Knudsen number, calculated below, can be used to qualitatively evaluate the
mode of flow of gases through pores.
m
Knλλ
=
Where, λ=mean free path
mλ =the average distance between two molecules.
If d and mλ is very small compared to pd , the flow is considered a continuum flow
which can be described by the Maxwell-Stefan equations. But when the mean free path is
large, the flow can be described as Knudsen or Viscous based on the mean free path and
pore diameter comparison [8]. When the mean free path of the gas is much smaller than
the pore diameter, the flow is usually described as viscous (Poiseulle flow). If the mean
free path is comparable to the pore diameter or bigger, the flow is described as Knudsen
[45]. Defining which regime should be followed to describe gas transmission based on
Knudsen number and mean free path is not very clear and boundaries are loosely defined
in different studies [33]. However, it is acceptable to consider the flow as Knudsen if
Kn>>1 or viscous if Kn<0.01 (Figure 2). The flow within the intermediate region of the
Knudsen number interval is called the transition flow. The regime between Knudsen and
viscous is often called the slip flow. In all three of these cases, the molecule diameter is

12
considered to be very small compared to the pore diameter. As pore diameter gets smaller
and comparable in size to the molecule diameter, it becomes a configurational diffusion
(surface flow). Although most of the gas flow in porous media lay in the transition
region, there is a lack of analytical or numerical models to describe the transmission rate
within this region.
Kn 10 0.1 0.01 0
Figure 1.2. Knudsen number vs. flow distribution [4]
Although the true nature of flow cannot be defined by a mere evaluation of mean free
path and Knudsen number, this information can be useful in understanding the general
flow mechanism and enable a better estimation of the flow characteristics. A summary of
the evaluation of types of fluxes based on various parameters such as the ratio of the
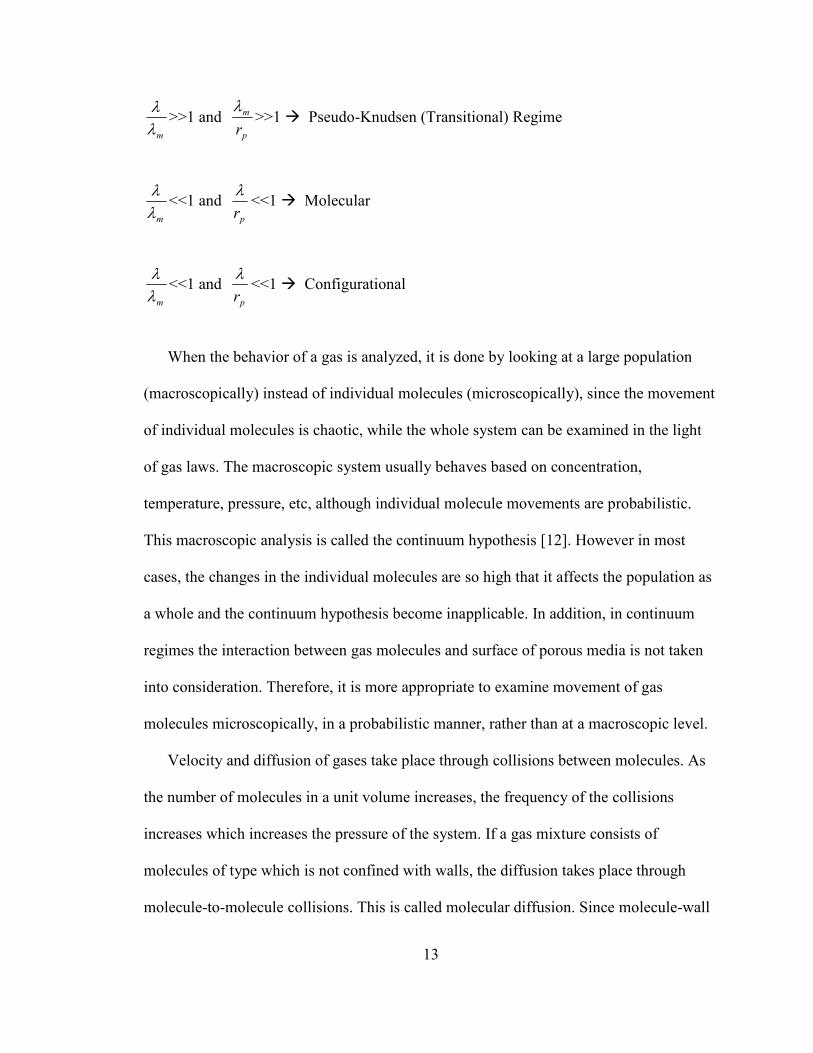
molecular size to the pore diameter or Knudsen number is shown below [12]:
mλλ
<<1 and pr
λ<<1 � Viscous Regime
mλλ
>>1 and pr
λ<<1 � Knudsen Regime
mλλ
~1 and pr
λ<<1 � Slip Regime
Transition Free-molecular Continuum Slip
13
mλλ
>>1 and p
m
r
λ>>1 � Pseudo-Knudsen (Transitional) Regime
mλλ
<<1 and pr
λ<<1 � Molecular
mλλ
<<1 and pr
λ<<1 � Configurational
When the behavior of a gas is analyzed, it is done by looking at a large population
(macroscopically) instead of individual molecules (microscopically), since the movement
of individual molecules is chaotic, while the whole system can be examined in the light
of gas laws. The macroscopic system usually behaves based on concentration,
temperature, pressure, etc, although individual molecule movements are probabilistic.
This macroscopic analysis is called the continuum hypothesis [12]. However in most
cases, the changes in the individual molecules are so high that it affects the population as
a whole and the continuum hypothesis become inapplicable. In addition, in continuum
regimes the interaction between gas molecules and surface of porous media is not taken
into consideration. Therefore, it is more appropriate to examine movement of gas
molecules microscopically, in a probabilistic manner, rather than at a macroscopic level.
Velocity and diffusion of gases take place through collisions between molecules. As
the number of molecules in a unit volume increases, the frequency of the collisions
increases which increases the pressure of the system. If a gas mixture consists of
molecules of type which is not confined with walls, the diffusion takes place through
molecule-to-molecule collisions. This is called molecular diffusion. Since molecule-wall
14
collisions do not exist in this case, momentum is transferred from one molecule to the
other and the total momentum is conserved for the whole system [12].
1.5.1. Molecule-wall collisions
Gas transport in porous media occurs usually in systems that are confined with walls,
which introduces molecule-wall collisions. These systems are more complex since the
movement of the molecule depends on several factors such as the roughness of the
surface and the interaction of the surface with the molecule, etc. Three different situations
may occur:
• Elastic Collisions: If the wall has a smooth surface and the collision is elastic,
the momentum is conserved similar to a system without walls, with the
exception of a reverse velocity component in this case. In elastic collisions,
the angle of the molecule hitting the wall is the same as the angle of the
reflection from the wall. Although one component of velocity is reversed in
direction, the molecule still moves in the direction of the whole system, with
the same magnitude of velocity.
• Diffusive Collisions: If the wall has a rough surface, the system will loose
momentum after collisions and the movement of individual molecules will be
chaotic. Neither the reflection angle nor the magnitude of the velocity will
remain the same.
• Adsorption by the Wall: In this case, the reflection of the molecule from the
wall depends on the attractive force of the wall. This collision often causes
surface diffusion, since the molecule is forced to migrate over the surface.
15
Due to the chaotic nature of their reflection, molecules that collide on adsorptive
surfaces are not distinguishable from the ones that collide on rough surfaces at a
macroscopic scale. Therefore, it is possible to categorize collisions only in two
categories; as either elastic or non-elastic. Since every molecule has some degree of
interaction with the surfaces, most collisions with surfaces are usually non-elastic at some
degree. In the absence of adsorption conditions, some studies have assumed all collisions
to be elastic for simplicity.
1.5.2. Molecular collisions and viscous vs. Knudsen flow
When all the molecules that collide with the wall rebound and collide with other
molecules, this flow is described as a viscous flow. Viscous flow may have a viscous, or
turbulent regime, depending on how much of the momentum change can be transferred to
the entire fluid. Although molecules have a chaotic nature in their collisions, in viscous
flow the bulk of the fluid has a direction and an overall velocity [12]. Flow through
highly porous media is often viscous.
In Knudsen flow, the number of molecule-wall collisions is much higher than that in
viscous flow that the molecule-molecule collisions become negligible. Therefore, the
flow does not have an overall direction. The pressure only affects the concentration of the
species; therefore Knudsen flux is directly proportional to the pressure of the system.
When there are more than one species in the fluid, they may not always diffuse as a
complete mixture. When the mixture does not have an integration of the species
throughout the process, the flow is called a segregative flow. In Knudsen flow with more
than one species, each species will have their own flux, independent of each other,
16
whereas in molecular diffusion, different species are interdependent in their behavior. In
viscous flow, the flux is not segregative for different species.
Since, Knudsen flow is based on molecule-wall collisions, after the molecule hits and
rebounds from the wall surface, it can be assumed that the molecule will not collide with
other molecules, therefore has no resistance to diffusion. In this regime, the velocity of
the molecule is not zero at the surface and can be assumed to be equal at any distance
from the wall compared to a viscous flow. In other words, it is independent of the
distance from the wall. However in viscous flow the velocity can be assumed as zero at
the surface. It gradually reaches a steady state as it gets away from the wall.
For viscous flow, when the pressure is uniform, the total momentum loss as well as
the flux is zero. For Knudsen flow, since the only collision is between the molecule and
the wall, velocity distribution is the same for the whole system, regardless of distance
from the wall. For viscous flow, velocity distribution is different from the bulk of the
fluid near the wall [12]. To summarize, Knudsen flow depends on the mean distance
between molecule-wall collisions (mean free path). Viscous flow depends on the mean
hydraulic radius, which is the ratio of the cross-sectional area of the flow to the affected
perimeter of the pore [45].
1.5.3. Diffusion in Knudsen regime
Gas flow changes depending on several parameters, such as temperature, pressure and
concentration. For an ideal gas in laminar flow in a circular tube, with the assumption
that all collisions are diffusive and not elastic, i.e. in a Knudsen diffusion, the mass rate
of flow can be calculated using the Haagen-Posieulle equation as follows [8]:

17
−=
L
ppa
T
m L03 )34
(2
ππκ
ω
Where, m=molecular mass, κ=Boltzmann constant, a=tube radius and L=tube length.
The molar flux can be calculated as:
dz
dc
M
RTa
dz
dp
RTM
aN A
A
A
A
A ππ 238
21
38
−=−=
This equation can be re-written as follows:
dz
dcDN A
AKA −=
Where, AKD =Knudsen Diffusivity.
However, to obtain the molar flux based on the total cross section of the porous
medium, we have to include the porosity and tortuosity of the material. In that case, the
molar flux becomes:
dz
dcDN Aeff
AKA −=
Where, AK
eff
AK DD )/( τε= , ε=porosity and τ=tortuosity.
Additionally, using Fick’s second law, the total volume of a gas that permeates
through a porous medium Q in time t can be calculated as follows:

18
dtt
CDAQ
t
hxt ∫
∂∂
−= =0
Where, h=membrane thickness and A=surface area.
1.5.4. Knudsen – Poiseulle transition model
In most microporous membranes, a pure Knudsen or a pure viscous flow is hard to
achieve. As mentioned before, if the diameter of the pores is too large for a pure Knudsen
diffusion, compared to the molecule diameter, the flow is considered in a transition
regime between Knudsen and viscous [45]. Depending on the size of the pores which the
individual molecules enter into; both a Knudsen-style and a viscous-style behavior may
exist in the same material. For instance, at a certain temperature and pressure, the flow of
nitrogen with a mean free path of 0.13µm through pores of 0.1-0.5 µm, is not purely
Knudsen or purely viscous, but in a transition regime. Schofield et al. [45] calculated the
flux in the Knudsen region for an isotropic, microporous membrane as:
δδπχε P
KP
RT
M
M
RTrJ KK
∆≡
∆
=
2/18
32
Where, δ = membrane thickness, r = pore radius, χ = tortuosity, K=permeability of the
material, _8u
M
RT=
π=mean molecular speed.
Viscous flow is calculated as follows:
δδηχε P
KP
RT
MPrJ PP
∆≡
∆=
181 2

19
Where, η=gas viscosity.
In this equation, mean molecular velocity (ū) is calculated by utilizing the Maxwell
speed distribution and molecular mass. For a gas at equilibrium, the molecular velocities
are random in nature and have an average magnitude which is calculated as [8]:
M
RTu
π8_
=
Most available models to describe the transition regime flux are in general non-
practical due to their complexity and the required detailed knowledge of membrane
morphology. Schofield et al. [45] developed a model which can can be used to correlate
the flux to the membrane parameters with a semi-empirical relationship. In this model,
membrane permeability is described with the equation:
baK
ψδ
=
Where, a=membrane constant, b=Knudsen/Poiseulle constant (b=0 for Knudsen, b=1 for
Poiseulle) and ψ=dimensionless pressure (refP
P).
This gives the flux as:
PaJ b ∆= ψ
The effect of pressure in the flux changes based on the value of constant b. As b goes
to 0, the flux in transition regime gets closer to a Knudsen-type behavior. The Poiseuille

20
flux can be re-written as follows, with the incorporation of mean free path which replaces
the viscosity of the gas in the equation:
δπχε
λπ P
RT
M
M
RTrrJ P
∆
=
2/18
32
If the Knudsen and Poiseuille equations are linearly added together, the following
equation is obtained:
K=M ū (A+B/λ)
Where, A=2rε/3χRT, B=πr2ε/32χRT, and ū=(8RT/πM)1/2. A and B are membrane
constants for a given temperature. When this equation is refined, the initial equation
baK
ψδ
= can be derived.
Where α is a property of the membrane and is equal to δK
at a reference pressure Pref, the
term b is a measure of the operating regime and shows the contribution of Poiseuille flow
in the transition. Both terms (a and b) are independent of each other unlike most other
models where the constants have a dependency on each other.
1.6. Flow rate of gases through larger openings and tubes
Isothermal flow of gases and liquids is derived from the equation of motion below by
making certain assumptions and simplifications.
].[v gpDt
Dρτρ +∇−−∇=
When equation of motion is simplified for constant ρ (density) and µ (viscosity), the
Navier-Stokes equation can be obtained as follows:

21
vv or vv 22 ∇+−∇=+∇+−∇= µρρµρ PDt
Dgp
Dt
D
Where, Dt
Dis the substantial time derivative, P is the modified pressure (P=p+ρgh) and v
is the velocity. The modified pressure is defined where h is the elevation in the
gravitational field and gh is the gravitational potential energy per unit mass. Creeping or
Stokes flow equation can be obtained by neglecting the acceleration terms in the Navier-
Stokes equation, i.e. by assuming Dt
Dρ =0. When the viscosity of the fluids are relatively
low, the fluids can be assumed to be inviscid fluids and viscous forces can also be
neglected, which results in the Euler equation. When the flow is assumed to be a steady
flow, then the Bernoulli equation can be derived from the Euler equation for steady and
irrotational flows as follows [8, 16]:
constant)(21 22 =++ Pyx ννρ
At low velocities, this equation can simply be written as:
P∆=2
21
ρν
Where, ∆P=the difference between the total pressure and the static pressure.
If the pressure is known, this equation can be used to calculate volumetric flow rate
(w) as w=ρvS, where S=cross-sectional area. When the flow passes through an orifice or
different cross-sectional areas, the cross-section will play an important role in the
velocity profiles and therefore affect the rate of flow. In this case, the velocity change
should be calculated which will be proportional to the ratio of the cross-sectional area [8].

22
1.7. Chemical and Physical Adsorption of Gases
Adsorption is usually defined as the attachment of gases or liquids onto a solid
surface. Unlike absorption, adsorption occurs on the surface and does not cause the gases
or liquids to dissolve in another liquid or solid. A solid that has an interaction with the
gas molecules is called the adsorbent. The gas or vapor molecule is called the adsorptive
prior to attaching to the surface and adsorbate upon adsorption onto the surface [16]. The
interaction of gas molecules with a solid is a complex phenomenon due to the nature of
the molecules and their variability in size, structure and electrical properties [29].
Adsorption levels of molecules onto a solid surface depend strictly on their energy
loss close to that surface. When there is no energy loss, the molecules are considered to
have an elastic collision with the surface without any bonding. If there is small energy
loss, the collision is considered inelastic. When sufficient energy loss occurs, adsorption
takes place. Depending on the amount of energy loss required, adsorption may occur in
two different ways:
a) Physical adsorption: In this process, a weak, physical interaction occurs between
the gas and the solid and the electronic structure of the molecule is not affected by the
adsorption process. The molecules are bound to the surface with van der Waals forces
which require lower adsorption energies, i.e. less energy loss and can be easily reversible.
It can also occur on multiple layers.
b) Chemical adsorption: This process is usually a result of strong covalent or ionic
bonds which are not easily reversible. They require higher adsorption energies and
usually only happen on adsorptive sites and as a monolayer [3, 57, 34]. Chemisorption
can also be associative or dissociative. If adsorption requires dissociation of a molecule
23
into its atoms before adsorption, it is called a dissociative adsorption. If the adsorbate is a
single-atom molecule or dissociation is not required for adsorption, it is an associative
adsorption [3].
As mentioned above, the adsorption process is a result of energy loss of the
molecule close to the surface. This energy loss occurs based on the kinetic energy of the
molecule as well as the attraction between the molecule and the surface which is related
to the surface potential energy. If the attraction between the molecule and the surface is
high, the molecule is more likely to experience energy loss, i.e. lose its kinetic energy and
become adsorbed by the surface.
The two important energy parameters are defined as translational kinetic energy
of the molecule (Ek) and the potential/interaction/attraction energy of the surface versus
gas (Ep or Ea). Energy loss of the molecules is related to the distance of the molecule
from the solid [40]. For instance, at a distance where kinetic energy of the molecule is
lower than the interaction energy on the surface, an adsorption is expected to take place.
If the distance between the molecule and the surface is close enough this will be in the
form of a chemical adsorption since chemical adsorption usually requires a higher energy
loss, i.e. a closer distance from the wall. Physical adsorption can occur at further
distances from the wall with less energy loss [3, 57]. When there is strong attraction
between the gas and the solid, chemical adsorption has priority over physical adsorption
[34].

24
Figure 1.3. Required energy levels for adsorption [redrawn from Ref. 3]
A schematic view of physisorption, chemisorption and the required attraction
energies relative to distance from the surface is shown in Figure 3.
The rate of adsorption depends on several parameters such as pressure, temperature,
surface area, surface energy distribution and porosity of the solid material. The
relationship between the number of molecules that are taken up by the surface and the
pressure at constant temperature is referred to as the adsorption isotherm [57]. In the
evaluation of adsorption behavior of a system reaching equilibrium, Langmuir adsorption
isotherm is used most commonly with several assumptions and approximations. For
chemisorption, Langmuir isotherm equation assumes that:
a) There are only a fixed number of sites available for adsorption each of which can
only be occupied by one molecule,
b) At constant temperature, there is a dynamic equilibrium between the adsorbed
layer and the gas at pressure P
25
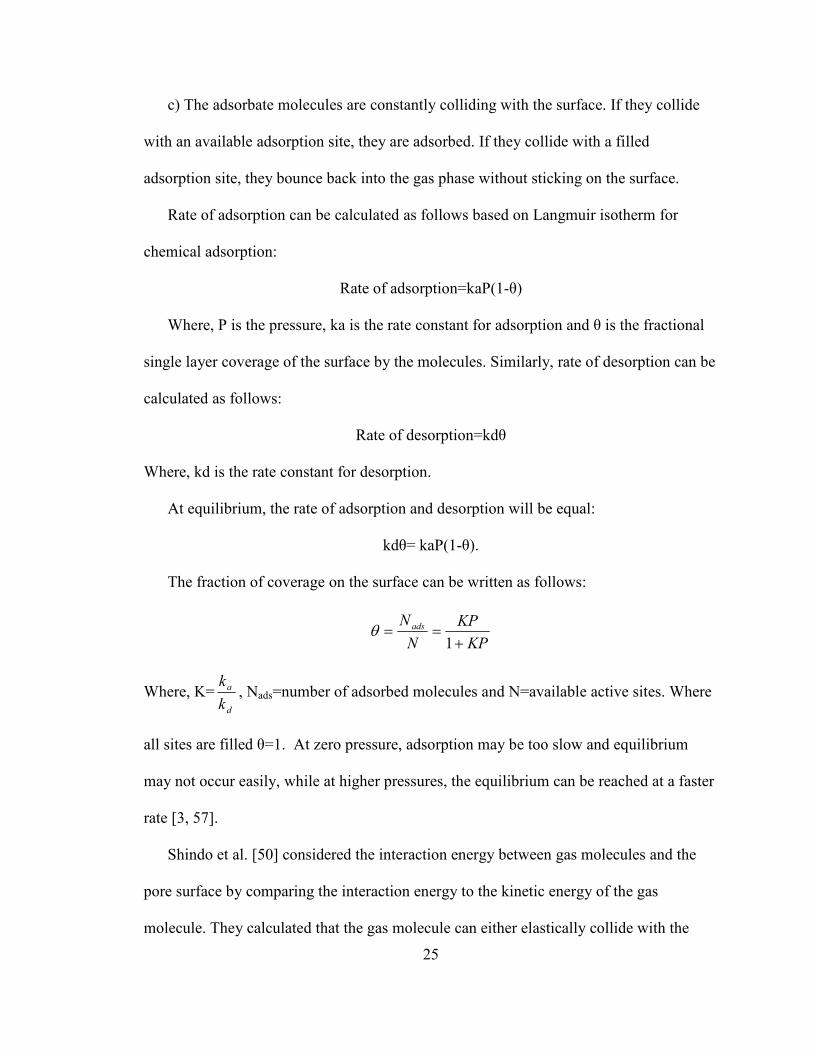
c) The adsorbate molecules are constantly colliding with the surface. If they collide
with an available adsorption site, they are adsorbed. If they collide with a filled
adsorption site, they bounce back into the gas phase without sticking on the surface.
Rate of adsorption can be calculated as follows based on Langmuir isotherm for
chemical adsorption:
Rate of adsorption=kaP(1-θ)
Where, P is the pressure, ka is the rate constant for adsorption and θ is the fractional
single layer coverage of the surface by the molecules. Similarly, rate of desorption can be
calculated as follows:
Rate of desorption=kdθ
Where, kd is the rate constant for desorption.
At equilibrium, the rate of adsorption and desorption will be equal:
kdθ= kaP(1-θ).
The fraction of coverage on the surface can be written as follows:
KP
KP
N
N ads
+==
1θ
Where, K=d
a
k
k, Nads=number of adsorbed molecules and N=available active sites. Where
all sites are filled θ=1. At zero pressure, adsorption may be too slow and equilibrium
may not occur easily, while at higher pressures, the equilibrium can be reached at a faster
rate [3, 57].
Shindo et al. [50] considered the interaction energy between gas molecules and the
pore surface by comparing the interaction energy to the kinetic energy of the gas
molecule. They calculated that the gas molecule can either elastically collide with the

26
pore surface or be trapped in the potential field and hop on the surface. If the kinetic
energy (Ek) of the molecule is greater than the interaction energy or potential energy of
the pore surface (Es), the molecule will be able to escape from the surface potential field
and rebound elastically without losing energy (Figure 4). In this case, the molecule will
be able to proceed inside the pore in the gas phase. Alternatively, if the interaction energy
between the surface and the gas molecule is greater than the kinetic energy of the
molecule, then the molecule will be trapped in the potential energy field and physisorbed
on the surface, in which case the movement of the molecule will be in the form of surface
flow along the pore wall. This means that the molecule will lose some of its kinetic
energy (i.e., velocity) resulting in a decrease in the gas transmission rate.
Figure 1.4. Effect of Kinetic Energy vs. Surface Potential Energy on the molecules inside
the pore
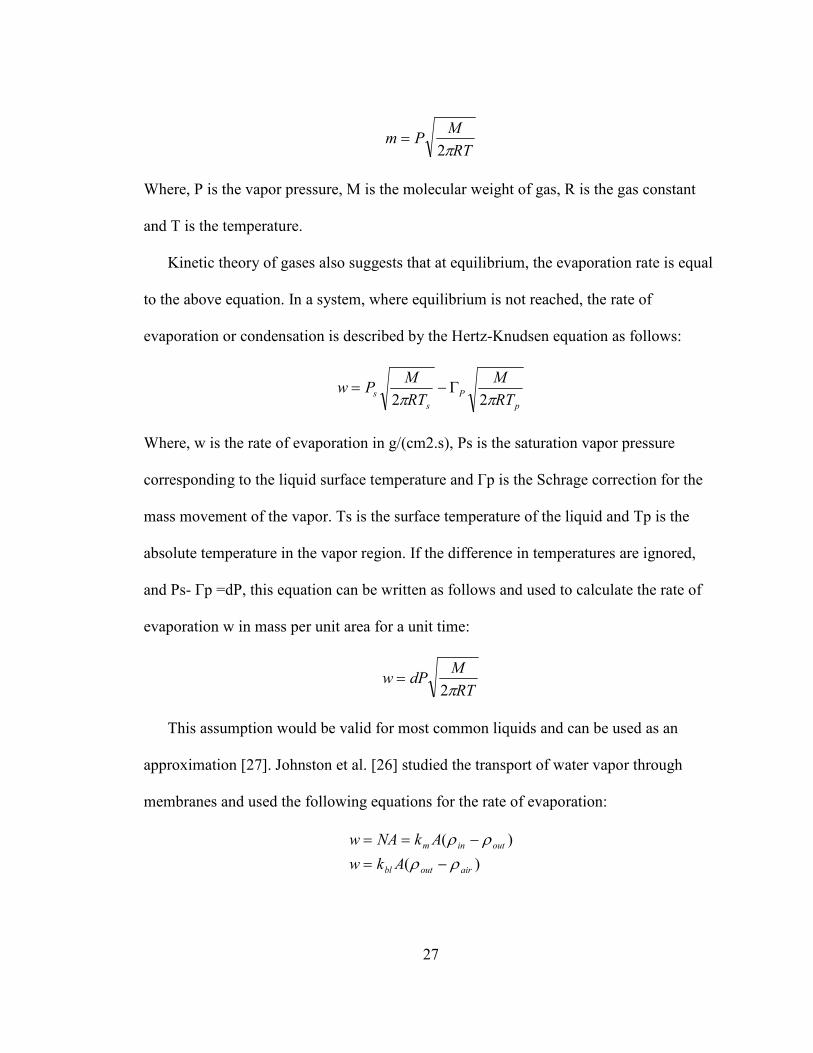
1.8. Evaporation of Liquids
The evaporation rate of liquids at different temperatures can be calculated based on
the pressure of the vapor at that temperature. If water is taken into consideration in a
closed system, the rate the vapor which comes in contact with a metal is expressed as the
following by Langmuir’s equation of mass flux (m) [27]:
27
RT
MPm
π2=
Where, P is the vapor pressure, M is the molecular weight of gas, R is the gas constant
and T is the temperature.
Kinetic theory of gases also suggests that at equilibrium, the evaporation rate is equal
to the above equation. In a system, where equilibrium is not reached, the rate of
evaporation or condensation is described by the Hertz-Knudsen equation as follows:
p
P
s
sRT
M
RT
MPw
ππ 22Γ−=
Where, w is the rate of evaporation in g/(cm2.s), Ps is the saturation vapor pressure
corresponding to the liquid surface temperature and Гp is the Schrage correction for the
mass movement of the vapor. Ts is the surface temperature of the liquid and Tp is the
absolute temperature in the vapor region. If the difference in temperatures are ignored,
and Ps- Гp =dP, this equation can be written as follows and used to calculate the rate of
evaporation w in mass per unit area for a unit time:
RT
MdPw
π2=
This assumption would be valid for most common liquids and can be used as an
approximation [27]. Johnston et al. [26] studied the transport of water vapor through
membranes and used the following equations for the rate of evaporation:
)(
)(
airoutbl
outinm
Akw
AkNAw
ρρ
ρρ
−=
−==
28
Where, N is the water flux, A is the membrane surface area, km the membrane mass
transfer coefficient, ρin the density of water vapor in equilibrium as a function of water
temperature, ρout the density of water vapor at the surface of the membrane, kbl the air
boundary layer mass transfer coefficient and ρair the density of water vapor in the bulk
air which flows through the membrane.
1.9. Microscale Models for Permeation of Gases through Protective Materials
Gas flow and heat or mass transfer of protective clothing materials can be studied at
three different scales. At a macroscale, protective clothing performance can be studied for
the whole human body. At a mesoscale, a single limb which is covered by clothing can be
evaluated and at a microscale the flow through individual fibers of the clothing material
can be studied [6]. Microscale studies are important in understanding the transport
behavior of different materials as well as the transmitted fluids and the effect of external
conditions on transport. Although, these studies can be done experimentally or by
modeling, modeling makes it easier to evaluate the transport behavior of different gases
and surfaces and provide the basis for the selection and design of materials to be used in
protective clothing.
1.9.1. Mathematical models for fibrous materials
Many studies have been conducted to understand how porosity affects gas
transmission through fabrics and membranes. In a study done on a perforated metal plate,
it was shown that when pore diameters are constant throughout the thickness, (i.e. when
tortuosity is 1), a large number of small pores allow higher water vapor permeation than a
small number of large pores for the same porosity [58]. This study was also applied to
29
fabrics at a null pressure difference and the same relationship was validated for moisture
vapor transport. However, for air permeation, experimental studies showed that
permeation rate was inversely related to pore diameter and larger pores had a higher flow
of air in fabrics [35]. The contradicting findings in those studies may be a result of the
effect of moisture diffusion through the non-porous areas of the fabric in addition to the
pores versus the convective flow of air through the openings which is usually dominant in
comparison. It is also possible to deduce from these studies that gas permeation cannot
simply be related to porosity alone and that other parameters such as pore diameters, pore
distributions, pressure, temperature, tortousity, concentration, etc. also play an important
role.
McCord et al. [35] studied permeability through woven and knitted fabrics, which are
significantly open structures compared to polymeric membranes. They considered the
diffusion through the fibers negligible as the flow through the pores is very large in
comparison. They created a model using Fick’s law of diffusion and Whelan’s model to
calculate moisture and gas permeation through fabrics. Gibson et al. [19] studied
transport properties of porous textiles of different fiber types using Darcy permeability
and calculated flow rate as a function of pressure drop across the sample. They also
derived an equation using the continuity equation and compared theoretical and
experimental results. Water vapor transport was also studied in fabrics as well as
microporous PTFE membranes using similar numerical models [21]. Another study on
fibrous porous materials such as pulp and paper was done by Nilsson and Stenstrom [38]
to understand gas diffusion through fibrous sheets. In this study, the relationship between
gas diffusivity and volume fraction of cylindrical and band-shaped fibers was examined.
30
A general deduction from this study was that during water vapor diffusion, the main
transport process occurred in the pores between the fibers rather than through the fibers
by adsorption or absorption of gas molecules.
Ryu et al. [42] also studied the gas transport through electrospun nonwoven mats
made of Nylon 6 and the effect of pore sizes and surface area. It was shown that mass
flow rate through the electrospun mats increased with increasing pressure for N2.
However, increasing the concentration of the polymer increased the fiber diameter and
therefore, increasing the polymer concentration on the fibers had an effect on
permeability. For higher polymer concentrations, the gas flow rate was also lower
compared to low polymer concentrations. This study showed that fiber diameters in
electrospun non-woven mats had an effect on gas permeability as well as pore size and
surface area and permeability mainly depended on fiber diameter and pore size.
1.9.2. Mathematical models for membranes
Guijt et al. [22] used the Dusty Gas Model to predict the gas transport properties for a
single component gas diffusion and compared with experimental results. In this study, all
pores were assumed to be cylindrical and membrane morphology parameters were used
for theoretical estimation of Knudsen, molecular and viscous flow. The results did not
follow experimental data and it was necessary to evaluate membrane morphology
parameters for molecular diffusion experimentally. Dusty Gas Model and Mean
Transport Pore Model were also used by Hejtmanek et al. [23] to understand the effect of
pressure build-up for multicomponent gas transport on porous media. The pressure
change was largely affected by the molecular weight of the gases and the change was
much larger for gas components with higher differences in molecular weights, i.e.
31
replacement of a heavier gas by a lighter gas would cause an increase in the pressure
build-up inside the porous solid. This study found good correlation between experiments
and the two models. Kerkhof et al. [31] developed a Velocity Profile Model versus the
Dusty Gas Model due to the insufficiency of the latter model at small Knudsen numbers.
This model was derived from Maxwell-Stefan equation with no-slip boundary condition
for liquids and Maxwell-slip boundary condition for gases. The Velocity Profile Model
presented a solution for transport of two-component liquids as well as gases through a
single pore, for flow in one direction, ignoring radial transport. The chemical potential,
and interspecies friction and shear stress is needed to predict the velocity profiles of any
component. The results were found to be in good agreement with experiments for macro
and mesopores. The results obtained from the Velocity Profile Model was also very
similar to results with the Binary Friction Model which was presented by Kerkhof et al.
[30] in a previous study for single component gases which included interspecies
(diffusive) forces as well as species-wall forces.
Gibson et al. [20] studied gas convection and water vapor diffusion properties in
electrospun fiber mats. They suggested that when there is no pressure difference between
the two sides of the mat, the water vapor transport occurs in the form of pure diffusion. In
the case of the presence of a pressure difference, transport is carried out as a convective
gas flow of the vapor. They used Darcy’s Law to calculate permeability of convective gas
flow with the equation:
∆∆
=p
x
A
QkD
µ

32
Where, kD is the permeability constant, µ is the gas viscosity, Q is the total volumetric
flow rate, A is the sample area, ∆x is the thickness, and ∆p is the pressure drop across the
sample.
Shelekhin et al. [49] studied permeation, diffusion and separation of gases through
molecular-sieve membranes. This study also described adsorption phenomena and
created a mathematical model using the Dubinin-Radushkevich isotherm, which allows
calculation of adsorption at different pressures and temperatures. The study showed that
inorganic molecular-sieve membranes have better gas separation properties than
polymeric membranes.
Shindo et al. [50] used a different approach to study gas permeation through
microporous glass membranes. In this study, the potential energy between the molecules
and the pore walls was used to determine the permeation in the Knudsen regime. Since
the collisions inside the micro pores in Knudsen regime occur only between gas
molecules and pore walls and not between molecules, it is reasonable to study the
permeation based on this relationship. Shindo et al.’s model was mentioned in section 7.1
in greater detail and this concept was also adapted in our research to understand the gas
behavior inside the pores.
Siginer and Bakhtiyarov [51] studied the flow of polymeric as well as Newtonian
liquids in porous media mathematically and compared the pressure drop for both cases at
different Reynolds numbers. They showed that at all Reynolds numbers, the pressure
drop required for the same volume flow rate is higher for polymeric liquids than the
Newtonian liquids such as water and water/glycerol solutions. Yoshioka et al. [59]
studied gas permeation experimentally and theoretically for microporous silica

33
membranes with less than 1 nm pore size. Knudsen diffusion theory was used and flux
calculations were carried out using Fick’s first law of diffusion. It was shown that as the
pore diameter decreases, the effect of surface potential (i.e. interaction energy between
the pore wall and the molecules) on permeation increases. In other words, as the pore size
gets smaller, the surface potential in the pore begins to have a significant effect in
permeation that cannot be ignored.
1.9.3. Molecular simulations and modeling
Many researchers have studied flow based on behavior of individual molecules rather
than using generalized gas laws. Petropoulos and Petrou [39] studied the permeation and
adsorption of gases in pores and pore networks using a simulation model. They
considered the surface of the adsorbent as a square lattice of adsorption sites on a 2-
dimensional space. The z-axis, as the 3rd dimension showed the depth of the adsorption
sites. Molecular trajectories were determined using the equations of motion. This study
provided a much realistic theoretical estimation of the gas transport inside very narrow
pores present in microporous membranes.
Tunca and Ford [55] studied diffusion as well as adsorption through microporous
membranes at a molecular level for steady-state permeation. They used free-energy
calculations to define the adsorption sites on the adsorbent and used this information on a
lattice model to simulate dynamic and equilibrium properties. They also used a
continuum approach for diffusion calculations. Fick’s law of diffusion was applied to
evaluate the diffusion flux and diffusion barriers between the adsorption sites. They used
the model to simulate the permeation of methane through siliceous ZK4 and obtained
reasonable estimations. This study was particularly useful to conclude that different
34
modeling techniques can be used to bridge the gap between molecular simulation and
continuum transport modeling.
Charrette and Houzelot [10] used both mathematical modeling and experimental
techniques to study mass transfer through cotton fabrics. They studied the diffusion of
salt through fabrics at zero pressure difference, using concentration as the driving force.
They applied a mass balance to calculate the change of concentration in time. Then the
fabric was washed in a washing machine to calculate the accumulation of NaCl as
impurity concentration. This model was used to determine the efficiency of the washing
process for a given fabric in certain conditions.
1.9.4. Adsorption studies
Staudt et al. [53] studied the physisorption of pure gases such as He, O2, N2, Ar, CO2,
etc. through microporous solids such as activated carbons or zeolites. Initially, single
component gas adsorption measurements were conducted to evaluate the effect of gas
composition, pressure and temperature on the amount adsorbed. Generally the absolute
adsorbed amount can not be determined without the information regarding porosity, pore
size distribution and the structure of the adsorbed layer. To eliminate this problem, Gibbs
surface excess approach was adopted in this study which only requires the knowledge of
void volume. The experiments were done gravimetrically to measure adsorption
equilibria, by measuring the change of weight on the sorbent sample after adsorption of
gas molecules. The experiments were found in good agreement with the three Parameter
Isotherm (3-PIG) equation, which was developed to describe adsorption equilibria based
on three parameters; maximum load, Henry’s law constant and the molar volume of the
adsorbed phase.
35
Do et al. [14] studied adsorption in approximately 1 nm diameter pores of
microporous solids and the effect of adsorbed molecules on the pore volume. It was
suggested that in very small pores, the overlapping of adsorption potentials exerted by the
opposite walls inside the pore may enhance the adsorption energy. Unlike larger pores
which will only allow one layer of adsorbed molecules, smaller pores may have multiple
layers due to this overlapping and the volume of adsorbed molecules may reach the
volume of the pores. In this study, the following equation was suggested for the
evaluation of the absolute amount adsorbed (nABS) at any given position r within the
adsorption space:
∫=v
ABS dVrn )(ρ
Where, ρ is the density and V is the volume. The volume that should be used in this
equation was also addressed by this study.
Hu et al. [25] studied the effect of solubility of gases, free volume and sorption on gas
permeability through dense membranes. Increasing the free volume caused an increase on
permeability. It was assumed that gas sorption would have an effect on the permeation
level. Since the increased free volume also caused an increase in solubility coefficient, to
further investigate the effect of sorption, they produced membranes with the same free
volume and different chemical structure. Studies done on polycarbonate (PC) and
polyetherimide (PEI) membranes showed that even though PEI membranes had the
highest gas sorption, they had the lowest permeability. PC membranes had the highest
permeability, although they had the lowest gas sorption. Gas sorption did not seem to
have an effect on the permeation order.
36
1.10. References
[1] Adanur, S., “Fabric Properties and Technology”, Wellington Sears Handbook of
Industrial Fabrics, Technomic Publishing Co., Inc., Lancaster, PA, 1996.
[2] ASTM D 1434-82: Standard test method for determining gas permeability characteristics of plastic film and sheeting, ASTM International, Reapproved 1998.
[3] Attard, G. and Barnes, C., Surfaces, Oxford ; New York: Oxford University Press,
1998.
[4] Barber, R. W. and Emerson, D. R., “The influence of Knudsen number on the hydrodynamic development length within parallel plate micro-channels”, Advances
in Fluid Mechanics IV, Eds. M. Rahman, R. Verhoeven, C.A. Brebbia, WIT Press, Southampton, UK, 2002, pp. 207-216.
[5] Barker, R. L. and Scruggs, B.J., “Evaluating the comfort performance of fabrics for nuclear protective apparel”, Performance of Protective Clothing: Fifth Volume, ASTM STP 1237, 1996.
[6] Barry, J., Hill, R., Brasser, P., Sobera, M., Kleijn, C., Gibson, P., “Computational fluid dynamics modeling of fabric systems for intelligent garment design”, MRS
Bulletin, August 2003.
[7] Bhandarkar, M., Shelekhin, A. B., Dixon, A. G., Ma, Y. H., “Adsorption, permeation, and diffusion of gases in microporous membranes. I. Adsorption of gases on microporous glass membranes”, Journal of Membrane Science, Vol. 75, 1992, pp. 221-231.
[8] Bird, R. B., Stewart, W. E., Lightfoot, E. N., Transport Phenomena, John Wiley & Sons, Inc., USA, 2002.
[9] Carroll, T.R., Schwope, A.D., McCarthy, R.T., “A technique to determine chemical contamination in chemical protective clothing”, ASTM Special Technical
Publication, Fourth Volume, No. 1133, 1992.
[10] Charrette, H., Houzelot, J. L., Ventenat, V., “Modeling and experimental studies of mass transfer in cotton fabrics”, Textile Research Journal, Vol. 71, No. 11, 2001, pp. 954-959.
[11] Chen, S. H., Yu, K. C., Houng, S. L., Lai, J. Y., “Gas transport properties of HTPB based polyurethane/cosalen membrane”, Journal of Membrane Science, Vol. 173, 2000, pp. 99-106.
[12] Cunningham, R. E. and Williams, R. J. J., Diffusion in Gases and Porous Media, 1980 Plenum Press, New York, 1980.
37
[13] Dhingra, S. S., “Mixed gas transport study through polymeric membranes: a novel technique”, PhD Dissertation, June 19, 1997.
[14] Do, D. D. and Do, H. D., “Adsorption of supercritical fluids in non-porous and porous carbons: analysis of adsorbed phase volume and density”, Carbon, Vol. 41, 2003, pp. 1777-1791.
[15] Faerevik, H., Markussen, D., Ogleand, G.E., Reinertsen, R.E., “The thermoneutral zone when wearing aircrew protective clothing”, Journal of Thermal Biology, Vol. 26 , 2001.
[16] Geankoplis, C. J., Transport Processes and Unit Operations, Englewood Cliffs, N.J.: PTR Prentice Hall, c1993.
[17] George, S. C. and Thomas, S., “Transport phenomena through polymeric systems”, Progress in Polymer Science, Vol. 26, 2001, pp. 985-1017.
[18] Gibson, P. W., “Effect of temperature on water vapor transport through polymer membrane laminates”, Polymer Testing, Vol. 19, 2000, pp. 673-691.
[19] Gibson, P. W., Charmchi, M., “Modeling convection/diffusion processes in porous textiles with inclusion of humidity-dependent air permeability”, Int. Comm. Heat
Mass Transfer, Vol. 24, No. 5, 1997, pp. 709-724.
[20] Gibson, P. W., Shreuder-Gibson, H. L., Rivin, D., “Electrospun fiber mats: transport properties”, AIChE Journal, Vol. 45, No. 1, January 1999, pp. 190-195.
[21] Gibson, P., Rivin, D., Kendrick, C., “Convection/diffusion test method for porous textiles”, International Journal of Clothing Science and Technology, Vol. 12, No. 2, 2000, pp. 96-113.
[22] Guijt, C. M. , Meindersma, G. W., Reith, T., de Haan, A. B., “Method for experimental determination of the gas transport properties of highly porous fiber membranes: a first step before predictive modeling of a membrane distillation process”, Desalination, Vol. 147, 2002, pp. 127-132.
[23] Hejtmanek, V., Capek, P., Solcova, O., Schneider, P., “Dynamics of pressure build-up accompanying multicomponent gas transport in porous solids: intert gases”, Chemical Engineering Journal, Vol. 70, 1998, pp. 189-195.
[24] Hoerner, S. F., “Aerodynamic Properties of Screen Fabrics”, Textile Research
Journal, Vol. 22, No. 4, 1952, pp. 274-280.
[25] Hu, C. C., Chang, C. S., Ruaan, R.C., Lai, J. Y., “Effect of free volume and sorption on membrane gas transport”, Journal of Membrane Science, Vol. 226, 2003, pp. 51-61.
38
[26] Johnson, D. W., Yavuzturk, C., Pruis, J., “Analysis of heat and mass transfer phenomena in hollow fiber membranes used for evaporative cooling”, Journal of
Membrane Science, Vol. 227, 2003, pp. 159-171.
[27] Jones, F. E., Evaporation of Water: with emphasis on applications and
measurements, Chelsea, Mich. : Lewis Publishers, c1992, pp.26-38.
[28] Kamada, K., Kamo, J., Motonaga, A., Iwasaki, T., Hosokawa, H., “Gas permeation properties of conducting polymer/porous media composite membranes I”, Polymer
Journal, Vol. 26, No. 2, 1994.
[29] Keller, J. and Staudt, R., “Gas Adsorption Equilibria: Experimental methods and adsorption isotherms”, Springer Science+Business Media, Inc, USA, 2005.
[30] Kerkhof, P. J.A.M., “A modified Maxwell-Stefan model for transport through inert membranes: the binary friction model”, The Chemical Engineering Journal, Vol. 64, 1996, pp. 319-343.
[31] Kerkhof, P. J.A.M., Geboers, M. A. M., Ptasinski, K. J., “On the isothermal binary mass transport in a single pore”, Chemical Engineering Journal, Vol. 83, 2001, pp. 107-121.
[32] Krueger, G.P., “Psychological and performance effects of chemical-biological protective clothing and equipment”, Military Medicine, Vol. 166 (12 Suppl), No. 41-3, Dec 2001.
[33] Kumaran, V., “Granular flow of rough particles in the high-Knudsen-number limit”, Journal of Fluid Mechanics, Vol. 561, 2006, pp. 43-72.
[34] Luth, H., Surfaces and Interfaces of Solids, Springer-Verlag, Berlin, 1993.
[35] McCord, M. G., Birla, K., Barker, R. L., “The relationship between porosity and barrier effectiveness of some shell fabrics used in protective apparel”, Performance
of Protective Clothing: Issues and Priorities for the 21st Century: Vol. 7, ASTM
STP 1386, C. N. Nelson and N. W. Henry Eds., American Society for Testing and Materials, West Conshohocken, PA, 2000.
[36] McGord, M. G., Brown, J. Z., Deaton, A. S., Barker, R. L., “Comfort and barrier effectiveness of microporous films and laminates”, Performance of Protective
Clothing: Seventh Volume, ASTM STP 1386, 2000.
[37] McLellan, T. M., “Work performance at 40 ºC with Canadian Forces biological and chemical protective clothing”, Aviation, Space and Environmental Medicine, Vol. 64, No. 12, December 1993, pp. 1094-100.
[38] Nilsson, L. and Stenstrom, S., “Gas diffusion through sheets of fibrous porous media”, Chemical Engineering Science, Vol. 50, No. 3, 1995, pp. 361-371.
39
[39] Petropolous, J. H. and Petrou, J. K., “Simulation of molecular transport in pores and pore networks”, Journal of Chemical Society Faraday Trans, Vol. 87, No. 13, 1991, pp. 2017-2022.
[40] Prutton, M., Introduction to Surface Physics, Clarendon Press, Oxford, 1994.
[41] Rodriguez-Reinoso, F., Mc Enaney, B., Rouquerol, J., Unger, K., “Characterization of porous solids VI”, Proceedings of the 6th Int. Symposium on the Characterization of Porous Solids, (COPS-VI), Alicante, May 2002, Studies in
Surface Science and Catalysis, Vol. 144 Elsevier, Amsterdam etc., 2002.
[42] Ryu, Y. J., Kim, H. Y., Lee, K. H., Park, H. C., Lee, D. R., “Transport properties of electrospun nylon 6 nonwoven mats”, European Polymer Journal, Vol. 39, 2003, pp. 1883-1889.
[43] Santee, W.R., Cadarette, B.S., Schamber, D.W., Gonzalez, R.R., “Comparative responses to exercise-heat stress of two chemical protective garments”, Performance of Protective Clothing: Fourth Volume, ASTM STP 1133, 1992.
[44] Satterfield, C. N., Sherwood, T. K., The Role of Diffusion in Catalysis, Addison-Wesley Publishing Company, Inc., Reading, MA, 1963.
[45] Schofield, R. W., Fane, A. G., Fell, C. J. D., “Gas and vapor transport through microporous membranes. I. Knudsen-Poiseuille transition”, Journal of Membrane
Science, Vol. 53, 1990, pp. 159-171.
[46] Schreuder-Gibson, H. L., Truong, Q., Walker, J. E., Owens, J. R., Wander, J. D., Jones Jr., W. E., “Chemical and biological protection and detection in fabrics for protective clothing”, MRS Bulletin, August 2003, pp. 574-578.
[47] Shalev, I., Barker, R. L., Hersh, S. P., Maini, S. M., Scruggs, B. J., Sood, V. K., Tosti, A., Tucker, P. A., Wu, G., “Protective textile barrier systems and their comfort”, ASTM Special Technical Publication, No. 1237, 1996, pp. 347-359.
[48] Shelekhin, A. B., Dixon, A. G., Ma, Y. H., “Adsorption, permeation, and diffusion of gases in microporous membranes. III. Application of percolation theory to interpretation of porosity, tortuosity, and surface area in microporous glass membranes”, Journal of Membrane Science, Vol. 83, 1993, pp. 181-198.
[49] Shelekhin, A.B., Dixon, A. G., Y. H. Ma, “Theory of gas diffusion and permeation in inorganic molecular-sieve membranes”, AIChE Journal, Vol. 41, No. 1, January 1995, pp. 58-67.
[50] Shindo, Y., Hakuta, T., Yoshitome, H., Inoue, H., “Gas diffusion in microporous media in Knudsen’s regime”, Journal of Chemical Engineering of Japan, Vol. 16, No. 2, 1983, pp. 120-126.
40
[51] Siginer, D. A. and Bakhtiyarov, S. I., “Flow in porous media of variable permeability and novel effects”, Journal of Applied Mechanics, Vol. 68, March 2001, pp. 312-319.
[52] Sing et al., K. S. W., “Reporting physisorption data for gas/solid systems with special reference to the determination of surface area and porosity”, (Recommendations 1984), Pure Applied Chemistry, Vol. 57, 1983, pp. 603-619.
[53] Staudt, R., Herbst, A., Beutekamp, S., Harting, P., “Adsorption of pure gases and mixtures on porous solids up to high pressures”, Adsorption, Vol. 11, 2005, pp. 379-384.
[54] Stull, J. O., “Considerations for design and selection of chemical-protective clothing”, Journal of Hazardous Materials, Vol. 14, 1987, pp. 165-189.
[55] Tunca, C. and Ford, D. M., “Coarse-grained nonequilibrium approach to the molecular modeling of permeation through microporous membranes”, Journal of
Chemical Physics, Vol. 120, No. 22, June 2004, pp. 10763-10767.
[56] Veghte, J.H., “Field Test Evaluation of ASTM Standard F-1154 with Chemical Protective Suit Ensembles”, Performance of Protective Clothing: Fourth Volume, ASTM STP 1133, 1992.
[57] Webb, P. A., “Introduction to chemical adsorption analytical techniques and their applications to catalysis”, Micromeritics Instrument Corp. Technical Publications, January 2003.
[58] Whelan, M. E., MacHattie, L. E., Goodings, A. C., Turl, L. H., “The diffusion of water vapor through laminae with particular reference to textile fabrics”, Textile
Research Journal, Vol. 25, No. 4, Mar. 1955, pp. 197-222.
[59] Yoshioka, T., Nakanishi, E., Tsuru, T., Asaeda, M., “Experimental studies of gas permeation through microporous silica membranes”, AIChE Journal, Vol. 47, No. 9, 2001, pp. 2052-2063.
[60] Zhong, W., Ding, X., Tang, Z. L., “Analysis of fluid flow through fibrous structures”, Textile Research Journal, Vol. 72, No. 9, 2002, pp. 751-755.
41
CHAPTER II
GAS TRANSMISSION RATE THROUGH MICROPOROUS MEMBRANES
Abstract
Gas transmission through microporous membranes was investigated experimentally
and a molecular-level probabilistic model was constructed to evaluate the effect of
various parameters on the gas flow. Gas transmission experiments were conducted on
PET, nylon and PP/PE microporous membranes at different pressure values and a
comparison was made between permeability testing machines based on volumetric and
manometric principles as to their ability to accommodate high permeability membranes.
The interaction energy between gas molecules and membranes’ surface was investigated
to explore its influence on the gas transmission rate. Gas transmission experiments were
simulated utilizing the proposed model, and results were compared to experimental data
and to macro-level gas transmission models available in literature.
Keywords: Air transmission, Microporous membrane, Probabilistic modeling
2.1. Introduction
The idea of a garment that can protect first responders against chemical attacks or
spills while providing comfort for a prolonged period of time is intriguing. Various
garment material design constructions have been proposed in literature [13, 10, 12] with
varied degrees of success. Selectively permeable layered systems [13] assembled from a
group of microporous membrane layers and fabrics provide a logical premise to be able
42
to obstruct the passage of toxic gases while providing breathability to the skin. The first
step to design such an assembly is to understand the process of gas permeation through
single layer, and multi-layer assemblies, of microporous membranes.
The permeation of gas molecules through a pore of a microporous membrane can be
studied either at the level of individual molecules or at the level of the molecular
population. At the molecular-level, each molecule and its interaction with other
molecules and surfaces have to be taken into consideration and may be studied using a
probabilistic technique. At the macro-level, the behavior of the molecular population
depends on concentration and can be described by the continuum hypothesis. However,
when the number of molecules in the molecular population decreases to a point where the
behavior of the molecular population becomes chaotic, continuum equations cannot be
used. The flux must be estimated by probabilistic techniques [2, 3].
The flow of any gas through a porous system is typically governed by geometric and
energetic considerations. The geometric aspects are controlled by the mean free path of
the gas (λ), the average distance between collisions for a gas molecule, in comparison to
the diameter of the pore [2, 3, 6, 4], and can be represented by the Knudsen number (Kn)
as follows:
DKn
λ=
Where, λ = mean free path and D = diameter of single pore.
If the value of Kn is very small, the flow is considered to be in continuum (which can
be considered as a viscous or a Poisseuille flow) assuming that the molecules move
together with an overall average velocity and can be treated similar to a liquid flow inside

43
a tube [2]. In this case, Maxwell-Stefan and Navier Stokes equations can be used to
adequately express the gas permeation process. As the value of the Knudsen number gets
larger, the continuum assumptions breakdown [1], the gas no longer has an overall mass
velocity or diffusion behavior and individual molecule-wall collisions become significant
(Knudsen flow). Defining which regime should be followed to describe the gas
transmission problem based on Knudsen number is not very clear. However, it is
acceptable to consider the flow as either Knudsen if Kn>10 or viscous if Kn<0.01. The
flow within the intermediate region of the Knudsen number interval is called the
transition flow. Although most of gas flow in porous media lay in this region, there is a
lack of analytical or numerical models to describe the transmission rate within this
region. Moreover, these continuum regimes (Knudsen and viscous flow) do not consider
the interaction between the gas molecules and the surface of porous media.
Shindo et al. [11] considered the interaction energy between gas molecules and
surfaces, during the flow of gases through pores, and compared it to the kinetic energy of
the gas molecules. A gas molecule can either collide elastically with the pore surface or
be trapped in the potential field and hop on the surface. If the kinetic energy of the
molecule is larger than the interaction energy, that will make the molecule able to escape
from the surface potential field and rebound elastically without losing energy, in other
words, with the same velocity. Alternatively, if the interaction energy between the
surface and the gas molecule is greater than the kinetic energy of the molecule, then the
molecule will be trapped in the field, physisorbed on the surface and may cause a slip
surface flow. The second case means that the molecule will lose some of its kinetic
energy, and velocity, which results in a decrease of the gas transmission rate.
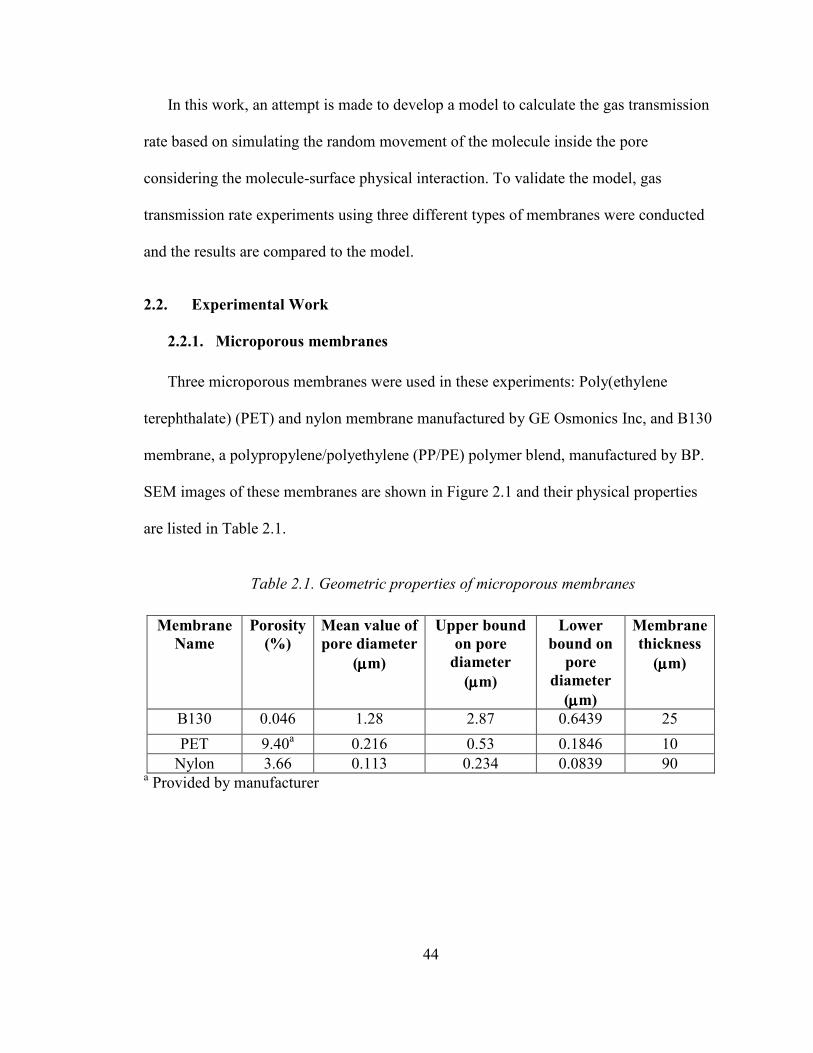
44
In this work, an attempt is made to develop a model to calculate the gas transmission
rate based on simulating the random movement of the molecule inside the pore
considering the molecule-surface physical interaction. To validate the model, gas
transmission rate experiments using three different types of membranes were conducted
and the results are compared to the model.
2.2. Experimental Work
2.2.1. Microporous membranes
Three microporous membranes were used in these experiments: Poly(ethylene
terephthalate) (PET) and nylon membrane manufactured by GE Osmonics Inc, and B130
membrane, a polypropylene/polyethylene (PP/PE) polymer blend, manufactured by BP.
SEM images of these membranes are shown in Figure 2.1 and their physical properties
are listed in Table 2.1.
Table 2.1. Geometric properties of microporous membranes
Membrane Name
Porosity (%)
Mean value of pore diameter
(µµµµm)
Upper bound on pore
diameter (µµµµm)
Lower bound on
pore diameter
(µµµµm)
Membrane thickness
(µµµµm)
B130 0.046 1.28 2.87 0.6439 25
PET 9.40a 0.216 0.53 0.1846 10 Nylon 3.66 0.113 0.234 0.0839 90
a Provided by manufacturer

45
Figure 2.1. SEM images of microporous membranes: (a) PET (b) B130, and (c) nylon
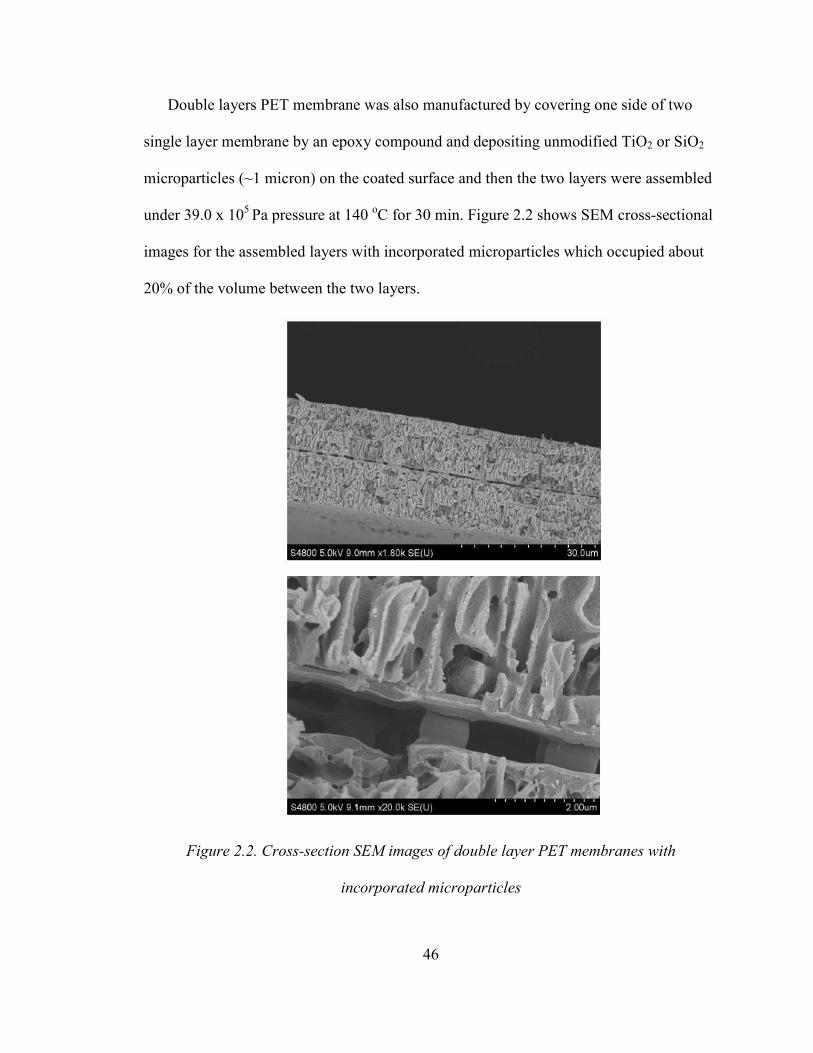
46
Double layers PET membrane was also manufactured by covering one side of two
single layer membrane by an epoxy compound and depositing unmodified TiO2 or SiO2
microparticles (~1 micron) on the coated surface and then the two layers were assembled
under 39.0 x 10⁵ Pa pressure at 140 oC for 30 min. Figure 2.2 shows SEM cross-sectional
images for the assembled layers with incorporated microparticles which occupied about
20% of the volume between the two layers.
Figure 2.2. Cross-section SEM images of double layer PET membranes with
incorporated microparticles

47
2.2.2. Evaluation of gas transmission rate
The transmission rate of air and ammonia through the three membranes, mentioned
above, was measured at different pressure levels. Two machines were used to measure
the air transmission rate, one based on the principle of manometric measurement
(LYSSY L100-5000, manufactured by PBI-Dansensor), as shown in Figure 2.3, and the
other on volumetric measurement (CSI-135, manufactured by Custom Scientific
Instruments, Inc), as defined in the ASTM D 1434 standard, shown in Figure 2.4.
Figure 2.3. LYSSY L100-5000, air permeability measurement chambers [7]
Figure 2.4. CSI-135, view of the permeation cell [8]
48
The air transmission rate in the LYSSY L100-5000 manometric machine is measured
based on the pressure difference between the upper and lower chambers and the time
needed to increase the pressure from a set lower value to a set upper limit. The CSI-135
evaluates gas permeation by measuring the change of a volume of gas that permeates
through the membrane from the lower to the upper chambers, at a constant pressure
gradient. The change in volume is measured by the displacement of a short slug of
mercury or other observable liquid in a glass capillary of a 1 mm diameter. Low porosity
materials, or impermeable materials, require a high pressure difference value to test their
permeability, while more open structures like microporous membranes require very low
pressure. The manometric machine’s testing capabilities were limited to materials with
very low permeability, therefore only the lowest permeability membrane, the B130, was
tested with this machine. The standard pressure regulator on the CSI permeability
instrument was more appropriate for less permeable or completely impermeable
materials, therefore a modification was done to the machine to add a second pressure
regulator for low pressure values. A similar modification to the pressure controls was not
possible for the manometric machine. A digital camera was used to record the CSI
experiments and the time needed for the slug to move a specific length was obtained by
analyzing the product video. Five samples were tested at each pressure difference (∆P)
when evaluating the gas transmission rate (GTR) defined by the ASTM D1434 standard
as “the quantity of a given gas passing through a unit of the parallel surfaces of plastic
film in a unit time under the conditions of test” and is calculated as follows in mol/(m².s).
GTR = TRA
Vp ra **10 6−
49
Where, A = transmitting area of specimen (mm²), pa= ambient pressure (Pa), R =
universal gas constant (R=8.314 L.Pa/(mol.K) and T = ambient temperature (K). Vr is
calculated as Vr = slope*ac where ac = cross-sectional area of capillary (mm²) and slope
= rate of rise of capillary slug (mm/s).
2.2.3. Evaluation of porosity and pore diameter
A capillary flow porometer (CFP-1100-AEXS, manufactured by Porous Materials,
Inc.) was used to evaluate the mean value and distribution of pore diameters (see Table
2.1). In this procedure, the pores of the sample are filled with a wetting liquid and air
pressure is incrementally applied on one side of the sample. At a certain pressure, the
larger pores are emptied of the wetting liquid and air flow starts. On further increase of
the pressure, smaller pores are emptied, etc, and air pressure and flow through dry and
wet samples is measured. Pore diameter is computed from the differential pressures
between wet and dry samples.
2.3. Probabilistic Model
A probabilistic model was developed utilizing a Monte Carlo approach to simulate
gas transmission through microporous membranes in the CSI machine. The pore
diameters were assumed to vary randomly between the upper and lower bounds observed
experimentally and to be perfectly cylindrical. Pores were categorized based on pore size
ranges and frequency and pore size averages were determined for each category.
Molecules were assumed to fill available space, in the bottom chamber of the CSI
machine, with random locations and direction of movement. The molecular trajectory
was calculated for the molecules which were able to enter the pores. The molecules that

50
entered the pores travelled a distance ( nl ) assumed to be equal to the mean free path (λ)
or less in the case that the molecule hits the pore wall. The direction of the molecule
(angle α) after each collision was determined and the total path of the molecule inside the
pore was calculated by following this trajectory. A sketch of a possible trajectory is
shown in Figure 2.5. The total length of the path is equal to ∑n
i
nl where n is reached as z
= δ (thickness of the membrane).
Figure 2.5. The sketch of a possible molecular trajectory
The volume of molecules required to pass through the membrane at a certain time is
calculated based on the volume of the capillary used in the experimental setup of the CSI
machine. It is assumed that for each molecule that passes through the thickness of the
membrane sample, a molecule will move into the capillary. The time (t1) needed for one
molecule to pass through the pore is equal to:
51
υpathm
t =1
Where, mpath = length of molecular trajectory path and v is the average molecule
velocity, M
RT
πυ
8=
.
Matlab® software was used to construct the model. Model results were compared to
experimental results, as well as gas flux calculated for Knudsen (JK) and viscous (JP)
flow regimes mathematically defined as follows [9]:
δδπτ
ε/}
8{
32 2/1 PK
P
RT
M
M
RTrJ KK ∆≡
∆=
δδητ
ε/
181 2
PKP
RT
MPrJ PP ∆≡
∆=
Where, ε = porosity, r = average pore diameter, τ = tortuosity, δ = thickness of
membrane, η = viscosity, M = molecular weight, T = temperature, P = pressure and R =
gas constant.
2.4. Results and Discussion
Air transmission rate throygh B130 microporous membrane, which has the lowest
porosity, was evaluated on both the manometric and volumetric permeability machines at
different pressure-difference values. Air permeation rate reported by the manometric
tester was calculated as 2.086*10-4 mol/m²s at a ∆P=11.39 in-water, while reported as
3.32*10-5 mol/m²s on the volumetric tester CSI-135 at ∆P=0.43 in-water. Linear
extrapolating the data of CSI-135, assuming a linear relationship between GTR and ∆P,
showed that GTR will be 7.99*10-4 mol/m2s at ∆P=11.39 in-water. Although results were
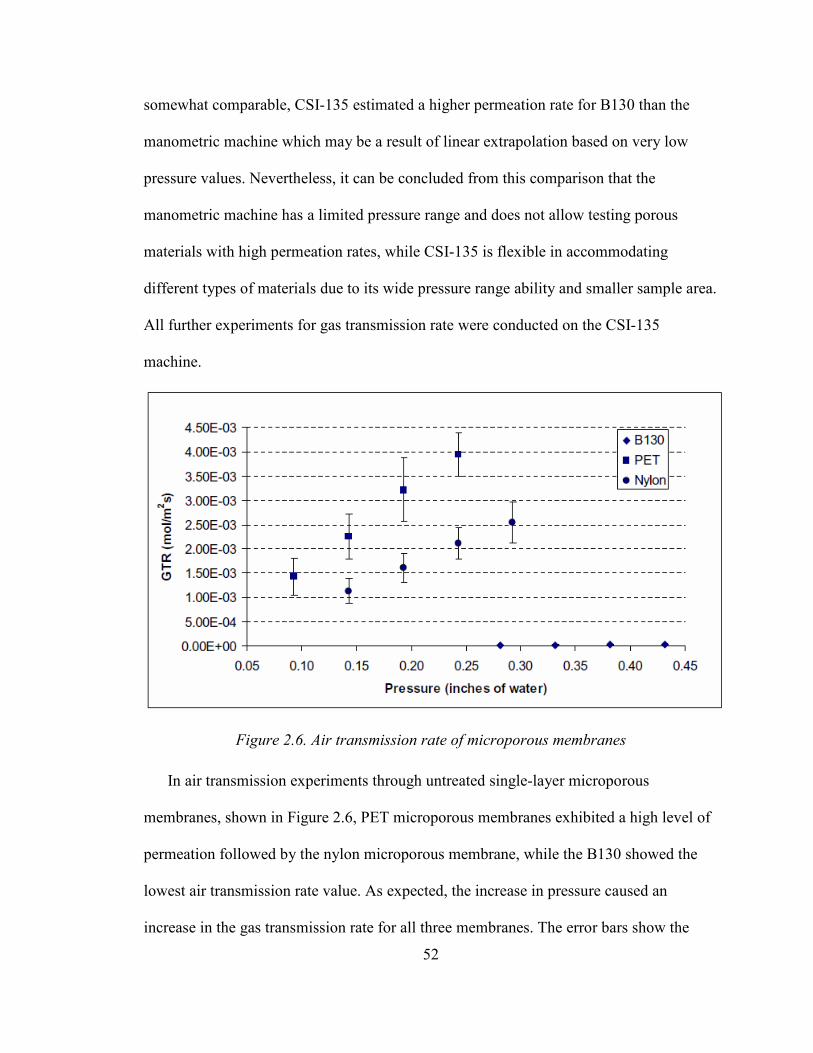
52
somewhat comparable, CSI-135 estimated a higher permeation rate for B130 than the
manometric machine which may be a result of linear extrapolation based on very low
pressure values. Nevertheless, it can be concluded from this comparison that the
manometric machine has a limited pressure range and does not allow testing porous
materials with high permeation rates, while CSI-135 is flexible in accommodating
different types of materials due to its wide pressure range ability and smaller sample area.
All further experiments for gas transmission rate were conducted on the CSI-135
machine.
Figure 2.6. Air transmission rate of microporous membranes
In air transmission experiments through untreated single-layer microporous
membranes, shown in Figure 2.6, PET microporous membranes exhibited a high level of
permeation followed by the nylon microporous membrane, while the B130 showed the
lowest air transmission rate value. As expected, the increase in pressure caused an
increase in the gas transmission rate for all three membranes. The error bars show the
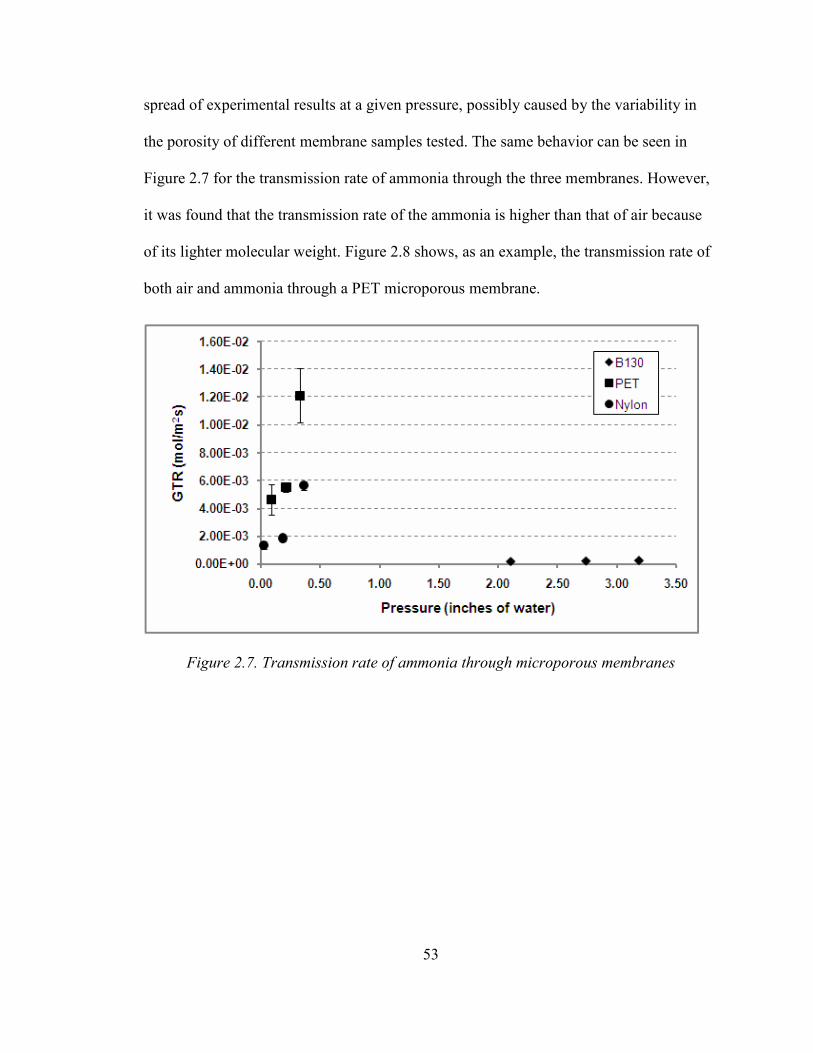
53
spread of experimental results at a given pressure, possibly caused by the variability in
the porosity of different membrane samples tested. The same behavior can be seen in
Figure 2.7 for the transmission rate of ammonia through the three membranes. However,
it was found that the transmission rate of the ammonia is higher than that of air because
of its lighter molecular weight. Figure 2.8 shows, as an example, the transmission rate of
both air and ammonia through a PET microporous membrane.
Figure 2.7. Transmission rate of ammonia through microporous membranes
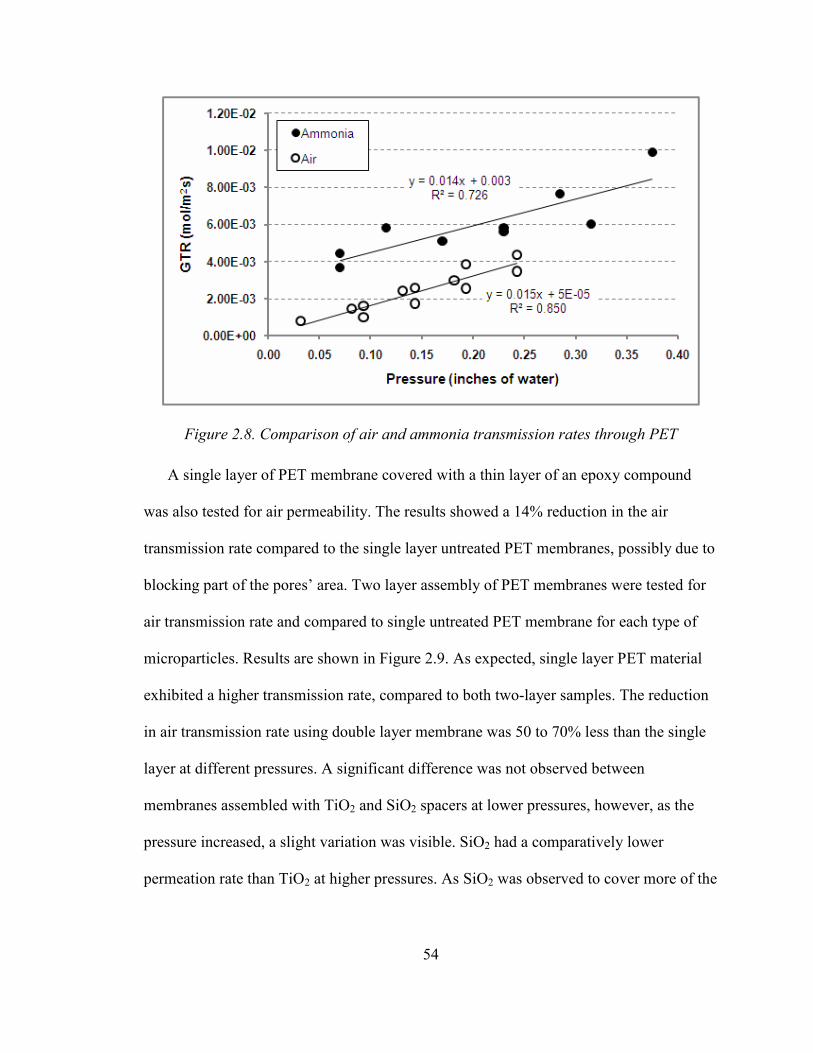
54
Figure 2.8. Comparison of air and ammonia transmission rates through PET
A single layer of PET membrane covered with a thin layer of an epoxy compound
was also tested for air permeability. The results showed a 14% reduction in the air
transmission rate compared to the single layer untreated PET membranes, possibly due to
blocking part of the pores’ area. Two layer assembly of PET membranes were tested for
air transmission rate and compared to single untreated PET membrane for each type of
microparticles. Results are shown in Figure 2.9. As expected, single layer PET material
exhibited a higher transmission rate, compared to both two-layer samples. The reduction
in air transmission rate using double layer membrane was 50 to 70% less than the single
layer at different pressures. A significant difference was not observed between
membranes assembled with TiO2 and SiO2 spacers at lower pressures, however, as the
pressure increased, a slight variation was visible. SiO2 had a comparatively lower
permeation rate than TiO2 at higher pressures. As SiO2 was observed to cover more of the
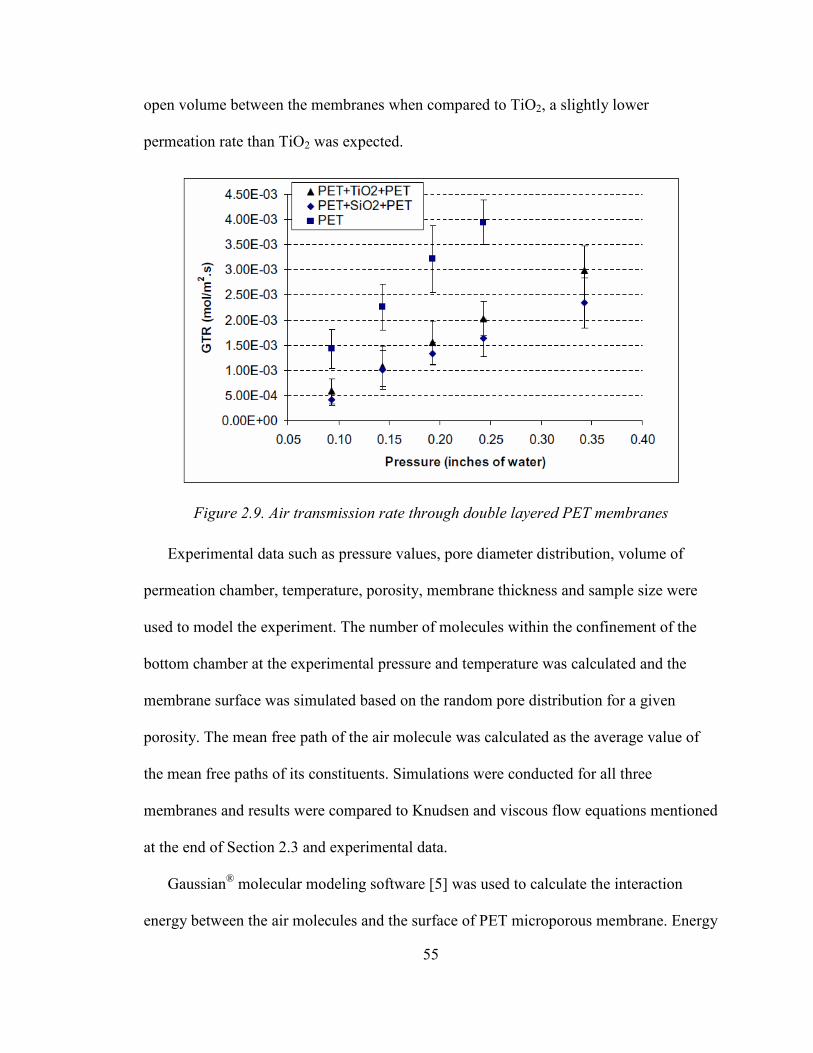
55
open volume between the membranes when compared to TiO2, a slightly lower
permeation rate than TiO2 was expected.
Figure 2.9. Air transmission rate through double layered PET membranes
Experimental data such as pressure values, pore diameter distribution, volume of
permeation chamber, temperature, porosity, membrane thickness and sample size were
used to model the experiment. The number of molecules within the confinement of the
bottom chamber at the experimental pressure and temperature was calculated and the
membrane surface was simulated based on the random pore distribution for a given
porosity. The mean free path of the air molecule was calculated as the average value of
the mean free paths of its constituents. Simulations were conducted for all three
membranes and results were compared to Knudsen and viscous flow equations mentioned
at the end of Section 2.3 and experimental data.
Gaussian® molecular modeling software [5] was used to calculate the interaction
energy between the air molecules and the surface of PET microporous membrane. Energy

56
calculations were restricted to the two most dominant components in dry air - nitrogen
and oxygen as they represent almost 99% of the air volume (~78% and ~21%
respectively). Two surfaces were modeled for the energy calculations - untreated PET
microporous membrane and that covered with a thin layer of epoxy. Molecular models
were geometrically optimized and the interaction energy calculated using the Density
Functional Theory (DFT) using B3LYP-method with the base function (6-31g(d)). The
interaction energy was calculated at different distances between the gas molecule and the
surface to obtain an interaction energy profile. The depth of the energy-well was
compared to the kinetic energy of the gas molecule calculated at 25oC to be 0.89
kcal/mol. Figure 2.10 shows the interaction energy profiles of both gases with virgin PET
as compared to their kinetic energy. It can be seen from this graph that the molecules
have enough kinetic energy to rebound from the surface. However, for surfaces covered
with epoxy the interaction energy increased as shown in Figure 2.11. Although the
nitrogen molecules still have greater kinetic energy to escape the surface, the oxygen
energy-well is deeper than the kinetic energy. This means that if an oxygen molecule is
3.5 Ǻ close to the surface it will be captured by the potential field of the surface (i.e.,
physisorped). It is important to note that although this represents a possibility of
physisorption, the double layer specimens used in the experimental work shown in Figure
2. 11 were already in the air prior to the experiments allowing physisorption sites to be
occupied by the oxygen molecules and limiting the contribution of physisorption to their
GTR.
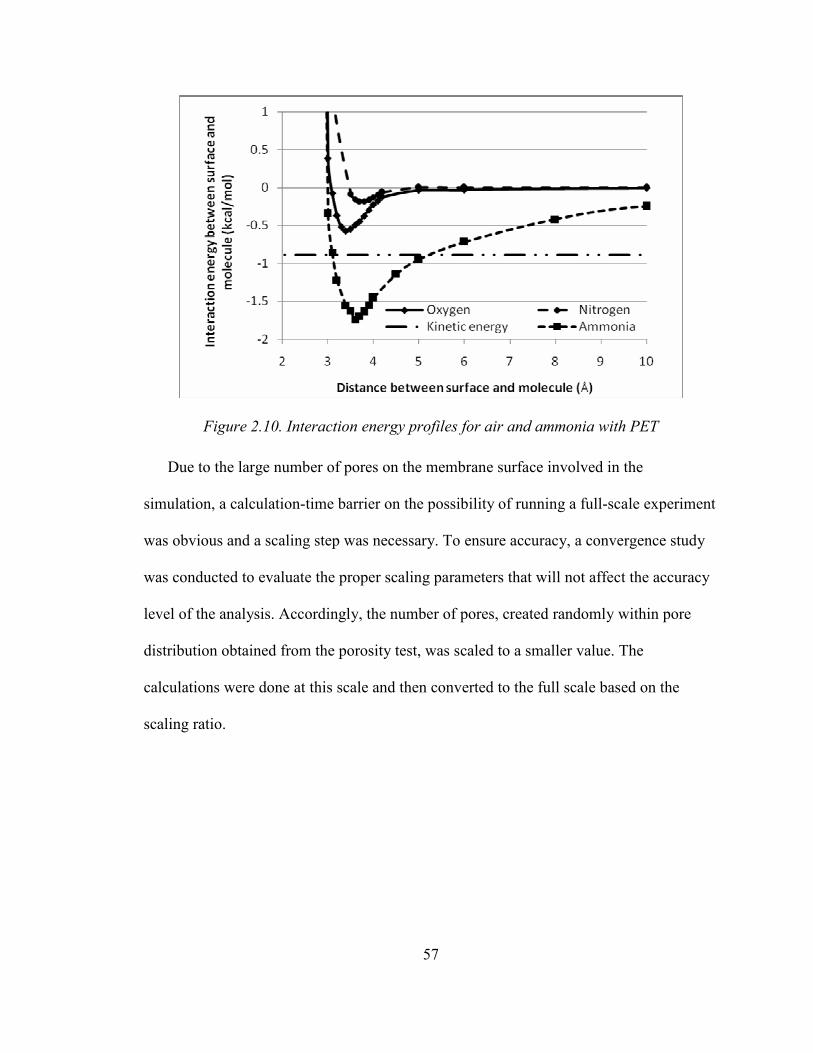
57
Figure 2.10. Interaction energy profiles for air and ammonia with PET
Due to the large number of pores on the membrane surface involved in the
simulation, a calculation-time barrier on the possibility of running a full-scale experiment
was obvious and a scaling step was necessary. To ensure accuracy, a convergence study
was conducted to evaluate the proper scaling parameters that will not affect the accuracy
level of the analysis. Accordingly, the number of pores, created randomly within pore
distribution obtained from the porosity test, was scaled to a smaller value. The
calculations were done at this scale and then converted to the full scale based on the
scaling ratio.
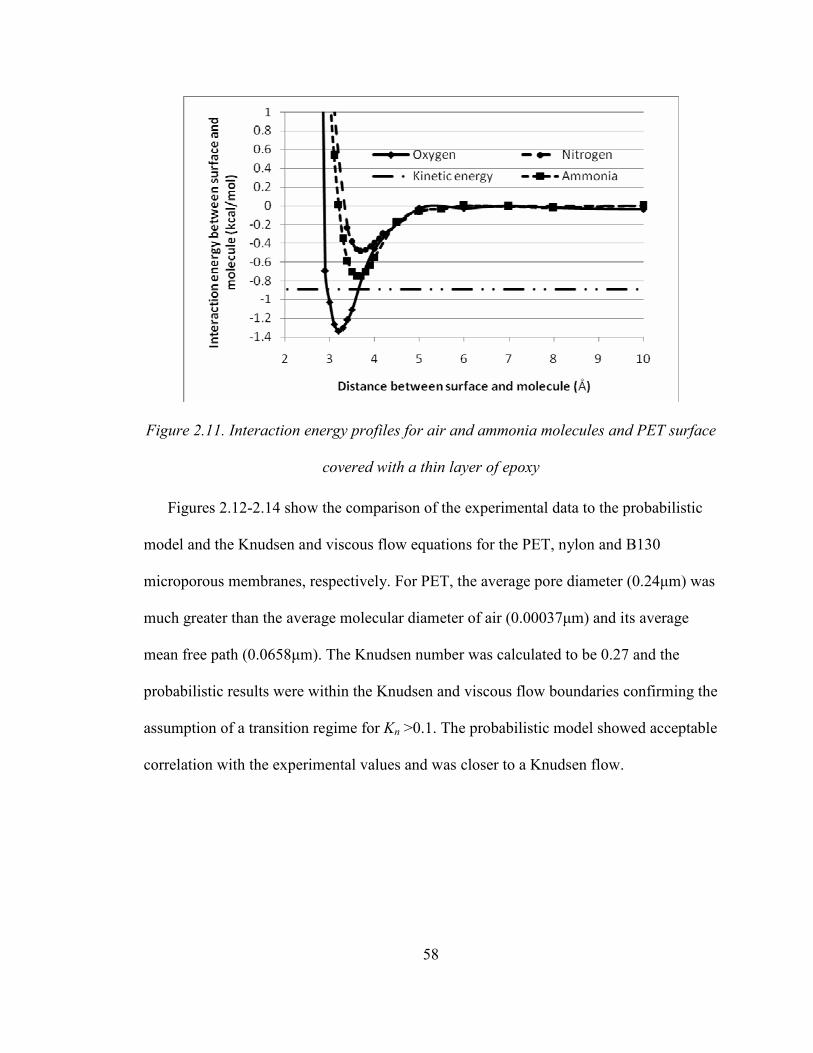
58
Figure 2.11. Interaction energy profiles for air and ammonia molecules and PET surface
covered with a thin layer of epoxy
Figures 2.12-2.14 show the comparison of the experimental data to the probabilistic
model and the Knudsen and viscous flow equations for the PET, nylon and B130
microporous membranes, respectively. For PET, the average pore diameter (0.24µm) was
much greater than the average molecular diameter of air (0.00037µm) and its average
mean free path (0.0658µm). The Knudsen number was calculated to be 0.27 and the
probabilistic results were within the Knudsen and viscous flow boundaries confirming the
assumption of a transition regime for Kn >0.1. The probabilistic model showed acceptable
correlation with the experimental values and was closer to a Knudsen flow.
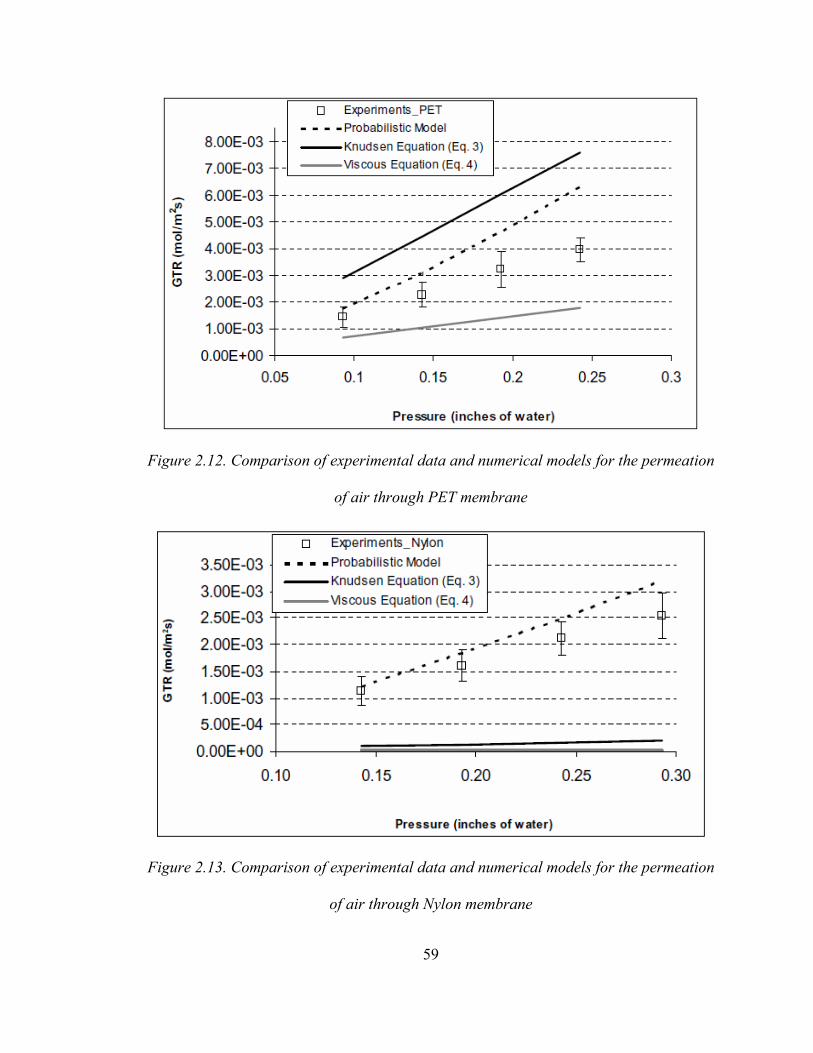
59
Figure 2.12. Comparison of experimental data and numerical models for the permeation
of air through PET membrane
Figure 2.13. Comparison of experimental data and numerical models for the permeation
of air through Nylon membrane
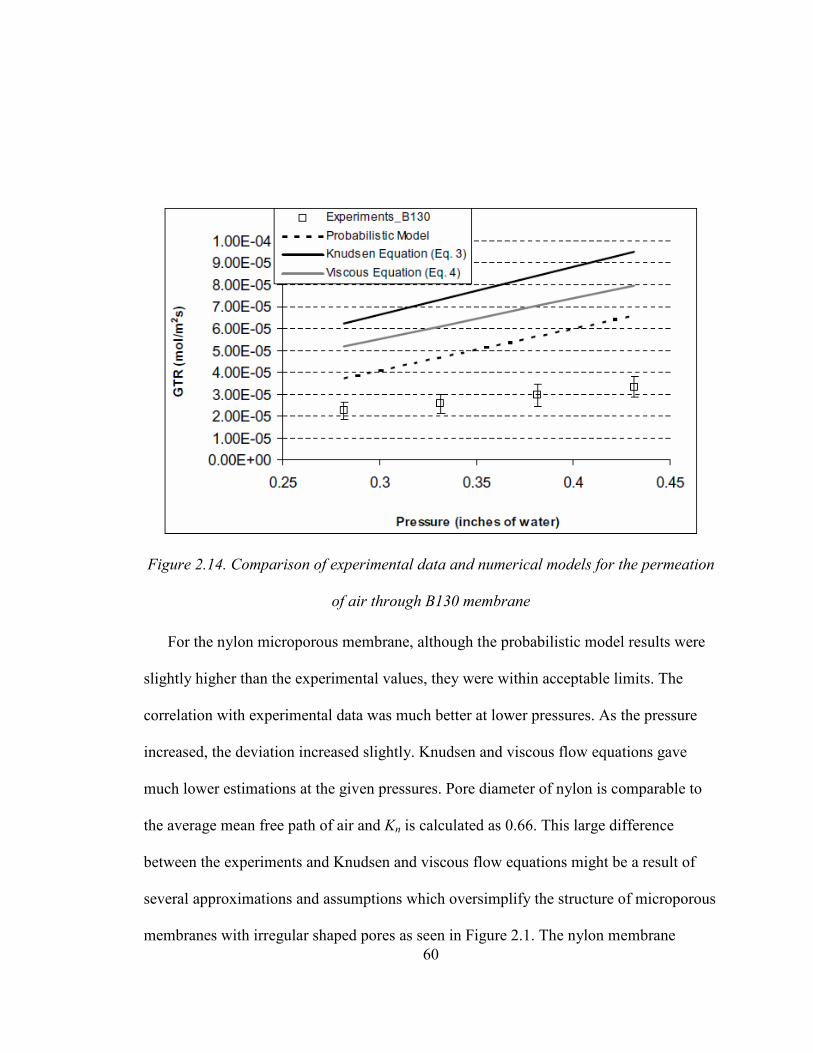
60
Figure 2.14. Comparison of experimental data and numerical models for the permeation
of air through B130 membrane
For the nylon microporous membrane, although the probabilistic model results were
slightly higher than the experimental values, they were within acceptable limits. The
correlation with experimental data was much better at lower pressures. As the pressure
increased, the deviation increased slightly. Knudsen and viscous flow equations gave
much lower estimations at the given pressures. Pore diameter of nylon is comparable to
the average mean free path of air and Kn is calculated as 0.66. This large difference
between the experiments and Knudsen and viscous flow equations might be a result of
several approximations and assumptions which oversimplify the structure of microporous
membranes with irregular shaped pores as seen in Figure 2.1. The nylon membrane
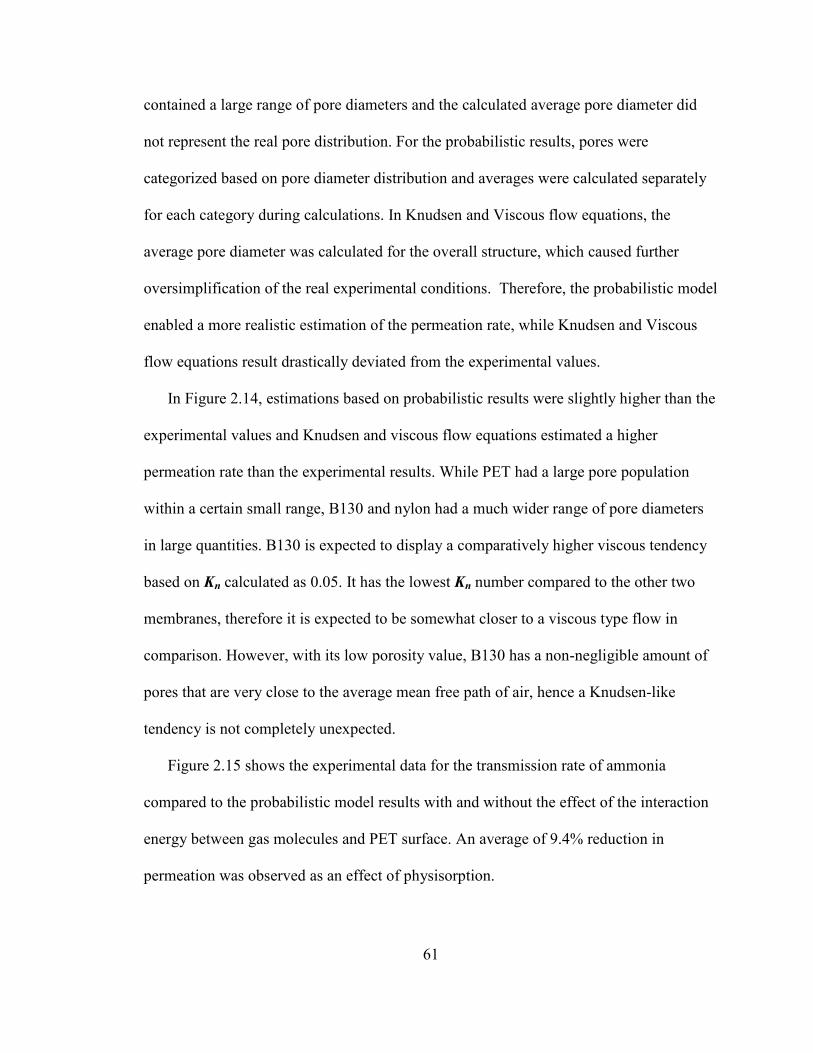
61
contained a large range of pore diameters and the calculated average pore diameter did
not represent the real pore distribution. For the probabilistic results, pores were
categorized based on pore diameter distribution and averages were calculated separately
for each category during calculations. In Knudsen and Viscous flow equations, the
average pore diameter was calculated for the overall structure, which caused further
oversimplification of the real experimental conditions. Therefore, the probabilistic model
enabled a more realistic estimation of the permeation rate, while Knudsen and Viscous
flow equations result drastically deviated from the experimental values.
In Figure 2.14, estimations based on probabilistic results were slightly higher than the
experimental values and Knudsen and viscous flow equations estimated a higher
permeation rate than the experimental results. While PET had a large pore population
within a certain small range, B130 and nylon had a much wider range of pore diameters
in large quantities. B130 is expected to display a comparatively higher viscous tendency
based on Kn calculated as 0.05. It has the lowest Kn number compared to the other two
membranes, therefore it is expected to be somewhat closer to a viscous type flow in
comparison. However, with its low porosity value, B130 has a non-negligible amount of
pores that are very close to the average mean free path of air, hence a Knudsen-like
tendency is not completely unexpected.
Figure 2.15 shows the experimental data for the transmission rate of ammonia
compared to the probabilistic model results with and without the effect of the interaction
energy between gas molecules and PET surface. An average of 9.4% reduction in
permeation was observed as an effect of physisorption.
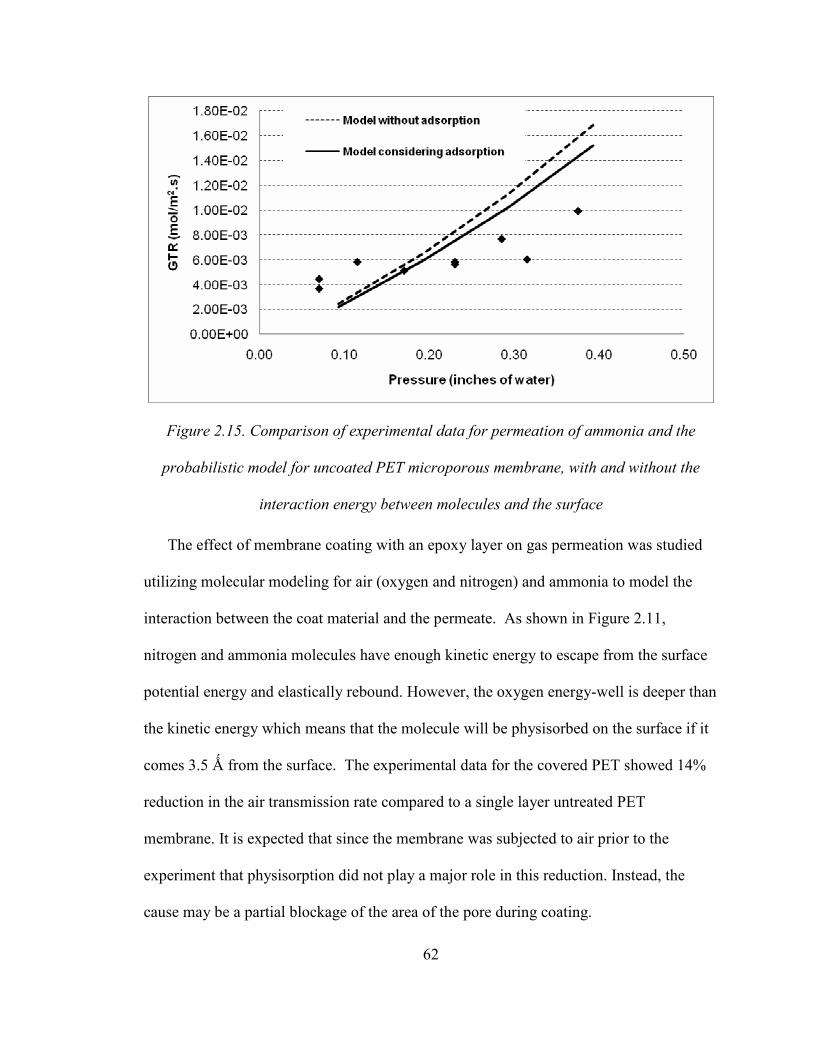
62
Figure 2.15. Comparison of experimental data for permeation of ammonia and the
probabilistic model for uncoated PET microporous membrane, with and without the
interaction energy between molecules and the surface
The effect of membrane coating with an epoxy layer on gas permeation was studied
utilizing molecular modeling for air (oxygen and nitrogen) and ammonia to model the
interaction between the coat material and the permeate. As shown in Figure 2.11,
nitrogen and ammonia molecules have enough kinetic energy to escape from the surface
potential energy and elastically rebound. However, the oxygen energy-well is deeper than
the kinetic energy which means that the molecule will be physisorbed on the surface if it
comes 3.5 Ǻ from the surface. The experimental data for the covered PET showed 14%
reduction in the air transmission rate compared to a single layer untreated PET
membrane. It is expected that since the membrane was subjected to air prior to the
experiment that physisorption did not play a major role in this reduction. Instead, the
cause may be a partial blockage of the area of the pore during coating.
63
The probabilistic model was tailored to calculate air transmission rate through double
layer samples assuming that the pressure decreases linearly along the sample layers
between the top and bottom chambers. Accordingly, the molecular separation distance
and the number of molecules were calculated between the two layers. Probabilistic model
results, calculated for particles occupying 20% of the volume between membrane layers,
along with experimental data are shown in Figure 2.16. As shown in the figure, the
probabilistic model results are very close to experimental data at smaller pressure values,
however as the pressure increases, the deviation increases.
Figure 2.16. Comparison of experimental results and model for double layered PET
2.5. Conclusions
Gas transmission rate through three types of single layer microporous membranes and
air transmission through one double layer membrane were evaluated. A probabilistic
64
computer-based model was developed to calculate the gas transmission rate through
different types of microporous membranes and results were compared to experimental
data as well as Knudsen and Viscous equations. The probabilistic model simulated the
random variation of the pore size distribution, unlike Knudsen and Viscous equations that
use average pore size, which resulted in more realistic results when compared to the
experimental data especially for membranes with a wide variation in pore distribution.
Acceptable correlations were observed between the probabilistic model and the
experimental data. Gaussian®, molecular modeling software, was used to evaluate the
interaction energy between the air molecules and both untreated PET surfaces and PET
covered with a thin layer of an epoxy compound. The interaction energy profiles were
compared to the kinetic energy of the molecule and results of untreated PET showed that
the kinetic energy of air molecules is large enough to allow the molecule to escape the
surface potential energy field. On the other hand, PET membranes coated with an epoxy
compound can cause oxygen molecules to be physisorbed on the surface. The
probabilistic model was also tailored to calculate air transmission rate through double
layer microporous membranes and results were compared to experimental data showing
an acceptable agreement.
2.6. References
[1] Barber, R. W. and Emerson, D. R., “The influence of Knudsen number on the
hydrodynamic development length within parallel plate micro-channels”, Advances
in Fluid Mechanics IV, Eds. M. Rahman, R. Verhoeven, C.A. Brebbia, WIT Press,
Southampton, UK, 2002, pp. 207-216.
65
[2] Bird, R. B., Stewart, W. E., Lightfoot, E. N., Transport Phenomena, John Wiley &
Sons, Inc., USA, 2002.
[3] Cunningham, R. E. and Williams, R. J. J., Diffusion in Gases and Porous Media,
1980 Plenum Press, New York, 1980.
[4] Fried, J. R., Polymer Science and Technology, Englewood Cliffs, NJ: Prentice Hall,
1995.
[5] Gaussian 03, Revision D.01, M. J. Frisch, G. W. Trucks, H. B. Schlegel, G. E.
Scuseria, M. A. Robb, J. R. Cheeseman, J. A. Montgomery, Jr., T. Vreven, K. N.
Kudin, J. C. Burant, J. M. Millam, S. S. Iyengar, J. Tomasi, V. Barone, B.
Mennucci, M. Cossi, G. Scalmani, N. Rega, G. A. Petersson, H. Nakatsuji, M.
Hada, M. Ehara, K. Toyota, R. Fukuda, J. Hasegawa, M. Ishida, T. Nakajima, Y.
Honda, O. Kitao, H. Nakai, M. Klene, X. Li, J. E. Knox, H. P. Hratchian, J. B.
Cross, V. Bakken, C. Adamo, J. Jaramillo, R. Gomperts, R. E. Stratmann, O.
Yazyev, A. J. Austin, R. Cammi, C. Pomelli, J. W. Ochterski, P. Y. Ayala, K.
Morokuma, G. A. Voth, P. Salvador, J. J. Dannenberg, V. G. Zakrzewski, S.
Dapprich, A. D. Daniels, M. C. Strain, O. Farkas, D. K. Malick, A. D. Rabuck, K.
Raghavachari, J. B. Foresman, J. V. Ortiz, Q. Cui, A. G. Baboul, S. Clifford, J.
Cioslowski, B. B. Stefanov, G. Liu, A. Liashenko, P. Piskorz, I. Komaromi, R. L.
Martin, D. J. Fox, T. Keith, M. A. Al-Laham, C. Y. Peng, A. Nanayakkara, M.
Challacombe, P. M. W. Gill, B. Johnson, W. Chen, M. W. Wong, C. Gonzalez, and
J. A. Pople, Gaussian, Inc., Wallingford CT, (2004)
[6] George, S. C. and Thomas, S., “Transport phenomena through polymeric systems”,
Progress in Polymer Science, Vol. 26, 2001, pp. 985-1017.
66
[7] Operating manual of automatic manometric gas permeability tester, Model L100-
5000.
[8] Operating manual of gas permeability cell system, Model CSI-135.
[9] Schofield, R. W., Fane, A. G., Fell, C. J. D., “Gas and vapor transport through
microporous membranes. I. Knudsen-Poiseuille transition”, Journal of Membrane
Science, Vol. 53, 1990, pp. 159-171.
[10] Schreuder-Gibson, H. L., Truong, Q., Walker, J. E., Owens, J. R., Wander, J. D.,
Jones Jr., W. E., “Chemical and biological protection and detection in fabrics for
protective clothing”, MRS Bulletin, August 2003, pp. 574-578.
[11] Shindo, Y., Hakuta, T., Yoshitome, H., Inoue, H., “Gas diffusion in microporous
media in Knudsen’s regime”, Journal of Chemical Engineering of Japan, Vol. 16,
No. 2, 1983, pp. 120-126.
[12] Stull, J. O., “Considerations for design and selection of chemical-protective
clothing”, Journal of Hazardous Materials, Vol. 14, 1987, pp. 165-189.
[13] Truong, Q. T., Wilusz, E., Rivin, D.,” Advanced Lightweight Chemical/Biological
Agent Protective Clothing Systems-Strengths and Limitations”, Membrane &
Separation Technology News, September 2004.

67
CHAPTER III
TRANSPORT BEHAVIOR OF MIMICS of WARFARE AGENTS THROUGH
POROUS MEMBRANES
Abstract
Permeation of chemical warfare agents through microporous membranes were studied
using their benign simulants. Gas transmission rate of these simulant gases (mimics) was
investigated experimentally and an evaporation model was constructed to evaluate the
evaporation rate of the mimic in liquid form and the effect of various parameters on the
flow of vapor through the membrane. Beta-pinene and prenol were used as mimics of
sarin and mustard gases, respectively. Experiments were conducted on PET and nylon
microporous membranes at different temperatures. These transmission experiments were
simulated utilizing the proposed evaporation model, and results were compared to
experimental data.
3.1. Introduction
Selectively permeable microporous membranes have been suggested as effective
barrier materials against toxic gases when assembled with other membranes or fabrics [8,
9]. These assemblies can provide protection against harmful molecules by the obstruction
created by the micropores, while they offer breathability to the skin for the comfort of the
wearer. To design such assemblies, it is necessary to understand the transport process
during permeation of toxic gases through such systems. In this study, it was assumed that
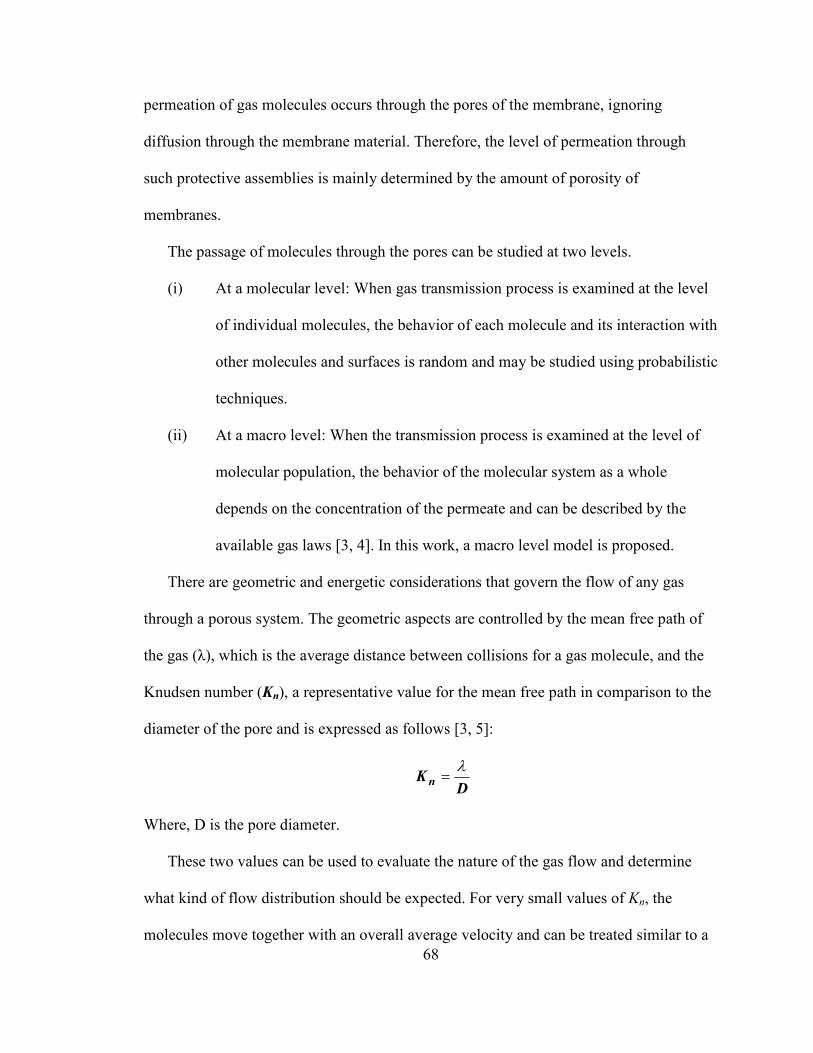
68
permeation of gas molecules occurs through the pores of the membrane, ignoring
diffusion through the membrane material. Therefore, the level of permeation through
such protective assemblies is mainly determined by the amount of porosity of
membranes.
The passage of molecules through the pores can be studied at two levels.
(i) At a molecular level: When gas transmission process is examined at the level
of individual molecules, the behavior of each molecule and its interaction with
other molecules and surfaces is random and may be studied using probabilistic
techniques.
(ii) At a macro level: When the transmission process is examined at the level of
molecular population, the behavior of the molecular system as a whole
depends on the concentration of the permeate and can be described by the
available gas laws [3, 4]. In this work, a macro level model is proposed.
There are geometric and energetic considerations that govern the flow of any gas
through a porous system. The geometric aspects are controlled by the mean free path of
the gas (λ), which is the average distance between collisions for a gas molecule, and the
Knudsen number (Kn), a representative value for the mean free path in comparison to the
diameter of the pore and is expressed as follows [3, 5]:
DKn
λ=
Where, D is the pore diameter.
These two values can be used to evaluate the nature of the gas flow and determine
what kind of flow distribution should be expected. For very small values of Kn, the
molecules move together with an overall average velocity and can be treated similar to a

69
liquid flow inside a tube [3]. In this case, Maxwell-Stefan and Navier Stokes equations
are adequate to evaluate the permeation characteristics. As the value of the Knudsen
number gets larger, the continuum assumptions break down, the gas no longer has an
overall mass velocity or diffusion behavior and individual molecule-wall collisions
become significant (Knudsen flow) [2]. Although Kn, by itself, cannot be used to
determine the type of flow, it is acceptable to consider the flow as either Knudsen if
Kn>10 or viscous if Kn<0.01 [2].
Most of the permeation models use generalized gas laws to estimate permeation rates,
while some use molecular simulations and look at movements of individual molecules in
the gas flow. This study combined both approaches and investigated the random behavior
of molecules inside the gas flow as well as using generalized gas laws to estimate
permeation through membranes, to obtain a better understanding of the transport process
based on actual conditions of the flow. Knudsen number was used in this study to
evaluate the nature of the flow and as a reference to determine and construct the
appropriate permeation model to be used to estimate the transmission rate.
3.2. Materials
Due to the highly toxic nature of warfare agents, they cannot be used in experimental
settings in a laboratory without major precautions. Therefore, it is important to select
benign chemicals as simulants of warfare agents, which are comparably similar to these
toxic gases in molecular size, shape, composition or other physical properties. For this
purpose, mimics of chemical warfare agents such as mustard and sarin have been
obtained for this study in a liquid form and evaporated to study them as gases.

70
Mimics were mainly selected from chemicals used in flavor and perfume industry for
food and cosmetics which were tested and approved regarding their benign character in
case of interaction with human body. Information obtained from Flavor and Essence
Manufacturers Association (FEMA) and Research Institute for Fragrance Materials
(RIFM) regarding the toxicity of these chemicals confirmed that these chemicals had
ideal properties for this type of studies and did not cause any harm to the researchers due
to their tailored applications in foods or perfumes, their evaporation properties and
average lifetime in their environment.
Selected mimics included beta-pinene, a molecule with an almost spherical shape and
can be used as a mimic of organophosphoric compounds such as the toxic sarin agent. Its
“ball-like” shape is also comparable to sarin in geometry. Its molecular weight and
molecular diameter are also comparable to sarin as shown in Table 3.1. Other mimics
selected for use in this study was methional and 3-methyl-2-butene-1-ol (prenol).
Methional was found naturally in vegetables, such as tomatoes, and used as flavoring
agent in food industry. Prenol also has a fruity odor and is used in the perfume industry.
These mimics both have a “stick-like” shape which is comparable to mustard gas and
some of its derivates. The molecular diameters are also comparable to mustard as shown
in Table 3.1. The vapor pressures of these mimics were also compared to the warfare
agents during selection. Vapor pressure of β-pinene and prenol are shown in Figure 3.5
and 3.6, respectively.
The molecular morphology of toxic gases and mimics were drawn and molecular
diameters were calculated using a Pymol (2005 DeLano Scientific LLC) software
program as shown in Figure 3.1-3.4 and listed in Table 3.1. respectively.
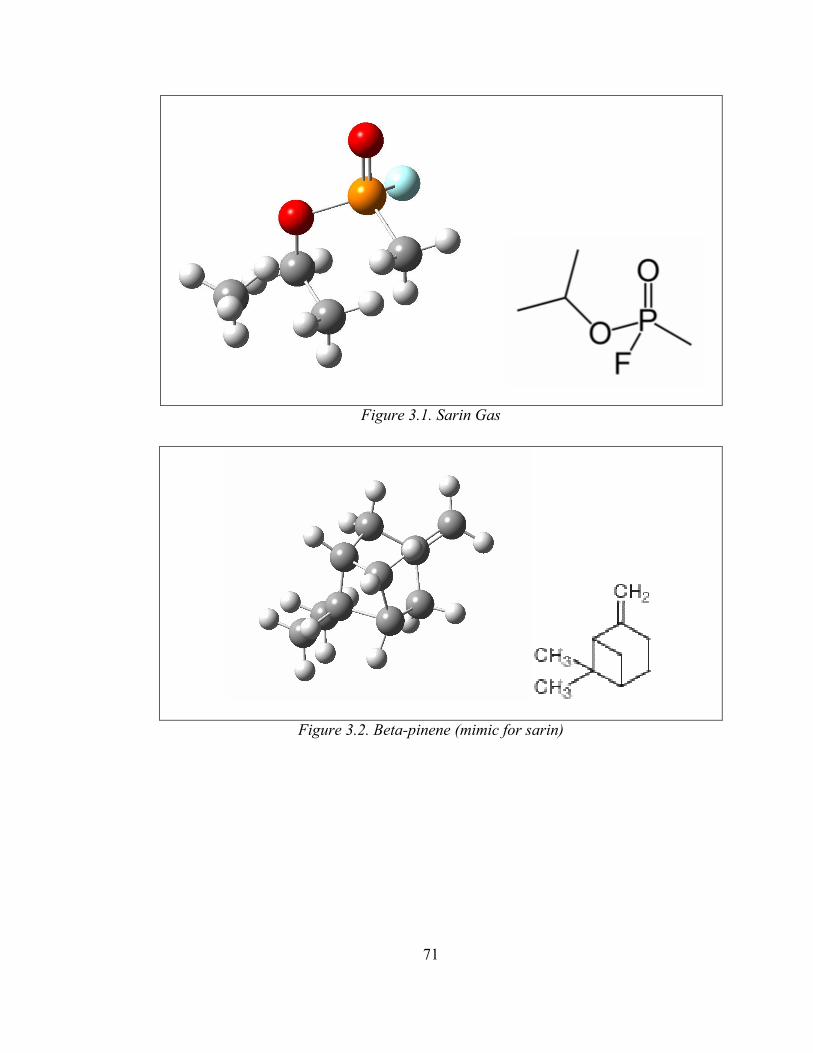
71
Figure 3.1. Sarin Gas
Figure 3.2. Beta-pinene (mimic for sarin)
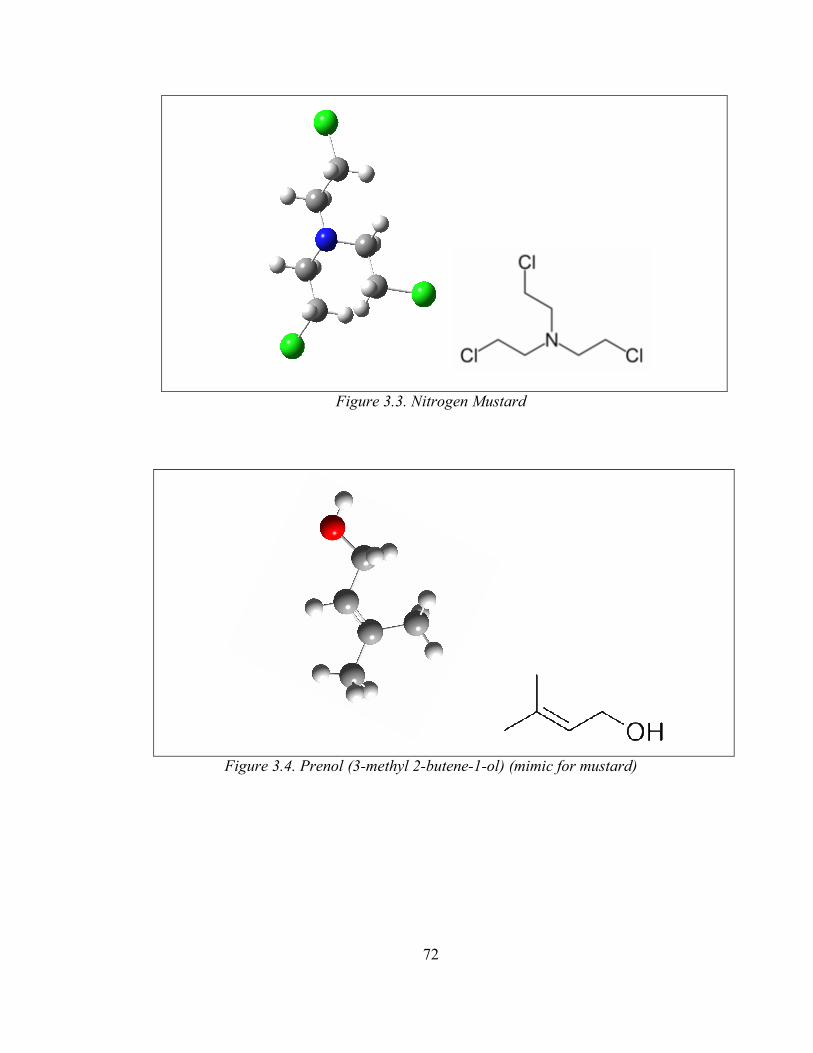
72
Figure 3.3. Nitrogen Mustard
Figure 3.4. Prenol (3-methyl 2-butene-1-ol) (mimic for mustard)
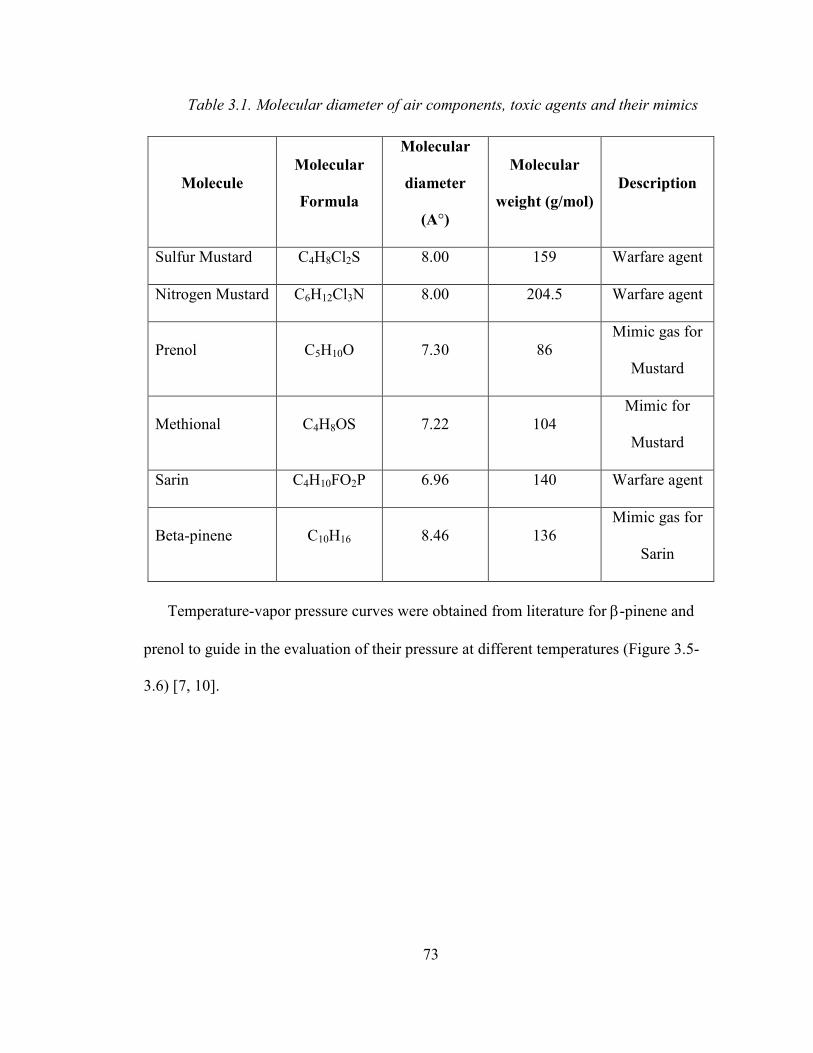
73
Table 3.1. Molecular diameter of air components, toxic agents and their mimics
Molecule Molecular
Formula
Molecular
diameter
(A°)
Molecular
weight (g/mol) Description
Sulfur Mustard C4H8Cl2S 8.00 159 Warfare agent
Nitrogen Mustard C6H12Cl3N 8.00 204.5 Warfare agent
Prenol C5H10O 7.30 86 Mimic gas for
Mustard
Methional C4H8OS 7.22 104 Mimic for
Mustard
Sarin C4H10FO2P 6.96 140 Warfare agent
Beta-pinene C10H16 8.46 136 Mimic gas for
Sarin
Temperature-vapor pressure curves were obtained from literature for β-pinene and
prenol to guide in the evaluation of their pressure at different temperatures (Figure 3.5-
3.6) [7, 10].
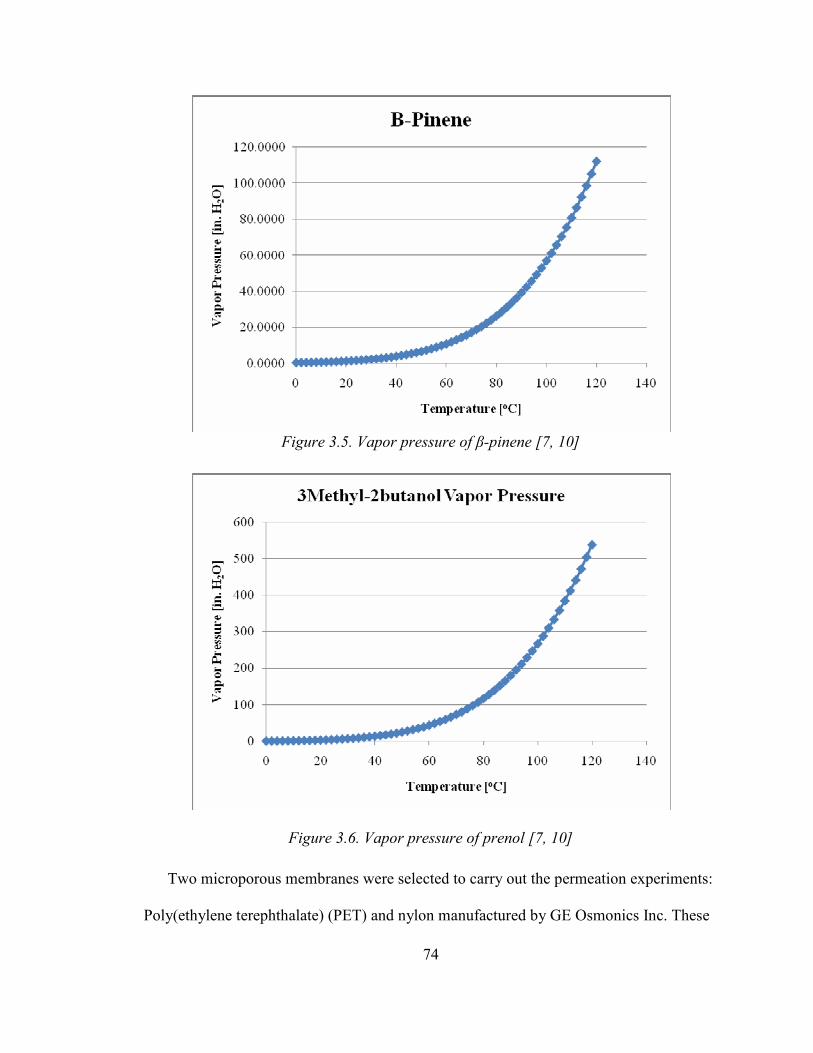
74
Figure 3.5. Vapor pressure of β-pinene [7, 10]
Figure 3.6. Vapor pressure of prenol [7, 10]
Two microporous membranes were selected to carry out the permeation experiments:
Poly(ethylene terephthalate) (PET) and nylon manufactured by GE Osmonics Inc. These
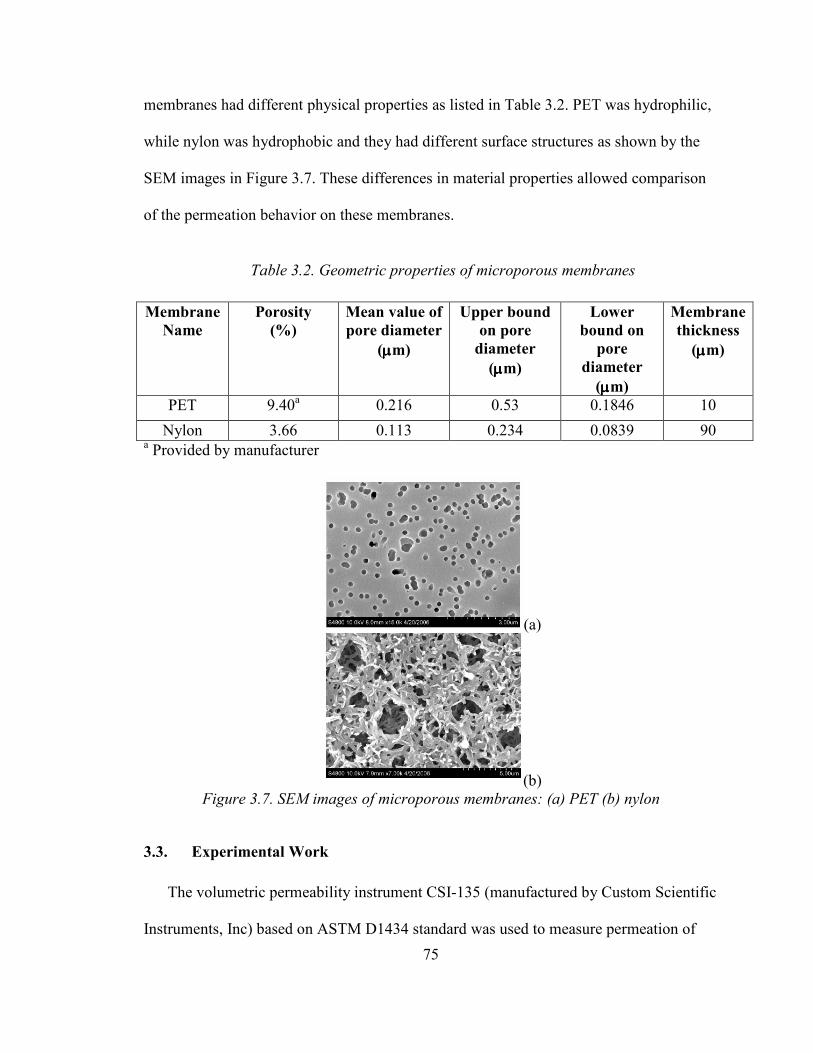
75
membranes had different physical properties as listed in Table 3.2. PET was hydrophilic,
while nylon was hydrophobic and they had different surface structures as shown by the
SEM images in Figure 3.7. These differences in material properties allowed comparison
of the permeation behavior on these membranes.
Table 3.2. Geometric properties of microporous membranes
Membrane Name
Porosity (%)
Mean value of pore diameter
(µµµµm)
Upper bound on pore
diameter (µµµµm)
Lower bound on
pore diameter
(µµµµm)
Membrane thickness
(µµµµm)
PET 9.40a 0.216 0.53 0.1846 10
Nylon 3.66 0.113 0.234 0.0839 90 a Provided by manufacturer
(a)
(b) Figure 3.7. SEM images of microporous membranes: (a) PET (b) nylon
3.3. Experimental Work
The volumetric permeability instrument CSI-135 (manufactured by Custom Scientific
Instruments, Inc) based on ASTM D1434 standard was used to measure permeation of
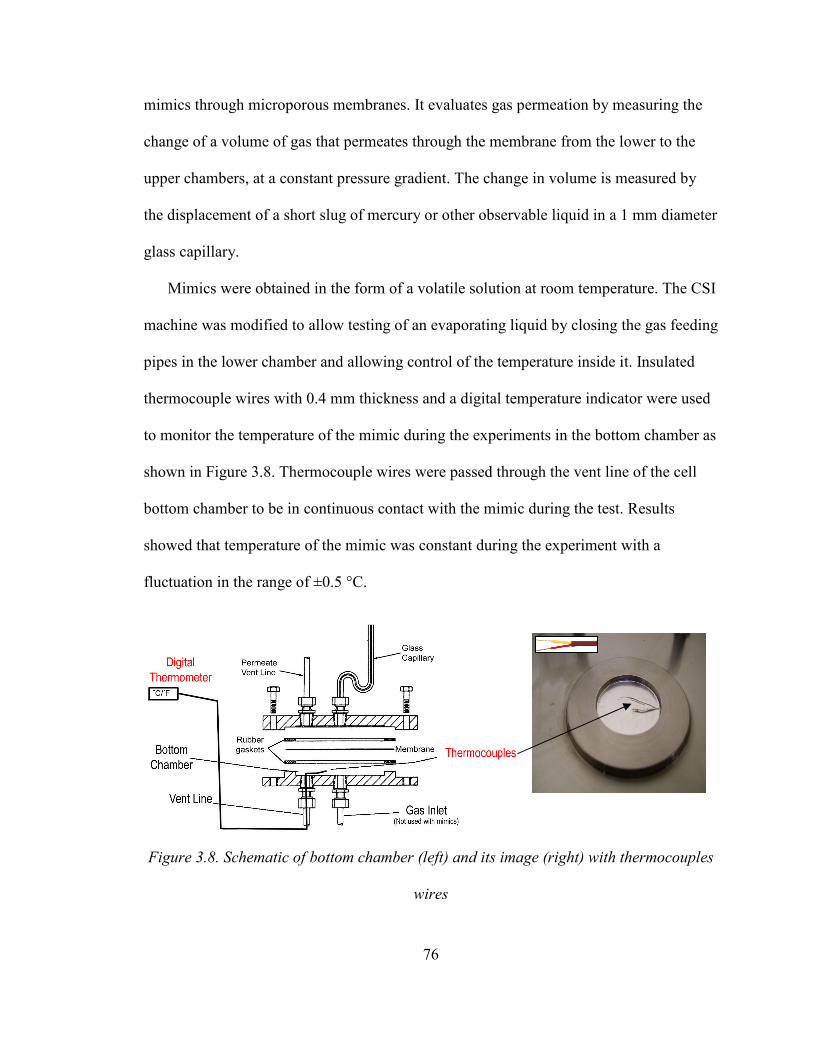
76
mimics through microporous membranes. It evaluates gas permeation by measuring the
change of a volume of gas that permeates through the membrane from the lower to the
upper chambers, at a constant pressure gradient. The change in volume is measured by
the displacement of a short slug of mercury or other observable liquid in a 1 mm diameter
glass capillary.
Mimics were obtained in the form of a volatile solution at room temperature. The CSI
machine was modified to allow testing of an evaporating liquid by closing the gas feeding
pipes in the lower chamber and allowing control of the temperature inside it. Insulated
thermocouple wires with 0.4 mm thickness and a digital temperature indicator were used
to monitor the temperature of the mimic during the experiments in the bottom chamber as
shown in Figure 3.8. Thermocouple wires were passed through the vent line of the cell
bottom chamber to be in continuous contact with the mimic during the test. Results
showed that temperature of the mimic was constant during the experiment with a
fluctuation in the range of ±0.5 °C.
Figure 3.8. Schematic of bottom chamber (left) and its image (right) with thermocouples
wires
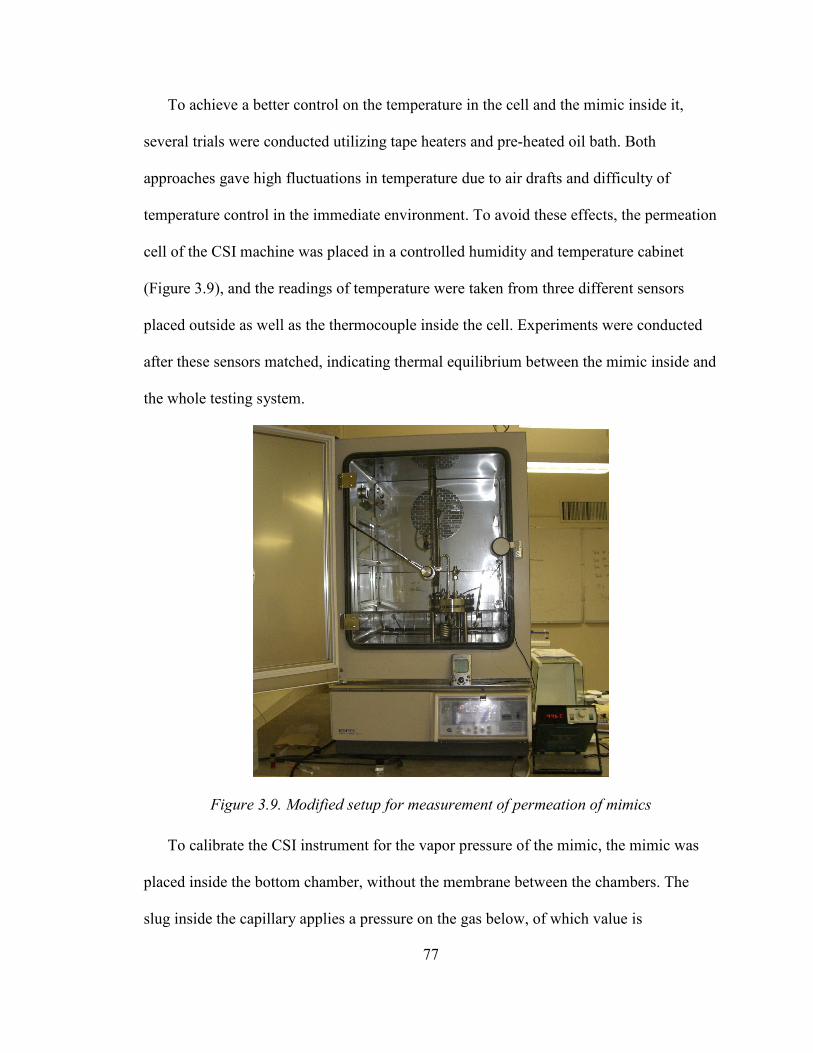
77
To achieve a better control on the temperature in the cell and the mimic inside it,
several trials were conducted utilizing tape heaters and pre-heated oil bath. Both
approaches gave high fluctuations in temperature due to air drafts and difficulty of
temperature control in the immediate environment. To avoid these effects, the permeation
cell of the CSI machine was placed in a controlled humidity and temperature cabinet
(Figure 3.9), and the readings of temperature were taken from three different sensors
placed outside as well as the thermocouple inside the cell. Experiments were conducted
after these sensors matched, indicating thermal equilibrium between the mimic inside and
the whole testing system.
Figure 3.9. Modified setup for measurement of permeation of mimics
To calibrate the CSI instrument for the vapor pressure of the mimic, the mimic was
placed inside the bottom chamber, without the membrane between the chambers. The
slug inside the capillary applies a pressure on the gas below, of which value is
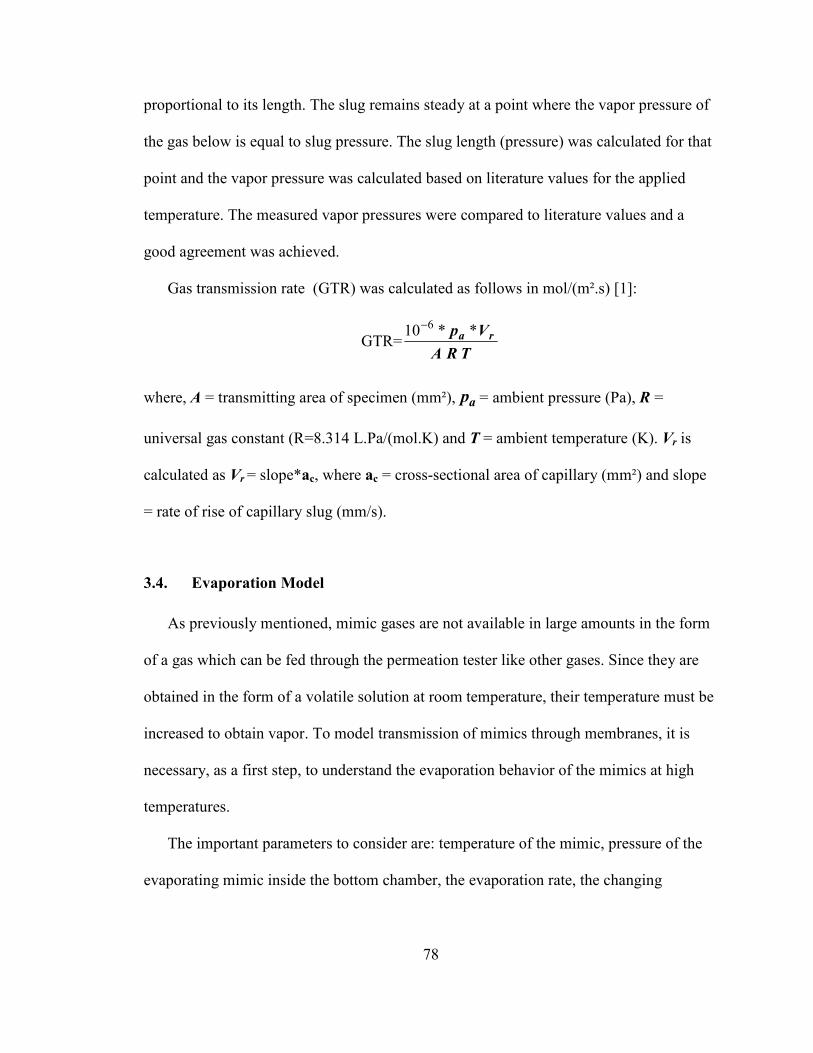
78
proportional to its length. The slug remains steady at a point where the vapor pressure of
the gas below is equal to slug pressure. The slug length (pressure) was calculated for that
point and the vapor pressure was calculated based on literature values for the applied
temperature. The measured vapor pressures were compared to literature values and a
good agreement was achieved.
Gas transmission rate (GTR) was calculated as follows in mol/(m².s) [1]:
GTR=TRA
Vp ra **10 6−
where, A = transmitting area of specimen (mm²), ap = ambient pressure (Pa), R =
universal gas constant (R=8.314 L.Pa/(mol.K) and T = ambient temperature (K). Vr is
calculated as Vr = slope*ac, where ac = cross-sectional area of capillary (mm²) and slope
= rate of rise of capillary slug (mm/s).
3.4. Evaporation Model
As previously mentioned, mimic gases are not available in large amounts in the form
of a gas which can be fed through the permeation tester like other gases. Since they are
obtained in the form of a volatile solution at room temperature, their temperature must be
increased to obtain vapor. To model transmission of mimics through membranes, it is
necessary, as a first step, to understand the evaporation behavior of the mimics at high
temperatures.
The important parameters to consider are: temperature of the mimic, pressure of the
evaporating mimic inside the bottom chamber, the evaporation rate, the changing
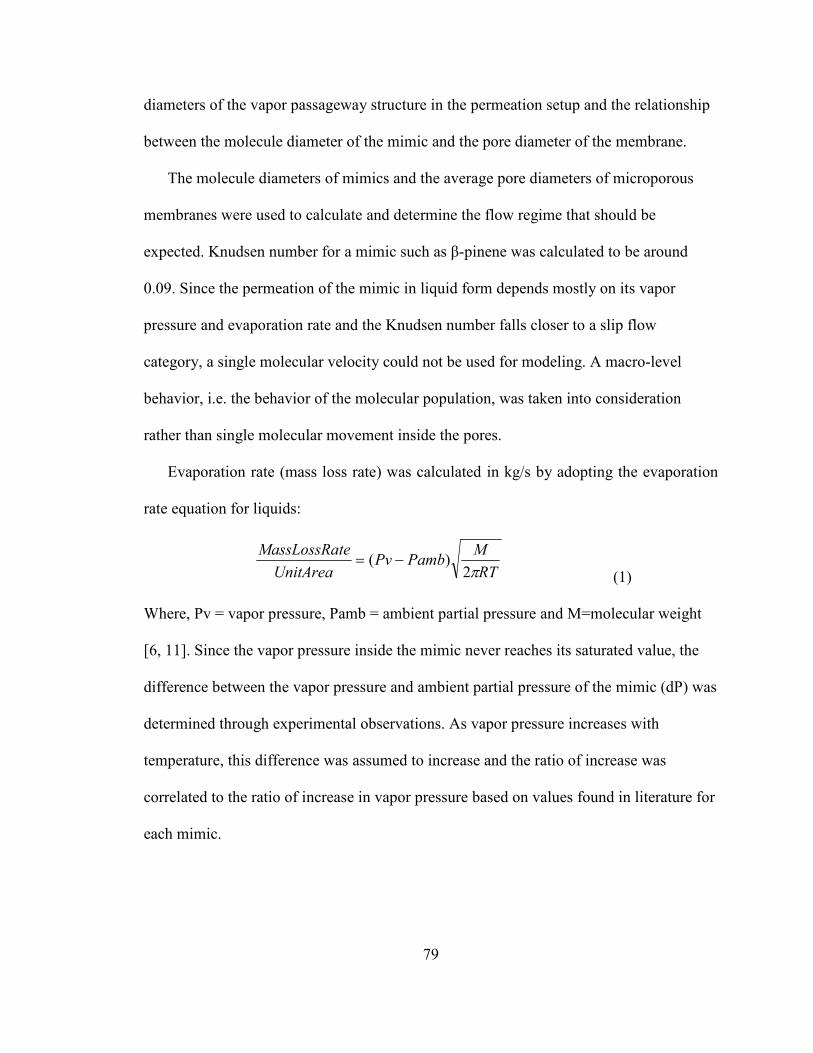
79
diameters of the vapor passageway structure in the permeation setup and the relationship
between the molecule diameter of the mimic and the pore diameter of the membrane.
The molecule diameters of mimics and the average pore diameters of microporous
membranes were used to calculate and determine the flow regime that should be
expected. Knudsen number for a mimic such as β-pinene was calculated to be around
0.09. Since the permeation of the mimic in liquid form depends mostly on its vapor
pressure and evaporation rate and the Knudsen number falls closer to a slip flow
category, a single molecular velocity could not be used for modeling. A macro-level
behavior, i.e. the behavior of the molecular population, was taken into consideration
rather than single molecular movement inside the pores.
Evaporation rate (mass loss rate) was calculated in kg/s by adopting the evaporation
rate equation for liquids:
RT
MPambPv
UnitArea
teMassLossRa
π2)( −=
(1)
Where, Pv = vapor pressure, Pamb = ambient partial pressure and M=molecular weight
[6, 11]. Since the vapor pressure inside the mimic never reaches its saturated value, the
difference between the vapor pressure and ambient partial pressure of the mimic (dP) was
determined through experimental observations. As vapor pressure increases with
temperature, this difference was assumed to increase and the ratio of increase was
correlated to the ratio of increase in vapor pressure based on values found in literature for
each mimic.
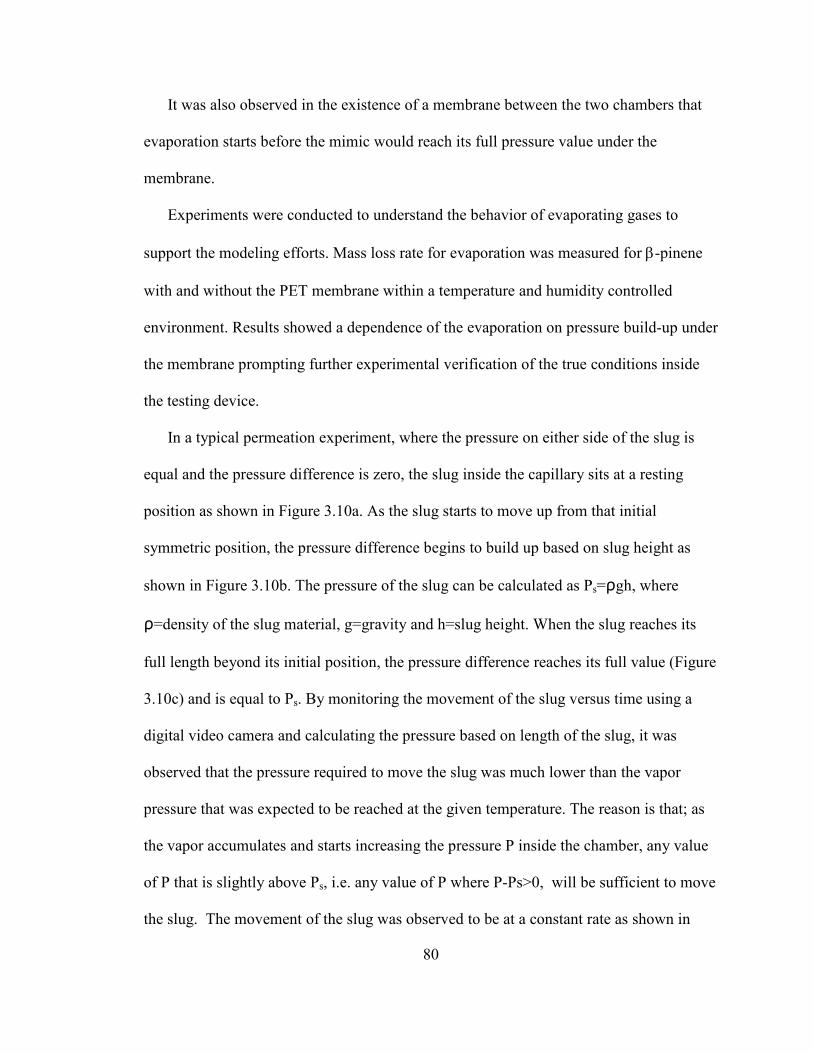
80
It was also observed in the existence of a membrane between the two chambers that
evaporation starts before the mimic would reach its full pressure value under the
membrane.
Experiments were conducted to understand the behavior of evaporating gases to
support the modeling efforts. Mass loss rate for evaporation was measured for β-pinene
with and without the PET membrane within a temperature and humidity controlled
environment. Results showed a dependence of the evaporation on pressure build-up under
the membrane prompting further experimental verification of the true conditions inside
the testing device.
In a typical permeation experiment, where the pressure on either side of the slug is
equal and the pressure difference is zero, the slug inside the capillary sits at a resting
position as shown in Figure 3.10a. As the slug starts to move up from that initial
symmetric position, the pressure difference begins to build up based on slug height as
shown in Figure 3.10b. The pressure of the slug can be calculated as Ps=ρgh, where
ρ=density of the slug material, g=gravity and h=slug height. When the slug reaches its
full length beyond its initial position, the pressure difference reaches its full value (Figure
3.10c) and is equal to Ps. By monitoring the movement of the slug versus time using a
digital video camera and calculating the pressure based on length of the slug, it was
observed that the pressure required to move the slug was much lower than the vapor
pressure that was expected to be reached at the given temperature. The reason is that; as
the vapor accumulates and starts increasing the pressure P inside the chamber, any value
of P that is slightly above Ps, i.e. any value of P where P-Ps>0, will be sufficient to move
the slug. The movement of the slug was observed to be at a constant rate as shown in

81
Figure 3.11. Hence the rate of evaporation was calculated based on the pressure required
to move the slug rather than the expected vapor pressure.
Figure 3.10. Slug movement versus Pressure relationship
y = 1.30E-02x + 6.10E-01
0
10
20
30
40
50
60
70
80
90
1200 2200 3200 4200 5200 6200 7200
Time (s)
dP
(P
a)
Figure 3.11. Pressure versus time during slug movement due to evaporation of mimics
Another experiment was conducted to support the modeling effort, to evaluate the
effect of the existence of an orifice on the evaporation rate for a given volume of β-
pinene inside a closed and open beaker at the same temperature levels. Since the gas is
traveling through a sample of 1 inch diameter and reaching a capillary of 1 mm diameter,
(a) (b) (c)
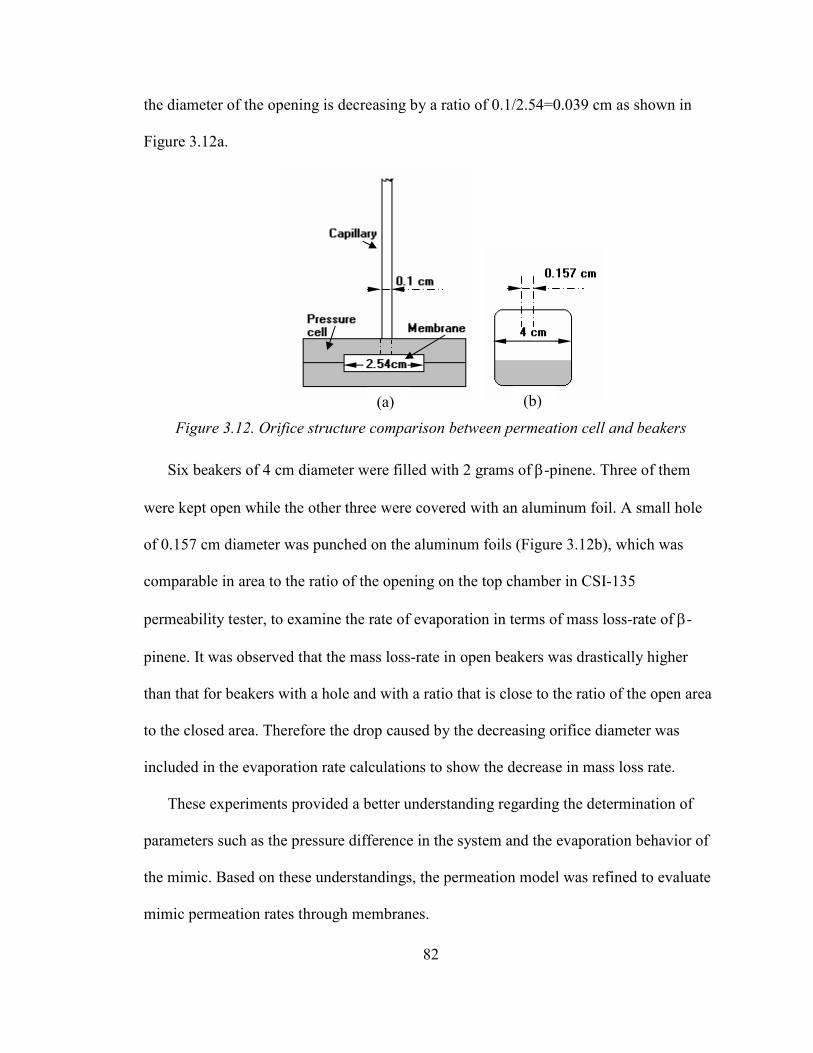
82
the diameter of the opening is decreasing by a ratio of 0.1/2.54=0.039 cm as shown in
Figure 3.12a.
Figure 3.12. Orifice structure comparison between permeation cell and beakers
Six beakers of 4 cm diameter were filled with 2 grams of β-pinene. Three of them
were kept open while the other three were covered with an aluminum foil. A small hole
of 0.157 cm diameter was punched on the aluminum foils (Figure 3.12b), which was
comparable in area to the ratio of the opening on the top chamber in CSI-135
permeability tester, to examine the rate of evaporation in terms of mass loss-rate of β-
pinene. It was observed that the mass loss-rate in open beakers was drastically higher
than that for beakers with a hole and with a ratio that is close to the ratio of the open area
to the closed area. Therefore the drop caused by the decreasing orifice diameter was
included in the evaporation rate calculations to show the decrease in mass loss rate.
These experiments provided a better understanding regarding the determination of
parameters such as the pressure difference in the system and the evaporation behavior of
the mimic. Based on these understandings, the permeation model was refined to evaluate
mimic permeation rates through membranes.
(a) (b)
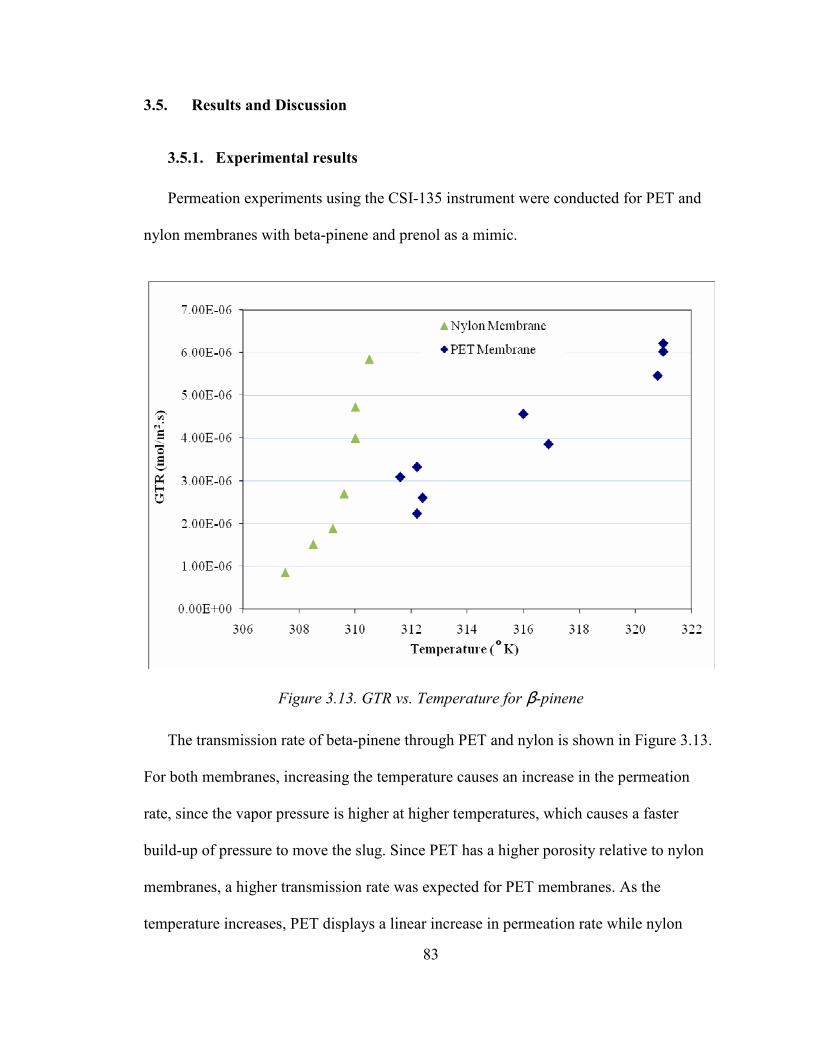
83
3.5. Results and Discussion
3.5.1. Experimental results
Permeation experiments using the CSI-135 instrument were conducted for PET and
nylon membranes with beta-pinene and prenol as a mimic.
Figure 3.13. GTR vs. Temperature for β-pinene
The transmission rate of beta-pinene through PET and nylon is shown in Figure 3.13.
For both membranes, increasing the temperature causes an increase in the permeation
rate, since the vapor pressure is higher at higher temperatures, which causes a faster
build-up of pressure to move the slug. Since PET has a higher porosity relative to nylon
membranes, a higher transmission rate was expected for PET membranes. As the
temperature increases, PET displays a linear increase in permeation rate while nylon
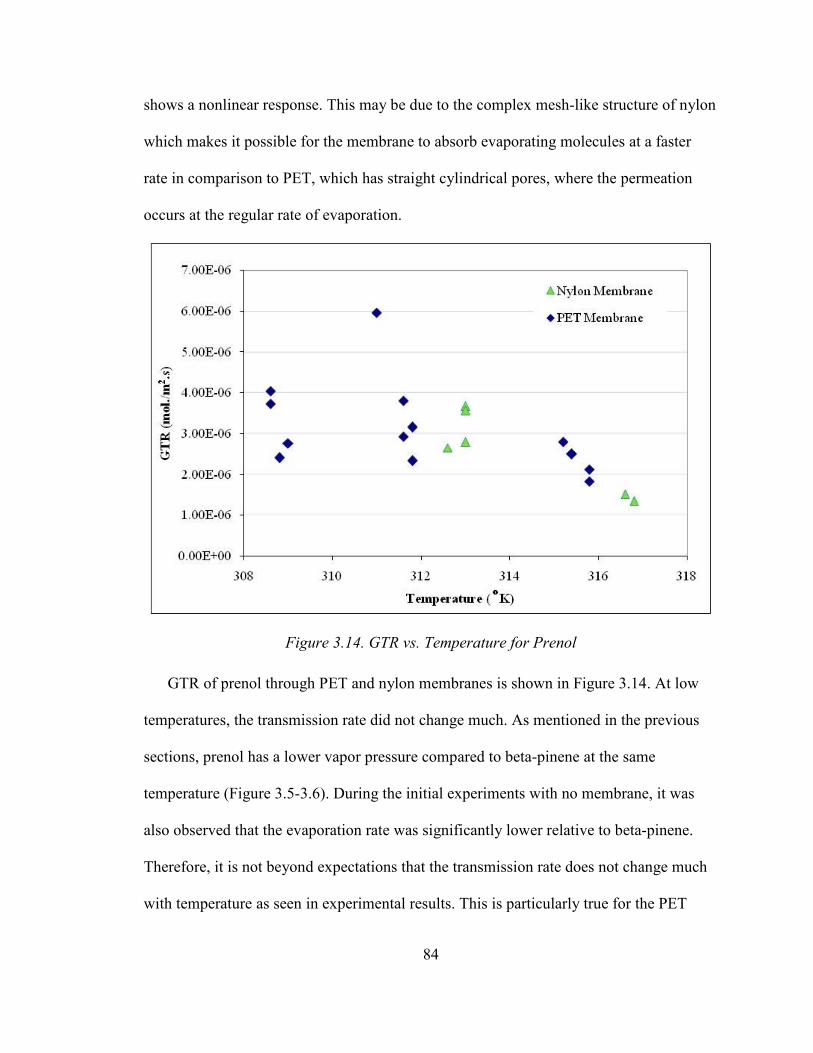
84
shows a nonlinear response. This may be due to the complex mesh-like structure of nylon
which makes it possible for the membrane to absorb evaporating molecules at a faster
rate in comparison to PET, which has straight cylindrical pores, where the permeation
occurs at the regular rate of evaporation.
Figure 3.14. GTR vs. Temperature for Prenol
GTR of prenol through PET and nylon membranes is shown in Figure 3.14. At low
temperatures, the transmission rate did not change much. As mentioned in the previous
sections, prenol has a lower vapor pressure compared to beta-pinene at the same
temperature (Figure 3.5-3.6). During the initial experiments with no membrane, it was
also observed that the evaporation rate was significantly lower relative to beta-pinene.
Therefore, it is not beyond expectations that the transmission rate does not change much
with temperature as seen in experimental results. This is particularly true for the PET
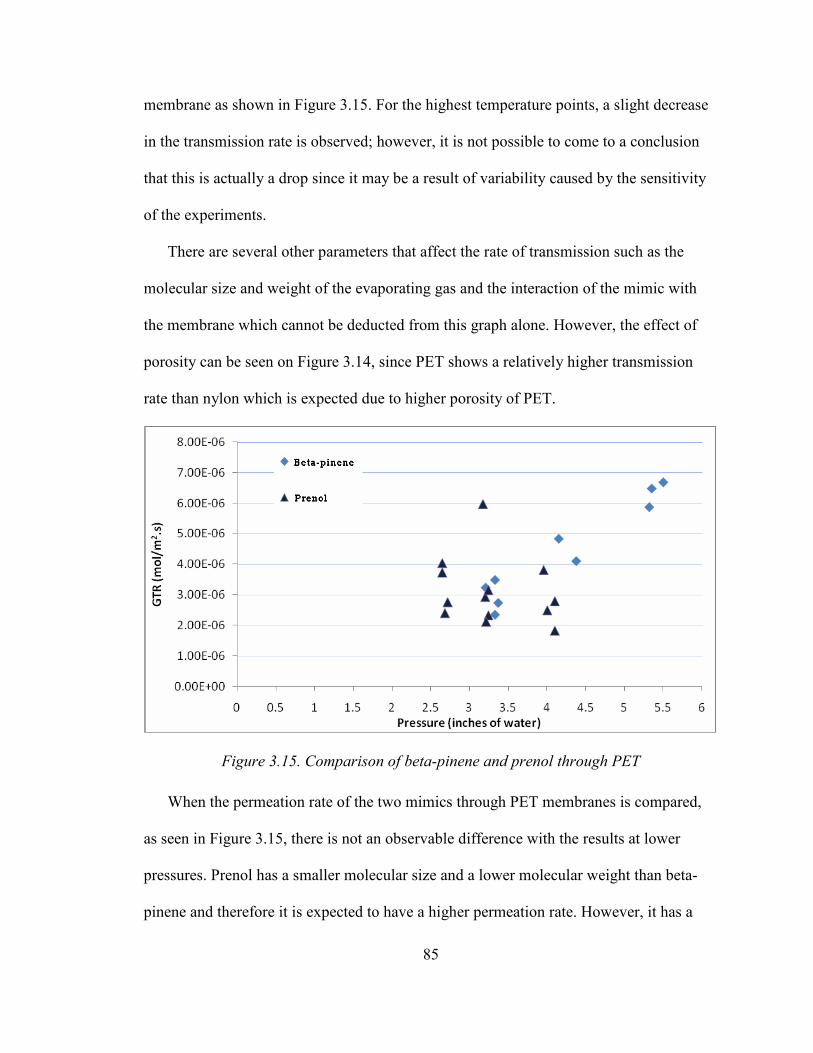
85
membrane as shown in Figure 3.15. For the highest temperature points, a slight decrease
in the transmission rate is observed; however, it is not possible to come to a conclusion
that this is actually a drop since it may be a result of variability caused by the sensitivity
of the experiments.
There are several other parameters that affect the rate of transmission such as the
molecular size and weight of the evaporating gas and the interaction of the mimic with
the membrane which cannot be deducted from this graph alone. However, the effect of
porosity can be seen on Figure 3.14, since PET shows a relatively higher transmission
rate than nylon which is expected due to higher porosity of PET.
Figure 3.15. Comparison of beta-pinene and prenol through PET
When the permeation rate of the two mimics through PET membranes is compared,
as seen in Figure 3.15, there is not an observable difference with the results at lower
pressures. Prenol has a smaller molecular size and a lower molecular weight than beta-
pinene and therefore it is expected to have a higher permeation rate. However, it has a
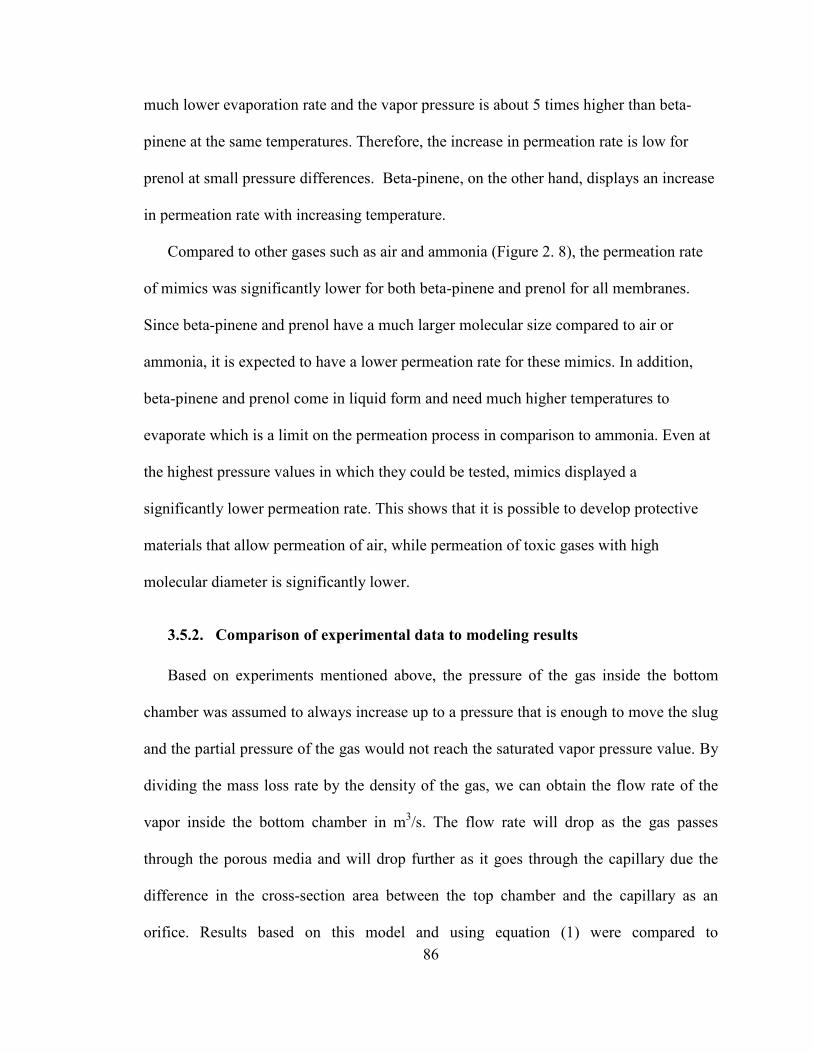
86
much lower evaporation rate and the vapor pressure is about 5 times higher than beta-
pinene at the same temperatures. Therefore, the increase in permeation rate is low for
prenol at small pressure differences. Beta-pinene, on the other hand, displays an increase
in permeation rate with increasing temperature.
Compared to other gases such as air and ammonia (Figure 2. 8), the permeation rate
of mimics was significantly lower for both beta-pinene and prenol for all membranes.
Since beta-pinene and prenol have a much larger molecular size compared to air or
ammonia, it is expected to have a lower permeation rate for these mimics. In addition,
beta-pinene and prenol come in liquid form and need much higher temperatures to
evaporate which is a limit on the permeation process in comparison to ammonia. Even at
the highest pressure values in which they could be tested, mimics displayed a
significantly lower permeation rate. This shows that it is possible to develop protective
materials that allow permeation of air, while permeation of toxic gases with high
molecular diameter is significantly lower.
3.5.2. Comparison of experimental data to modeling results
Based on experiments mentioned above, the pressure of the gas inside the bottom
chamber was assumed to always increase up to a pressure that is enough to move the slug
and the partial pressure of the gas would not reach the saturated vapor pressure value. By
dividing the mass loss rate by the density of the gas, we can obtain the flow rate of the
vapor inside the bottom chamber in m3/s. The flow rate will drop as the gas passes
through the porous media and will drop further as it goes through the capillary due the
difference in the cross-section area between the top chamber and the capillary as an
orifice. Results based on this model and using equation (1) were compared to
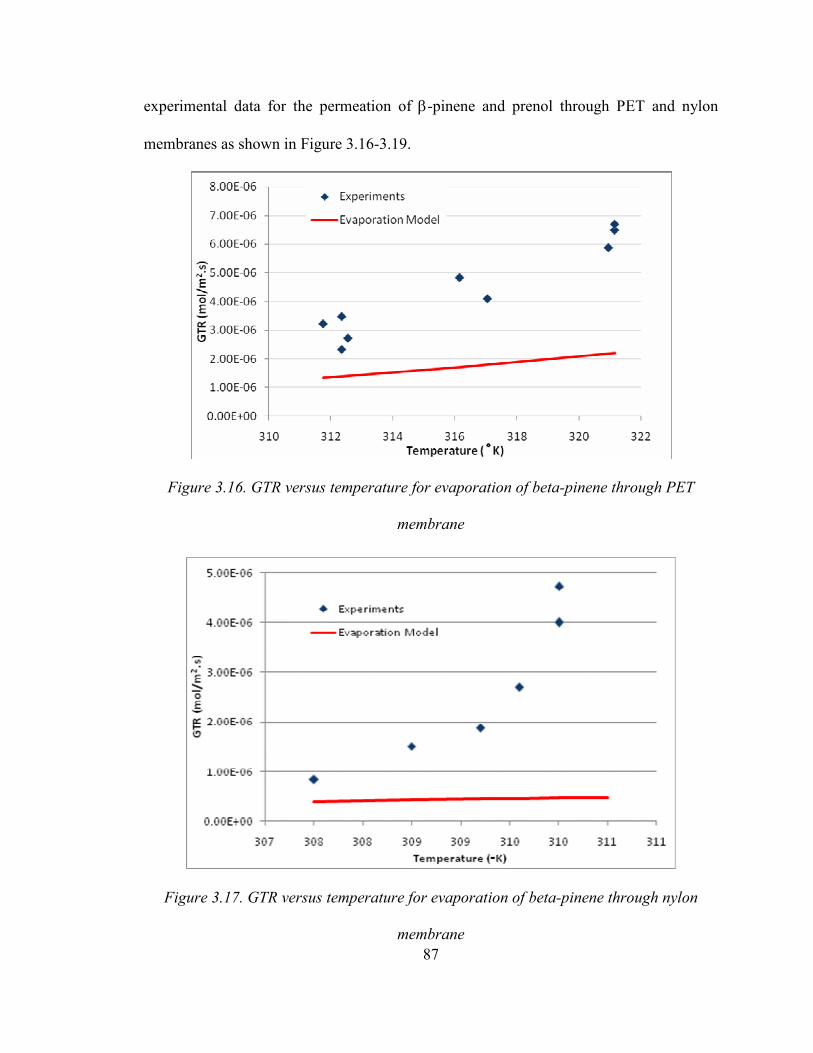
87
experimental data for the permeation of β-pinene and prenol through PET and nylon
membranes as shown in Figure 3.16-3.19.
Figure 3.16. GTR versus temperature for evaporation of beta-pinene through PET
membrane
Figure 3.17. GTR versus temperature for evaporation of beta-pinene through nylon
membrane

88
Figure 3.18. GTR versus temperature for evaporation of prenol through PET membrane
It can be seen from Figure 3.16 that the estimated permeation rate using the
evaporation model has an acceptable correlation with permeation of beta-pinene through
the PET membranes. The results are particularly close at low temperatures, while there is
a higher deviation at higher temperatures. The linear increase of transmission rate
obtained during the experiments was similar to the results obtained by the evaporation
model which was based on the increase in temperature. On the other hand, for nylon as
shown in Figure 3.17, the model estimated a lower permeation rate compared to PET,
which was originally expected due to lower porosity and higher thickness of nylon
relative to PET. However, the experimental results were higher and did not show a linear
increase of the transmission rate with temperature unlike the model estimates. This could
be a result of the high tortousity and mesh-like structure of nylon, which could not be
considered in the model.
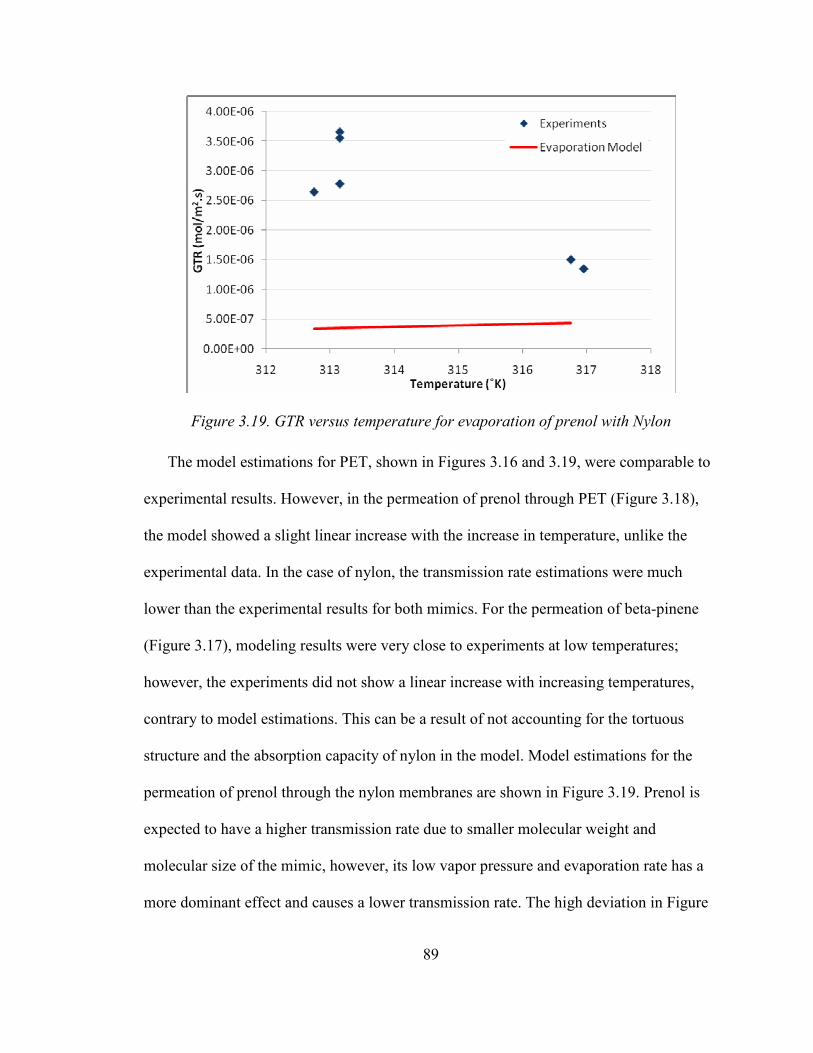
89
Figure 3.19. GTR versus temperature for evaporation of prenol with Nylon
The model estimations for PET, shown in Figures 3.16 and 3.19, were comparable to
experimental results. However, in the permeation of prenol through PET (Figure 3.18),
the model showed a slight linear increase with the increase in temperature, unlike the
experimental data. In the case of nylon, the transmission rate estimations were much
lower than the experimental results for both mimics. For the permeation of beta-pinene
(Figure 3.17), modeling results were very close to experiments at low temperatures;
however, the experiments did not show a linear increase with increasing temperatures,
contrary to model estimations. This can be a result of not accounting for the tortuous
structure and the absorption capacity of nylon in the model. Model estimations for the
permeation of prenol through the nylon membranes are shown in Figure 3.19. Prenol is
expected to have a higher transmission rate due to smaller molecular weight and
molecular size of the mimic, however, its low vapor pressure and evaporation rate has a
more dominant effect and causes a lower transmission rate. The high deviation in Figure

90
3.19 can be a result of a combination of these mutually-exclusive effects of mimic
properties and the complex morphology of the nylon membranes.
Experimental results for mimics showed some variability at the same temperature,
due to the complex nature of the vapor and the sensitivity of the experimental setup.
However, it is expected that as the temperature increases the transmission rate of the gas
will increase due to an increasing vapor pressure and higher evaporation rate. The
evaporation model showed reasonable correlation with the experimental data with an
expected increase of GTR at increasing temperatures.
3.6. Conclusions
Gas transmission rate of mimics of warfare agents such as mustard and sarin was
studied experimentally and analytically. A volumetric air permeability tester was
modified to enable the measurement with mimics in liquid form. An evaporation model
was developed to calculate the permeation rates of mimic vapors through microporous
membranes at different temperatures based on the effect of evaporation rate of the mimic.
Results were compared to experimental data and showed an increase in gas transmission
rate with the increase in temperature. Acceptable correlations were observed between
experiments and the model. It can be concluded from this study that permeability
characteristics of membranes can be predicted more accurately for membranes with a
well-known morphology. It is also possible to improve barrier properties of membranes
for toxic gases with larger molecule diameters than air, while a higher level of air
permeation is still available.
91
3.7. References
[1] ASTM D 1434-82: Standard test method for determining gas permeability
characteristics of plastic film and sheeting, ASTM International, Reapproved 1998.
[2] Barber, R. W. and Emerson, D. R., “The influence of Knudsen number on the
hydrodynamic development length within parallel plate micro-channels”, Advances
in Fluid Mechanics IV, Eds. M. Rahman, R. Verhoeven, C.A. Brebbia, WIT Press,
Southampton, UK, 2002, pp. 207-216.
[3] Bird, R. B., Stewart, W. E., Lightfoot, E. N., Transport Phenomena, John Wiley &
Sons, Inc., New York, 2002.
[4] Cunningham, R. E. and Williams, R. J. J., Diffusion in Gases and Porous Media,
1980 Plenum Press, New York, 1980.
[5] Fried, J. R., Polymer Science and Technology, Englewood Cliffs, NJ: Prentice Hall,
1995.
[6] Jones, F. E., Evaporation of Water: with Emphasis on Applications and
Measurements, Chelsea, Mich. Lewis Publishers, c1992, pp.26-38
[7] Jordan, T. E., Vapor Pressure of Organic Compounds, New York, Interscience
Publishers, 1954.
[8] Stull, J. O., “Considerations for design and selection of chemical-protective
clothing”, Journal of Hazardous Materials, Vol. 14, 1987, pp. 165-189
[9] Truong, Q. T., Wilusz, E., Rivin, D., “Advanced lightweight chemical/biological
agent protective clothing systems: strengths and limitations”, Membrane &
Separation Technology News, September (2004)
[10] Yaws, C. L. Handbook of Vapor Pressure Vol. 3, Gulf Publications, 1994.
92
[11] Zemansky, M. W., Heat and Thermodynamics: an Intermediate Textbook for
Students of Physics, Chemistry, and Engineering, New York, McGraw-Hill, 1951.
93
CHAPTER IV
CHEMICAL ADSORPTION OF MICROPOROUS MEMBRANES COATED
WITH ACTIVE ELEMENTS
Abstract
Chemical warfare agents and toxic industrial chemicals were reviewed and several
toxins among these groups were selected for this study. Simulants of those toxins or
benign equivalents were obtained to use in experimental evaluations of the transmission
behavior of those chemicals through microporous membrane materials proposed for
chemical protection. To enable blockage of the toxic molecules by the protective material
surfaces, microporous membranes were treated with active elements which can interact
with the toxic gas molecules and prevent them from proceeding through the material. The
effect of physical and chemical adsorption of gases, such as ammonia, on gas
transmission rate was evaluated experimentally for membranes made of PET coated with
PGMA and activated with functional groups XL-I-177 and 5-azido-3-
oxapentanesulfonate by anchoring them on PET surface. XL-I-177 was selected for its
ability to interact with mustard gas or its mimic methional and 5-azido-3-
oxapentanesulfonate for its ability to capture NH3. A probabilistic chemisorption model
was developed to understand the transmission behavior of membranes in the presence of
active elements. Interaction potential of the active surfaces with selected gas molecules
were calculated using molecular modeling software Gaussian®. An experimental setup
was developed to measure gas concentration changes upon passage through active
94
membranes and results were compared to concentration behavior of membranes with no
active agents. Experimental results and probabilistic estimations were also compared to
understand the adsorption phenomena.
4.1. Introduction
Chemical Warfare Agents (CWA) and Toxic Industrial Chemicals (TIC) are toxins
that can become a threat to human population in the case of exposure and cause death or
irreparable damage to human body. CWA has been used often in recent history against
civilians as well as military personnel. Due to their fast and lethal results, all of these
toxins must be decontaminated or prevented from contact with the skin [2, 3].
CWAs can be categorized such as nerve gases (sarin, soman, tabun, etc.), blister
agents (mustard gas, lewisite, etc.), chocking agents (phosgene, chlorine), vomiting
agents (adamsite, etc.), blood agents (cyanide, cyanogen, etc.), tear gases and
incapacitating agents. Each category of gases causes damage or failure to different parts
of the body. TICs are usually categorized based on their toxic effect on human body and
their physical characteristics such as flammability, explosiveness, etc. [9].
Gases investigated in this study were mustard, a blister agent; sarin, a nerve agent and
ammonia a TIC with basic character which reacts violently with strong oxidants and
halogens.
The most common way to evaluate the performance of protective materials is to
measure their permeation rate for different gases. This information is useful in selection
of more resistant materials for protection.

95
4.2. Adsorption Phenomena
Adsorption is defined as the attachment of gases or liquids onto a solid surface [4].
Unlike absorption, adsorption occurs on the surface and does not cause the gases or
liquids to dissolve into another liquid or solid.
Adsorption of molecules onto a solid surface depends strictly on their energy state
close to that surface. When there is no energy loss, the molecules are considered to have
an elastic collision with the surface without bonding with it. If there is a small energy
loss, the collision is considered to be inelastic. When a sufficient energy loss occurs,
adsorption takes place. Adsorption may occur in the form of physical adsorption
(physisorption) or chemical adsorption (chemisorption). Physisorption occurs as a result
of a physical interaction between the gas and the solid and does not cause a change in the
electronic structure of the molecule. The gas and the solid are bonded with van der Waals
forces which can occur on multiple layers. Chemisorption is usually a result of strong
covalent or ionic bonds which requires higher adsorption energies and is not easily
reversible. It usually happens on adsorptive sites as a monolayer [1, 6, 10].
The adsorption energy or the energy loss required for adsorption is dependent on the
translational kinetic energy of the molecule (Ek) as well as the attraction between the
molecule and the surface which is related to the surface potential energy (Ep). If the
attraction between the molecule and the surface is higher than the kinetic energy of the
molecule (Ek≤Ep), the molecule is more likely to experience energy loss, i.e. lose its
kinetic energy and become adsorbed by the surface.
Energy loss of the molecules is a function of the distance of the molecule from the
solid surface [7]. As the molecules get closer to the surface, the attraction energy

96
increases and causes the molecule to lose its kinetic energy. At the distance, where the
kinetic energy becomes lower than the interaction energy between the molecule and the
surface, adsorption takes place [8]. Since chemisorption requires higher adsorption
energy, chemisorption of the molecule occurs at a closer distance to the surface than the
distance required for physisorption [1, 10]. Therefore, when there is strong attraction
between the gas and the solid surface, chemical adsorption has priority over physical
adsorption [6].
In the evaluation of adsorption behavior of a system reaching equilibrium, Langmuir
adsorption isotherm is most commonly used. For chemisorption, Langmuir isotherm
equation assumes that there are only a fixed number of sites available for adsorption each
of which can only be occupied by one molecule. At a constant temperature, there is a
dynamic equilibrium between the adsorbed layer and the gas at pressure P. The adsorbate
molecules are constantly colliding with the surface. If they collide with an available
adsorption site, they are adsorbed. If they collide with a filled adsorption site, they
bounce back into the gas phase without sticking on the surface. The fraction of coverage
on the surface can be written as follows:
N
N ads=θ
Where, Nads=number of adsorbed molecules and N=available active sites. Where all
sites are filled θ=1. At zero pressure, adsorption may be too slow and equilibrium may
not occur easily, while at higher pressures, the equilibrium can be reached at a faster rate
[1, 10].

97
4.3. Membrane and Gas Properties
A polymeric membrane made of PET with a pore size of 0.2 µm, porosity of 9.4%
and thickness of 10 microns was used in chemisorptions studies. The PET membrane was
selected for the attachment of functional groups which can act as active elements and
interact with the gas molecules to prevent them from proceeding into the membrane
layers. Modifications of PET membrane was carried out at Clemson University in which
plasma treated PET membranes were covered with an epoxy containing polymer poly
(glycidyl methacrylate) (PGMA) to modify its surface and create an anchoring layer. To
ensure that the pores on the membrane were not blocked by this treatment, PET grafted
with PGMA was tested for air permeability. No significant blockage of the pores was
observed during the experiments.
PGMA modified layers were, then, used for attachment of the functional groups on
the surface. A model chemical compound XL-I-177 (Figure 4.1) and another active
element with an acidic functionality 5-azido-3-oxapentanesulfonate (Figure 4.2) were
attached separately on the surfaces of PET microporous films.
Figure 4.1. Chemical structure of XL-I-177

98
Figure 4.2. Adsorption of NH3 on modified PET with 5-azido-3-oxapentanesulfonate
4.4. Modeling of Chemical and Physical Adsorption
To develop a permeation model which includes adsorption, it is necessary to
understand the attraction mechanism between the gas and the solid and define the
important parameters that affect adsorption and as a result affect the overall rate of
permeation on materials created with active elements. The important parameters to take
into consideration are the gas type, energy parameters between the surface and the
molecule, pore structure of the membrane, density of the active elements on the surface
and the number of molecules satisfying the adsorption conditions.
At the initial step of constructing the model, the energy requirements were
investigated and the minimum distances necessary for chemical and physical adsorption
were calculated for the condition Ek≤Ep. A geometric probabilistic approach was
adopted to calculate the amount of molecules attached to the surface until an adsorption
equilibrium state is reached.
4.4.1. Energy calculations
Molecular geometry optimization and energy calculations were done using
Gaussian® molecular modeling software for the toxic industrial chemical ammonia,
warfare agent mustard and its mimic prenol to enhance the understanding of their
adsorption mechanisms on the treated PET surface before and after being grafted with
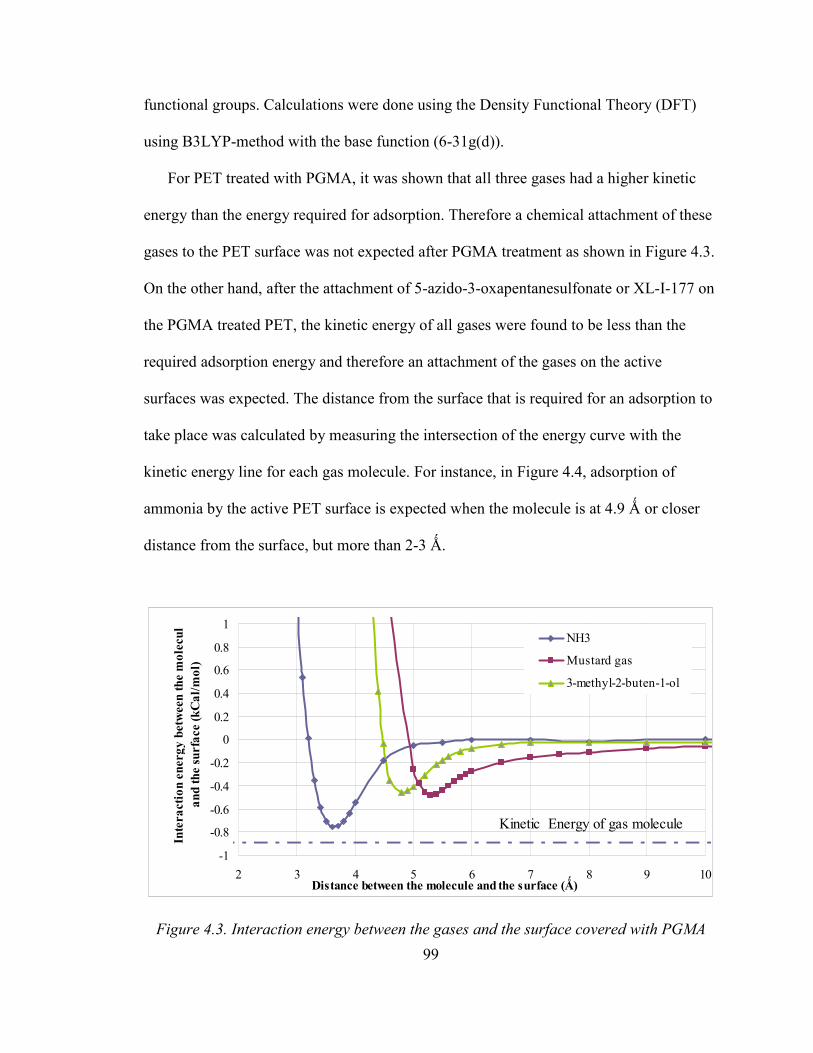
99
functional groups. Calculations were done using the Density Functional Theory (DFT)
using B3LYP-method with the base function (6-31g(d)).
For PET treated with PGMA, it was shown that all three gases had a higher kinetic
energy than the energy required for adsorption. Therefore a chemical attachment of these
gases to the PET surface was not expected after PGMA treatment as shown in Figure 4.3.
On the other hand, after the attachment of 5-azido-3-oxapentanesulfonate or XL-I-177 on
the PGMA treated PET, the kinetic energy of all gases were found to be less than the
required adsorption energy and therefore an attachment of the gases on the active
surfaces was expected. The distance from the surface that is required for an adsorption to
take place was calculated by measuring the intersection of the energy curve with the
kinetic energy line for each gas molecule. For instance, in Figure 4.4, adsorption of
ammonia by the active PET surface is expected when the molecule is at 4.9 Ǻ or closer
distance from the surface, but more than 2-3 Ǻ.
Figure 4.3. Interaction energy between the gases and the surface covered with PGMA
-1
-0.8
-0.6
-0.4
-0.2
0
0.2
0.4
0.6
0.8
1
2 3 4 5 6 7 8 9 10Distance between the molecule and the surface (Ǻ)
Inte
ract
ion
ener
gy b
etw
een
the
mol
ecul
e an
d th
e su
rfac
e (k
Cal
/mol
)
NH3
Mustard gas
3-methyl-2-buten-1-ol
Kinetic Energy of gas molecule
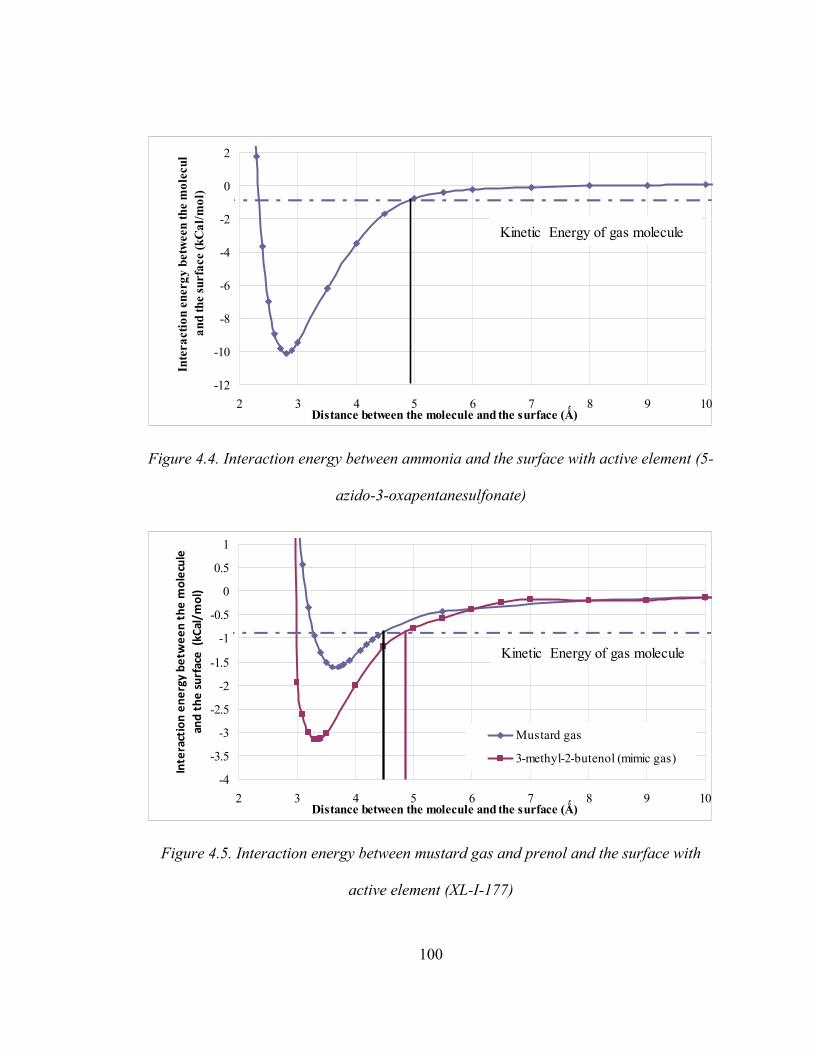
100
-12
-10
-8
-6
-4
-2
0
2
2 3 4 5 6 7 8 9 10Distance between the molecule and the surface (Ǻ)
Inte
ract
ion
ener
gy b
etw
een
the
mol
ecul
e an
d th
e su
rfac
e (k
Cal
/mol
)
Kinetic Energy of gas molecule
Figure 4.4. Interaction energy between ammonia and the surface with active element (5-
azido-3-oxapentanesulfonate)
-4
-3.5
-3
-2.5
-2
-1.5
-1
-0.5
0
0.5
1
2 3 4 5 6 7 8 9 10Distance between the molecule and the surface (Ǻ)
Inte
ract
ion
en
erg
y b
etw
ee
n t
he
mo
lecu
le
an
d t
he
su
rfa
ce
(kC
al/
mo
l)
Mustard gas
3-methyl-2-butenol (mimic gas)
Kinetic Energy of gas molecule
Figure 4.5. Interaction energy between mustard gas and prenol and the surface with
active element (XL-I-177)
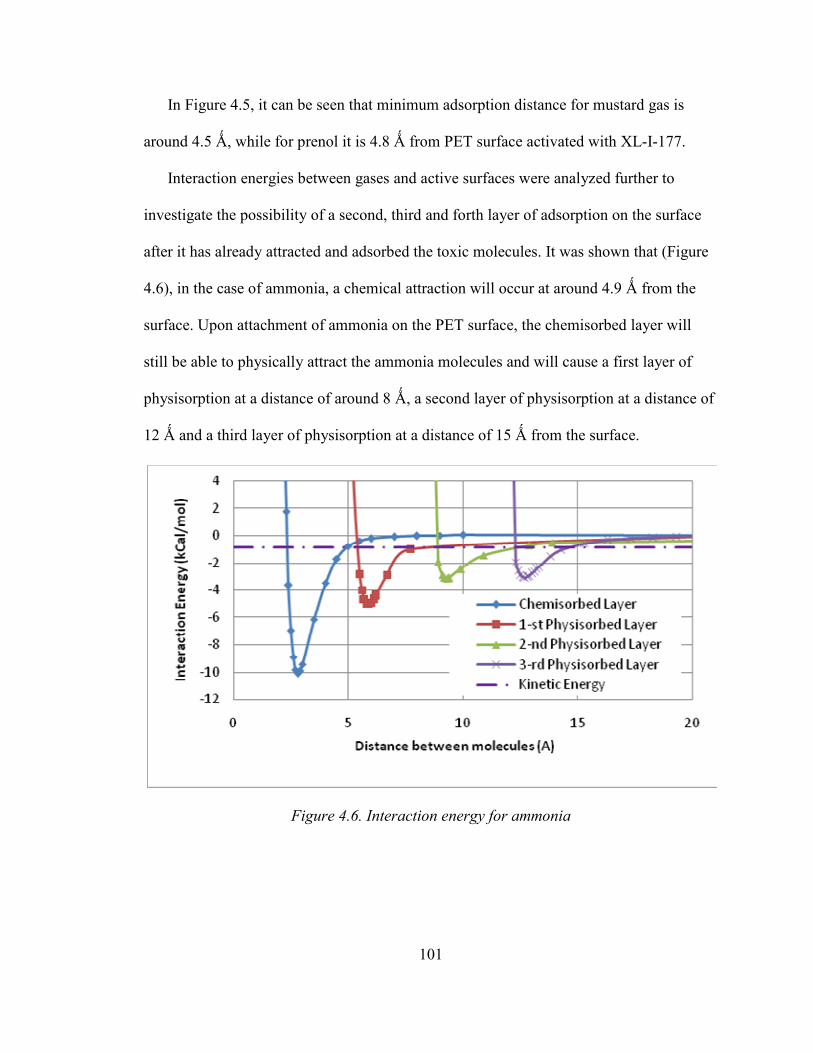
101
In Figure 4.5, it can be seen that minimum adsorption distance for mustard gas is
around 4.5 Ǻ, while for prenol it is 4.8 Ǻ from PET surface activated with XL-I-177.
Interaction energies between gases and active surfaces were analyzed further to
investigate the possibility of a second, third and forth layer of adsorption on the surface
after it has already attracted and adsorbed the toxic molecules. It was shown that (Figure
4.6), in the case of ammonia, a chemical attraction will occur at around 4.9 Ǻ from the
surface. Upon attachment of ammonia on the PET surface, the chemisorbed layer will
still be able to physically attract the ammonia molecules and will cause a first layer of
physisorption at a distance of around 8 Ǻ, a second layer of physisorption at a distance of
12 Ǻ and a third layer of physisorption at a distance of 15 Ǻ from the surface.
Figure 4.6. Interaction energy for ammonia
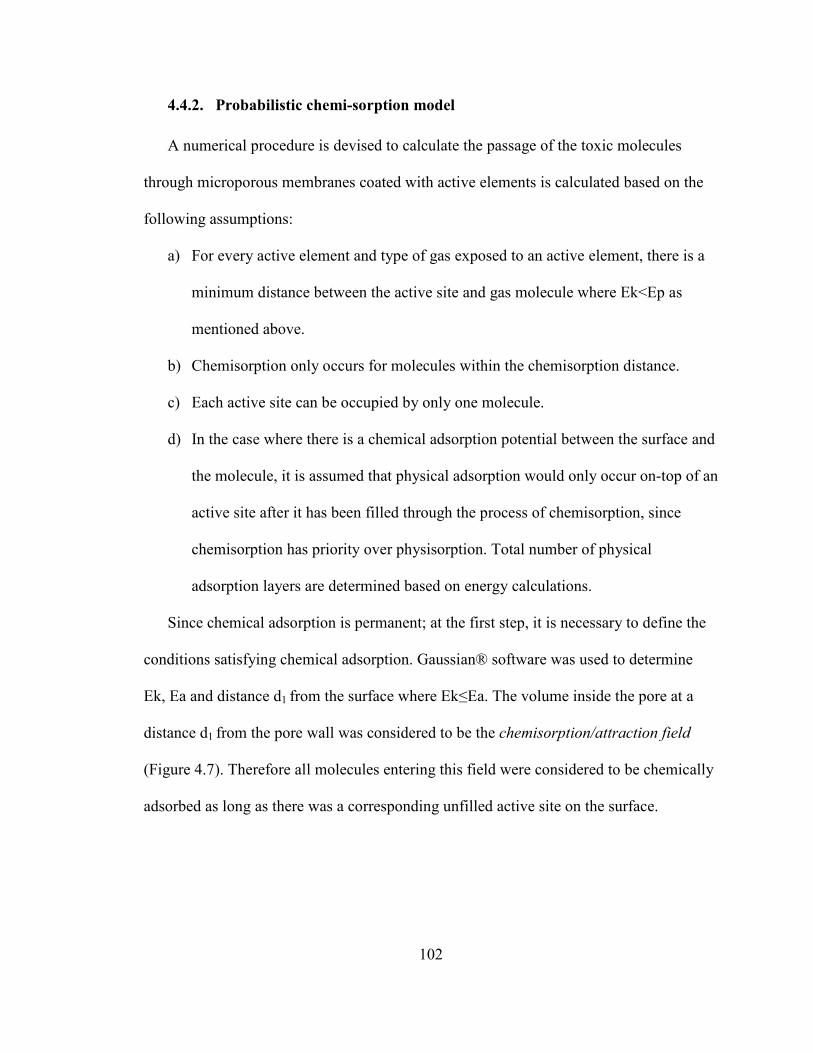
102
4.4.2. Probabilistic chemi-sorption model
A numerical procedure is devised to calculate the passage of the toxic molecules
through microporous membranes coated with active elements is calculated based on the
following assumptions:
a) For every active element and type of gas exposed to an active element, there is a
minimum distance between the active site and gas molecule where Ek<Ep as
mentioned above.
b) Chemisorption only occurs for molecules within the chemisorption distance.
c) Each active site can be occupied by only one molecule.
d) In the case where there is a chemical adsorption potential between the surface and
the molecule, it is assumed that physical adsorption would only occur on-top of an
active site after it has been filled through the process of chemisorption, since
chemisorption has priority over physisorption. Total number of physical
adsorption layers are determined based on energy calculations.
Since chemical adsorption is permanent; at the first step, it is necessary to define the
conditions satisfying chemical adsorption. Gaussian® software was used to determine
Ek, Ea and distance d1 from the surface where Ek≤Ea. The volume inside the pore at a
distance d1 from the pore wall was considered to be the chemisorption/attraction field
(Figure 4.7). Therefore all molecules entering this field were considered to be chemically
adsorbed as long as there was a corresponding unfilled active site on the surface.
103
Figure 4.7. Determination of chemisorption field
Calculation of the permeation rate was determined using the same principle in the
previous gas permeation models, however, the number of molecules which can pass
through the membrane was reduced by adsorption on the surface and the required time
was calculated for the adsorption equilibrium to occur. The adsorption rate was evaluated
based on the number of molecules exposed to chemisorption field (Nm) versus the
number of active sites available (Na). The number of filled active sites (Nfas) and Nm were
updated for each time step.

104
If all adsorption sites are filled, there is still the possibility of adsorption on top of the
previously adsorbed layer in the form of physisorption if the necessary conditions are
satisfied. Therefore, physisorption was also considered up to three layers in the
chemisorption model based on the analysis described in the previous section.
At the first step, the number of molecules in the attraction field was determined for an
instance t=t1 for the minimum chemisorption distance obtained from Gaussian®. The
number of active sites on the pore surfaces was determined for the given density. If the
number of active sites is greater than the number of molecules in the attraction field, all
molecules in the attraction field are assumed to be captured by the active sites, causing a
reduction in the available active sites as well as a reduction in the number of molecules
that will pass through the membrane. The unit time ti required for one molecule to pass
through the membrane was determined using the same method as was used in the
previous gas transmission rate models, based on random molecular trajectory. The
number of molecules needed to occupy all active sites by chemisorption as well as
physisorption, i.e. to reach saturation, was calculated. The total time tn was calculated
based on the total number of molecules to pass through the thickness of the material
before saturation. With the chemisorption addition, several modifications and additions
were introduced to the gas transmission rate model. The change in the pore diameter
caused by the addition of PGMA as well as the active element was implemented.
Therefore, the pore diameters were reduced by the number of possible layers to be
adsorbed.
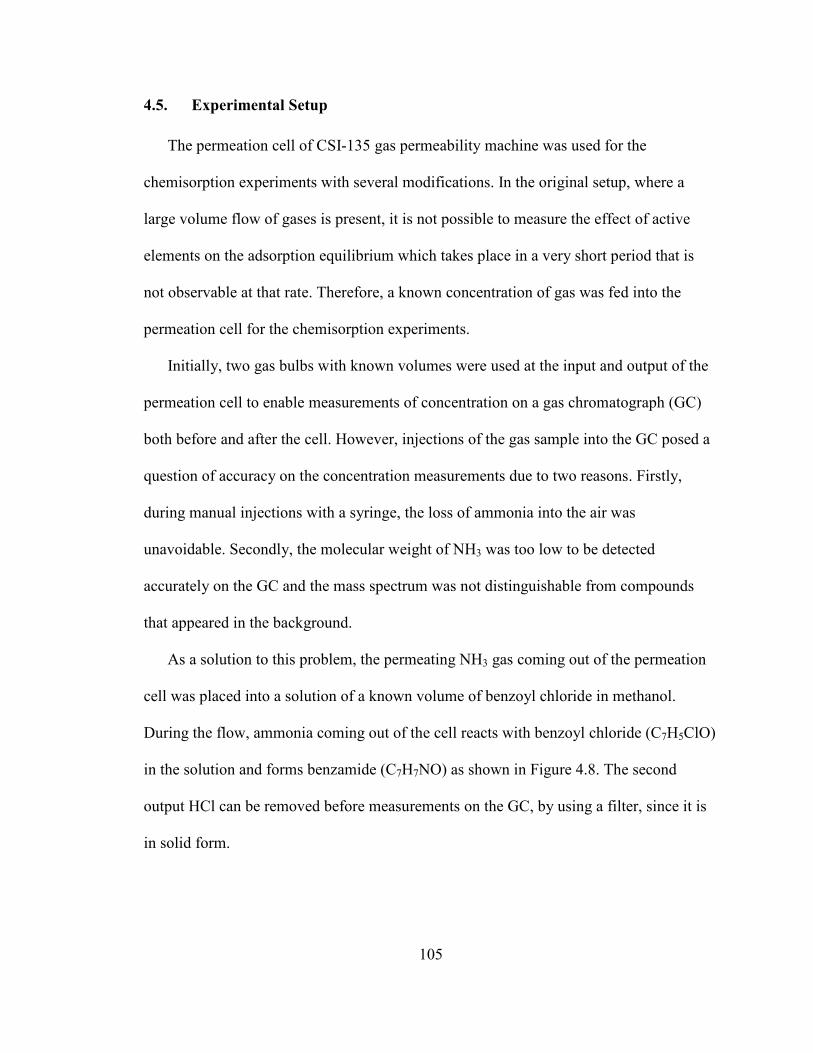
105
4.5. Experimental Setup
The permeation cell of CSI-135 gas permeability machine was used for the
chemisorption experiments with several modifications. In the original setup, where a
large volume flow of gases is present, it is not possible to measure the effect of active
elements on the adsorption equilibrium which takes place in a very short period that is
not observable at that rate. Therefore, a known concentration of gas was fed into the
permeation cell for the chemisorption experiments.
Initially, two gas bulbs with known volumes were used at the input and output of the
permeation cell to enable measurements of concentration on a gas chromatograph (GC)
both before and after the cell. However, injections of the gas sample into the GC posed a
question of accuracy on the concentration measurements due to two reasons. Firstly,
during manual injections with a syringe, the loss of ammonia into the air was
unavoidable. Secondly, the molecular weight of NH3 was too low to be detected
accurately on the GC and the mass spectrum was not distinguishable from compounds
that appeared in the background.
As a solution to this problem, the permeating NH3 gas coming out of the permeation
cell was placed into a solution of a known volume of benzoyl chloride in methanol.
During the flow, ammonia coming out of the cell reacts with benzoyl chloride (C7H5ClO)
in the solution and forms benzamide (C7H7NO) as shown in Figure 4.8. The second
output HCl can be removed before measurements on the GC, by using a filter, since it is
in solid form.
106
NH3
HCl
Figure 4.8. Ammonia reaction with benzoyl chloride
Since this is a one-to-one reaction, the molar amount of NH3 will be equal to
C7H5ClO and measuring the molar amount of benzamide in the solution, the
concentration of ammonia can be evaluated. By this reaction, benzamide is obtained in
liquid form which eliminates the accuracy problem during the transport of gas sample.
Furthermore, the molecular weight of benzamide (121.14 g/mol) is much higher than
ammonia (17 g/mol) and it has a wider mass spectrum which makes it easier to detect by
the GC.
Based on these considerations, a new experimental setup was developed. For this
purpose, a Riteflow® flow meter was purchased. The flowmeter was resistant to
corrosive gases, had a scale from 0 to 150 units and contained a glass and a stainless steel
float as scale indicators. The scale readings were taken at the center of each float and a
chart from Aalborg Instruments & Controls Inc was used to determine the corresponding
flow rate in volume/time, at standard conditions; i.e. 1 atm pressure and 70˚ F
temperature. Pure ammonia gas was supplied by a cylinder; a pressure valve was
connected between the gas supply and the input of the flow meter and set to 1 atm. The
flow rate, was manually adjusted to the desired value in ml/min. The output from the
flowmeter was connected to the permeation cell. A schematic view of the experimental
setup is shown in Figure 4.9.
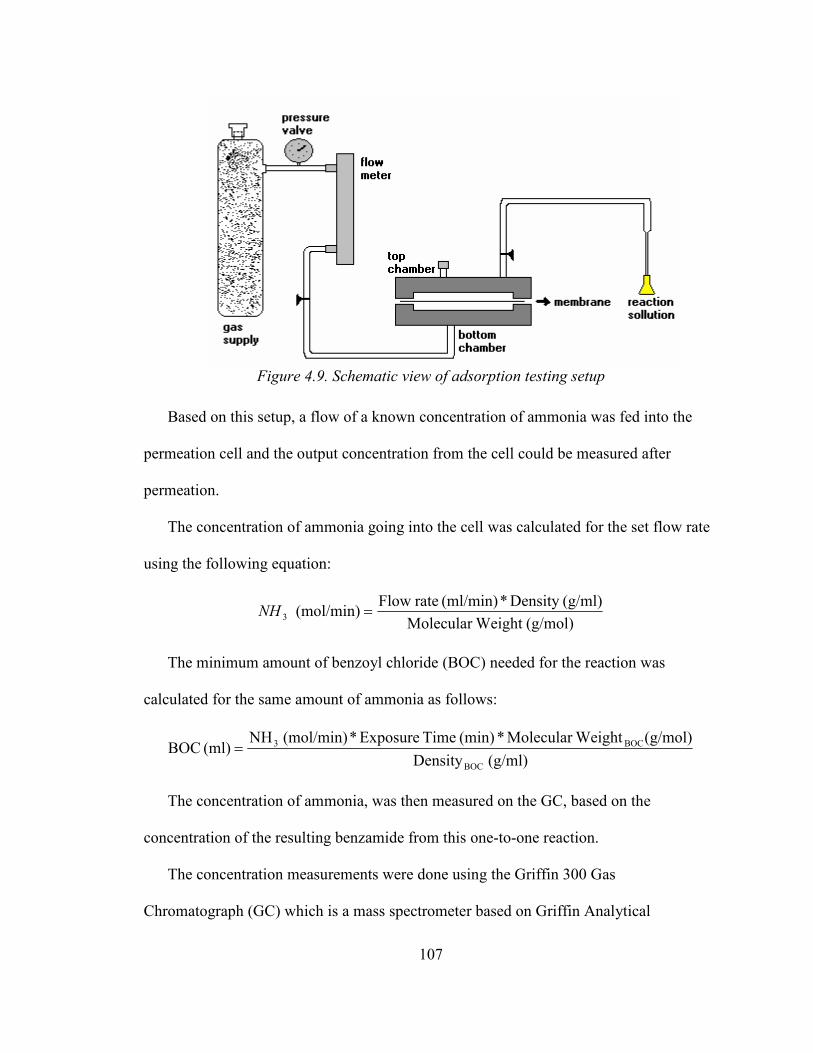
107
Figure 4.9. Schematic view of adsorption testing setup
Based on this setup, a flow of a known concentration of ammonia was fed into the
permeation cell and the output concentration from the cell could be measured after
permeation.
The concentration of ammonia going into the cell was calculated for the set flow rate
using the following equation:
(g/mol)Weight Molecular (g/ml)Density *(ml/min) rate Flow
(mol/min) 3 =NH
The minimum amount of benzoyl chloride (BOC) needed for the reaction was
calculated for the same amount of ammonia as follows:
(g/ml) Density(g/mol)WeightMolecular *(min) Time Exposure*(mol/min) NH
(ml) BOCBOC
BOC3=
The concentration of ammonia, was then measured on the GC, based on the
concentration of the resulting benzamide from this one-to-one reaction.
The concentration measurements were done using the Griffin 300 Gas
Chromatograph (GC) which is a mass spectrometer based on Griffin Analytical

108
Technologies’ proprietary Cylindrical Ion Trap (CIT) technology. The column type used
during the experiments was an RTX -5 (30 meter, 0.25 mm internal diameter and 0.25
µm depth film).
4.6. Results and Discussion
4.6.1. Calibration Measurements for Concentration
Before the actual experiments, an HPLC grade benzamide was used to calibrate the
GC. Different concentrations of benzamide was prepared using methanol as a solvent and
a calibration curve was obtained. Six different concentration levels were prepared for
calibration, ranging from 0.0005 mmols/ml up to 0.1 mmols/ml and the area of the peaks
was calculated on the GC three times for each concentration and an average was taken for
each point. Well-defined peaks and consistent and repeatable results were obtained
during calibration. The original mass spectrum obtained for benzamide from the
chromatography tests matched well with the target results from the library as shown in
Figure 4.11. The test was repeated using an HP 5890 Gas Chromatograph coupled with
HP5970 Mass Selective Detector for verification and a similar spectrum was obtained.
Figure 4.11. (a)The actual mass spectrum of benzamide from calibration
experiments, (b) expected mass spectrum for benzamide
(a)
(b)

109
The method used for calibration tests had a 2 step temperature program with a start
temperature of 70˚ which was held at 70˚ for 1 minute with a 20% split and then ramped
up in a rate of 30 deg/min to 250˚. The temperature was held at 250˚ for 5 minutes. The
mass/charge ratio (m/z) was set to 45-150 m/z and a minimum of 5 minute delay was
used. The calibration curve obtained for benzamide based on peak area is shown in
Figure 4.12. The quantitative detection limit, which is the lowest concentration used for
detection experiments, was 5*10-4 mmol/ml. The limit of detection (LOD), which is
defined as the lowest concentration level that can be detected qualitatively [11], was
calculated based on the calibration curve using the equation LOD=3.3*Standard
Deviation/Slope as 4*10e-5 mmol/ml. According to United States Pharmacopeia (USP),
LOD is defined as the concentration that had a signal-to-noise ratio of 3:1, while for limit
of quantification the ratio considered is 10:1 [12]. LOD was calculated as 1.7*10-4
mmol/ml or 2.33 mg% based on USP recommendations.
Figure 4.12. Calibration curve for benzamide concentration measurements
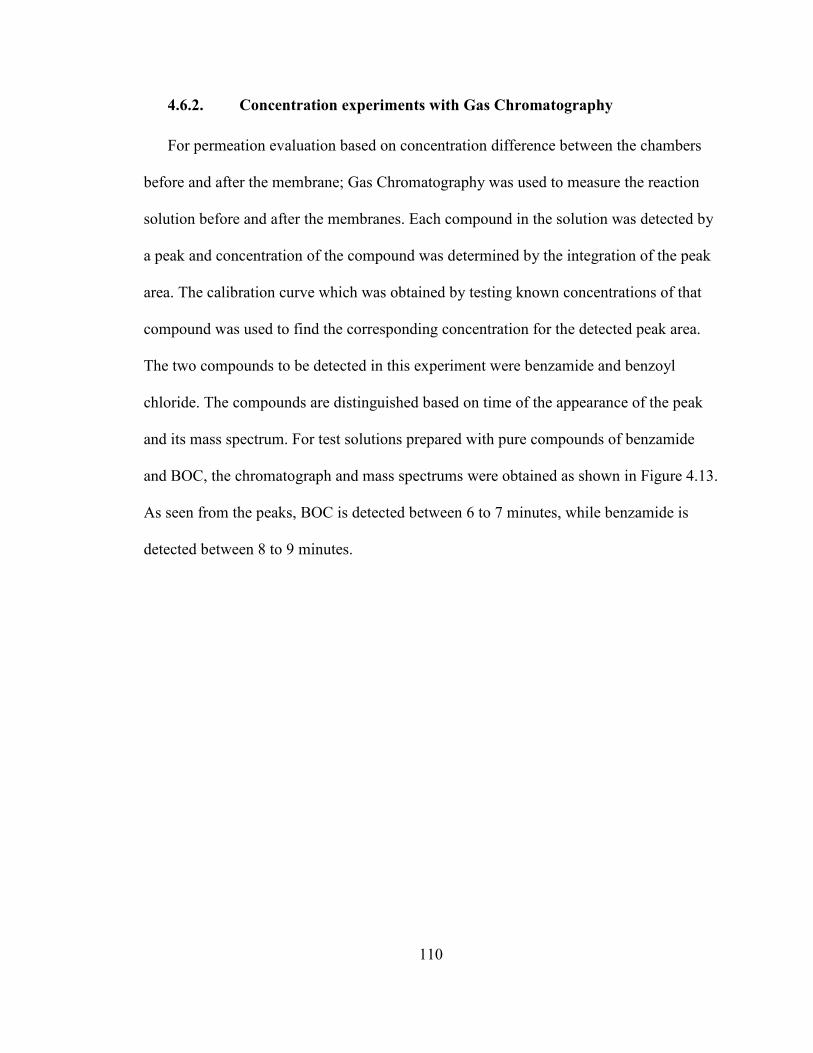
110
4.6.2. Concentration experiments with Gas Chromatography
For permeation evaluation based on concentration difference between the chambers
before and after the membrane; Gas Chromatography was used to measure the reaction
solution before and after the membranes. Each compound in the solution was detected by
a peak and concentration of the compound was determined by the integration of the peak
area. The calibration curve which was obtained by testing known concentrations of that
compound was used to find the corresponding concentration for the detected peak area.
The two compounds to be detected in this experiment were benzamide and benzoyl
chloride. The compounds are distinguished based on time of the appearance of the peak
and its mass spectrum. For test solutions prepared with pure compounds of benzamide
and BOC, the chromatograph and mass spectrums were obtained as shown in Figure 4.13.
As seen from the peaks, BOC is detected between 6 to 7 minutes, while benzamide is
detected between 8 to 9 minutes.
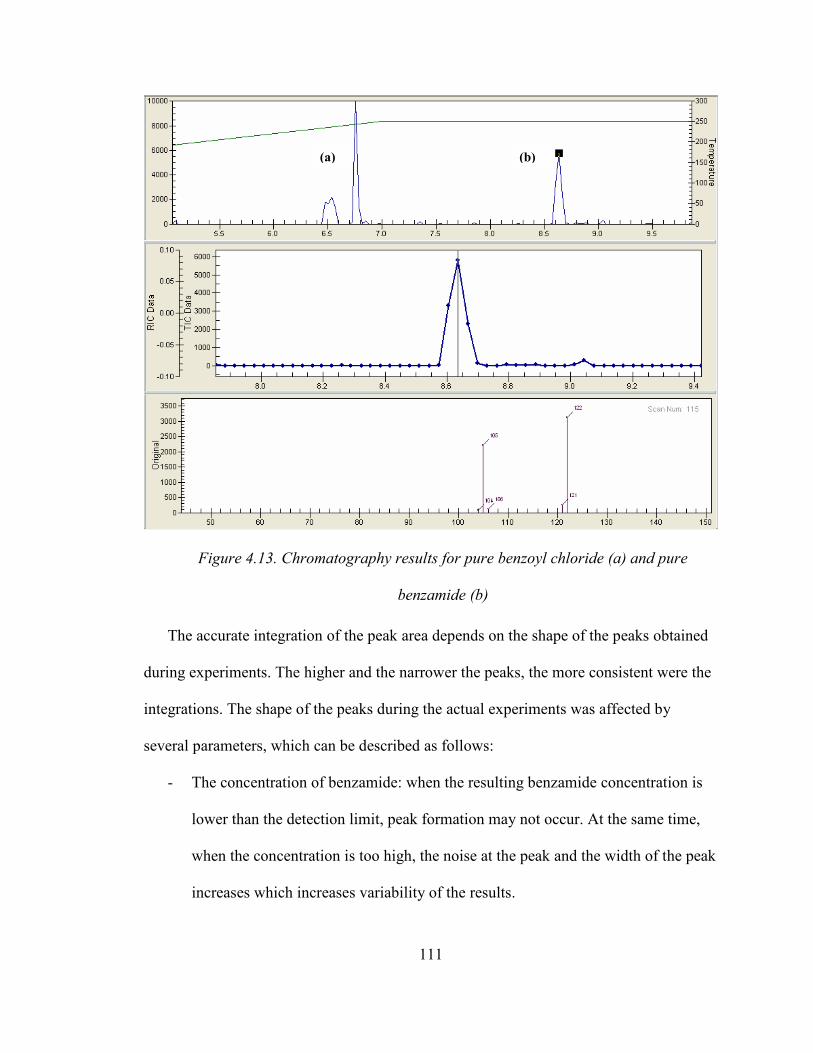
111
Figure 4.13. Chromatography results for pure benzoyl chloride (a) and pure
benzamide (b)
The accurate integration of the peak area depends on the shape of the peaks obtained
during experiments. The higher and the narrower the peaks, the more consistent were the
integrations. The shape of the peaks during the actual experiments was affected by
several parameters, which can be described as follows:
- The concentration of benzamide: when the resulting benzamide concentration is
lower than the detection limit, peak formation may not occur. At the same time,
when the concentration is too high, the noise at the peak and the width of the peak
increases which increases variability of the results.
(a) (b)

112
- The concentration of benzoyl chloride left in the solution: if this concentration is
too high, it can cause contamination of the column and hence inaccuracy of the
results. It can also prevent the detection of other compounds which have
significantly low concentration in comparison.
During the concentration experiments, the initial concentration was calculated
mathematically as described in the previous section. To verify the actual amount of
ammonia fed into the cell, a test was run at the beginning of each experiment without
using a membrane inside the cell and the resulting solution was tested using the GC. The
calculated concentration based on the flow rate was higher than the concentration
obtained experimentally. The difference between calculated values and actual
measurements could be a result of several parameters such as the change in density of
NH3 in gas based on the effect of temperature and pressure conditions during each
experiment, the manual scale adjustment on the flow meter and the pressure change
inside the ammonia cylinder upon consumption. Therefore, for comparison purposes, the
experimental concentration values obtained from the GC upon passage of ammonia
through the empty cell were used as the beginning concentration. This initial value of
ammonia was obtained experimentally for each test and concentration through a regular
PET membrane with no active agents and through an activated PET membrane were
compared in respect to this value. The concentration difference between the two
membranes showed the amount of adsorption of ammonia on the activated membrane.
The concentrations were obtained in mmol/ml based on the corresponding concentration
value on the calibration curve for each peak area. Tests were done using the same method
and a temperature program was used in calibration tests.

113
During the experiments, it was observed that the amount of reacting agent BOC used
in the solution had a significant effect on the quality of the peaks. To eliminate the
inaccuracy due to peak areas, different BOC amounts were tested to determine the
optimum experimental parameters. The starting BOC concentration used for this purpose
ranged from 5 µl to 3 ml per 25 ml solution. At concentrations above 0.5 ml; peak
formation either did not occur or the integration of the peak area was not possible due to
spread of the peaks. Some examples of these peaks obtained during the experiments are
shown in Figure 4.14.
Figure 4.14. Gas Chromatography peaks for benzamide inside the reaction solution with
10 µl BOC and 238.6 ml/min ammonia passing through untreated PET
The amounts where no peak formation occurred were also repeated using HP 5890
Gas Chromatography and similar results were obtained. Repeatable results and relatively
consistent peaks were achieved only for 5 µl of BOC and an initial flow rate of 238.6
ml/min of ammonia. An example of chromatography results obtained at these conditions
by the passage of ammonia through an untreated PET membrane and an active PET
membrane are shown in Figures 4.15 and 4.16.
Benzoyl chloride
Benzamide
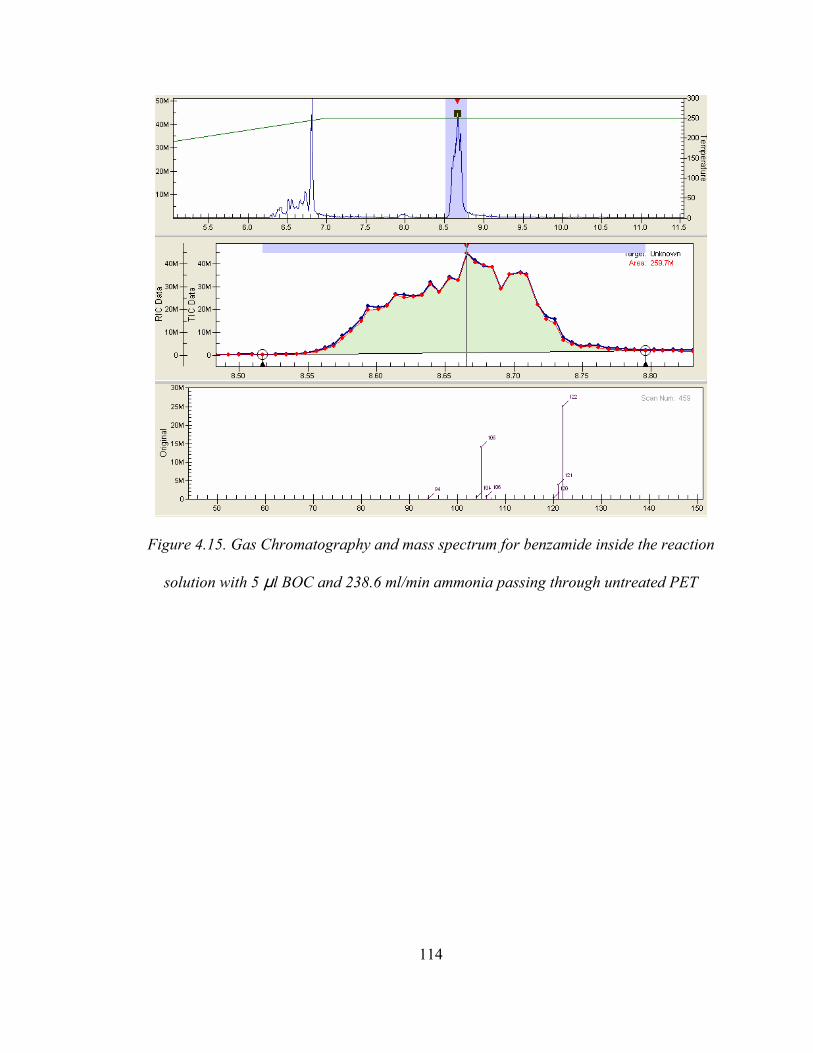
114
Figure 4.15. Gas Chromatography and mass spectrum for benzamide inside the reaction
solution with 5 µl BOC and 238.6 ml/min ammonia passing through untreated PET

115
Figure 4.16. Gas Chromatograph and mass spectrum for benzamide inside the reaction
solution with 5 µl BOC and 238.6 ml/min ammonia passing through active PET
During the concentration evaluation for the treated and untreated PET membranes,
the initial amount of ammonia passing through the cell was calculated as 5.82
mmols/ml/min. Concentrations for the empty cell with no PET membrane was measured
to verify this value, experimentally. However, the total amount of ammonia contributing
to the formation of benzamide was limited by the amount of BOC used in the solution,
which was 5 µl and corresponded to a concentration of approximately 0.045 mmols/ml,
thus, only 0.045 mmols/ml of the 5.82 mmol/ml of ammonia could be used toward
benzamide formation. Therefore, the concentrations obtained for the membranes could
not be compared to the concentration based on the calculated concentration of ammonia
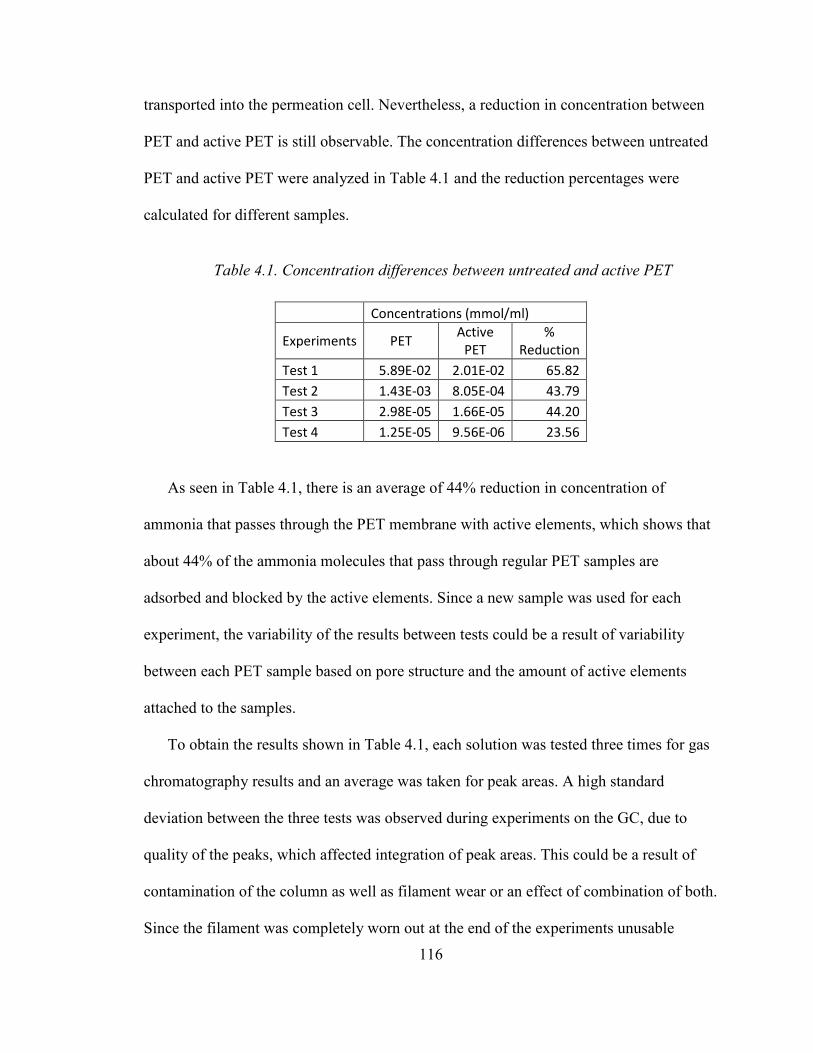
116
transported into the permeation cell. Nevertheless, a reduction in concentration between
PET and active PET is still observable. The concentration differences between untreated
PET and active PET were analyzed in Table 4.1 and the reduction percentages were
calculated for different samples.
Table 4.1. Concentration differences between untreated and active PET
Concentrations (mmol/ml)
Experiments PET Active
PET
%
Reduction
Test 1 5.89E-02 2.01E-02 65.82
Test 2 1.43E-03 8.05E-04 43.79
Test 3 2.98E-05 1.66E-05 44.20
Test 4 1.25E-05 9.56E-06 23.56
As seen in Table 4.1, there is an average of 44% reduction in concentration of
ammonia that passes through the PET membrane with active elements, which shows that
about 44% of the ammonia molecules that pass through regular PET samples are
adsorbed and blocked by the active elements. Since a new sample was used for each
experiment, the variability of the results between tests could be a result of variability
between each PET sample based on pore structure and the amount of active elements
attached to the samples.
To obtain the results shown in Table 4.1, each solution was tested three times for gas
chromatography results and an average was taken for peak areas. A high standard
deviation between the three tests was observed during experiments on the GC, due to
quality of the peaks, which affected integration of peak areas. This could be a result of
contamination of the column as well as filament wear or an effect of combination of both.
Since the filament was completely worn out at the end of the experiments unusable
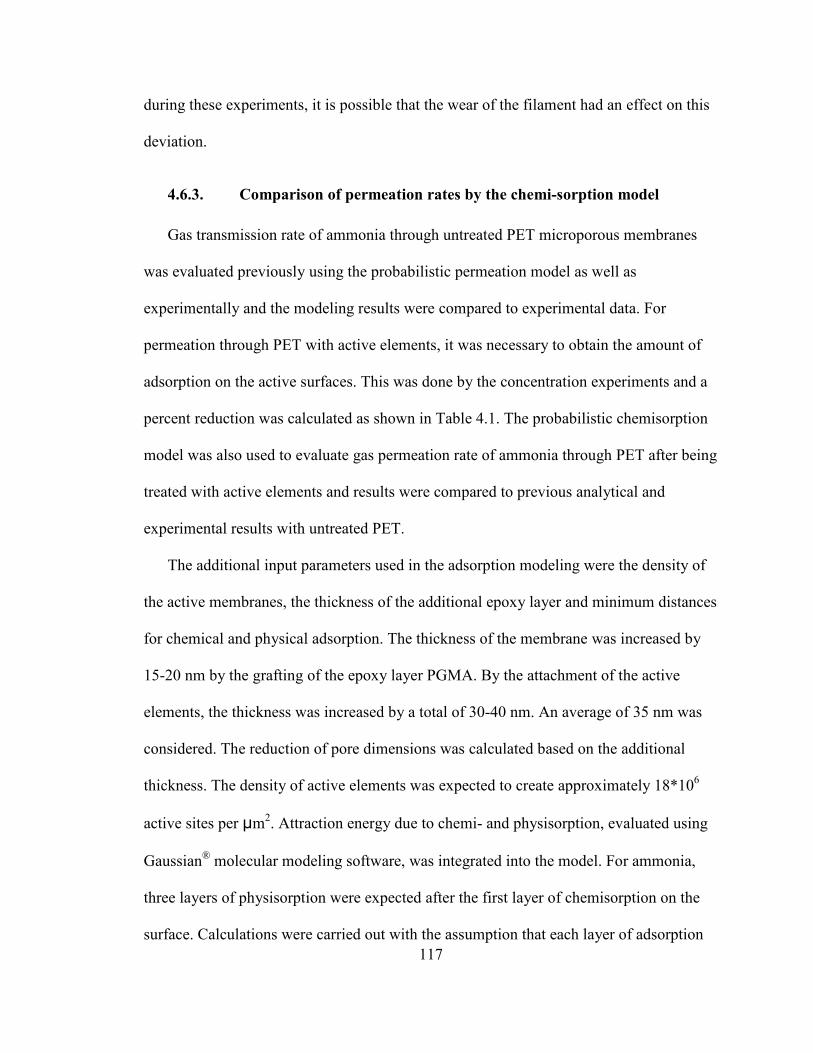
117
during these experiments, it is possible that the wear of the filament had an effect on this
deviation.
4.6.3. Comparison of permeation rates by the chemi-sorption model
Gas transmission rate of ammonia through untreated PET microporous membranes
was evaluated previously using the probabilistic permeation model as well as
experimentally and the modeling results were compared to experimental data. For
permeation through PET with active elements, it was necessary to obtain the amount of
adsorption on the active surfaces. This was done by the concentration experiments and a
percent reduction was calculated as shown in Table 4.1. The probabilistic chemisorption
model was also used to evaluate gas permeation rate of ammonia through PET after being
treated with active elements and results were compared to previous analytical and
experimental results with untreated PET.
The additional input parameters used in the adsorption modeling were the density of
the active membranes, the thickness of the additional epoxy layer and minimum distances
for chemical and physical adsorption. The thickness of the membrane was increased by
15-20 nm by the grafting of the epoxy layer PGMA. By the attachment of the active
elements, the thickness was increased by a total of 30-40 nm. An average of 35 nm was
considered. The reduction of pore dimensions was calculated based on the additional
thickness. The density of active elements was expected to create approximately 18*106
active sites per µm2. Attraction energy due to chemi- and physisorption, evaluated using
Gaussian® molecular modeling software, was integrated into the model. For ammonia,
three layers of physisorption were expected after the first layer of chemisorption on the
surface. Calculations were carried out with the assumption that each layer of adsorption
118
would only start after saturation is reached at the previous layer. The results are shown in
Figure 4.17.
Figure 4.17. Comparison of models for air and ammonia with and without adsorption on
PET
As can be seen from the results, adding active elements to the microporous membrane
decreased the transmission rate of ammonia based on model estimations. At low
pressures, more than 50% reduction was estimated in the permeation rate of ammonia
through active PET membranes. The reduction is even higher at higher pressures. The
reduction of gas permeation rate calculated by the chemisorption model is in good
agreement with the reduction percentage in concentration experiments shown in Table
4.1. The results in Figure 4.18 are obtained for the time before saturation; therefore, as

119
the saturation is reached, i.e. all the active sites on the surface are occupied, the reduction
in the permeation rate is expected to decrease.
4.7. Conclusions
Gas permeation behavior of toxic gases such as ammonia was investigated through
microporous PET membranes both at the presence and absence of active elements on
their surface, which can bond chemically and/or physically when exposed to a toxic
agent. Gaussian® Molecular Modeling software was used for molecular optimization as
well as for calculation of interaction energies and the distance of attraction fields between
molecules and the surface. A chemisorption model was developed based on the density of
the active sites on the membrane surface and the attraction energies and distances. The
reduction in the gas permeation rate was estimated using the chemisorption model.
An experimental setup was developed for measuring the adsorption behavior of the
active membranes based on concentration differences on both sides of the membrane.
Concentration differences were measured using gas chromatography. The concentration
change through a regular membrane was compared to an active membrane. A reduction
was observed experimentally as well as by the model. The experimental results were
found comparable to the reduction percentage estimated by the model.
Results showed that the detection of gas molecules with very low molecular weight
such as air and ammonia can be done using gas chromatography by using an agent which
can react with the gas and produce a liquid compound with high molecular weight. This
can improve the detection quality due to a better mass spectrum and the accuracy of the
measurement due to elimination of chemicals in gas form.

120
4.8. References
[1] Attard, G. and Barnes, C., Surfaces, Oxford ; New York: Oxford University Press,
1998.
[2] Carroll, T. R., Schwope, A. D., McCarthy, R. T., “A technique to determine
chemical contamination in chemical protective clothing”, Performance of
Protective Clothing: Fourth Volume, ASTM STP 1133, James P. McBriarty and
Norman W. Henry, Eds., American Society for Testing Materials, Philadelphia,
1992, pp. 785-797.
[3] Coletta, G. C. and Spence, M. W., “Managing the selection and use of chemical
protective clothing”, Performance of Protective Clothing, ASTM STP 900, R. L.
Barker and G. C. Coletta, Eds., American Society for Testing and Materials,
Philadelphia, 1986, pp. 235-242.
[4] Geankoplis, C. J., Transport Processes and Unit Operations, Englewood Cliffs,
N.J.: PTR Prentice Hall, c1993.
[6] Luth, H., Surfaces and Interfaces of Solids, Springer-Verlag, Berlin, 1993. 34
[7] Prutton, M., Introduction to Surface Physics, Clarendon Press, Oxford, 1994.
[8] Shindo, Y., Hakuta, T., Yoshitome, H., Inoue, H., “Gas diffusion in microporous
media in Knudsen’s regime”, Journal of Chemical Engineering of Japan, Vol. 16,
No. 2, 1983, pp. 120-126.
[9] US Department of Justice, “Guide for the selection of chemical agent and toxic
industrial material detection equipment for emergency first responders”, NIJ
Guide 100-00, Volume 1, June 2000.
121
[10] Webb, P. A., “Introduction to chemical adsorption analytical techniques and their
applications to catalysis”, Micromeritics Instrument Corp. Technical
Publications, January 2003.
[11] Long, G. L. and Winefordner, J. D., “Limit of detection. A closer look at the
IUPAC definition”, Analytical Chemistry, Vol. 55, No. 7, 1983, pp. 712-724.
[12] The United States Pharmacopeia 30th edition, The National Formulary, 25th edition
“The Official Compendia of Standards”, United States Pharmacopeial
Convention, Inc., Asian Edition, Washington, D.C., 2007.

122
CHAPTER V
CONCLUSIONS AND FUTURE WORK
5.1. Conclusions
A multi-layer structure of microporous membranes was proposed as a chemical
protective material with ability to block the passage of toxic chemical gases and the gas
permeation behavior of such materials was investigated experimentally and
mathematically.
Microporous membranes made of polyester, nylon and polypropylene with different
properties and surface characteristics, such as pore structure, porosity, thickness,
hydrophobic or hydrophilic behavior, etc. were selected to be used as protective layers
for the proposed structure and for experimental analyses. Some of these membranes were
modified by grafting at Clemson University, to enhance their adsorption capacity and
barrier effectiveness by anchoring active agents on their surface which can bond with the
chosen toxic chemicals and warfare agents.
Air, toxic industrial chemical ammonia and warfare agents mustard and sarin were
selected for evaluation of their transmission behavior through these membranes. For
experimental studies, benign mimics of mustard and sarin were selected as methional,
prenol (for mustard) and beta-pinene (for sarin), based on their comparability to the
warfare agents in molecular weight, morphology and vapor pressure.
For experimental studies; a manometric and a volumetric gas permeability machine
were selected and their performances were compared. The volumetric gas permeability
machine CSI-135 was selected due to its modifiability for different experimental methods
and ability to measure different types of gases.

123
Three different experimental methods were developed using CSI-135 to measure
permeation of air and other gases, permeation of mimic gases by evaporation and
adsorption capacity of surface-modified membranes with active agents. A gas
Chromatography machine was used to measure the concentration of ammonia upon
transport through untreated PET and treated PET membranes with active elements for
adsorption testing. Experimental studies were conducted to measure gas transmission
rate of these gases and chemicals through different membranes, at different pressures and
temperatures.
A probabilistic micro-level air permeability model was developed to evaluate
permeation of gases through single and multi-layer membranes at different pressures. An
evaporation model was developed to evaluate the permeation rate of mimic vapors
through these membranes at different temperatures. A chemisorption model was
developed to evaluate the effect of adsorption of active membranes on gas transmission
behavior.
For modeling, Guassian® Molecular Modeling software was used to evaluate the
interaction energy of the gas molecules with the membrane surfaces and to determine the
adsorption distances for chemical and physical attachment of molecules onto the surface.
Interaction energies and adsorption distances were calculated for air, ammonia, mustard
and its mimics as well as untreated and treated PET surfaces and active PET membranes.
Experimental results were compared to modeling results. The air and ammonia
transmission rates were found to be in good agreement with the molecular-level
probabilistic model. The transmission rate increased with an increase in porosity as well
as pressure. Increasing the number of membrane layers also caused a decrease in gas
124
transmission rates. The size of the gas molecules as well as the pore distribution was also
important parameters in the evaluation of gas transmission rates. The transmission rate of
mimics increased with an increase in temperature. Acceptable agreements were achieved
between the mimic transmission rates and the evaporation model. It was also found that
better correlations could be achieved for membranes with a well-known morphology.
The transmission rates of mimics were found to be less than air transmission rates by
1000 in average due to greater molecular size, molecular weight and high temperature
requirements for vaporization.
For membranes with active elements, a reduction of transmission rate was expected
based on results obtained by the chemisorption model. Concentration experiments
confirmed a reduction upon attachment of active elements on membrane surfaces for
active elements compared to untreated membranes. The reduction percentages obtained
experimentally and mathematically were in good agreement.
5.2. Future Work and Improvements
Several improvements and modifications were noted to increase the accuracy of
experimental data as well as to examine the barrier properties of microporous membranes
which are summarized below.
It was not possible to determine tortuousity of the actual samples for experimental
results. It may be useful to understand the effect of tortuosity versus porosity and for that
samples with known tortuosity and porosity should be obtained and tested.
Similar experiments should be conducted by the same person to ensure consistency in
handling.
125
Concentration experiments must be further investigated and experimental conditions
must be improved. The improvements can be listed as follows:
1. In real life situation, the ammonia may not show a continuous flow behavior
vertical to the material. A setup can be developed to measure the exposure of the material
to a known concentration of ammonia in a closed environment, rather than in the case of
a continuous flow.
2. During the current experiments; pure ammonia was passed through the membranes.
In the actual life situation, the ammonia would be mixed with air and therefore it may be
necessary to build a reservoir for pure ammonia and known concentration of air to be
mixed before it is passed through a material. The amount of ammonia can also be
determined based on the level of toxicity that is considered hazardous based on safety
assessments. Measurements can be taken based on time of exposure.
3. To improve quality of peak areas, the experimental setup can be modified to allow
a more sensitive flow meter to allow for low ammonia transport through the cell, which
requires less BOC concentration. Furthermore, if the experiments can be repeated on
different gas chromatography machines and an instrument validation is conducted, the
results would be a valuable source for a method to detect low molecular weight chemicals
in gas form on Gas Chromatography.
126
APPENDIX A
TESTING INSTRUMENTS FOR MATERIAL PROPERTIES
A.1. LYSSY Air Permeability Tester
PBI Dansensor’s L 100-5000 Manometric Gas Permeability Tester is used for the
measurement of permeability of a wide-range of gases through low-porosity films and
membranes. It works with the manometric principle according to the method of pressure
change through the sample. It contains two test chambers and allows measurement of two
samples at a time. After vacuuming the chambers, the tester measures the pressure
change in the top chamber upon permeation through the material and calculates
permeation rate in ml/m2.day. This machine works based on the ASTM D1434 standard
for “determining gas permeability characteristics of plastic film and sheeting”.
LYSSY Air Permeability Tester was used with a vacuum supply and a thermostat to
work at different temperatures (Figure A.1-A.2). This tester was used initially to test a
wide range of membranes during the initial evaluation of the permeability tester. Results
were plotted and later compared to values obtained on other permeability testers such as
Gurley and CSI-135 permeability tester.

127
Figure A.1. The LYSSY 100-5000 Permeability Tester and the humidity control
Figure A.2. Rotary pump (left) and heated/refrigerated circulator (right)
A.2. Gurley Permeability Tester
Gurley Model 58-03 Densometer is another air permeability tester mainly used for
films, membranes and other textile materials (Figure A.3). It works under light uniform
pressure and measures the time for a given volume of air to pass through a known surface
area in Gurley seconds, based on ASTM D726 standard for “resistance of nonporous
paper to passage of air”. This tester is suitable for the measurement of high porosity films

128
and fabric, therefore, most samples were measured on Gurley to compare results with the
L100-5000 permeability tester.
Figure A.3. Model 58-03 Gurley Densometer
A.3. Scanning Electron Microscope (SEM)
Scanning electron microscopy was used to obtain a general idea regarding the pore
size distributions and examine the surface and pore structure of the membranes. To take
SEM images, specimens were first coated with gold-palladium. They were placed in the
DSM 940 microscrope and images were taken at different distances from the surface and
at different zoom levels.
Polypropylene and polyethylene-based membranes MF715 and B130 and
polypropylene-based membranes Aptra-classic, UV8, W-wide, and W-gray were used in
the initial experiments with the air permeability testers mentioned above.
SEM images of these microporous membranes which were used at the initial stages of
this study are shown in Figure A.4.
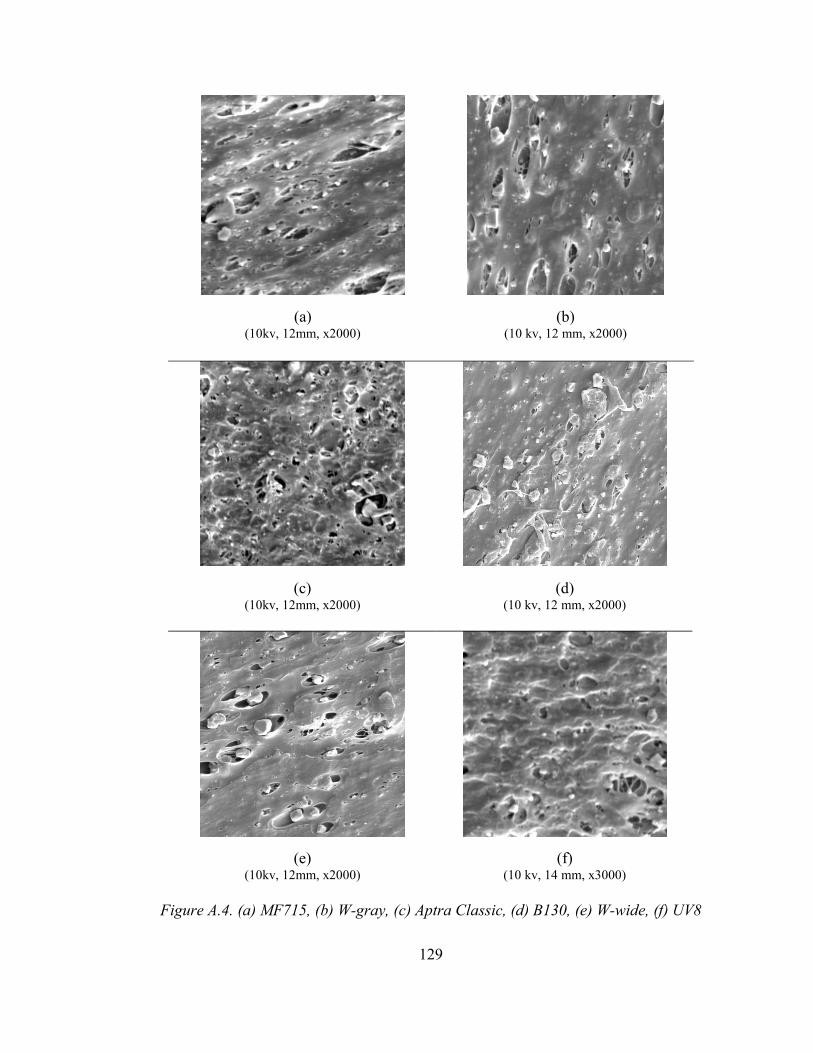
129
(a) (10kv, 12mm, x2000)
(b) (10 kv, 12 mm, x2000)
(c) (10kv, 12mm, x2000)
(d) (10 kv, 12 mm, x2000)
(e) (10kv, 12mm, x2000)
(f) (10 kv, 14 mm, x3000)
Figure A.4. (a) MF715, (b) W-gray, (c) Aptra Classic, (d) B130, (e) W-wide, (f) UV8
130
A.4. Capillary Flow Porometer
Capillary Flow Porometer (CFP-1100-AEXS, Porous Materials, Inc) was used for the
measurement of porosity and pore size distributions of membranes used in the main part
of the study. When testing porosity, the pores of the sample are, first, filled with a wetting
liquid and later, a gas pressure is applied in gradually increasing amount to empty the
pores. Larger pores are emptied at a certain pressure and smaller pores are emptied at the
increasing pressure values. The measurements of gas pressure and flow are taken through
dry and wet samples and pore diameter is calculated from the differential pressure. The
pore diameter is calculated using the equation:
p = 4 γ cosθ / D
Where, D=pore diameter, p=the differential pressure required to remove the wetting
liquid from a pore of diameter D, γ=the surface tension of wetting liquid and θ=the
contact angle of the wetting liquid on the sample. Pore distribution is given by the
distribution function:
f = -[d(fw/fd) * 100/dD]
Where, fw and fd are flow rates through wet and dry samples respectively.
Capillary Flow Porometer can detect pore sizes of 0.013 micron to 500 micron.
131
APPENDIX B
ADDITIONAL EXPERIMENTS AND RESULTS
B.1. Permeability Results with Treated PET and Nylon Membranes
Before the creation of multi-layer assemblies as well as before the attachment of
active elements, the PET surfaces were treated with different chemicals such as poly-
glycidyl methacrylate (PGMA), poly-pentafluorostyrene (PPFS) and poly-acrylic acid
(PAA) and nylon surfaces were treated with PPFS, PAA and poly-ethyleneimine (PEI)
for a permanent attachment. The PET and nylon samples were tested after being treated
with chemicals to examine the effect of treatment and observe the amount of blockage
caused by these chemicals on the membrane surface. PET and nylon with no treatment
(virgin) as well as after treatment was tested on the CSI-135 permeability tester for air
permeability. The results are shown in Figure B.1 for PET and Figure B.2 for nylon.
These experiments were helpful in determining the amount of blockage and the
amount of reduction in porosity caused by the treatment. The blockage caused by the
treatment was not significant for any of the membranes. However, the amount of
reduction in porosity was taken into consideration during the calculation of permeation
rate on double-layer PET, which was treated with PGMA.

132
Permeability Results
0.00E+00
5.00E-04
1.00E-03
1.50E-03
2.00E-03
2.50E-03
3.00E-03
3.50E-03
4.00E-03
Virgin PGMA PPFS PAAPET Membranes
GTR (mol/ m2.s)
Pressure=0.07 in waterPressure=0.03 in water
Figure B.1. Gas transmission rate of PET with and without treatment at two different
pressures
0.00E+00
5.00E-04
1.00E-03
1.50E-03
2.00E-03
2.50E-03
20 30 40 50
Temperature (oC)
GT
R (m
ol/m
2 .s)
Nylon Clear
PPFSPAA
PEI
Figure B.2. Gas transmission rate of Nylon with and without treatment at different
temperatures
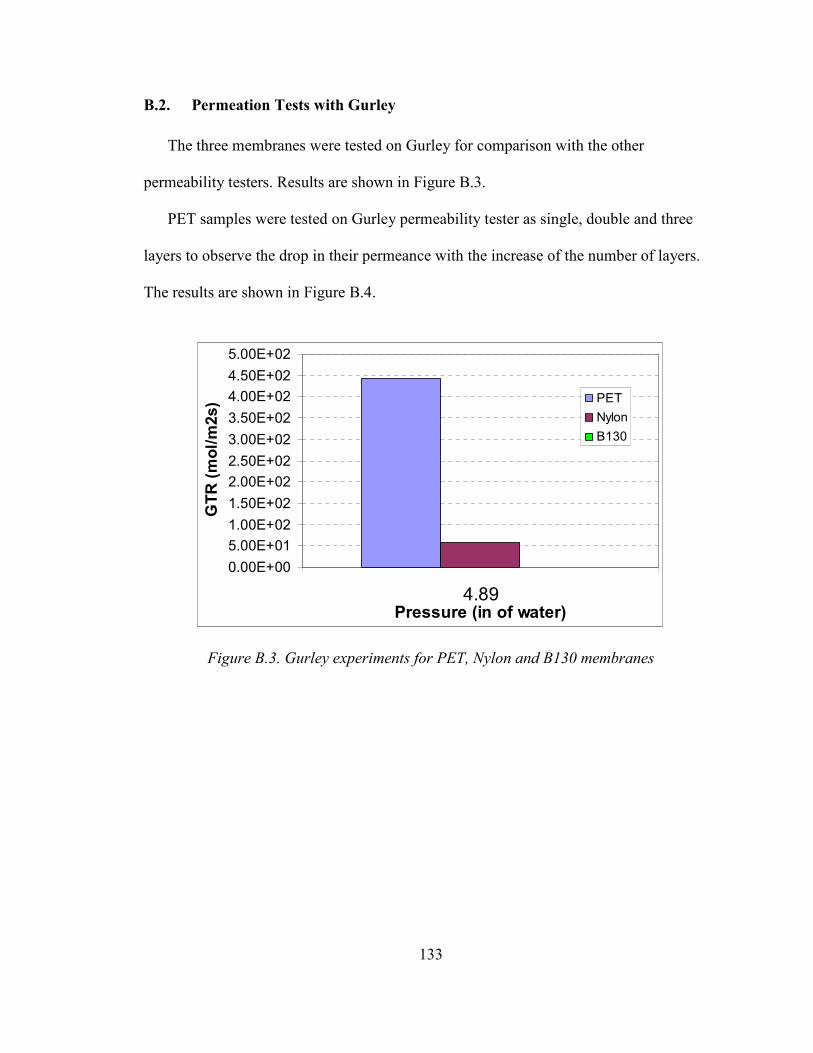
133
B.2. Permeation Tests with Gurley
The three membranes were tested on Gurley for comparison with the other
permeability testers. Results are shown in Figure B.3.
PET samples were tested on Gurley permeability tester as single, double and three
layers to observe the drop in their permeance with the increase of the number of layers.
The results are shown in Figure B.4.
0.00E+005.00E+011.00E+021.50E+022.00E+022.50E+023.00E+023.50E+024.00E+024.50E+025.00E+02
4.89Pressure (in of water)
GTR (mol/m2s) PET
NylonB130
Figure B.3. Gurley experiments for PET, Nylon and B130 membranes
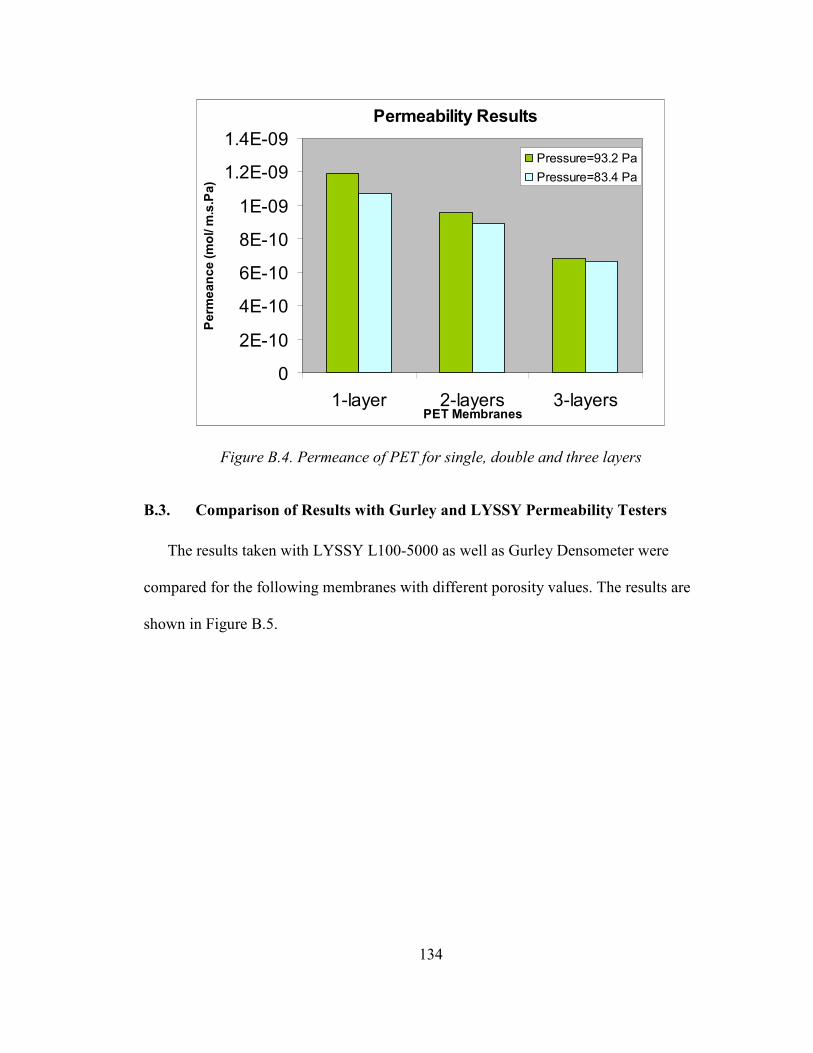
134
Permeability Results
0
2E-10
4E-10
6E-10
8E-10
1E-09
1.2E-09
1.4E-09
1-layer 2-layers 3-layersPET Membranes
Permeance (mol/ m.s.Pa)
Pressure=93.2 PaPressure=83.4 Pa
Figure B.4. Permeance of PET for single, double and three layers
B.3. Comparison of Results with Gurley and LYSSY Permeability Testers
The results taken with LYSSY L100-5000 as well as Gurley Densometer were
compared for the following membranes with different porosity values. The results are
shown in Figure B.5.
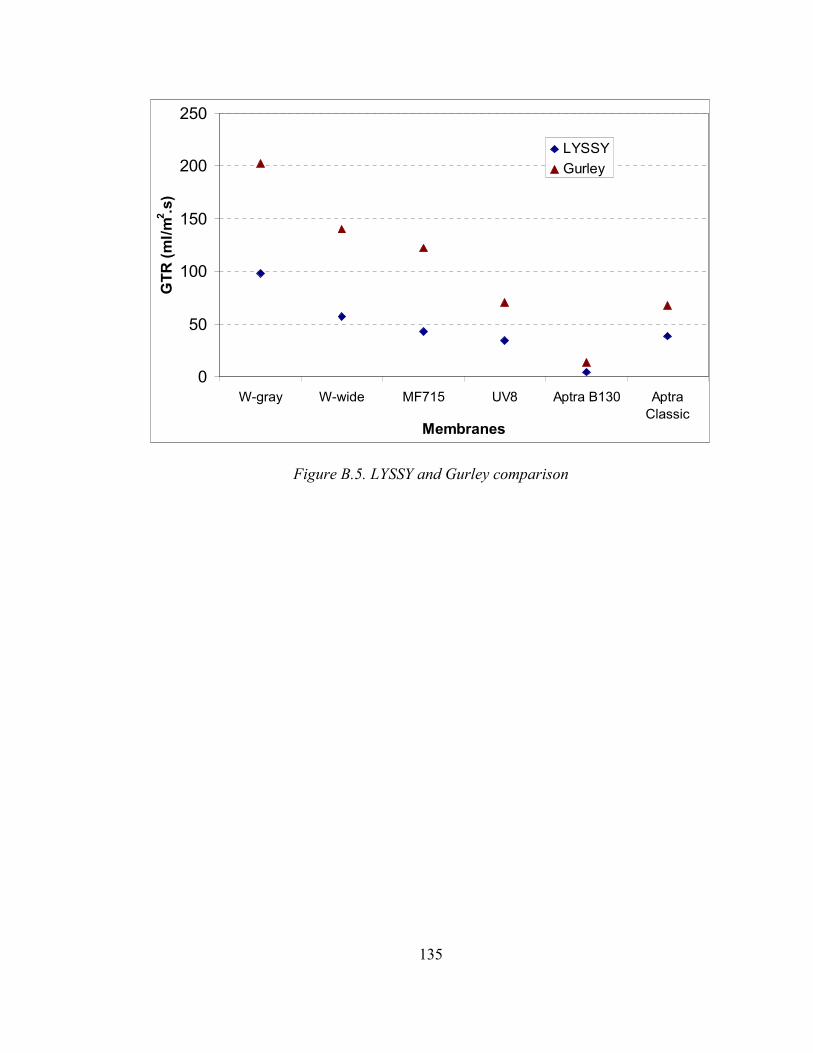
135
0
50
100
150
200
250
W-gray W-wide MF715 UV8 Aptra B130 AptraClassic
Membranes
GTR (ml/m2.s)
LYSSYGurley
Figure B.5. LYSSY and Gurley comparison
136
APPENDIX C
SOURCE CODES
C.1. Matlab Code for Permeation of Gases through Porous Membranes
% Matlab code to calculate permeation of gases through microporous membranes using
probabilistic modeling
% Authors: Tacibaht Turel and Yasser Gowayed
% All rights reserved 2007
clear all;
NUMBEROFRUNS = 5;
fprintf(1, '*****************************************************\n');
fprintf(1,'Pressure Rate Jk Jp TimeAve \n');
for runs=1:NUMBEROFRUNS
clear;
SCALEFACTOR = 100000;
%%1. %%%%%%%INPUT PARAMETERS%%%%%%%%%%%%%
dP=0.55/4.014/0.001;
dist=0.040775;
SlugH=1; %Slug height to calculate pressure (cm)
Temperature=24; % Temperature (C)
thickness=10; %Membrane thickness (micron)
Mgas=0.02897; %Molecular weight of gas (kg/mol)
MD=3.7; %Molecule Diameter (Ǻ)

137
tp=1; % Tortousity
Porosity=0.094; %Porosity of membrane
%Dum variables and unit conversions
pass=0;
passed = 0;
avepD=0;
molD=0;
ave=0;
Patm=101325.01; %Atmospheric Pressure (1 atm) in Pascal:
SlugP=(SlugH*0.78/2.54)/4.014/0.001; %Slug pressure in Pa
PressurePa=dP-SlugP; %Pressure difference at the bottom in Pa
Pamb=Patm+SlugP; %Ambient Pressure: (1 atm + slug pressure) in Pascal
Pressure=PressurePa/101325.01; %Pressure in atm
molD=MD*(10^(-4)); %%Molecule Diameter in micron
ChamberVolumeActualm=39.2699*1e-9; %Chamber volume in m^3 for 50 mm of the capillary
%%Constants used in calculations:
RGasConstant=8.31451; %Gas Constant (J/mol.K)
RGasConstant2=82.0578; %Gas Constant (cm^3.atm/g-mol.K)
NAvagadro=6.0221367*(10^23); %Avagadro's Number
kb=1.38065*(10^(-23)); %Boltzmann Constant (m^2.kg)/(s^2.K)
%%2. %%%%%%%%CALCULATE NECESSARY PARAMETERS%%%%%%%%%%%%%%
%Calculate gas velocity using v=(8RT/M*pi)^1/2 in m/s
Vgas=((8*RGasConstant*(Temperature+273.15))/(Mgas*pi))^(1/2);
%Calculate no. of molecules that will occupy measured capillary volume
%from PV=NkT (N=no. of molecules)
nmolsActual=((Pamb)*ChamberVolumeActualm)/(kb*(Temperature+273.15));
sheet_sizeactual = pi*(1.0625*25.4)^2/4; %Sample area (mm^2)
138
sheet_size=sheet_sizeactual*1e6; %Sample area (micron^2)
%Calculate Mean Free Path in centimeters
MeanFreePath=(RGasConstant2*(Temperature+273.15))/(4.4428829*((MD/100000000)^2)*(dP/1
01325.01+1)*NAvagadro);
mfp=MeanFreePath*10000;%Mean Free Path in micron
%%3. %%%%%%%%%GENERATE RANDOM PARAMETERS%%%%%%%%%%%%
poreDave=0.216; %Given average pore diameter (micron)
%% Calculate no. of pores based on experimental porosity distribution
nporesActual=(Porosity*(sheet_size))/(pi*(0.00979*(0.3835^2)/4+0.148*(0.2274^2)/4+0.723*(0.20
85^2)/4+0.12*(0.1922^2)/4));
npores=nporesActual/SCALEFACTOR; %Total no. of pores in scaled area
%% Pore groups based on pore diamater upper limit (pdul) and lower
%% limit (pdll):
NUMPOREGROUPS = 4; %for PET
np(1)=npores*0.979/100;
pdul(1)=0.5292;
pdll(1)=0.2378;
np(2)=npores*14.8/100;
pdul(2)=0.237;
pdll(2)=0.2178;
np(3)=npores*72.3/100;
pdul(3)=0.2170;
pdll(3)=0.20;
np(4)=npores*12/100;
pdul(4)=0.1997;
pdll(4)=0.1846;
%% Random pore distribution generation in "porecount" subroutine
[poreD, npores, pAve]=porecount(NUMPOREGROUPS, npores, np, pdll, pdul);
139
%% Calculate porosity of created random sample in "porosity" subroutine
fraction_of_holes=porosity(npores, poreD, SCALEFACTOR, sheet_size);
avepD=mean(poreD)/1000000; %Actual average in meters based on randomly created pores
%Calculate knudsen and viscous results in "knudsen" subroutine
[Jk, Jp]=knudsen(avepD, fraction_of_holes, tp, RGasConstant, Temperature, Vgas, mfp,
PressurePa, thickness);
PercPassed=fraction_of_holes; % Percent passed assumed to be equal to porosity
%The number of molecules that will pass through at time t:
nmolscs=PercPassed*(thickness/dist)*PressurePa*(sheet_sizeactual/1000000)*(molD/1000000)/(
kb*(Temperature+273.15));
%Calculate molecular trajectory in "trajectory" subroutine
avenewpath=trajectory(NUMPOREGROUPS, pAve, thickness, mfp);
%%4. %%%%%%%%%%%%CALCULATE GTR%%%%%%%%%%%%%%%%%
Time1=(avenewpath/1000000)/Vgas; %Average time for first set of molecules to pass
TimeTotal=(nmolsActual*Time1)/(nmolscs); %Total time for capillary movement
mol=nmolsActual*kb/RGasConstant; %Calculate no. of molecules in mols
Rate=mol/TimeTotal;
Rate=Rate/(sheet_sizeactual/1000000); %Calculate GTR (mol/m^2.s)
Pinch=PressurePa*0.001*4.014; %Pressure difference (inch of water)
fprintf(1, '%g \t %3d \t %3d \t %3d \t %g \n', Pinch, Rate, Jk, Jp, TimeTotal);
end
C.2. Matlab Code for Permeation of Mimics through Porous Membranes
% Matlab code to calculate permeation of mimics through microporous membranes using
probabilistic modeling
% Authors: Tacibaht Turel and Yasser Gowayed
% All rights reserved 2007
140
clear all;
NUMBEROFRUNS = 5;
fprintf(1, '*****************************************************\n');
fprintf(1,'Temperature GTR TimeAve \n');
for runs=1:NUMBEROFRUNS %number of runs
clear;
SCALEFACTOR = 100000;
%%Constants
RGasConstant=8.31451; %Gas Constant (J/mol.K)
RGasConstant2=82.0578; %Gas Constant (cm3.atm/g-mol.K)
NAvagadro=6.0221367*(10^23); %Avagadro's number
kb=1.38065*(10^(-23)); % Boltzmann Constant (m2.kg)/(s2.K)
%%1. %%%%%%%INPUT PARAMETERS%%%%%%%%%%%%%
SlugH=1; %Slug height to calculate pressure (cm)
Temperature=39; %Temperature (C)
thickness=10; %Membrane thickness (micron)
Mgas=0.136234; %Molecular weight of gas (kg/mol)
MD=7.26; %Molecule diameter (Ǻ)
tp=1; %Tortousity
Porosity=0.094; %Porosity for PET
gasdensity = 5.2607; %4.7 times air at given temperature (kg/m^3)
area_of_capillary = pi*(1^2)/4; %area of capillary (mm^2)
capillary_volume=area_of_capillary*50; %volume of 50mm of capillary (mm^3)
141
pass=0;
passed = 0;
aveporeD=0;
molD=0;
ave=0;
Patm=101325.01; %Atmospheric Pressure (1 atm) in Pascal:
SlugP=(SlugH*0.78/2.54)/4.014/0.001; %Slug pressure in Pa
dP=SlugP;
PressurePa=SlugP; %Pressure difference at the bottom in Pa
Pamb=Patm+SlugP; %Ambient Pressure: (1 atm + slug pressure) in Pascal
Pressure=PressurePa/101325.01; %Pressure in atm
molD=MD*(10^(-4)); %Molecule Diameter in micron
%%2. %%%%%%%%CALCULATE NECESSARY PARAMETERS%%%%%%%%%%%%%%
sheet_sizeactual = pi*(1.0625*25.4)^2/4; %Sample area (mm^2)
sheet_size=sheet_sizeactual*1e6; %Sample area (micron^2)
%Calculate Mean Free Path in centimeters
MeanFreePath=(RGasConstant2*(Temperature+273.15))/(4.4428829*((MD/100000000)^2)*(Pres
surePa/101325.01+1)*NAvagadro);
mfp=MeanFreePath*10000; %Mean Free Path in micron
%%3. %%%%%%%%%GENERATE RANDOM PARAMETERS%%%%%%%%%%%%
poreDave=0.216; %Given average pore diameter (micron)
%% Calculate no. of pores based on experimental porosity distribution
nporesActual=(Porosity*(sheet_size))/(pi*(0.00979*(0.3835^2)/4+0.148*(0.2274^2)/4+0.723*(0.20
85^2)/4+0.12*(0.1922^2)/4));
npores=nporesActual/SCALEFACTOR; %Total no. of pores in scaled area
%% Pore groups based on pore diamater upper limit (pdul) and lower limit(pdll)
NUMPOREGROUPS = 4; %for PET
np(1)=npores*0.00979;

142
pdul(1)=0.5292;
pdll(1)=0.2378;
np(2)=npores*0.148;
pdul(2)=0.237;
pdll(2)=0.2178;
np(3)=npores*0.723;
pdul(3)=0.2170;
pdll(3)=0.20;
np(4)=npores*0.12;
pdul(4)=0.1997;
pdll(4)=0.1846;
%% Random pore distribution generation in "porecount" subroutine
[poreD, npores, pAve]=porecount(NUMPOREGROUPS, npores, np, pdll, pdul);
%% Calculate porosity of created random sample in "porosity" subroutine
fraction_of_holes=porosity(npores, poreD, SCALEFACTOR, sheet_size);
PercPassed=fraction_of_holes; % Percent passed assumed to be equal to porosity
%Calculate molecular trajectory in "trajectory" subroutine
avenewpath=trajectory(NUMPOREGROUPS, pAve, thickness, mfp);
Pdif=0.00075*(0.0254^2)/(0.001^2); %Evaporation pressure difference for 39 C (Pa)
%Calculate mass loss rate in kg/s
MassLossRate=(sheet_sizeactual/1000000)*Pdif*sqrt(Mgas/(2*pi*RGasConstant*(Temperature+
273.15)));
q_bchamber=MassLossRate/gasdensity; % Flow rate at bottom chamber (m^3/s)
q_topchamber = q_bchamber*Porosity*thickness/avenewpath; % Flow rate in top chamber
(m^3/s)
q_capillary=q_topchamber*area_of_capillary/sheet_sizeactual; %Flow rate in capillary (m^3/s)
% Time for 50 mm movement of slug:
time_for_slug=capillary_volume*1e-9/q_capillary;
143
%Volume rate of slug movement in ml/s=cm^3/s.
Vr=q_capillary*(10^6)
%%4. %%%%%%CALCULATE GTR%%%%%%%%%%%%%%
%Gas Transmission Rate in mol/m^2.s
GTR=Vr*Pamb/(RGasConstant*Temperature*sheet_sizeactual);
fprintf(1, '%3d \t %3d \t %g \n', Temperature, GTR, time_for_slug);
end %end number of runs
C.3. Matlab Code for Permeation of Gases through Membranes with Active
Elements
% Matlab code to calculate permeation of gases through microporous membranes with active
elements
% using probabilistic modeling for chemisorption and physisorption
% Authors: Tacibaht Turel and Yasser Gowayed
% All rights reserved 2007
clear all;
NUMBEROFRUNS = 5;
fprintf(1, '*****************************************************\n');
fprintf(1,'Pressure Rate Jk Jp TimeAve \n');
for runs=1:NUMBEROFRUNS
clear;
SCALEFACTOR = 100000;
%%1. %%%%%%%INPUT PARAMETERS%%%%%%%%%%%%%
dP=0.55/4.014/0.001;
dist=0.040775;
SlugH=1; %Slug height to calculate pressure (cm)
Temperature=24; % Temperature (C)
thickness=10; %Membrane thickness (micron)

144
Mgas=0.02897; %Molecular weight of gas (kg/mol)
MD=3.7; %Molecule Diameter (Ǻ)
tp=1; % Tortousity
Porosity=0.094; %Porosity of membrane
% Chemisorption parameters:
poreDadd=0.035; % the increase on the pore diameter after modification (micron)
dense=18e+06; % # of active elements per micron^2
%Dum variables and unit conversions
pass=0;
passed = 0;
avepD=0;
molD=0;
ave=0;
Patm=101325.01; %Atmospheric Pressure (1 atm) in Pascal:
SlugP=(SlugH*0.78/2.54)/4.014/0.001; %Slug pressure in Pa
PressurePa=dP-SlugP; %Pressure difference at the bottom in Pa
Pamb=Patm+SlugP; %Ambient Pressure: (1 atm + slug pressure) in Pascal
Pressure=PressurePa/101325.01; %Pressure in atm
molD=MD*(10^(-4)); %%Molecule Diameter in micron
ChamberVolumeActualm=39.2699*1e-9; %Chamber volume in m^3 for 50 mm of the capillary
%%Constants used in calculations
RGasConstant=8.31451; %Gas Constant (J/mol.K)
RGasConstant2=82.0578; %Gas Constant (cm^3.atm/g-mol.K)
NAvagadro=6.0221367*(10^23); %Avagadro's Number
kb=1.38065*(10^(-23)); %Boltzmann Constant (m^2.kg)/(s^2.K)
%%2. %%%%%%%%CALCULATE NECESSARY PARAMETERS%%%%%%%%%%%%%%
%Calculate gas velocity from v=(8RT/M*pi)^1/2 in m/s
Vgas=((8*RGasConstant*(Temperature+273.15))/(Mgas*pi))^(1/2);

145
%Calculate no. of molecules that will occupy measured capillary volume
%from PV=NkT (N=no. of molecules)
nmolsActual=((Pamb)*ChamberVolumeActualm)/(kb*(Temperature+273.15));
sheet_sizeactual = pi*(1.0625*25.4)^2/4; %Sample area (mm^2)
sheet_size=sheet_sizeactual*1e6; %Sample area (micron^2)
%Calculate Mean Free Path in centimeters
MeanFreePath=(RGasConstant2*(Temperature+273.15))/(4.4428829*((MD/100000000)^2)*(dP/1
01325.01+1)*NAvagadro);
mfp=MeanFreePath*10000;%Mean Free Path in micron
%%3. %%%%%%%%%GENERATE RANDOM PARAMETERS%%%%%%%%%%%%
poreDave=0.216; %Given average pore diameter (micron)
%% Calculate no. of pores based on experimental porosity distribution
nporesActual=(Porosity*(sheet_size))/(pi*(0.00979*(0.3835^2)/4+0.148*(0.2274^2)/4+0.723*(0.20
85^2)/4+0.12*(0.1922^2)/4));
npores=nporesActual/SCALEFACTOR; %Total no. of pores in scaled area
%% Pore groups based on pore diamater upper limit (pdul) and pd lower
%% limit (pdll):
NUMPOREGROUPS = 4; %for PET
np(1)=npores*0.979/100;
pdul(1)=0.5292;
pdll(1)=0.2378;
np(2)=npores*14.8/100;
pdul(2)=0.237;
pdll(2)=0.2178;
np(3)=npores*72.3/100;
pdul(3)=0.2170;
pdll(3)=0.20;
np(4)=npores*12/100;
146
pdul(4)=0.1997;
pdll(4)=0.1846;
%% Random pore distribution generation in "porecount" subroutine
[poreD, npores, pAve]=porecount(NUMPOREGROUPS, npores, np, pdll, pdul);
%% Calculate porosity of created random sample in "porosity" subroutine
fraction_of_holes=porosity(npores, poreD, SCALEFACTOR, sheet_size);
avepD=mean(poreD)/1000000; %Actual average in meters based on randomly created pores
%Calculate knudsen and viscous results in "knudsen" subroutine
[Jk, Jp]=knudsen(avepD, fraction_of_holes, tp, RGasConstant, Temperature, Vgas, mfp,
PressurePa, thickness);
PercPassed=fraction_of_holes; % Percent passed assumed to be equal to porosity
%The number of molecules that will pass through at time t:
nmolscs=PercPassed*(thickness/dist)*PressurePa*(sheet_sizeactual/1000000)*(molD/1000000)/(
kb*(Temperature+273.15));
%%4. %%%%%%%%%%PORE DIAMETER CHANGE WITH ACTIVE
ELEMENTS%%%%%%%%%%%%%
% PGMA causes around 15-20 nm increase. With active elements there is
% around 35 nm of increase in thickness and therefore reduction in poreD
poreD1=poreD-poreDadd; % pore diameter will be reduced by the thickness increase
poreDt=0;
poreD1t=0;
for i=1:npores
poreDt=poreDt+poreD(i)^2;
poreD1t=poreD1t+poreD1(i)^2;
end
VolDecrease=(poreDt-poreD1t)/poreDt; %Gives percent decrease in volume which will decrease
the number of molecules in pores.
nmolscs=nmolscs*(1-VolDecrease);

147
PoreWallArea=SCALEFACTOR*sum(thickness*pi*poreD1); %Area of pore walls in micron^2
Na=PoreWallArea*dense;
%Calculate molecular trajectory in "trajectory" subroutine
avenewpath=trajectory(NUMPOREGROUPS, pAve, thickness, mfp);
Time1=(avenewpath/1000000)/Vgas;
%Calculate retardation in "Chemisorption" subroutine
[nTotal, nmolsPassed, nmolscs]=Chemisorption(thickness, poreD1, nmolscs, nmolsActual,
sheet_sizeactual, Na, npores);
%Calculate time for the no. of molecules which could pass through
LeftnmolsActual=nmolsActual-nmolsPassed;
if LeftnmolsActual>0
TimeA=Time1*nTotal; %TimeA=Time for Adsorption
TimeF=LeftnmolsActual*Time1/nmolscs; %TimeF=Time for flow after saturation
TimeTotal=TimeA+TimeF;
mol=nmolsActual*kb/RGasConstant;
slugx=5;
else
mol=nmolsPassed*kb/RGasConstant;
slugx=nmolsPassed*5/nmolsActual; % slug movement in cm
TimeTotal=Time1*nTotal;
end
%%5. %%%%%%%%%%%%%CALCULATE GTR%%%%%%%%%%%%%%%%
Rate=mol/TimeTotal;
Rate=Rate/(sheet_sizeactual/1000000);
Pinch=PressurePa*0.001*4.014;
Timefor5cm=5*TimeTotal/slugx;
fprintf(1, '%g \t %3d \t %3d \t %3d \t %g \n', Pinch, Rate, Jk, Jp, Timefor5cm);
end
148
C.4. Subroutines
C.4.1. Chemisorption
function [nTotal, Nc, nmolsPassed, nmolscs]=Chemisorption(thickness, poreD1, nmolscs,
nmolsActual, sheet_sizeactual, Na, npores)
%Calculates number of molecules adsorbed inside pores, based on Gaussian
%assumptions for chemisorption and physisorption:
%% Input Parameters:
fprintf(1, 'Gas Type= Ammonia \n');
% From Gaussian:
dis = 5e-4; % min. chemisorption distance in micron
disP1= 8e-4;
disP2=12e-4;
disP3=15e-4;
poreD1t=0;
for i=1:npores
poreD1t=poreD1t+poreD1(i)^2;
end
InitialArea=pi*poreD1t/4;
AttArea=sum(pi*dis*(poreD1-dis)); %Attraction area for chemisorption
Nm=nmolscs*AttArea/InitialArea; %Total # of molecules in chemisorption field in membrane
% InitialArea=pi*poreD2t/4;
AttArea1=sum(pi*disP1*(poreD1-disP1)); %Attraction area for 1st layer of physisorption
NmP(1)=nmolscs*AttArea1/InitialArea; %Total # of molecules in physisorption field in membrane
% InitialArea=pi*poreD3t/4;
AttArea2=sum(pi*disP2*(poreD1-disP2)); %Attraction area for 2nd layer of physisorption
NmP(2)=nmolscs*AttArea2/InitialArea; %Total # of molecules in physisorption field in membrane
149
% InitialArea=pi*poreD4t/4;
AttArea3=sum(pi*disP3*(poreD1-disP3)); %Attraction area for 3rd layer of physisorption
NmP(3)=nmolscs*AttArea3/InitialArea; %Total # of molecules in physisorption field in membrane
%Chemisorption:
n=Na/Nm; %Total time instances necessary to fill all active sites
Nads=4*Na; %Potential no. of molecules that can be adsorbed by chemisorption and 3 layers of
physisorption
nmolsPassedTotal=n*nmolscs; %Total no. of molecules that will go through the pore in n
instances
%Physisorption:
for i=1:3
NaLayers(i)=Na;
ni(i)=Na/NmP(i);
nmolsPassedTotal=nmolsPassedTotal+ni(i)*nmolscs; %Total no. of molecules that will actually
pass
end
nmolsPassed=nmolsPassedTotal-Nads; %number of molecules that passed through the pore
until saturation
nTotal=n+sum(ni); %Total time instances necessary for saturation
C.4.2. Porecount
function [poreD, npores, pAve]=porecount(NUMPOREGROUPS, npores, np, pdll, pdul)
%Calculates number of pores based on pore groups and pore sizes for each
%group obtained from porosity measurements
npores=floor(npores); %convert to integers
np=floor(np); %convert to integers
npk=0; %dum variable for numbering pores
pSum=0; %dum variable

150
for k=1:NUMPOREGROUPS
for i=1:np(k)
j=i+npk;
poreD(j)=pdll(k)+(pdul(k)-pdll(k))*rand;
pSum=pSum+poreD(j);
end %end i loop
pAve(k)=pSum/(j-npk);
pSum=0;
npk=npk+np(k);
end %end k loop
npores=j;
C.4.3. Porosity
function [fraction_of_holes]=porosity(npores, poreD, SCALEFACTOR, sheet_size)
%%Calculates actual porosity of randomly created pores
area_of_pores = 0;
for i=1:npores
area_of_pores = area_of_pores + (pi*(poreD(i)^2)/4);
end %end of npores loop
fraction_of_holes = area_of_pores*SCALEFACTOR/(sheet_size);
C.4.4. Knudsen
function [Jk, Jp]=knudsen(avepD, fraction_of_holes, tp, RGasConstant, Temperature, Vgas, mfp,
PressurePa, thickness)
%% Calculates fluxes based on Knudsen and Viscous flow equations
A=(avepD/3)*(fraction_of_holes/tp)/(RGasConstant*(Temperature+273.15)); %knudsen const
B=(pi*(avepD^2)/128)*(fraction_of_holes/tp)/(RGasConstant*(Temperature+273.15)); %viscous
Kk=Vgas*A; %knudsen coef

151
Kp=Vgas*B/(mfp/1000000); %viscous coef
Jk=Kk*PressurePa/(thickness/1000000); %Knudsen flux
Jp=Kp*PressurePa/(thickness/1000000); %Viscous flux
C.4.5. Trajectory
function [avenewpath]=trajectory(NUMPOREGROUPS, pAve, thickness, mfp) % Calculates the total length of molecular trajectory inside the pore avenewpath = 0; %average of total path length inside pores
%%Calculate the length the molecule will travel inside the pore
for k=1:NUMPOREGROUPS
xlim=pAve(k); %dum variable to pick ave pore diam for group
x1=rand*xlim; %2D pore with x as width and z as height
z1=0;
newpath=0; %another dum variable
alfa=rand*180; %direction angle
a=0; %number of steps that molecule takes
while z1<thickness
coeff=180;
a=a+1;
angle=0;
if alfa>90
alfa=180-alfa;
xlength=mfp*abs(cos(alfa*pi/180));
if (x1-xlength)<0
length=x1/abs(cos(alfa*pi/180));
x=0;
coeff=90;
angle=0;

152
else
length=mfp;
x=x1-xlength;
end %ends if (x1-xlength)<0
else
xlength=mfp*abs(cos(alfa*pi/180));
if (x1+xlength)>xlim
length=(xlim-x1)/abs(cos(alfa*pi/180));
x=xlim;
coeff=90;
angle=90;
else
length=mfp;
x=x1+xlength;
end %ends if (x1+xlength)>xlim
end %ends alfa>90
z=z1+length*abs(sin(alfa*pi/180));
newpath=newpath+length;
z1=z;
x1=x;
alfa=angle+rand*coeff;
alf(a)=alfa;
len(a)=length;
end %ends the while loop
avenewpath=avenewpath+newpath;
end %ends the calculation for molecular trajectory inside pores for all groups
avenewpath = avenewpath/NUMPOREGROUPS;
Recommended


![Water 2012 OPEN ACCESS water - Semantic Scholar · 2017-05-28 · Water 2012, 4 631 separate gas molecules [6–9]. In these cases, microporous silica membranes have molecular-sieving](https://img.pdfslide.net/doc/110x75/5f04b6267e708231d40f5375/water-2012-open-access-water-semantic-scholar-2017-05-28-water-2012-4-631-separate.jpg)


![Fast and efficient synthesis of microporous polymer ......in organic electronics [8]. Among the microporous materials, conjugated microporous polymers (CMPs) [9,10] or porous aro-matic](https://img.pdfslide.net/doc/110x75/5ed931156714ca7f47695094/fast-and-efficient-synthesis-of-microporous-polymer-in-organic-electronics.jpg)