Genome-Scale Characterization of Metabolic Interactions
in a Clostridial Co-culture for Consolidated Bioprocessing
by
Fahimeh Salimi
A thesis submitted in conformity with the requirements for the degree of
Doctor of Philosophy
Graduate Department of Chemical Engineering and Applied Chemistry
University of Toronto
copy Copyright by Fahimeh Salimi 2014
ii
Genome-Scale Characterization of Metabolic Interactions in a
Clostridial Co-culture for Consolidated Bioprocessing
Fahimeh Salimi
Doctor of Philosophy
Graduate Department of Chemical Engineering and Applied Chemistry
University of Toronto
2014
Abstract
The co-culture of Clostridium acetobutylicum and Clostridium cellulolyticum can offer a
potential CBP approach for producing commodity chemicals from cellulosic biomass This thesis
examines the nature of interactions between these two species in this co-culture An expanded
genome-scale metabolic model of C acetobutylicum which incorporates thermodynamic and
metabolomic data was presented Flux variability analysis showed the presence of alternate
carbon and electron sinks that allows for different carbon assimilation patterns and ranges of
product formation rates The genome-scale metabolic model of C cellulolyticum was presented
and validated against experimental data and was able to predict the metabolism of C
cellulolyticum on cellulose and cellobiose A genome-scale model of the clostridial co-culture
metabolism was developed by integrating C cellulolyticum and C acetobutylicum metabolic
models and was used to analyze the integrated physiology of this co-culture the simulation
results showed that at high cellulose concentrations the model is not able to capture the C
cellulolyticum growth arrest suggesting that the removal of cellobiose inhibition by C
acetobutylicum is not the main factor that improves cellulose degradation in the co-culture
Experimental methods were developed to characterize the cellulolytic activity the co-culture
metabolism and the metabolic interactions in this co-culture Comparative qPCR analyses and
iii
characterization of the metabolism in this clostridial co-culture along with the mono-cultures
revealed that significant increase in the rate of cellulose hydrolysis can be achieved using the co-
culture due to the synergy between the two clostridial species It is likely that C acetobutylicum
improves the cellulolytic activity of C cellulolyticum in the co-culture through exchange of
metabolites such as pyruvate enabling it to grow and metabolize cellulose under suboptimal co-
culture conditions An in vivo metabolite analysis of C cellulolyticum suggested a limitation on
the lactate transportation pathway that leads to intracellular lactate accumulation and the growth
arrest
iv
Acknowledgments
I would like to express my gratitude to my supervisor Professor Radhakrishnan Mahadevan for
his support during this research I would like to sincerely thank my thesis committee members
Professor Elizabeth Edwards and Professor Bradley Saville for their guidance throughout this
study
I like to thank members of Laboratory of Metabolic Systems Engineering Pratish Ahsan
Patrick Nikolas Nadeera Cleo Sarat Chris Kevin and the present and past members of
BioZone for being supportive colleagues and friends
This work was financially supported by Natural Sciences and Engineering Research Council of
Canada (NSERC) Discovery grant and the Graduate School of Chemical Engineering and
Applied Chemistry at the University of Toronto I am grateful to Professor Edgar Acosta for
providing access to Total Organic Carbon Analyzer
Finally I want to thank my family for their love support and encouragement and my friend Dr
Hamed Ghotbi for always being there This thesis is dedicated to my family
v
Table of Contents
Acknowledgments iv
Table of Contents v
List of Tables ix
List of Figures x
List of Appendices xiv
Chapter 1 - Introduction 1
11 Cellulosic butanol an alternative biofuel 1
12 Rationale 5
13 Research objectives 6
14 Thesis outline 7
Chapter 2 - Background and Literature Review 9
21 Consolidated bioprocessing of cellulosic biomass 9
22 Biobutanol production using a clostridial co-culture a CBP approach 17
221 Clostridium acetobutylicum fermentation 20
2211 Central metabolism of Clostridium acetobutylicum characterization of enzymes
pathways and genes 21
2212 Metabolic shift from acidogenesis to solventogenesis 28
222 C cellulolyticum fermentation 30
23 Genome-scale metabolic modeling 35
231 Metabolic network reconstruction 37
232 Flux-balance analysis (FBA) 39
24 Conclusion 42
Chapter 3 Understanding Clostridium acetobutylicum ATCC 824 Metabolism Using Genome-
Scale Thermodynamics and Metabolomics-based Modeling 43
31 Abstract 43
32 Introduction 44
33 Methods 45
331 C acetobutylicum metabolic network reconstruction 45
332 Flux balance analysis (FBA) and flux variability analysis (FVA) 47
333 Thermodynamics-based metabolic flux analysis (TMFA) 48
vi
334 Batch cultivation and metabolomic samples 48
34 Results and discussion 49
341 Genome-scale network reconstruction and flux balance analysis 49
342 Flux variability analysis 51
343 Thermodynamics-based metabolic flux analysis 54
344 Metabolomic data analysis 54
35 Conclusion 55
Chapter 4 Genome-scale Metabolic Modeling of a Clostridial Co-culture for Consolidated
Bioprocessing 57
41 Abstract 57
42 Introduction 58
43 Methods 61
431 C acetobutylicum and C cellulolyticum metabolic network reconstructions 61
432 Flux balance analysis (FBA) 63
433 Co-culture model development 64
44 Results and discussion 66
441 C cellulolyticum metabolic network analysis 66
4411 Central metabolism and energetics 66
4412 Analysis of by-product secretion patterns in C cellulolyticum during growth on
cellobiose 68
4413 Analysis of C cellulolyticum growth physiology on cellulose 72
4414 Analysis of C cellulolyticum batch growth on cellulose 75
442 Genome-scale metabolic modeling of the co-culture and strategies for improving the co-
culture metabolism 77
4421 Analysis of the co-culture for butanol production 79
45 Concluding remarks 81
46 Nomenclature for chapter 4 82
Chapter 5 Characterizing Metabolic Interactions in the Clostridial Co-culture 84
51 Abstract 84
52 Background 85
53 Methods 87
531 Strains and media 87
532 Co-culture experiments 88
vii
533 Analysis 89
5331 Primer design and qPCR standard plasmid DNA preparation 90
5332 Genomic DNA isolation 91
5333 qPCR reaction preparation detection and quantification 92
54 Results and discussion 93
541 Experimental characterization of C cellulolyticum cellulolytic activity at high cellulose
concentration addressing the pH effect 93
542 Experimental characterization of the co-culture metabolism 94
543 Experimental characterization of the co-culture metabolism with low concentration of C
acetobutylicum 99
544 Experimental characterization of C acetobutylicum metabolic activity under co-culture
conditions 100
545 Analysis of product formation in the co-culture 103
55 Conclusions 106
Chapter 6 Investigation of the Growth Arrest Event in C cellulolyticum Through an In vivo
Metabolite Analysis 107
61 Background 107
62 Methods 108
621 Experimental characterization of C cellulolyticum cellulolytic activity at high and low
cellulose concentrations 108
622 Method for the metabolomic study 110
623 Calculation of intracellular lactate concentration 111
63 Results and discussion 112
631 Profiling intracellular pHi at high cellulose concentration 117
64 Conclusion 119
Chapter 7 Summary conclusions and recommendations for future work 121
71 Summary and conclusions 121
72 Engineering significance 125
73 Future work 126
References 130
Appendix A supplementary information for chapter 3 148
Appendix B supplementary information for chapter 3 153
B-1 Extraction of intracellular metabolites from Clostridium acetobutylicum cell cultures 153
B-2 NMR sample preparation 153
viii
B-3 NMR spectroscopy 153
B-4 NMR compound identification and quantification 154
B-5 Method for thermodynamics-based metabolic flux analysis (TMFA) formulation 154
Appendix C supplementary information for chapter 4 157
Appendix D supplementary information for chapter 5 158
D-1 Primer design and qPCR standard plasmid DNA preparation 158
D-2 qPCR reaction preparation 160
D-3 qPCR calculations and quantifications 161
D-4 qPCR primers cross-specificity test 165
D-5 Genomic DNA isolation 167
D-6 Examination of the specificity of the interactions between C cellulolyticum and C
acetobutylicum in the co-culture 169
D-8 Time profiles of the product formations in the clostridial co-culture experiment 170
D-9 Identifying potential exchanged metabolites in the co-culture 171
D-10 Assessment of C cellulolyticum growth on the supernatant of C acetobutylicum culture177
Appendix E supplementary information for chapter 6 178
ix
List of Tables
Table 2-1 Recent studies on cellulase producing microorganisms for developing native CBP
strategies (adapted from (Olson et al 2012)) 13
Table 2-2 Recent studies on the production of chemicals from cellulose through SSF and
recombinant CBP strategies (adapted from (Hasunuma et al 2013)) 15 Table 2-3 The genomic features of C cellulolyticum (httpwwwjgidoegov) 35 Table 3-1 Specifications of C acetobutylicum metabolic networks 50 Table 3-2 Intracellular and extracellular metabolite concentrations in acidogenic and
solventogenic phases Standard deviations are based on three biological replicates as
presented in the parentheses 55 Table 5-1 Primer sequences used for qPCR analysis 90
Table 6-1 LCMS analysis of the metabolomic samplesyen Cell biomass formation profiles and
sampling points in batches a b e and g are presented in Figure 6-3 eg sample a-1 is the
sample 1 of batch ldquoardquo as indicated by an arrow ND not detectable 115 Table 6-2 C cellulolyticum intracellular pH values estimated from intracellular and extracellular
lactate concentrations in metabolomic samples obtained from C cellulolyticum batch
cultures with high cellulose concentration of 20 gL Total lactic concentration ([lac-] +
[lactic acid]) was obtained from HPLC (extracellular) and LCMS (intracellular)
measurements 118 Table A1 The list of none-gene associated reactions in iFS700 C acetobutylicum metabolic
model 148 Table A2Primer sequences used for qPCR analysis 158
Table A3 PCR protocol 159
Table A4 Plasmid standard solutions used for qPCR calibration 160
Table A5 qPCR protocol 161 Table A6 qPCR standard curves used for the quantifications of C acetobutylicum (CA) and C
cellulolyticum (CC) in the co-culture and mono-culture experiments 163 Table A7 The extracellular metabolite concentrations from NMR analysis of the co-culture and
mono-culture samples at Chenomx samples are explained in Figure A8 175
Table A8 The extracellular metabolite concentrations in mono-culture samples 176 Table A9 The extracellular metabolite concentrations in the co-culture and mono-culture
samples 177
x
List of Figures
Figure 2-1 Various biomass-processing schemes separate hydrolysis and fermentation (SHF)
simultaneous saccharification and fermentation (SSF) simultaneous saccharification and
co-fermentation (SSCF) and consolidated bioprocessing (CBP) (Lynd et al 2002) 10 Figure 2-2 The simplified scheme of the clostridial co-culture fermentation on biomass
hydrolyzates (cellulose and hemicellulose) (1) cellulase (2) hemicellulase enzymes
produced by C cellulolyticum 18 Figure 2-3 Developing viable strains through system-level metabolic engineering using genome
sequence fermentation and omics data along with in silico genome-scale metabolic models
is an essential part of developing commercial biobutanol processes (Lee et al 2008c) 20 Figure 2-4 Central biochemical pathways of Clostridium acetobutylicum (adapted from (Desai
et al 1999)) Enzymes involved in different pathways are given next to the arrows HYDA
(hydrogenase) PTA (phosphotransacetylase) AK (acetate kinase) THL (thiolase) BHBD
(Β-hydroxybutyryl-CoA dehydrogenase) CRO (crotonase) BCD (butyryl-CoA
dehydrogenase) PTB (phosphotransbutyrylase) BK (butyrate kinase) AADC
(Acetoacetate decarboxylase) CoAT (acetoacetyl-CoA acetatebutyrate CoenzymeA
transferase) ADC (acetoacetate decarboxylase) AAD (aldehydealcohol dehydrogenase)
and BDHAampB (butanol dehydrogenase A amp B) 23 Figure 2-5 Central metabolic pathways of Clostridium cellulolyticum (adapted from (Desvaux
2005b)) 1 pyruvate-ferredoxin oxidoreductase 2 hydrogenase 3 NADH-ferredoxin
oxidoreductase 4 lactate dehydrogenase 5 acetaldehyde dehydrogenase 6 alcohol
dehydrogenase 7 phosphotransacetylase 8 acetate kinase 33
Figure 2-6 The process of metabolic model development (adapted from (Covert et al 2001a))
36
Figure 2-7 The metabolic network reconstruction procedure (adapted from (Francke et al
2005)) 38
Figure 2-8 Defining a metabolic system in FBA (adapted from (Palsson 2001)) Arrows show
the reactions interconnecting the metabolites inside and outside the cell membrane as well
as the system boundary 40
Figure 3-1 Venn diagram comparison of the existing model reactions 49 Figure 3-2 The range of product flux variations for C acetobutylicum metabolic products FVA
under stoichiometric thermodynamic and metabolomic constraints (A) and FVA under
predicted maximum growth and butanol formation rates (B) 53 Figure 4-1 The scheme of the clostridial co-culture fermentation on cellulose C cellulolyticum
adheres to the cellulose fibers using cellulosome and hydrolyzes cellulose to cellobiose
(cellb) and glucose (glc) which can be metabolized by C cellulolyticum and C
acetobutylicum in the co-culture The produced pyruvate (pyr) can also be fermented as a
carbon source by C acetobutylicum 59 Figure 4-2 (a) Distribution of reactions in C cellulolyticum metabolic network and (b) the
genomic features and specifications of C cellulolyticum H10 metabolic network 67 Figure 4-3 Model predicted metabolism of C cellulolyticum in chemostat culture on cellobiose
(a) model predicted cellobiose metabolism with no constraint on H2 formation LDH and
PFO pathways (b) model predicted cellobiose metabolism with no constraint on LDH and
PFO pathways (c) model predicted cellobiose metabolism with no constraint on LDH
pathway (d) Model predicted product formation rates of C cellulolyticum on cellobiose
xi
D=012 h-1
and comparison with the experimental data (Guedon et al 1999b) (e)
Goodness of fit for C cellulolyticum growth rate data on cellobiose at various dilution rates
(Guedon et al 1999b) and GAM=15 mmolgDCWh bm celb eth ac lac pyr stand for
cell biomass cellobiose ethanol acetate lactate and pyruvate 71
Figure 4-4 Model predicted cellulose metabolism in chemostat culture by C cellulolyticum (a)
Model prediction of C cellulolyticum growth rate on cellulose at various experimental
dilution rates (Desvaux et al 2001c) (b) model predicted cellulose metabolism with no
constraint on H2 formation LDH and PFO pathways (c) model predicted cellulose
metabolism with no constraint on LDH and PFO pathways (d) model predicted cellulose
metabolism with no constraint on LDH pathway (e) C cellulolyticum model predictions on
cellulose as carbon source and D=008 h-1
and comparison with the experimental data
(Desvaux et al 2001c) bm cel eth ac lac pyr stand for cell biomass cellulose ethanol
acetate lactate and pyruvate and it has been assumed that cellobiose is the major product of
cellulose hydrolysis 74 Figure 4-5 Model predicted metabolic profile of C cellulolyticum in batch culture on cellulose
(a) cell biomass and cellulose profiles are compared to the experimental data at initial
cellulose concentration of 67 gL (b) model predicted cell biomass and sugar profiles and
cellulose profile compared to the experimental data at initial cellulose concentration of 39
gL 77 Figure 4-6 The kinetic profiles of the co-culture metabolism on cellulose as predicted using
DMMM framework C cellulolyticum biomass concentration in the co-culture and mono-
culture C acetobutylicum (ATCC824) biomass concentration in the co-culture cellulose
hydrolysis profile in the co-culture and mono-culture and cellobiose accumulation profiles
in the co-culture and mono-culture under various cellobiose inhibition extents at initial
cellulose concentration of 20 gL 81
Figure 5-1 The scheme of the clostridial co-culture fermentation on cellulose C cellulolyticum
adheres to the cellulose fibers using a cellulosome and hydrolyzes cellulose to cellobiose
(cellb) and glucose (glc) which can be metabolized by C cellulolyticum and C
acetobutylicum in the co-culture The produced pyruvate (pyr) can also be fermented as a
carbon source by C acetobutylicum 86 Figure 5-2 The co-culture experimental set-up C cellulolyticum was cultivated at the initial pH
of 70 for two days and pH was adjusted to 60 after inoculating C acetobutylicum into the
co-culture at 48 hr 89
Figure 5-3 The total solubilized carbon and cell biomass profiles in the C cellulolyticum mono-
culture experiments The cell biomass profile in the mono-culture at pH of 72 (circle) TOC
profile in the mono-culture at pH of 72 (triangle) cell biomass profile in the mono-culture
under the co-culture pH profile (rhombus) and TOC profile in the mono-culture under the
co-culture pH profile (square) The co-culture pH profile includes the initial pH of 70 for
two days and pH adjustment to 60 at 48 hr Cell biomass concentrations were calculated
from qPCR data taking into account that there are eight 16S rRNA genes in C
cellulolyticum genome 94 Figure 5-4 The cellulose solubilization in the co-culture and mono-culture experiments The
profiles of cellulose degradation and cell biomass formations in the co-culture experiment
A with autoclaved iron solution (a) and in the co-culture experiment B with filter sterilized
iron solution (b) The time profiles of C cellulolyticum (circle) C acetobutylicum (square)
and cellulose solubilization in terms of total organic carbon in each co-culture (triangle) at
initial cellulose concentration of 20 gL and under pH profile along with cellulose
xii
solubilization in terms of total organic carbon in C cellulolyticum mono-culture under the
same co-culture conditions (rhombus) The co-culture pH profile includes the initial pH of
70 for two days and pH adjustment to 60 at 48 hr as shown by arrows Figures (a) and (b)
each show one data set representative of two independent experiments with both showing
comparable results Cell biomass concentrations were calculated from qPCR data taking
into account that there are eleven 16S rRNA genes in C acetobutylicum genome and eight
16S rRNA genes in C cellulolyticum genome 95 Figure 5-5 Degradation of cellulose in the co-culture experiments A and B the C cellulolyticum
mono-culture experiment at the optimal pH of 72 and the C cellulolyticum mono-culture
experiment under the co-culture pH profile 5 days after reaching the maximum C
cellulolyticum concentration in the culture (light grey) and after 28 days (dark grey) The
co-culture pH profile includes the initial pH of 70 for two days and pH adjustment to 60 at
48 hr Error bars show the ranges based on two sets of experimental data 96
Figure 5-6 The profiles of cellulose degradation and cell biomass formations in the co-culture
experiment with low concentration of C acetobutylicum The time profiles of C
cellulolyticum (circle) C acetobutylicum (square) and cellulose solubilization in terms of
total organic carbon (triangle) in the co-culture experiment The co-culture pH profile
includes the initial pH of 70 for two days and pH adjustment to 60 at 48 hr The figure
shows one data set representative of two independent experiments with both showing
comparable results Cell biomass concentrations were calculated from qPCR data taking
into account that there are eleven 16S rRNA genes in C acetobutylicum genome and eight
16S rRNA genes in C cellulolyticum genome 100
Figure 5-7 C acetobutylicum biomass profiles in the mono-cultures under co-culture conditions
(a) C acetobutylicum was cultivated on the co-culture medium at pH of 60 and 20 gL
cellulose without glucosepyruvate addition and characterized using qPCR (rhombus) and
hemacytometry (square) (b) C acetobutylicum culture on the co-culture medium at pH 60
and 20 gL cellulose 1 gL glucose was added at day 12 and 1 gL pyruvate was added to
the culture on day 19 as shown by arrows Cell biomass concentrations were calculated
from qPCR data taking into account that there are eleven 16S rRNA genes in C
acetobutylicum genome 102 Figure 5-8 Product concentration ranges in the co-culture experiment A after 28 days (ranges
have been calculated based on two sets of experimental data) and the product
concentrations in the C cellulolyticum mono-culture batch under the co-culture pH profile
after 28 days (asterisk) 104 Figure 6-1 The percentage of cellulose degradation (circle) maximum cell biomass
concentration (rhombus) and maximum rate of cellulose degradation (square) obtained in
120 h in batch cultures of C cellulolyticum as a function of initial cellulose concentration
(Desvaux et al 2000) 108 Figure 6-2 (a) C cellulolyticum cell biomass profiles obtained from protein assay and qPCR
analyses on 20 gL cellulose Arrows indicate the metabolomic sampling points (b) final
concentrations of the products in each set of batches with 20 gL and 2 gL initial cellulose
concentrations (for dynamic profiles see Figure 6-3) Error bars show the ranges in two
duplicate experiments 109 Figure 6-3 The profiles of products and cell biomass formations in the batches from which
metabolomic samples were taken a b at 20 gL and e g at 2 gL initial cellulose
concentration Arrows show the metabolomic sampling points eg sample a-1 is the
sample 1 of batch ldquoardquo as indicated by an arrow 114
xiii
Figure A1 Dynamic Multi-species Metabolic Modeling framework (DMMM) (Zhuang et al
2011) used for developing the clostridial co-culture metabolic model In this model μ is the
cell biomass growth rate ViA and Vi
B are the fluxes of metabolite i predicted by genome-
scale metabolic models of each species in the co-culture X is the cell biomass
concentration [Si] is the concentration of ith
metabolite and Ks i is the saturation constant
for ith
metabolite 157 Figure A2 Derivative melting curves for (a) a C acetobutylicum qPCR assay (b) C
cellulolyticum qPCR assays using standard plasmid solution (105
copiesmicroL) and isolated
genomic DNA 164
Figure A3 Gel electrophoresis image of the qPCR amplifications with C cellulolyticum as the
target species All qPCR products had a single band with different intensities which
confirmed the qPCR product purity 165 Figure A4 Cross-specificity tests for C acetobutylicum (a) and C cellulolyticum (b) plasmids
using qPCR plasmid combinations in contrast to the standard curves Plasmid combinations
of 10x+10
y copiesmicroL were prepared where 0le x y le 8 and x+y=8 and 10
x is the
concentration of CA4(1) and 10y is the concentration of CC10 in the mixture 166
Figure A5 A comparison of C acetobutylicum (a) and C cellulolyticum (b) quantifications in a
co-culture experiment using Norgen and Mo-Bio DNA isolation kits 168 Figure A6 Cellulolytic activities in the sequential co-culture of E coli and C cellulolyticum and
the mono-culture of C Cellulolyticum (control) 169
Figure A7 Time profiles of fermentation products in the co-culture set A replicate experiments
Pyruvate uptake and butanol formation were observed in the co-cultures 171
Figure A8 (ab) The extracellular metabolomic samples 1 2 4 and 5 were taken from co-culture
experiments set A (replicates a b) as shown by arrows The time profiles of C
cellulolyticum (circle) C acetobutylicum (square) and cellulose solubilization in terms of
total organic carbon in each co-culture (triangle) (c) samples 6 7 were taken from C
cellulolyticum mono-culture experiment at pH of 72 and samples A and B were taken from
C cellulolyticum mono-culture experiment under pH profile (data has also been presented
in Figure 5-3) where the cell biomass profile in the mono-culture at pH of 72 (circle) TOC
profile in the mono-culture at pH of 72 (triangle) cell biomass profile in the mono-culture
under pH profile (rhombus) and TOC profile in the mono-culture under pH profile (square)
173 Figure A9 The standard curve of lactate concentration versus peak area obtained from LC-MS
mass chromatograms 178
xiv
List of Appendices
Appendix A supplementary information for chapter 3 148
Appendix B supplementary information for chapter 3 153
B-1 Extraction of intracellular metabolites from Clostridium acetobutylicum cell cultures 153
B-2 NMR sample preparation 153
B-3 NMR spectroscopy 153
B-4 NMR compound identification and quantification 154
B-5 Method for thermodynamics-based metabolic flux analysis (TMFA) formulation 154
Appendix C supplementary information for chapter 4 157
Appendix D supplementary information for chapter 5 158
D-1 Primer design and qPCR standard plasmid DNA preparation 158
D-2 qPCR reaction preparation 160
D-3 qPCR calculations and quantifications 161
D-4 qPCR primers cross-specificity test 165
D-5 Genomic DNA isolation 167
D-6 Examination of the specificity of the interactions between C cellulolyticum and C
acetobutylicum in the co-culture 169
D-8 Time profiles of the product formations in the clostridial co-culture experiment 170
D-9 Identifying potential exchanged metabolites in the co-culture 171
D-10 Assessment of C cellulolyticum growth on the supernatant of C acetobutylicum culture177
Appendix E supplementary information for chapter 6 178
xv
List of Non-Standard Abbreviations Used
CA Clostridium acetobutylicum
CC Clostridium cellulolyticum
CBP Consolidated bioprocessing
CGM Clostridial growth medium
DS Degree of synergism
DMMM Dynamic multispecies metabolic modeling
FBA Flux balance analysis
FVA Flux variability analysis
GAM Growth-associated maintenance energy
GPR Gene-protein-reaction
NGAM Non-growth associated maintenance
TOC Total organic carbon
1
Chapter 1 - Introduction
11 Cellulosic butanol an alternative biofuel
Increasing world energy demands and environmental concerns due to fossil fuel consumption
motivate considerable efforts toward the development of sustainable and renewable energy
resources such as solar energy wind energy geothermal energy energy from biomass and
biofuel Biofuels are attractive substitutes for fossil fuels and can help significant reduction in
greenhouse gas emissions Liquid biofuels such as biodiesel bioethanol and biobutanol as well
as gaseous biofuels like hydrogen and methane can be produced from biomass Compared to
gaseous energy carriers liquid energy carriers present advantages due to their storage
transportation and usage considerations (Brown and Brown 2013 Duumlrre 2007 Lee et al
2008b)
Biodiesel is derived from vegetable oils animal fats or waste cooking oils and can be used in
pure form or as a blend in diesel engines These oils are converted to fatty acid methyl esters
(FAME) via a transesterification with alcohols like methanol and ethanol resulting in glycerol
as a process by-product (Meng et al 2008) Bioethanol is currently the main liquid biofuel and
can be produced from sugarstarch containing biomass such as sugar cane and corn starch or
lignocellulosic biomass Bioethanol is mainly being used as a fuel additive but hydrated ethanol
an azeotrope mixture of 93 ethanol and 7 water is also used in ethanol-powered vehicles
(Carere et al 2008) Compared to gasoline ethanol is less toxic to humans and has a higher
octane number higher heat of vaporization and lower flame temperature and thus burns with
greater efficiency and produces less smog (Demain et al 2005)
Currently most of the worldwide bioethanol production is derived from fermentation of either
starch (corn wheat cassava) or sugar (sugarcane sugar beets) and Saccharomyces cerevisiae is
the most commonly used microorganism in large scale bioethanol production plants However
the main concerns in these approaches are the high cost of feedstock as well as the competition
with food resources (Carere et al 2008 Karakashev et al 2007) Another alternative approach
is the production of ethanol from cellulosic feedstock (Demain et al 2005) and commercial-
scale cellulosic ethanol plants are operating and under construction (Brown and Brown 2013) A
variety of approaches are currently under commercial development for producing cellulosic
2
biofuels including (1) catalytic pyrolysis and hydrotreating to hydrocarbons (2) gasification
and Fischer-Tropsch synthesis to hydrocarbons (3) gasification and methanol-to-gasoline
synthesis (4) dilute acid hydrolysis fermentation to acetic acid and chemical synthesis to
ethanol (5) enzymatic hydrolysis to ethanol and (6) consolidated bioprocessing of biomass to
ethanol (Brown and Brown 2013)
Biobutanol has recently been introduced as a direct substitute of gasoline Application of
biobutanol as a biofuel instead of bioethanol brings several advantages 1) butanol can be used in
pure form or can be blended with gasoline in any concentration while ethanol can be blended
only up to 85 2) utilization of butanol either as a biofuel or as a fuel additive does not require
significant modifications in existing car engines 3) butanol is less volatile so it is a safer fuel 4)
it is not hygroscopic and is less corrosive so it is possible to use current existing facilities for
storage transportation and distribution purposes 5) butanol has a higher energy content thus the
mileage to gasoline ratio increases and 6) some butanol derivatives such as isobutanol 3-
methyl-1-butanol and 2-methyl-1-butanol which have higher octane number are suitable fuel
additives (Duumlrre 2007 Lee et al 2008c)
Until 1950 about two thirds of the worldrsquos butanol supply was produced using the fermentation
of Clostridium acetobutylicum and the Acetone-Butanol-Ethanol (ABE) process was the second
major large-scale biological process after ethanol However due to the increasing substrate costs
and low crude oil prices petrochemical production became more feasible (Duumlrre 2007) In the
ABE process C acetobutylicum converts carbohydrate substrates (eg sugars and starch) to a
mixture of acetone butanol and ethanol in the ratio of 361 and the total solvent production in
the range of 16 to 24 gL with solvent yield of 29-34 (18-25 for butanol only) (Soucaille
2010) High substrate cost low product concentration because of the product toxicity and high
product recovery costs are the main factors that influence the economical feasibility of this
process (Karakashev et al 2007 Green 2011) With the revival of interest in solventogenic
clostridia to produce biofuels novel processes for the production of petrol jet and diesel
through the integration of an extractive ABE fermentation and chemical catalysis and
conversion of alcohols and acetone into ketones by a palladium-catalysed alkylation have been
developed (Anbarasan et al 2012) Moreover metabolic engineering approaches have been
applied to develop transformant strains of C acetobutylicum to convert acetone into isopropanol
3
and to produce a mixture of isopropanol butanol and ethanol (IBE) as a biofuel (Jang et al
2013 Dusseaux et al 2013 Lee et al 2012)
Low product titer due to solvent toxicity is a significant issue in the ABE process which limits
the carbohydrate utilization and solvent productivity while the total solvent concentration of 20
gL inhibits the metabolism of clostridia (Jones and Woods 1986 Green 2011) Butanol is more
toxic than the other solvents since it interacts with the phospholipid components of the cell
membrane and increases the membrane fluidity therefore all membrane associated functions
such as transport processes and membrane-bound ATPase activity are interrupted (Lee et al
2008c) The identification of solvent tolerance genes in C acetobutylicum has been investigated
to overcome this barrier (Borden and Papoutsakis 2007 Tomas et al 2003)
Four major solvent producing species include C acetobutylicum ATCC 824 Clostridium
saccharobutylicum Clostridium beijerincki and Clostridium saccharoperbutylacetonicum (Keis
et al 2001 Du et al 2013 Kosaka et al 2007) Although C acetobutylicum ATCC 824 is the
most studied and manipulated strain different strains from these four main species groups have
been developed and used based on their performance on different feedstocks (Green 2011)
Industrial mutant strains of C beijerincki strain BA101 with butanol titer of 196 gL and C
acetobutylicum mutant strain EA2018 with butanol titer of 144 gL have been developed
through chemical mutagenesis (Annous and Blaschek 1991 Green 2011) Metabolic
engineering tools have also been employed toward improving butanol formation in C
acetobutylicum to reach butanol titer of about 17 gL (Harris et al 2000 Harris et al 2001
Jiang et al 2009) and to introduce butanol formation pathway in non-natural host organisms
(Connor and Liao 2009 Alper and Stephanopoulos 2009 Knoshaug and Zhang 2009) such as
engineered Escherichia coli strain to produce butanol with high titer of 30 gL (Shen et al
2011) In a recent study a two stage immobilized column reactor system with immobilized C
acetobutylicum DSM 792 integrated with in situ solvent extraction has been investigated for
continuous ABE production from a sugar mixture (glucose mannose galactose arabinose and
xylose) comparable to lignocellulose hydrolysates (Bankar et al 2013) where high sugar
mixture conversion of 937 solvent productivity of 1085 g Lminus1
hminus1
and the solvent yield of
038 g gminus1
were achieved using this system
4
Although high oil prices make the biological butanol production process feasible or even
superior to petrochemical processes (Duumlrre 2007) this process can be further improved Butanol
has been produced by the fermentation of various substrates including molasses whey permeate
and corn (Jones and Woods 1986 Lee et al 2008c) Currently sugars (eg molasses sugar
cane and sugar beet) as well as corn starch are the substrates being used in new fermentation
plants (Duumlrre 2007) while corn starch comprises about 79 of the solvent production cost
(Green 2011) Since these substrates compete with food and the cost of substrate has a
significant effect on the process economic feasibility the utilization of cellulosic biomass which
is an abundant low-cost feedstock and does not compete with food as well as agricultural
residues and municipal solid waste have been suggested (Ezeji et al 2007a Mes-Hartree and
Saddler 1982 Qureshi et al 2008d Ezeji et al 2007b) In a two-stage process pre-treated
cellulosic biomass is hydrolyzed and then in the ABE process the hydolysates will be fermented
by C acetobutylicum to butanol (Lee et al 1985)
Butanol production from various cellulosic feedstocks has also been investigated Fermentation
of enzyme treated corn fiber hydrolysate (ETCFH) and sulfuric acid treated corn fiber
hydrolysate (SACFH) by C beijerinckii BA101 after removing some of the fermentation
inhibitors using resins has resulted in the production of about 9 gL ABE with a yield ranging
from 035 to 039 g gminus1
(Qureshi et al 2008a) In a recent study on the ABE production from
wheat straw hydrolysate it has been shown that addition of furfural and hydroxymethyl furfural
(sugar degradation products) to C beijerinckii P260 culture improves the ABE productivity
producing 250 gL ABE from wheat straw hydrolysate with a yield of 042 g gminus1
(Qureshi et al
2012 Qureshi et al 2007) Further improvements in the butanol productivity have been
achieved through the removal of fermentation inhibitors from enzymatically hydrolyzed
cellulosic biomass (Qureshi et al 2008c Wang and Chen 2011) simultaneous hydrolysis and
fermentation (Qureshi et al 2008d Qureshi et al 2008b) and in situ solvent recovery (Ezeji et
al 2004b Ezeji et al 2004a Qureshi 2010)
However the cost of enzymatic hydrolysis is still a significant factor influencing the economic
feasibility of cellulosic butanol (Green 2011 Du and Yang 2012) New strains of C
acetobutylicum capable of hydrolyzing hemicellulose and converting it to solvents have also
been isolated recently (Berezina et al 2008) Although C acetobutylicum genome contains a
large cellulosomal gene cluster these genes are not expressed sufficiently and C acetobutylicum
5
is not able to grow on cellulose (Nolling et al 2001 Sabathe et al 2002) Recently the
expression of Clostridium cellulolyticum cellulase-encoding genes in C acetobutylicum has been
investigated but it has been suggested that the lack of chaperons involved in the cellulase
secretion leads to the cytoplasmic cellulase accumulation and the growth inhibition in C
acetobutylicum (Mingardon et al 2011)
12 Rationale
An alternative method for the production of biobutanol from cellulosic biomass in a consolidated
bioprocessing approach is the use of mesophilic clostridial co-culture C acetobutylicum shows
an effective capability to ferment hemicelluloses and cellulose derived sugars such as cellobiose
mannose arabinose xylose glucose and galactose to acetone butanol and ethanol (Yu et al
1984 Fond et al 1986 Ali et al 2004) Thus the co-culture of this bacterial species with a
mesophilic cellulose degrading bacterium can be an efficient approach C cellulolyticum is a
cellulolytic mesophilic bacterium which is able to solubilize crystalline cellulose in pretreated
hardwood (Demain et al 2005)
The co-culture of C cellulolyticum with C acetobutylicum has been studied previously and it
has been shown that cellulolytic activity is the limiting factor in the co-culture fermentation since
most of the cellulase activity products are consumed by C acetobutylicum The fermentation
products are mainly butyric acid along with butanol acetic acid and ethanol and the lack of
glucose which is required for solvent production due to low cellulolytic activity was
hypothesized to be the reason for acid accumulation (Jones and Woods 1986 Petitdemange et
al 1983) Furthermore three times more cellulosic material was degraded in the co-culture
compared to the mono-culture of C cellulolyticum suggesting the presence of a synergism
between these two species Hence the analysis of this effect can be valuable for optimizing the
rate of cellulosic material degradation
Genome-scale metabolic models of microorganisms from different domains of life have been
developed and been applied for analyses of metabolism in pure cultures However systems
biology of microbial co-cultures will extend our knowledge on pure culture physiology to
microbial co-cultures where metabolic interactions along with inter-species transport of
metabolites are present System-level understanding of the C cellulolyticum and C
6
acetobutylicum co-culture metabolism which can be applied for biobutanol production from
cellulosic biomass facilitates the analyses and design of strategies for process and metabolic
optimization thus improving the biobutanol production rate Therefore the development of
computational methods as well as experimental methods to investigate the interactions between
microorganisms in this co-culture based on the community genome sequences and physiology
is beneficial for the ultimate engineering of the co-culture Consequently the focus of this thesis
is the development of such methods as outlined in the following objectives
13 Research objectives
It is hypothesized that the genome-scale metabolic analysis of the C cellulolyticum and C
acetobutylicum co-culture can assist in designing strategies for improving the yield and
productivity of the biobutanol production rate which is the desired product in this consolidated
bioprocessing approach Thus the eventual goal of this study is to develop methods for the
analysis of metabolism in this co-culture and to investigate the inter-species metabolic
interactions for enhancing the metabolic rate and biofuel synthesis The research method
involves both computational methods for the development of genome-scale models of
metabolism and experimental approaches for the examination of microbial physiology The
following objectives were investigated
1 To develop the genome-scale metabolic model of C acetobutylicum ATCC 824 that
includes thermodynamic and metabolomic constraints and to achieve thermodynamically
feasible phenotypes
This objective is fulfilled through developing an updated genome-scale metabolic model of C
acetobutylicum acquiring intracellular metabolite concentrations in C acetobutylicum cultures
and incorporating these metabolomic and thermodynamic data into this metabolic model (chapter
3)
2 To develop the genome-scale metabolic model of C cellulolyticum
3 To apply the developed metabolic models of the pure cultures to develop the genome-
scale model of metabolic interactions in the co-culture
These two objectives are fulfilled through developing the genome-scale metabolic model of C
cellulolyticum and combining this model with aforementioned C acetobutylicum model to
7
obtain the co-culture metabolic model (chapter 4) This metabolic model was used to analyze the
integrated physiology of the co-culture
4 To characterize the co-culture metabolism by developing molecular biology methods
We investigated metabolic interactions in this co-culture by developing a comparative qPCR
method and dynamically characterized the co-culture physiology and microbial composition
using this qPCR method (chapter 5)
5 To examine the growth arrest event in C cellulolyticum
We developed a method for the extraction and quantitative analysis of intracellular metabolites in
C cellulolyticum cultures under high and low cellulose concentrations particularly to test the
hypothesis that there is a link between pyruvate accumulation and the growth arrest event at high
cellulose concentrations (chapter 6)
14 Thesis outline
Chapter 2 provides an overview on the research in this field
Chapter 3 addresses the first objective where an expanded genome-scale metabolic model of C
acetobutylicum is presented This study has been published in the conference proceedings below
Salimi F1 Mandal R
2 Wishart D
2 Mahadevan R
1 (2010) Understanding Clostridium
acetobutylicum ATCC 824 Metabolism Using Genome-Scale Thermodynamics and
Metabolomics-Based Modeling In Proceedings of the Symposium on Computer Applications in
Biotechnology 11 (1) 126-131
Affiliations 1 - Department of Chemical Engineering and Applied Chemistry University of
Toronto 2 - Department of Biological Sciences University of Alberta
Contributions FS designed and conducted the in silico and in vitro experiments analyzed the
data and drafted the manuscript RM2 and DW
2 carried out the NMR analyses RM conceived of
the experiments and helped to draft the manuscript
8
Chapter 4 presents the genome-scale models of C cellulolyticum metabolism as well as the
clostridial co-culture metabolism which point to the second and third objectives This work has
also been published as a research paper
Salimi F1 Zhuang K
1 2 Mahadevan R
1 (2010) Genome-scale metabolic modeling of a
clostridial co-culture for consolidated bioprocessing Biotechnology Journal 5 (7)726-738
Affiliations 1 - Department of Chemical Engineering and Applied Chemistry University of
Toronto 2 - Present Address Novo Nordisk Foundation Center for Biosustainability Denmark
Contributions FS conceived of the study reconstructed the metabolic network conducted the
modeling and drafted the manuscript KZ carried out the DMM simulations RM conceived of
the study and helped to draft the manuscript
In chapter 5 we developed and presented methods for the co-culture experiments to characterize
the cellulolytic activity and the co-culture metabolism and to investigate the fourth objective
This study has been published as a research paper
Salimi F Mahadevan R (2013) Characterizing Metabolic Interactions in a Clostridial Co-
culture for Consolidated Bioprocessing BMC Biotechnology 1395
Affiliations Department of Chemical Engineering and Applied Chemistry University of
Toronto
Contributions FS conceived of the study designed and conducted the experiments and drafted
the manuscript RM conceived of the study and helped to draft the manuscript
Chapter 6 describes the efforts to further investigate and understand the mechanism behind the
growth arrest event in C cellulolyticum To explore the fifth objective we designed and
conducted an in vivo metabolite analysis This study is being prepared for submission as a short
research note Finally chapter 7 summarizes the results and conclusions of this thesis and offers
recommendations for future studies in this field
9
Chapter 2 - Background and Literature Review
21 Consolidated bioprocessing of cellulosic biomass
Cellulose is the most abundant component of plant biomass which is almost exclusively found in
plant cell wall and composes 35 to 50 of plant dry weight A matrix of other structural
biopolymers mainly hemicelluloses and lignin which form 20 to 35 and 5 to 30 of plant dry
weight accordingly embeds cellulose fibres (Lynd et al 2002) Cellulosic biomass is a plentiful
inexpensive and renewable feedstock for the production of biofuels (Lynd et al 2008)
Cellulosic feedstock is an abundant resource with relatively low cost but the main technological
factor which hampers the extensive utilization of this supply is the lack of low-cost technology
for hydrolysis of the highly ordered insoluble structure of cellulose (Lynd et al 2002) The
products of this hydrolysis are readily soluble sugars Most of the research on cellulose
hydrolysis has been focused on the genetics biochemistry and process development using fungi
mostly Trichoderma reesei for the conversion of cellulose to sugars (Demain et al 2005)
Efficient pre-treatment approaches to release the polysaccharides cellulose and hemicellulose
from lignocellulosic structure and make them available for hydrolysis and then fermentation are
also key factors in the process of lignocellulosic biomass Lignocellulosic material is hard to
hydrolyze since it is associated with hemicelluloses and is enclosed by a lignin seal hence has a
highly ordered and firmly packed structure Pre-treatment increases the surface area of cellulose
eliminates the lignin seal solubilises hemicelluloses and disrupts the crystallinity of cellulose
(Demain et al 2005) Various pre-treatment methods include steam pre-treatment with or
without acid catalyst wet oxidation and thermal hydrolysis which are often at high temperature
and pressure No microorganisms are currently known to efficiently use liberated lignin which is
an aromatic polymer (Karakashev et al 2007)
Four biological steps are involved in the conversion of cellulosic biomass into biofuel via
enzymatic hydrolysis a) production of saccharolytic enzymes cellulase and hemicellulase b)
the hydrolysis of the produced polysaccharides present in pre-treated biomass c) fermentation of
hexoses and d) fermentation of pentose sugars (D-xylose L-arabinose) present in the
hydrolyzate to desired products (Lynd et al 2008) Figure 2-1 shows the development of
biomass processing approaches Different process configurations can be categorized based on the
10
degree of integration of these four steps Separate hydrolysis and fermentation (SHF) involves
four separate process stages using four different biocatalysts Simultaneous saccharification and
fermentation (SSF) integrates hydrolysis and fermentation of cellulose hydrolyzates into one
process step while cellulase production and fermentation of hemicellulase hydrolysis products
take place in two additional stages Simultaneous saccharification and co-fermentation (SSCF)
includes two process stages production of saccharolytic enzymes takes place in one step while
hydrolysis of pre-treated biomass along with the co-fermentation of both cellulose and
hemicellulose hydrolysis products occur in another step (Lynd et al 2002)
Figure 2-1 Various biomass-processing schemes separate hydrolysis and fermentation (SHF) simultaneous
saccharification and fermentation (SSF) simultaneous saccharification and co-fermentation (SSCF) and
consolidated bioprocessing (CBP) (Lynd et al 2002)
In consolidated bioprocessing (CBP) all of above mentioned steps occur in one bioreactor using
a single microorganism or a microbial consortium which is able to ferment pretreated biomass
without adding saccharolytic enzymes (Lynd et al 2002) Consolidated bioprocessing is an
efficient approach to decrease the product cost as a 75 decrease in the cost of biological
process and a 50 reduction of overall process cost is achievable comparing to a hypothetical
advanced simultaneous saccharification and co-fermentation process (SSCF) for ethanol
production (Lynd et al 2008) Furthermore use of complex cellulase systems and enzyme-
Process SHF SSF SSC CBP
Enzyme production O2 O2 O2
Biomass
Biomass hydrolysis
Hexose fermentation
Pentose fermentation
Product
11
microbe synergy may improve biomass solubilisation using CBP (Olson et al 2012 Lu et al
2006) Presently Mascoma is proposing to construct a commercial cellulosic ethanol plant using
CBP approach to convert hardwood pulpwood feedstock into ethanol (Brown and Brown 2013)
Microorganisms with both rapid conversion of cellulose and high product yield productivities
and titers required for CBP have not been identified in nature and need to be developed (Lynd et
al 2008 Olson et al 2012 Hasunuma et al 2013) To realize this aim two strategies can be
applied the native strategy improves the product formation capabilities such as yield and titer in
natural cellulolytic microorganisms while the recombinant strategy involves engineering non-
cellulolytic organisms with high product yields so that they will express heterologous cellulase
and be able to utilize cellulose (Lynd et al 2002)
Developing genetic modification tools and constructing genetically modified strains that
produce a desired fuel with high yield titer and robustness under industrial conditions are the
main challenges of the native strategy (Olson et al 2012) The native strategy has been applied
to Thermoanaerobacterium saccharolyticum a free-enzyme bacterium that ferments xylan (but
not cellulose) and biomass-derived sugars by eliminating the acetate and lactate formation
pathways the engineered strain has produced 37 gL ethanol with high yield of 046 grams of
ethanol per gram of substrate (Shaw et al 2008) Genetic tools also have been developed for
other free-enzyme bacterial systems such as Clostridium phytofermentans (Tolonen et al 2009)
Clostridium japonicus (Gardner and Keating 2010) Thermoanaerobacter ethanolicus (Peng et
al 2006) and Geobacillus thermoglucosidasius (Cripps et al 2009) Recently anaerobic
cellulolytic bacteria capable of degrading untreated lignocellulosic biomass such as
Anaerocellum thermophilum and Caldicellulosiruptor species have been screened and studied as
potential CBP organisms (Yang et al 2009 Svetlitchnyi et al 2013)
Among cellulosome forming bacteria genetic manipulation systems have been developed for C
cellulolyticum and for C thermocellum (Li et al 2012 Lynd et al 2005 Tripathi et al 2010
Argyros et al 2011 Higashide et al 2011 Cui et al 2013) An acid-deficient mutant strain of
C thermocellum has been created by deleting lactate dehydrogenase (Ldh) and
phosphotransacetylase (Pta) pathways (Argyros et al 2011) to improve ethanol formation by
redirecting intracellular carbon and electron flows Subsequently co-culturing the two Acid-
deficient mutant strains of C thermocellum and T saccharolyticum (Shaw et al 2008) has
12
resulted in the fermentation of 92 gL cellulose and the production of 38 gL ethanol with
undetectable acetic and lactic acids (Argyros et al 2011) This study demonstrates the potential
of an engineered co-culture as a CBP solution for cellulosic ethanol However in contrast to S
cerevisiae the main disadvantage of thermophilic clostridia is the low ethanol tolerance
(Karakashev et al 2007) Although ethanol-adapted strains of C thermocellum that can tolerate
and grow in the presence of 50 gL added ethanol have been evolved by serial transfer where
biochemical assays have identified the mutation of the coenzyme specificity of acetaldehyde-
CoAalcohol dehydrogenase gene from NADH-dependent activity to NADPH-dependent
activity as the reason behind the improved ethanol tolerance (Brown et al 2011 Williams et al
2007)
Recently a targeted gene inactivation system for C cellulolyticum has been developed and
applied to disrupt the paralogous lactate dehydrogenase and malate dehydrogenase genes
resulting in a significant increase in ethanol formation from cellulose (Li et al 2012) Moreover
gene transfer systems for C cellulolyticum have also been investigated (Jennert et al 2000
Tardif et al 2001) and applied for the production of ethanol (Guedon et al 2002) and
isobutanol (Higashide et al 2011) from cellulose Heterologous expression of pyruvate
decarboxylase and alcohol dehydrogenase genes from Zymomonas mobilis has led to 53 and
150 increase in ethanol formation and cellulose consumption in the C cellulolyticum batch
culture respectively (Guedon et al 2002) Furthermore the feasibility of isobutanol production
from cellulose in a CBP has been demonstrated through metabolic engineering of C
cellulolyticum to divert its 2-keto acid intermediates toward alcohol formation and the synthesis
of 660 mgL isobutanol from cellulose However the lack of an inducible gene expression
system has been deemed as a significant barrier in expressing new pathways in C cellulolyticum
(Higashide et al 2011) These studies suggest metabolic engineering approaches can
significantly improve the metabolism of C cellulolyticum as a potential CBP organism Table 2-
1 provides a summary of the recent studies on cellulase producing microorganisms for
developing native CBP strategies
13
Table 2-1 Recent studies on cellulase producing microorganisms for developing native CBP strategies
(adapted from (Olson et al 2012))
Organism Relevant
genotype
Substrate Substrate
conc
(gL)
Conversion
()
Product Titer
(gL)
Metabolic
yield ()
Rate
(gL-1 h-1)
C thermocellum
M1570 and
Tsaccharolyticum
ALK2 co-culture
M1570
∆ldh ∆pta
ALK2
∆ldh ∆pta
∆ack
Avicel 922 90 Ethanol 381 82 026
C cellulolyticum
H10
Wildtype Cellulose
MN301
50 26 Ethanol 051 7 11E-03
C phytofermentans
ATCC 700394
Wildtype AFEX-
corn
stover
8 81 Ethanol 28 85 12E-02
C thermocellum
DSM 1313
Wildtype Avicel 195 90 Ethanol 13 15 18E-02
C cellulolyticum
CC-pMG8
Pdc adh Cellulose
MN301
50 64 Ethanol 083 5 18E-03
Geobacillus spR7 Wildtype Prairie
cord grass
108 ND Ethanol 0035 ND 21E-04
T hirsuta Wildtype Rice straw 103 ND Ethanol 3 ND 31E-02
C japonicus Ueda
107
Wildtype Avicel 10 ND Ethanol 00002 ND 42E-06
C phytofermentans
ATCC 700394
Wildtype Filter
paper
10 63 Ethanol 29 81 43E-03
C cellulolyticum
pWH320
Kivd yqhD
alsS ilvCD
Sigma 50 10 ND Isobutan
ol
066 ND 46E-03
C japonicus
MSB280
Pdc adhB Avicel 10 ND Ethanol 00035 ND 73E-05
C thermocellum
M1570
∆ldh ∆pta Avicel 195 94 Ethanol 56 60 78E-02
C acetobutylicum 7 Wildtype Grass 30 ND Butanol 06 ND ND
14
Developing CBP organisms by a recombinant strategy has also been studied in engineered strains
of E coli Klebsiella oxytoca Zymomonas mobilis and the yeast S cerevisiae (Lynd et al 2002
Lynd et al 2008 Hasunuma et al 2013) Although S cerevisiae and Z mobilis are promising
ethanol producers native strains of S cerevisiae and Z mobilis are not able to utilize pentoses
(xylose and arabinose) so genetically modified pentose utilizing strains of S cerevisiae have
been developed (Karakashev et al 2007 Matsushika et al 2009) However engineered
yeasts ferment xylose slowly and usually only when glucose is completely consumed
Subsequently engineered yeast strains that co-ferment mixtures of xylose and cellobiose have
been developed (Ha et al 2011) in which cellobiose hydrolysis takes place inside yeast cells
minimizing glucose repression of xylose fermentation and improving ethanol yield
Furthermore high level heterologous expression and secretion of two exocellulase enzymes
(CBHI amp CBHII 4-5 of total cell protein) which is required for an industrial process has been
achieved in S cerevisiae (Ilmen et al 2011) However most studies on heterologous cellulase
expression in yeasts have been conducted under aerobic conditions with high cell density so it is
necessary to evaluate these systems under anaerobic conditions and under industrial conditions
required for CBP (Olson et al 2012) Moreover production of up to 76 gL ethanol from
phosphoric acid swollen cellulose (PASC) using recombinant strain of S cerevisiae capable of
direct fermentation of cellulosic material in anaerobic systems with low cell density has been
reported (Den Haan et al 2007 Hasunuma and Kondo 2012 Yamada et al 2011) A
cellulolytic strain of B subtilis which grows on cellulose and converts it to lactate has also been
developed by over-expression of B subtilis endoglucanase BsCel5 and produced about 31
gL lactate with a yield of 60 of the theoretical maximum (Zhang et al 2011) To summarize
beside the substantial achievements obtained in microbial cellulose utilization in recent years
there are still basic questions to be answered yet the optimal operational conditions for microbial
cellulose utilization such as temperature pH substrate particle size and the application of
microbial communities are not known Furthermore the effectiveness of microbial cellulose
conversion (eg rate and yield) compared to cell-free enzymatic systems is not well-understood
(Olson et al 2012) Table 2-2 provides a summary of the recent studies on non-cellulolytic
microorganisms for developing recombinant CBP strategies
15
Table 2-2 Recent studies on the production of chemicals from cellulose through SSF and recombinant CBP
strategies (adapted from (Hasunuma et al 2013))
Strain Relevant genes Substrate Enzyme added Product
B coagulans
36D1
None 96 g L-1
cellulose 15 FPU
g-cellulose-1
biocellulase W
80 g L-1
lactic acid
B coagulans
DSM2314
None 1549 g L-1
lime-
pretreated wheat
straw
98 mg g-biomass-
1
cellulase GC220
396 g L-1
lactic acid
B coagulans
P4-102B
Dldh DalsS GlyDHfrasl (D121N
F245S) 40 g L
-1
lignocellulose
75 FPU
g-cellulose-1
cellulase
20 g L-1
h-1
lactic acid
B subtilis168 B subtilis EG (BsCel5) DalsS 70 g L-1
amorphous
cellulose
None 31 g L-1
lactic acid
C glutamicum
pCCT-engD
C cellulovorans engD 15 g L-1
barley
β-glucan
A aculeatus β-
glucosidase
017 g L-1
Glutamic
acid
C glutamicum
ATCC 13032
C cellulovorans celE cbpA Carboxymethyl
cellulose
None Not
determined
E coli
MG1655
∆fadE
C japonicas cel3A and gly43F
Bacillus sp cel
C stercoranium xyn10B
FAEE biosynthesis pathway
55 g L-1
IL-treated
switchgrass
None 71 mg L-1
Fatty acid
ethyl esters
E coli
DH1 ∆adhE
C japonicas cel3A and gly43F
Bacillus sp cel
C stercoranium xyn10B
butanol biosynthesis pathway
55 g L-1
IL-treated
switchgrass
None 28 mg L-1
n-butanol
E coli
MG1655
C japonicas cel3A and gly43F
Bacillus sp cel
C stercoranium xyn10B
pinene biosynthesis pathway
55 g L-1
IL-treated
switchgrass
None 17 mg L-1
pinene
L plantarum
NCIMB8826
pCU-
CelA∆ ldhL1
C thermocellum celA Dldh1 2 g L-1
cellohexaose A aculeatus β-
glucosidase 127 g L
-1
lactic acid
L plantarum
NCIMB8826
pCU-
CelA∆ ldhL1
C thermocellum celA Dldh1 2g L-1
barley
β-glucan
A aculeatus β-
glucosidase 147 g L
-1
lactic acid
16
Recently several studies have demonstrated the potential of microbial co-cultures as CBP
solutions for cellulosic ethanol and butanol production As described earlier an engineered co-
culture of two acid-deficient mutant strains of C thermocellum and T saccharolyticum (Shaw et
al 2008) has resulted in the fermentation of 92 gL cellulose in 6 days and the production of 38
gL ethanol with high yield of 041gg substrate and undetectable acetic and lactic acids (Argyros
et al 2011) In the above mentioned co-culture it has been shown that the metabolism of C
thermocellum rather than its cellulolytic capacity is the limiting factor in the cellulose
metabolism and ethanol formation as the co-culture has shown significantly improved ethanol
yield and titer compared to the mono-culture of C thermocellum However the reason for this
improved co-culture metabolism is not clear and the secretion of some metabolites by C
thermocellum that can be later utilized by the other species in the co-culture as well as prevention
of the overflow metabolism in C thermocellum through rapid consumption of soluble sugars by
T saccharolyticum have been deemed as the possible explanations for this enhancement In
another study the co-culture of Acremonium cellulolyticus a mutant hyper cellulase producer
filamentous fungus and S cerevisiae has been employed to produce cellulosic ethanol with titer
and yield of 351 gL and 019 gg substrate respectively (Park et al 2012) whereas process
variables such as inoculation time for each species and medium composition have been
optimized in this one-pot ethanol production Although significant improvements in ethanol titers
have been achieved using co-cultures the ethanol yield and productivity still require further
improvement
The co-culture of C thermocellum and the mesophilic Clostridium saccharoperbutylacetonicum
strain N1-4 has been investigated for producing butanol from crystalline cellulose (Nakayama et
al 2011) and optimizing operational parameters has resulted in the production of 79 gL
butanol However no information has been provided on cellulose metabolism and the
cellulolytic activity in this co-culture It has been suggested that a quorum-sensing mechanism
may control and induce the solventogenesis in C saccharoperbutylacetonicum which is a
different mechanism from other butanol producing clostridial species (Kosaka et al 2007
Nakayama et al 2011) The sequential co-culture of C thermocellum and C acetobutylicum has
also been investigated (Yu et al 1985 Nakayama et al 2011) whereas the co-culture produced
only organic acids In a recent study the co-culture of a xylanase producing thermophilic strain
of Kluyvera and Clostridium sp strain BOH3 could directly convert xylan to 12 gL butanol in
17
6 days (Xin and He 2013) which has been comparable to the butanol titer obtained through
separate hydrolysis (using xylanase) and fermentation by Clostridium sp strain BOH3
22 Biobutanol production using a clostridial co-culture a
CBP approach
An alternative method for the production of biobutanol from cellulosic biomass in a consolidated
bioprocessing approach is the use of mesophilic clostridial co-culture Clostridium
acetobutylicum shows an effective capability to ferment hemicellulose derived sugars as well as
cellulose derived sugars such as cellobiose mannose arabinose xylose glucose and galactose
to acetone butanol and ethanol (Yu et al 1984 Fond et al 1986 Ali et al 2004) Thus the co-
culture of this bacterial species with a mesophilic cellulose degrading bacterium can be an
efficient approach Clostridium cellulolyticum is a cellulolytic mesophilic bacterium which is
able to solubilize crystalline cellulose in pretreated hardwood (Demain et al 2005)
The simplified scheme of the clostridial co-culture fermentation on biomass hydrolyzates
cellulose and hemicellulose is presented in Figure 2-2 The co-culture of C cellulolyticum with
C acetobutylicum has been studied previously and it has been shown that cellulolytic activity is
the limiting factor in the co-culture fermentation since most of the cellulase activity products are
consumed by C acetobutylicum (Petitdemange et al 1983 Jones and Woods 1986) The
fermentation products are mainly acids with small amounts of ethanol and butanol and the lack
of glucose which is required for solvent production due to low cellulolytic activity seems to be
the reason for acid accumulation Furthermore three times more cellulosic material was
degraded in the co-culture compared to the mono-culture of C cellulolyticum The utilization of
cellulose hydrolysis products and the removal of their repressive effects have been deemed to be
the reasons for this improved cellulolytic activity in the co-culture (Mitchell et al 1995) This
fact suggests the presence of a synergism between these two species where the interactions
between the two species in the co-culture result in an improved metabolic activity compared to
their pure cultures Hence the analysis of this effect can be valuable for optimizing the rate of
cellulosic material degradation
18
The cellulolytic mesophilic C cellulolyticum synthesizes a cellulosome which is an extracellular
multi-enzymatic complex and degrades cellulose to glucose and soluble cellodextrins (mainly
cellobiose) with the use of this cellulosome This extracellular complex comprises a variety of
cellulases hemicellulase and pectinase which are arranged on a protein scaffold (CipC)
(Guedon et al 1999b Desvaux 2005b Desvaux 2005a) The cellulosomes are located on the
cell surface and facilitate both cell adhesion as well as cellulolytic activity on the cellulose fibres
Different aspects of this cellulosome complex including structure regulation extracellular
assembly and enzymatic activity have been characterized and reviewed However the regulation
of the cellulosomal gene expression and the mechanism of secretion attachment and
arrangement of this complex on the cell surface still need more investigation (Desvaux 2005a)
Figure 2-2 The simplified scheme of the clostridial co-culture fermentation on biomass hydrolyzates
(cellulose and hemicellulose) (1) cellulase (2) hemicellulase enzymes produced by C cellulolyticum
19
Limited growth and catabolic activity on cellulose is the common feature of the currently known
cellulolytic bacteria (Desvaux 2005b) Previously heterologous expression of pyruvate
decarboxylase and alcohol dehydrogenase genes from Zymomonas mobilis has led to 180 and
150 increase in cell concentration and cellulose consumption in the C cellulolyticum batch
culture on fibrous cellulose (Guedon et al 2002) This recombinant strain has shown a
prolonged growth on cellulose with the same growth rate as the wild strain and produced
ethanol acetate and lactate Improving the cellulolytic and catabolic activity of C cellulolyticum
by metabolic engineering can facilitate the shift of co-culture metabolism to the solventogenic
phase However it has been demonstrated that the central metabolism of C cellulolyticum rather
than the cellulose hydrolysis rate is the limiting step in cellulose metabolism therefore the
improvement of C cellulolyticum metabolism which is not adapted to high catabolic rates
instead of the catalytic activity of the cellulosome should be the main focus in order to improve
its cellulolytic activity (Guedon et al 2002 Desvaux 2005b) Therefore genome-scale
metabolic modeling of C cellulolyticum metabolism can bring deep insights into the bottleneck
pathways and facilitate the improvement of this cellulolytic activity using in silico generated
hypotheses which can be tested experimentally
Furthermore developing a genome-scale model of metabolism in this co-culture can assist in
designing strategies for improving the yield and productivity of biobutanol which is the desired
product in this CBP Moreover by means of the developed model of co-culture metabolism it
would be possible to examine the in silico production of other valuable chemicals using
genetically engineered strains and to characterize the critical pathways for their production (Lee
and Papoutsakis 1999) Developing viable strains through system-level metabolic engineering
using genome sequence information and metabolic engineering tools for clostridia has been
proposed as an essential part of developing commercial biobutanol process along with
fermentation and solvent recovery process developments as depicted in Figure 2-3 (Lee et al
2008c)
20
Figure 2-3 Developing viable strains through system-level metabolic engineering using genome sequence
fermentation and omics data along with in silico genome-scale metabolic models is an essential part of
developing commercial biobutanol processes (Lee et al 2008c)
221 Clostridium acetobutylicum fermentation
C acetobutylicum is a Gram-positive solvent producing anaerobic bacterium which is able to
convert a variety of sugars polysaccharides and oligosaccharides to organic acids and solvents
In this fermentation the main products are acetate butyrate ethanol butanol acetone carbon
dioxide and hydrogen (Hartmanis and Gatenbeck 1984) In a typical fermentation of this
bacterium two distinct phases are observed In the acidogenic phase acetate butyrate hydrogen
and carbon dioxide are produced during this phase the bacterium grows rapidly and due to the
accumulation of acids the medium pH drops In the stationary growth phase the metabolic shift
to solventogenesis takes place During solventogenic phase the consumption of acids as well as
carbohydrates and production of neutral solvents result in an increase in the medium pH (Jones
and Woods 1986) Since comprehensive knowledge on the metabolism is required for
21
developing a genome-scale metabolic model the central metabolic pathways of C
acetobutylicum are described in the subsequent section
The ClosTron a gene knockout system has been developed for C acetobutylicum and other
clostridia which facilitates further functional genomic studies and the construction of multiple
knock-out mutants (Heap et al 2010 Heap et al 2007 Lehmann et al 2012 Tracy BP and ET
2009) Moreover plasmid-based gene over expression systems have been developed recently
(Dong et al 2010 Soucaille et al 2008 Heap et al 2009) providing a platform for metabolic
engineering of C acetobutylicum The genome sequence of C acetobutylicum has also been
completed (Nolling et al 2001) and genome wide transcriptome studies on different
physiological aspects of this species such as sporulation stationary-phase events and solvent
stress have been conducted (Alsaker and Papoutsakis 2005 Jones et al 2008 Janssen et al
2012) Therefore systems biology approaches for strain development and the improvement of C
acetobutylicum metabolic activity seems to be promising However difficult genetic accessibility
of clostridia limited number of available genetic methods and lack of knowledge on the
regulatory mechanisms have restricted the success of metabolic engineering studies on C
acetobutylicum to improve the butanol productivity (Lee et al 2008c Lutke-Eversloh and Bahl
2011 Papoutsakis 2008)
2211 Central metabolism of Clostridium acetobutylicum
characterization of enzymes pathways and genes
The central biochemical pathways of C acetobutylicum involved in the conversion of
carbohydrates to hydrogen carbon dioxide acids and solvents are presented in Figure 2-4 In the
primary metabolism of C acetobutylicum hexose and pentose sugars are converted to pyruvate
ATP and NADH (Lee et al 2008c) Hexoses are metabolized via glycolysis to pyruvate 2 mol
of ATP and 2 mol of NADH However pentoses are metabolized via the pentose phosphate
pathway and 3 mol of pentose generates 5 mol of ATP and 5 mol of NADH Pyruvate is
decarboxylated in the presence of coenzyme A (CoA) by pyruvate-ferredoxin oxidoreductase to
generate carbon dioxide acetyl-CoA and reduced ferredoxin (Meinecke B et al 1989) The
produced acetyl-CoA is the major intermediate in both acid and solvent production pathways
Bacterial-type ferredoxins are low molecular weight carrier proteins composed of two [4Fe-4S]
clusters which can both accept and donate electrons in very low potential reactions
22
In C acetobutylicum reduced ferredoxin is the physiological electron donor of the iron
containing hydrogenase which transfers electrons to protons as final electron acceptors and
produces hydrogen (Guerrini et al 2008 Calusinska et al 2010) NADH-ferredoxin
oxidoreductase is another enzyme which facilitates redox reactions between NAD+ and
ferredoxin whereas NADPH-ferredoxin oxidoreductase controls the production of NADPH
which is essential in biosynthesis pathways from reduced ferredoxin (Jungermann et al 1973)
Furthermore the presence of another low molecular weight nonsulfur protein rubredoxin has
been shown Unlike ferredoxin no specific electron acceptor for reduced rubredoxin has been
identified (Jones and Woods 1986) C acetobutylicum is also able to convert pyruvate to lactate
under certain conditions although this pathway is a less efficient alternative for NAD+
regeneration and energy production where the activity of hydrogenase enzyme has been blocked
using carbon monoxide or in iron deficient cultures where the levels of ferredoxin and the iron
containing hydrogenase are low Moreover reducing hydrogenase activity and redirecting the
electron flow for the regeneration of NAD(P) pool in C acetobutylicum has been demonstrated
to increase the butanol formation (Lutke-Eversloh and Bahl 2011) Increasing the hydrogen
partial pressure gassing with carbon monoxide and addition of artificial electron carriers for
instance methyl viologen and neutral red are some of the techniques that have been employed to
drive the metabolism of C acetobutylicum towards butanol formation by decreasing hydrogenase
activity (Girbal and Soucaille 1998 Girbal and Soucaille 1994 Girbal et al 1995)
23
Figure 2-4 Central biochemical pathways of Clostridium acetobutylicum (adapted from (Desai et al 1999))
Enzymes involved in different pathways are given next to the arrows HYDA (hydrogenase) PTA
(phosphotransacetylase) AK (acetate kinase) THL (thiolase) BHBD (Β-hydroxybutyryl-CoA
dehydrogenase) CRO (crotonase) BCD (butyryl-CoA dehydrogenase) PTB (phosphotransbutyrylase) BK
(butyrate kinase) AADC (Acetoacetate decarboxylase) CoAT (acetoacetyl-CoA acetatebutyrate
CoenzymeA transferase) ADC (acetoacetate decarboxylase) AAD (aldehydealcohol dehydrogenase) and
BDHAampB (butanol dehydrogenase A amp B)
24
Conversion of acetyl-CoA to acetate is catalyzed by two enzymes phosphotransacetylase (PTA)
and acetate kinase (AK) and the genes pta and ack encoding these enzymes are organized in one
operon (Boynton et al 1996b) The acetate production is a significant pathway in the acidogenic
fermentation stage and generates ATP for the cell growth These enzymes are present in all
anaerobic bacteria that consume acetyl-CoA to produce ATP via substrate level phosphorylation
(Hartmanis and Gatenbeck 1984) Thiolase (THL) catalyzes the condensation of two acetyl-CoA
molecules to form acetoacetyl-CoA the precursor of four carbon products in C acetobutylicum
metabolism and hence it has a significant effect on the relative amounts of the two-carbon
products (acetate and ethanol) to three- and four-carbon products (butanol and acetone) (Bennett
and Rudolph 1995) In acidogenic phase thiolase competes with phosphotransacetylase for the
available pool of acetyl-CoA to form butyrate and acetate respectively (Wiesenborn et al 1988
Wiesenborn et al 1989a) In comparison to the formation of acetic acid butyric acid production
yields 3 mol of ATP while 4 mol of ATP is made during acetate formation Butyrate production
is neutral in NADH formation and consumption but acetate formation leads to an increase in the
NADH level
The condensation reaction is highly sensitive to the presence of micromolar amounts of CoA due
to competitive inhibition by it and the ratio of CoA to acetyl-CoA may be the most important
factor affecting the net rate of acetyl-CoA condensation to acetoacetyl-CoA by thiolase
(Wiesenborn et al 1988) Reducing thiolase sensitivity towards CoA through protein
engineering has also been studied recently which resulted in improved alcohol titers (Mann and
Lutke-Eversloh 2013) In C acetobuylicum thiolase activity has a broad range of pH values
from 55 to 7 which is the range of internal pH so change in internal pH does not seem to have
an important role in regulation of thiolase activity During solventogenesis thiolase competes
with acetaldehyde dehydrogenase for the available pool of acetyl-CoA and it affects the ratio of
butanol plus acetone to ethanol furthermore its specific activity is highest in this phase showing
that thiolase might be somewhat inducible (Bennett and Rudolph 1995)
In the next three steps acetoacetyl-CoA is reduced to butyryl-CoA The first step involves the Β-
hydroxybutyryl-CoA dehydrogenase (BHBD) which catalyzes the reduction of acetoacetyl-CoA
by NAD(P)H The hbd gene encoding BHBDH has been cloned and sequenced while analysis of
the chromosomal region including hbd shows that the five open reading frames (hbd crt bcd
etfB and etfA) are transcribed as a transcription unit and form a BCS (butyryl-CoA synthesis)
25
operon (Boynton et al 1996a Bennett and Rudolph 1995) Subsequently the crt gene encoding
crotonase (CRO) catalyzes the dehydration of 3-hydroxybutyryl CoA to crotonyl-CoA In the
next step bcd gene encodes butyryl-CoA dehydrogenase (BCD) that catalyzes the reduction of
carbon-carbon double bond in crotonyl-CoA to form butyryl-CoA a key branch point in acid and
solvent formation Open reading frames etfB and etfA located downstream of bcd show
homology to those encoding the α and β subunits of the electron transfer flavoprotein these
findings suggest that BCD in clostridia may interact with the electron transfer flavoprotein
(Boynton et al 1996a) Unlike Clostridium kluyveri there is no evidence that the exergonic
BCD reaction in C acetobutylicum is energetically coupled with the endergonic reduction of
ferredoxin by NADH catalyzed by BCDetf complex (Lutke-Eversloh and Bahl 2011) Energy
conservation through the flavin-based electron bifurcation (FBEB) has been considered as a
mode of energy generation in C kluyveri and some other anaerobes (Herrmann et al 2008
Buckel and Thauer 2013)
Butyryl-CoA is converted to butyrate by phosphotransbutyrylase (PTB) and butyrate kinase and
the genes encoding these enzymes ptb and buk form an operon (Walter et al 1993) It has been
shown that when a continuous culture of C acetobutylicum producing a significant amount of
butyrate is sparged with carbon monoxide a high butyrate consumption rate coincides with
butanol production but not acetone formation (Meyer et al 1986) Carbon monoxide inhibits
dehydrogenase activity and redirects the electron flow to alcohol production pathways The
exclusive production of butanol and not acetone shows that CoA transferase enzyme is not active
under this condition and suggests that the butyrate uptake is catalyzed by the reversal of the
PTB-butyrate kinase pathway (Wiesenborn et al 1989b Lehmann et al 2012) In the
physiological range of pH 55 to 7 PTB is highly sensitive to pH changes in the butyryl
phosphate production direction and its activity is too low below pH 6 This fact suggests a
feedback control loop to slow or stop the butyrate formation by butyrate kinase pathway But this
enzyme is less sensitive to pH change in butyryl-CoA formation direction so this pathway can
act in the butyrate uptake direction at low external pH condition
Acetoacetate decarboxylase (AADC) and acetoacetyl-CoA acetatebutyrate CoenzymeA
transferase (short CoA transferase) are involved in the production of acetone from acetoacetyl-
CoA The adc gene coding acetoacetate decarboxylase is organised in a monocistronic operon
whereas the ctf genes encoding CoA transferase with an aldehydealcohol dehydrogenase (aad)
26
form an operon named sol operon (Fischer et al 1993) The complete sol operon is induced or
derepressed before the onset of solventogenesis CoA transferase from C acetobutylicum has
been purified and consists of two subunits which are involved in the uptake of acetate and
butyrate and the production of corresponding CoA derivatives (Wiesenborn et al 1989a) The
Km values of CoA transferase for acetate and butyrate were determined to be 12M and 06M
respectively which are higher than intracellular concentrations of acetate and butyrate and may
suggest a regulatory system that enables the cells to tolerate the toxic environment caused by
increased levels of acids (Wiesenborn et al 1989a Duumlrre et al 1995) Acetoacetate
decarboxylase catalyzes the decarboxylation of acetoacetate via the formation of a Schiff base
intermediate in the catalytic centre of the enzyme and produces acetone and carbon dioxide
(Highbarger et al 1996)
At the onset of solventogenesis substrate uptake rate slows down because large amounts of
acids are accumulated and must be consumed to prevent the dissipation of proton motive force
across the cell membrane Accordingly CoA transferase converts acids to butyryl-CoA and
acetyl-CoA which are converted to ethanol and butanol by the subsequent action of the
aldehydealcohol dehydrogenase Therefore it seems logical for the cell to arrange these two
enzymes in one transcription unit sol operon Acetoacetate decarboxylase is required to provide
a thermodynamic gradient for the initial reaction of butyryl-CoA formation since this reaction is
less thermodynamically favourable This requirement for the decarboxylase might be the reason
that the adc gene is organised in a monocistronic adjacent operon (Duumlrre et al 1995)
Ethanol and butanol are produced in two reduction steps from acetyl-CoA and butyryl-CoA
respectively Butanol formation is catalyzed by several enzymes In addition to the AAD two
butanol dehydrogenase isozymes are involved in butanol formation RNA analysis shows a
sequential order in the induction of different butanol dehydrogenase genes BDH1 enzyme is
mostly involved in low concentration of butanol formation at the onset of solventogenesis but
BDH2 and AAD contribute predominantly to butanol production at higher concentrations and
ensure continued butanol production during solventogenesis (Duumlrre et al 1995 Chen 1995
Welch et al 1989 Walter et al 1992 Petersen et al 1991) Welch et al have characterized two
butanol dehydrogenases with different cofactor requirements and different pH ranges in C
acetobutylicum ATCC 824 The NADH dependent BDH is more active at lower pH with a pH
maximum at 55 and reduced activity at higher pH while the NADPH dependent one is more
27
active at higher pH and its activity decreases when pH drops below 80 so the NADH
dependent BDH is more active in the intracellular pH range
NADH dependent butanol dehydrogenases BDH1 and BDH2 can be considered BDH
isozymes BDH1 is 22-fold more active with butyradehyde than acetaldehyde while BDH2 is
46-fold more active with butyradehyde (Petersen et al 1991) These isozymes are primarily
NADH dependant but show some NADPH activity Although the bdhA and bdhB genes coding
these isozymes are located in tandem on the chromosome RNA studies have shown that they do
not form an operon (Walter et al 1992) The detection of bdh mRNA and BDH activity at
approximately the same time implies that the BDHs are initially regulated at the transcriptional
level (Walter et al 1992)
The gene (aad) encoding the aldehydealcohol dehydrogenase (AAD) has been identified as a
part of sol operon with two ctf genes (Nair et al 1994 Nair and Papoutsakis 1994) The
transformation of aad gene to the mutant M5 of C acetobutylicum which lacks acetoacetate
decarboxylase CoA transferase and butyraldehyde dehydrogenase restores the butanol
formation without any acetone production or significant increase in ethanol production This
suggests that AADrsquos main role is in butyraldehyde dehydrogenase activity and it does not play a
significant role in ethanol production (Nair and Papoutsakis 1994) The second NADH
dependant alcoholaldehyde dehydrogenase has also been identified in alcohologenic cultures of
C acetobutylicum and not in solventogenic cultures (Fontaine et al 2002) An alcohologenic
culture is observed in continuous cultures when grown at neutral pH under conditions of high
NAD(P)H availability and produces butanol and ethanol but no acetone Both aad genes reside
on a megaplasmid whose loss produces degenerated mutants that produce acids and little or no
solvents (Cornillot et al 1997) The sol operon located on the megaplasmid plays a significant
role in solventogenesis and is induced or derepressed at the onset of solventogenesis The
presence of a common regulatory factor for butanol and acetone production has been suggested
(Grupe and Gottschalk 1992) A CoA linked butyraldehydeacetaldehyde dehydrogenase has
been characterized and purified in C acetobutylicum B643 The Km values for both acetyl-CoA
and butyryl-CoA have been almost identical but the relative turnover rate for butyryl-CoA to
acetyl-CoA is 55 therefore this enzyme might be responsible for the final molar ratio of 61 for
butanol to ethanol during this fermentation (Palosaari and Rogers 1988)
28
Metabolic engineering studies of C acetobutylicum have been conducted to improve butanol
yield titer and productivity The inactivation of acetate and butyrate formation pathways (Green
et al 1996) and the combination of CoA transferase downregulation with AAD overexpression
(Tummala et al 2003 Sillers et al 2009) have shown to improve alcohol formation The Β-
hydroxybutyryl-CoA dehydrogenase (BHBD)-negative mutant has produced ethanol with a yield
of 038 gg substrate while the inactivation of entire butyratebutanol pathways had no
significant effect on the growth of C acetobutylicum indicating the flexibility of the central
metabolism towards product pattern modifications (Lehmann and Lutke-Eversloh 2011)
Disrupting the acetate and acetone formation pathways significantly reduced acetate and solvent
production (Lehmann et al 2012) while the megaplasmid-deficient mutant which lacks the
solvent producing genes has shown enhanced hydrogen production rate (Oh et al 2009)
2212 Metabolic shift from acidogenesis to solventogenesis
The onset of solventogenesis coincides with endospore formation both processes start when
cells are exposed to severe acid stress Low pH and accumulation of acids in the cell
environment lead to the presence of massive amounts of undissociated acids these undissociated
acids are membrane permeable and will dissipate the proton gradient across the cell membrane
which causes cell death Sporulation is a time consuming process that enables cells to survive the
harsh environmental condition On the other hand the conversion of acids to neutral solvents and
decreasing the acids production rate provide cells with an opportunity to prevent cell death by the
proton gradient dissipation and formation of mature endospores before the solvent concentration
reaches the toxic level (Duumlrre et al 1995)
In batch cultures the level of undissociated butyric acid correlates with the induction of solvent
production (Huumlsemann and Papoutsakis 1989) The kinetic studies of acid and solvent
formation at various pH values between 45 and 60 in batch cultures show that at lower pH
solvents are the main products but at higher pH only acids are produced The effect of pH can
be correlated with undissociated butyric acid concentration in the medium Between pH 45 to
55 solvent formation starts at undissociated butyric acid concentration between 16 and 19 gl
while at pH 60 in spite of high acid concentrations the undissociated butyric acid concentration
does not exceed 08 gl and no significant amount of solvents are formed (Monot et al 1984)
The intracellular pH in growing clostridia is higher than external pH due to the activity of
29
membrane bound ATPase in proton translocation and it increases the undissociated acetate and
butyrate concentrations inside the cell (Huumlsemann and Papoutsakis 1989 Monot et al 1984)
In contrast to batch cultures the level of undissociated butyric acid does not correlate with
solventogenesis in continuous cultures and high intracellular ATP concentration has been
suggested as an important factor in the kinetic regulation of several key enzymes such as
phosphotransbutyrylase (PTB) and thiolase ATP is an inhibitor to the PTB and inactivation of
this enzyme redirects the carbon flow from butyryl-CoA to the production of butanol instead of
butyrate (Huumlsemann and Papoutsakis 1989) Grupe et al analyzed the continuous cultures of C
acetobutylicum DSM1731 during the shift from acidogenic state to solventogenic state and
noticed an increase in intracellular butyric acid concentration followed by a decrease in acid
production along with acid uptake at the onset of solventogenesis (Grupe and Gottschalk 1992)
Furthermore the intracellular ATP concentration reached a minimum before the commencement
of solventogenesis probably due to the ATP-consuming proton extrusion process accomplished
by F0-F1ATPase at higher ΔpH conditions The NADH plus NADPH pool showed a drastic
increase until the induction of solventogenesis followed by stable oscillatory changes in culture
redox potential in steady state solventogenic culture The shift to solventogenic phase decreases
the ATP demand for pumping protons out thus regeneration of the ATP pool as well as the
decrease in the NAD(P)H concentration weaken the signals for solventogenesis and the level of
solventogenic enzymes decrease acids are produced and the cell enters another shift induction
cycle (Grupe and Gottschalk 1992)
Several studies have been conducted to determine the shift inducing conditions and increase the
solvent yield (Zhao et al 2005 Girbal et al 1995 Girbal and Soucaille 1994 Vasconcelos et
al 1994 Sauer and Duumlrre 1995) however the signals which trigger the solventogenesis are yet
to be known The shift could be attributed to a combination of several signals responsible for
transcriptional regulation DNA supercoiling also has been proposed as a transcriptional sensor
that responds directly to the environmental stimuli (Duumlrre et al 1995) In a recent study
(Wietzke and Bahl 2012) the redox-sensing transcriptional repressor protein Rex has been
identified as a transcriptional regulator of solventogenesis in C acetobutylicum in response
to the cellular NADHNAD+ ratio Rex controls the expression of the genes involved in the
butanol formation pathway The Rex-negative mutant produced significantly higher amounts of
butanol and ethanol while the solventogenesis started earlier than in the wild type and acetone
30
and hydrogen formation were significantly decreased Also the expression of NADH dependant
alcohol dehydrogenase was significantly higher in the Rex mutant These findings offer new
metabolic engineering targets for improving the butanol production in C acetobutylicum
222 C cellulolyticum fermentation
The cellulolytic mesophilic C cellulolyticum synthesizes cellulosome which is an extracellular
multi-enzymatic complex and degrades cellulose to glucose and soluble cellodextrins (mainly
cellobiose) with the use of this cellulosome where the β-14-glycosidic bonds of the cellulose
polymer are hydrolyzed by general acid catalysis (Desvaux 2005b) This extracellular complex
comprises a variety of cellulases hemicellulase and pectinase which are arranged on a protein
scaffold (CipC) (Guedon et al 1999b Desvaux 2005b Desvaux 2005a Perret et al 2004) So
far eight cellulosomal enzymes including seven cellulases and one pectinase have been
biochemically characterized (Desvaux 2005a) The cellulosomes are located on the cell surface
and facilitate both cell adhesion as well as cellulolytic activity on the cellulose fibres Different
aspects of this cellulosome complex including structure regulation extracellular assembly and
enzymatic activity have been characterized and reviewed however the regulation of the
cellulosomal gene expression and the mechanism of secretion attachment and arrangement of
this complex on the cell surface still need more investigation (Abdou et al 2008 Desvaux
2005a) Compared to other mesophilic cellulosome-forming clostridia such as C acetobutylicum
and C cellulovorans C cellulolyticum contains fewer carbohydrate-active enzyme genes
(CAZyme 149 genes) involved in the degradation creation and modification of glycosidic
bonds (Cantarel et al 2009 Xu et al 2013) However it has the most diverse cellulosomal
genes (65 genes) which have been identified in four clusters spread along its genome (Xu et al
2013)
In a recent study it has been demonstrated that the cellulosomes of C cellulolyticum differ in
their protein compositions and are acting synergistically on complex substrates such as straw
whereas higher enzyme diversity advances the degradation efficiency of the cellulosomes (Fendri
et al 2009) The cellulosome of C cellulolyticum is smaller (600kDa) and less complex than its
counterpart in C thermocellum (20 to 65 MDa) (Desvaux 2005b) Also in addition to cell-
associated cellulosomes C cellulolyticum produces cell-free cellulosomes and it has been
proposed that the degree of cell-association cellulose adhesion and the composition of
31
cellulosomes are regulated by the substrate characteristics (Mohand-Oussaid et al 1999) for
instance in contrast to cellulose-grown cells about 90 of the xylanase activity is not cell-
associated when C cellulolyticum is cultivated on xylan and the composition of cellulosomes
obtained from xylan and cellulose-grown cells are different
Previous reports have shown that the cellulosome of C thermocellum is strongly inhibited by
cellobiose while glucose has an insignificant inhibitory effect Furthermore adding β-
glucosidase which hydrolyses cellobiose to the C thermocellum culture has been shown to
increase cellulose degradation rate and remove the adverse effects of cellobiose inhibition by
hydrolyzing it to glucose Cellobiose inhibits the function of C thermocellum cellulosome
through a competitive inhibitory mechanism (Kruus et al 1995) So far cellobiose inhibitory
effect on the Cel5A an endogluconase component of the C cellulolyticum cellulosome has been
established (Fierobe et al 1991) Furthermore it has been shown that glucose has a significant
derepressing effect on the production of cellulosome in C cellulolyticum and in contrast to
cellobiose it does not have any inhibitory effect on its catalytic activity (Petitdemange et al
1992) In a recent study it has been shown that the expression of cellulases in C cellulolyticum
at both transcription and protein levels is induced by glucose while the expression of
cellulosomal genes are repressed under cellobiose and xylose through a carbon catabolite
repression mechanism (Xu et al 2013) In C cellulolyticum cultures on cellulose mixed with
05-80 gL of glucose glucose addition has led to a decrease in the culture lag phase and the
peak cellulose degradation rate has increased compared to the control culture on cellulose (0854
gLday and 0607 gLday respectively) with less than 05 gL of glucose in the culture
The metabolism of cellobiose as the main product of cellulose hydrolysis by C cellulolyticum is
demonstrated in Figure 2-5 (Desvaux 2005b) C cellulolyticum is also able to grow on
cellodextrins (cellobiose to cellohexaose) xylan glucose xylose and weakly on hemicellulose-
derived sugars such as arabinose fructose galactose mannose and ribose The uptake of sugars
through an ATP-Binding Cassette (ABC) transport system followed by their metabolism through
glycolysis pathways results in the production of pyruvate NADH and ATP Pyruvate is
decarboxylated in the presence of coenzyme A (CoA) by pyruvate-ferredoxin oxidoreductase to
generate carbon dioxide acetyl-CoA and reduced ferredoxin where electrons are then
transferred from the reduced ferredoxin to the dehydrogenase NADH-ferredoxin oxidoreductase
and NADPH-ferredoxin oxidoreductase pathways Furthermore the ratio of H2CO2 higher than
32
one has been observed in C cellulolyticum cultures which confirms the transfer of electrons from
NADH to hydrogenase pathway through ferredoxin reduction (Desvaux et al 2000)
It has been previously shown (Desvaux et al 2000) that in pH controlled batch cultures of C
cellulolyticum on a defined medium the distribution of carbon flow depends on the initial
cellulose concentration For concentrations less than 67 gL of cellulose acetate ethanol CO2
and H2 were shown to be the main fermentation end products and more than 91 of cellulose
was observed to be degraded At higher cellulose concentrations from 67 gL up to 291 gL the
carbon flow is redirected from ethanol and acetate towards lactate and extracellular pyruvate In
addition in batch cultures of C cellulolyticum on high cellulose concentration it has been shown
that the peak of pyruvate formation coincides with the start of lactate formation and this
pyruvate accumulation in the C cellulolyticum culture shows that the rate of cellulose catabolism
is higher than the rate of pyruvate consumption Also it has been suggested that the cellulose
hydrolysis depends on the concentration of C cellulolyticum which remains constant at and
above 67 gL of cellulose (Desvaux et al 2000)
33
Figure 2-5 Central metabolic pathways of Clostridium cellulolyticum (adapted from (Desvaux 2005b)) 1
pyruvate-ferredoxin oxidoreductase 2 hydrogenase 3 NADH-ferredoxin oxidoreductase 4 lactate
dehydrogenase 5 acetaldehyde dehydrogenase 6 alcohol dehydrogenase 7 phosphotransacetylase 8
acetate kinase
34
Cellulose metabolism mainly occurs when C cellulolyticum is attached to the substrate (Gelhaye
et al 1993) but in the batch cultures of C cellulolyticum at high cellulose concentrations cell
growth terminates before substrate depletion (Desvaux et al 2000) Moreover it has been shown
that re-inoculating a fresh culture of C cellulolyticum at high cellulose concentration of 291 gL
where substrate is not fully consumed significantly improves the cellulose solubilization and cell
biomass yield compared to a classical batch culture (Desvaux et al 2000) This result indicates
that the incomplete cellulose catabolism is not due to either the limitation of adhesion sites on
cellulose fibers or product inhibition At high cellulose concentrations the likely explanation for
the incomplete cellulose consumption is the lack of control on carbon uptake flow and an
imbalanced metabolism leading to the accumulation of intracellular metabolites and self-
intoxication of the cells eventually resulting in a growth arrest (Desvaux et al 2000 Desvaux
2005b) Similarly extracellular pyruvate formation has been reported in C thermocellum
cultures at high cellulose and cellobiose concentrations which evidences the overflow
metabolism (Levin et al 2006)
Limited growth and catabolic activity on cellulose is the common feature of the currently known
cellulolytic bacteria (Desvaux 2005b) Improving the cellulolytic and catabolic activity of C
cellulolyticum by metabolic engineering (Guedon et al 2002) can facilitate the shift of the co-
culture metabolism to the solventogenic phase However it has been demonstrated that the
central metabolism of C cellulolyticum rather than the cellulose hydrolysis rate is the limiting
step in cellulose metabolism therefore the improvement of C cellulolyticum metabolism which
is not adapted to high catabolic rates instead of the catalytic activity of the cellulosome should
be the main focus in order to improve its cellulolytic activity (Guedon et al 2002 Desvaux
2005b)
Recently a targeted gene inactivation system for C cellulolyticum has been developed and
applied to disrupt the paralogous lactate dehydrogenase and malate dehydrogenase genes
resulting in a significant increase in ethanol formation from cellulose (Li et al 2012) Moreover
gene transfer systems for C cellulolyticum have also been investigated (Jennert et al 2000
Tardif et al 2001) and applied for the production of ethanol (Guedon et al 2002) and
isobutanol (Higashide et al 2011) from cellulose Heterologous expression of pyruvate
decarboxylase and alcohol dehydrogenase genes from Zymomonas mobilis has led to a 53 and
180 increase in ethanol formation and cellulose consumption in the C cellulolyticum batch
35
culture respectively (Guedon et al 2002) Furthermore the feasibility of isobuatnol production
from cellulose in a CBP has been demonstrated through metabolic engineering of C
cellulolyticum to divert its 2-keto acid intermediates toward alcohol formation and the synthesis
of 660 mgL isobutanol from cellulose However the lack of an inducible gene expression
system has been deemed as a significant barrier in expressing new pathways in C cellulolyticum
(Higashide et al 2011) These studies suggest metabolic engineering approaches can
significantly improve the metabolism of C cellulolyticum as a potential CBP organism
Table 2-3 presents some attributes of the C cellulolyticum genome and the calculated number of
orthologous genes which has been derived using reciprocal BLAST (Altschul et al 1990) of C
cellulolyticum and C acetobutylicum genome sequences About 180 of the 1148 orthologous
genes currently exist in the reconstructed C acetobutylicum metabolic network (i FS700)
Table 2-3 The genomic features of C cellulolyticum (httpwwwjgidoegov)
Characteristic Quantity
The genome sequence length 39 Mb
Number of protein coding gene 3283
The calculated number of orthologs among C acetobutylicum and
C cellulolyticum
1148
The calculated number of orthologous genes that exist in C
acetobutylicum model
180
23 Genome-scale metabolic modeling
A wealth of genomic proteomic metabolomic and other types of biological data have been
generated using high-throughput technologies and it is now possible to use this information to
investigate the phenotypic characteristics of microorganisms (Edwards et al 2002 Hyduke et
al 2013 Bordbar et al 2012) Furthermore system-level quantitative analysis of cellular
metabolism using in silico modeling approaches facilitates the generation of new knowledge via
iterative modification of in silico models and experimental designs This knowledge can be
applied for designing strains with improved metabolic activities for industrial applications (Sang
et al 2005 Curran et al 2012 Mahadevan et al 2005 Anesiadis et al 2011 Yim et al 2011)
36
Figure 2-6 illustrates a schematic process of the genome-scale microbial metabolic model
development This iterative process involves two main stages In the first using the knowledge
of the metabolism of an organism annotated genome sequence data along with experimentally
driven biochemical and physiological data the metabolic network is reconstructed This
reconstructed network forms the modeling platform and in the second stage together with other
physiological constraints is analyzed using a mathematical technique (ie Flux Balance
Analysis) Cell biomass synthesis reaction which is derived from cellular chemical composition
as well as maintenance and growth energy requirements must be incorporated into this model
(Senger 2010) The model is refined until the modeling results validate the experimental growth
yield product secretion rates substrate uptake rates and gene knockout experiments (Orth et al
2010 Cheung CY et al 2013) This biochemically and genomically accurate model will then be
applied to study the fluxome of the metabolic network and generate testable hypotheses (Chen et
al 2011 Choon et al 2012 Martinez et al 2013)
Figure 2-6 The process of metabolic model development (adapted from (Covert et al 2001a))
37
231 Metabolic network reconstruction
Through the metabolic network reconstruction process genes proteins and metabolites which
are involved in the metabolism of an organism are identified classified and interrelated to create
a network (Feist et al 2006) This reconstructed network forms the backbone of a metabolic
model Automated approaches for reconstruction of metabolic networks have also been
developed in order to accelerate the pace of reconstruction process (Alves and Buck 2007
Notebaart et al 2006) However inefficiencies of these automated methods due to some
problems such as existence of mis- annotations non-standard protein identifier designations
along with the use of incomplete and unspecific identifiers and the presence of organism specific
reactions or pathways highlight the need for manual curation of these automated reconstructed
networks to increase their accuracy (Francke et al 2005)
A schematic illustration of the metabolic network reconstruction procedure is shown in
Figure 2-7 Annotated genome sequences are the scaffolds of the metabolic networks and are
available from various databases such as KEGG (httpwwwgenomejpkegg) TIGR
(httpwwwtigrorg) EBI (wwwebiacuk) NCBI (wwwncbinlmnihgov) and so forth The
annotation of sequenced genomes involves the identification of genes in a genome and assigning
either predicted or known functions to these identified gene products (Reed et al 2006) using
various computational methods such as BLAST (Altschul et al 1990) or FASTA (Pearson and
Lipman 1988)
In the next step the annotated genes and proteins will be associated to the reactions by means of
database searches using protein name EC number or any other assigned identifiers Some of
these biochemical databases include BRENDA (Schomburg et al 2004) KEGG (Kanehisa and
Goto 2000) Biocyc (Karp et al 2005) and Expasy proteomic server (Artimo et al 2012
Gasteiger et al 2003) as well as TransportDB (Ren et al 2007) which provides information on
transporter proteins in various sequenced genomes Various levels of information such as
substrate and co-enzyme specificity of proteins charged molecular formula of metabolites
stoichiometric coefficients of the reactions and the reaction directionalities which are based on
thermodynamic and biochemical data are required to achieve an accurate metabolic network
(Reed et al 2006) Further metabolic details can be found in scientific literature and textbooks
Gene-Protein-Reaction (GPR) associations also should be defined using Boolean rules for
38
connecting the reactions in a metabolic network to the genes and proteins which are catalyzing
those reactions in a biological system These GPR associations are useful for linking various
types of data such as genomic proteomic and fluxomic data (Reed et al 2006 Francke et al
2005)
Figure 2-7 The metabolic network reconstruction procedure (adapted from (Francke et al 2005))
Pathway analysis for filling in missing metabolic activities or metabolic gaps is a significant
step in metabolic network reconstruction The metabolic capabilities must be in agreement with
the physiology of the organism for example if proline is not an essential amino acid in the
growth medium then the metabolic network must include the complete proline biosynthesis
pathways even though some of enzymes are missing in the genome annotation Thus it can
result in annotation of some genes which were missed in the annotation process or in re-
annotation of other incorrectly annotated genes (Osterman and Overbeek 2003 Green and Karp
2004) Therefore the central metabolism pathways as well as the biosynthesis pathways of
macromolecule building blocks such as amino acids lipids and nucleotides should be examined
Sequence similarity and orthology searches phylogenetic relationships gene context
comparisons between different organisms along with experimental evidence for functional
associations such as transcription pattern data should be considered to achieve high-quality
function assignments to the gene products (Francke et al 2005)
39
A metabolic network continuously evolves as more knowledge on different aspects of a
biological system becomes available and like the annotation process it is never complete Once
a metabolic network is reconstructed its capabilities must be evaluated and further refined In the
network evaluation step the results of in silico analyses using flux balance approach are
compared to the available physiological and biochemical information The metabolic model must
be able to generate precursor metabolites cell biomass components and the cultivation products
of an organism furthermore the network behaviour should be compatible with experimental
results such as cellular phenotypes growth requirements and genetic perturbation data Network
evaluation often results in completion of network gaps and refinements to the network or model
Network reconstruction can also be used to evaluate the consistency of various data sets and to
generate experimentally testable hypotheses (Reed et al 2006)
232 Flux-balance analysis (FBA)
A reconstructed metabolic network can be represented in textual graphical or mathematical
forms The mathematical representation which is a stiochiometric matrix (S) is advantageous
since it facilitates quantitative analysis of the network using various computational methods
(Price et al 2004) Each row of this matrix corresponds to a metabolite each column stands for
a biochemical reaction and each element expresses the stoichiometric coefficient of the
metabolites in various reactions Various features of the metabolic network such as metabolite
connectivity and systemic reactions can be readily known by the analysis of the S matrix (Reed
et al 2006 Schilling et al 2000a) and metabolic phenotypes can be characterized as the
metabolic flux distributions through the metabolic network which are derived using
mathematical modeling approaches (Edwards et al 2002)
Although vast biological data are available the lack of detailed kinetic information limits the
development of dynamic models of cellular metabolism (Chassagnole et al 2002) therefore
instead of attempting to calculate the exact metabolic network fluxes constraint-based modeling
approach narrows the range of possible flux distribution under steady state conditions and thus
constrains the possible phenotypes (Edwards et al 2002) In flux balance analysis (FBA) the
constraints are defined by the stoichiometry of metabolic reactions and flux distributions that
satisfy these constraints are derived by optimizing a particular objective function such as growth
40
rate or ATP production (Edwards et al 2002) The FBA is based on the mass conservation law
for each metabolite in the network
Figure 2-8 illustrates an example of defining mass balance constraints (Palsson 2001) a flux
balance for each metabolite (Xi) in the network yields a dynamic mass balance equation for each
metabolite
Figure 2-8 Defining a metabolic system in FBA (adapted from (Palsson 2001)) Arrows show the reactions
interconnecting the metabolites inside and outside the cell membrane as well as the system boundary
The accumulation rate of Xi in the system can be derived from equation (1) in which Vsyn and
Vdeg refer to the synthesis and degradation rates of Xi Vtrans stands for the exchange fluxes that
transfer metabolites in or out of the system boundary and Vuse corresponds to the growth and
maintenance requirements
dXidt = Vsyn - Vdeg - Vuse plusmn Vtrans (1)
The growth stoichiometry and maintenance requirements can be derived from literature data so
if bi is the net transport rate of extra-cellular metabolites (Xi) into the system boundaries
equation (1) can be rewritten as
dXidt = Vsynth - Vdeg - Vuse + bi (2)
Equation (3) represents all the mass balance equations in a matrix form where X is an m
dimensional vector that describes the amount of metabolites inside the system boundary v is an
n dimensional vector of metabolic reaction fluxes S is the mtimesn stoichiometric matrix and b is
41
the vector of exchange fluxes which transport extracellular metabolites into and out of system
boundary
dXdt = Sv + b (3)
Vallino et al have shown that the steady-state approximation of the metabolite concentrations is
a valid approximation Since the intracellular metabolite concentrations and metabolic fluxes
dynamics are rapid (Vallino and Stephanopoulos 1993) the metabolic transients are very fast in
comparison to the time constants of the cell growth Thus at a steady-state condition the
accumulation term is set to zero and the following equation is derived
Sv + Ib = 0 (4)
Where I is the identity matrix and according to this equation no metabolite accumulation takes
place in the metabolic system since on time scales longer than the doubling time all the
consumption formation and transport reactions are balanced (Palsson 2001) Rearranging the
terms of equation (4) yields the following equation in which Sacute is the stoichiometric matrix that
includes all metabolic transport and exchange reactions and vacute is the vector of all metabolic and
exchange fluxes
Sacutevacute = 0 (5)
Since all of the reactions in the metabolic system are balanced all vectors that satisfy Equation
(5) the null space of Sacute are steady-state flux distributions which meet these constraints These
flux distributions describe the cellular phenotypes under different genetic and environmental
conditions although many of these flux vectors are not physiologically feasible and additional
constraints must be imposed to further limit the solution space (Price et al 2004) In addition to
the stoichiometric constraints flux capacity constraints (Yang et al 2008) and thermodynamic
constraints to generate thermodynamically feasible fluxes through the metabolic network (Henry
et al 2007) have been applied Reaction directionalities and capacity constraints on the fluxes
are introduced as linear inequalities αle vi leβ where the irreversible reaction fluxes are
constrained by setting the lower flux limits to zero while reversible reactions are not
constrained
42
Finally a particular steady-state flux distribution in this underdetermined system where the
number of fluxes often exceeds the number of metabolites can be determined by applying an
optimization approach for maximization or minimization of an objective function such as
growth rate and ATP production (Burgard and Maranas 2003 Schuetz et al 2007) Thus
solving the linear programming (LP) formulated optimization problem subject to all constraints
will result a specific set of steady-state fluxes which meet the objective function as well FBA
has been applied for quantitative prediction and analysis of phenotypic behaviours of various
microorganisms from various life domains (Varma and Palsson 1994 Mahadevan et al 2006
Feist et al 2006 Oh et al 2007 Bro et al 2006)
24 Conclusion
Several studies have recently demonstrated the potential of microbial co-cultures as CBP
solutions for cellulosic ethanol and butanol production however little is known about the co-
culture physiology and inter-species metabolic interactions Such knowledge will be valuable in
designing co-culture systems with improved yield and productivity of the desired biochemicals
in a CBP approach
Therefore genome-scale characterization of metabolic interactions in the co-culture of C
cellulolyticum and C acetobutylicum can bring deep insights into the bottleneck pathways and
facilitate the improvement of this cellulolytic activity using in silico generated hypotheses which
can be tested experimentally Furthermore developing a genome-scale model of metabolism in
this co-culture can assist in designing strategies for improving the yield and productivity of
biobutanol which is the desired product in this CBP Moreover by means of the developed
model of co-culture metabolism it would be possible to examine the in silico production of other
valuable chemicals using genetically engineered strains and to characterize the critical pathways
for their production (Lee and Papoutsakis 1999)
Thus the eventual goal of this study is to develop methods for the analysis of metabolism in this
co-culture and to investigate the inter-species metabolic interactions for enhancing the metabolic
rate and the synthesis of biochemicals from cellulose The research method involves both
computational methods for the development of genome-scale metabolic models and
experimental approaches for the examination of the microbial physiology
43
Chapter 3
Understanding Clostridium acetobutylicum ATCC 824
Metabolism Using Genome-Scale Thermodynamics and
Metabolomics-based Modeling
This chapter contains material published in the conference proceedings below
Salimi F1 Mandal R
2 Wishart D
2 Mahadevan R
1 (2010) Understanding Clostridium
acetobutylicum ATCC 824 Metabolism Using Genome-Scale Thermodynamics and
Metabolomics-Based Modeling In Proceedings of the Symposium on Computer Applications
in Biotechnology 11 (1) 126-131
Affiliations 1 - Department of Chemical Engineering and Applied Chemistry University of
Toronto 2 - Department of Biological Sciences University of Alberta
Contributions FS designed and conducted the in silico and in vitro experiments analyzed the
data and drafted the manuscript RM2 and DW
2 carried out the NMR analyses RM
1 conceived
of the experiments and helped to draft the manuscript
The permission for the reproduction of this material has been granted by the International
Federation of Automatic Control (IFAC) In addition to the original document supplementary
information to this chapter including the list of non-gene associated reactions in C
acetobutylicum model as well as the method for the metabolomic study (intracellular metabolite
extraction and NMR analysis) are provided in Appendices A and B
31 Abstract
Biobutanol has a potential application as a biofuel and can replace gasoline as an alternative
fuel However the productivity of the biobutanol process has to be increased significantly
before it can be commercialized Clostridium acetobutylicum has been the primary microbial
host used for biobutanol production Consequently systems biology based genome-scale
metabolic model of C acetobutylicum metabolism is essential to optimize the biobutanol
44
production rate via genetic and process optimization and metabolic engineering An updated
genome-scale metabolic model of C acetobutylicum ATCC824 consists of 700 genes 709
reactions 29 exchange reactions and 679 metabolites which covers 163 of ORFs and is
more comprehensive compared to two other existing models This metabolic network was used
as a platform for simulating phenotypes using the constraint-based modeling approach Flux
variability analysis shows the presence of alternate carbon and electron sinks that allows for
different carbon assimilation patterns and ranges of product formation rates Incorporation of
metabolomic and thermodynamic data into this model results in thermodynamically feasible
flux distributions We apply an NMR based approach to quantify 31 intracellular metabolites in
both metabolic phases The total molar concentration of metabolites was approximately 245
mM where asparagine was the most dominant metabolite
32 Introduction
Clostridium acetobutylicum is a Gram-positive solvent producing anaerobic bacterium which
is able to convert a variety of sugars to organic acids and solvents In a typical fermentation of
this bacterium two distinct phases are observed in the acidogenic phase the bacterium grows
rapidly and produces acetate butyrate and hydrogen whereas in the stationary growth phase
the metabolic shift to solventogenesis takes place (Jones and Woods 1986) Several studies
have been conducted to increase the solvent yield The ClosTron a gene knockout system for
the genus clostridia has been developed that facilitates further functional genomics studies
(Heap et al 2007) and genome wide transcriptome studies on this species have been
performed (Alsaker and Papoutsakis 2005) Therefore a systems biology approach that allows
the integration of these genome-scale data and the improvement of C acetobutylicum
metabolic activity provides a promising method for optimizing the biobutanol production
process
System-level quantitative analysis of cellular metabolism using in silico modeling approaches
facilitates the generation of new knowledge via iterative modification of in silico models and
experimental designs This knowledge can be applied for designing strains with improved
metabolic activities for industrial applications (Sang et al 2005) Flux balance analysis (FBA)
has been applied for analysis and quantitative prediction of phenotypic behaviours of various
microorganisms across different biological domains More recently FBA has been extended to
include genome-scale thermodynamic and metabolomic data (Wang et al 2006 Henry et al
45
2007 Zamboni et al 2008) in order to refine the metabolic models and shed light on various
aspects of the metabolism
Lee et al have reconstructed a genome-scale metabolic model of C acetobutylicum with
112 ORF coverage and applied this model to predict the metabolic behaviours in acidogenic
and solventogenic phases using FBA (Lee et al 2008a) Senger et al has also presented
another genome-scale metabolic model of C acetobutylicum with 126 ORF coverage and
applied genetic algorithm to derive a constraint based on the specific proton flux state to further
restrict the solution space in FBA and predict the pH of the batch culture during the acidogenic
phase (Senger and Papoutsakis 2008a Senger and Papoutsakis 2008b)
However these models do not incorporate thermodynamic and metabolomic data analyses
These additional constraints can be applied to further limit the solution space In this study an
expanded genome-scale metabolic model of C acetobutylicum is presented We applied
thermodynamics-based metabolic flux analysis (Henry et al 2007) to obtain
thermodynamically feasible flux distributions along with metabolomic data analysis to study
the metabolism of C acetobutylicum
33 Methods
331 C acetobutylicum metabolic network reconstruction
The MetaFluxNetreg
version 182 was the platform used for the model reconstruction
(httpmbelkaistackrlabmfn) The reconstructed network model was then exported to a
Systems Biology Markup Language model (SBML httpsbmlorg) for further analyses using
COBRA toolbox (Becker et al 2007a) in MATLAB environment (The MathWorkstrade) The
automated annotated genome sequence of C acetobutylicum ATCC824 was downloaded from
TIGR-CMR database (httpwwwtigrorg) and was used as a framework for GPR
assignments
The 413 Mb-length genome sequence of ATCC824 (Nolling et al 2001) comprises 4273
ORFs and the GPR assignments were mostly based on this genome annotation in addition the
automated metabolic network of ATCC824 reconstructed using Pathway Tools software
version 115 and MetaCyc version 111 (httpbiocycorgbiocyc-pgdb-listshtml) was used for
confirmation of GPR assignments or re-annotations after manual inspection The model was
46
reconstructed manually on the metabolic roles in the existing annotation Biochemical
databases such as KEGG (httpwwwgenomejpkegg) and the enzyme nomenclature database
were consulted for more information on pathways metabolites and enzymes
(httpcaexpasyorgenzyme)
The elementally and charge balanced reaction equations were mostly obtained from the BIGG
database (httpbiggucsdedu) and the SimPhenytrade database (Genomatica Inc San Diego
CA) furthermore the chemical composition and charge of some particular metabolites which
did not exist in the aforementioned databases were determined using ACDLogD Sol Suite
version 110 (httpwwwacdlabscom) at the physiological pH of 67 which is consistent with
the intracellular pH of C acetobutylicum (Jones and Woods 1986) Transport reactions were
included in the network according to the transport protein information in KEGG and
TransportDB (httpwwwmembranetransportorg) databases as well as the available
physiological data
Pathway completion and gap filling were done manually so that the network produces ATP
along with all cell biomass building blocks including amino acids solute pool nucleotides
cofactors lipids and polysaccharides from available substrates in a defined growth medium
(Monot et al 1982) The BLAST search using UniProt Blast tool (httpwwwuniprotorg)
was applied to assign predicted functions to some missing ORFs in the original annotation as
well as some ORF re-annotations The GPR assignments also were done using available
literature data Further network evaluation and pathway completion were done using
computational analyses (FBA) of the network using COBRA toolbox however network gaps
in some poorly characterized pathways can exist even after performing the network evaluation
step
Non-gene associated reactions were added in order to fill the gaps or to meet the physiological
requirements according to the available literature data The cell biomass macromolecular
composition was assumed to be identical to the Bacillus subtilis (Lee et al 2008a Oh et al
2007) where the composition of nucleotides protein lipids and trace elements as well as the
required polymerization energy were adapted from the model developed by Lee et al The cell
biomass synthesis equation which includes 40 mmol ATP per gram DCW per hour as the
growth associated maintenance energy (GAM) (Lee et al 2008a Senger and Papoutsakis
2008a) was included in the network as a demand reaction
47
332 Flux balance analysis (FBA) and flux variability analysis (FVA)
Metabolic phenotypes can be characterized as the metabolic flux distributions through the
metabolic network derived using mathematical modelling approaches (Edwards et al 2002)
The flux balance analysis (FBA) is based on the mass conservation law for each metabolite in
the network Vallino et al have shown that the steady-state approximation of the metabolite
concentrations is a valid approximation where due to the intracellular metabolite
concentrations and rapid metabolic fluxes the metabolic transients are very fast in comparison
to the time constants of the cell growth (Vallino and Stephanopoulos 1993)
In FBA the constraints are defined by the stoichiometry of metabolic reactions and flux
distributions that satisfy these constraints in this underdetermined system are derived by
optimizing a particular objective function such as growth rate or ATP production (Schilling et
al 1999) Thus solving the linear programming (LP) problem subject to all constraints will
result in a specific set of steady-state fluxes which meet the objective function as well In the
C acetobutylicum network an additional constraint is required due to the presence of cyclic
acid uptake pathways (Desai et al 1999) This constraint relates the acetate and butyrate
uptake rates based on the enzyme kinetic and selectivity data and metabolite concentrations
The butyrate and acetate concentrations were obtained from chemostat data (Meyer and
Papoutsakis 1989)
Ratebutyrate uptake Rateacetate uptake=0315[butyrate] [acetate] (1)
However alternate flux distributions can be achieved using a linear programming technique
under the same optimal condition and objective value (Mahadevan and Schilling 2003) These
alternate flux distributions give an idea about the existence of alternate pathways in the
metabolic network In flux variability analysis (FVA) the optimal objective value is calculated
by FBA and then each flux is maximized and minimized under the same FBA constraints as
well as the fixed optimal objective value The obtained ranges of flux variability demonstrate
the feasible fluxes due to alternate optimal solutions in the metabolic network (Mahadevan and
Schilling 2003)
48
333 Thermodynamics-based metabolic flux analysis (TMFA)
In addition to the stoichiometric constraints thermodynamic constraints have been imposed to
further limit the solution space (Henry et al 2007) Thermodynamics-based metabolic flux
analysis (TMFA) integrates thermodynamic constraints into a constraint-based metabolic
model to generate thermodynamically feasible fluxes through the metabolic network and to
provide data on feasible metabolite activity ranges and ∆rGacute (Henry et al 2007) The ∆rGacute0 of
the metabolic reactions required for thermodynamic constraints were estimated using an
improved group contribution method (Jankowski et al 2008)
334 Batch cultivation and metabolomic samples
Batch cultivations of C acetobutylicum ATCC 824 were conducted anaerobically at 37 ˚C in
15 litre fermenters on Clostridial Growth Medium (CGM) which contains per litre of distilled
water KH2PO4 075 g K2HPO4 075 g MgSO4 0348 g MnSO41H2O 001 g FeSO47H2O
001 g yeast extract 50 g glucose 50 g NaC1 10 g para amino benzoic acid 0004 g
asparagine 20 g and (NH4)2SO4 2 g (Desai 1999) The pH of the medium was adjusted to 55
before inoculation
Cell biomass concentration was monitored by measuring OD at 600 nm while the samples
were diluted to keep the optical density below 10 Product concentrations were measured using
an HPLC system (Biorad Aminex HPX87H column) at 20 ˚C and 05 mlmin-1
of 5 mM H2SO4
as eluent The C acetobutylicum metabolomic samples were taken from three biological
replicates in two growth phases and quenched using liquid nitrogen (Wang et al 2006)
Intracellular metabolite extraction from cell cultures was done according to the method
described by Maharajan et al (Prasad Maharjan and Ferenci 2003) using hot methanol the
extracted metabolites were then analyzed and quantified by NMR Spectroscopy at the
University of Alberta
49
34 Results and discussion
341 Genome-scale network reconstruction and flux balance analysis
The specifications of the iFS700 genome-scale model along with two other previously available
genome-scale metabolic models of C acetobutylicum ATCC 824 are illustrated in Table 3-1
The iFS700 includes 709 reactions 679 metabolites and 700 genes and has a higher ORF
coverage comparing to the other existing models Furthermore a number of genes on ATCC
824 annotation file were identified to be mis-annotated in the TIGR-CMR database and were
highlighted by the discrepancies among various database annotations These genes have been
re-annotated with a defined confidence level in this model
The comparison of the existing model reactions is depicted in Figure 3-1 The major
differences in these network reactions are related to fatty acid and phospholipid metabolism
purines and pyrimidines metabolism and transport reactions Integration of these three
available models will be useful to obtain a comprehensive model of C acetobutylicum
metabolism and to develop a universal model (Lee et al 2008a) Both iJL432 (Lee et al
2008a) and iRS474 (Senger and Papoutsakis 2008a) have been reconstructed mostly based on
the KEGG database and are similar in size while iFS700 is mainly based on TIGR-CMR
database Also Senger et al have applied a semi-automated reverse engineering approach for
metabolic network reconstruction and gap filling but iJL432 and iFS700 are mainly manually
curated networks
Figure 3-1 Venn diagram comparison of the existing model reactions
50
Table 3-1 Specifications of C acetobutylicum metabolic networks
Model Features iFS700 iRS474 iJL432
Genes 700 474 432
Reactions 711 552 502
None-gene associated reactions 69 NA 71
Metabolites 679 422 479
ORF coverage 163 126 112
Re-annotated ORFs 180
Another major difference of this model is the representation of the TCA cycle The TCA cycle
of C acetobutylicum is incomplete and lacks several key enzymes The degenerate TCA cycle
has been found in many prokaryotes but in those cases the pathways of 2-oxoglutarate
succinyl-CoA and fumarate syntheses proceed in both reductive and oxidative directions
(Nolling et al 2001) It was previously suggested that 2-oxoglutarate which is a key precursor
in amino acid biosynthesis pathways is being produced through either reductive counter
clockwise direction of TCA cycle (Nolling et al 2001 Lee et al 2008a) or from ornithine
through the reverse direction of arginine biosynthesis pathway and urea cycle (Senger and
Papoutsakis 2008a)
However a recent flux profiling experiment by Amador-Noguez et al demonstrates that the
TCA cycle in C acetobutylicum is bifurcated (Amador-Noguez et al 2011) This suggested
that 2-oxoglutarate is being produced through the oxidative side of the TCA cycle from
oxaloacetate despite the putative lack of citrate synthase and succinate production from
oxaloacetate is through the reductive direction of TCA cycle via malate and fumarate
Therefore citrate synthase was included as a non-gene associated pathway in this model In C
acetobutylicum the succinate dehydrogenase which reduces fumarate to succinate is missing
and it is assumed in this model that another unknown dehydrogenase catalyzes this reaction
(Nolling et al 2001) Furthermore the enzyme involved in succinyl-CoA formation is missing
This genome encodes a CoA transferase which catalyzes the acetyl-CoA and butyryl-CoA
formations in solventogenic phase and it is plausible that this enzyme also catalyzes the
succinyl-CoA formation from succinate (Nolling et al 2001)
51
To analyse the reconstructed metabolic network and to simulate the growth and metabolism in
a continuous culture (Meyer and Papoutsakis 1989) FBA was conducted using maximization
of cell biomass as the objective function The results showed that the predicted growth rate is in
good agreement with the reported growth rate (micro=044 hr-1
compared to the experimental value
of micro=043 hr-1
) however the cell produced only acetate hydrogen and CO2 in silico
Therefore in order to investigate the possibility of the alternate flux distributions flux
variability analysis was performed (Mahadevan and Schilling 2003)
342 Flux variability analysis
The results of FVA under various sets of stoichiometric thermodynamic and metabolomic
constraints are demonstrated in Figure 3-2a In these analyses the growth rate has been fixed
to its predicted value by FBA (micro=044 hr-1
) The FVA determines the maximum and minimum
values for each flux that can satisfy the model constraints as well as the exact growth rate In all
cases there are significant flux variation ranges for the product formation rates and all of the
experimental chemostat flux data fall in these model-predicted ranges
The alternate optimal solutions are due to the presence of equivalent pathways in the metabolic
network (Price et al 2002 Mahadevan and Schilling 2003) There were 191 reactions with
significant variation ranges (above 01 mmolgDCW-1
h-1
) which can be examined for
identification of the alternate pathways using extreme pathway analysis (Schilling et al
2000b) However alternate pathways are equivalent routes for the production of metabolites
under the same objective value and cannot describe the various fluxes through these alternative
product pathways These results suggest that these various products act as alternative carbon
and electron sinks in C acetobutylicum metabolism All of these pathways are
thermodynamically feasible and consequently the fluxes through them are perhaps determined
by the regulatory network resulting in different product patterns The iFS700 model was able to
predict the growth rate and flux variability in a chemostat and incorporate metabolomic data
Furthermore it is metabolically feasible to have both acids and solvents produced
simultaneously in the exponential growth phase (Harris et al 2000) We applied FVA under
predicted maximum growth and butanol formation rates and these results are depicted in
Figure 3-2b These results suggest that hydrogen and acetate formation pathways are essential
under maximum butanol formation rate while butyrate ethanol lactate acetone and acetoin
52
pathways can be eliminated A previous study has also shown that higher amount of butanol is
produced in iron limited cultures (Peguin and Soucaille 1995) Lactate formation pathway is a
less efficient alternative for NAD+ regeneration and energy production when the activity of
hydrogenase enzyme has been blocked or in iron deficient cultures where the levels of
ferredoxin and the iron containing hydrogenase are low (Jones and Woods 1986) Also in CO-
sparged culture of C acetobutylicum where the activity of hydrogenase enzyme has been
blocked using carbon monoxide a drastic increase in lactic acid formation has been reported
(Datta and Zeikus 1985)
Lee et al (Lee et al 2008a) have also applied FBA to analyze this metabolic system
maximization of cell biomass has been the objective function for modelling the acidogenic
phase and minimization of metabolic adjustment (MOMA) (Segre et al 2002) has been
applied to simulate the solventogenic phase It has been shown that the QP-based approach
results are significantly dependant on the reference flux distribution which is obtained from
FBA (Mahadevan and Schilling 2003) So the predicted solventogenic fluxes will be
dependent on the predicted fluxes in the acidogenic phase where there are significant
differences in the alternative optimal solutions as illustrated in Figure 3-2
53
Figure 3-2 The range of product flux variations for C acetobutylicum metabolic products FVA under
stoichiometric thermodynamic and metabolomic constraints (A) and FVA under predicted maximum
growth and butanol formation rates (B)
54
343 Thermodynamics-based metabolic flux analysis
In order to further constrain the model solution space and improve the model predictability
thermodynamic along with metabolomic information were integrated into the model using
TMFA Thermodynamic data of the model reactions were estimated by group contribution
method (Jankowski et al 2008) The upper and lower bound for metabolite concentrations
were set at 250 mM and 10-9
mM for the measured intracellular metabolites which are
presented in Table 3-2 the concentrations were restricted to the observed ranges and
extracellular metabolites were fixed at the measured concentrations TMFA along with
metabolomic constraints predicted the same growth rate and flux ranges obtained using the
FBA and FVA So all of the reactions involved in the in silico growth which are not part of
internal loops are thermodynamically feasible Furthermore by analyzing the model-predicted
ranges for the reaction Gibbs free energies (∆rGacute) putative regulatory sites (Kummel et al
2006) in C acetobutylicum metabolic network can be identified
344 Metabolomic data analysis
Knowledge of the intracellular metabolite concentrations can be valuable for further
characterizing the metabolic shift and shift inducing conditions in C acetobutylicum
metabolism Thirty one intracellular metabolites were quantified and the list of some of these
metabolites with the error estimates and some of the extracellular concentrations are presented
in Table 3-2 The total molar concentration of metabolites was approximately 245 mM which is
comparable with the E coli metabolite pool of 300 mM (Bennett et al 2009) Measured
metabolites are mainly amino acids which are present at the same level in both phases The
most dominant metabolite after glucose was asparagine followed by alanine and glutamate
This is in contrast to the E coli metabolome where glutamate was the most abundant
compound (Bennett et al 2009) Nucleotides and redox coenzymes could be identified but
were present in very low amounts so could not be quantified In terms of the significance of
the changes in metabolite concentrations butyrate and acetate concentrations showed a
significant increase in solventogenic phase while phenylalanine 2-oxoglutarate and fumarate
showed significant decrease during solventogenesis consistent with their role as precursors for
cell biomass synthesis
55
Table 3-2 Intracellular and extracellular metabolite concentrations in acidogenic and solventogenic phases
Standard deviations are based on three biological replicates as presented in the parentheses
Metabolites Acidogenic phase Solventogenic phase Significant variation in
intracellular
concentrations
between two phases
at 95 confidence
level
Intracellular
(mM)
Extracellular
(mM)
Intracellular
(mM)
Extracellular
(mM)
Glucose 221 (47) 270 (2) 160 (54) 215 (2)
Acetate 099 (036) 6 (5) 262 (034) 19 (5)
Acetone 007 (004) 015 (01) 005 (002) 12 (3)
Butyrate 081 (038) 10 (9) 512 (144) 21 (9)
Ethanol 012 (001) 2 (2) 034 (011) 4 (1)
Formate 021 (005) 012 (01) 011 (002) 005 (005)
Lactate 039 (011) 4 (7) 030 (005) 6 (3)
Pyruvate 009 (002) 011 (002)
Alanine 173 (046) 224 (041)
Glutamate 125 (025) 127 (018)
Asparagine 141 (375) 100 (123)
Methionine 017 (005) 009 (001)
Phenylalanine 053 (009) 021 (015)
2-Oxoglutarate 007 (002) 0
Citrate 002 (001) 0
Fumarate 001 (7times10-4
) 0
Succinate 029 (002) 021 (011)
Isocitrate 018 (006) 060 (041)
35 Conclusion
Flux balance analysis cannot predict the complex metabolism of C acetobutylicum properly
and additional constraints are required to narrow down the solution space Previously specific
proton flux state (Senger and Papoutsakis 2008b) was developed for this purpose here we
incorporated thermodynamic and metabolomic data Although it did not improve the
predictability of the model it allows for thermodynamically feasible flux distributions On the
other hand incorporating the regulatory network in the genome-scale model is necessary for
describing the metabolic shift from acidogenic to solventogenic phase (Covert et al 2001b)
56
The intracellular metabolome of C acetobutylicum was quantified in two phases but a
dynamic metabolome profiling experiment is necessary to trace the intracellular metabolite
concentration changes over time and during the metabolic shift
57
Chapter 4 Genome-scale Metabolic Modeling of a Clostridial Co-culture for
Consolidated Bioprocessing
This chapter contains material from our publication
Salimi F1 Zhuang K
1 2 Mahadevan R
1 (2010) Genome-scale metabolic modeling of a
clostridial co-culture for consolidated bioprocessing Biotechnology Journal 5 (7)726-738
Affiliations 1 - Department of Chemical Engineering and Applied Chemistry University of
Toronto 2 - Present Address Novo Nordisk Foundation Center for Biosustainability Denmark
Contributions FS conceived of the study reconstructed the metabolic network conducted the
modeling and drafted the manuscript KZ carried out the DMM simulations RM conceived of
the study and helped to draft the manuscript
The permission for the reproduction of this material has been granted by Wiley-VCH Verlag
GmbH amp Co KGaA publishing company
41 Abstract
An alternative consolidated bioprocessing approach is the use of a co-culture containing
cellulolytic and solventogenic clostridia It has been demonstrated that the rate of cellulose
utilization in the co-culture of Clostridium acetobutylicum and Clostridium cellulolyticum is
improved compared to the mono-culture of C cellulolyticum suggesting the presence of
synergy between these two species However the metabolic interactions in the co-culture are
not well understood In order to understand the metabolic interactions in the co-culture we
developed a genome-scale metabolic model of C cellulolyticum comprising of 431 genes 621
reactions and 603 metabolites The C cellulolyticum model can successfully predict the
chemostat growth and byproduct secretion with cellulose as the substrate However a growth
arrest phenomenon which occurs in batch cultures of C cellulolyticum at cellulose
concentrations higher than 67 gL cannot be predicted by dynamic flux balance analysis due to
the lack of understanding of the underlying mechanism Furthermore these genome-scale
metabolic models of the pure cultures have been integrated using a community modeling
framework to develop a dynamic model of metabolic interactions in the co-culture Co-culture
58
simulations suggest that cellobiose inhibition cannot be the main factor that is responsible for
improved cellulose utilization relative to mono-culture of C cellulolyticum
42 Introduction
In consolidated bioprocessing (CBP) all four biological steps involved in the conversion of
cellulosic biomass which includes production of saccharolytic enzymes the hydrolysis of the
polysaccharides present in pre-treated biomass and fermentation of hexose and pentose sugars
present in the hydrolyzate to desired products occur in one bioreactor CBP uses a single
microorganism or a microbial consortium without the external addition of saccharolytic
enzymes (Lynd et al 2002) Consolidated bioprocessing has been proposed to decrease the
product cost by eliminating substrate costs utility capital and other costs related to the
cellulase production stage However microorganisms with both rapid conversion of cellulose
and high-titer product formation capabilities required for CBP do not currently exist and need
to be developed (Lynd et al 2005) current strategies for this purpose include the native
strategy which improves the product formation capabilities such as yield and titer in natural
cellulolytic microorganisms while the recombinant strategy involves engineering non-
cellulolytic organisms with high product yields so that they will express heterologous cellulase
and be able to utilize cellulose (Lynd et al 2005)
Clostridia are among the metabolically diverse group of bacteria and include both cellulolytic
and solventogenic members This metabolic diversity motivates an alternative method for the
production of biobutanol from cellulosic biomass in a consolidated bioprocessing approach
using a mesophilic clostridial co-culture C acetobutylicum shows an effective capability to
ferment hemicellulose derived sugars as well as cellulose derived sugars such as cellobiose
mannose arabinose xylose glucose and galactose to acetone butanol and ethanol (Yu et al
1984 Fond et al 1986) therefore the co-culture of this bacterial species with a mesophilic
cellulose degrading bacterium can be an alternative option for CBP
A simplified scheme of the clostridial co-culture fermentation on cellulose is presented in
Figure 4-1 C acetobutylicum is a Gram-positive solvent producing anaerobic bacterium
which is able to convert a variety of sugars to organic acids and solvents In a typical
fermentation of this bacterium two distinct phases are observed in the acidogenic phase the
bacterium grows rapidly and produces acetate butyrate and hydrogen whereas in the
59
stationary growth phase the metabolic shift to solventogenesis takes place (Jones and Woods
1986) C cellulolyticum which is cellulolytic mesophilic bacterium synthesizes cellulosome
which is an extracellular multi-enzymatic complex and degrades cellulose to glucose and
soluble cellodextrins (mainly cellobiose) with the use of this cellulosome This extracellular
complex comprises a variety of cellulases hemicellulase and pectinase which are arranged on
a protein scaffold (CipC)(Guedon et al 1999b Desvaux 2005a) The cellulosomes are located
on the cell surface and facilitate both cell adhesion as well as cellulolytic activity on the
cellulose fibers However in comparison to C thermocellum the cellulosome of C
cellulolyticum is smaller and less complex (Felix and Ljungdahl 1993)
Figure 4-1 The scheme of the clostridial co-culture fermentation on cellulose C cellulolyticum adheres to
the cellulose fibers using cellulosome and hydrolyzes cellulose to cellobiose (cellb) and glucose (glc) which
can be metabolized by C cellulolyticum and C acetobutylicum in the co-culture The produced pyruvate
(pyr) can also be fermented as a carbon source by C acetobutylicum
The co-culture of C cellulolyticum with C acetobutylicum has been studied previously and it
has been shown that cellulolytic activity is the limiting factor in the co-culture fermentation
since most of the cellulase activity products are consumed by C acetobutylicum The
fermentation products are mainly butyric acid along with butanol acetic acid and ethanol and
the lack of glucose which is required for solvent production due to low cellulolytic activity
was hypothesized to be the reason for acid accumulation (Jones and Woods 1986
60
Petitdemange et al 1983) Furthermore three times more cellulosic material was degraded in
the co-culture compared to the mono-culture of Ccellulolyticum due to the utilization of
cellulase activity products and the elimination of their repressive effects (Mitchell et al 1995)
suggesting the presence of synergy between these two species Hence the analysis of this effect
can be valuable for optimizing the rate of cellulosic material degradation
Limited growth and catabolic activity on cellulose is the common characteristic of the currently
known cellulolytic bacteria (Desvaux 2005b) Improving the cellulolytic and catabolic activity
of C cellulolyticum by metabolic engineering (Guedon et al 2002) can facilitate the shift of
co-culture metabolism to the solventogenic phase However it has been demonstrated that the
central metabolism of C cellulolyticum rather than the cellulose hydrolysis rate is the limiting
step in cellulose metabolism therefore the improvement of C cellulolyticum metabolism
which is not adapted to high catabolic rates instead of the catalytic activity of the cellulosome
is critical in order to improve its cellulolytic activity (Guedon et al 2002 Desvaux 2005b)
Therefore genome-scale metabolic modeling of C cellulolyticum metabolism can provide an
improved understanding of the bottleneck pathways and facilitate the improvement of this
metabolic and cellulolytic activity using in silico generated hypotheses which can be tested
experimentally Furthermore developing a genome-scale model of metabolism in this co-
culture can assist in designing strategies for improving the yield and productivity of
bioproducts via CBP
Lee et al has reconstructed a genome-scale metabolic model of C acetobutylicum with 112
ORF coverage and applied this model to predict the metabolic behavior in acidogenic and
solventogenic phases using FBA (Lee et al 2008b) Senger et al has also presented another
genome-scale metabolic model of C acetobutylicum with 126 ORF coverage and applied
genetic algorithm to derive a constraint based on the specific proton flux state to further restrict
the solution space in FBA and predict the pH of the batch culture during the acidogenic phase
(Senger and Papoutsakis 2008b)
In this study we present the genome-scale metabolic model of C cellulolyticum H10 which
comprises 431 genes 621 reactions 603 metabolites and covers 12 of ORFs Also we
developed an updated genome-scale metabolic model of C acetobutylicum ATCC824 which
consists of 700 genes 712 reactions and 679 metabolites covering 163 of ORFs and is more
comprehensive compared to two other existing models These metabolic networks were used as
61
platforms for simulating phenotypes using the constraint-based modeling approach C
cellulolyticum model (iFS431) was able to predict the physiology during growth in the presence
of cellulose and cellobiose These models were used to develop a model of co-culture
metabolism by combining these metabolic models of the pure cultures using the DMMM
framework (dynamic multi-species metabolic modeling framework also illustrated in
Appendix C Figure A1) (Zhuang et al 2011) This co-culture model was used to analyze the
integrated physiology of this co-culture and the results showed that at high cellulose
concentrations the model is not able to capture the C cellulolyticum growth arrest suggesting
that cellobiose inhibition removal by C acetobutylicum is not the main factor that improves
cellulose degradation in the co-culture Further investigation to understand the mechanism
behind this growth arrest is required to improve the model predictions at high cellulose
concentrations as well as predictions of the co-culture physiology
43 Methods
431 C acetobutylicum and C cellulolyticum metabolic network reconstructions
The automatically annotated genome sequence of C acetobutylicum ATCC824 was
downloaded from TIGR-CMR database (httpwwwtigrorg) and was used as a framework for
gene-protein-reaction (GPR) assignments The 413Mb-length genome sequence of ATCC824
(Nolling et al 2001) comprises 4273 ORFs and the GPR assignments were mostly based on
this genome annotation in addition the automated metabolic network of ATCC824
reconstructed using Pathway Tools software version 115 and MetaCyc version 111
(httpbiocycorgbiocyc-pgdb-listshtml) were used for confirmation of GPR assignments or
re-annotations after manual inspection
The model was reconstructed manually based on the metabolic roles in the existing annotation
and biochemical databases such as KEGG (httpwwwgenomejpkegg) and the enzyme
nomenclature database were consulted for more information on pathways metabolites and
enzymes (httpcaexpasyorgenzyme) Transport reactions were included in the network
according to the transport protein information in KEGG and TransportDB
(httpwwwmembranetransportorg) databases as well as the available physiological data The
cell biomass synthesis equation of C acetobutylicum which includes 40 mmol ATP per gram
62
DCW per hour as the growth associated maintenance energy (GAM)(Lee et al 2008b Senger
and Papoutsakis 2008b) was included in the network as a demand reaction C cellulolyticum
H10 Metabolic network was reconstructed based on the genome annotation available on JGI
database (httpwwwjgidoegov) for GPR associations and using the available literature and
experimental data To find the transporter genes in the C cellulolyticum H10 genome
reciprocal blast was conducted where the entire amino acid sequences were blasted against
Transport Classification Database (httpwwwtcdborg) at the cut off e-value equal of 10-5
The candidate orthologous genes then were assigned to the corresponding transport reactions
Non-growth associated maintenance (NGAM) for growth of C cellulolyticum on cellobiose has
been reported to be 22 mmol ATP per gram DCW per hour and 29 mmol ATP per gram DCW
per hour for growth on cellulose (Desvaux et al 2001b)
The MetaFluxNetreg
version 182 was the platform used for the model reconstructions
(httpmbelkaistackrlabmfn) and the reconstructed network models were then exported to
Systems Biology Markup Language models (SBML httpsbmlorg) for further analyses using
COBRA toolbox (Becker et al 2007b) in MATLAB environment (The MathWorkstrade) The
elementally and charge balanced reaction equations were mostly obtained from the BIGG
database (httpbiggucsdedu) and SimPhenytrade database (Genomatica Inc San Diego CA)
furthermore the chemical composition and charge of some particular metabolites which did
not exist in the aforementioned databases were determined using ACDLogD Sol Suite version
110 (httpwwwacdlabscom) at the physiological pH of 67 which is consistent with the
intracellular pH of C acetobutylicum (Jones and Woods 1986)
Pathway completion and gap filling were done manually so that the networks produce ATP
along with all cell biomass building blocks including amino acids solute pool nucleotides
cofactors lipids and polysaccharides from available substrates in their defined growth media
(Monot et al 1982 Guedon et al 1999b) The BLAST search using UniProt BLAST tool
(httpwwwuniprotorg) was applied to assign predicted functions to some missing ORFs in
the original annotations as well as some ORF re-annotations The GPR assignments also were
done using available literature data Further network evaluation and pathway completion were
done using the COBRA toolbox however network gaps in some poorly characterized
pathways can exist even after performing the network evaluation step Non-gene associated
63
reactions were added in order to fill the gaps or to meet the physiological requirements
according to the available literature data manually and using FBA
These reactions are detailed in the supplementary information (Appendix A available at
httponlinelibrarywileycomdoi101002biot201000159fullsupp-info) The cell biomass
macromolecular compositions were assumed to be identical to the Bacillus subtilis (Lee et al
2008b Oh et al 2007) where the composition of nucleotides protein lipids and trace
elements as well as the required polymerization energy were adapted from the model developed
by Lee et al (Lee et al 2008b)
432 Flux balance analysis (FBA)
Metabolic phenotypes can be predicted by calculating the flux distributions through the
metabolic networks using constraint-based modeling (Feist et al 2009 Price et al 2004
Henry et al 2007) The flux balance analysis (FBA) is based on the mass conservation law for
each metabolite in the network Vallino et al (Vallino and Stephanopoulos 1993) have shown
that the steady-state approximation of the metabolite concentrations is a valid approximation
where due to the intracellular metabolite concentrations and rapid metabolic fluxes the
metabolic transients are very fast in comparison to the time constants of the cell growth In
FBA the constraints are defined by the stoichiometry of metabolic reactions and flux
distributions that satisfy these constraints in this underdetermined system are derived by
optimizing a particular objective function such as growth rate or ATP production (Schilling et
al 2000a) Thus solving the linear programming (LP) problem subject to all constraints will
result in a specific set of steady-state fluxes which maximizes the objective function as well In
the C acetobutylicum network an additional constraint is required due to the presence of cyclic
acid uptake pathways (Desai et al 1999) This constraint relates the acetate and butyrate
uptake rates based on the enzyme kinetics and selectivity data and metabolite concentrations
The butyrate and acetate concentrations were obtained from chemostat data (Meyer and
Papoutsakis 1989) Ratebutuptake and Rateacuptake are the rate of butyrate and acetate uptake and
Cbutyrate Cacetate are extracellular butyrate and acetate concentration
acetate
butyrate
acuptake
butuptake
C
C
Rate
Rate3150 (1)
64
However alternate flux distributions can be achieved using the linear programming technique
under the same optimal condition and objective value (Mahadevan and Schilling 2003) These
alternate flux distributions provide information on the existence of alternate or redundant
pathways in the metabolic network In flux variability analysis (FVA) the optimal objective
value is calculated by FBA and then each flux is maximized and minimized under the same
FBA constraints as well as the fixed optimal objective value
433 Co-culture model development
The scheme of cellulose fermentation by clostridial co-culture has been illustrated in
Figure 4-1 C cellulolyticum can attach to the cellulose fibrils via the carbohydrate binding
domains of the cellulosome which is an extracellular multi-enzymatic complex located on the
cell surface of C cellulolyticum (Desvaux 2005a) Due to the cellulolytic activity of the
cellulosome soluble sugars are released where cellobiose is the major product of cellulose
hydrolysis (Guedon et al 1999b) and it has been shown that glucose constitutes 30 of the
cellulose hydrolysis products (Giallo et al 1985) So in this study we assumed the following
stoichiometry for the cellulase reaction which takes place in C cellulolyticum extracellular
compartment by means of the cellulosome complex in the model
glcCellbOHGcell 30350650 2 (2)
The co-culture system dynamics can be described using the following equations (3-11) which
are based on the dynamic multi-species metabolic modeling framework (Zhuang et al 2011)
(also illustrated Appendix C) The Michaelis-Menten kinetic parameters of cellulose
solubilisation and metabolism by C cellulolyticum have been reported previously where vmax is
291 mmolgDCWh (Desvaux et al 2001c) and Km is equal to 08 g hexose equivalent per
litre (Giallo et al 1985) It has been assumed that cellobiose inhibits the function of C
cellulolyticum cellulosome through a competitive inhibitory mechanism similar to what has
been demonstrated for the C thermocellum cellulosome (Kruus et al 1995) the Ki value for
competitive inhibition of the endogluconaseA component of the cellulosome is equal to 11
mM (Fierobe et al 1991) and the Ki value of about 2 mM has been reported for the C
thermocellum cellulosome (Kruus et al 1995)
65
Gcellm
i
cellb
Gcellcellulase
CKk
C
CvV
)1(
max (3)
cc
cellulaseGcell XV
dt
dC (4)
cccc
cellb
caca
cellb
CC
cellulasecellb XVXVXV
dt
dC 350 (5)
cellulase
cccc
glc
caca
glc
glcVXVXV
dt
dC30 (6)
caca
pyr
cccc
pyr
pyrXVXV
dt
dC (7)
cacaca
Xdt
dX (8)
cccccc
Xdt
dX (9)
Max microca
(10)
Subject to Sca
Vca
=0
glc
glcca
glcC
CV
563
115
cellb
cellbca
cellbC
CV
1
472
pyr
pyrca
pyrC
CV
1
915
lac
lacca
lacC
CV
11
240
ac
acca
acC
CV
41
618
Max microcc
(11)
Subject to Scc
Vcc
=0
glc
glccc
glcC
CV
2220
016
cellb
cellbcc
cellbC
CV
2220
015
Where CGcell Ccellb Cglc Cpyr Cac Clac are cellulose cellobiose glucose pyruvate acetate
and lactate concentrations V is reaction rate obtained from FBA and Xca
and Xcc
are C
acetobutylicum and C cellulolyticum biomass concentrations Kinetic data for C cellulolyticum
growth on cellobiose (Desvaux et al 2001b Guedon et al 2000) and glucose (Giallo et al
1983) and C acetobutylicum growth on cellobiose (Lopez-Contreras et al 2003) glucose
(Yang and Tsao 1994 Houston and Papoutsakis 1989) pyruvate (Janati-Idrissi et al 1989)
acetate and lactate (Diez-Gonzalez et al 1995) were incorporated into the constraints For
66
modeling cellulose fermentation in batch and the co-culture the upper limit of cellobiose
uptake rate has been set to 076 mmolgDCWh to fit the experimental data (Desvaux et al
2001c) Hence microca
and microcc
were obtained by solving the FBA problem for each species in
equations (10-11) using maximization of growth rates as the objective functions and the
integration of these ODEs was performed using established methods in MATLAB (Covert et
al 2008)
44 Results and discussion
441 C cellulolyticum metabolic network analysis
4411 Central metabolism and energetics
The genomic features and specifications of C cellulolyticum H10 (iFS431) metabolic network
are shown in Figure 4-2a and b Aligning C cellulolyticum and C acetobutylicum genomes
using reciprocal BLAST at e-value cut off of 10-2
suggests the existence of 1142 putative
orthologous genes between these two species out of which 180 of them are currently present in
the C acetobutylicum metabolic network The iFS431 network includes 603 metabolites 621
reactions associated to 431 genes and 68 reactions have been added as non-gene associated
reactions in order to fill the gaps or to meet the physiological requirements according to the
available literature data (Guedon et al 1999b) This reconstruction is mainly based on the
genome annotation available on JGI database The TCA cycle and central metabolism
pathways of C cellulolyticum have not been characterized yet however this species is capable
of producing succinate (Giallo et al 1983) Therefore succinate dehydrogenase is included in
the model as a non-gene associated reaction in the TCA cycle Like C acetobutylicum the
TCA cycle of C cellulolyticum also seems to be bifurcated and it is missing succinate CoA
ligase
C cellulolyticum degrades cellulose to glucose and soluble cellodextrins (mainly cellobiose)
using its extracellular cellulosome It has been suggested that the bioenergetic cost of
cellodextrin transport is independent of the cellodextrin degree of polymerization (Lynd et al
2002) and for C cellulolyticum 2 mol ATP is being consumed per each mole of substrate
transported through ABC transport system The energetic cost of cellulosome biosynthesis has
been included in the GAM value Furthermore there is an ATP gain associated with
67
phosphorylitic cleavage of the cellodextrins (EC 24120 EC 24149) which can explain the
higher cell biomass yield on cellobiose compared to glucose (Lynd et al 2002)
b
Characteristic Quantity
The genome sequence length 41 Mb
Number of protein coding genes 3575
Number of genes included in the reconstructed network 431
ORF coverage () 12
The calculated number of orthologs among C acetobutylicum and
C cellulolyticum
1148
The calculated number of orthologous genes that exist in C
acetobutylicum model
180
ReactionsMetabolites
Total number of model reactions 621
Gene associated reactions 513
Non-gene associated reactions 71
Exchange reactions 37
Transport reactions 45
Total number of metabolites 603
Number of extracellular metabolites 46
Figure 4-2 (a) Distribution of reactions in C cellulolyticum metabolic network and (b) the genomic features
and specifications of C cellulolyticum H10 metabolic network
68
This higher yield is also predicted by the model Growth associated maintenance energy
(GAM) was estimated using the available chemostat data (Guedon et al 1999b) by minimizing
the error between the model-predicted growth rate and the experimental data at various dilution
rates on cellobiose as shown in Figure 4-3e The estimated GAM value of 15 mmol ATP per
gram DCW per hour was included in the cell biomass synthesis equation (supplementary Table
at httponlinelibrarywileycomdoi101002biot201000159fullsupp-info)
4412 Analysis of by-product secretion patterns in C cellulolyticum during growth on cellobiose
The FBA was used to simulate the flux distributions in the reconstructed network in continuous
cultures of C cellulolyticum on cellobiose and cellulose (Guedon et al 1999b Desvaux et al
2001b) The maximization of growth rate was selected as the objective function and the results
of FBA for the growth on cellobiose are shown in Figure 4-3d The growth simulation on
cellobiose demonstrates that acetate formation rate is significantly higher than the experimental
data C cellulolyticum is a fermentative anaerobe and produces energy through the acetate
formation pathway To investigate the reason for high acetate flux and the presence of futile
cycles FVA on the acetate formation pathway under the same conditions and predicted growth
rate of 0116 h-1
were conducted The FVA showed that for this growth rate the minimum
required ATP formation and acetate flux is 449 mmolgDCWh and rejects the presence of
futile cycles Another explanation for this can be the existence of alternate energy production
pathways in C cellulolyticum as it has been shown recently that this genome encodes an
energy-converting [NiFe] hydrogenase (Calusinska et al 2010) which can couple the
exergonic hydrogen formation reaction to the formation of a proton or sodium-ion motive force
and energy conservation through oxidative level phosphorylation (Hedderich 2004)
In addition the model did not predict pyruvate formation while it has been observed that
pyruvate is being produced at high dilution rates or carbon fluxes (Guedon et al 2002) and it
has been suggested that limited pyruvate-ferredoxin oxidoreductase (PFO) activity which
cannot support high pyruvate flow is the reason of this pyruvate overflow (Guedon et al
1999b) Furthermore high pyruvate affinity of PFO (km=057 mM) as well as the low pyruvate
affinity of lactate dehydrogenase (LDH km=45 mM) can explain the intracellular pyruvate
accumulation and overflow (Guedon et al 1999b) Also as shown in Figure 4-3a simulation
of the C cellulolyticum metabolism without any constraint on the LDH and PFO at high
69
cellobiose uptake rate (186 mmolgDCWh) showed that pyruvate will not be produced if
there is no capacity constraint on these two reactions Therefore the upper bound for the LDH
flux was set to the maximum observed lactate production rate which is 05 mmolgDCWh
(Guedon et al 1999b) and by minimizing the error in predicted pyruvate formation rate the
upper bound for the flux through PFO was found to be 545 mmolgDCWh The constraint on
hydrogen formation flux has been set to cellbH qq 42 based on the fermentation stoichiometry
(Guedon et al 1999b) and simulation results with expression of pyruvate decarboxylase
(PDC) pathway showed that PDC pathway will not be active unless there is a constraint on
hydrogen formation rate Furthermore Figure 4-3b and c show that removing these constraints
on PFO LDH and hydrogen production pathways decrease the model prediction accuracy
70
71
Figure 4-3 Model predicted metabolism of C cellulolyticum in chemostat culture on cellobiose (a) model
predicted cellobiose metabolism with no constraint on H2 formation LDH and PFO pathways (b) model
predicted cellobiose metabolism with no constraint on LDH and PFO pathways (c) model predicted
cellobiose metabolism with no constraint on LDH pathway (d) Model predicted product formation rates of
C cellulolyticum on cellobiose D=012 h-1
and comparison with the experimental data (Guedon et al
1999b) (e) Goodness of fit for C cellulolyticum growth rate data on cellobiose at various dilution rates
(Guedon et al 1999b) and GAM=15 mmolgDCWh bm celb eth ac lac pyr stand for cell biomass
cellobiose ethanol acetate lactate and pyruvate
72
4413 Analysis of C cellulolyticum growth physiology on cellulose
In order to validate the model prediction which was calibrated using cellobiose growth data
we compared the model simulations with cellulose as the substrate with experimental data
Modeling results show that the iFS431 model is able to appropriately predict the cellulose
metabolism growth rates and product formation rates as depicted in Figure 4-4a and e We
used cellobiose growth data for prediction of the GAM energetic parameter and then used this
calibrated model to predict the cellulose growth data However due to the cellulosome
synthesis cost the GAM value for growth on cellulose could be higher As this cost has not
been considered in the model which was calibrated on cellobiose the model over-predicts the
growth rates in the Figure 4-4a The rate of acetate formation is higher when C cellulolyticum
H10 is growing on cellulose while it has higher growth rate on the cellobiose this discrepancy
might be related to the ATP cost of cellulosome biosynthesis which is higher for the growth on
cellulose and leads to more ATP formation via acetate production pathway The acetate and
ethanol formation rates are properly predicted by the model however lactate and pyruvate
secretion rates which are significantly less than cellobiose growth case could not be captured
by the model The impact of imposing the constraints on PFO LDH and hydrogen production
pathways on the model prediction of cellulose metabolism are illustrated in Figure 4-4b to d to
support the presence of these constraints
73
74
Figure 4-4 Model predicted cellulose metabolism in chemostat culture by C cellulolyticum (a) Model
prediction of C cellulolyticum growth rate on cellulose at various experimental dilution rates (Desvaux et
al 2001c) (b) model predicted cellulose metabolism with no constraint on H2 formation LDH and PFO
pathways (c) model predicted cellulose metabolism with no constraint on LDH and PFO pathways (d)
model predicted cellulose metabolism with no constraint on LDH pathway (e) C cellulolyticum model
predictions on cellulose as carbon source and D=008 h-1
and comparison with the experimental data
(Desvaux et al 2001c) bm cel eth ac lac pyr stand for cell biomass cellulose ethanol acetate lactate
and pyruvate and it has been assumed that cellobiose is the major product of cellulose hydrolysis
75
4414 Analysis of C cellulolyticum batch growth on cellulose
We also applied dynamic flux balance analysis (dFBA) (Mahadevan et al 2002) to model the
metabolism of C cellulolyticum in a batch culture on cellulose (Desvaux et al 2001a) The
results of this simulation with the initial cellulose concentration of 67 gL and initial cell
biomass concentration of 20 mgL are shown in Figure 4-5a Under these conditions C
cellulolyticum degrades approximately 80 of the cellulose and shifts to its stationary growth
phase before complete cellulose exhaustion which is due to a growth arrest and is thought to be
caused by the accumulation of an intracellular metabolite (Desvaux et al 2000) This
intracellular growth arrest which has been shown to happen when the cellulose concentration is
higher than 39 gL cannot be captured using FBA however in the exponential growth phase
the initial cellulose degradation and cell biomass growth patterns are well predicted by the
model
Modeling this phenomenon requires the knowledge of the underlying growth arrest mechanism
and is a topic for further experimental studies The results of dFBA for simulating the cellulose
hydrolysis by C cellulolyticum in a batch culture at initial cellulose concentration of 39 gL
where no growth arrest occurs are depicted in Figure 4-5b the model is able to predict the
cellulose hydrolysis accurately and there is a good agreement between the model prediction and
the experimental data (Desvaux et al 2000) also the predicted final cell biomass
concentration of 364 mgL is in accordance with the reported experimental value of 340 mgL
Moreover in batch cultures of C cellulolyticum glucose and cellobiose accumulation of up to
15 mM has been observed which is predicted by the model as well (Desvaux et al 2001a)
76
77
Figure 4-5 Model predicted metabolic profile of C cellulolyticum in batch culture on cellulose (a) cell
biomass and cellulose profiles are compared to the experimental data at initial cellulose concentration of
67 gL (b) model predicted cell biomass and sugar profiles and cellulose profile compared to the
experimental data at initial cellulose concentration of 39 gL
442 Genome-scale metabolic modeling of the co-culture and strategies for improving the co-culture metabolism
Cellulose metabolism mainly occurs when C cellulolyticum is attached to the substrate
(Gelhaye et al 1993) but in the batch cultures of C cellulolyticum at high cellulose
concentrations cell growth terminates before substrate depletion (Desvaux et al 2000)
78
Furthermore it has been shown that re-inoculating a fresh culture of C cellulolyticum when
substrate is not fully consumed significantly improved the cellulose solubilisation and cell
biomass yield This result indicates that the incomplete metabolism is not due to either the
limitation of adhesion sites on cellulose fibers or product inhibition At high cellulose
concentrations the likely explanation for the incomplete cellulose consumption is that the lack
of control on carbon uptake flow and an imbalanced metabolism leads to the accumulation of
intracellular metabolites and self-intoxication of the cells (Desvaux et al 2000 Desvaux
2005b)
Previous studies suggest that the cellobiose metabolic capacity is a limiting factor in the
cellobiose metabolism by C cellulolyticum since it is not able to metabolize high
concentrations of cellobiose as the cells may not be able to efficiently control the cellobiose
uptake (Guedon et al 1999a) The co-culture study of the C cellulolyticum and C
acetobutylicum has shown improved cellulose fermentation and the co-culture has been able to
degrade entirely a high amount of cellulose at a higher rate compared to the monoculture of C
cellulolyticum Hence it can be hypothesized that cellobiose uptake by C acetobutylicum
improves the cellulose degradation process and C acetobutylicum can contribute in cellulose
hydrolysis by preventing the cellobiose overflow which is the major product of the cellulose
hydrolysis and the associated inhibitory effect on C cellulolyticum Therefore it is crucial to
know how the products of cellulose hydrolysis cellobiose and glucose (Giallo et al 1985)
impact the cellulosome activity and cellulose metabolism by the co-culture
Previous reports have shown that the cellulosome of Clostridium thermocellum is strongly
inhibited by cellobiose while glucose has an insignificant inhibitory effect Furthermore
adding β-glucosidase which hydrolyses cellobiose to the C thermocellum culture has been
shown to increase cellulose degradation rate and remove the adverse effects of cellobiose
inhibition by hydrolyzing it to glucose Cellobiose inhibits the function of C thermocellum
cellulosome through a competitive inhibitory mechanism (Kruus et al 1995) So far the
cellobiose inhibitory effect on the Cel5A an endogluconase component of the Ccellulolyticum
cellulosome has been established (Fierobe et al 1991) Furthermore it has been shown that
glucose has a significant derepressing effect on the production of the cellulosome in C
cellulolyticum and in contrast to cellobiose it does not have any inhibitory effect on its
catalytic activity (Petitdemange et al 1992) C acetobutylicum has extracellular
79
endogluconase and cellobiase activities during its growth on cellobiose (Lee et al 1985)
therefore improving the cellobiase activity and expression in C acetobutylicum which leads to
the hydrolysis of cellobiose to glucose and thus reducing the cellobiose inhibitory effect on
the cellulosome activity can improve the cellulose degradation rate in this co-culture
4421 Analysis of the co-culture for butanol production
Further interaction in this co-culture is related to the pyruvate metabolism C cellulolyticum
typically secrets pyruvate as a result of its metabolic imbalance which can be metabolized by
C acetobutylicum in this co-culture C cellulolyticum secretes pyruvate as the result of a
limited pyruvate consumption rate and a comparatively higher carbon catabolism rate (Guedon
et al 1999a) while intracellular pyruvate accumulation could be the explanation for the
growth arrest at high cellulose concentrations (Guedon et al 2002) Also it has been shown
that providing C acetobutylicum with pyruvate as the sole carbon source results in the growth
and production of mainly acetate and butyrate (Janati-Idrissi et al 1989) The major products
of pyruvate fermentation by C acetobutylicum are acetate butyrate and butanol and neither
acetate nor butyrate is re-utilized
The effects of pyruvate on glucose fermentation by C acetobutylicum have also been
investigated before and it is shown that both substrates can be fermented simultaneously
(Junelles et al 1987) Therefore a potential strategy for improving cellobiose metabolic
capacity is through the redirection of the cellobiose toward secreted pyruvate which can be
later metabolized by C acetobutylicum In the study of co-culture fermentation of cellulose
(Petitdemange et al 1983) high level of acids and low titer butanol have been reported This
observation can be explained by secretion of pyruvate by C cellulolyticum which affects the
C acetobutylicum metabolism and reduces the solvent formation although the pyruvate
formation in the co-culture was not measured Moreover it has been shown that addition of
pyruvate to the glucose culture under pH-controlled condition represses the solventogenic
pathways in C acetobutylicum (Junelles et al 1987) So based on this information additional
physiological and genetic manipulations are required to enhance the biobutanol production
from cellulose by the co-culture
Figure 4-6 depicts the model-predicted cellulose hydrolysis profiles in the co-culture and these
profiles have been compared to the simulated mono-culture profiles at various extents of
80
cellobiose inhibition on cellulose hydrolysis rate At a high cellulose concentration of 20 gL
dFBA is not able to capture the C cellulolyticum growth arrest however qualitative
comparison of these two hypothetical profiles shows that even at the Ki value of 2 mM the
cellobiose removal by C acetobutylicum does not improve the rate of cellulose degradation in
the co-culture so this result implies that cellobiose inhibition removal by C acetobutylicum is
not the main factor that improves cellulose degradation in the co-culture The model prediction
suggests that the concentration of cellobiose in the mono-culture is mostly less than 1 mM
which cannot significantly slow down the cellulose hydrolysis through the assumed
competitive inhibition mechanism and this Ki value of 2 mM is still too high for any significant
inhibition due to cellobiose Also the experimental profiles of cellobiose and glucose
concentrations have not been reported and it is possible that a higher level of cellobiose
accumulation takes place in the batch culture at this high cellulose concentration (Desvaux et
al 2000) In addition we have assumed a competitive inhibition mechanism for the modeling
of cellobiose inhibitory effect on C cellulolyticum and it is possible that a different inhibitory
mechanism affects the cellulosome activity Hence these simulations highlight the importance
of the C cellulolyticum cellulosome characterization Further studies should investigate the
underlying mechanism associated with the growth arrest phenomenon in C cellulolyticum at
high cellulose concentration
81
Figure 4-6 The kinetic profiles of the co-culture metabolism on cellulose as predicted using DMMM
framework C cellulolyticum biomass concentration in the co-culture and mono-culture C acetobutylicum
(ATCC824) biomass concentration in the co-culture cellulose hydrolysis profile in the co-culture and
mono-culture and cellobiose accumulation profiles in the co-culture and mono-culture under various
cellobiose inhibition extents at initial cellulose concentration of 20 gL
45 Concluding remarks
Metabolic models have been used in the past to characterize C acetobutylicum metabolism
however flux balance analysis cannot predict the complex metabolism of C acetobutylicum
properly and additional constraints are required to narrow down the solution space Previously
the specific proton flux state (Senger and Papoutsakis 2008b) was developed for this purpose
On the other hand incorporating the regulatory network in the genome-scale model seems to be
necessary to describe the metabolic shift from acidogenic to solventogenic phase (Covert et al
2001b) In this work we present the first genome-scale model of C cellulolyticum metabolism
that has been validated against the experimental data and is able to predict the metabolism of
C cellulolyticum on cellulose and cellobiose
Furthermore this model of C cellulolyticum metabolism has been integrated with a C
acetobutylicum model to develop a genome-scale model of the clostridial co-culture
metabolism The results of our simulations suggest that 1) removal of cellobiose inhibition is
82
not the main factor responsible for improved cellulose utilization in the co-culture and 2) C
cellulolyticum is primarily adapted to low carbon flow and availability (Guedon et al 1999a)
These results also motivate the need for metabolic engineering strategies to enable C
cellulolyticum to handle high carbon flows The inability of C cellulolyticum to metabolize
high concentrations of cellobiose (Guedon et al 1999a) is a significant barrier to the
development of commercial CBP process using clostridia In order to overcome this limitation
there is a need to improve the cellobiose uptake capacity of C cellulolyticum assuming that
the cellulosome function is not the limiting step (Desvaux 2005b) Genome-scale models of C
cellulolyticum and co-culture modeling framework as presented here will be valuable for
further optimization of this co-culture for improved cellulose degradation and biobutanol
production This metabolic model of the co-culture can also be easily extended to incorporate
hemicellulose metabolism for growth on more complex cellulosic substrates
46 Nomenclature for chapter 4
μi Specific growth rate of organism i (hr
-1)
Xi Cell biomass concentration of organism i (gDW l
-1)
Cj Metabolite concentration of metabolite j (mmol)
CGcell cellulose concentration (mmol)
Ccellb cellobiose concentration (mmol)
Cglc glucose concentration (mmol)
Cpyr pyruvate concentration (mmol)
Cac acetate concentration (mmol)
Clac lactate concentration (mmol)
vmax Maximum specific uptake rate of cellulose (mmolgDWhr)
i
jV Specific uptake or secretion rate of metabolite j by the organism i
(mmolgDWhr)
Vi Vector of reaction fluxes of organism i (mmolgDWhr)
Vcellulase cellulose hydrolysis rate (mmolgDWhr)
83
ci FBA objective vector of the ith
organism
Si The stoichiometric matrix of organism i
Sij The sub-set of stoichiometric matrix of organism i corresponding
to metabolite j
ki cellobiose inhibition constant
km Michaelis-Menten constant
Ratebutuptake Rate of butyrate uptake by C acetobutylicum
Rateacuptake Rate of acetate uptake by C acetobutylicum
ubi
vector of upper-bound capacity constraints on the fluxes of
organism i
lbi vector of lower- bound capacity constraints on the fluxes of
organism i
84
Chapter 5 Characterizing Metabolic Interactions in the Clostridial Co-culture
This chapter includes the material published as a research paper in BMC Biotechnology
journal
Salimi F Mahadevan R Characterizing Metabolic Interactions in a Clostridial Co-culture for
Consolidated Bioprocessing BMC Biotechnology 1395
Affiliations Department of Chemical Engineering and Applied Chemistry University of
Toronto
Contributions FS conceived of the study designed and conducted the experiments and
drafted the manuscript RM conceived of the study and helped to draft the manuscript
The supplementary experiments and information to this chapter are presented in Appendix D
including the qPCR assay development examination of the specificity of the interactions
between C cellulolyticum and C acetobutylicum in the co-culture identifying potential
exchanged metabolites in the co-culture assessment of C cellulolyticum growth on the
supernatant of C acetobutylicum culture and experimental characterization of C
acetobutylicum metabolic activity under co-culture conditions
51 Abstract
Background Clostridial co-culture containing cellulolytic and solventogenic species is a
potential consolidated bioprocessing (CBP) approach for producing biochemicals and biofuels
from cellulosic biomass It has been demonstrated that the rate of cellulose utilization in the co-
culture of Clostridium acetobutylicum and Clostridium cellulolyticum is improved compared to
the mono-culture of C cellulolyticum (Petitdemange et al 1983) However the metabolic
interactions in this co-culture are not well understood To investigate the metabolic interactions
in this co-culture we dynamically characterized the physiology and microbial composition
using qPCR
Results The qPCR data suggested a higher growth rate of C cellulolyticum in the co-culture
compared to its mono-culture Our results also showed that in contrast to the mono-culture of
C cellulolyticum which did not show any cellulolytic activity under conditions similar to those
85
of co-culture the co-culture did show cellulolytic activity even superior to the C cellulolyticum
mono-culture at its optimal pH of 72 Moreover experiments indicated that the co-culture
cellulolytic activity depends on the concentration of C acetobutylicum in the co-culture as no
cellulolytic activity was observed at low concentration of C acetobutylicum and thus
confirming the essential role of C acetobutylicum in improving C cellulolyticum growth in the
co-culture Furthermore a butanol concentration of 350 mgL was detected in the co-culture
batch experiments
Conclusion These results suggest the presence of synergism between these two species while
C acetobutylicum metabolic activity significantly improves the cellulolytic activity in the co-
culture and allows C cellulolyticum to survive under suboptimal co-culture conditions which
do not allow C cellulolyticum to grow and metabolize cellulose independently It is likely that
C acetobutylicum improves the cellulolytic activity of C cellulolyticum in the co-culture
through exchange of metabolites such as pyruvate enabling it to grow and metabolize cellulose
under suboptimal co-culture conditions
52 Background
In consolidated bioprocessing (CBP) all four biological steps involved in the conversion of
cellulosic biomass which includes production of saccharolytic enzymes hydrolysis of the
polysaccharides present in pre-treated biomass and fermentation of hexose and pentose sugars
present in the hydrolyzate to desired products takes place in one bioreactor using a single
microorganism or a microbial consortium without the external addition of saccharolytic
enzymes (Lynd et al 2002) Consolidated bioprocessing has been proposed to decrease the
production cost by eliminating the costs associated with the cellulase production stage CBP
requires microorganisms with both rapid conversion of cellulose and high product yield
productivities and titers while such microbes have not been identified in nature yet and need to
be developed (Lynd et al 2005 Lynd et al 2008 Olson et al 2012 Hasunuma et al 2013)
To realize this aim two strategies have been applied the native strategy which improves the
product formation capabilities such as yield and titer in natural cellulolytic microorganisms (Li
et al 2012 Shaw et al 2008 Argyros et al 2011 Yang et al 2009 Svetlitchnyi et al 2013
Higashide et al 2011) and the recombinant strategy that involves engineering non-cellulolytic
86
organisms with high product yields so that they will express heterologous cellulase and be able
to utilize cellulose (Lynd et al 2002 Hasunuma and Kondo 2012 Hasunuma et al 2013)
An alternative method for the production of biobutanol and biochemicals from cellulosic
biomass in a consolidated bioprocessing approach is the use of mesophilic clostridial co-
culture Clostridium acetobutylicum shows an effective capability to ferment cellulose derived
sugars as well as hemicellulose derived sugars such as cellobiose mannose arabinose xylose
glucose and galactose to acetone butanol and ethanol (Yu et al 1984 Fond et al 1986 Ali
et al 2004 Lee et al 2012) Thus the co-culture of this bacterial species with a mesophilic
cellulose degrading bacterium can be an efficient approach Clostridium cellulolyticum is a
cellulolytic mesophilic bacterium which is able to solublize crystalline cellulose in pretreated
hardwood (Demain et al 2005) A simplified scheme of this clostridial co-culture fermentation
on cellulose is presented in Figure 5-1 C cellulolyticum synthesizes cellulosome which is an
extracellular multi-enzymatic complex and degrades cellulose with the use of this
cellulosome to glucose and soluble cellodextrins (mainly cellobiose) which can be fermented
by both species in the co-culture
Figure 5-1 The scheme of the clostridial co-culture fermentation on cellulose C cellulolyticum adheres to
the cellulose fibers using a cellulosome and hydrolyzes cellulose to cellobiose (cellb) and glucose (glc) which
can be metabolized by C cellulolyticum and C acetobutylicum in the co-culture The produced pyruvate
(pyr) can also be fermented as a carbon source by C acetobutylicum
87
The co-culture of C cellulolyticum with C acetobutylicum has been studied previously and it
has been shown that cellulolytic activity is the limiting factor in the co-culture fermentation
since most of the cellulase activity products are consumed by C acetobutylicum The
fermentation products have been mainly butyric acid along with butanol acetic acid and
ethanol and the lack of glucose which is required for solvent production due to low
cellulolytic activity was hypothesized to be the reason for acid accumulation (Jones and
Woods 1986 Petitdemange et al 1983) Furthermore three times more cellulosic material
was degraded in the co-culture compared to the mono-culture of C cellulolyticum due to the
utilization of cellulase activity products and the elimination of their repressive effects (Mitchell
et al 1995) suggesting the presence of synergism between these two species The analysis of
this effect can be valuable for optimizing the rate of cellulosic material degradation
Therefore in this study we investigated metabolic interactions in this co-culture by developing
a comparative qPCR analysis of the co-culture and mono-cultures of C cellulolyticum and C
acetobutylicum Investigation of the metabolism in this clostridial co-culture along with the
mono-cultures revealed that significant increase in the rate of cellulose hydrolysis can be
achieved using the co-culture and making use of the synergism existing between the two
clostridial species It is likely that C acetobutylicum improves the cellulolytic activity of C
cellulolyticum in the co-culture through exchange of metabolites such as pyruvate enabling it
to grow and metabolize cellulose under suboptimal co-culture conditions This clostridial co-
culture can offer a considerable potential CBP approach for producing commodity chemicals
from cellulosic biomass taking advantage of C acetobutylicum metabolic potential in
converting sugars to variety of chemicals
53 Methods
531 Strains and media
C acetobutylicum ATCC 824 was grown in clostridial growth medium (CGM) containing per
litre 075 g of KH2PO4 075 g of K2HPO4 1 g of NaCl 001 g of MnSO4 0004 g of p-
aminobenzoic acid 0348 g of MgSO4 001 g of FeSO4 2 g of asparagine 5 g of yeast extract
2 g of (NH4)2SO4 and 50 g of glucose (pH 58) C cellulolyticum ATCC 35317 was maintained
and cultivated on a modified CM3 medium containing per litre KH2PO4 15 g K2HPO4 29 g
(NH4)2SO4 13 g MgC126H2O 1 g CaC12 015g FeSO4 125 mg resazurin 1 mg
88
cysteine hydrochloride 1 g fibrous cellulose (medium Sigma-Aldrich C6288) 75 g and 2 g
of yeast extract (pH 72)
The co-culture medium was composed of 075 g of KH2PO4 1 g of MgC126H2O 015 g of
CaC12 1 mg of resazurin 1 g of cysteine hydrochloride 001 g of MnSO4 0004 g of p-
aminobenzoic acid 10 mg of (NH4)2Mo7O24 001 g of FeSO4 2 g of asparagine 3 g of yeast
extract 1 g of (NH4)2SO4 and 20 g of fibrous cellulose per litre of medium All pre-cultures
were incubated at 37˚C without shaking in serum bottles to reach the total protein concentration
of 15 to 20 mgL (Bio-Rad Protein Assay 500-0006)
532 Co-culture experiments
The co-culture experimental set-up is depicted in Figure 5-2 All batch cultivations were
conducted in 5 L bioreactors with a working volume of 2 L at 37˚C where agitation was set at
200 rpm and the volume of C cellulolyticum inoculum at exponential growth phase formed
10 of the total volume The C cellulolyticum pre-cultures were transferred twice on the co-
culture medium with 75 gl of cellulose before inoculation into bioreactors where the cell
biomass concentration in the bioreactor inocula was between 6times108 and 8times10
8 cellsmL For
the co-culture batches C cellulolyticum was first cultivated for 48 hours at pH 70 then 200
mL of C acetobutylicum culture at exponential phase was centrifuged and the cell pellets were
suspended in 20 mL of CGM medium and inoculated into the bioreactor The pH then was
adjusted and maintained at 60 using 1N H2SO4 and 3N NaOH The bioreactors were kept
under anaerobic conditions by continuous sparging of nitrogen gas The same pH adjustment
and medium were applied for the C cellulolyticum mono-culture batch unless for the mono-
culture batch at pH 72 that was conducted on CM3 medium with no pH profile
89
Figure 5-2 The co-culture experimental set-up C cellulolyticum was cultivated at the initial pH of 70 for
two days and pH was adjusted to 60 after inoculating C acetobutylicum into the co-culture at 48 hr
533 Analysis
Concentrations of sugars organic acids and alcohols were measured using a Dionex Ultimate
3000 HPLC (Bio-Rad Hercules CA) equipped with a UV monitor (210 nm) and a Shodex RI-
101 differential refractive index detector The products were separated using a Bio-Rad HPX-
87H cation-exchange column where 10 mM H2SO4 was used as the mobile phase (06 mLmin
flow rate 60˚C column temperature 20 microL injection volume) To account for the extracellular
proteins amino acids and amino compounds in cell cultures (Guedon et al 1999b) and to
estimate the overall carbon recovery total organic carbon (TOC) concentrations of the sample
supernatants were quantified using Total Organic Carbon Analyzer (TOC-VCPHCPV Shimadzu
Japan) with the lower detection limit of 05 mgL using standard TOC catalyst Cellulose
concentration was measured using Updegraff method (Updegraff 1969) Cellulose pellets were
washed using acetic acid-nitric acid reagent and water to remove the non-cellulosic material
cellulose then was quantified using anthron in a colorimetric method The results of cellulose
assay and TOC measurements showed that 24plusmn4 (based on 7 data points) of the total carbon
was used for CO2 formation which was consistent with our previous model prediction (Salimi
et al 2010)
90
To measure protein 05 ml of cell culture was centrifuged at 8000 g for 2 min and washed
with 09 (wtvol) NaCl The pellet was resuspended in 05 ml of 02 N NaOH and this
suspension was placed in a boiling water bath for 10 min After cooling the hydrolyzed sample
was centrifuged as described above and the total solubilized protein concentration in
supernatants was measured using Bio-Rad Protein Assay (500-0006) Quantification of the
population of each species in the co-culture was conducted using quantitative PCR (qPCR)
method which includes DNA extraction PCR amplification of 16S rRNA gene and detection
using fluorescent dyes and is elaborated in following sections Total cell quantifications of C
acetobutylicum were also conducted using hemacytometry method
5331 Primer design and qPCR standard plasmid DNA preparation
The qPCR primers were designed to target the 16S rRNA genes in C acetobutylicum
(CA_Cr001) and C cellulolyticum (Ccel_R0007) as reported in Table 5-1 The qPCR standard
plasmid solutions for each target species were prepared by cloning the purified PCR products
into pCRreg
21-TOPOreg
vector using TOPO-TA Cloningreg
kit (Invitrogentrade K4500-01) In the
first step fresh PCR products were purified using GeneJET PCR Purification Kit (Fermentas
K0701K0702) the nucleic acid concentrations in purified PCR products were measured to be
67 and 50 ngmicrol for C acetobutylicum and C cellulolyticum respectively using NanoDrop
1000 (Thermo Scientific) spectrophotometer and PCR products purity were verified using
agarose gel electrophoresis Plasmid extraction from the positive clones was conducted using
GenElute Plasmid Miniprep kit (Sigma-Aldrich USA) All of the extracted plasmids were
sequenced at the University of Toronto Sanger Sequencing Facility and the plasmids with right
inserts were selected and applied for qPCR calibrations
Table 5-1 Primer sequences used for qPCR analysis
Primer name Target species Primer sequence (5-3) Product length Tm
CA2 (forward) C acetobutylicum CTTGTTGGTGAGGTAACGG 386 bp 60degC
CA2 (reverse) C acetobutylicum CACTCCAGACATCCAGTTTG
CC2 (forward) C cellulolyticum TACAGGGGGATAACACAGG 348 bp 60degC
CC2 (reverse) C cellulolyticum CGTGGCTTATTCTTCAGGTAC
91
There are eleven 16S rRNA genes in C acetobutylicum genome (CA_Cr001 CA_Cr004
CA_Cr007 CA_Cr010 CA_Cr013 CA_Cr016 CA_Cr019 CA_Cr022 CA_Cr025
CA_Cr028 CA_Cr033) and eight 16S rRNA genes in C cellulolyticum genome (Ccel_R0007
Ccel_R0018 Ccel_R0088 Ccel_R0084 Ccel_R0059 Ccel_R0012 Ccel_R0024
Ccel_R0036) Multiple sequence alignment of the 16S rRNA genes for each species using
ClustalW2 (ClustalW2) showed identical amplification regions for each set of 16S rRNA
genes therefore 8 amplicons with the same size are being produced per copy of C
cellulolyticum genome in a qPCR reaction and 11 amplicons with the same size are being
produced per copy of C acetobutylicum genome in a qPCR reaction these facts also were
verified by observing single peaks in melting curve analysis as well as single DNA bands for
each species in agarose gel electrophoresis runs and must be considered in qPCR
quantifications of each species Therefore to calculate the concentration of cells (cellmL) in
cultures using qPCR data of the 16S rRNA gene quantifications (copiesmicroL) the number of 16S
rRNA genes in the genome (n16s) the volume of the culture from which genomic DNA was
extracted (Vc) and the volume of extracted DNA (400 microL) were taken into account as below
Concentration (cellmL) = concentration (copiesmicroL) times 400 microL times dilution factor (Vc times n16s)
The value for n16s was equal to 11 for C acetobutylicum and equal to 8 for C cellulolyticum
cell quantifications
For each qPCR run a new standard curve was made using fresh dilutions where the standard
curve concentrations of 108
copiesmicroL to 101
copiesmicroL were prepared by making serial 110
dilutions starting with the 109
copiesmicroL plasmid solution More details about the qPCR method
development are presented in Appendix D
5332 Genomic DNA isolation
Initially the Mo Bio Laboratories UltraCleanreg
Soil DNA Isolation Kit was applied to extract
DNA from the samples However it was demonstrated that there was no correlation between
culture size and the DNA yield using this kit for co-culture samples as the same amount of
DNA was extracted from 02 1 2 and 5 mL of cultures in fact this kit has been aimed for soil
samples where the concentrations of cell biomass is typically low and therefore there was a
chance to miss significant amount of DNA in the co-culture samples Consequently DNA
92
isolation using Norgen bacterial genomic DNA isolation kit (Norgen 17900) was tested
(Appendix Figure A5) It was found that there was a correlation between the sample size (in the
range of 02 to 05 mL) and DNA yield using Norgen kit while it had a higher DNA yield
compared to the Mo Bio kit Therefore the Norgen kit was chosen for DNA isolations culture
samples (05 mL) were centrifuged at 13000 g for 2 minutes and the cell pellets were used for
DNA isolations following the standard kit protocol where 400 microL elution buffer was used
lastly to elute DNA in two steps (200 microL for each dilution step)
5333 qPCR reaction preparation detection and quantification
The qPCR amplification was performed using 2 μL of tenfold diluted sample genomic DNA
and 18 μL of a master mix in a total reaction volume of 20 μL A master mix was prepared for
each qPCR run whereby the reagents for the individual reactions were combined prior to plate
preparation in order to minimize errors Master mixes were prepared by combining 10 μL of
SsoFasttrade EvaGreenreg Supermix (Bio-Rad 172-5200) 1 μL of each primer with final
concentration of 025 μM and 6 μL of water for each reaction and 2 microL of DNA solution was
added to each reaction in a 20 microL reaction volume
The qPCR amplifications and detections were carried out in a CFX96trade Real-Time PCR
Detection System (Bio-Rad Laboratories Inc) The qPCR program had the following protocol
1) initial denaturation at 98 degC for 3 min 2) 40 cycles of denaturation at 98 degC for 5 sec 3)
annealing and extension at 60˚C for 10 sec followed by a plate read afterward a melting curve
analysis from 65 to 95 ˚C measuring fluorescence every 05 ˚C For all qPCR runs the qPCR
signals were analyzed at a standard pre-determined threshold of 1E+03 RFU which was in the
exponential amplification phase and above the background fluorescence noise for all the qPCR
runs The quantification cycles (Cq or CT) the cycle number where fluorescence increases
above the threshold were used to find the DNA copy numbers (automatically calculated from
the standard curve) To examine the quality of qPCR assays standard curve with coefficient of
determination (R2) gt 0980 high amplification efficiency (90ndash110) and consistency across
replicate reactions were considered
93
54 Results and discussion
541 Experimental characterization of C cellulolyticum
cellulolytic activity at high cellulose concentration addressing the
pH effect
In the previous co-culture study (Petitdemange et al 1983) the pH effect on C cellulolyticum
growth and cellulolytic activity has not been addressed Therefore to investigate the pH effect
on C cellulolyticum growth and cellulolytic activity in a mono-culture at high cellulose
concentration of 20 gL two batch cultures of C cellulolyticum were conducted one batch at
pH of 72 which is an optimal pH for C cellulolyticum growth and cellulolytic activity
(Desvaux et al 2001a) and another batch with the same pH profile as the co-culture run ie
initially at pH of 70 for 2 days followed by a pH switch to 60 The profiles of cellulose
solubilization and cell biomass concentration are shown in Figure 5-3 In the mono-culture at
pH of 72 TOC data showed that 15 gL of carbon was solubilized after 14 days which is
equivalent to 49 gL of cellulose degraded assuming 24 of carbon flow goes towards CO2
formation this amount of degraded cellulose was comparable to 51 gL reported for the C
cellulolyticum mono-culture at the same initial cellulose concentration (Desvaux et al 2000
Petitdemange et al 1983) Also qPCR data showed that cells reached a stationary growth
phase after 9 days with a maximum cell density of 5times 109 cellmL and a specific growth rate of
123 day-1
In contrast the mono-culture run under co-culture pH profile did not show any cellulose
solubilization during the batch (Figure 5-3) and cells had a very low growth rate of 016 day-1
(87 decrease) compared to the mono-culture batch at pH of 72 The effect of pH on C
cellulolyticum growth and cellulolytic activity at low cellulose concentration of 37 gL has
been addressed previously (Desvaux et al 2001a) and it has been shown that C cellulolyticum
is significantly affected by acidic pH where a pH drop from 70 to 64 leads to 75 lower cell
biomass concentration It has been suggested that acidic pH hampers cell biomass formation
likely through direct effect of pH on a cellular constituent such as an enzyme or a transport
protein rather than cellulose degradation capability in C cellulolyticum This argument is
supported by the observation that the flux through cellulose degradation reaction remains
94
almost unvarying in the range of 169 to 184 mmol (g cell h)-1
while pH varies between 64
to 70 (Desvaux et al 2001a) However regardless of the mechanism of inhibition this pH
effect must be considered when comparing cellulolytic activity and C cellulolyticum growth
and metabolism in the mono-culture and co-culture
0
04
08
12
16
2
10E+04
10E+05
10E+06
10E+07
10E+08
10E+09
10E+10
0 5 10 15 20 25
So
lub
iliz
ed
ca
rbo
n (
TO
C)
(gL
)
Time (day)
Bio
ma
ss
co
nc (c
ell
ml)
CC mono-culture under pH profile CC mono-culture at pH 72TOC mono-culture under pH profile TOC mono-culture at pH 72
Figure 5-3 The total solubilized carbon and cell biomass profiles in the C cellulolyticum mono-culture
experiments The cell biomass profile in the mono-culture at pH of 72 (circle) TOC profile in the mono-
culture at pH of 72 (triangle) cell biomass profile in the mono-culture under the co-culture pH profile
(rhombus) and TOC profile in the mono-culture under the co-culture pH profile (square) The co-culture
pH profile includes the initial pH of 70 for two days and pH adjustment to 60 at 48 hr Cell biomass
concentrations were calculated from qPCR data taking into account that there are eight 16S rRNA genes in
C cellulolyticum genome
542 Experimental characterization of the co-culture metabolism
To prepare the co-culture medium for the first co-culture experiment A all media components
including the iron solution were autoclaved The profile of cellulose degradation in this co-
culture is shown in Figure 5-4a At an initial cellulose concentration of 20 gL which is
equivalent to 608 gL of final TOC concentration assuming full degradation of cellulose and
considering 24 of the total carbon would be used toward CO2 formation 82 of cellulose
was degraded after 28 days in the co-culture experiment A Compared to the mono-culture at
the optimal pH of 72 cellulose degradation showed 82 improvement as shown in Figure 5-5
whereas no cellulose degradation was observed in the mono-culture run under co-culture pH
profile These results confirm that C acetobutylicum metabolic activity significantly improves
the cellulolytic activity in the co-culture and in fact makes it possible for C cellulolyticum to
95
0
1
2
3
4
5
6
10E+04
10E+05
10E+06
10E+07
10E+08
10E+09
10E+10
0 4 8 12 16 20 24 28
So
lub
iliz
ed
ca
rbo
n(T
OC
) g
L
Bio
ma
ss
co
nc
(c
ellm
l)
Time (day)
a
CA CC TOC TOC CC mono-culture under pH profile
0
05
1
15
2
25
3
35
4
10E+04
10E+05
10E+06
10E+07
10E+08
10E+09
10E+10
0 4 8 12 16 20 24 28
So
lub
iliz
ed
ca
rbo
n(T
OC
) g
L
Bio
ma
ss
co
nc
(c
ellm
l)
Time (day)
bCA CC TOC TOCCC mono-culture under pH profile
Figure 5-4 The cellulose solubilization in the co-culture and mono-culture experiments The profiles of
cellulose degradation and cell biomass formations in the co-culture experiment A with autoclaved iron
solution (a) and in the co-culture experiment B with filter sterilized iron solution (b) The time profiles of C
cellulolyticum (circle) C acetobutylicum (square) and cellulose solubilization in terms of total organic
carbon in each co-culture (triangle) at initial cellulose concentration of 20 gL and under pH profile along
with cellulose solubilization in terms of total organic carbon in C cellulolyticum mono-culture under the
same co-culture conditions (rhombus) The co-culture pH profile includes the initial pH of 70 for two days
and pH adjustment to 60 at 48 hr as shown by arrows Figures (a) and (b) each show one data set
representative of two independent experiments with both showing comparable results Cell biomass
concentrations were calculated from qPCR data taking into account that there are eleven 16S rRNA genes
in C acetobutylicum genome and eight 16S rRNA genes in C cellulolyticum genome
96
survive under suboptimal co-culture conditions which do not allow it to grow and metabolize
cellulose independently Furthermore to check and ensure iron sufficiency in the co-culture
medium the co-culture medium was prepared by filter sterilizing the ferrous sulphate solution
(experiment B) rather than autoclaving as for co-culture experiment A to avoid potential iron
oxidation during medium preparation The results of this experiment are shown in Figure 5-4b
while the cellulolytic activity was high in the co-culture experiment B and C cellulolyticum
growth rate was still as high as experiment A but cellulose degradation declined by 38
compared to experiment A as presented in Figure 5-5 Cellulose degradation in each batch was
estimated from carbon balance and TOC measurements taking into account that 24 of the
total carbon has been utilized for CO2 formation as described in the analysis section These
results confirmed that the co-culture was not under iron limiting condition and the presence of
more ferrous ions had an adverse effect on the co-culture cellulolytic activity
00
4
8
12
16
20
A B CC mono-culture at the optimal pH of 72
CC mono-culture under co-culture conditions
De
gra
de
d c
ellu
los
e (
gL
)
5 days after reaching maximum cell biomass
28 days
Figure 5-5 Degradation of cellulose in the co-culture experiments A and B the C cellulolyticum mono-
culture experiment at the optimal pH of 72 and the C cellulolyticum mono-culture experiment under the
co-culture pH profile 5 days after reaching the maximum C cellulolyticum concentration in the culture
(light grey) and after 28 days (dark grey) The co-culture pH profile includes the initial pH of 70 for two
days and pH adjustment to 60 at 48 hr Error bars show the ranges based on two sets of experimental data
The mechanism underlying such a synergy between the two clostridial species is not clearly
understood Hence in order to understand the nature of interactions between C acetobutylicum
and C cellulolyticum that improve cellulose solubilization we used qPCR to track the
population of each species in the batch cultures Figure 5-4a and Figure 5-4b show the dynamic
profiles of each species population in the co-culture batches C cellulolyticum cell biomass
concentration reached to 3times109
cellmL in the co-cultures which was the same value for
maximum cell biomass concentration in the mono-culture runs however the growth dynamics
was significantly faster in the co-cultures compared to the mono-culture run under the same pH
97
profile C cellulolyticum growth rate in the co-culture was comparable to its growth rate in
mono-culture under optimal pH condition of 72 Also it could be observed from all co-culture
TOC profiles that cellulose solubilization started after C cellulolyticum had reached its late
exponential growth phase
C acetobutylicum cell biomass profiles are also shown in Figure 5-4 where the initial decrease
in cell biomass concentration in the co-culture could be attributed to the lack of available
sugars for C acetobutylicum to grow while C cellulolyticum had been in the lag phase
Furthermore a considerable growth could be observed for C acetobutylicum when C
cellulolyticum had reached its maximum concentration in the co-culture where possibly more
sugars became available in the co-culture to support C acetobutylicum growth Although C
acetobutylicum cell biomass concentration showed significant increases at some points over the
course of co-culture it was fluctuating and did not remain constant It has been suggested that
in the microbial communities growing on cellulosic material where there is a competition
between cellulose-adherent cellulolytic microorganisms and non-adhered microbes for
cellulose hydrolysis products cellulose-adherent cellulolytic microorganisms are possibly
successful winners (Lynd et al 2005) and this phenomenon could explain the limited growth
of C acetobutylicum in the co-culture
C acetobutylicum shows cellobiase and endoglucanase activities during growth on cellobiose
glucose xylose and mannose but is not able to hydrolyze crystalline cellulose due to lack of
the required enzymatic activities (Lee et al 1985 Sabathe et al 2002 Kovacs et al 2013)
Sabathe et al have reported the production of a high molecular mass cellulosome in C
acetobutylicum (Sabathe et al 2002) Since C acetobutylicum is unable to grow on crystalline
cellulose as the sole carbon source C acetobutylicum has been cultivated on cellobiose (20
gL) as the main carbon source along with microcrystalline cellulose (10 gL) for the
adsorption of the cellulosomal protein components Proteins purified from the culture
supernatant as well as proteins eluted from cellulose have been tested for the cellulolytic
activity No cellulolytic activity on Avicel and very low levels of activity on carboxymethyl
cellulose (CMC) and phosphoric acid swollen cellulose (PASC) have been observed (Sabathe
et al 2002) Recently heterologous expression of three C thermocellum-derived cellulosome
components and the production of functional mini-cellulosomes in C acetobutylicum has been
reported (Kovacs et al 2013) Furthermore our experiments showed that C acetobutylicum
98
did not grow on fibrous cellulose under the co-culture conditions (Figure 5-7) Therefore the
improved cellulolytic activity in the co-culture cannot be attributed to C acetobutylicum
cellulolytic activity However C acetobutylicum is able to ferment cellobiose and cellulose-
derived sugars and the improved cellulolytic activity in co-culture can be attributed to the role
of C acetobutylicum in consuming sugars and preventing the carbon overflow toward C
cellulolyticum as C cellulolyticum is unable to metabolize high concentrations of cellobiose
(Guedon et al 1999a)
Also degree of synergism (DS) defined as the activity of a mixture of components divided by
the sum of the component activities evaluated separately (Lu et al 2006) in this co-culture can
be estimated as the ratio of C cellulolyticum growth rates in co-culture and mono-culture under
pH profile and was equal to 799 However the co-culture DS determined based on the
cellulolytic activities in the co-culture and the mono-culture would be substantially high which
indicates the presence of a strong synergism in this clostridial co-culture The DS value of 5 or
higher is not very common in enzyme-microbe cellulose hydrolysis systems and has been
observed under some conditions (Zhang and Lynd 2004 Hu et al 2011) Moreover in this co-
culture on fibrous cellulose observed maximum cellulose degradation rate of 0108 g(L h) is
comparable with a cellulose degradation rate of 015 g(L h) in C thermocellum culture on
crystalline cellulose which shows one of the highest cellulose utilization rates among
cellulolytic microorganisms (Lu et al 2006)
Since cellulolytic bacteria are unable to grow at low intracellular pH under acidic environment
the pH gradient (ΔpH) across the cell membrane is high consequently the intracellular
dissociation of fermentation acids which are membrane permeable in undissociated form and
the intracellular accumulation of acid anions lead to anion toxicity which is the likely reason of
growth inhibition under acidic condition (Russell and Wilson 1996 Flythe and Russell 2006)
Furthermore it has been shown that presence of lactate and acetate ions in an acidic medium
leads to a significant decline of glutamate synthesis in Clostridium sporogenes MD1 which
inhibits the bacterial growth (Flythe and Russell 2006) Also for E coli culture at pH 6
incubation of cells with 8 mM acetate for 20 min was shown to result in intracellular
accumulation of acetate anions (240 mM) and reduced level of intracellular glutamate pools
(Roe et al 1998) Furthermore in mildly acidic E coli cultures (pH of 6) inhibition of
methionine biosynthesis by acetate (8 mM) and the toxicity of accumulated homocysteine have
99
been indicated as the cause of growth inhibition by acetate under weak acid stress (Roe et al
2002) Addition of methionine to this culture can restore E coli growth rate to some significant
extent This effect has been also reported for other organic acids
In this clostridial co-culture the synergy could be attributed to the exchange of some growth
precursors and cell biomass constituents between C acetobutylicum and C cellulolyticum
which potentially enables the cellulolytic organism to grow and metabolize cellulose under
acidic pH condition C acetobutylicum is a fermentative bacterium which is able to grow well
under acidic conditions in acidogenic and solventogenic growth phases The results of co-
culture experiments under a low concentration of C acetobutylicum which are presented in the
following section also provide support for the role of C acetobutylicum
543 Experimental characterization of the co-culture metabolism
with low concentration of C acetobutylicum
To investigate if a high initial concentration of C acetobutylicum contributes to its low growth
in the co-culture and if C acetobutylicum growth in the co-culture is affected by the ratio of
cells to the cellulose hydrolysate a co-culture experiment was conducted with 1 of the initial
concentration of C acetobutylicum Two mL of C acetobutylicum culture at exponential
growth phase was centrifuged and the cell pellets were suspended in 2 mL of CGM medium
and incoculated into the bioreactor The results of this experiment are presented in Figure 5-6
where no cellulose degradation was observed in either biological replicates Also C
cellulolyticum as well as C acetobutylicum did not grow in the co-culture This experiment
confirmed that the role of C acetobutylicum in the metabolism of cellulose by the co-culture is
associated with the population of C acetobutylicum and can be attributed to the exchange of
some metabolites between the two species
Furthermore the metabolic behaviour of C acetobutylicum under the co-culture conditions was
investigated as discussed in the following section This study confirmed the metabolism of
pyruvate and the released sugars by C acetobutylicum in the clostridial co-culture and that the
observed oscillations in the C acetobutylicum concentration in the co-cultures could be due to
the slow release of sugars by C cellulolyticum that can lead to starvation cycles for C
acetobutylicum in the co-culture
100
000
030
060
090
120
10E+04
10E+05
10E+06
10E+07
10E+08
10E+09
0 4 8 12 16 20 24 28 32
So
lub
lilize
d c
arb
on
(T
OC
) (g
L )
Bio
ma
ss
Co
nc
(C
ellm
l)
Time (day)
CC CA TOC
Figure 5-6 The profiles of cellulose degradation and cell biomass formations in the co-culture experiment
with low concentration of C acetobutylicum The time profiles of C cellulolyticum (circle) C acetobutylicum
(square) and cellulose solubilization in terms of total organic carbon (triangle) in the co-culture experiment
The co-culture pH profile includes the initial pH of 70 for two days and pH adjustment to 60 at 48 hr The
figure shows one data set representative of two independent experiments with both showing comparable
results Cell biomass concentrations were calculated from qPCR data taking into account that there are
eleven 16S rRNA genes in C acetobutylicum genome and eight 16S rRNA genes in C cellulolyticum genome
544 Experimental characterization of C acetobutylicum metabolic
activity under co-culture conditions
To further investigate the metabolic behaviour and the role of C acetobutylicum in the
clostridial co-culture mono-culture batches of C acetobutylicum were conducted under the co-
culture conditions The results of these experiments are presented in Figure 5-7a and b In the
first mono-culture experiment (Figure 5-7a) C acetobutylicum was cultivated on the co-culture
medium with 20 gL cellulose and no glucose added to the culture The qPCR data as well as
the cell quantification of C acetobutylicum using hemacytometry showed a significant
reduction in the cell population over the course of the batch due to the lack of glucose and cell
starvation
In the second mono-culture batch (Figure 5-7b) after 12 days of cultivation and cell starvation
in the absence of glucose 1 gL of glucose was added to the culture As a result a drastic
increase in the cell biomass concentration was observed in the culture followed by a decline
due to cell starvation after consuming the entire added glucose in 24 hrs Furthermore to assess
101
C acetobutylicum growth and metabolism on pyruvate 1 gL of pyruvate was added to the
culture on day 19th
while the cells had been starving for previous 6 days and a 10-fold increase
in the cell biomass concentration was observed confirming metabolism of pyruvate by C
acetobutylicum However pyruvate was not consumed entirely (HPLC data showed that only
01 gL pyruvate had been consumed) and the main fermentation products were acetate and
butyrate Higher cell biomass concentrations obtained using qPCR method can be attributed to
the spore formation in C acetobutylicum cultures as both viable and non-viable spores in
addition to dead cells are quantified using qPCR (Rawsthorne et al 2009) in contrast to
hemacytometry Also the similar trends observed in the cell biomass profiles using both qPCR
and hemacytometry methods verified the appropriateness of the developed qPCR method
Moreover a cell biomass yield of 221 g cellmol glucose has been reported for C
acetobutylicum (Meyer and Papoutsakis 1989) Therefore the increase in the C
acetobutylicum cell concentration as a result of adding 1 gL glucose to the culture assuming
35 times109 cells per mg cell protein in the culture (Giallo et al 1985) can be calculated as
follows
Increase in the cell concentration = 35 times 109
(cellmg protein) times 06 (mg proteinmg cell) times
012 (mg cellmg glucose) = 25times108 cellmg glucose
This value is comparable to the increase in the C acetobutylicum concentration obtained from
the qPCR data (15times109 cellmg glucose) and the hemacytometry data (60times10
7 cellmg
glucose) in this C acetobutylicum culture (Figure 5-7b) Moreover this study confirmed the
metabolism of pyruvate and the released sugars by C acetobutylicum in the clostridial co-
culture and that the observed oscillations in the C acetobutylicum concentrations in the co-
culture experiments could be due to the slow release of sugars by C cellulolyticum which can
lead to starvation cycles for C acetobutylicum in the co-culture
102
100E+03
100E+04
100E+05
100E+06
100E+07
100E+08
100E+09
0 7 14 21 28
Bio
ma
ss
co
nc
(c
ellm
L)
Time (day)
a
hemacytometry qPCR
100E+03
100E+04
100E+05
100E+06
100E+07
100E+08
100E+09
0 7 14 21 28
Bio
ma
ss
co
nc
(c
ellm
L)
Time (day)
b hemacytometry qPCR
Figure 5-7 C acetobutylicum biomass profiles in the mono-cultures under co-culture conditions (a) C
acetobutylicum was cultivated on the co-culture medium at pH of 60 and 20 gL cellulose without
glucosepyruvate addition and characterized using qPCR (rhombus) and hemacytometry (square) (b) C
acetobutylicum culture on the co-culture medium at pH 60 and 20 gL cellulose 1 gL glucose was added at
day 12 and 1 gL pyruvate was added to the culture on day 19 as shown by arrows Cell biomass
concentrations were calculated from qPCR data taking into account that there are eleven 16S rRNA genes
in C acetobutylicum genome
Glucose added Pyruvate added
103
545 Analysis of product formation in the co-culture
Figure 5-8 shows the ranges for co-culture and mono-culture product concentrations after 28
days As it can be noted acetate ethanol lactate butyrate and butanol were the main products
of the fermentation in the co-culture Butyrate appeared after C acetobutylicum inoculation in
the co-culture but its concentration remained low Neither acetate nor butyrate uptake which
are the characteristics of the solventogenic phase in C acetobutylicum metabolism was
observed in this co-culture At high cellulose concentration C cellulolyticum produces lactate
as its main product along with acetate and ethanol (Desvaux et al 2000) The lactate uptake
observed in the co-culture batches coincided with butanol formation (Appendix Figure A7)
The lactate uptake can be related to C acetobutylicum metabolic activity as C acetobutylicum
ATCC824 has been shown to co-ferment lactate and glucose (Bahl et al 1986)
It has been previously shown (Desvaux et al 2000) that in pH controlled batch cultures of C
cellulolyticum on a defined medium the distribution of carbon flow depends on the initial
cellulose concentration For concentrations less than 67 gL of cellulose acetate ethanol CO2
and H2 were shown to be the main fermentation end products and more than 91 of cellulose
was observed to be degraded At higher cellulose concentrations from 67 gL up to 291 gL
carbon flow is redirected from ethanol and acetate towards lactate and extracellular pyruvate In
addition in batch cultures of C cellulolyticum on high cellulose concentration it has been
shown that the peak of pyruvate formation coincides with the start of lactate formation and this
pyruvate accumulation in the C cellulolyticum culture shows that the rate of cellulose
catabolism is higher than the rate of pyruvate consumption Also it has been suggested that the
cellulose hydrolysis depends on the concentration of C cellulolyticum which remains constant
at and above 67 gL of cellulose (Desvaux et al 2000)
104
00
10
20
30
40
50
60
lactate acetate butyrate ethanol butanol
Conc
entr
atio
n (g
l)
Product concentration ranges in co-culture set A after 28 days
mono-culture under pH profile
Figure 5-8 Product concentration ranges in the co-culture experiment A after 28 days (ranges have been
calculated based on two sets of experimental data) and the product concentrations in the C cellulolyticum
mono-culture batch under the co-culture pH profile after 28 days (asterisk)
Furthermore it has been shown that re-inoculating a fresh culture of C cellulolyticum at high
cellulose concentration of 291 gL where substrate is not fully consumed significantly
improves the cellulose solubilization and cell biomass yield compared to a classical batch
(Desvaux et al 2000) This result indicates that the incomplete cellulose catabolism is not due
to either the limitation of adhesion sites on cellulose fibers or product inhibition At high
cellulose concentrations the likely explanation for the incomplete cellulose consumption is the
lack of control on carbon uptake flow and an imbalanced metabolism leading to the
accumulation of intracellular metabolites and self-intoxication of the cells eventually resulting
in a growth arrest (Desvaux et al 2000 Desvaux 2005b) Similarly extracellular pyruvate
formation has been reported in C thermocellum cultures at high cellulose and cellobiose
concentrations which evidences the overflow metabolism (Levin et al 2006)
In our experiments the maximum concentration of C cellulolyticum in co-culture experiments
was the same as the mono-culture experiment under optimal pH of 72 however the cellulose
degradation was improved up to 82 (Figure 5-5) which confirms the role of C
acetobutylicum in cellulose degradation while C cellulolyticum has reached the stationary
growth phase We observed pyruvate accumulation of 0029 gL in the mono-culture batch
under the co-culture pH profile and 0004 gL in the mono-culture batch at pH of 72 In the co-
culture replicates maximum pyruvate concentration of 017 gL was observed which was
105
taken up later during the course of experiments coinciding with butyrate formation in the co-
cultures Our previous modeling studies have suggested that limited pyruvate-ferredoxin
oxidoreductase (PFO) activity which cannot support high pyruvate flow results in pyruvate
overflow (Guedon et al 1999b) Hence a potential explanation for pyruvate secretion in C
cellulolyticum cultures is the limitation on the pyruvate consumption rate and a comparatively
higher carbon catabolism rate and due to inefficient regulation of entering carbon flow
(Guedon et al 1999a) Furthermore intracellular pyruvate accumulation could be the
explanation for the growth arrest at high cellulose concentrations (Guedon et al 2002) at
which cells switch to stationary growth phase before substrate depletion
Pyruvate uptake in the co-culture can be explained by the capability of C acetobutylicum to
metabolize pyruvate It has been also reported that providing C acetobutylicum with pyruvate
as the sole carbon source results in the growth and production of mainly acetate and butyrate
(Janati-Idrissi et al 1989) In another co-culture study the removal of C cellulolyticum
metabolic products such as pyruvate and their associated inhibitory effects by
Rhodopseudomonas palustris in the co-culture of C cellulolyticum and R palustris has been
reported as the underlying reason for the improved cellulose degradation and bacterial growth
in this co-culture (Jiao et al 2012) C cellulolyticum growth on cellulose has been shown to be
severely inhibited by pyruvate where about a 60 decrease in the cell biomass concentration
in the presence of 2 mM (176 mgL) pyruvate has been observed in C cellulolyticum mono-
culture at initial pH of 72 (Jiao et al 2012) Therefore pyruvate removal by C acetobutylicum
and alleviating its inhibitory effect can be a contributing factor in the improved growth of C
cellulolyticum and its boosted cellulolytic activity in the co-culture
The major products of pyruvate fermentation by C acetobutylicum are acetate butyrate and
butanol and neither acetate nor butyrate is reutilized The effects of pyruvate on glucose
fermentation by C acetobutylicum have also been investigated before and it has been shown
that both substrates can be fermented simultaneously (Junelles et al 1987) Furthermore
cellobiose and glucose were only detected at the early stage of batches which could have been
present in the pre-cultures inoculated into the bioreactors and were taken up in 24 hours
Cellobiose and glucose could not be detected in the course of co-cultures which indicated their
immediate consumption in the co-culture In conclusion in this study we showed a strong
synergism between the two species of clostridia in the co-culture and found that C
106
acetobutylicum enables C cellulolyticum to grow under a suboptimal co-culture environment
This synergy can be attributed to the production of some growth pre-cursors and future
metabolomic studies of this co-culture can identify such metabolites
55 Conclusions
Examining the metabolism in this clostridial co-culture along with the mono-cultures revealed
that a significant increase in the rate of cellulose hydrolysis can be achieved using the co-
culture and making use of the synergism existing between the two clostridial species It is likely
that C acetobutylicum improves the cellulolytic activity of C cellulolyticum in the co-culture
through exchange of metabolites such as pyruvate enabling it to grow and metabolize cellulose
under suboptimal co-culture conditions This clostridial co-culture can offer a considerable
potential CBP approach for producing commodity chemicals from cellulosic biomass taking
advantage of C acetobutylicum metabolic potential in converting sugars to variety of
chemicals
107
Chapter 6 Investigation of the Growth Arrest Event in C cellulolyticum
Through an In vivo Metabolite Analysis
61 Background
As discussed in chapter 4 the knowledge of the underlying growth arrest mechanism at high
cellulose concentration is required for modeling C cellulolyticum and the co-culture metabolism
Previous study of cellulose fermentation in the continuous cultures of C cellulolyticum has
shown that with increasing amounts of cellulose at a dilution rate of D=0048 h-1
cell biomass
concentration rises in proportion to the cellulose concentration in the feed stream however at
and above 76 gL of cellulose the steady state cell biomass concentration levels off (Desvaux et
al 2001c) Furthermore an increase in acetateethanol ratio as well as an increase in lactate and
extracellular pyruvate formation has been observed while shifting from cellulose limited to
cellulose sufficient conditions This shift has been accompanied by a decrease in both YATP and
YXS as well as an increase in qATP showing the occurrence of an uncoupling growth
phenomenon Therefore the fact that some metabolized cellulose and ATP are no longer
associated with cell biomass formation under cellulose sufficient conditions along with
concomitant increase in lactate formation and pyruvate leakage suggests the accumulation of an
intracellular inhibitory compound(s) that may also explain the establishment of steady state
conditions under substrate excess conditions (Desvaux et al 2001c)
Also in batch cultures of C cellulolyticum at different initial cellulose concentrations the
growth arrest event has been shown to limit the maximum cell biomass concentration and
cellulolytic activity at high cellulose concentrations as illustrated in Figure 6-1 It has been
suggested that during the course of evolution C cellulolyticum bacteria have been exposed to
low carbon availability conditions and have evolved with no need for regulating the entering
carbon flow Therefore when C cellulolyticum is growing on easily metabolizable carbon
sources such as cellobiose and cellulose the high carbon flow leads to pyruvate overflow and
accumulation of intracellular metabolites and consequently early growth cessation (Guedon et
al 2002) This observation highlights the importance of conducting a metabolomic analysis on
C cellulolyticum Therefore in this study we developed a method for the extraction and
108
comparative analysis of intracellular metabolite concentrations in C cellulolyticum cultures
under high and low cellulose concentrations particularly to test the hypothesis that there is a
link between intracellular pyruvate accumulation and the growth arrest event at high cellulose
concentrations
Figure 6-1 The percentage of cellulose degradation (circle) maximum cell biomass concentration (rhombus)
and maximum rate of cellulose degradation (square) obtained in 120 h in batch cultures of C cellulolyticum
as a function of initial cellulose concentration (Desvaux et al 2000)
62 Methods
621 Experimental characterization of C cellulolyticum cellulolytic activity at high and low cellulose concentrations
Batch cultures of C cellulolyticum were conducted on CM3 medium containing per litre
KH2PO4 075 g K2HPO4 075 g (NH4)2SO4 13 g MgC126H2O 1 g CaC12 015g FeSO4
125 mg resazurin 1 mg cysteine hydrochloride 1 g fibrous cellulose (medium particle size
Sigma-Aldrich C6288) 20 g or 2 g and 2 g of yeast extract The pH was controlled at 72
which is the optimal pH for C cellulolyticum growth and cellulolytic activity (Desvaux et al
2001a) The profiles of cell biomass concentration for a typical batch with 20 gL cellulose are
shown in Figure 6-2a The protein assay along with qPCR analysis showed that cells reached a
stationary growth phase after 9 days with a maximum cell density of 5times 109 cellmL (Figure 6-
109
2a) These data also verified the appropriateness of the protein assay for profiling the cell
biomass concentration in the C cellulolyticum culture for metabolomic samplings
Figure 6-2 (a) C cellulolyticum cell biomass profiles obtained from protein assay and qPCR analyses on 20
gL cellulose Arrows indicate the metabolomic sampling points (b) final concentrations of the products in
each set of batches with 20 gL and 2 gL initial cellulose concentrations (for dynamic profiles see Figure 6-3)
Error bars show the ranges in two duplicate experiments
The main fermentation products in the batch cultures with 20 gL and 2 gL cellulose were
acetate ethanol formate lactate pyruvate and succinate as shown in Figure 6-2b (measured by
HPLC analysis as it was explained in chapter 5) Under high cellulose concentration of 20 gL
more carbon flow has been oriented towards acetate and lactate formations compared to the
batches under low cellulose concentration of 2 gL
110
622 Method for the metabolomic study
C cellulolyticum was cultivated on modified CM3 medium at pH of 72 under low cellulose
concentration (2 gL) or high cellulose concentration (20 gL) as described in the previous
section Metabolomic samples were taken during the exponential and stationary growth phases
from C cellulolyticum batch cultures under high and low cellulose concentrations as represented
by arrows on Figure 6-2a The procedure for intracellular metabolome extraction was as follows
1 20 mL of culture was passed quickly through 47 mm nylon filters (Millipore
HNWP04700 045 microm) and the filter-bound cells were quenched by immediately
dropping the filter into 25 mL of -20degC extraction solvent 404020
acetonitrilemethanolwater (Amador-Noguez et al 2011 Lu et al 2010)
2 The quenched cells were vortex mixed and extracted at -20˚C for 30 min
3 The extraction solvent was transferred into eppendorf tubes the residual cells were
washed from filter with 1 mL extraction solvent and it was combined with previous
extraction solvent
4 The mixture of extraction solvent and cell debris was centrifuged for 5min at 13000g and
4˚C and the supernatant was stored at 4˚C
5 The pellet was resuspended in 600 microL of extraction solution and extracted at -20˚C for
15 min followed by centrifugation for 5min at 13000 g and 4˚C
6 The two supernatants were combined and then frozen using liquid nitrogen and stored at
-80˚C
7 For the targeted LCMS (Liquid ChromatographyMass Spectrometry) analysis of
metabolomic samples 05 mL of each metabolomic sample was dried using a vacuum
dryer at 30˚C for 2 h and the dried samples were then resuspended in 04 mL HPLC
grade water In contrast the original method has used drying under nitrogen for sample
preparation (Lu et al 2010)
The targeted analyses of pyruvate and lactate concentrations were conducted using reversed-
phase ion-exclusion liquid chromatography coupled to an Orbitrap mass spectrometer An
LCMS method was developed for analyzing the metabolomic samples using a HPX-87H HPLC
column (300 x 78 mm 9 microm particle size) where the mobile phase was 01 formic acid in
water with a flow rate of 015 mLmin at room temperature The mass spectrometry was
111
conducted in negative ion mode with the scan range of 50-900 The limit of detection (LOD) was
50 ngmL (for both pyruvate and lactate) and pyruvate and lactate loss of 57 and 2 were
observed in 50 ppm solutions using this method
623 Calculation of intracellular lactate concentration
C cellulolyticum is a rod-shaped bacterium which is 3ndash6 microm long and 06ndash1 microm wide (Desvaux
2005b) so the cell volume of 47 (μm)3was approximated for C cellulolyticum based on its
geometry The specific cell volume of C cellulolyticum was also estimated using the E coli
specific cell volume (215 microLmg dry cell (Park et al 2011)) with a correction factor (Cf) of 67
which was based on the cell volume ratios (E coli cell volume is 06ndash07 (μm)3
(Kubitschek
1990)) The intracellular volume of the cells in that 20 mL metabolomic sample culture (Vint)
was calculated using sample size (20 mL) cell biomass concentration (mg proteinL) and protein
content of C cellulolyticum (062 g proteing cell biomass dry weight (Giallo et al 1985)) as
follows
Vint = 20 (mL) times cell concentration (mg proteinL) times 215 (microLmg dry cell) times Cf 062 (1)
The intracellular concentration ( mCint ) of each metabolite (m) was then calculated from the
concentration of the metabolite in that 41 mL extraction solvent ( m
solvC ) and Vint
mCint (gL) = m
solvC (gL) times 41 (mL) Vint (mL) (2)
For example in sample a-5 with the cell concentration of 370 mg proteinL
Vint = 20 times 10-3
(L) times 370 (mg proteinL) times 215 (microLmg dry cell) times 67062 (mg proteinmg cell
biomass dry weight) = 017 mL
Intracellular lactate concentration = lactate concentration in the solvent (045 gL) times 41 (mL)
017 (mL) = 11 (gL)
112
63 Results and discussion
The cell biomass formation profiles in C cellulolyticum batch cultures with 20 gL and 2 gL
cellulose are presented in Figure 6-3a b e and g where arrows show the metabolomic sampling
points At the high cellulose concentration of 20 gL cells reached a stationary growth phase
after 8 days with a maximum cell biomass concentration of 07 gL assuming 062 g proteing
cell dry weight of C cellulolyticum (Giallo et al 1985) Notably drastic increases in the
concentration of pyruvate and lactate were observed in the cultures with 20 gL cellulose These
increases were coinciding with the growth arrest and the switch to a stationary growth phase
which was in agreement with previous reports (Desvaux et al 2000) However in the batch
cultures at 2 gL cellulose the cells reached the stationary growth phase after cellulose depletion
as has been reported for cultures on cellulose concentrations below 67 gL (Desvaux et al
2000)
Table 6-1 presents the results of the LCMS analysis of the metabolomic samples As cells were
transitioning from exponential growth to the stationary growth phase (eg from a-1 to a-5) in
the batches from a high cellulose concentration of 20 gL intracellular accumulation of lactate
was observed in each set of metabolomic samples The intracellular lactate concentration reached
94 gL after 5 days of growth in the culture In addition the intracellular lactate concentration
reached 13 gL in the stationary growth phase In contrast in the batches with low cellulose
concentration of 2 gL no intracellular lactate accumulation was observed
In addition no intracellular pyruvate accumulation was observed in all of the metabolomic
samples under low and high cellulose concentrations which rejected the hypothesis that
intracellular pyruvate accumulation is involved in the growth arrest event However this
observation implies a possible connection between the lactate accumulation and the growth arrest
in C cellulolyticum at high cellulose concentration
113
1
2
3
1
2
5
4
3
4
114
Figure 6-3 The profiles of products and cell biomass formations in the batches from which metabolomic
samples were taken a b at 20 gL and e g at 2 gL initial cellulose concentration Arrows show the
metabolomic sampling points eg sample a-1 is the sample 1 of batch ldquoardquo as indicated by an arrow
1
2
3
4
1
2
3
115
Table 6-1 LCMS analysis of the metabolomic samplesyen Cell biomass formation profiles and sampling points in batches a b e and g are presented in
Figure 6-3 eg sample a-1 is the sample 1 of batch ldquoardquo as indicated by an arrow ND not detectable
sample ID
days after starting to grow
cell biomass concentration (g proteinL)
Lactate conc in 41 mL
extraction solvent (gL)
Intracellular lactate conc
(gL)
Extracellular lactate conc
(gL)
Intracellular pyruvate conc
(gL)
Intracellular pyruvate and
lactate detection limit (mgL)
Extracellular pyruvate
conc (mgL)
Me
tab
olo
mic
sam
ple
s o
n 2
0 g
L c
ellu
lose
a-1 0 003 ND ND 01 ND 14 2
a-2 2 011 ND ND 01 ND 4 3
a-3 3 019 001 05 03 ND 2 5
a-4 5 043 034 70 29 ND 1 1
a-5 8 037 045 11 39 ND 1 2
b-1 3 023 006 21 06 ND 2 5
b-2 4 037 030 71 20 ND 1 9
b-3 5 043 047 94 38 ND 1 18
b-4 6 041 058 13 39 ND 1 17
c-1 1 004 ND ND 02 ND 12 8
c-2 3 023 001 04 05 ND 2 2
d-1 1 005 ND ND 02 ND 10 8
d-2 3 027 027 87 24 ND 2 3
Me
tab
olo
mic
sam
ple
s
on
2 g
L c
ellu
lose
e-1 1 003 ND ND 04 ND 13 5
e-2 2 009 ND ND 04 ND 5 6
e-3 3 010 ND ND 04 ND 5 7
e-4 4 007 ND ND 04 ND 6 7
g-1 1 005 ND ND 03 ND 8 10
g-2 2 007 ND ND 03 ND 6 4
g-3 3 007 ND ND 03 ND 6 7
yenAll values were determined with an average accuracy of plusmn10
Intracellular lactate concentrations were calculated from lactate concentrations in 41 mL extraction solvent using Equation (2)
Intracellular pyruvate and lactate detection limit = 50 (ngmL) times 41 mL extraction solventVint and Vint for each sample was obtained using Equation (1)
116
Previous kinetic analysis of the fermentation products in C cellulolyticum culture with pH
controlled at 72 has also shown accelerated lactate formation while the culture is transitioning
to the stationary growth phase on high cellulose concentration of 291 gL Lactate formation is
coinciding with pyruvate formation in the culture and the growth arrest (Desvaux et al 2000)
suggesting accumulation of an intracellular compound under high carbon flow conditions as an
explanation for the growth arrest event (Guedon et al 1999a) Furthermore consecutive re-
inoculations of this culture with fresh inoculum while cells had reached the stationary growth
phase has significantly increased the cell biomass concentration and cellulose degradation in
the C cellulolyticum culture with 29 gL cellulose verifying that growth arrest event is not due
to end product inhibitions or availability of adhesion sites (Desvaux et al 2000) The lactate
concentration in this culture at re-inoculation points has been in the range of 18 to 62 gL
which confirms that C cellulolyticum growth is not inhibited in the presence of lactate
Furthermore since at this extracellular pH of 72 only 0045 of the total lactate
concentration is in undissociated membrane permeable form it indicates that trans-membrane
migration of lactate is not the reason for the intracellular lactate accumulation
Moreover a recent metabolic engineering study of C cellulolyticum (Li et al 2012) in which
lactate dehydrogenase and malate dehydrogenase genes have been disrupted using targeted
mutagenesis has shown that the double mutant ferments more cellulose compared to the wild-
type species growing on 10 gL cellulose Thirty eight percent increase in cellulose degradation
has been reported and the mutant produces very little lactate and acetate while the ethanol
yield has increased 9 times compared to the wild-type species (Li et al 2012) In another
study heterologous expression of pyruvate decarboxylase and alcohol dehydrogenae genes
from Zymomonas mobilis in C cellulolyticum has resulted in a prolonged growth of C
cellulolyticum a 180 increase in cellulose degradation a 48 decrease in lactate production
and a 60 decrease in pyruvate production while the concentration of acetate and ethanol
increased by 93 and 53 respectively (Guedon et al 2002)
Also it has been shown that the lactate formation flux in C cellulolyticum has a weak
correlation with in vitro LDH activity which can be related to regulation effects imposed by
intracellular metabolites (Guedon et al 1999b) Based on these results and our observations it
can be hypothesized that the likely explanation for the improved cellulolytic activity and cell
117
biomass formations in the above mutant and recombinant strains compared to the wild-type
strain is the decreased level of lactate production and consequently decreased level of
intracellular lactate accumulation It is likely that there is a limit on the lactate transportation
pathway in C cellulolyticum that leads to intracellular lactate accumulation and growth
cessation This hypothesis can be tested by over-expressing the lactate transporter gene in C
cellulolyticum
In addition the metabolomic samples were also examined for the presence of acetyl CoA
(exact mass of 8091258 u) glucose 6-phosphate (exact mass of 2600297 u) NADH (exact
mass of 651248 u) coenzyme A (exact mass of 7671152 u) glyceraldehyde 3-phosphate
(exact mass of 169998 u) and 13 diphosphoglycerate (exact mass of 2656593 u) in the
samples but no peaks were detected for any of the mentioned compounds It is possible that
some volatile compounds have been evaporated during the vacuum drying step The ideal
procedure was to analyze the samples without further processing (ie drying) to minimize the
errors but the HPLC column used in this study was not compatible with methanol in the
solvent Also this HPLC column and method might have not been suitable for separating and
detecting these compounds
631 Profiling intracellular pHi at high cellulose concentration
To investigate the effect of intracellular lactate accumulation on the intracellular medium
acidity and to address if an intracellular pH drop is involved in the growth arrest event in C
cellulolyticum extracellular pH (pHe) and intracellular pH (pHi) were estimated using
Henderson-Hasselbalch equation
pHe = pKa+log10([lac-]e[lactic acid]e) (3)
pHi = pKa+log10([lac-]i[lactic acid]i) (4)
Where the pKa of lactic acid is 386 and the extracellular pH (pHe) was 72 Total lactic
concentration ([lac-] + [lactic acid]) was obtained from HPLC (extracellular) and LCMS
(intracellular) measurements The undissociated lactic acid concentration ([lactic acid]) was
deemed to be equal inside and outside the cells since the undissociated forms of fermentation
acids are membrane permeable therefore they can pass freely across the cell membrane The
118
estimated intracellular pHi at each metabolomic sampling point is presented in Table 6-2 In all
metabolomic samples obtained from C cellulolyticum batch cultures with high cellulose
concentration of 20 gL the estimated intracellular pHi was in the range of 71 to 78 which
was consistent with the previously reported intracellular pHi in C cellulolyticum (Russell and
Wilson 1996 Desvaux 2005b) Therefore the acidification of intracellular medium in C
cellulolyticum has not been the reason for the growth arrest event The intracellular lactic acid
accumulation was mainly in form of lactate anion as only 002 of total lactic acid was found
in undissociated form in this range of intracellular pHi Furthermore as discusses earlier at this
pHe of 72 only 0045 of the total lactate concentration is in the undissociated membrane
permeable form which indicates that the trans-membrane migration of lactate is not the reason
for the intracellular lactate accumulation
Table 6-2 C cellulolyticum intracellular pH values estimated from intracellular and extracellular lactate
concentrations in metabolomic samples obtained from C cellulolyticum batch cultures with high cellulose
concentration of 20 gL Total lactic concentration ([lac-] + [lactic acid]) was obtained from HPLC
(extracellular) and LCMS (intracellular) measurements
Sample id Cell biomass concentration
(gL)
Total intracellular lactate conc
(gL)
Total extracellular lactate conc (gL)
Undissociated lactic acid conc
(mgL)
pHi
a-3 019 05 03 01 73
a-4 043 70 29 13 76
a-5 037 11 39 18 76
b-1 023 21 06 03 77
b-2 037 71 20 09 77
b-3 043 94 38 17 76
b-4 041 13 40 18 77
c-2 023 04 05 02 71
d-2 027 87 24 11 78
All values were determined with an average accuracy of plusmn10
Intracellular lactate concentrations were calculated using Equation (2) as presented in Table 6-1
Intracellular anion accumulation and toxicity under acidic pH has also been previously shown
to be the reason for the growth inhibition in cellulolytic bacteria as well as E coli cultures
Cellulolytic bacteria are unable to grow at low intracellular pH and it has been shown that
under an acidic environment where the pH gradient (ΔpH) across the cell membrane is high
the intracellular dissociation of fermentation acids which are membrane permeable in
undissociated form and the intracellular accumulation of acid anions lead to anion toxicity
119
which is the likely reason of growth inhibition under acidic conditions (Russell and Wilson
1996 Flythe and Russell 2006)
Furthermore it has been shown that presence of lactate and acetate ions in an acidic medium
leads to a significant decline in glutamate synthesis in Clostridium sporogenes MD1 which
inhibits the bacterial growth (Flythe and Russell 2006) Also in E coli cultures at pH 6
incubation of cells in 8 mM acetate for 20 min resulted in intracellular accumulation of acetate
anions (240 mM) and reduced the level of intracellular glutamate pools (Roe et al 1998)
Furthermore in mildly acidic E coli cultures (pH 6) inhibition of methionine biosynthesis by
acetate (8 mM) and the toxicity of accumulated homocysteine have been indicated as the cause
of growth inhibition by acetate under weak acid stress (Roe et al 2002) where addition of
methionine to this culture could restore the E coli growth rate to some significant extent This
effect has been also reported for other organic acids
In conclusion intracellular lactate accumulation along with the intracellular pH data in C
cellulolyticum cultures at high cellulose concentration of 20 gL suggests that lactate anion
accumulation and toxicity possibly through its inhibitory effect on the biosynthesis of a growth
precursor is the likely reason for the growth arrest event in C cellulolyticum This lactate
accumulation might be due to a limit on the lactate transportation pathway in C cellulolyticum
64 Conclusion
C cellulolyticum produces significant amounts of lactate when it is growing under high
cellulose concentrations however its growth and metabolism is limited due to the growth
arrest event In this study we propose and hypothesize that there is a limit on the lactate
transportation pathway in C cellulolyticum which leads to intracellular lactate accumulation
and the growth arrest This hypothesis can be tested by over-expressing the lactate transporter
gene in C cellulolyticum using existing gene transfer techniques for C cellulolyticum ATCC
35319 (Jennert et al 2000 Tardif et al 2001 Guedon et al 2002) and investigating its
effects on the metabolism of C cellulolyticum at high cellulose concentrations Overcoming the
growth arrest barrier and improving the lactate production in C cellulolyticum culture would
promote it as a potential CBP approach for cellulosic lactate production In addition
developing methods for targeted LCMS analysis of other metabolites involved in the central
metabolism of C cellulolyticum will assist in obtaining a more comprehensive picture of the
120
growth arrest phenomenon in C cellulolyticum and identifying other potential metabolites
which might be playing roles in the growth arrest event
121
Chapter 7 Summary conclusions and recommendations for future work
71 Summary and conclusions
The eventual goal of this study was to develop methods for the analysis of metabolism in the
co-culture of C acetobutylicum and C cellulolyticum and to investigate the inter-species
metabolic interactions that enhance the metabolic rate and biofuel synthesis To address this
goal the following objectives were defined and investigated
1 To develop a genome-scale metabolic model of C acetobutylicum ATCC 824 that
includes the thermodynamic and metabolomic constraints and to achieve
thermodynamically feasible phenotypes
An updated genome-scale metabolic model of C acetobutylicum ATCC824 was developed
which consists of 700 genes 712 reactions and 679 metabolites covering 163 of ORFs and
is more comprehensive compared to two other existing models This metabolic network was
used as a platform for simulating phenotypes using the constraint-based modeling approach
Flux variability analysis showed the presence of alternate carbon and electron sinks that allows
for different carbon assimilation patterns and ranges of product formation rates
We applied an NMR based approach to quantify 31 intracellular metabolites in both acidogenic
and solventogenic phases The total molar concentration of metabolites was approximately
245mM where asparagine was the most dominant metabolite Incorporation of these
metabolomic data along with thermodynamic data into this model resulted in
thermodynamically feasible flux distributions However flux balance analysis cannot predict
the complex metabolism of C acetobutylicum properly and additional constraints are required
to narrow down the solution space Incorporating the regulatory network in the genome-scale
model seems to be necessary for describing the metabolic shift from acidogenic to
solventogenic phase
2 To develop the genome-scale metabolic model of C cellulolyticum and to apply the
developed metabolic models of the pure cultures to develop the genome-scale model of
metabolic interactions in the co-culture
122
The genome-scale metabolic model of C cellulolyticum H10 which comprises 431 genes 621
reactions 603 metabolites and covers 12 of ORFs was developed and used as a platform for
simulating phenotypes using the constraint-based modeling approach C cellulolyticum model
(iFS431) was able to predict the physiology during growth in the presence of cellulose and
cellobiose The model of co-culture metabolism was developed by combining these metabolic
models of the pure cultures This co-culture model was used to analyze the integrated
physiology of this co-culture and the results showed that at high cellulose concentrations the
model is not able to capture the C cellulolyticum growth arrest suggesting that cellobiose
inhibition removal by C acetobutylicum is not the main factor that improves cellulose
degradation in the co-culture Also these simulations highlighted the importance of the C
cellulolyticum cellulosome characterization Further investigation to understand the mechanism
behind this growth arrest is required for improving the model predictions at high cellulose
concentrations as well as predictions of the co-culture physiology
Genome-scale models of C cellulolyticum and the co-culture modeling framework as
presented here will be valuable for further optimization of this co-culture for improved
cellulose degradation and biobutanol production This metabolic model of the co-culture can
also be easily extended to incorporate hemicellulose metabolism for growth on more complex
cellulosic substrates The comprehensive genome-scale model of the co-culture metabolism can
be applied to devise methods for design and optimization of environmental process and
genetic parameters and for analyzing the impact of the genetic perturbations (gene additions or
gene deletions) as well as environmental parameters such as medium composition on the
metabolic activity of the clostridial co-culture to enhance the desired product formation
3 To characterize the co-culture metabolism by developing molecular biology methods
Clostridial co-culture containing cellulolytic and solventogenic species is a potential
consolidated bioprocessing (CBP) approach for producing biochemicals and biofuels from
cellulosic biomass It has been demonstrated that the rate of cellulose utilization in the co-
culture of C acetobutylicum and C cellulolyticum is improved compared to the mono-culture
of C cellulolyticum (Petitdemange et al 1983) However the metabolic interactions in this co-
culture are not well understood To investigate the metabolic interactions in this co-culture we
dynamically characterized its physiology and microbial composition using qPCR
123
Therefore in this study we investigated metabolic interactions in this co-culture by developing
a comparative qPCR analysis of the co-culture and mono-cultures of C cellulolyticum and C
acetobutylicum Investigation of the metabolism in this clostridial co-culture along with the
mono-cultures revealed that a significant increase in the rate of cellulose hydrolysis can be
achieved using the co-culture and making use of the synergism existing between the two
clostridial species The qPCR data suggested a higher growth rate of C cellulolyticum in the
co-culture compared to its mono-culture
Our results also showed that in contrast to the mono-culture of C cellulolyticum which did not
show any cellulolytic activity under conditions similar to those of the co-culture the co-culture
did show cellulolytic activity even superior to the C cellulolyticum mono-culture at its optimal
pH of 72 Moreover experiments indicated that the co-culture cellulolytic activity depends on
the concentration of C acetobutylicum in the co-culture as no cellulolytic activity was
observed at a low concentration of C acetobutylicum thus confirming the essential role of C
acetobutylicum in improving C cellulolyticum growth in the co-culture Furthermore a butanol
concentration of 350 mgL was detected in the co-culture batch experiments
These results suggest the presence of synergism between these two species while C
acetobutylicum metabolic activity significantly improves the cellulolytic activity in the co-
culture and allows C cellulolyticum to survive under suboptimal co-culture conditions which
do not allow C cellulolyticum to grow and metabolize cellulose independently It is likely that
C acetobutylicum improves the cellulolytic activity of C cellulolyticum in the co-culture
through exchange of metabolites such as pyruvate enabling it to grow and metabolize cellulose
under suboptimal co-culture conditions This clostridial co-culture can offer a considerable
potential CBP approach for producing commodity chemicals from cellulosic biomass taking
advantage of the C acetobutylicum metabolic potential to convert sugars to variety of
chemicals
We also observed a significant increase in acetate and ethanol production in the co-culture
compared to the mono-culture of C cellulolyticum at high cellulose concentrations where the
carbon flow was redirected from lactate to acetate and ethanol formations The produced
acetate can be further reduced to ethanol by integrating this CBP with a chemical reduction
unit
124
4 To examine the growth arrest event in C cellulolyticum
The knowledge of the underlying growth arrest mechanism at high cellulose concentration is
required for modeling C cellulolyticum and the co-culture metabolism It has been suggested
that during the course of evolution C cellulolyticum bacteria have been exposed to low carbon
availability conditions and have evolved with no need for regulating the entering carbon flow
therefore when C cellulolyticum is growing on easily metabolizable carbon sources such as
cellobiose and cellulose it has been suggested that the high carbon flow leads to pyruvate
overflow and accumulation of intracellular metabolites and consequently early growth
cessation (Guedon et al 2002) This premise highlights the importance of conducting a
metabolomic analysis on C cellulolyticum Therefore in this study we developed an LCMS
method for the extraction and comparative analysis of intracellular metabolite concentrations in
C cellulolyticum cultures under high and low cellulose concentrations particularly to test the
hypothesis that there is a link between intracellular pyruvate accumulation and the growth
arrest event at high cellulose concentrations
No intracellular pyruvate accumulation was observed in all of the metabolomic samples under
low and high cellulose concentrations which rejected the hypothesis that intracellular pyruvate
accumulation is involved in the growth arrest event However in the batches with a high
cellulose concentration of 20 gL intracellular accumulation of lactate was observed in each set
of metabolomic samples as cells were transitioning from exponential growth to the stationary
growth phase These results suggest a possible connection between the lactate accumulation
and the growth arrest event in C cellulolyticum at high cellulose concentration
Intracellular lactate accumulation along with the intracellular pH data in C cellulolyticum
cultures at high cellulose concentration of 20 gL suggest that lactate anion accumulation and
toxicity possibly through its inhibitory effect on the biosynthesis of a growth precursor is a
possible reason for the growth arrest event in C cellulolyticum We propose and hypothesize
that this lactate accumulation might be due to a limit on the lactate transportation pathway in C
cellulolyticum which leads to intracellular lactate accumulation and may account for the
growth arrest
125
72 Engineering significance
The first genome-scale metabolic model of C cellulolyticum was presented in this study This
model has been validated against the experimental data and is able to predict the metabolism of
C cellulolyticum on cellobiose and cellulose Also we presented an updated genome-scale
metabolic model of C acetobutylicum which has a higher ORF coverage compared to other
existing models However incorporation of the regulatory network seems to be necessary to
model the complex metabolism of C acetobutylicum These genome-scale metabolic models
are providing platforms for future analyses and optimization of the metabolism in these two
clostridial species using in silico generated hypotheses that can be tested experimentally
Furthermore this model of C cellulolyticum metabolism has been integrated with the C
acetobutylicum model to develop the first genome-scale model of the clostridial co-culture
metabolism The results of our simulations suggest that 1) removal of cellobiose inhibition is
not the main factor responsible for improved cellulose utilization in the co-culture and 2) C
cellulolyticum is primarily adapted to low carbon flow and availability (Guedon et al 1999a)
These results also motivate the need for metabolic engineering strategies to enable C
cellulolyticum to handle high carbon flows This co-culture model will be valuable for further
analyses and optimization of the co-culture for the production of various biochemicals in this
consolidated bioprocessing approach
We also developed and validated the first qPCR method for the characterization of the
clostridial co-culture physiology dynamics and composition This method will be valuable for
the future analyses of the interactions between these two species and for devising methods to
improve the metabolic and cellulolytic activity in this co-culture Optimization of the co-culture
medium and experimental conditions seems to be necessary as small variations in the medium
preparation resulted in different cellulolytic activities in our co-culture experiments Moreover
we used a novel method to investigate the growth arrest event in C cellulolyticum through a
comparative in vivo metabolite analysis We proposed a hypothesis that there is a limit on the
lactate transportation pathway in C cellulolyticum which leads to intracellular lactate
accumulation and the growth arrest The knowledge of the growth arrest mechanism in C
cellulolyticum metabolism is an essential requirement for improving its metabolic and
cellulolytic activity under industrial conditions with high cellulose concentrations
126
73 Future work
1- Optimization of the co-culture medium and experimental conditions
The co-culture of C acetobutylicum and C cellulolyticum can be further improved and
optimized for cellulose degradation and biochemical production In a recent study it has been
shown that the expression of cellulases in C cellulolyticum at both transcription and protein
levels is induced by glucose while the expression of cellulosomal genes are repressed under
cellobiose and xylose through a carbon catabolite repression mechanism (Xu et al 2013) In
C cellulolyticum cultures on cellulose glucose addition led to a decrease in the culturersquos lag
phase The peak cellulose degradation rate increased compared to the control culture on
cellulose (0854 gLday and 0607 gLday respectively) with less than 05 gL of glucose in
the culture Therefore adding a small amount of glucose to the co-culture in a fed-batch system
may benefit cellulose degradation in the co-culture and it needs to be investigated
Recently the medium conditions have been optimized for C cellulolyticum cultivation on
cellobiose (Wang et al 2013) In the co-culture of C acetobutylicum and C cellulolyticum the
medium composition initial cellulose concentration the impact of the co-culture pH profile
and the duration of C cellulolyticum culture before the addition of C acetobutylicum should be
explored We examined the metabolism of the co-culture under low concentrations of C
acetobutylicum and demonstrated its drastic effect on the co-culture cellulolytic activity The
impact of initial concentration of both species on the co-culture metabolism can be further
investigated and optimized This study also might be helpful in reducing the observed long lag
phase in the co-culture experiments
2- Developing LCMS methods for untargeted metabolomic analysis of the growth arrest
event in C cellulolyticum
Potential compounds and metabolites unidentified in this thesis which may play a role in the
growth arrest event can be identified by conducting untargeted analysis of the LCMS data
Also methods for targeted LCMS analysis of other metabolites involved in the central
metabolism and cofactors such as NAD+ can be developed and employed to obtain a more
comprehensive picture of the growth arrest phenomenon in C cellulolyticum
127
3- 13C labelling experiment to trace the carbon distribution pattern in the co-culture
To test the hypothesis that C acetobutylicum can improve cellulose hydrolysis in the co-culture
by preventing the cellobiose overflow towards C cellulolyticum metabolism a 13
C labelling
experiment and 13
C metabolic flux analysis (MFA) can be applied
4- Comparative transcriptomic study of C cellulolyticum
Further understanding of the growth arrest mechanism in C cellulolyticum can be obtained by
comparing the gene expression profiles under low and high cellulose concentrations and
transcriptional profiling of the genes involved in the central metabolism of C cellulolyticum
during the switch from exponential phase to stationary phase and growth arrest RNAseq and
qPCR methods can be applied for this purpose Also profiling gene expression in the co-
culture can provide us with further understanding of the interactions between the two species in
the co-culture
5- Further investigation of the specificity of the metabolic interactions between the two
clostridial species in this co-culture
In order to examine the specificity of the synergism in the clostridial co-culture and to find out
if other microbial species would also have similar metabolic interactions with C cellulolyticum
in a co-culture we tried an E coli strain C and C cellulolyticum co-culture system No
significant improvement in the co-culture cellulolytic activity compared to the control C
cellulolyticum culture was observed Further details and the results of this experiment are
presented in Appendix D-6 However this experiment has been conducted under unregulated
pH conditions and the final pH in all bottles was about 55 which is below the optimal pH
range for cellulolytic activity Therefore running this co-culture under pH-controlled
conditions and the pH profile that has been used for clostridial co-culture would be more
insightful Such a co-culture would also be interesting as a potential CBP for producing other
biochemicals
6- Modeling the regulatory network of C acetobutylicum
In a recent study (Wietzke and Bahl 2012) the redox-sensing transcriptional repressor protein
Rex has been identified as a transcriptional regulator of solventogenesis in C acetobutylicum
in response to the cellular NADHNAD+ ratio Rex controls the expression of the genes
128
involved in the butanol formation pathway The Rex-negative mutant produced significantly
higher amounts of butanol and ethanol The solventogenesis started earlier than in the wild
type and acetone and hydrogen formation were significantly decreased Also the expression of
NADH dependant alcohol dehydrogenase was significantly higher in the Rex mutant These
findings offer new metabolic engineering targets for improving the butanol production in C
acetobutylicum Furthermore incorporating the regulatory network in the genome-scale model
of C acetobutylicum seems to be necessary for describing the metabolic shift from acidogenic
to solventogenic phase
7- Over-expression of PFO (pyruvate ferredoxin oxidoreductase) and the lactate formation
pathway in C cellulolyticum
The rationale behind this experiment is based on the finding that the lactate production pathway
may be constrained Simulation of the C cellulolyticum metabolism without any constraint on
the LDH (lactate dehydrogenase) and PFO (pyruvate ferredoxin oxidoreductase) at high
cellobiose uptake rate (186 mmolgDCWh) has shown that pyruvate will not be produced if
there is no capacity constraint on these two reactions (Chapter 4) It has been suggested that
limited PFO activity which cannot support high pyruvate flow is the reason for this pyruvate
overflow (Guedon et al 1999b) Furthermore high pyruvate affinity of PFO (km=057mM)
which results in PFO saturation as well as low pyruvate affinity of lactate dehydrogenase
(LDH km=45mM) where there is a significant difference in the VmaxKm ratios (502times10-3
min-
1mg
-1 for PFO and 0182times10
-3 min
-1mg
-1 for LDH) can explain the intracellular pyruvate
accumulation and overflow (Guedon et al 1999b) Also it has been shown that the lactate
formation flux has a weak correlation with in vitro LDH activity which can be related to the
regulation effects imposed by intracellular metabolites (Guedon et al 1999b)
In addition in batch cultures of C cellulolyticum with a high cellulose concentration it has
been shown that the peak of pyruvate formation coincides with the start of lactate formation
and this pyruvate accumulation in the C cellulolyticum culture shows that the rate of cellulose
catabolism is higher than the rate of pyruvate consumption (Desvaux et al 2000) therefore a
potential strategy for improving the cell biomass yield and consequently cellulose hydrolysis is
the reduction of pyruvate accumulation which has been identified as one of the growth
inhibitory metabolites (Guedon et al 2002) by over-expression of LDH and lactate
129
transportation pathway The secreted lactate by the transformant strain can be later fermented
by C acetobutylicum in the co-culture for butanol production (Bahl et al 1986)
In another approach over-expression of a low affinity PFO in C cellulolyticum which is a
limiting pathway in C cellulolyticum metabolism can improve the cell density and cellulose
degradation as it has been shown that the cellulose depolymerization by the cellulosome is not
the limiting step in the cellulolytic activity of C cellulolyticum and improving the metabolism
of C cellulolyticum should be the main focus (Desvaux 2005b) A metabolic engineering
approach has been applied previously through heterologous expression of pyruvate
decarboxylase (PDC) and alcohol dehydrogenase (ADH) from Zymomonas mobilis to reduce
the pyruvate accumulation and it increased the cell biomass formation (180) and cellulose
hydrolysis (150) in batch culture of C cellulolyticum on cellulose Also in a very recent
work Higashide et al (2011) applied a metabolic engineering approach to synthesize
isobutanol from cellulose using a C cellulolyticum transformant strain
8- Analysis of H2 production in the co-culture of C cellulolyticum and C acetobutylicum
M5 mutant
It has been shown that the C acetobutylicum M5 mutant which does not bear the
solventogenic genes has a higher H2 yield (Oh et al 2009) Therefore the co-culture of this
mutant with C cellulolyticum can be a promising approach for producing biohydrogen from
cellulosic biomass in a consolidated bioprocessing approach Furthermore engineering the
redox balance and down-regulating the NADH formation from reduced ferredoxin through
ferredoxin-NADH oxidoreductase (FNOR) pathway will improve redox balance through
hydrogen formation and result in the higher hydrogen formation in C acetobutylicum and C
cellulolyticum
130
References ABDOU L BOILEAU C DE PHILIP P PAGES S FIEROBE H P amp TARDIF C
(2008) Transcriptional regulation of the Clostridium cellulolyticum cip-cel operon A
complex mechanism involving a catabolite-responsive element Journal of
Bacteriology 190 1499-1506
ALI M K RUDOLPH F B amp BENNETT G N (2004) Thermostable xylanase10B from
Clostridium acetobutylicum ATCC824 Journal of Industrial Microbiology and
Biotechnology 31 229-234
ALPER H amp STEPHANOPOULOS G (2009) Engineering for biofuels Exploiting innate
microbial capacity or importing biosynthetic potential Nature Reviews Microbiology
7 715-723
ALSAKER K V amp PAPOUTSAKIS E T (2005) Transcriptional program of early
sporulation and stationary-phase events in Clostridium acetobutylicum Journal of
Bacteriology 187 7103-7118
ALTSCHUL S F GISH W MILLER W MYERS E W amp LIPMAN D J (1990) Basic
local alignment search tool Journal of Molecular Biology 215 403-410
ALVES J M P amp BUCK G A (2007) Automated system for gene annotation and metabolic
pathway reconstruction using general sequence databases Chemistry and Biodiversity
4 2593-2602
AMADOR-NOGUEZ D BRASG I A FENG X J ROQUET N amp RABINOWITZ J D
(2011) Metabolome remodeling during the acidogenic-solventogenic transition in
Costridium acetobutylicuml Applied and Environmental Microbiology 77 7984-7997
ANBARASAN P BAER Z C SREEKUMAR S GROSS E BINDER J B BLANCH
H W CLARK D S amp DEAN TOSTE F (2012) Integration of chemical catalysis
with extractive fermentation to produce fuels Nature 491 235-239
ANESIADIS N CLUETT W R amp MAHADEVAN R (2011) Model-driven design based
on sensitivity analysis for a synthetic biology application 21st European Symposium on
Computer Aided Process Engineering Chalikidiki Greece
ANNOUS B amp BLASCHEK H (1991) Isolation and characterization of Clostridium
acetobutylicum mutants with enhanced amylolytic activity Appl Environ Microbiol
57(9) 2544ndash2548
ARGYROS D A TRIPATHI S A BARRETT T F ROGERS S R FEINBERG L F
OLSON D G FODEN J M MILLER B B LYND L R HOGSETT D A amp
CAIAZZA N C (2011) High ethanol Titers from cellulose by using metabolically
engineered thermophilic anaerobic microbes Applied and Environmental
Microbiology 77 8288-8294
ARTIMO P JONNALAGEDDA M ARNOLD K BARATIN D CSARDI G DE
CASTRO E DUVAUD S FLEGEL V FORTIER A GASTEIGER E
GROSDIDIER A HERNANDEZ C IOANNIDIS V KUZNETSOV D LIECHTI
R MORETTI S MOSTAGUIR K REDASCHI N ROSSIER G XENARIOS I
amp STOCKINGER H (2012) ExPASy SIB bioinformatics resource portal Nucleic
Acids Research 40 W597-W603
BAHL H GOTTWALD M KUHN A RALE V ANDERSCH W amp GOTTSCHALK
G (1986) Nutritional factors affecting the ratio of solvents produced by Clostridium
acetobutylicum Applied and Environmental Microbiology 52 169-172
131
BANKAR SURVASE S A OJAMO H amp GRANSTROM T (2013) The two stage
immobilized column reactor with an integrated solvent recovery module for enhanced
ABE production Bioresource Technology
BECKER S A FEIST A M MO M L HANNUM G PALSSON B amp HERRGARD
M J (2007a) Quantitative prediction of cellular metabolism with constraint-based
models The COBRA Toolbox Nature Protocols 2 727-738
BECKER S A FEIST A M MO M L HANNUM G PALSSON B Atilde amp
HERRGARD M J (2007b) Quantitative prediction of cellular metabolism with
constraint-based models The COBRA Toolbox Nature Protocols 2 727-738
BENNETT B D KIMBALL E H GAO M OSTERHOUT R VAN DIEN S J amp
RABINOWITZ J D (2009) Absolute metabolite concentrations and implied enzyme
active site occupancy in Escherichia coli Nature Chemical Biology 5 593-599
BENNETT G N amp RUDOLPH F B (1995) The central metabolic pathway from acetyl-CoA
to butyryl-CoA in Clostridium acetobutylicum FEMS Microbiology Reviews 17 241-
249
BEREZINA O V SINEOKY S P VELIKODVORSKAYA G A SCHWARZ W amp
ZVERLOV V V (2008) Extracellular glycosyl hydrolase activity of the Clostridium
strains producing acetone butanol and ethanol Applied Biochemistry and
Microbiology 44 42-47
BORDBAR A MO M L NAKAYASU E S SCHRIMPE-RUTLEDGE A C KIM Y
M METZ T O JONES M B FRANK B C SMITH R D PETERSON S N
HYDUKE D R ADKINS J N amp PALSSON B O (2012) Model-driven multi-omic
data analysis elucidates metabolic immunomodulators of macrophage activation
Molecular Systems Biology
BORDEN J R amp PAPOUTSAKIS E T (2007) Dynamics of genomic-library enrichment and
identification of solvent tolerance genes for Clostridium acetobutylicum Applied and
Environmental Microbiology 73 3061-3068
BOYNTON Z L BENNETT G N amp RUDOLPH F B (1996a) Cloning sequencing and
expression of clustered genes encoding Icircsup2-hydroxybutyryl-coenzyme A (CoA)
dehydrogenase crotonase and butyryl-CoA dehydrogenase from Clostridium
acetobutylicum ATCC 824 Journal of Bacteriology 178 3015-3024
BOYNTON Z L BENNETT G N amp RUDOLPH F B (1996b) Cloning sequencing and
expression of genes encoding phosphotransacetylase and acetate kinase from
Clostridium acetobutylicum ATCC 824 Applied and Environmental Microbiology 62
2758-2766
BRO C REGENBERG B FORSTER J amp NIELSEN J (2006) In silico aided metabolic
engineering of Saccharomyces cerevisiae for improved bioethanol production
Metabolic Engineering 8 102-111
BROWN S D GUSS A M KARPINETS T V PARKS J M SMOLIN N YANG S
LAND M L KLINGEMAN D M BHANDIWAD A RODRIGUEZ JR M
RAMAN B SHAO X MIELENZ J R SMITH J C KELLER M amp LYND L
R (2011) Mutant alcohol dehydrogenase leads to improved ethanol tolerance in
Clostridium thermocellum Proceedings of the National Academy of Sciences of the
United States of America 108 13752-13757
BROWN T R amp BROWN R C (2013) A review of cellulosic biofuel commercial-scale
projects in the United States Biofuels Bioproducts and Biorefining 7 235-245
132
BUCKEL W amp THAUER R K (2013) Energy conservation via electron bifurcating
ferredoxin reduction and protonNa+ translocating ferredoxin oxidation Biochimica et
Biophysica Acta - Bioenergetics 1827 94-113
BURGARD A P amp MARANAS C D (2003) Optimization-based framework for inferring
and testing hypothesized metabolic objective functions Biotechnology and
Bioengineering 82 670-677
CALUSINSKA M HAPPE T JORIS B amp WILMOTTE A (2010) The surprising diversity
of clostridial hydrogenases A comparative genomic perspective Microbiology 156
1575-1588
CANTAREL B I COUTINHO P M RANCUREL C BERNARD T LOMBARD V amp
HENRISSAT B (2009) The Carbohydrate-Active EnZymes database (CAZy) An
expert resource for glycogenomics Nucleic Acids Research 37 D233-D238
CARERE C R SPARLING R CICEK N amp LEVIN D B (2008) Third generation
biofuels via direct cellulose fermentation International Journal of Molecular Sciences
9 1342-1360
CHASSAGNOLE C NOISOMMIT-RIZZI N SCHMID J W MAUCH K amp REUSS M
(2002) Dynamic modeling of the central carbon metabolism of Escherichia coli
Biotechnology and Bioengineering 79 53-73
CHEN J S (1995) Alcohol dehydrogenase Multiplicity-and relatedness in the solvent-
producing clostridia FEMS Microbiology Reviews 17 263-273
CHEN X ALONSO A P ALLEN D K REED J L amp SHACHAR-HILL Y (2011)
Synergy between 13C-metabolic flux analysis and flux balance analysis for
understanding metabolic adaption to anaerobiosis in E coli Metabolic Engineering 13
38-48
CHEUNG CY WILLIAMS TC POOLMAN MG FELL D RATCLIFFE R amp
SWEETLOVE L (2013) A method for accounting for maintenance costs in flux
balance analysis improves the prediction of plant cell metabolic phenotypes under stress
conditions The Plant Journal for Cellular and Molecular Biology
CHOON Y W MOHAMAD M S DERIS S CHONG C K CHAI L E IBRAHIM Z
amp OMATU S (2012) Identifying gene knockout strategies using a hybrid of bees
algorithm and flux balance analysis for in silico optimization of microbial strains
Advances in Intelligent and Soft Computing 151 371-378
CLUSTALW2 [httpwwwebiacukToolsmsaclustalw2]
CONNOR M R amp LIAO J C (2009) Microbial production of advanced transportation fuels
in non-natural hosts Current Opinion in Biotechnology 20 307-315
CORNILLOT E NAIR R V PAPOUTSAKIS E T amp SOUCAILLE P (1997) The genes
for butanol and acetone formation in Clostridium acetobutylicum ATCC 824 reside on a
large plasmid whose loss leads to degeneration of the strain Journal of Bacteriology
179 5442-5447
COVERT M W SCHILLING C H FAMILI I EDWARDS J S GORYANIN I I
SELKOV E amp PALSSON B O (2001a) Metabolic modeling of microbial strains in
silico Trends in Biochemical Sciences 26 179-186
COVERT M W SCHILLING C H amp PALSSON B (2001b) Regulation of gene
expression in flux balance models of metabolism Journal of Theoretical Biology 213
73-88
COVERT M W XIAO N CHEN T J amp KARR J R (2008) Integrating metabolic
transcriptional regulatory and signal transduction models in Escherichia coli
Bioinformatics 24 2044-2050
133
CRIPPS R E ELEY K LEAK D J RUDD B TAYLOR M TODD M BOAKES S
MARTIN S amp ATKINSON T (2009) Metabolic engineering of Geobacillus
thermoglucosidasius for high yield ethanol production Metabolic Engineering 11 398-
408
CUI G Z HONG W ZHANG J LI W L FENG Y LIU Y J amp CUI Q (2013)
Targeted gene engineering in Clostridium cellulolyticum H10 without methylation
Journal of Microbiological Methods 89 201-208
CURRAN K A CROOK N C amp ALPER H S (2012) Using flux balance analysis to guide
microbial metabolic engineering Methods in Molecular Biology 834 197-216
DATTA R amp ZEIKUS J G (1985) Modulation of acetone-butanol-ethanol fermentation by
carbon monoxide and organic acids Applied and Environmental Microbiology 49 522-
529
DEMAIN A L NEWCOMB M amp WU J H D (2005) Cellulase clostridia and ethanol
Microbiology and Molecular Biology Reviews 69 124-154
DEN HAAN R ROSE S H LYND L R amp VAN ZYL W H (2007) Hydrolysis and
fermentation of amorphous cellulose by recombinant Saccharomyces cerevisiae
Metabolic Engineering 9 87-94
DESAI R P (1999) Development of Metabolic Flux analysis and Antisense RNA
technologies as Tools for Metabolic Engineering of Clostridium acetobutylicum
ATCC824
DESAI R P NIELSEN L K amp PAPOUTSAKIS E T (1999) Stoichiometric modeling of
Clostridium acetobutylicum fermentations with non-linear constraints Journal of
Biotechnology 71 191-205
DESVAUX M (2005a) The cellulosome of Clostridium cellulolyticum Enzyme and Microbial
Technology 37 373-385
DESVAUX M (2005b) Clostridium cellulolyticum Model organism of mesophilic cellulolytic
clostridia FEMS Microbiology Reviews 29 741-764
DESVAUX M GUEDEON E amp PETITDEMANGE H (2001a) Metabolic flux in cellulose
batch and cellulosefed continuous cultures of Clostridium cellulolyticum in response to
acidic environment Microbiology 147 1461-1471
DESVAUX M GUEDON E amp PETITDEMANGE H (2000) Cellulose catabolism by
Clostridium cellulolyticum growing in batch culture on defined medium Applied and
Environmental Microbiology 66 2461-2470
DESVAUX M GUEDON E amp PETITDEMANGE H (2001b) Carbon flux distribution and
kinetics of cellulose fermentation in steady-state continuous cultures of Clostridium
cellulolyticum on a chemically defined medium Journal of Bacteriology 183 119-130
DESVAUX M GUEDON E amp PETITDEMANGE H (2001c) Kinetics and Metabolism of
Cellulose Degradation at High Substrate Concentrations in Steady-State Continuous
Cultures of Clostridium cellulolyticum on a Chemically Defined Medium Applied and
Environmental Microbiology 67 3837-3845
DIEZ-GONZALEZ F RUSSELL J B amp HUNTER J B (1995) The role of an NAD-
independent lactate dehydrogenase and acetate in the utilization of lactate by
Clostridium acetobutylicum strain P262 Archives of Microbiology 164 36-42
DONG H ZHANG Y DAI Z amp LI Y (2010) Engineering Clostridium strain to accept
unmethylated DNA PLoS ONE 5
DU T F HE A Y WU H CHEN J N KONG X P LIU J L JIANG M amp
OUYANG P K (2013) Butanol production from acid hydrolyzed corn fiber with
Clostridium beijerinckii mutant Bioresource Technology 135 254-261
134
DU Y amp YANG S T (2012) High-yield and high-titer n-butanol production from
lignocellulosic biomass by engineered clostridium tyrobutyricum AIChE 2012 - 2012
AIChE Annual Meeting Conference Proceedings
DUumlRRE P (2007) Biobutanol An attractive biofuel Biotechnology Journal 2 1525-1534
DUumlRRE P FISCHER R J KUHN A LORENZ K SCHREIBER W
STURZENHOFECKER B ULLMANN S WINZER K amp SAUER U (1995)
Solventogenic enzymes of Clostridium acetobutylicum Catalytic properties genetic
organization and transcriptional regulation FEMS Microbiology Reviews 17 251-262
DUSSEAUX S CROUX C SOUCAILLE P amp MEYNIAL-SALLES I (2013) Metabolic
engineering of Clostridium acetobutylicum ATCC 824 for the high-yield production of
a biofuel composed of an isopropanolbutanolethanol mixture Metabolic Engineering
18 1-8
EDWARDS J S COVERT M amp PALSSON B (2002) Metabolic modelling of microbes
The flux-balance approach Environmental Microbiology 4 133-140
EZEJI T QURESHI N amp BLASCHEK H P (2007a) Butanol production from agricultural
residues Impact of degradation products on Clostridium beijerinckii growth and
butanol fermentation Biotechnology and Bioengineering 97 1460-1469
EZEJI T C QURESHI N amp BLASCHEK H P (2004a) Acetone butanol ethanol (ABE)
production from concentrated substrate Reduction in substrate inhibition by fed-batch
technique and product inhibition by gas stripping Applied Microbiology and
Biotechnology 63 653-658
EZEJI T C QURESHI N amp BLASCHEK H P (2004b) Butanol fermentation research
Upstream and downstream manipulations Chemical Record 4 305-314
EZEJI T C QURESHI N amp BLASCHEK H P (2007b) Bioproduction of butanol from
biomass from genes to bioreactors Current Opinion in Biotechnology 18 220-227
FARRELL R E (2010) RNA Methodologies Laboratory Guide for Isolation and
Characterization Oxford Elsevier Inc
FEIST A M HERRGARD M J THIELE I REED J L amp PALSSON B Atilde (2009)
Reconstruction of biochemical networks in microorganisms Nature Reviews
Microbiology 7 129-143
FEIST A M SCHOLTEN J C M PALSSON B BROCKMAN F J amp IDEKER T
(2006) Modeling methanogenesis with a genome-scale metabolic reconstruction of
Methanosarcina barkeri Molecular Systems Biology 2
FELIX C R amp LJUNGDAHL L G (1993) The cellulosome The exocellular organelle of
Clostridium Annual Review of Microbiology 47 791-819
FENDRI I TARDIF C FIEROBE H P LIGNON S VALETTE O PAGAS S amp
PERRET S (2009) The cellulosomes from Clostridium cellulolyticum Identification of
new components and synergies between complexes FEBS Journal 276 3076-3086
FIEROBE H P GAUDIN C BELAICH A LOUTFI M FAURE E BAGNARA C
BATY D amp BELAICH J P (1991) Characterization of endoglucanase A from
Clostridium cellulolyticum Journal of Bacteriology 173 7956-7962
FISCHER R J HELMS J amp DURRE P (1993) Cloning sequencing and molecular
analysis of the sol operon of Clostridium acetobutylicum a chromosomal locus
involved in solventogenesis Journal of Bacteriology 175 6959-6969
FLYTHE M D amp RUSSELL J B (2006) Fermentation acids inhibit amino acid deamination
by Clostridium sporogenes MD1 via mechanism involving a decline in intracellular
glutamate rather than protonmotive force Microbiology 152 2619-2624
135
FOND O ENGASSER J-M MATTA-EL-AMOURI G amp PETITDEMANGE H (1986)
Acetone butanol fermentation on glucose and xylose I Regulation and kinetics in batch
cultures Biotechnology and Bioengineering 28 160-166
FONTAINE L MEYNIAL-SALLES I GIRBAL L YANG X CROUX C amp
SOUCAILLE P (2002) Molecular characterization and transcriptional analysis of
adhE2 the gene encoding the NADH-dependent aldehydealcohol dehydrogenase
responsible for butanol production in alcohologenic cultures of Clostridium
acetobutylicum ATCC 824 Journal of Bacteriology 184 821-830
FRANCKE C SIEZEN R J amp TEUSINK B (2005) Reconstructing the metabolic network
of a bacterium from its genome Trends in Microbiology 13 550-558
GARDNER J G amp KEATING D H (2010) Requirement of the type II secretion system for
utilization of cellulosic substrates by Cellvibrio japonicus Applied and Environmental
Microbiology 76 5079-5087
GASTEIGER E GATTIKER A HOOGLAND C IVANYI I APPEL R D amp
BAIROCH A (2003) ExPASy The proteomics server for in-depth protein knowledge
and analysis Nucleic Acids Research 31 3784-3788
GELHAYE E GEHIN A amp PETITDEMANGE H (1993) Colonization of crystalline
cellulose by Clostridium cellulolyticum ATCC 35319 Applied and Environmental
Microbiology 59 3154-3156
GIALLO J GAUDIN C amp BELAICH J P (1983) Metabolism of glucose and cellobiose by
cellulolytic mesophilic Clostridium sp strain H10 Applied and Environmental
Microbiology 45 843-849
GIALLO J GAUDIN C amp BELAICH J P (1985) Metabolism and solubilization of
cellulose by Clostridium cellulolyticum H10 Applied and Environmental Microbiology
49 1216-1221
GIRBAL L CROUX C VASCONCELOS I amp SOUCAILLE P (1995) Regulation of
metabolic shifts in Clostridium acetobutylicum ATCC 824 FEMS Microbiology
Reviews 17 287-297
GIRBAL L amp SOUCAILLE P (1994) Regulation of Clostridium acetobutylicum metabolism
as revealed by mixed- substrate steady-state continuous cultures Role of NADHNAD
ratio and ATP pool Journal of Bacteriology 176 6433-6438
GIRBAL L amp SOUCAILLE P (1998) Regulation of solvent production in Clostridium
acetobutylicum Trends in Biotechnology 16 11-16
GREEN E M (2011) Fermentative production of butanol-the industrial perspective Current
Opinion in Biotechnology 22 337-343
GREEN E M BOYNTON Z L HARRIS L M RUDOLPH F B PAPOUTSAKIS E T
amp BENNETT G N (1996) Genetic manipulation of acid formation pathways by gene
inactivation in Clostridium acetobutylicum ATCC 824 Microbiology 142 2079-2086
GREEN M L amp KARP P D (2004) A Bayesian method for identifying missing enzymes in
predicted metabolic pathway databases BMC Bioinformatics
GRUPE H amp GOTTSCHALK G (1992) Physiological events in Clostridium acetobutylicum
during the shift from acidogenesis to solventogenesis in continuous culture and
presentation of a model for shift induction Applied and Environmental Microbiology
58 3896-3902
GUEDON E DESVAUX M PAYOT S amp PETITDEMANGE H (1999a) Growth
inhibition of Clostridium cellulolyticum by an inefficiently regulated carbon flow
Microbiology 145 1831-1838
136
GUEDON E DESVAUX M amp PETITDEMANGE H (2002) Improvement of cellulolytic
properties of Clostridium cellulolyticum by metabolic engineering Applied and
Environmental Microbiology 68 53-58
GUEDON E PAYOT S DESVAUX M amp PETITDEMANGE H (1999b) Carbon and
electron flow in Clostridium cellulolyticum grown in chemostat culture on synthetic
medium Journal of Bacteriology 181 3262-3269
GUEDON E PAYOT S DESVAUX M amp PETITDEMANGE H (2000) Relationships
between cellobiose catabolism enzyme levels and metabolic intermediates in
Clostridium cellulolyticum grown in a synthetic medium Biotechnology and
Bioengineering 67 327-335
GUERRINI O BURLAT B LEGER C GUIGLIARELLI B SOUCAILLE P amp
GIRBAL L (2008) Characterization of two 2[4Fe4S] ferredoxins from Clostridium
acetobutylicum Current Microbiology 56 261-267
HA S J GALAZKA J M KIM S R CHOI J H YANG X SEO J H GLASS N L
CATE J H amp JIN Y S (2011) Engineered Saccharomyces cerevisiae capable of
simultaneous cellobiose and xylose fermentation Proceedings of the National Academy
of Sciences of the United States of America 108 504-509
HARRIS L M BLANK L DESAI R P WELKER N E amp PAPOUTSAKIS E T (2001)
Fermentation characterization and flux analysis of recombinant strains of Clostridium
acetobutylicum with an inactivated solR gene J Ind Microbiol Biotechnol
HARRIS L M DESAI R P WELKER N E amp PAPOUTSAKIS E T (2000)
Characterization of recombinant strains of the Clostridium acetobutylicum butyrate
kinase inactivation mutant Need for new phenomenological models for solventogenesis
and butanol inhibition Biotechnology and Bioengineering 67 1-11
HARTMANIS M G N amp GATENBECK S (1984) Intermediary metabolism in Clostridium
acetobutylicum Levels of enzymes involved in the formation of acetate and butyrate
Applied and Environmental Microbiology 47 1277-1283
HASUNUMA T amp KONDO A (2012) Development of yeast cell factories for consolidated
bioprocessing of lignocellulose to bioethanol through cell surface engineering
Biotechnology Advances 30 1207-1218
HASUNUMA T OKAZAKI F OKAI N HARA K Y ISHII J amp KONDO A (2013) A
review of enzymes and microbes for lignocellulosic biorefinery and the possibility of
their application to consolidated bioprocessing technology Bioresource Technology
135 513-522
HEAP J T KUEHNE S A EHSAAN M CARTMAN S T COOKSLEY C M
SCOTT J C amp MINTON N P (2010) The ClosTron Mutagenesis in Clostridium
refined and streamlined Journal of Microbiological Methods 80 49-55
HEAP J T PENNINGTON O J CARTMAN S T CARTER G P amp MINTON N P
(2007) The ClosTron A universal gene knock-out system for the genus Clostridium
Journal of Microbiological Methods 70 452-464
HEAP J T PENNINGTON O J CARTMAN S T amp MINTON N P (2009) A modular
system for Clostridium shuttle plasmids Journal of Microbiological Methods 78 79-
85
HEDDERICH R (2004) Energy-Converting [NiFe] Hydrogenases from Archaea and
Extremophiles Ancestors of Complex I Journal of Bioenergetics and Biomembranes
36 65-75
HENRY C S BROADBELT L J amp HATZIMANIKATIS V (2007) Thermodynamics-
based metabolic flux analysis Biophysical Journal 92 1792-1805
137
HERRMANN G JAYAMANI E MAI G amp BUCKEL W (2008) Energy conservation via
electron-transferring flavoprotein in anaerobic bacteria Journal of Bacteriology 190
784-791
HIGASHIDE W LI Y YANG Y amp LIAO J C (2011) Metabolic engineering of
Clostridium cellulolyticum for production of isobutanol from cellulose Applied and
Environmental Microbiology 77 2727-2733
HIGHBARGER L A GERLT J A amp KENYON G L (1996) Mechanism of the reaction
catalyzed by acetoacetate decarboxylase Importance of lysine 116 in determining the
pKa of active-site lysine 115 Biochemistry 35 41-46
HOUSTON C L M amp PAPOUTSAKIS E T (1989) Continuous and biomass recycle
fermentations of Clostridium acetobutylicum - Part 2 Novel patterns in energetics and
product-formation kinetics Bioprocess Engineering 4 49-55
HU J ARANTES V amp SADDLER J N (2011) The enhancement of enzymatic hydrolysis
of lignocellulosic substrates by the addition of accessory enzymes such as xylanase is it
an additive or synergistic effect Biotechnology for Biofuels 4
HUumlSEMANN M H W amp PAPOUTSAKIS E T (1989) Comparison between in vivo and in
vitro enzyme activities in continuous and batch fermentations of Clostridium
acetobutylicum Applied Microbiology and Biotechnology 30 585-595
HYDUKE D R LEWIS N E amp PALSSON B O (2013) Analysis of omics data with
genome-scale models of metabolism Molecular BioSystems 9 167-174
ILMEN M DEN HAAN R BREVNOVA E MCBRIDE J WISWALL E
FROEHLICH A KOIVULA A VOUTILAINEN S P SIIKA-AHO M LA
GRANGE D C THORNGREN N AHLGREN S MELLON M DELEAULT K
RAJGARHIA V VAN ZYL W H amp PENTTILA M (2011) High level secretion of
cellobiohydrolases by Saccharomyces cerevisiae Biotechnology for Biofuels
JANATI-IDRISSI R JUNELLES A M EL KANOUNI A PETITDEMANGE H amp
GAY R (1989) Pyruvate fermentation by Clostridium acetobutylicum Biochemistry
and Cell Biology 67 735-739
JANG Y S MALAVIYA A LEE J IM J A LEE S Y EOM M H CHO J H amp
SEUNG D Y (2013) Metabolic engineering of Clostridium acetobutylicum for the
enhanced production of isopropanol-butanol-ethanol fuel mixture Biotechnology
Progress 29 1083-1088
JANKOWSKI M D HENRY C S BROADBELT L J amp HATZIMANIKATIS V (2008)
Group contribution method for thermodynamic analysis of complex metabolic
networks Biophysical Journal 95 1487-1499
JANSSEN H GRIMMLER C EHRENREICH A BAHL H amp FISCHER R J (2012) A
transcriptional study of acidogenic chemostat cells of Clostridium acetobutylicum-
Solvent stress caused by a transient n-butanol pulse Journal of Biotechnology 161
354-365
JENNERT K C B TARDIF C YOUNG D I amp YOUNG M (2000) Gene transfer to
Clostridium cellulolyticum ATCC 35319 Microbiology-Uk 146 3071-3080
JIANG Y XU C DONG F YANG Y JIANG W amp YANG S (2009) Disruption of the
acetoacetate decarboxylase gene in solvent-producing Clostridium acetobutylicum
increases the butanol ratio Metabolic Engineering 11 284-291
JIAO Y NAVID A STEWART B J MCKINLAY J B THELEN M P amp PETT-
RIDGE J (2012) Syntrophic metabolism of a co-culture containing Clostridium
cellulolyticum and Rhodopseudomonas palustris for hydrogen production International
Journal of Hydrogen Energy 37 11719-11726
138
JONES D T amp WOODS D R (1986) Acetone-butanol fermentation revisited
Microbiological Reviews 50 484-524
JONES S W PAREDES C J TRACY B CHENG N SILLERS R SENGER R S amp
PAPOUTSAKIS E T (2008) The transcriptional program underlying the physiology
of clostridial sporulation Genome Biology
JUNELLES A M JANATI-IDRISSI R PETITDEMANGE H amp GAY R (1987) Effect of
pyruvate on glucose metabolism in Clostridium acetobutylicum Biochimie 69 1183-
1190
JUNGERMANN K THAUER R K LEIMENSTOLL G amp DECKER K (1973) Function
of reduced pyridine nucleotide ferredoxin oxidoreductases in saccharolytic Clostridia
Biochimica et Biophysica Acta 305 268-280
KANEHISA M amp GOTO S (2000) KEGG Kyoto Encyclopedia of Genes and Genomes
Nucleic Acids Research 28 27-30
KARAKASHEV D THOMSEN A B amp ANGELIDAKI I (2007) Anaerobic
biotechnological approaches for production of liquid energy carriers from biomass
Biotechnology Letters 29 1005-1012
KARP P D OUZOUNIS C A MOORE-KOCHLACS C GOLDOVSKY L KAIPA P
AHREN D TSOKA S DARZENTAS N KUNIN V amp LOPEZ-BIGAS N (2005)
Expansion of the Biocyc collection of pathwaygenome databases to 160 genomes
Nucleic Acids Research 33 6083-6089
KEIS S SHAHEEN R amp JONES D T (2001) Emended descriptions of Clostridium
acetobutylicum and Clostridium beijerinckii and descriptions of Clostridium
saccharoperbutylacetonicum sp nov and Clostridium saccharobutylicum sp nov
International Journal of Systematic and Evolutionary Microbiology 51 2095-2103
KNOSHAUG E P amp ZHANG M (2009) Butanol tolerance in a selection of microorganisms
Applied Biochemistry and Biotechnology 153 13-20
KOSAKA T NAKAYAMA S NAKAYA K YOSHINO S amp FURUKAWA K (2007)
Characterization of the sol operon in butanol-hyperproducing Clostridium
saccharoperbutylacetonicum strain N1-4 and its degeneration mechanism Bioscience
Biotechnology and Biochemistry 71 58-68
KOVACS K WILLSON B J SCHWARZ K HEAP J T JACKSON A BOLAM DN
WINZER K amp MINTON N P (2013) Secretion and assembly of functional mini-
cellulosomes from synthetic chromosomal operons in Clostridium acetobutylicum
ATCC 824 Biotechnology for Biofuels
KRUUS K ANDREACCHI A WANG W K amp WU J H D (1995) Product inhibition of
the recombinant CelS an exoglucanase component of the Clostridium thermocellum
cellulosome Applied Microbiology and Biotechnology 44 399-404
KUBITSCHEK H E (1990) Cell volume increase in Escherichia coli after shifts to richer
media Journal of Bacteriology 172 94-101
KUMMEL A PANKE S amp HEINEMANN M (2006) Putative regulatory sites unraveled by
network-embedded thermodynamic analysis of metabolome data Molecular Systems
Biology
LEE J JANG Y S CHOI S J IM J A SONG H CHO J H SEUNG D Y TERRY
PAPOUTSAKIS E BENNETT G N amp LEE S Y (2012) Metabolic engineering of
Clostridium acetobutylicum ATCC 824 for isopropanol-butanol-ethanol fermentation
Applied and Environmental Microbiology 78 1416-1423
139
LEE J YUN H FEIST A M PALSSON B amp LEE S Y (2008a) Genome-scale
reconstruction and in silico analysis of the Clostridium acetobutylicum ATCC 824
metabolic network Applied Microbiology and Biotechnology 80 849-862
LEE J YUN H FEIST A M PALSSON B Atilde amp LEE S Y (2008b) Genome-scale
reconstruction and in silico analysis of the Clostridium acetobutylicum ATCC 824
metabolic network Applied Microbiology and Biotechnology 80 849-862
LEE S Y amp PAPOUTSAKIS E T (1999) Metabolic Engineering CRC Press
LEE S F FORSBERG C W amp GIBBINS L N (1985) Cellulolytic activity of Clostridium
acetobutylicum Applied and Environmental Microbiology 50 220-228
LEE S Y PARK J H JANG S H NIELSEN L K KIM J amp JUNG K S (2008c)
Fermentative butanol production by clostridia Biotechnology and Bioengineering 101
209-228
LEHMANN D HONICKE D EHRENREICH A SCHMIDT M WEUSTER-BOTZ D
BAHL H amp LUTKE-EVERSLOH T (2012) Modifying the product pattern of
Clostridium acetobutylicum Physiological effects of disrupting the acetate and acetone
formation pathways Applied Microbiology and Biotechnology 94 743-754
LEHMANN D amp LUTKE-EVERSLOH T (2011) Switching Clostridium acetobutylicum to
an ethanol producer by disruption of the butyratebutanol fermentative pathway
Metabolic Engineering 13 464-473
LEVIN D B ISLAM R CICEK N amp SPARLING R (2006) Hydrogen production by
Clostridium thermocellum 27405 from cellulosic biomass substrates International
Journal of Hydrogen Energy 31 1496-1503
LI Y TSCHAPLINSKI T J ENGLE N L HAMILTON C Y RODRIGUEZ M LIAO
J C SCHADT C W GUSS A M YANG Y amp GRAHAM D E (2012)
Combined inactivation of the Clostridium cellulolyticum lactate and malate
dehydrogenase genes substantially increases ethanol yield from cellulose and
switchgrass fermentations Biotechnology for Biofuels
LOPEZ-CONTRERAS A M MARTENS A A SZIJARTO N MOOIBROEK H
CLAASSEN P A M VAN DER OOST J amp DE VOS W M (2003) Production by
Clostridium acetobutylicum ATCC 824 of CelG a cellulosomal glycoside hydrolase
belonging to family 9 Applied and Environmental Microbiology 69 869-877
LU W CLASQUIN M F MELAMUD E AMADOR-NOGUEZ D CAUDY A A amp
RABINOWITZ J D (2010) Metabolomic analysis via reversed-phase ion-pairing
liquid chromatography coupled to a stand alone orbitrap mass spectrometer Analytical
Chemistry 82 3212-3221
LU Y ZHANG Y H P amp LYND L R (2006) Enzyme-microbe synergy during cellulose
hydrolysis by Clostridium thermocellum Proceedings of the National Academy of
Sciences of the United States of America 103 16165-16169
LUTKE-EVERSLOH T amp BAHL H (2011) Metabolic engineering of Clostridium
acetobutylicum Recent advances to improve butanol production Current Opinion in
Biotechnology 22 634-647
LYND L R CURRIE D CIAZZA N HERRING C amp OREM N (2008) Consolidated
bioprocessing of cellulosic biomass to ethanol using thermophylic bacteria IN WALL
J D HARWWOD C S amp DEMAIN A (Eds) Bioenergy Part I Biotechnology
Washington DC ASM Press
LYND L R VAN ZYL W H MCBRIDE J E amp LASER M (2005) Consolidated
bioprocessing of cellulosic biomass An update Current Opinion in Biotechnology 16
577-583
140
LYND L R WEIMER P J VAN ZYL W H amp PRETORIUS I S (2002) Microbial
cellulose utilization Fundamentals and biotechnology Microbiology and Molecular
Biology Reviews 66 506-577
MAHADEVAN R BOND D R BUTLER J E ESTEVE-NUNEZ A COPPI M V
PALSSON B O SCHILLING C H amp LOVLEY D R (2006) Characterization of
metabolism in the Fe(III)-reducing organism Geobacter sulfurreducens by constraint-
based modeling Applied and Environmental Microbiology 72 1558-1568
MAHADEVAN R BURGARD A P FAMILI I VAN DIEN S amp SCHILLING C H
(2005) Applications of metabolic modeling to drive bioprocess development for the
production of value-added chemicals Biotechnology and Bioprocess Engineering 10
408-417
MAHADEVAN R EDWARDS J S amp DOYLE III F J (2002) Dynamic Flux Balance
Analysis of diauxic growth in Escherichia coli Biophysical Journal 83 1331-1340
MAHADEVAN R amp SCHILLING C H (2003) The effects of alternate optimal solutions in
constraint-based genome-scale metabolic models Metabolic Engineering 5 264-276
MANN M S amp LUTKE-EVERSLOH T (2013) Thiolase engineering for enhanced butanol
production in Clostridium acetobutylicum Biotechnology and Bioengineering 110
887-897
MARTINEZ V S DIETMAIR S QUEK L E HODSON M P GRAY P amp NIELSEN
L K (2013) Flux balance analysis of CHO cells before and after a metabolic switch
from lactate production to consumption Biotechnology and Bioengineering 110 660-
666
MATSUSHIKA A INOUE H KODAKI T amp SAWAYAMA S (2009) Ethanol production
from xylose in engineered Saccharomyces cerevisiae strains Current state and
perspectives Applied Microbiology and Biotechnology 84 37-53
MEINECKE B BERTRAM J amp GOTTSCHALK G (1989) Purification and
characterization of the pyruvate-ferredoxin oxidoreductase from Clostridium
acetobutylicum Arch Microbiol 152 244-50
MENG X CHEN G amp WANG Y (2008) Biodiesel production from waste cooking oil via
alkali catalyst and its engine test Fuel Processing Technology 89 851-857
MES-HARTREE M amp SADDLER J N (1982) Butanol production of Clostridium
acetobutylicum grown on sugars found in hemicellulose hydrolysates Biotechnology
Letters 4 247-252
MEYER C L amp PAPOUTSAKIS E T (1989) Continuous and biomass recycle
fermentations of Clostridium acetobutylicum - Part 1 ATP supply and demand
determines product selectivity Bioprocess Engineering 4 1-10
MEYER C L ROOS J W amp PAPOUTSAKIS E T (1986) Carbon monoxide gasing leads
to alcohol production and butyrate uptake without acetone formation in continuous
cultures of Clostridium acetobutylicum Applied Microbiology and Biotechnology 24
159-167
MINGARDON F CHANAL A TARDIF C amp FIEROBE H P (2011) The issue of
secretion in heterologous expression of Clostridium cellulolyticum cellulase-encoding
genes in Clostridium acetobutylicum ATCC 824 Applied and Environmental
Microbiology 77 2831-2838
MITCHELL W J ALBASHERI K A amp YAZDANIAN M (1995) Factors affecting
utilization of carbohydrates by clostridia FEMS Microbiology Reviews 17 317-329
MOHAND-OUSSAID O PAYOT S GUEDON E GELHAYE E YOUYOU A amp
PETITDEMANGE H (1999) The extracellular xylan degradative system in
141
Clostridium cellulolyticum cultivated on xylan Evidence for cell-free cellulosome
production Journal of Bacteriology 181 4035-4040
MONOT F ENGASSER J M amp PETITDEMANGE H (1984) Influence of pH and
undissociated butyric acid on the production of acetone and butanol in batch cultures of
Clostridium acetobutylicum Applied Microbiology and Biotechnology 19 422-426
MONOT F MARTIN J R PETITDEMANGE H amp GAY R (1982) Acetone and butanol
production by Clostridium acetobutylicum in a synthetic medium Applied and
Environmental Microbiology 44 1318-1324
NAIR R V BENNETT G N amp PAPOUTSAKIS E T (1994) Molecular characterization of
an aldehydealcohol dehydrogenase gene from Clostridium acetobutylicum ATCC 824
Journal of Bacteriology 176 871-885
NAIR R V amp PAPOUTSAKIS E T (1994) Expression of plasmid-encoded aad in
Clostridium acetobutylicum M5 restores vigorous butanol production Journal of
Bacteriology 176 5843-5846
NAKAYAMA S KIYOSHI K KADOKURA T amp NAKAZATO A (2011) Butanol
production from crystalline cellulose by Cocultured Clostridium thermocellum and
Clostridium saccharoperbutylacetonicum N1-4 Applied and Environmental
Microbiology 77 6470-6475
NOLLING J BRETON G OMELCHENKO M V MAKAROVA K S ZENG Q
GIBSON G HONG MEI L DUBOIS J QIU D HITTI J ALDREDGE T
AYERS M BASHIRZADEH R BOCHNER H BOIVIN M BROSS S BUSH
D BUTLER C CARON A CARUSO A COOK R DAGGETT P
DELOUGHERY C EGAN J ELLSTON D ENGELSTEIN M EZEDI J
GILBERT K GOYAL A GUERIN J HO T HOLTHAM K JOSEPH P
KEAGLE P KOZLOVSKY J LAPLANTE M LEBLANC G LUMM W
MAJESKI A MCDOUGALL S MANK P MAO J I NOCCO D PATWELL
D PHILLIPS J POTHIER B PRABHAKAR S RICHTERICH P RICE P
ROSETTI D ROSSETTI M RUBENFIELD M SACHDEVA M SNELL P
SPADAFORA R SPITZER L SHIMER G THOMANN H U VICAIRE R
WALL K WANG Y WEINSTOCK K LAI PENG W WONSEY A XU Q
ZHANG L WOLF Y I TATUSOV R L SABATHE F DOUCETTE-STAMM
L SOUCAILLE P DALY M J BENNETT G N KOONIN E V amp SMITH D
R (2001) Genome sequence and comparative analysis of the solvent-producing
bacterium Clostridium acetobutylicum Journal of Bacteriology 183 4823-4838
NOTEBAART R A VAN ENCKEVORT F H J FRANCKE C SIEZEN R J amp
TEUSINK B (2006) Accelerating the reconstruction of genome-scale metabolic
networks BMC Bioinformatics 7
OH S E ZUO Y ZHANG H GUILTINAN M J LOGAN B E amp REGAN J M
(2009) Hydrogen production by Clostridium acetobutylicum ATCC 824 and
megaplasmid-deficient mutant M5 evaluated using a large headspace volume technique
International Journal of Hydrogen Energy 34 9347-9353
OH Y K PALSSON B O PARK S M SCHILLING C H amp MAHADEVAN R (2007)
Genome-scale reconstruction of metabolic network in Bacillus subtilis based on high-
throughput phenotyping and gene essentiality data Journal of Biological Chemistry
282 28791-28799
OLSON D G MCBRIDE J E JOE SHAW A amp LYND L R (2012) Recent progress in
consolidated bioprocessing Current Opinion in Biotechnology 23 396-405
142
ORTH J D THIELE I amp PALSSON B O (2010) What is flux balance analysis Nature
Biotechnology 28 245-248
OSTERMAN A amp OVERBEEK R (2003) Missing genes in metabolic pathways A
comparative genomics approach Current Opinion in Chemical Biology 7 238-251
PALOSAARI N R amp ROGERS P (1988) Purification and properties of the inducible
coenzyme A-linked butyraldehyde dehydrogenase from Clostridium acetobutylicum
Journal of Bacteriology 170 2971-2976
PALSSON B (2001) Appendix 1 Flux balance analysis primer Nature Biotechnology
PAPOUTSAKIS E T (2008) Engineering solventogenic clostridia Current Opinion in
Biotechnology 19 420-429
PARK C LEE Y J YUP LEE S BIN OH H amp LEE J (2011) Determination of the
intracellular concentrations of metabolites in Escherichia coli collected during the
exponential and stationary growth phases using liquid chromatography-mass
spectrometry Bulletin of the Korean Chemical Society 32 524-530
PARK E Y NARUSE K amp KATO T (2012) One-pot bioethanol production from cellulose
by co-culture of Acremonium cellulolyticus and Saccharomyces cerevisiae
Biotechnology for Biofuels
PEARSON W R amp LIPMAN D J (1988) Improved tools for biological sequence
comparison Proceedings of the National Academy of Sciences of the United States of
America 85 2444-2448
PEGUIN S amp SOUCAILLE P (1995) Modulation of carbon and electron flow in Clostridium
acetobutylicum by iron limitation and methyl viologen addition Applied and
Environmental Microbiology 61 403-405
PENG H FU B MAO Z amp SHAO W (2006) Electrotransformation of
Thermoanaerobacter ethanolicus JW200 Biotechnology Letters 28 1913-1917
PERRET S BELAICH A FIEROBE H P BELAICH J P amp TARDIF C (2004)
Towards designer cellulosomes in clostridia Mannanase enrichment of the
cellulosomes produced by Clostridium cellulolyticum Journal of Bacteriology 186
6544-6552
PETERSEN D J WELCH R W RUDOLPH F B amp BENNETT G N (1991) Molecular
cloning of an alcohol (butanol) dehydrogenase gene cluster from Clostridium
acetobutylicum ATCC 824 Journal of Bacteriology 173 1831-1834
PETITDEMANGE E FOND O CAILLET F PETITDEMANGE H amp GAY R (1983) A
novel one step process for cellulose fermentation using mesophilic cellulolytic and
glycolytic Clostridia Biotechnology Letters 5 119-124
PETITDEMANGE E TCHUNDEN T VALLES S PIRSON H RAVAL G amp GAY R
(1992) Effect of carbon sources on cellulase production by Clostridium cellulolyticum
Biomass and Bioenergy 3 393-402
PRASAD MAHARJAN R amp FERENCI T (2003) Global metabolite analysis The influence
of extraction methodology on metabolome profiles of Escherichia coli Analytical
Biochemistry 313 145-154
PRICE N D PAPIN J A amp PALSSON B O (2002) Determination of redundancy and
systems properties of the metabolic network of Helicobacter pylori using genome-scale
extreme pathway analysis Genome Research 12 760-769
PRICE N D REED J L amp PALSSON B Atilde (2004) Genome-scale models of microbial
cells Evaluating the consequences of constraints Nature Reviews Microbiology 2
886-897
143
QURESHI N (2010) Agricultural residues and energy crops as potentially economical and
novel substrates for microbial production of butanol (a biofuel) CAB Reviews
Perspectives in Agriculture Veterinary Science Nutrition and Natural Resources 5
QURESHI N BOWMAN M J SAHA B C HECTOR R BERHOW M A amp COTTA
M A (2012) Effect of cellulosic sugar degradation products (furfural and
hydroxymethyl furfural) on acetone-butanol-ethanol (ABE) fermentation using
Clostridium beijerinckii P260 Food and Bioproducts Processing 90 533-540
QURESHI N EZEJI T C EBENER J DIEN B S COTTA M A amp BLASCHEK H P
(2008a) Butanol production by Clostridium beijerinckii Part I Use of acid and enzyme
hydrolyzed corn fiber Bioresource Technology 99 5915-5922
QURESHI N SAHA B C amp COTTA M A (2007) Butanol production from wheat straw
hydrolysate using Clostridium beijerinckii Bioprocess and Biosystems Engineering 30
419-427
QURESHI N SAHA B C amp COTTA M A (2008b) Butanol production from wheat straw
by simultaneous saccharification and fermentation using Clostridium beijerinckii Part
II-Fed-batch fermentation Biomass and Bioenergy 32 176-183
QURESHI N SAHA B C HECTOR R E amp COTTA M A (2008c) Removal of
fermentation inhibitors from alkaline peroxide pretreated and enzymatically hydrolyzed
wheat straw Production of butanol from hydrolysate using Clostridium beijerinckii in
batch reactors Biomass and Bioenergy 32 1353-1358
QURESHI N SAHA B C HECTOR R E HUGHES S R amp COTTA M A (2008d)
Butanol production from wheat straw by simultaneous saccharification and
fermentation using Clostridium beijerinckii Part I-Batch fermentation Biomass and
Bioenergy 32 168-175
RAWSTHORNE H DOCK C N amp JAYKUS L A (2009) PCR-based method using
propidium monoazide to distinguish viable from nonviable Bacillus subtilis spores
Applied and Environmental Microbiology 75 2936ndash2939
REED J L FAMILI I THIELE I amp PALSSON B O (2006) Towards multidimensional
genome annotation Nature Reviews Genetics 7 130-141
REN Q CHEN K amp PAULSEN I T (2007) TransportDB A comprehensive database
resource for cytoplasmic membrane transport systems and outer membrane channels
Nucleic Acids Research 35 D274-D279
ROE A J MCLAGGAN D DAVIDSON I OBYRNE C amp BOOTH I R (1998)
Perturbation of anion balance during inhibition of growth of Escherichia coli by weak
acids Journal of Bacteriology 180 767-772
ROE A J OBYRNE C MCLAGGAN D amp BOOTH I R (2002) Inhibition of
Escherichia coli growth by acetic acid A problem with methionine biosynthesis and
homocysteine toxicity Microbiology 148 2215-2222
RUSSELL J B amp WILSON D B (1996) Why Are Ruminal Cellulolytic Bacteria Unable to
Digest Cellulose at Low pH Journal of Dairy Science 79 1503-1509
SABATHE F BLAICH A amp SOUCAILLE P (2002) Characterization of the cellulolytic
complex (cellulosome) of Clostridium acetobutylicum FEMS Microbiology Letters
217 15-22
SALIMI F ZHUANG K amp MAHADEVAN R (2010) Genome-scale metabolic modeling of
a clostridial co-culture for consolidated bioprocessing Biotechnology Journal 5 726-
738
SANG Y L LEE D Y amp TAE Y K (2005) Systems biotechnology for strain
improvement Trends in Biotechnology 23 349-358
144
SAUER U amp DUumlRRE P (1995) Differential induction of genes related to solvent formation
during the shift from acidogenesis to solventogenesis in continuous culture of
Clostridium acetobutylicum FEMS Microbiology Letters 125 115-120
SCHILLING C H EDWARDS J S LETSCHER D amp PALSSON B O (2000a)
Combining pathway analysis with flux balance analysis for the comprehensive study of
metabolic systems Biotechnology and Bioengineering 71 286-306
SCHILLING C H EDWARDS J S amp PALSSON B O (1999) Toward metabolic
phenomics Analysis of genomic data using flux balances Biotechnology Progress 15
288-295
SCHILLING C H LETSCHER D amp PALSSON B O (2000b) Theory for the systemic
definition of metabolic pathways and their use in interpreting metabolic function from a
pathway-oriented perspective Journal of Theoretical Biology 203 229-248
SCHOMBURG I CHANG A EBELING C GREMSE M HELDT C HUHN G amp
SCHOMBURG D (2004) BRENDA the enzyme database Updates and major new
developments Nucleic Acids Research 32 D431-D433
SCHUETZ R KUEPFER L amp SAUER U (2007) Systematic evaluation of objective
functions for predicting intracellular fluxes in Escherichia coli Molecular Systems
Biology 3
SEGRE D VITKUP D amp CHURCH G M (2002) Analysis of optimality in natural and
perturbed metabolic networks Proceedings of the National Academy of Sciences of the
United States of America 99 15112-15117
SENGER R S (2010) Biofuel production improvement with genome-scale models The role
of cell composition Biotechnology Journal 5 671-685
SENGER R S amp PAPOUTSAKIS E T (2008a) Genome-scale model for Clostridium
acetobutylicum Part I Metabolic network resolution and analysis Biotechnology and
Bioengineering 101 1036-1052
SENGER R S amp PAPOUTSAKIS E T (2008b) Genome-scale model for Clostridium
acetobutylicum Part II Development of specific proton flux states and numerically
determined sub-systems Biotechnology and Bioengineering 101 1053-1071
SHAW A J PODKAMINER K K DESAI S G BARDSLEY J S ROGERS S R
THORNE P G HOGSETT D A amp LYND L R (2008) Metabolic engineering of a
thermophilic bacterium to produce ethanol at high yield Proceedings of the National
Academy of Sciences of the United States of America 105 13769-13774
SHEN LAN E I DEKISHIMA Y BAEZ A CHO K M amp LIAO J C (2011) Driving
forces enable high-titer anaerobic 1-butanol synthesis in Escherichia coli Appl
Environ Microbiol
SILLERS R AL-HINAI M A amp PAPOUTSAKIS E T (2009) Aldehyde-alcohol
dehydrogenase andor thiolase overexpression coupled with CoA transferase
downregulation lead to higher alcohol titers and selectivity in Clostridium
acetobutylicum fermentations Biotechnology and Bioengineering 102 38-49
SOUCAILLE P (2010) Process for the biological production of n-butanol with high yield
United states Patent USA
SOUCAILLE P CROUX C amp FIGGE R (2008) Process for chromosomal integration and
DNA sequence replacement in Clostridia United states Patent
SVETLITCHNYI V A KENSCH O FALKENHAN D A KORSESKA S G LIPPERT
N PRINZ M SASSI J SCHICKOR A amp CURVERS S (2013) Single-step
ethanol production from lignocellulose using novel extremely thermophilic bacteria
Biotechnology for Biofuels
145
TARDIF C MAAMAR H BALFIN M amp BELAICH J P (2001) Electrotransformation
studies in Clostridium cellulolyticum Journal of Industrial Microbiology amp
Biotechnology 27 271-274
TOLONEN A C CHILAKA A C amp CHURCH G M (2009) Targeted gene inactivation in
Clostridium phytofermentans shows that cellulose degradation requires the family 9
hydrolase Cphy3367 Molecular Microbiology 74 1300-1313
TOMAS C A WELKER N E amp PAPOUTSAKIS E T (2003) Overexpression of groESL
in Clostridium acetobutylicum results in increased solvent production and tolerance
prolonged metabolism and changes in the cells transcriptional program Applied and
Environmental Microbiology 69 4951-4965
TRACY BP amp ET P (2009) Methods and compositions for genetically engineering clostridia
species
TRIPATHI S A OLSON D G ARGYROS D A MILLER B B BARRETT T F
MURPHY D M MCCOOL J D WARNER A K RAJGARHIA V B LYND L
R HOGSETT D A amp CAIAZZA N C (2010) Development of pyrF-Based genetic
system for targeted gene deletion in Clostridium thermocellum and creation of a pta
mutant Applied and Environmental Microbiology 76 6591-6599
TUMMALA S B JUNNE S G amp PAPOUTSAKIS E T (2003) Antisense RNA
downregulation of coenzyme A transferase combined with alcohol-aldehyde
dehydrogenase overexpression leads to predominantly alcohologenic Clostridium
acetobutylicum fermentations Journal of Bacteriology 185 3644-3653
UPDEGRAFF D M (1969) Semimicro determination of cellulose in biological materials
Analytical Biochemistry 32 420-424
VALLINO J J amp STEPHANOPOULOS G (1993) Metabolic flux distributions in
Corynebacterium glutamicum during growth and lysine overproduction Biotechnology
and Bioengineering 41 633-646
VARMA A amp PALSSON B O (1994) Stoichiometric flux balance models quantitatively
predict growth and metabolic by-product secretion in wild-type Escherichia coli
W3110 Applied and Environmental Microbiology 60 3724-3731
VASCONCELOS I GIRBAL L amp SOUCAILLE P (1994) Regulation of carbon and
electron flow in Clostridium acetobutylicum grown in chemostat culture at neutral pH
on mixtures of glucose and glycerol Journal of Bacteriology 176 1443-1450
WALTER K A BENNETT G N amp PAPOUTSAKIS E T (1992) Molecular
characterization of two Clostridium acetobutylicum ATCC 824 butanol dehydrogenase
isozyme genes Journal of Bacteriology 174 7149-7158
WALTER K A NAIR R V CARY J W BENNETT G N amp PAPOUTSAKIS E T
(1993) Sequence and arrangement of two genes of the butyrate-synthesis pathway of
Clostridium acetobutylicum ATCC 824 Gene 134 107-111
WANG L amp CHEN H (2011) Increased fermentability of enzymatically hydrolyzed steam-
exploded corn stover for butanol production by removal of fermentation inhibitors
Process Biochemistry 46 604-607
WANG L LIU Z WANG T WU X ZHANG C WANG Q amp XING X (2013)
Optimization of culture conditions for Clostridium cellulolyticum Shengwu Gongcheng
XuebaoChinese Journal of Biotechnology 29 392-402
WANG Q Z WU C Y CHEN T CHEN X amp ZHAO X M (2006) Integrating
metabolomics into systems biology framework to exploit metabolic complexity
Strategies and applications in microorganisms Applied Microbiology and
Biotechnology 70 151-161
146
WELCH R W RUDOLPH F B amp PAPOUTSAKIS E T (1989) Purification and
characterization of the NADH-dependent butanol dehydrogenase from Clostridium
acetobutylicum (ATCC 824) Archives of Biochemistry and Biophysics 273 309-318
WIESENBORN D P RUDOLPH F B amp PAPOUTSAKIS E T (1988) Thiolase from
Clostridium acetobutylicum ATCC 824 and Its Role in the Synthesis of Acids and
Solvents Applied and Environmental Microbiology 54 2717ndash2722
WIESENBORN D P RUDOLPH F B amp PAPOUTSAKIS E T (1989a) Coenzyme A
transferase from Clostridium acetobutylicum ATCC 824 and its role in the uptake of
acids Applied and Environmental Microbiology 55 323-329
WIESENBORN D P RUDOLPH F B amp PAPOUTSAKIS E T (1989b)
Phosphotransbutyrylase from Clostridium acetobutylicum ATCC 824 and its role in
acidogenesis Applied and Environmental Microbiology 55 317-322
WIETZKE M amp BAHL H (2012) The redox-sensing protein Rex a transcriptional regulator
of solventogenesis in Clostridium acetobutylicum Applied Microbiology and
Biotechnology 96 749-761
WILLIAMS T I COMBS J C LYNN B C amp STROBEL H J (2007) Proteomic profile
changes in membranes of ethanol-tolerant Clostridium thermocellum Applied
Microbiology and Biotechnology 74 422-432
XIN F amp HE J (2013) Characterization of a thermostable xylanase from a newly isolated
Kluyvera species and its application for biobutanol production Bioresource
Technology 135 309-315
XU C HUANG R TENG L WANG D HEMME C L BOROVOK I HE Q
LAMED R BAYER E A ZHOU J amp XU J (2013) Structure and regulation of the
cellulose degradome in Clostridium cellulolyticum Biotechnology for Biofuels
YAMADA R TANIGUCHI N TANAKA T OGINO C FUKUDA H amp KONDO A
(2011) Direct ethanol production from cellulosic materials using a diploid strain of
Saccharomyces cerevisiae with optimized cellulase expression Biotechnology for
Biofuels
YANG L MAHADEVAN R amp CLUETT W R (2008) A bilevel optimization algorithm to
identify enzymatic capacity constraints in metabolic networks Computers and
Chemical Engineering 32 2072-2085
YANG S J KATAEVA I HAMILTON-BREHM S D ENGLE N L TSCHAPLINSKI
T J DOEPPKE C DAVIS M WESTPHELING J amp ADAMS M W (2009)
Efficient degradation of lignocellulosic plant biomass without pretreatment by the
thermophilic anaerobe Anaerocellum thermophilum DSM 6725 Applied and
Environmental Microbiology 75 4762-4769
YANG X amp TSAO G T (1994) Mathematical modeling of inhibition kinetics in acetone-
butanol fermentation by Clostridium acetobutylicum Biotechnology Progress 10 532-
538
YIM H HASELBECK R NIU W PUJOL-BAXLEY C BURGARD A BOLDT J
KHANDURINA J TRAWICK J D OSTERHOUT R E STEPHEN R
ESTADILLA J TEISAN S SCHREYER H B ANDRAE S YANG T H LEE
S Y BURK M J amp VAN DIEN S (2011) Metabolic engineering of Escherichia coli
for direct production of 14-butanediol Nature Chemical Biology 7 445-452
YU E K C CHAN M K H amp SADDLER J N (1985) Butanol production from cellulosic
substrates by sequential co-culture of Clostridium thermocellum and C acetobutylicum
Biotechnology Letters 7 509-514
147
YU E K C DESCHATELETS L amp SADDLER J N (1984) The bioconversion of wood
hydrolyzates to butanol and butanediol Biotechnology Letters 6 327-332
ZAMBONI N KUMMEL A amp HEINEMANN M (2008) anNET A tool for network-
embedded thermodynamic analysis of quantitative metabolome data BMC
Bioinformatics 9
ZHANG X Z SATHITSUKSANOH N ZHU Z amp PERCIVAL ZHANG Y H (2011)
One-step production of lactate from cellulose as the sole carbon source without any
other organic nutrient by recombinant cellulolytic Bacillus subtilis Metabolic
Engineering 13 364-372
ZHANG Y H P amp LYND L R (2004) Toward an aggregated understanding of enzymatic
hydrolysis of cellulose Noncomplexed cellulase systems Biotechnology and
Bioengineering 88 797-824
ZHAO Y TOMAS C A RUDOLPH F B PAPOUTSAKIS E T amp BENNETT G N
(2005) Intracellular butyryl phosphate and acetyl phosphate concentrations in
Clostridium acetobutylicum and their implications for solvent formation Applied and
Environmental Microbiology 71 530-537
ZHUANG K IZALLALEN M MOUSER P RICHTER H RISSO C MAHADEVAN
R amp LOVLEY D R (2011) Genome-scale dynamic modeling of the competition
between Rhodoferax and Geobacter in anoxic subsurface environments ISME Journal
5 305-316
148
Appendix A supplementary information for chapter 3
The complete metabolite names are provided in the supplementary materials of our paper
publication Salimi et al (2010) Genome-scale metabolic modeling of a clostridial co-culture
for consolidated bioprocessing Biotechnology Journal 5 (7)726-738 available at
httponlinelibrarywileycomdoi101002biot201000159fullsupp-info)
Table A1 The list of none-gene associated reactions in iFS700 C acetobutylicum metabolic model
REACTION EQUATION SUBSYSTEM
4ABZt2r 4abz[e] + h[e] lt==gt 4abz + h Transport
BTNt2r btn[e] + h[e] lt==gt btn + h Transport
H2Ot5 h2o[e] lt==gt h2o Transport
H2td h2 lt==gt h2[e] transport
CO2t co2[e] lt==gt co2 Transport
L-LACt2 h[e] + lac-L[e] lt==gt h + lac-L Transport
ACt6 ac[e] + h[e] lt==gt ac + h Transport
BUTt2 but[e] + h[e] lt==gt but + h Transport
ETOHt1 etoh[e] lt==gt etoh Transport
BTOHt1 btoh[e] lt==gt btoh Transport
Acetont acetone[e] lt==gt acetone Transport
ACTNt actn-R[e] lt==gt actn-R Transport
2PPOHt 2ppoh[e] lt==gt 2ppoh Transport
N2tr n2[e] lt==gt n2 Transport
L-LACt3 h[e] + lac-D[e] lt==gt h + lac-D Transport
SUCD1 [c] fum + (2) fdred + (2) h lt==gt succ + (2) fdox TCA cycle
ORNCD [c] orn --gt pro-L + nh4 Amino acid biosynthesis
NDPK3 [c] atp + cdp lt==gt adp + ctp Purines pyrimidines nucleosides and
nucleotides
DTMPK [c] atp + dtmp lt==gt adp + dtdp Purines pyrimidines nucleosides and
nucleotides
NDPK4 [c] atp + dtdp lt==gt adp + dttp Purines pyrimidines nucleosides and
nucleotides
23 [c] ddcaACP + glyc3p --gt 1ddecg3p + ACP Fatty acid and phospholipid
metabolism
149
REACTION EQUATION SUBSYSTEM
24 [c] myrsACP + glyc3p --gt 1tdecg3p + ACP Fatty acid and phospholipid
metabolism
25 [c] tdeACP + glyc3p --gt 1tdec7eg3p + ACP Fatty acid and phospholipid
metabolism
26 [c] palmACP + glyc3p --gt 1hdecg3p + ACP Fatty acid and phospholipid
metabolism
27 [c] hdeACP + glyc3p --gt 1hdec9eg3p + ACP Fatty acid and phospholipid
metabolism
28 [c] ocdcaACP + glyc3p --gt 1odecg3p + ACP Fatty acid and phospholipid
metabolism
29 [c] octeACP + glyc3p --gt 1odec11eg3p + ACP Fatty acid and phospholipid
metabolism
PGPPH1 [c] h2o + pgp120 --gt pi + pg120 Fatty acid and phospholipid
metabolism
PGPPH2 [c] h2o + pgp140 --gt pi + pg140 Fatty acid and phospholipid
metabolism
PGPPH3 [c] h2o + pgp141 --gt pi + pg141 Fatty acid and phospholipid
metabolism
PGPPH4 [c] h2o + pgp160 --gt pi + pg160 Fatty acid and phospholipid
metabolism
PGPPH5 [c] h2o + pgp161 --gt pi + pg161 Fatty acid and phospholipid
metabolism
PGPPH6 [c] h2o + pgp180 --gt pi + pg180 Fatty acid and phospholipid
metabolism
PGPPH7 [c] h2o + pgp181 --gt pi + pg181 Fatty acid and phospholipid
metabolism
150
REACTION EQUATION SUBSYSTEM
30 [c] tdeACP lt==gt tmrs2eACP Fatty acid and phospholipid
metabolism
31 [c] hdeACP lt==gt tpalm2eACP Fatty acid and phospholipid
metabolism
32 [c] octeACP lt==gt toctd2eACP Fatty acid and phospholipid
metabolism
UAGT3 [c] uaagtmda + (5) gly --gt uaagtmdga + (5) h2o Biosynthesis and degradation of
surface polysaccharides and
lipopolysaccharides
PPTGS2 [c] uaagtmdga --gt pptg1 + h + udcpdp Biosynthesis and degradation of
surface polysaccharides and
lipopolysaccharides
G3PCT [c] ctp + glyc3p + h --gt cdpglyc + ppi Biosynthesis and degradation of
surface polysaccharides and
lipopolysaccharides
UGT_BS [c] (001) 12dgr_CA + (2) udpg --gt (001) d12dg_CA +
(2) h + (2) udp
Biosynthesis and degradation of
surface polysaccharides and
lipopolysaccharides
LIPO4S24_CA [c] (2400) cdpglyc + d12dg_CA --gt (2400) cmp +
(2400) h + lipo4-24_CA
Biosynthesis and degradation of
surface polysaccharides and
lipopolysaccharides
LIPO1S24_CA [c] (2400) cdpglyc + d12dg_CA + (2400) udpg --gt
(2400) cmp + (4800) h + lipo1-24_CA + (2400) udp
Biosynthesis and degradation of
surface polysaccharides and
lipopolysaccharides
LIPO2S24_CA [c] (2400) cdpglyc + d12dg_CA + (2400) uacgam --gt
(2400) cmp + (4800) h + lipo2-24_CA + (2400) udp
Biosynthesis and degradation of
surface polysaccharides and
lipopolysaccharides
LIPO3S24_CA [c] (2400) ala-D + (2400) atp + (2400) cdpglyc +
d12dg_CA + (2400) h2o --gt (2400) amp + (2400) cmp +
(4800) h + lipo3-24_CA + (2400) ppi
Biosynthesis and degradation of
surface polysaccharides and
lipopolysaccharides
151
REACTION EQUATION SUBSYSTEM
TECA1S45 [c] (45) cdpglyc + uacgam + uacmam --gt (45) cmp +
gtca1-45 + (46) h + udp + ump
Biosynthesis and degradation of
surface polysaccharides and
lipopolysaccharides
TECA3S45 [c] (45) cdpglyc + h2o + uacgam + uacmam + (45)
udpg --gt (45) cmp + gtca3-45 + (91) h + (46) udp + ump
Biosynthesis and degradation of
surface polysaccharides and
lipopolysaccharides
TECA2S45 [c] (45) ala-D + (45) atp + (45) cdpglyc + (45) h2o +
uacgam + uacmam --gt (45) amp + (45) cmp + gtca2-45
+ (91) h + (45) ppi + udp + ump
Biosynthesis and degradation of
surface polysaccharides and
lipopolysaccharides
TECA4S [c] (30) h2o + (30) uacgala + (30) udpg --gt (60) h +
tcam + (30) udp + (30) ump
Biosynthesis and degradation of
surface polysaccharides and
lipopolysaccharides
UAG4E [c] uacgam --gt uacgala Biosynthesis and degradation of
surface polysaccharides and
lipopolysaccharides
DHNAOT7 [c] dhna + hepdp + nad --gt 2dmmq7 + co2 + nadh +
ppi
Biosynthesis of cofactors prosthetic
groups and carriers
NPHS [c] sbzcoa --gt coa + dhna Biosynthesis of cofactors prosthetic
groups and carriers
HEXTT [c] hexdp + ipdp --gt hepdp + ppi Fatty acid and phospholipid
metabolism
PPTT [c] ipdp + pendp --gt hexdp + ppi Fatty acid and phospholipid
metabolism
GGTT [c] ggdp + ipdp --gt pendp + ppi Fatty acid and phospholipid
metabolism
FRTT [c] frdp + ipdp --gt ggdp + ppi Fatty acid and phospholipid
metabolism
152
REACTION EQUATION SUBSYSTEM
IPDPS [c] h + h2mb4p + nadh --gt h2o + ipdp + nad Fatty acid and phospholipid
metabolism
IPDDI [c] ipdp lt==gt dmpp Fatty acid and phospholipid
metabolism
SUCBZL [c] atp + coa + sucbz --gt amp + ppi + sbzcoa Coenzymes and prosthetic groups
SUCBZS [c] 2shchc --gt h2o + sucbz Coenzymes and prosthetic groups
2S6HCCi [c] akg + h + ichor --gt 2shchc + co2 + pyr Coenzymes and prosthetic groups
ICHORS [c] chor lt==gt ichor Coenzymes and prosthetic groups
FNOR2 [c] (2) fdox + nadh lt==gt (2) fdred + nad + h Fermentation
FNOR3 [c] (2) fdox + nadph lt==gt (2) fdred + nadp + h Fermentation
37 gcald lt==gt gcald[e] Transport
AHC [c] h2o + ahcys lt==gt adn + hcys-L Amino acid biosynthesis
38 [c] h + ethap + h2o --gt etha + pi Fatty acid and phospholipid
metabolism
153
Appendix B supplementary information for chapter 3
B-1 Extraction of intracellular metabolites from Clostridium acetobutylicum cell cultures
Intracellular metabolite extraction from the cell cultures was performed according to the
method described by Maharajan et al (2003) Briefly the bacterial cultures were centrifuged at
5000 x g for 20 min at room temperature The pellets were further washed 2-3 times with
milliQ water and centrifuged to remove traces of the culture medium The pellets were
resuspended in 0025 mL milliQ water after respective dry weight measurements and were
further subjected to extraction with hot methanol To the cell suspensions 075-10 mL of hot
Methanol water (21 vv) was added After thorough mixing the tubes were incubated for 30
min at 70C with brief vortexing at regular intervals After incubation the suspensions were
centrifuged (Eppendorf centrifuge) for 10 min (maximum speed) and the supernatant was
transferred to a new tube The metabolite extracts (supernatant) was further dried and stored in
the freezer at -20 C until further analysis
B-2 NMR sample preparation
The dried samples were reconstituted in 250 μL H2O 50 μL of 50 mM NaH2PO4 buffer (pH 7)
35 μL of D2O and 15 μL of a standard buffer solution (1166 mM DSS (disodium-22-dimethyl-
2-silapentane-5-sulphonate and 047 NaN3 in H2O) was added to the sample The sample
was vortexed for 1 minute and sonicated for 30 minutes and then transferred to a standard
Shigemi microcell NMR tube for subsequent spectral analysis
B-3 NMR spectroscopy
All 1H-NMR spectra were collected on a 500 MHz Inova (Varian Inc Palo Alto CA)
spectrometer equipped with a 5 mm HCN Z-gradient pulsed-field gradient (PFG) room-
temperature probe 1H-NMR spectra were acquired at 25 degC using the first transient of the TN-
NOESY presaturation pulse sequence which was chosen for its high degree of quantitative
accuracy Spectra were collected with 256 transients using a 4 s acquisition time and a 1 s
recycle delay
154
B-4 NMR compound identification and quantification
All FIDs were zero-filled to 64k data points and subjected to line broadening of 05 Hz The
singlet produced by the DSS methyl groups was used as an internal standard for chemical shift
referencing (set to 0 ppm) and for quantification All 1H-NMR spectra were processed and
analyzed using the Chenomx NMR Suite Professional software package version 60 (Chenomx
Inc Edmonton AB) The Chenomx NMR Suite software allows for qualitative and
quantitative analysis of an NMR spectrum by manually fitting spectral signatures from an
internal database to the spectrum Specifically the spectral fitting for each metabolite was done
using the standard Chenomx 500 MHz metabolite library Typically 90 of all visible peaks
were assigned to a compound and more than 90 of the spectral area could be routinely fit
using the Chenomx spectral analysis software Most of the visible peaks are annotated with a
compound name It has been previously shown that this fitting procedure provides absolute
concentration accuracies of 90 or better Each spectrum was processed and analyzed by at
least two NMR spectroscopists to minimize compound misidentification and misquantification
We used sample spiking to confirm the identities of assigned compound Sample spiking
involves the addition of 20-200 μM of the suspected compound to selected clostridium samples
and examination whether the relative NMR signal intensity changed as expected
B-5 Method for thermodynamics-based metabolic flux analysis
(TMFA) formulation
Thermodynamics-based metabolic flux analysis (TMFA) integrates thermodynamic constraints
into a constraint-based metabolic model to generate thermodynamically feasible fluxes through
the metabolic network and to provide data on feasible metabolite activity ranges and ∆rGacute
(Henry et al 2007) The ∆rGacute0 of the reactions required for thermodynamic constraints are
estimated using an improved group contribution method (Jankowski et al 2008) and are
adjusted for the cytosol ionic strength The mixed integer linear constraints include mass
balance equations for each metabolite in the network and the second law of thermodynamics
on each reaction considering the uncertainties in ∆rGacute0
values Furthermore a flux variability
analysis (FVA) analysis of the Ecoli metabolic model iJR904 demonstrated that
thermodynamic constraints can restrict the net flux through the thermodynamically infeasible
loops to zero while the effect of ionic strength was shown to be in the range of uncertainties in
155
∆rGacute0
values Also a thermodynamic variability analysis (TVA) analysis introduced the
reactions with highly negative ∆rGacute0
values as candidates for regulatory control points (Henry
et al 2007)
Assuming a closed system and constant pressure according to the second law of
thermodynamics a reaction occurs only in the direction of negative ΔrG so ΔrG lt0 forall rgt0 and
ΔrG gt0 forall rlt0 where r is the reaction rate and a negative rate means the flux in the backward
direction (Kummel et al 2006) The following formulation is applied in TMFA (Henry et al
2007)
Maximization of an objective function (eg growth rate)
Subject to
Nv = 0 (a-1)
0 le vi le zivmax i = 1 hellip r (a-2)
ΔrGiprime - K+Kzi lt0 i = 1 hellip r | ΔrGiprime0 is known (a-3)
ΔrGiprime0
+RT
m
j 1
nij ln(xj)= ΔrGiprime i = 1 hellip r+L | ΔrGiprime
0 is known (a-4)
ΔrGiprime -Kyi lt 0 i = r hellip r+L (a-5)
yi +
r
j 1
αij zj le
r
j 1
αij i = r hellip r+L (a-6)
Where N is the m x r stoichiometric matrix and v is the 1 x r flux vector The total number of
reactions (r) is higher than this value in the metabolic model since each reversible reaction is
split into separate forward and backward directions so all reactions have zero or positive
fluxes The zi a binary value for each reaction is zero if the flux is equal to zero and is equal
to one if the flux is positive The vmax is the upper flux limit which is set at a very large value
(1000 mmolgrDCW hr) Equations (a-3 a-4) ensure that the flux distributions and activity
profiles satisfy the second law of thermodynamics The constant K is a very large positive value
that always satisfies Equation (a-3) when vi and z are equal to zero
Equation (a-4) is the Gibbs free energy equation and ln(xj) is the natural logarithm of the
activity of compound xj and nij is the stoichiometric coefficient of that compound in the ith
156
reaction The reactions for which ∆rGacute0
cannot be estimated are lumped into overall reactions
with known ∆rGacute0 and equations (a-5 a-6) are the thermodynamic constraints for these
reactions The αij is equal to one if the reaction j is one of the reactions which compose the
reaction i and L is the number of them The ln(xj) vi ∆rGiacute are the continuous independent
variables and zi and yi are the binary variables of this optimization problem The TMFA
results can be validated using the metabolomic data We used the group contribution method to
determine the ∆rGacute0
of all reaction (Jankowski et al 2008)
157
Appendix C supplementary information for chapter 4
Figure A1 Dynamic Multi-species Metabolic Modeling framework (DMMM) (Zhuang et al 2011) used for
developing the clostridial co-culture metabolic model In this model μ is the cell biomass growth rate ViA
and ViB are the fluxes of metabolite i predicted by genome-scale metabolic models of each species in the co-
culture X is the cell biomass concentration [Si] is the concentration of ith
metabolite and Ks i is the
saturation constant for ith
metabolite
158
Appendix D supplementary information for chapter 5
D-1 Primer design and qPCR standard plasmid DNA preparation
The qPCR primers have been designed to target the 16S rRNA genes in C acetobutylicum
(CA_Cr001) and C cellulolyticum (Ccel_R0007) (Table A2) Primers were designed using
OligoAnalyzer31 (httpwwwidtdnacomanalyzerApplicationsOligoAnalyzer) and
Sequence Massager (httpwwwattotroncomcybertoryanalysisseqMassagerhtm) Criteria
for designing primers were as follows
1- Primers size should be 19-24 bp and qPCR amplicon size should be 250-300 bp
2- Primers GC content must be 40-60
3- Melting temperature (Tm) for reverse and forward primers should be the same and not
differ more than 2˚C
4- At both ends of the primer sequences it is preferable to have GC and no long stretch
of any base is desired
5- Long stretches of GC (longer than 3) in the last 5 bases of primers 3rsquo end must be
avoided
6- Hairpins melting temperatures must be far below primers melting temperature
7- Hetero-dimers and homo-dimers size must be smaller than 13 of the primer sequence
and homohetero-dimers formation ΔG must be higher than -9kcalmol
8- 16S rRNA genes of both species must be aligned to find conserved regions using
BLASTn (httpwwwncbinlmnihgovblast) and the primers must be in the regions
with at least two mismatches for each primer to ensure reaction specificity
Table A2Primer sequences used for qPCR analysis
Primer name Target species Primer sequence (5-3) Product
length
Tm
CA2 (forward) C acetobutylicum CTTGTTGGTGAGGTAACGG 386 bp 60degC
CA2 (reverse) C acetobutylicum CACTCCAGACATCCAGTTTG
CC2 (forward) C cellulolyticum TACAGGGGGATAACACAGG 348 bp 60degC
CC2 (reverse) C cellulolyticum CGTGGCTTATTCTTCAGGTAC
Primer stocks of 50microM in 10mM Tris buffer with 01mM EDTA were stored at -20˚C and
working stocks of 5microM were used in PCR reactions per following protocol
159
Table A3 PCR protocol
Stage Time Temperature (degC) Cycles
Initial Denaturation 5min 95 x1
Denaturation 30sec 95 x30
Annealing 30sec 55
Extension 30sec 72
Adding an A overhang 10 min 72 x1
The qPCR standard plasmid solutions for each target species were prepared by cloning the
purified PCR products into pCRreg
21-TOPOreg
vector using TOPO-TA Cloningreg
kit
(Invitrogentrade K4500-01) In the first step fresh PCR products were purified using GeneJET
PCR Purification Kit (Fermentas K0701K0702) the nucleic acid concentrations in purified
PCR products were measured to be 67 and 50 ngmicrol for C acetobutylicum and C cellulolyticum
respectively using NanoDrop 1000 (Thermo Scientific) spectrophotometer and PCR products
purity were verified by gel electrophoresis
To set up the cloning reaction 4 microL of this purified PCR product was incubated with 1 microL of
TOPOreg
vector solution for 5 min at room temperature subsequently 2 microL of the cloning
reaction product was incubated with TOP10reg
OneShot Chemically Competent Ecoli cells on
ice for 10 minutes The mixture was then heat-shocked at 42˚C for 30s and transferred
immediately on ice After adding 250 microL of SOC medium the culture was cultivated for 1
hour in an incubator at 200 rpm and 37˚C
To screen for positive clones 20 microL 50 microL and 200 microL of the culture were plated on LB agar
plates containing 50 mgL kanamycin and X-gal (40 microL of 40 mgmL in DMF) spread on the
surface of the solid agar medium Plates were incubated overnight at 37˚C and refrigerated at
4˚C on the next morning Potential positive clones appearing as white colonies were examined
and verified by running colony PCR and gel electrophoresis Afterward 3 positive clones for
each species were selected and transferred into 5 mL of LB (containing 50 mgL kanamycin)
liquid medium to be cultivated overnight at 37˚C and 200 rpm Glycerol stocks of the clones
were prepared by putting 800 microL of each cloned culture into 200 microL of 70 glycerol solution
and stored in a -80degC freezer
Plasmid extraction was conducted using the GenElute Plasmid Miniprep kit (Sigma-Aldrich
USA) and 2 mL of clone cultures All of the extracted plasmids were sequenced at the
University of Toronto Sanger Sequencing Facility and the plasmids with right inserts were
160
selected and applied for qPCR calibration The Plasmid DNA solutions were homogenized by
flicking the eppendorf tube several times and then spinning the tube in a mini-centrifuge The
concentration of plasmids in each solution was measured using 1 microL of each sample on a
NanoDrop 1000 (Thermo Scientific) spectrophotometer in duplicates and they are shown in
Table A4
Table A4 Plasmid standard solutions used for qPCR calibration
Species Plasmid Plasmid Size (bp) Nanodrop Concentration (ngmicroL) Gene
CopiesmicroL
C acetobutylicum CA4(1) 4286 602 128E+10
C cellulolyticum CC10 4248 854 183E+10
D-2 qPCR reaction preparation
Primer stocks of 50 microM in 10 mM Tris buffer with 01 mM EDTA were stored at -20degC and
aliquots of 5 microM primer stocks were prepared and used in qPCR reaction preparations to
circumvent potential degradation of the primer sequences in multiple freeze-thaws The qPCR
amplification was performed using 2 μL of tenfold diluted sample genomic DNA and 18 μL of
a master mix in a total reaction volume of 20 μL A master mix was prepared for each qPCR
run whereby the reagents for the individual reactions were combined prior to plate preparation
in order to minimize error Master mixes were prepared by combining 10 μL of SsoFasttrade
EvaGreenreg Supermix (Bio-Rad 172-5200) 1 μL of each primer with final concentration of
025 μM and 6 μL of water for each reaction
The qPCR reaction was prepared in White Individual PCR TubesTM
ndash Low Tube Strip (Bio-
Rad USA) each strip containing eight 02 mL reaction wells 18 microL of the master mix was put
into each well and then 2 microL of DNA was added to each well with a fresh pipette tip and the
full strip was capped with Ultra Clear Cap Strips (Thermo Scientific USA) The negative
controls (NTC) were placed in the same strip that samples were placed in and they only
contained an 18 microL volume as no DNA was added to these wells The qPCR amplifications and
detections were carried out in a CFX96trade Real-Time PCR Detection System (Bio-Rad
Laboratories Inc) The qPCR protocol took place following the protocol in Table A5 Running
qPCR temperature gradient tests on both plasmid solutions showed that 60˚C was the optimal
annealing temperature (Ta) for qPCR runs
161
Table A5 qPCR protocol
Stage Time Temperature Cycles
Stage 1
Initial Denaturation slow ramp rate to 2˚Csec 3min 98degC x1
Stage 2
Denaturation slow ramp rate to 2˚Csec 5sec 98degC
x40 Annealing and Extension 10sec Ta
Plate Read
Stage 3
Melting Curve increment 05˚C for 5sec 65-95degC
x1 Plate Read
D-3 qPCR calculations and quantifications
To calculate the concentration of DNA copies in the plasmid standard solutions (Table A4) the
total plasmid size including the length of the pCRreg
21-TOPOreg
vector (39 kbp) was taken into
account and it was assumed that there is 1 gene copy per 1 molecule of plasmid Also 1 mol of
bp = 660 g (Farrell 2010) and Avogadrorsquos Constant = 6023times1023
moleculesmol
For example in CA4(1) plasmid standard solution using the data from Table A4
The mass of one CA4(1) plasmid molecule = 4286 (bp) times 660 (gmol bp) 6023 times 1023
(bpmol
bp) = 469 times 10-18
(gcopy)
So the quantity of plasmids in 1 microL plasmid solution with a concentration of 602 ngmicroL is
obtained by
602 times 10-9
(gmicroL)469 times10-18
(gcopy) = 128 times 1010
(copiesmicroL)
Furthermore there are eleven 16S rRNA genes in C acetobutylicum genome (CA_Cr001
CA_Cr004 CA_Cr007 CA_Cr010 CA_Cr013 CA_Cr016 CA_Cr019 CA_Cr022
CA_Cr025 CA_Cr028 CA_Cr033) and eight 16S rRNA genes in C cellulolyticum genome
(Ccel_R0007 Ccel_R0018 Ccel_R0088 Ccel_R0084 Ccel_R0059 Ccel_R0012
Ccel_R0024 Ccel_R0036) Multiple sequence alignment of the 16S rRNA genes for each
species using ClustalW2 (httpwwwebiacukToolsmsaclustalw2) showed identical
amplification regions for each set of 16S rRNA genes therefore 8 amplicons with the same size
are being produced per copy of C cellulolyticum genome in a qPCR reaction and 11
162
amplicons with the same size are being produced per copy of C acetobutylicum genome in a
qPCR reaction these facts also were verified by observing single peaks in melting curve
analysis as well as single DNA bands for each species in agarose gel electrophoresis runs
Therefore to calculate the concentration of cells (cellmL) in samples using qPCR data of the
16S rRNA gene quantifications (copiesmicroL) the number of 16S rRNA genes in the genome
(n16s) the volume of the culture from which genomic DNA was extracted (Vc) and the volume
of extracted DNA (400 microL) must be taken into account as below
Concentration (cellmL) = concentration (copiesmicroL) times 400 microL times dilution factor (Vc times n16s)
Vc was 05 mL n16s was equal to 11 for C acetobutylicum and equal to 8 for C cellulolyticum
After the plasmid standards were prepared a 109
copiesmicroL solution of each plasmid was made
and stored in a -20degC freezer (2 microL DNA in 20 microL final volume) along with 1 tube of the stock
1010
copiesmicroL plasmid solution For each qPCR run a new standard curve was made using fresh
dilutions where the standard curve concentrations of 108
copiesmicroL to 101
copiesmicroL were
prepared by making serial 110 dilutions starting with the 109
copiesmicroL plasmid solution (5 microL
DNA in 45 microL of sterile UV treated DNaseRNase-Free distilled water)
A qPCR amplification plot shows the fluorescent signal which is proportional to the amount of
amplified product in the tube versus cycle number The amplification plot shows two phases
an exponential phase followed by a plateau phase During the exponential phase the amount of
the PCR product approximately doubles in each cycle As the reaction precedes the reaction
components are being consumed and eventually one or more of the components becomes
limiting At this point the reaction slows and enters the plateau phase
For all qPCR runs the qPCR signals were analyzed at a standard pre-determined threshold of
1E+03 RFU which was in the exponential amplification phase and above the background
fluorescence noise for all the qPCR runs The quantification cycles (Cq or CT) the cycle
number where fluorescence increases above the threshold were used to find the DNA copy
numbers (automatically calculated from the standard curve) For each qPCR run a standard
curve was constructed by plotting the log of the starting quantity in standard plasmid serial
dilutions (108
copiesmicroL to101
copiesmicroL) against the CT values obtained during amplification of
each dilution
163
Table A6 qPCR standard curves used for the quantifications of C acetobutylicum (CA) and C
cellulolyticum (CC) in the co-culture and mono-culture experiments
Run date Target
species
R2 Amplification
efficiency ()
slope y-intercept
08092011 CA 0997 963 -34 385
17012012 CA 0993 1064 -32 363
16052012 CA 0993 1007 -33 378
20072012 CA 0996 979 -34 396
01112012 CA 0996 904 -36 401
07092011 CC 0996 951 -34 373
01122011 CC 0996 981 -34 382
16012012 CC 0995 900 -36 400
20072012 CC 0997 936 -35 386
12062012 CC 0987 997 -33 368
To examine the quality and optimality of qPCR assay for accurate and reproducible
quantification of the genomic DNA samples following criteria have been applied
bull Linear standard curve with coefficient of determination (R2) gt 0980
bull High amplification efficiency (90ndash110) where Amplification efficiency E is calculated
from the slope of the standard curve (E = 10ndash1slope
) and Efficiency = (E ndash 1) times100
bull Consistency across replicate reactions
Furthermore to verify the qPCR product specificity a melt-curve analysis was conducted after
each amplification stage as shown in Figure A2 Melting curve analyses for C cellulolyticum
qPCR runs showed two peaks (Figure A2b) Therefore to ensure the qPCR product purity a
gel electrophoresis run was conducted on the qPCR products where only a single band with the
right size (348 bp) was obtained as shown in Figure A3 This test confirmed that the small
peak on the melting curve might be due to the secondary structure of the qPCR products and
not due to the formation of primer-dimers or other products in qPCR runs To account for intra-
plate variability (pipetting error) duplicates of each sample and standard were run and the
average of these two values was taken whereas the measurements were repeated for the
samples with CT ranges larger than one
164
0
500
1000
1500
2000
2500
650 700 750 800 850 900 950
dR
FUd
T
Temperature (deg C)
CA qPCR assay
0
500
1000
1500
2000
60 65 70 75 80 85 90 95 100
dR
FUd
T
Temperature (deg C)
CC plasmid CC sample DNA
Figure A2 Derivative melting curves for (a) a C acetobutylicum qPCR assay (b) C cellulolyticum qPCR
assays using standard plasmid solution (105 copiesmicroL) and isolated genomic DNA
a
b
165
Figure A3 Gel electrophoresis image of the qPCR amplifications with C cellulolyticum as the target
species All qPCR products had a single band with different intensities which confirmed the qPCR product
purity
D-4 qPCR primers cross-specificity test
As it was discussed in the previous section the qPCR standard curve is linear as there is a
linear relationship between CT and DNA sample size However in DNA mixtures where the
concentration of target DNA is low and in presence of high copy numbers of non-target DNA
some non-linearity effects are observed in qPCR analyses this phenomenon is due to non-
specific PCR reactions that lead to lower CT values in dilute DNA samples
To address this matter cross-specificity tests were conducted on mixtures of CA4(1) and CC10
plasmids Plasmid combinations of 10x+10
y copiesmicroL were prepared where 0le x y le 8 and
x+y=8 and 10x is the concentration of CA4(1) and 10
y is the concentration of CC10 in the
mixture Master mixes were prepared using both sets of primers for the two species and qPCR
runs were conducted on each set of plasmid combinations With CA4(1) as the target plasmid
the data showed that at high concentrations of CC10 (at and above106
copymicroL) CT is
decreasing while decreasing the concentration of CA4(1) from 102 to 1 copy microL The same
trend was observed when targeting CC10 in the plasmid mixtures and the results of these tests
are presented in Figure A4 Although in actual qPCR runs the target DNA molecules are
Standard plasmid (CC10 10
6 copiesmicroL) Genomic DNA samples
1Kb ladder
166
genomic DNA rather than small plasmid molecules where the PCR target is highly available
and this availability may increase the odds of non-specific PCR reactions this non-linearity can
lead to over-quantification of each species in unknown samples
00
100
200
300
400
0 1 2 3 4 5 6 7 8
CT
CA4(1) plasmid conc (log copy number)
a cross-specificity test with CA as the target species standard curve
00
50
100
150
200
250
300
350
0 1 2 3 4 5 6 7 8
CT
CC10 plasmid conc (log copy number)
b cross-specificity test with CC as the target species standard curve
Figure A4 Cross-specificity tests for C acetobutylicum (a) and C cellulolyticum (b) plasmids using qPCR
plasmid combinations in contrast to the standard curves Plasmid combinations of 10x+10
y copiesmicroL were
prepared where 0le x y le 8 and x+y=8 and 10x is the concentration of CA4(1) and 10
y is the concentration
of CC10 in the mixture
To resolve this issue primer specificity tests were conducted using pure genomic DNA
solutions pure C acetobutylicum and C cellulolyticum genomic DNA solutions with 67 and
64 ngmicroL of DNA respectively were applied Negative control qPCR experiments on pure
non-target genomic DNAs resulted in CT values far higher than the maximum significant CT
limits corresponding to 101
copymicroL of target plasmids for each species and therefore were
outside the range of valid data for qPCR quantifications Consequently in order to tackle non-
167
specific qPCR reactions the concentration of genomic DNA in all unknown samples were kept
below 6 ngmicroL and qPCR assays were conducted on 10 times diluted DNA samples All the
genomic DNA dilutions were stored at -20˚C before qPCR analyses
D-5 Genomic DNA isolation
Initially the Mo Bio Laboratories UltraCleanreg Soil DNA Isolation Kit was applied to extract
DNA from the samples 5 mL of culture was filtered through Millipore SterivexTM
filters (022
microm pore size) and filters were frozen at -80˚C before DNA extraction However it was
demonstrated that there was no correlation between culture size and the DNA yield using this
kit for co-culture samples as the same amount of DNA was extracted from 02 1 2 and 5 mL
of cultures in fact this kit has been aimed for soil samples where the concentrations of cell
biomass is typically low and therefore there was a chance to miss significant amount of DNA
in the co-culture samples A Comparison of C acetobutylicum and C cellulolyticum biomass
profiles in a co-culture using genomic DNA obtained by Norgen and Mo-Bio DNA isolation
kits are presented in Figure A5
Consequently DNA isolation using Norgen bacterial genomic DNA isolation kit (Norgen
17900) was tested and it was found that there was a correlation between the sample size (in
the range of 02 to 05 mL) and DNA yield using Norgen kit while it had a higher DNA yield
compared to the Mo Bio kit Therefore the Norgen kit was chosen for DNA isolations culture
samples (05 mL) were centrifuged at 13000 g for 2 minutes and the cell pellets were used for
DNA isolations following the standard kit protocol where 400 microL elution buffer was used
lastly to elute DNA in two steps (200 microL for each dilution step)
168
10E+04
10E+05
10E+06
10E+07
10E+08
10E+09
10E+10
0 5 10 15 20 25 30
Ce
ll co
nc
(ce
llm
L)
Time (day)
(a) C acetobutylicum qPCRNorgen MoBio
100E+04
100E+05
100E+06
100E+07
100E+08
100E+09
100E+10
0 5 10 15 20 25 30
Cel
l co
nc
(cel
lm
L)
Time (day)
(b) C cellulolyticum qPCR Norgen MoBio
Figure A5 A comparison of C acetobutylicum (a) and C cellulolyticum (b) quantifications in a co-culture
experiment using Norgen and Mo-Bio DNA isolation kits
169
D-6 Examination of the specificity of the interactions between C cellulolyticum and C acetobutylicum in the co-culture
In order to examine the specificity of the synergism in the clostridial co-culture and to find
out if another microbial species would also have similar metabolic interactions with C
cellulolyticum in a co-culture we tried E coli strain C and C cellulolyticum co-cultures
Co-culture experiments were conducted on VM medium (Higashide et al 2011) in serum
bottles with 3 bottles of C cellulolyticum as control experiment E coli was inoculated to
the co-culture bottles simultaneously at the beginning of batch or after 4 days (sequential)
into C cellulolyticum cultures The t-test analysis of the TOC data after 28 days showed
that the difference in the mean values of the two groups (C cellulolyticum mono-culture
and sequential co-culture) was not great enough to reject the possibility that the difference
is due to random sampling variability and there was not a statistically significant difference
between the input groups (P = 0133) Therefore no significant improvement in the co-
culture cellulolytic activity compared to the control C cellulolyticum culture was observed
(data presented in Figure A6)
Also inoculation of E coli to the C cellulolyticum culture simultaneously led to no
cellulolytic activity in the co-culture possibly due to immediate pH drop in the culture
However this experiment has been conducted under unregulated pH condition and the final
pH in all bottles were about 55 which is below the optimal pH range for cellulolytic
activity therefore running this co-culture under pH controlled condition and the pH profile
that has been used for clostridial co-culture would be more insightful
Figure A6 Cellulolytic activities in the sequential co-culture of E coli and C cellulolyticum and the mono-
culture of C Cellulolyticum (control)
170
D-8 Time profiles of the product formations in the clostridial co-culture experiment
replicate 1
replicate 1
171
00
10
20
30
40
50
60
70
0 5 10 15 20 25 30
Co
nce
ntr
atio
n (g
l)
Time (day)
lactate acetate ethanol
Replicate 2
0
002
004
006
008
01
012
014
016
018
02
0 5 10 15 20 25 30
Co
nce
nta
rtio
n (
gl
)
Time (day)
butyrate butanol pyruvate
replicate 2
Figure A7 Time profiles of fermentation products in the co-culture set A replicate experiments Pyruvate
uptake and butanol formation were observed in the co-cultures
D-9 Identifying potential exchanged metabolites in the co-culture
To address this question if any metabolite exchange in the co-culture enables C cellulolyticum
to grow and degrade cellulose in the co-culture the extracellular metabolite pools were
characterized in the co-culture and mono-culture samples from each batch two samples in
early and mid exponential growth phases as demonstrated by arrows in Figure A8 were
analyzed using NMR technique at Chenomx Laboratory (httpwwwchenomxcom) The data
172
are reported in Table A7 and the concentrations of 38 compounds have been measured in total
of 8 co-culture and mono-culture samples
2
1
173
Figure A8 (ab) The extracellular metabolomic samples 1 2 4 and 5 were taken from co-culture
experiments set A (replicates a b) as shown by arrows The time profiles of C cellulolyticum (circle) C
acetobutylicum (square) and cellulose solubilization in terms of total organic carbon in each co-culture
(triangle) (c) samples 6 7 were taken from C cellulolyticum mono-culture experiment at pH of 72 and
samples A and B were taken from C cellulolyticum mono-culture experiment under pH profile (data has
also been presented in Figure 5-3) where the cell biomass profile in the mono-culture at pH of 72 (circle)
TOC profile in the mono-culture at pH of 72 (triangle) cell biomass profile in the mono-culture under pH
profile (rhombus) and TOC profile in the mono-culture under pH profile (square)
7
6
A
B
C
4
5
174
Comparing the metabolite concentrations in the mono-culture supernatants in the
mono-culture under pH profile the concentration of negatively charged amino acids
aspartate and glutamate have increased significantly this observation is consistent with
the glutamate efflux in C sporogenes MD1 culture under acidic pH conditions and in
presence of acetate lactate and propionate ions (Flythe and Russell 2006) while under
acidic pH conditions and in absence of weak acids neither glutamate efflux nor growth
inhibition of C sporogenes cells by intracellular anion accumulation have been
observed Furthermore it has been shown that in E coli culture under acidic pH of 60
the presence of weak acids such as 8 mM acetate leads to accumulation of 232 mM
acetate ions in the cytoplasm which results in the decrease in other anion pools such as
glutamate and aspartate to compensate however it has not been clear if the decrease in
intracellular glutamate pool is due to its rapid metabolism or efflux (Roe et al 1998)
With the exception of arginine and histidine which their biosyntheses are linked to
glutamate most of amino acids had significantly higher concentrations in mono-culture
under pH profile as it is presented in
Table A8 moreover betaine choline which are derived from serine and isovalerate a Leucine
derivative as well as pyruvate uracil hypoxanthine isobutyrate (intermediate metabolites in
purine and pyrimidine pathways) have increased these data suggests an overflow metabolism
in the mono-culture under pH stress which has hampered the cell growth and cellulolytic
activity
175
Table A7 The extracellular metabolite concentrations from NMR analysis of the co-culture and mono-
culture samples at Chenomx samples are explained in Figure A8
Concentration (microM)
Sample id 1 2 4 5 6 7 A B
2-Hydroxybutyrate 41 40 36 34 0 0 0 0
Acetate 2394 4092 5682 7928 1693 2764 3484 5157
Acetoin 92 88 61 68 0 0 0 0
Acetone 33 32 68 57 78 74 37 34
Alanine 1006 1007 1254 1319 826 868 1155 1138
Arginine 0 0 0 0 223 229 0 0
Asparagine 12689 11470 13586 12272 1435 1580 12234 11484
Aspartate 243 217 550 561 222 201 283 424
Betaine 337 331 361 366 252 259 348 343
Butyrate 220 233 228 238 18 14 17 14
Choline 33 37 47 50 3 6 47 48
Cystine 876 878 1157 1177 987 953 849 906
Ethanol 1273 1850 2295 2794 930 1696 1162 978
Formate 0 0 0 0 1937 2157 0 0
Glutamate 750 702 1138 1164 786 863 1078 1132
Glycerol 20 0 33 0 72 235 0 0
Glycine 457 451 715 741 380 409 606 633
Histidine 0 0 0 0 81 90 0 0
Hypoxanthine 78 86 194 185 44 45 107 147
Isobutyrate 9 9 8 8 4 3 10 18
Isoleucine 395 423 564 576 381 422 508 501
Isovalerate 8 10 10 13 0 0 9 19
Leucine 581 571 739 795 537 543 676 688
Lysine 235 169 693 678 352 366 451 526
Methanol 11 11 35 37 11 12 8 10
Methionine 86 90 180 187 93 93 157 160
Phenylalanine 299 322 397 408 251 251 368 370
Proline 221 258 270 322 178 197 225 248
Pyroglutamate 252 254 300 295 240 263 269 271
Pyruvate 36 54 11 18 0 0 52 121
Serine 358 290 537 531 406 422 508 504
Succinate 0 0 0 0 156 161 0 0
Threonine 319 319 465 478 311 339 388 398
Tryptophan 51 30 102 86 43 60 67 57
Tyrosine 101 104 182 182 111 111 146 147
Uracil 165 236 325 336 44 40 256 315
Valine 563 587 763 793 491 541 685 688
sn-Glycero-3-
phosphocholine 9 3 0 0 39 41 0 0
176
Table A8 The extracellular metabolite concentrations in mono-culture samples
Concentration (microM average plusmn standard deviation)
Control mono-culture at pH
72
Mono-culture under pH
profile Percentage of change
Alanine 847plusmn30 1146plusmn12 35
Arginine 225plusmn4 0 -100
Aspartate 211plusmn15 353plusmn99 67
Betaine 255plusmn4 345plusmn3 35
Choline 4plusmn2 47plusmn1 1087
Glutamate 824plusmn54 1105plusmn37 34
Glycerol 153plusmn115 0 -100
Glycine 394plusmn20 619plusmn18 57
Histidine 85plusmn7 0 -100
Hypoxanthine 44plusmn1 127plusmn28 188
Isobutyrate 3plusmn1 14plusmn5 312
Isoleucine 401plusmn29 504plusmn5 25
Isovalerate 0 14plusmn7 Infinity
Leucine 540plusmn4 682plusmn8 26
Lysine 359plusmn10 488plusmn53 35
Methionine 93 158plusmn2 70
Phenylalanine 250plusmn01 368plusmn1 47
Proline 187plusmn13 236plusmn16 126
Pyruvate 0 86plusmn48 Infinity
Serine 413plusmn11 506plusmn2 22
Succinate 158plusmn4 0 -100
Threonine 325plusmn19 393plusmn7 21
Tyrosine 111plusmn03 146plusmn06 31
Uracil 42plusmn2 285plusmn42 580
Valine 516plusmn35 686plusmn2 33
sn-Glycero-3-
phosphocholine 40plusmn2 0 -100
Comparing the mono-culture under pH profile and the co-culture samples indicated
considerable changes in concentration of 2-hydroxybutyrate (propanoate metabolism) acetoin
(butanoate metabolism) and glycerol (Table A9) The concentration of pyruvate was also
significantly lower in the co-culture samples which implies less pyruvate overflow and a better
balanced metabolism However it should be noted that since co-culture samples 4 and 5 have
been analyzed freshly and overall had higher metabolite concentrations compared to samples 1
and 2 which had been thawed few times before NMR analysis and so potential degradation of
metabolites could have led to the heterogeneity in co-culture samples Considering co-culture
177
samples 1 and 2 only the concentration of choline glutamate glycin hypoxanthine isoleucine
isobutyrate isovalearte leucin lysine methionine phenylalanine serine threonine
tryptophan tyrosine and valine are lower compared to the mono-culture under pH profile
which indicates higher flux through cell biomass synthesis and consequently cellulolytic
activity in the co-culture
Table A9 The extracellular metabolite concentrations in the co-culture and mono-culture samples
Concentration (microM average plusmn standard deviation)
Control mono-culture
under pH profile
Co-culture
2-Hydroxybutyrate 0 38plusmn3
Acetoin 0 77plusmn15
Glycerol 0 13plusmn16
Isobutyrate 14plusmn5 8plusmn06
Pyruvate 87plusmn48 30plusmn19
D-10 Assessment of C cellulolyticum growth on the supernatant of C acetobutylicum culture
To further explore the metabolic interactions in this co-culture the mono-culture of C
cellulolyticum on the supernatant of C acetobutylicum culture was tested In this experiment
C acetobutylicum was cultivated on the co-culture medium containing 3 gL glucose until the
entire glucose was consumed in the overnight culture in 5times100 mL serum bottles The culture
was then filtered using 02micro SterivexTM
filters and the filtered supernatant was used as the
medium for the cultivation of C cellulolyticum in bioreactors 20 gL of fibrous cellulose was
added to each bioreactor containing 250 mL filtered supernatant and inoculated with 25 mL of
5-day old C cellulolyticum culture where pH was adjusted and controlled at 60 The
concentration of C cellulolyticum was monitored for 28 days in the batch culture however no
significant cell biomass growth was detected in either bioreactor replicate experiments
178
Appendix E supplementary information for chapter 6
Figure A9 The standard curve of lactate concentration versus peak area obtained from LC-MS mass
chromatograms


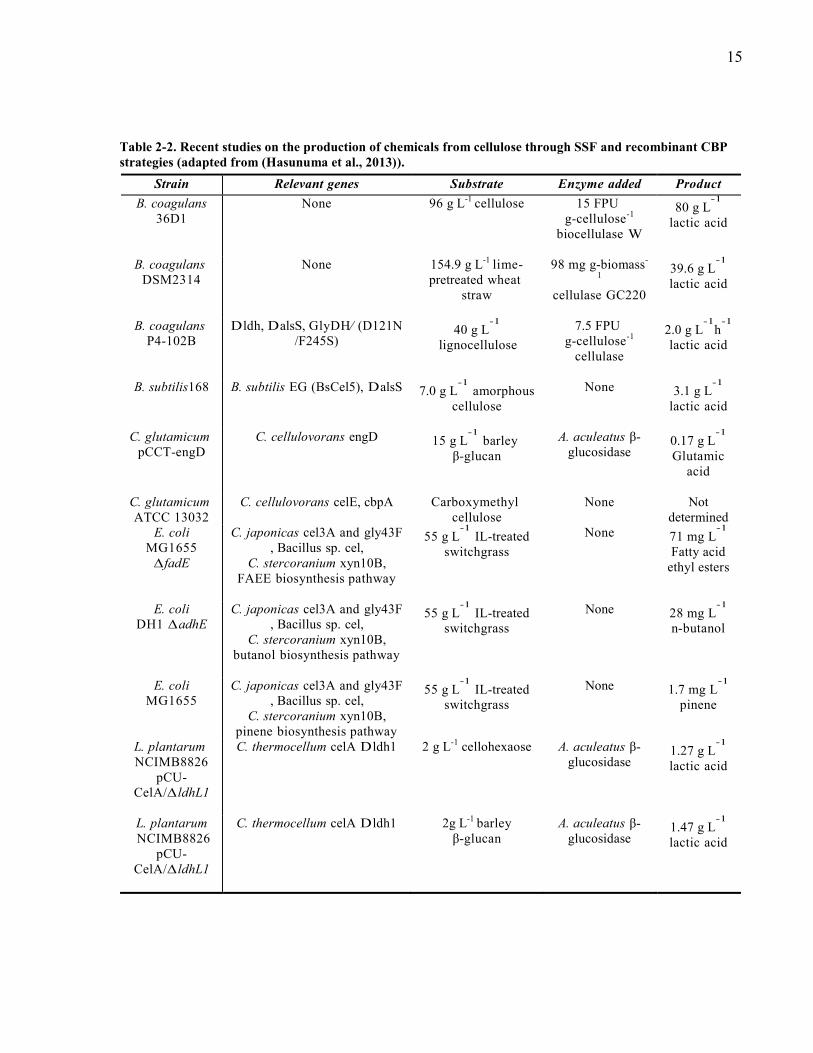


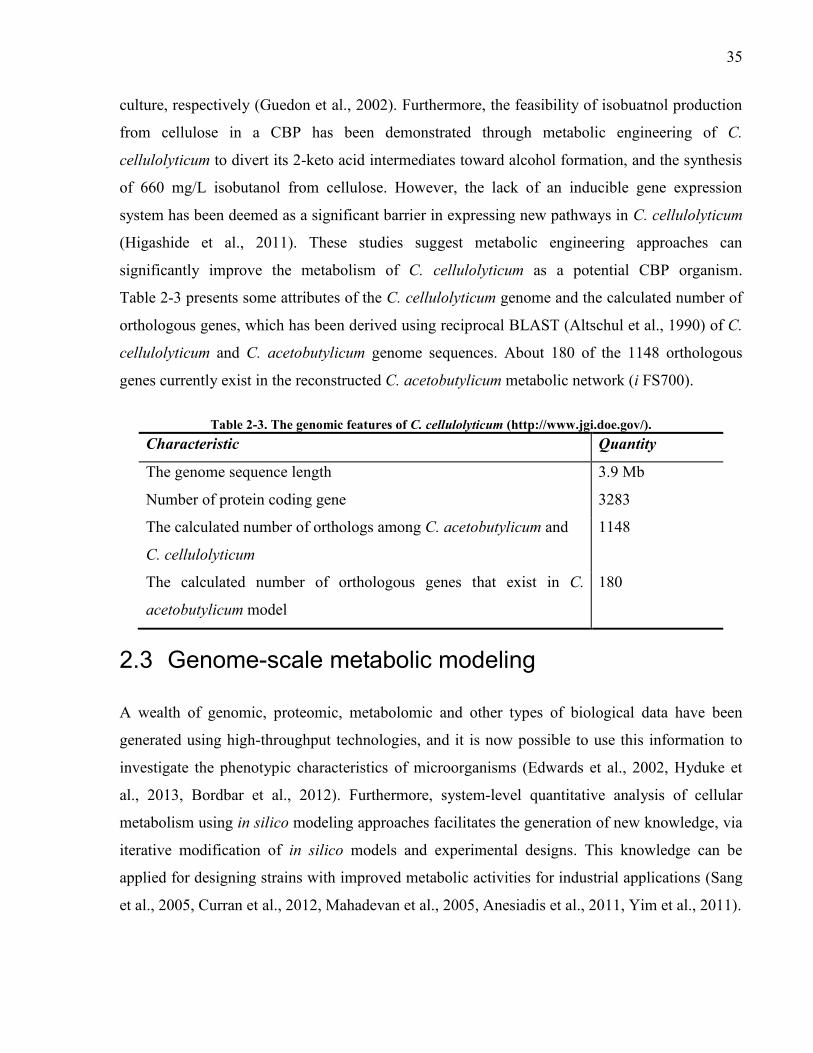


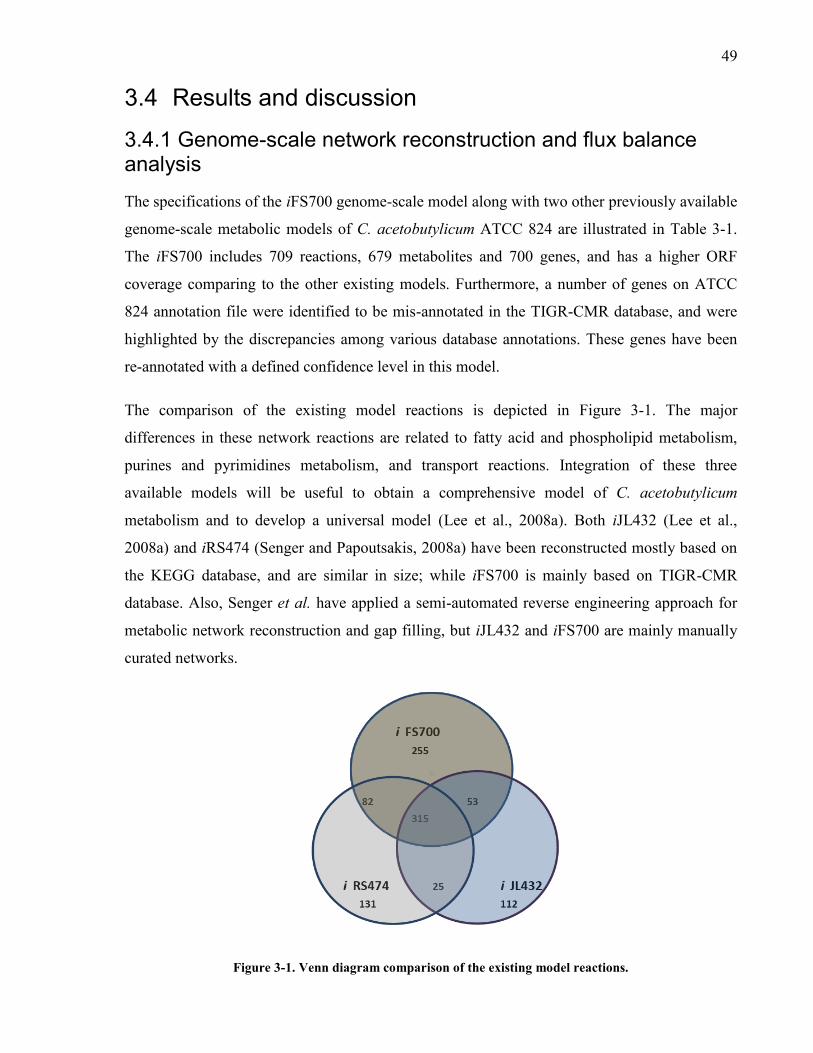


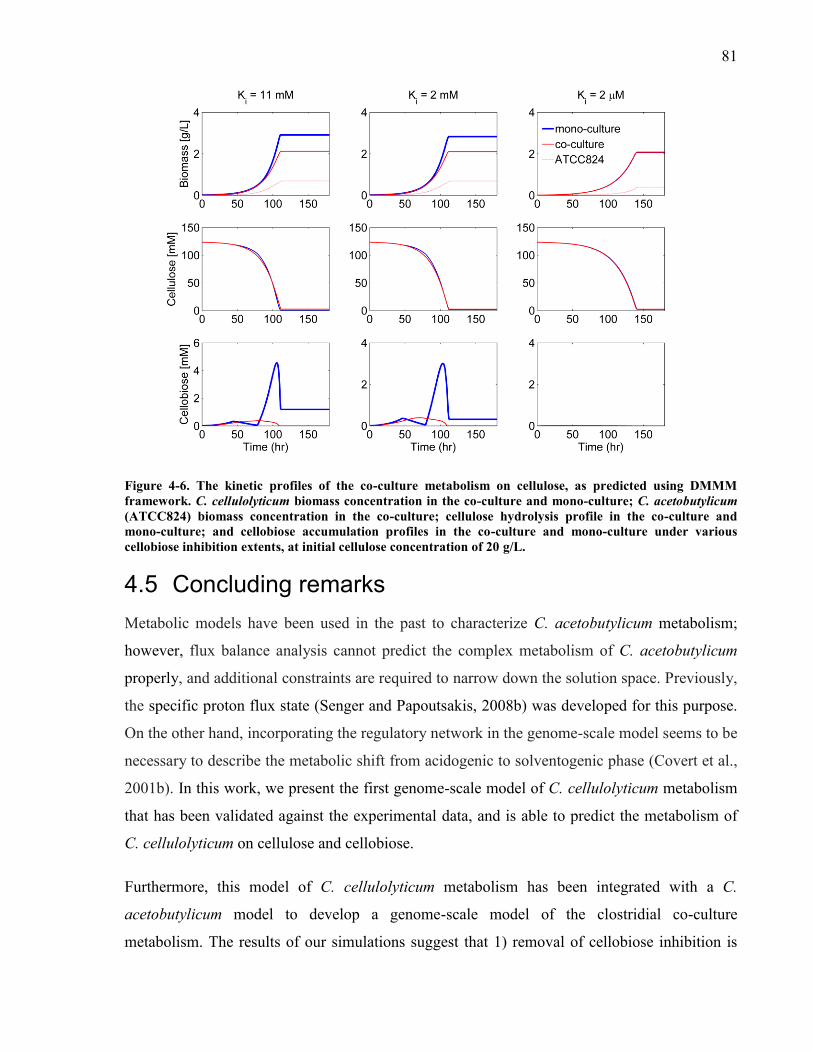


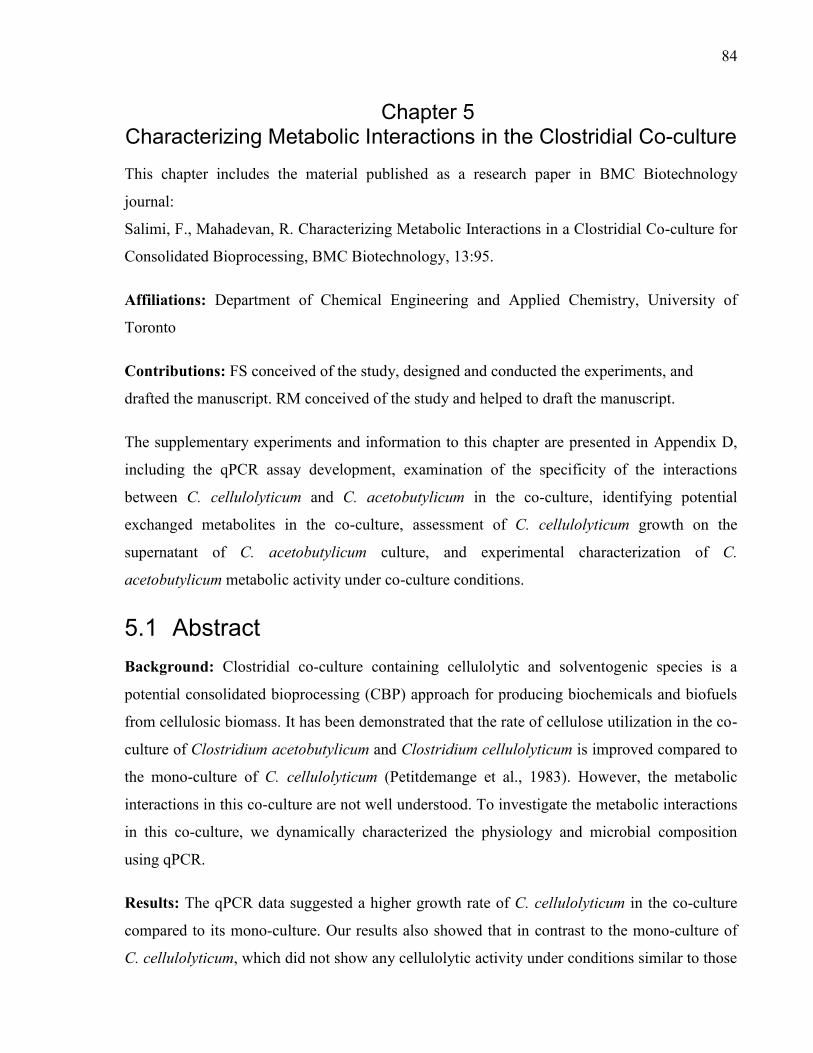


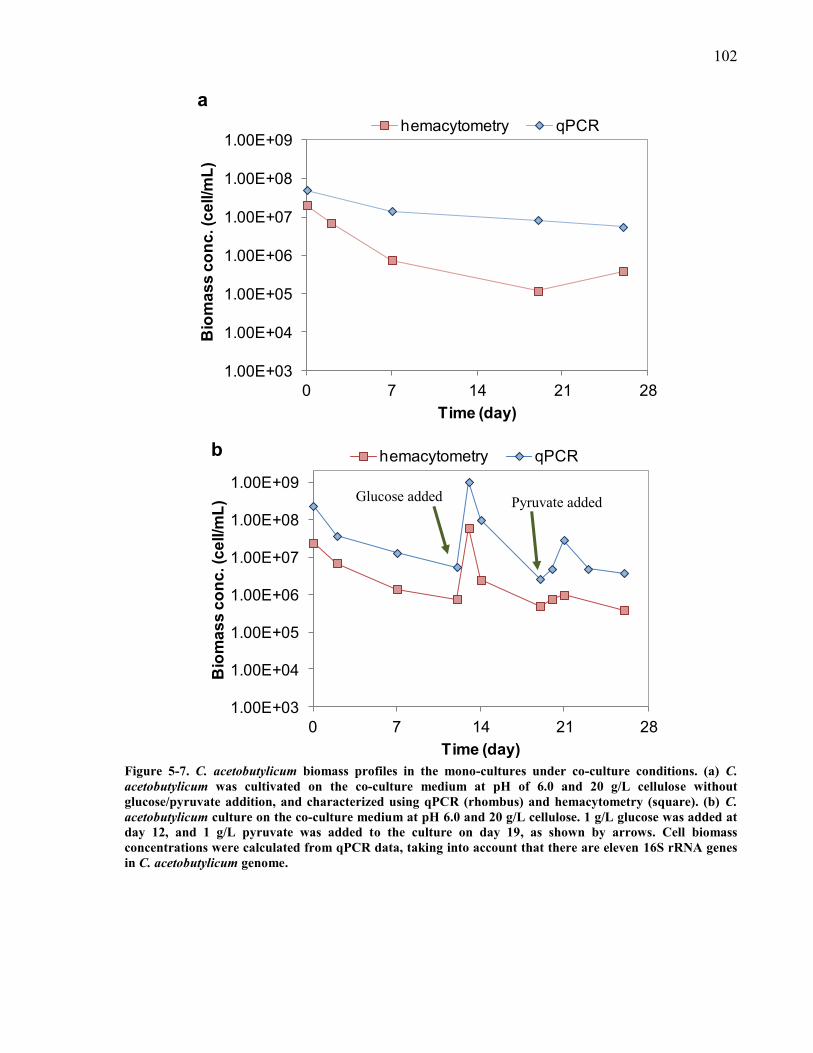


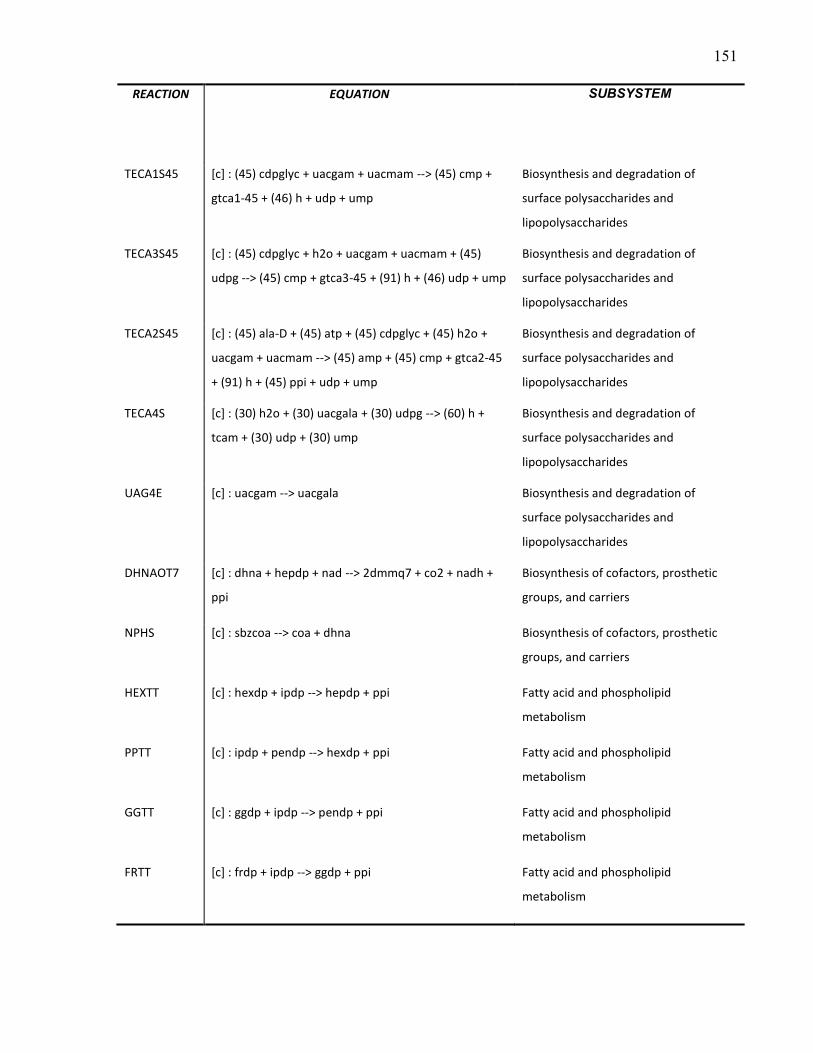


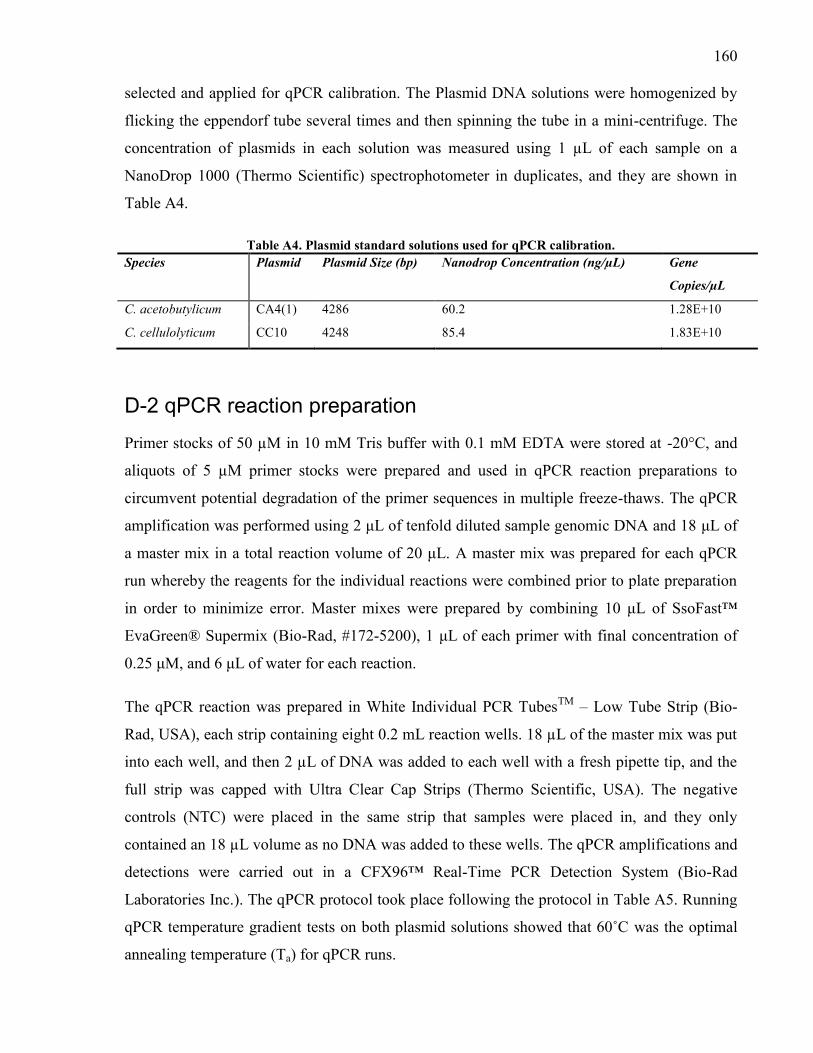


Recommended