8/11/2019 Giresun Pool City Summary Report
http://slidepdf.com/reader/full/giresun-pool-city-summary-report 1/14
Report Name:
GIRESUN_POOL_CITY_4th_OPTIMIZATION_REPORT
Reported by: TAYLAN ARIKAN
Date: 22.07.2014
SUMMARY REPORT
8/11/2019 Giresun Pool City Summary Report
http://slidepdf.com/reader/full/giresun-pool-city-summary-report 2/14
Contents1. Measurement Methodology
2. Technology Service Areas
VOICE
DATA
3. Voice Performance
OVERVIEW
2G PERFORMANCE 3G PERFORMANCE
CALL SETUP TIME
4 . Data Performance
MOBILE
5. Mahalle Benchmark
2G BENCHMARK
3G BENCHMARK
6. IRAT Optimization
7. Patch Area Analysis
8. Executive Summary
8/11/2019 Giresun Pool City Summary Report
http://slidepdf.com/reader/full/giresun-pool-city-summary-report 3/14
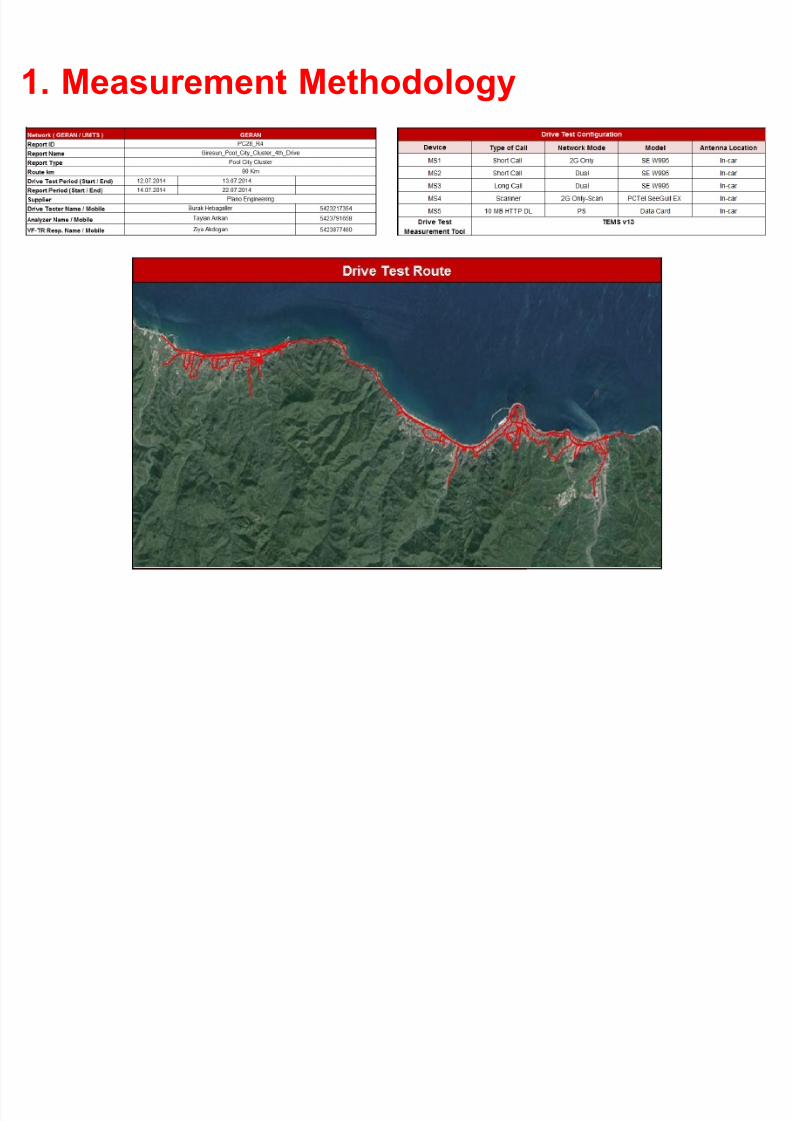
1. Measurement Methodology
8/11/2019 Giresun Pool City Summary Report
http://slidepdf.com/reader/full/giresun-pool-city-summary-report 4/14
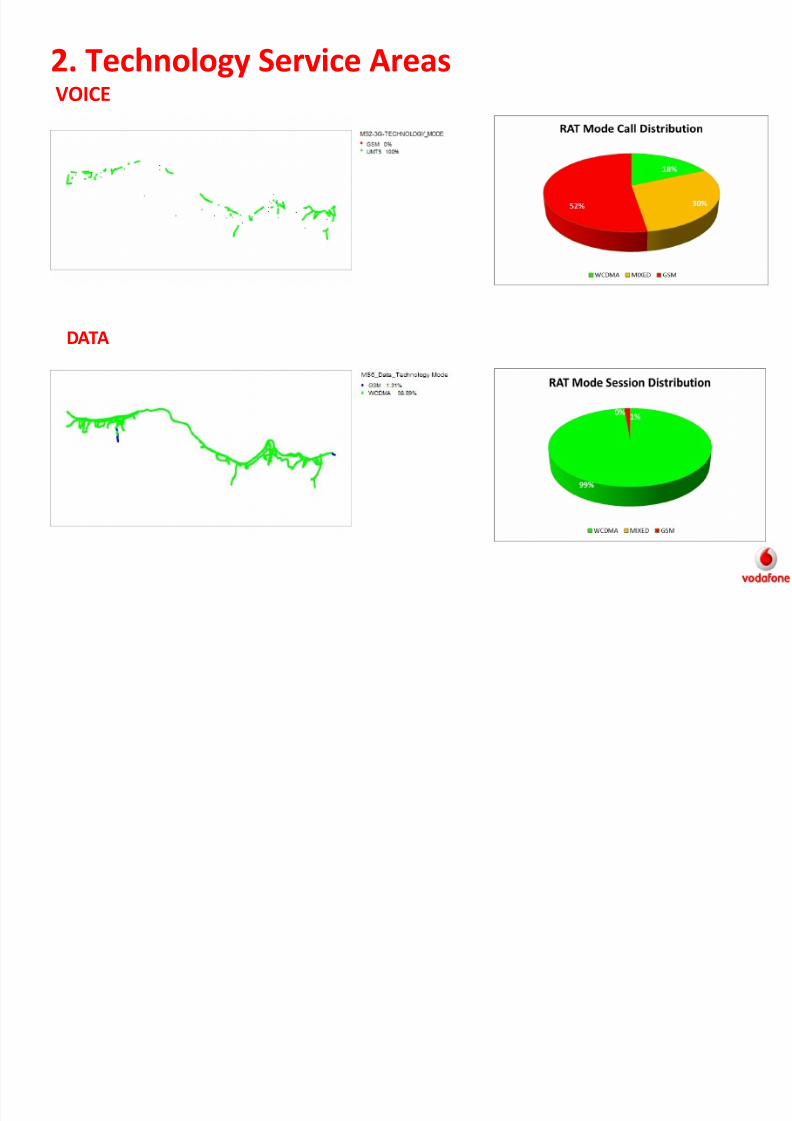
2. Technology Service AreasVOICE
DATA
8/11/2019 Giresun Pool City Summary Report
http://slidepdf.com/reader/full/giresun-pool-city-summary-report 5/14
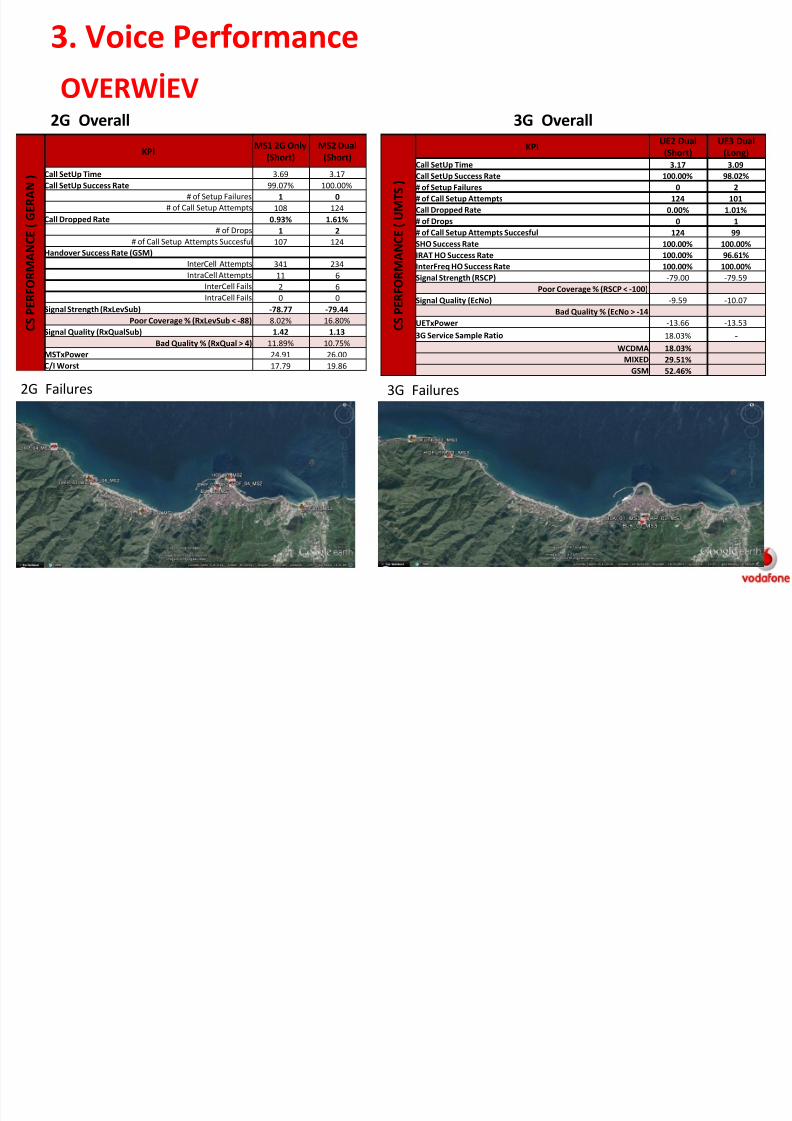
3. Voice Performance
OVERWİEV 2G Overall 3G Overall
2G Failures 3G Failures
C S P E R F O R
M A N C E ( G E R A N )
KPIMS1 2G Only
(Short)
MS2 Dual
(Short)
Call SetUp Time 3.69 3.17
Call SetUp Success Rate 99.07% 100.00%
# of Setup Failures 1 0
# of Call Setup Attempts 108 124
Call Dropped Rate 0.93% 1.61%
# of Drops 1 2
# of Call Setup Attempts Succesful 107 124
Handover Success Rate (GSM)
InterCell Attempts 341 234
IntraCell Attempts 11 6InterCell Fails 2 6
IntraCell Fails 0 0
Signal Strength (RxLevSub) -78.77 -79.44
Poor Coverage % (RxLevSub < -88) 8.02% 16.80%
Signal Quality (RxQualSub) 1.42 1.13
Bad Quality % (RxQual > 4) 11.89% 10.75%
MSTxPower 24.91 26.00
C/I Worst 17.79 19.86
C S P E R F O R
M A N C E ( U M T S )
KPI UE2 Dual(Short)
UE3 Dual(Long)
Call SetUp Time 3.17 3.09
Call SetUp Success Rate 100.00% 98.02%
# of Setup Failures 0 2
# of Call Setup Attempts 124 101
Call Dropped Rate 0.00% 1.01%
# of Drops 0 1
# of Call Setup Attempts Succesful 124 99
SHO Success Rate 100.00% 100.00%
IRAT HO Success Rate 100.00% 96.61%
InterFreq HO Success Rate 100.00% 100.00%
Signal Strength (RSCP) -79.00 -79.59Poor Coverage % (RSCP < -100)
Signal Quality (EcNo) -9.59 -10.07
Bad Quality % (EcNo > -14
UETxPower -13.66 -13.53
3G Service Sample Ratio 18.03% -WCDMA 18.03%
MIXED 29.51%
GSM 52.46%
8/11/2019 Giresun Pool City Summary Report
http://slidepdf.com/reader/full/giresun-pool-city-summary-report 6/14
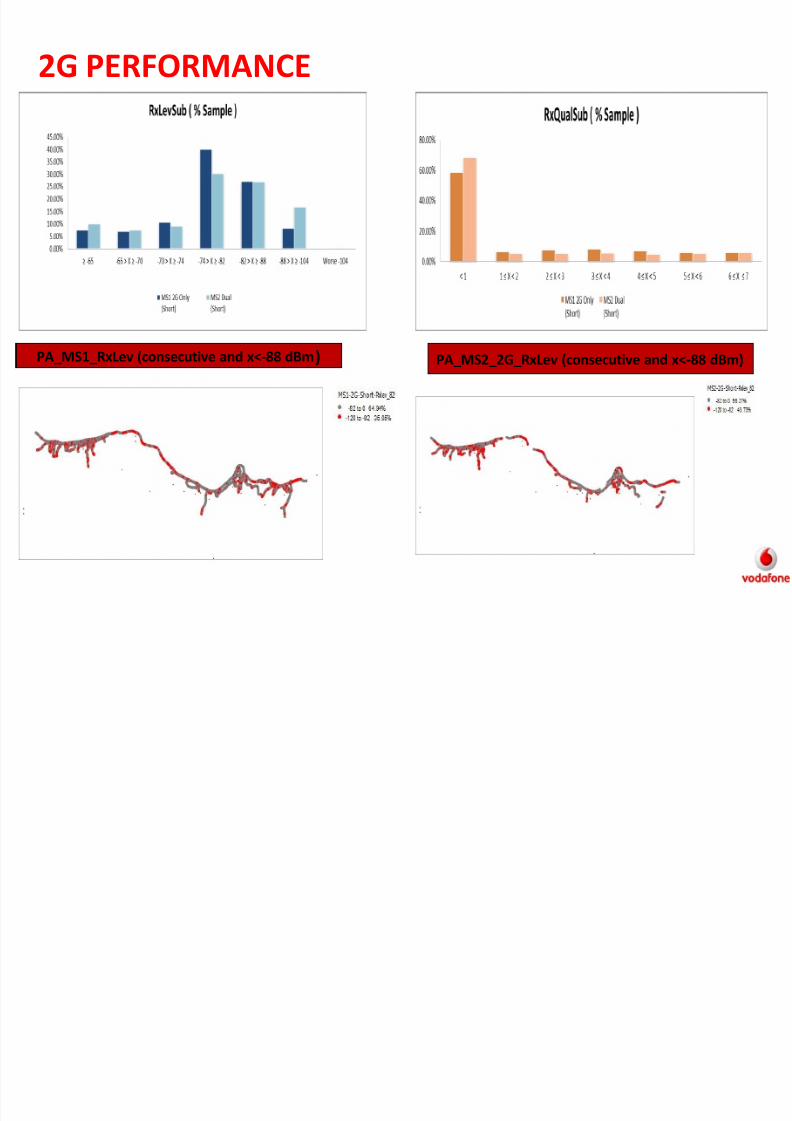
2G PERFORMANCE
PA_MS1_RxLev (consecutive and x<-88 dBm) PA_MS2_2G_RxLev (consecutive and x<-88 dBm)
8/11/2019 Giresun Pool City Summary Report
http://slidepdf.com/reader/full/giresun-pool-city-summary-report 7/14
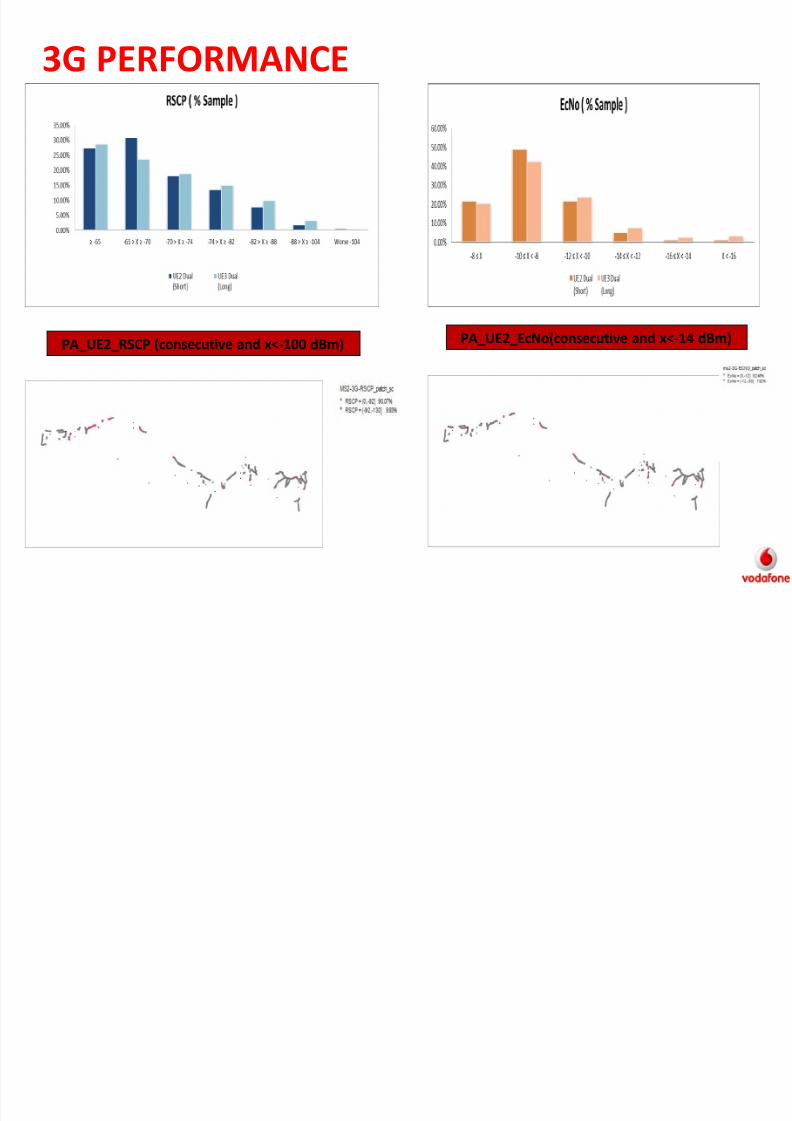
3G PERFORMANCE
PA_UE2_RSCP (consecutive and x<-100 dBm) PA_UE2_EcNo(consecutive and x<-14 dBm)
8/11/2019 Giresun Pool City Summary Report
http://slidepdf.com/reader/full/giresun-pool-city-summary-report 8/14
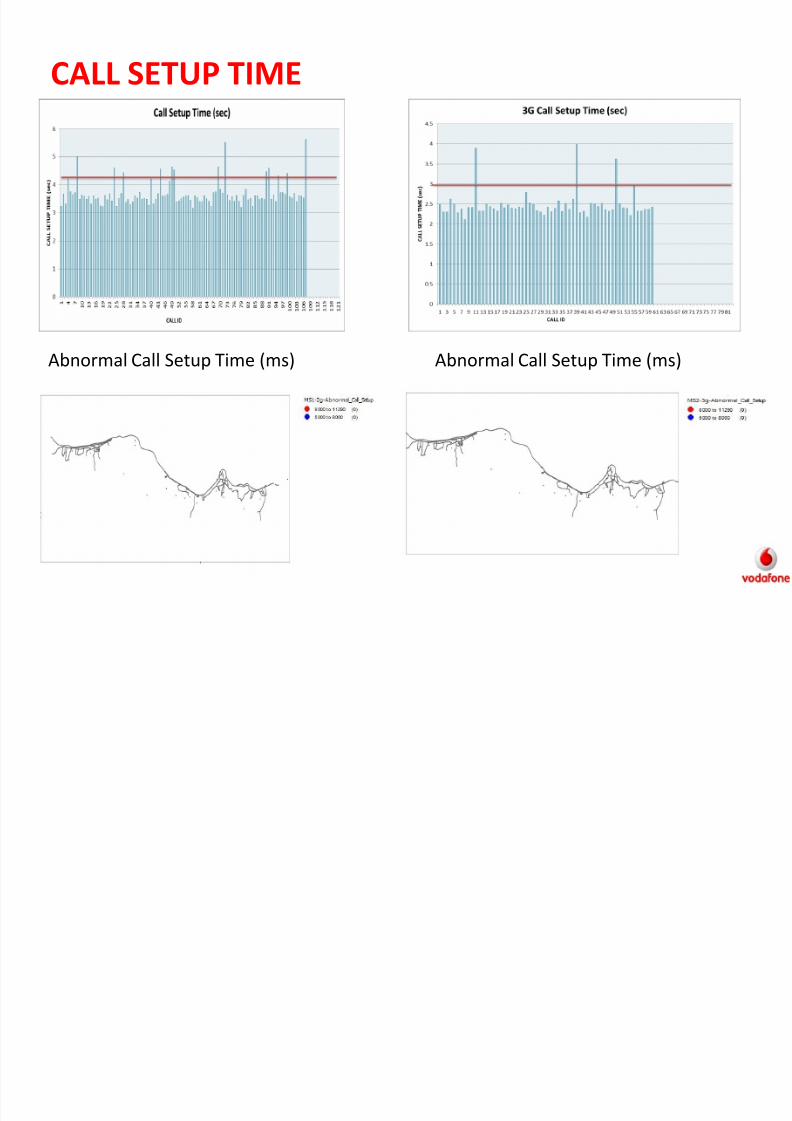
CALL SETUP TIME
Abnormal Call Setup Time (ms) Abnormal Call Setup Time (ms)
8/11/2019 Giresun Pool City Summary Report
http://slidepdf.com/reader/full/giresun-pool-city-summary-report 9/14
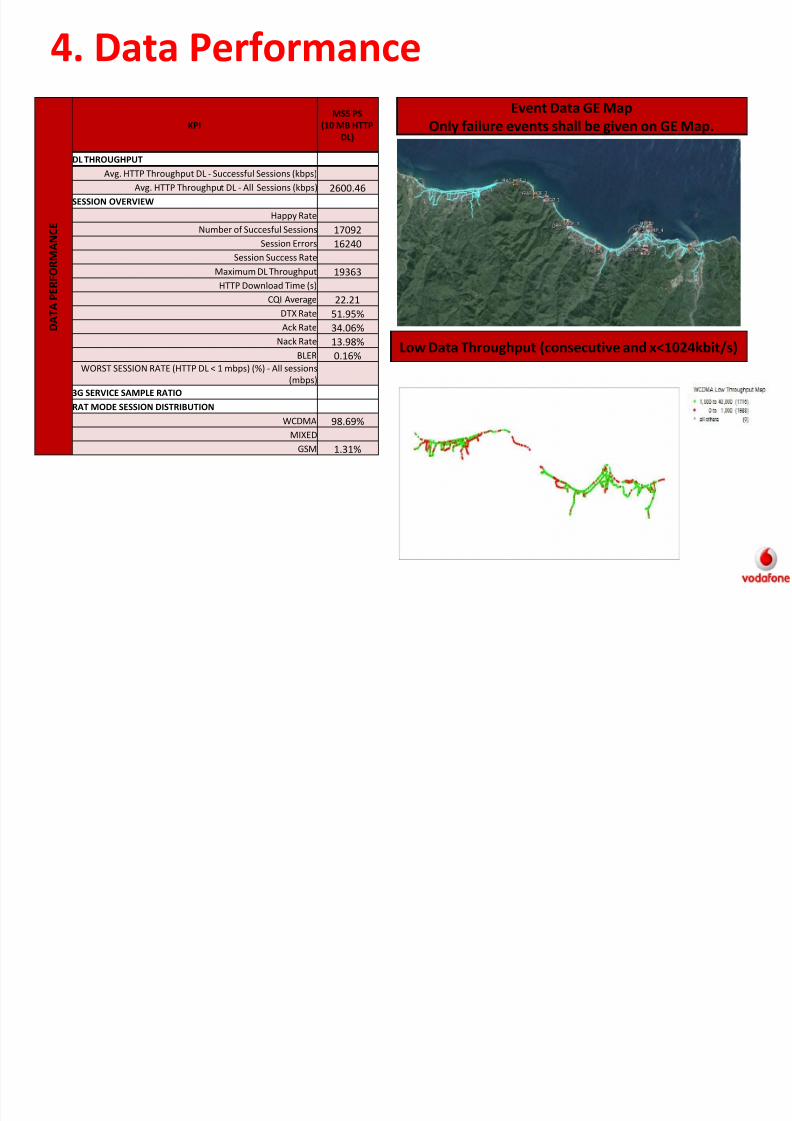
4. Data Performance
D A T A P E R F O R M A N C E
KPI
MS5 PS
(10 MB HTTP
DL)
DL THROUGHPUT
Avg. HTTP Throughput DL - Successful Sessions (kbps)
Avg. HTTP Throughput DL - All Sessions (kbps) 2600.46
SESSION OVERVIEW
Happy Rate
Number of Succesful Sessions 17092
Session Errors 16240
Session Success Rate
Maximum DL Throughput19363HTTP Download Time (s)
CQI Average 22.21
DTX Rate 51.95%
Ack Rate 34.06%
Nack Rate 13.98%
BLER 0.16%
WORST SESSION RATE (HTTP DL < 1 mbps) (%) - All sessions
(mbps)
3G SERVICE SAMPLE RATIO
RAT MODE SESSION DISTRIBUTION
WCDMA 98.69%
MIXED
GSM 1.31%
Event Data GE Map
Only failure events shall be given on GE Map.
Low Data Throughput (consecutive and x<1024kbit/s)
8/11/2019 Giresun Pool City Summary Report
http://slidepdf.com/reader/full/giresun-pool-city-summary-report 10/14
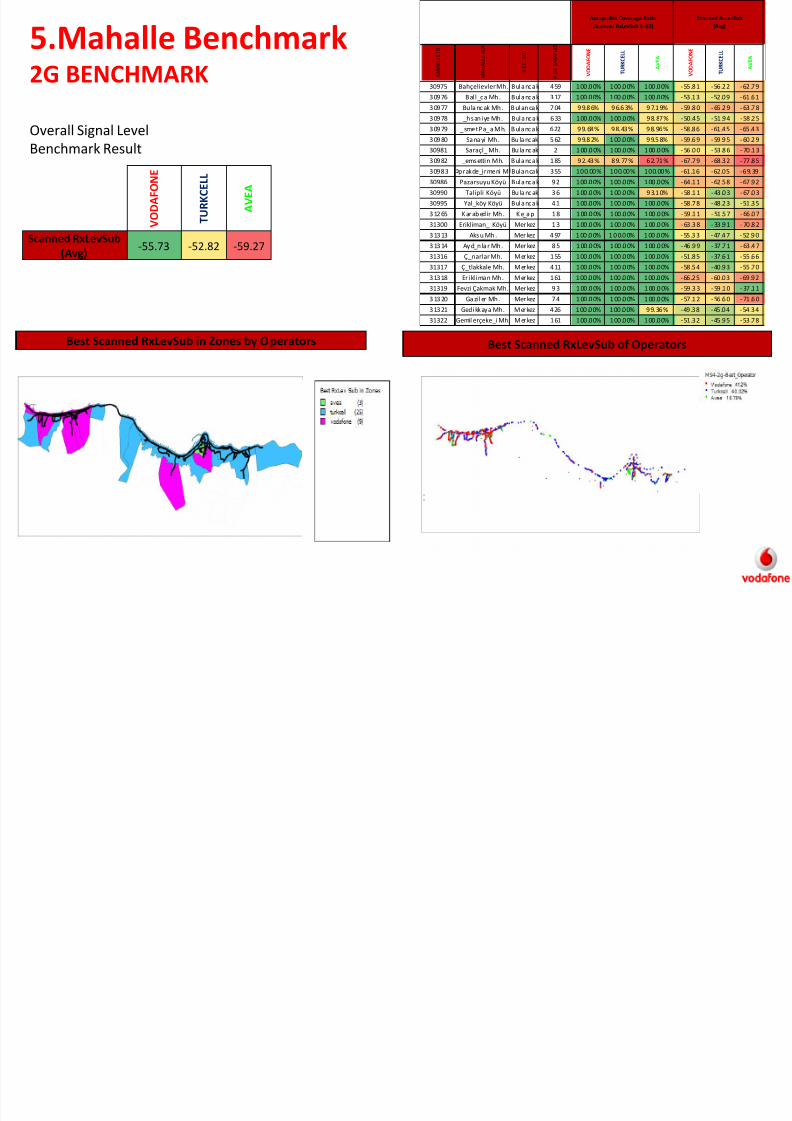
5.Mahalle Benchmark2G BENCHMARK
Overall Signal Level
Benchmark Result
V O D A F O N E
T U R K C E L L
A V E A
Scanned RxLevSub
(Avg)-55.73 -52.82 -59.27
Best Scanned RxLevSub in Zones by Operators Best Scanned RxLevSub of Operators
M A H E L L E I D
M A H A L L E A D I
I L C E
A D I
# O F S A M P L E S
V O D A F O N E
T U R K C E L L
A V E A
V O D A F O N E
T U R K C E L L
A V E A
30975 Bahçelievler Mh. Bulancak 459 100.00% 100.00% 100.00% -55.81 -56.22 -62.79
30976 Bal l_ca Mh. Bulancak 317 100.00% 100.00% 100.00% -53.13 -52.09 -61.61
3 09 77 Bu la nc ak Mh . B ul an ca k 7 04 9 9.8 6% 9 6.6 3% 9 7.1 9% -59 .8 0 -65 .2 9 -63 .7 8
30978 _hsaniye Mh. Bulancak 633 100.00% 100.00% 98.87% -50.45 -51.94 -58.25
30979 _smet Pa_a Mh. Bulancak 622 99.68% 98.43% 98.96% -58.86 -61.45 -65.43
3 09 80 Sa na yi Mh . Bu la nc ak 5 62 9 9.8 2% 1 00 .0 0% 9 9.5 8% -59 .6 9 -59 .9 5 -60 .2 9
30981 Saraçl_ Mh. Bu la nc ak 2 1 00 .0 0% 1 00 .0 0% 1 00 .0 0% -56 .0 0 -53 .8 6 -70 .1 3
30982 _emsettin Mh. Bulancak 185 92.43% 89.77% 62.71% -67.79 -68.32 -77.85
30983 prakde_irmeni M Bulancak 355 100.00% 100.00% 100.00% -61.16 -62.05 -69.39
30986 Pazarsuyu Köyü Bulancak 92 100.00% 100.00% 100.00% -64.11 -62.58 -67.92
30990 Talipli Köyü Bu la nc ak 3 6 1 00 .0 0% 1 00 .0 0% 9 3.1 0% -58 .1 1 -43 .0 3 -67 .0 3
30995 Yal_köy Köyü Bulancak 41 100.00% 100.00% 100.00% -58.78 -48.23 -51.35
3 12 65 K ar ab ed ir Mh . K e_a p 1 8 1 00 .0 0% 1 00 .0 0% 1 00 .0 0% -59 .1 1 -51 .5 7 -66 .0 7
31300 Erikliman_ Köyü Mer kez 1 3 1 00 .0 0% 1 00 .0 0% 1 00 .0 0% -63 .3 8 -33 .9 1 -70 .8 2
3 13 13 Aks u Mh . Mer kez 4 97 1 00 .0 0% 1 0 0.0 0% 1 00 .0 0% -55 .3 3 -47 .4 7 -52 .9 0
3 13 14 Ayd_n la r Mh . Mer kez 8 5 1 00 .0 0% 1 00 .0 0% 1 00 .0 0% -46 .9 9 -37 .7 1 -63 .4 7
31316 Ç_narlar Mh. Merkez 155 100.00% 100.00% 100.00% -51.85 -37.61 -55.66
31317 Ç_tlakkale Mh. Merkez 411 100.00% 100.00% 100.00% -58.54 -40.93 -55.70
31318 Er ikl iman Mh. Merkez 161 100.00% 100.00% 100.00% -66.25 -60.03 -69.92
31319 Fevzi Çakmak Mh. Mer kez 9 3 1 00 .0 0% 1 00 .0 0% 1 00 .0 0% -59 .3 3 -59 .1 0 -37 .1 1
3 13 20 Ga zi l er Mh . Mer kez 7 4 1 00 .0 0% 1 00 .0 0% 1 00 .0 0% -57 .1 2 -56 .6 0 -71 .6 0
31321 Gedikkaya Mh. Merkez 426 100.00% 100.00% 99.36% -49.38 -45.04 -54.34
31322 Gemil erçeke_i Mh. Merkez 161 100.00% 100.00% 100.00% -51.32 -45.95 -53.78
Acceptable Coverage Ratio
(Scanned RxLevSub ≥ -82)
Scanned RxLevSub
(Avg)
8/11/2019 Giresun Pool City Summary Report
http://slidepdf.com/reader/full/giresun-pool-city-summary-report 11/14
8/11/2019 Giresun Pool City Summary Report
http://slidepdf.com/reader/full/giresun-pool-city-summary-report 12/14
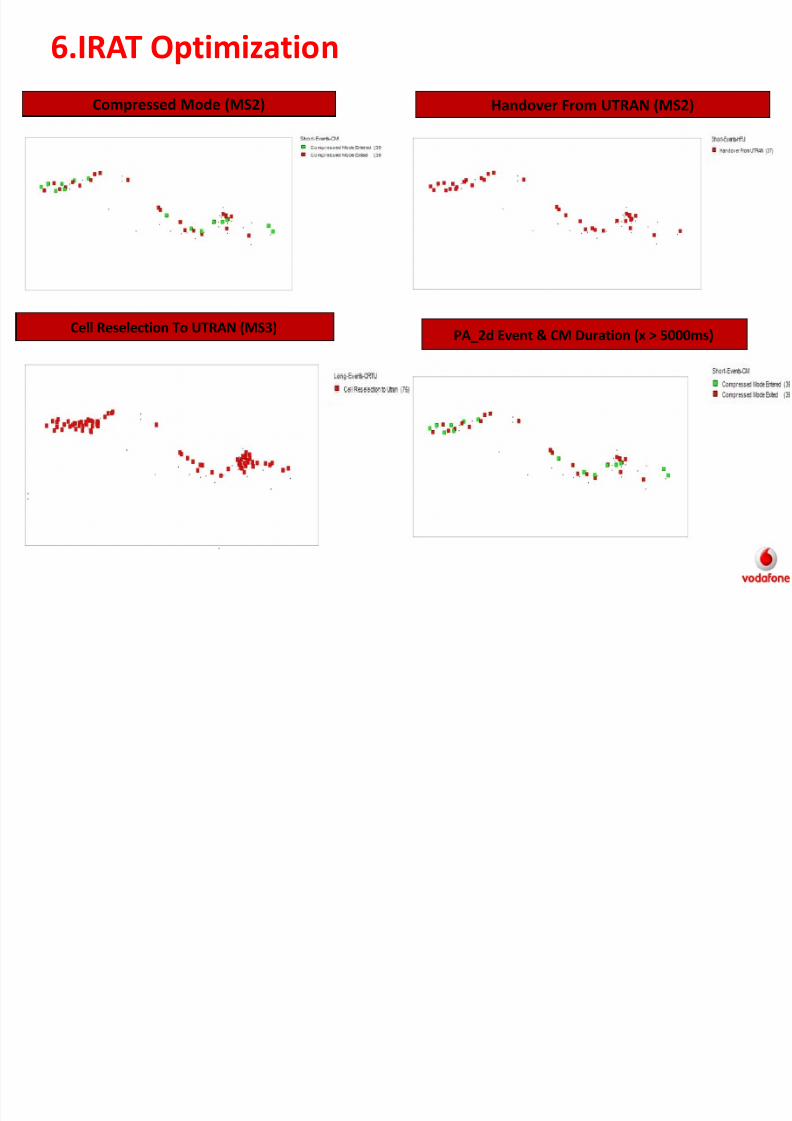
6.IRAT Optimization
Compressed Mode (MS2) Handover From UTRAN (MS2)
Cell Reselection To UTRAN (MS3)PA_2d Event & CM Duration (x > 5000ms)
8/11/2019 Giresun Pool City Summary Report
http://slidepdf.com/reader/full/giresun-pool-city-summary-report 13/14
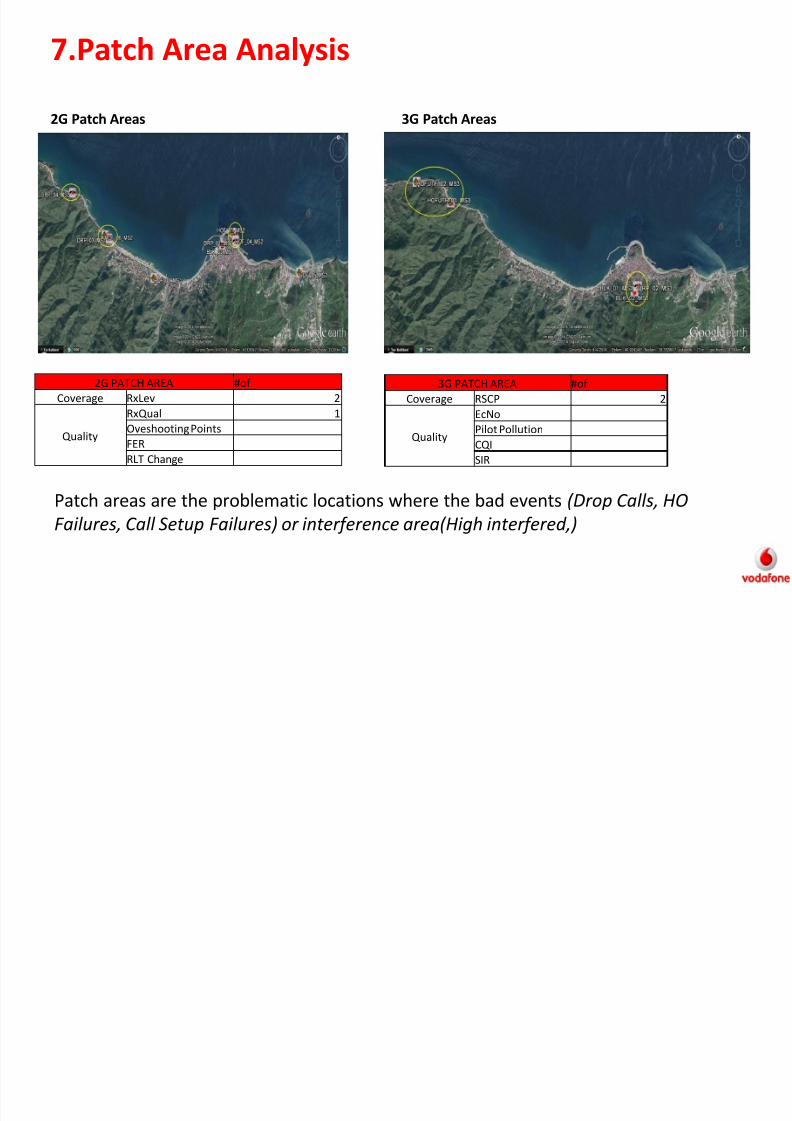
7.Patch Area Analysis
2G Patch Areas 3G Patch Areas
Patch areas are the problematic locations where the bad events (Drop Calls, HO
Failures, Call Setup Failures) or interference area(High interfered,)
2G PATCH AREA #of
Coverage RxLev 2
Quality
RxQual 1Oveshooting Points
FER
RLT Change
3G PATCH AREA #of
Coverage RSCP 2
Quality
EcNoPilot Pollution
CQI
SIR
8/11/2019 Giresun Pool City Summary Report
http://slidepdf.com/reader/full/giresun-pool-city-summary-report 14/14
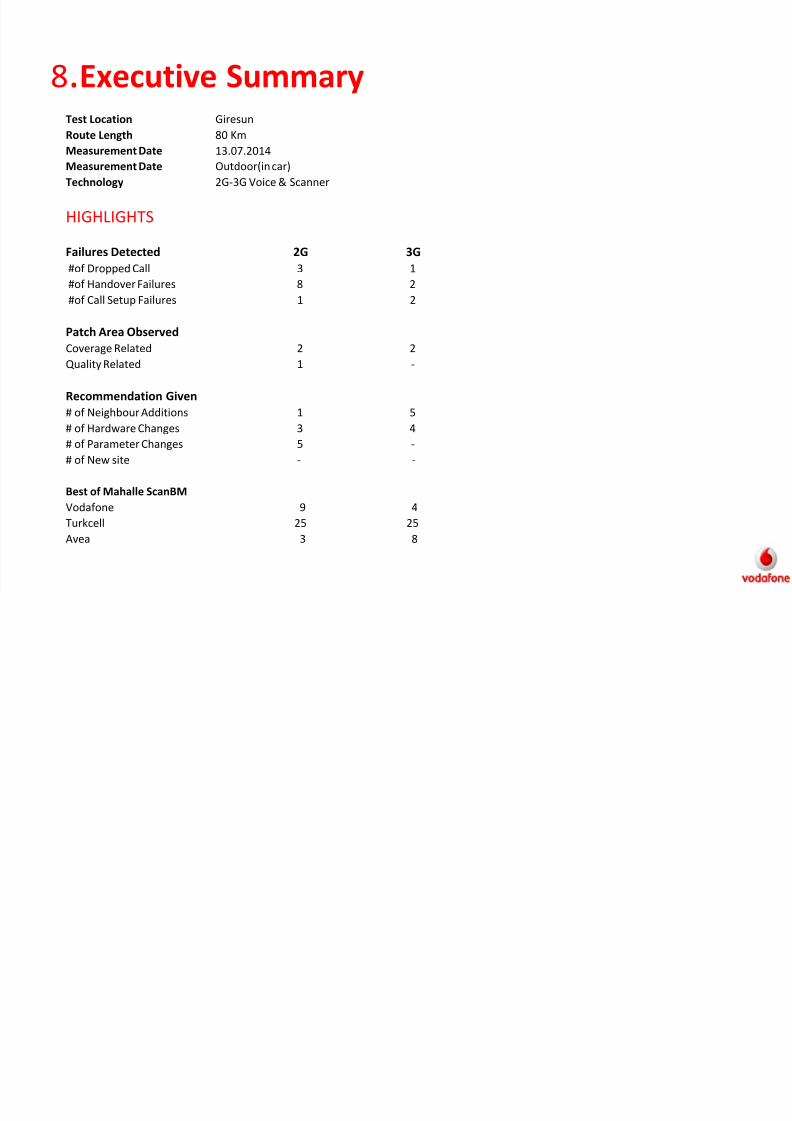
8.Executive SummaryTest Location Giresun
Route Length 80 KmMeasurement Date 13.07.2014
Measurement Date Outdoor(in car)
Technology 2G-3G Voice & Scanner
HIGHLIGHTS
Failures Detected 2G 3G
#of Dropped Call 3 1
#of Handover Failures 8 2
#of Call Setup Failures 1 2
Patch Area Observed
Coverage Related 2 2
Quality Related 1 -
Recommendation Given
# of Neighbour Additions 1 5# of Hardware Changes 3 4
# of Parameter Changes 5 -
# of New site - -
Best of Mahalle ScanBM
Vodafone 9 4
Turkcell 25 25
Avea 3 8
Recommended