Ground Tire Rubber as a Stabilizer for Subgrade Soils
Final ReportFDOT Contract Number: BDK81 977-03
Date Prepared: May 7, 2014
Submitted by:Paul Cosentino, Ph.D., P.E.Florida Institute of TechnologyDepartment of Civil Engineering150 West University BoulevardMelbourne, FL 32901-6975(321) 674-7555Email: [email protected]
Florida Institute of Technology Department of Civil Engineering 150 West University Boulevard Melbourne, Florida 32901www.fit.edu • (321) 674-8048
Submitted to:The Florida Department of TransportationResearch Center605 Suwannee St., MS 30Tallahassee, FL 32399c/o David Horhota Ph.D., P.E.
EN-364-514


ii
Disclaimer
The opinions, findings, and conclusions expressed in this publication are those of
the authors and not necessarily those of the State of Florida Department of
Transportation.
iii
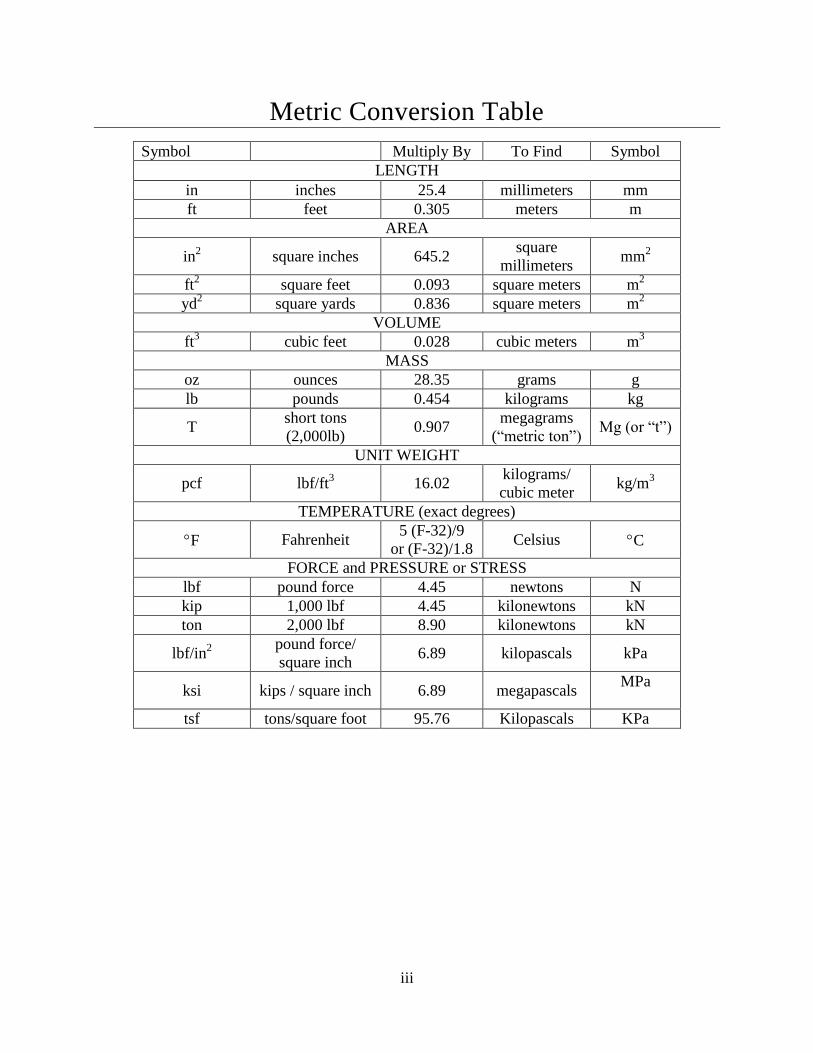
Metric Conversion Table
Symbol Multiply By To Find Symbol
LENGTH
in inches 25.4 millimeters mm
ft feet 0.305 meters m
AREA
in2
square inches 645.2 square
millimeters mm
2
ft2 square feet 0.093 square meters m
2
yd2
square yards 0.836 square meters m2
VOLUME
ft3
cubic feet 0.028 cubic meters m3
MASS
oz ounces 28.35 grams g
lb pounds 0.454 kilograms kg
T short tons
(2,000lb) 0.907
megagrams
(“metric ton”) Mg (or “t”)
UNIT WEIGHT
pcf lbf/ft3 16.02
kilograms/
cubic meter kg/m
3
TEMPERATURE (exact degrees)
F Fahrenheit 5 (F-32)/9
or (F-32)/1.8 Celsius C
FORCE and PRESSURE or STRESS
lbf pound force 4.45 newtons N
kip 1,000 lbf 4.45 kilonewtons kN
ton 2,000 lbf 8.90 kilonewtons kN
lbf/in2 pound force/
square inch 6.89 kilopascals kPa
ksi kips / square inch 6.89 megapascals MPa
tsf tons/square foot 95.76 Kilopascals KPa
Technical Report Documentation Page 1. Report No.
2. Government Accession No.
3. Recipient's Catalog No.
4. Title and Subtitle
Ground Tire Rubber as a Stabilizer for Subgrade Soils
DRAFT Final Report
5. Report Date
May 5 2014
6. Performing Organization Code
Index 201
7. Author(s)
P. J. Cosentino, A. M. Bleakley, A. T. Armstrong, A.M. Sajjadi, T. J.
Misilo
8. Performing Organization
Report No.
9. Performing Organization Name and Address
Florida Institute of Technology
Civil Engineering Department
150 West University Blvd.
Melbourne, FL 32901-6975 (321) 674-7555
10. Work Unit No. (TRAIS)
11. Contract or Grant No.
Contract Number
BDK81 977-03
12. Sponsoring Agency Name and Address
Florida Department of Transportation
605 Suwannee Street
Tallahassee, Florida 32399-0450
13. Type of Report and Period
Covered
June 2012 – May 2014
14. Sponsoring Agency Code
15. Supplementary Notes
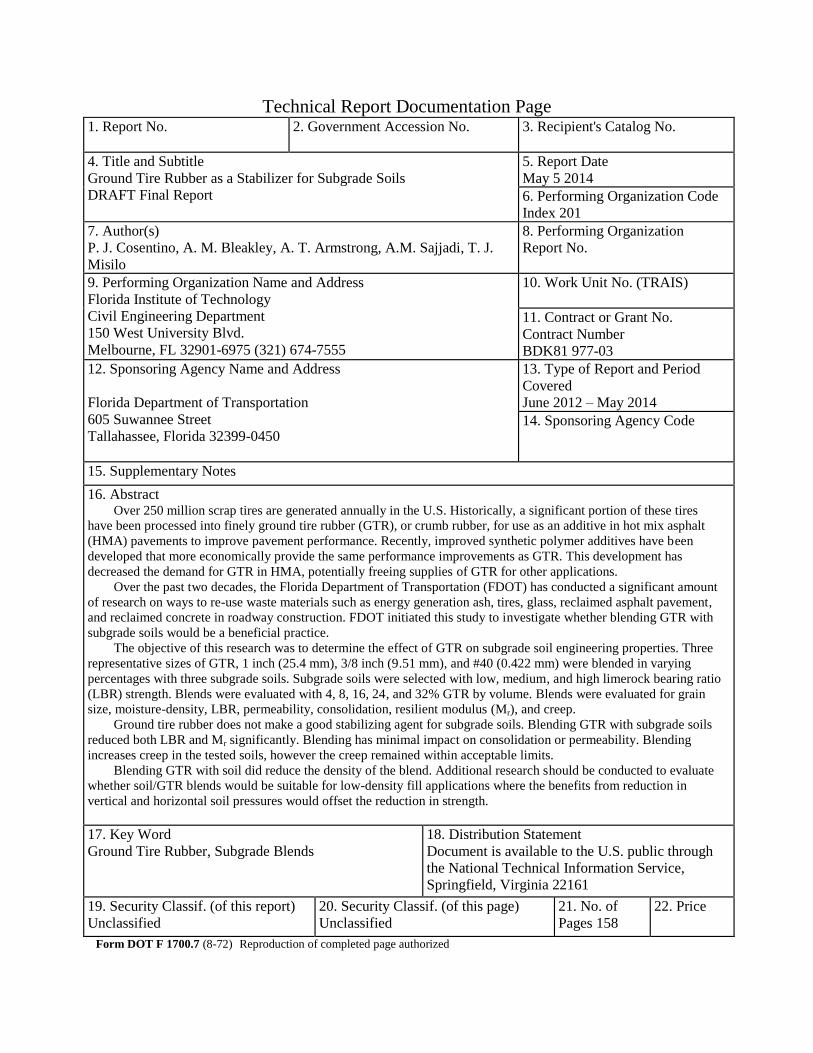
16. Abstract Over 250 million scrap tires are generated annually in the U.S. Historically, a significant portion of these tires
have been processed into finely ground tire rubber (GTR), or crumb rubber, for use as an additive in hot mix asphalt
(HMA) pavements to improve pavement performance. Recently, improved synthetic polymer additives have been
developed that more economically provide the same performance improvements as GTR. This development has
decreased the demand for GTR in HMA, potentially freeing supplies of GTR for other applications.
Over the past two decades, the Florida Department of Transportation (FDOT) has conducted a significant amount
of research on ways to re-use waste materials such as energy generation ash, tires, glass, reclaimed asphalt pavement,
and reclaimed concrete in roadway construction. FDOT initiated this study to investigate whether blending GTR with
subgrade soils would be a beneficial practice.
The objective of this research was to determine the effect of GTR on subgrade soil engineering properties. Three
representative sizes of GTR, 1 inch (25.4 mm), 3/8 inch (9.51 mm), and #40 (0.422 mm) were blended in varying
percentages with three subgrade soils. Subgrade soils were selected with low, medium, and high limerock bearing ratio
(LBR) strength. Blends were evaluated with 4, 8, 16, 24, and 32% GTR by volume. Blends were evaluated for grain
size, moisture-density, LBR, permeability, consolidation, resilient modulus (Mr), and creep.
Ground tire rubber does not make a good stabilizing agent for subgrade soils. Blending GTR with subgrade soils
reduced both LBR and Mr significantly. Blending has minimal impact on consolidation or permeability. Blending
increases creep in the tested soils, however the creep remained within acceptable limits.
Blending GTR with soil did reduce the density of the blend. Additional research should be conducted to evaluate
whether soil/GTR blends would be suitable for low-density fill applications where the benefits from reduction in
vertical and horizontal soil pressures would offset the reduction in strength.
17. Key Word
Ground Tire Rubber, Subgrade Blends
18. Distribution Statement
Document is available to the U.S. public through
the National Technical Information Service,
Springfield, Virginia 22161
19. Security Classif. (of this report)
Unclassified
20. Security Classif. (of this page)
Unclassified
21. No. of
Pages 158
22. Price
Form DOT F 1700.7 (8-72) Reproduction of completed page authorized
i
Acknowledgements
This work was completed under FDOT contract number BDK81-977-03. The authors
would like to acknowledge the following people for their invaluable guidance and help in the
completion of this study.
The support of Dr. David Horhota, P.E., Mr. Jose Hernando, P.E., Mr. John Shoucair,
P.E., and James Musselman, P.E., of the Florida Department of Transportation State Materials
Office throughout the project was critical to its successful completion. The hard work and
assistance of Bruce Swidarski, Todd Britton, Kyle Shepard, Kevin Haddix, and Glenn Johnson at
the FDOT State Materials Office is most appreciated.
The authors also wish to acknowledge the valuable assistance from Mr. Mark Bailey and
the entire staff at Global Tire Recycling in Wildwood, Florida, for graciously providing the
research team with ground tire rubber samples and allowing us to tour their facilities.
The following Florida Institute of Technology undergraduate students helped with
performing numerous laboratory tests: Patrick Hammond, Julius Reid, Christopher Welcome,
Raymond Quincy Sy, Alvaro Urcuyo, Mara Bancroft, and Alandre Melton.
ii
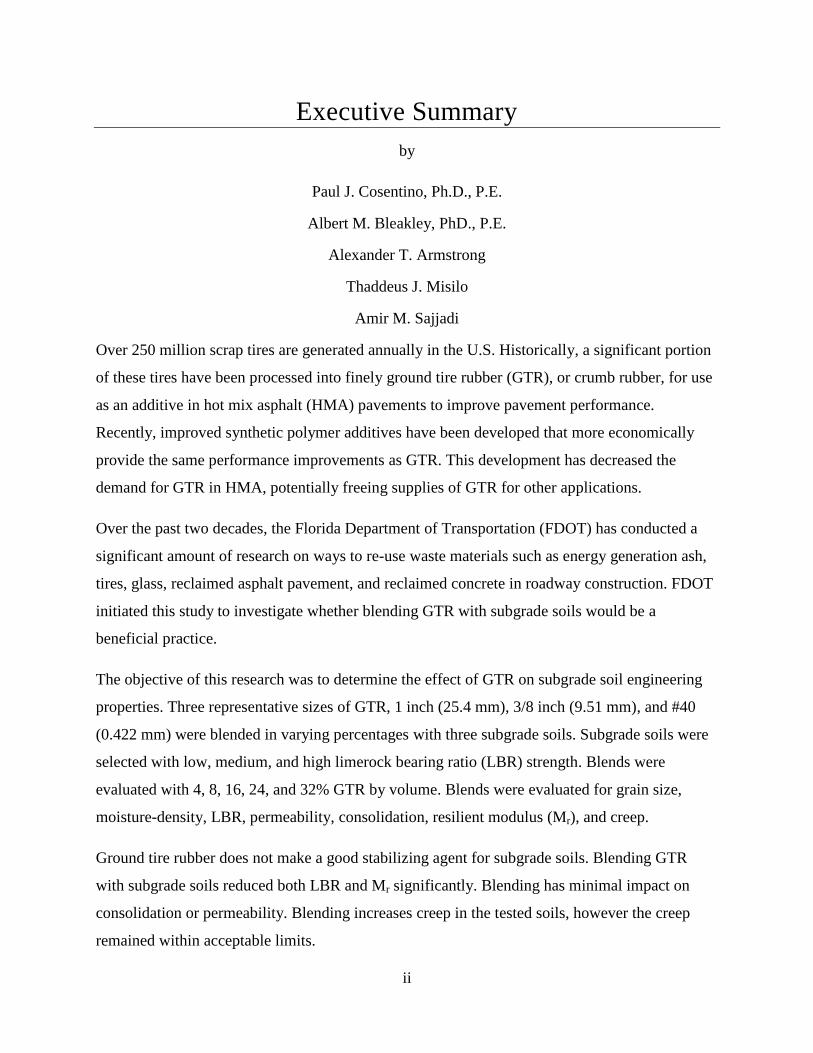
Executive Summary
by
Paul J. Cosentino, Ph.D., P.E.
Albert M. Bleakley, PhD., P.E.
Alexander T. Armstrong
Thaddeus J. Misilo
Amir M. Sajjadi
Over 250 million scrap tires are generated annually in the U.S. Historically, a significant portion
of these tires have been processed into finely ground tire rubber (GTR), or crumb rubber, for use
as an additive in hot mix asphalt (HMA) pavements to improve pavement performance.
Recently, improved synthetic polymer additives have been developed that more economically
provide the same performance improvements as GTR. This development has decreased the
demand for GTR in HMA, potentially freeing supplies of GTR for other applications.
Over the past two decades, the Florida Department of Transportation (FDOT) has conducted a
significant amount of research on ways to re-use waste materials such as energy generation ash,
tires, glass, reclaimed asphalt pavement, and reclaimed concrete in roadway construction. FDOT
initiated this study to investigate whether blending GTR with subgrade soils would be a
beneficial practice.
The objective of this research was to determine the effect of GTR on subgrade soil engineering
properties. Three representative sizes of GTR, 1 inch (25.4 mm), 3/8 inch (9.51 mm), and #40
(0.422 mm) were blended in varying percentages with three subgrade soils. Subgrade soils were
selected with low, medium, and high limerock bearing ratio (LBR) strength. Blends were
evaluated with 4, 8, 16, 24, and 32% GTR by volume. Blends were evaluated for grain size,
moisture-density, LBR, permeability, consolidation, resilient modulus (Mr), and creep.
Ground tire rubber does not make a good stabilizing agent for subgrade soils. Blending GTR
with subgrade soils reduced both LBR and Mr significantly. Blending has minimal impact on
consolidation or permeability. Blending increases creep in the tested soils, however the creep
remained within acceptable limits.

iii
Blending GTR with soil did reduce the density of the blend. Additional research should be
conducted to evaluate whether soil/GTR blends would be suitable for low-density fill
applications where the benefits from reduction in vertical and horizontal soil pressures would
offset the reduction in strength.
iv
Table of Contents
Disclaimer ....................................................................................................................................... ii
Metric Conversion Table ............................................................................................................... iii
Technical Report Documentation Page ............................................................................................
Acknowledgements .......................................................................................................................... i
Executive Summary ........................................................................................................................ ii
Table of Contents ........................................................................................................................... iv
List of Figures ............................................................................................................................... vii
List of Tables .................................................................................................................................. x
List of Abbreviations ..................................................................................................................... xi
1. Introduction ................................................................................................................................. 1
1.1. Objective .............................................................................................................................. 1
1.2. Approach .............................................................................................................................. 1
1.2.1. Task 1: Literature Search .............................................................................................. 1
1.2.2. Task 2: Determine GTR Sources .................................................................................. 2
1.2.3. Task 3: Determine Subgrade Sources ........................................................................... 2
1.2.4. Task 4: Test Program Development ............................................................................. 2
1.2.5. Task 5: Database Development .................................................................................... 2
1.2.6. Task 6: Testing Program Sampling ............................................................................... 2
1.2.7. Task 7: Testing .............................................................................................................. 3
1.2.8. Task 8 Data Reduction: ................................................................................................. 3
1.2.9. Task 9 Data Analysis: ................................................................................................... 3
1.2.10. Task 10 Technology Transfer: .................................................................................... 3
2. Literature Review........................................................................................................................ 4
2.1. Strength-Deformation Characteristics of GTR Blends ........................................................ 4
2.1.1. Shear Strength of Waste Tires-Sand Blends ................................................................. 4
2.1.2. Compressibility and Strength Behavior of Sand-Tire Chip Mixtures........................... 8
v
2.1.3. Determination of Elastic and Plastic Subgrade Soil Parameters for Asphalt Cracking
and Rutting Prediction ....................................................................................................... 11
2.2. Laboratory Performance of GTR Blends ........................................................................... 12
2.3. Creep Behavior of Subgrade Soils ..................................................................................... 16
3. Methodology ............................................................................................................................. 21
3.1. Material Selection .............................................................................................................. 21
3.1.1. Subgrade Soils ............................................................................................................ 21
3.1.2. Ground Tire Rubber (GTR) ........................................................................................ 21
3.2. Volumetric Blending .......................................................................................................... 22
3.3. Testing Procedures ............................................................................................................. 23
3.3.1. Sieve Analysis ............................................................................................................. 23
3.3.2. Atterberg Limits .......................................................................................................... 24
3.3.3. Optimum Moisture Content ........................................................................................ 24
3.3.4. Limerock Bearing Ratio (LBR) Test .......................................................................... 24
3.3.5. Resilient Modulus Test ............................................................................................... 26
3.3.6. Consolidation Test ...................................................................................................... 27
3.3.7. Constant Head Permeability Test ................................................................................ 29
3.3.8. Creep Test ................................................................................................................... 31
4. Findings..................................................................................................................................... 34
4.1. Sieve Analysis Test Results ............................................................................................... 34
4.2. Atterberg Limits Test Results ............................................................................................ 34
4.3. Optimum Moisture Content Test Results .......................................................................... 34
4.4. Limerock Bearing Ratio Test Results ................................................................................ 35
4.5. Resilient Modulus Test Results ......................................................................................... 40
4.6. Consolidation Test Results ................................................................................................ 44
4.7. Constant Head Permeability Test Results .......................................................................... 48
4.8. Creep Test Results ............................................................................................................. 51
4.9. Correlations ........................................................................................................................ 55
5. Conclusions ............................................................................................................................... 57
vi
5.1. Limerock Bearing Ratio Test ............................................................................................. 57
5.2. Resilient Modulus Test ...................................................................................................... 57
5.3. Consolidation Test ............................................................................................................. 57
5.4. Constant Head Permeability Test ...................................................................................... 57
5.5. Creep Test .......................................................................................................................... 57
5.6. CBR- Mr Correlations ........................................................................................................ 58
6. Recommendations ..................................................................................................................... 59
7. References ................................................................................................................................. 60
Appendices ……………………………………………………………………………...64
Appendix List of Figures …...…………………………………………………………. 67
Appendix List of Tables …..……………………………………………………………71
vii
List of Figures
Figure 2-1 Variation of Initial Friction Angle versus Rubber Content for Loose and Compacted
Blends (Ghazavi, 2004) .......................................................................................................... 7
Figure 2-2 Variation in Unit Weight for Sand-Rubber Blends (Ghazavi, 2004) ............................ 8
Figure 2-3 Percent Tire Chips versus Vertical Confined Compressive Strain (adapted from
Venkatappa Rao and Dutta, 2006) .......................................................................................... 9
Figure 2-4 Variation in Cohesion for Sand with Tire Chips Type I, II, III for Percentages up to
20% (after Ventakappa Rao and Dutta, 2006) ...................................................................... 10
Figure 2-5 Variation in Friction Angle for Sand with Tire Chips Type I, II, III for Percentages up
to 20% (adapted from Ventakappa Rao and Dutta, 2006) .................................................... 11
Figure 2-6 Dry Density Results for Tire/Soil Mixture (after Papp et al., 1997) ........................... 13
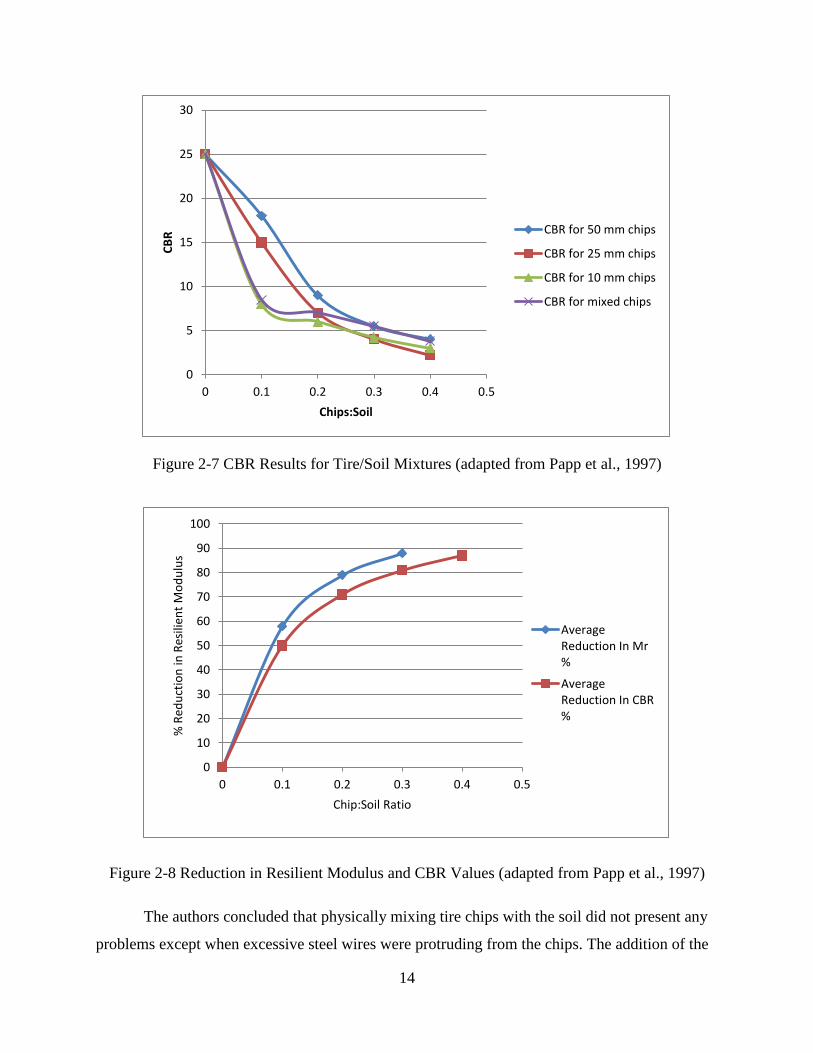
Figure 2-7 CBR Results for Tire/Soil Mixtures (adapted from Papp et al., 1997) ....................... 14
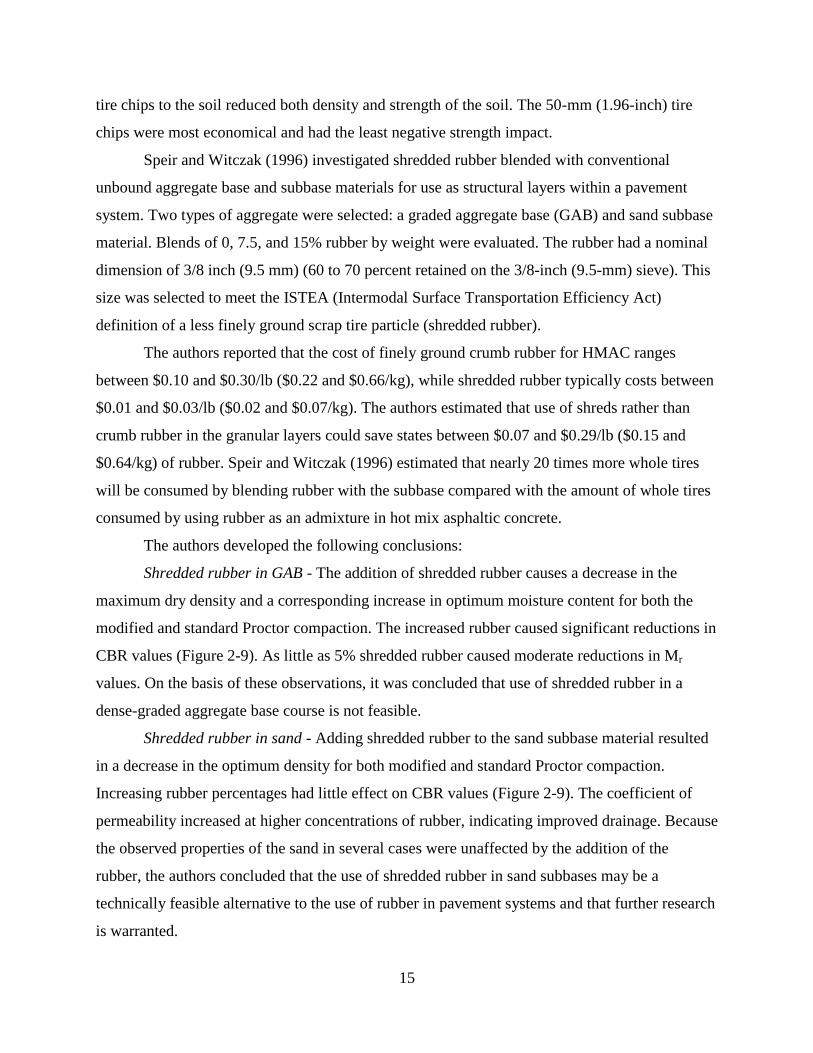
Figure 2-8 Reduction in Resilient Modulus and CBR Values (adapted from Papp et al., 1997) . 14
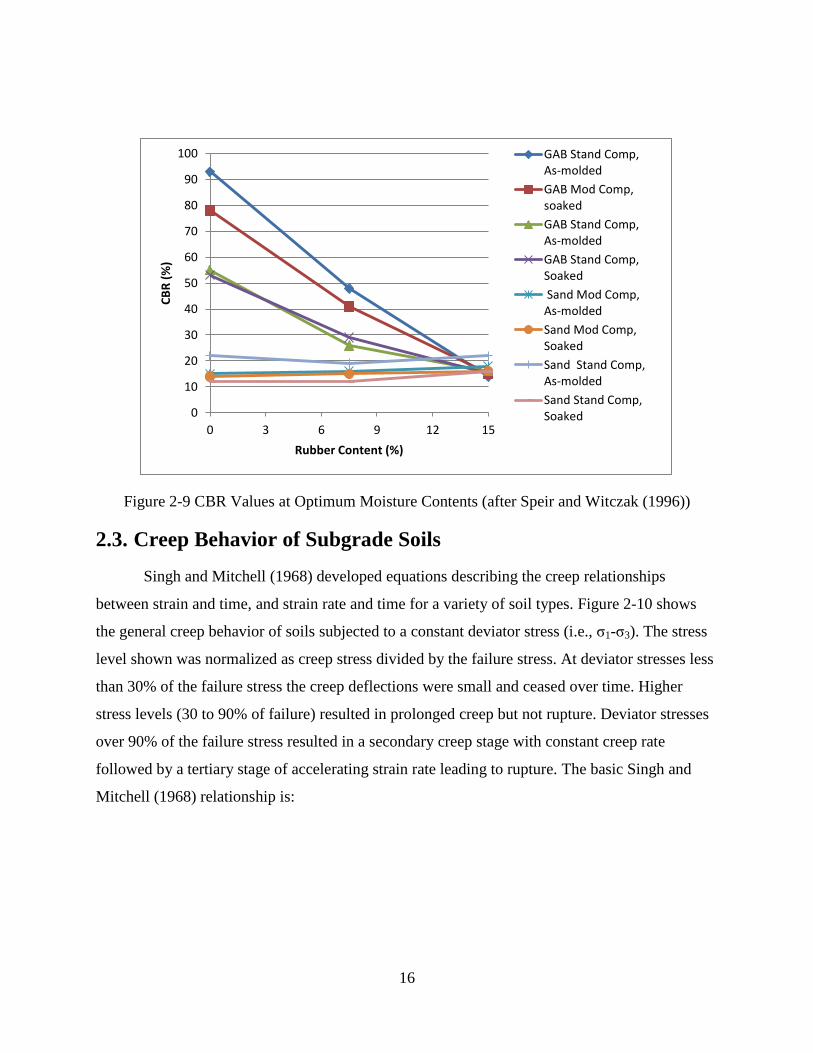
Figure 2-9 CBR Values at Optimum Moisture Contents (after Speir and Witczak (1996))......... 16
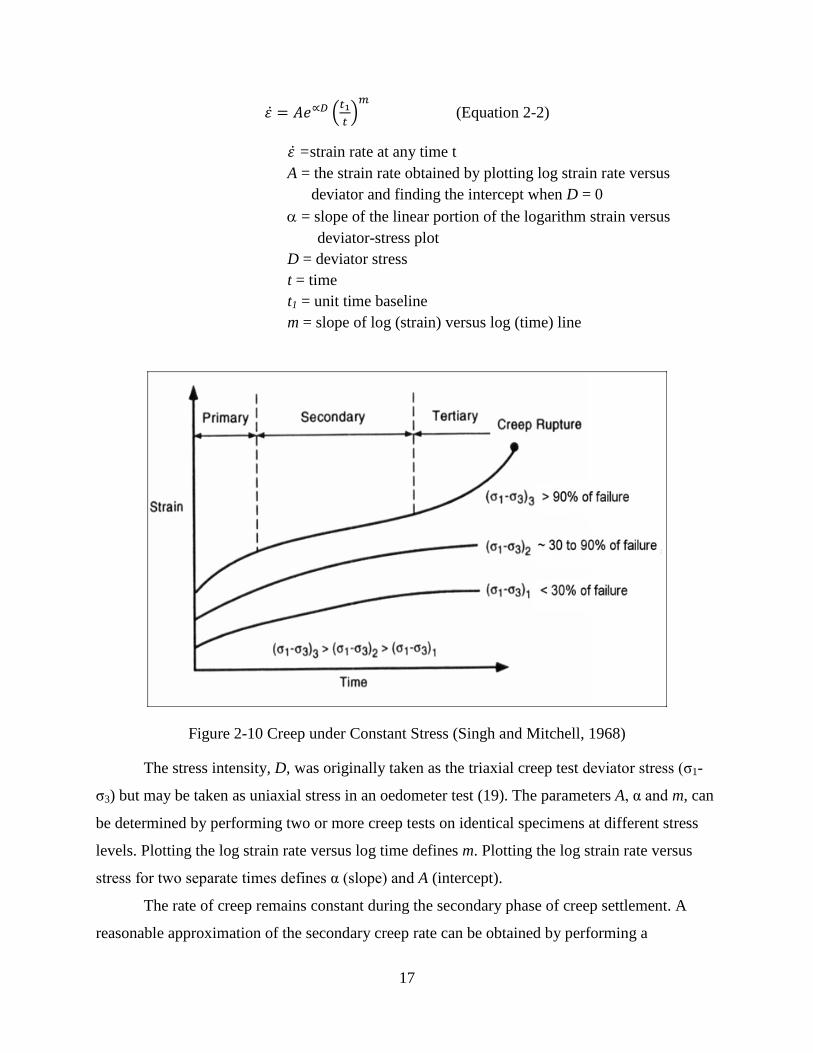
Figure 2-10 Creep under Constant Stress (Singh and Mitchell, 1968) ......................................... 17
Figure 2-11 Typical Creep Test Results in Linear Time and Log(time) ...................................... 18
Figure 2-12 Variation in Creep Strain from A-3 Sands to 100 % RAP (Dikova, 2006) .............. 19
Figure 2-13 Summary of Creep Strain Rates for Various Materials (after Cosentino et al., 2012)
............................................................................................................................................... 20
Figure 3-1 Sieve Shaker with Sieves (Diouf, 2011) ..................................................................... 24
Figure 3-2 a) Modified Proctor Compaction, b) Soaking Specimens ........................................... 25
Figure 3-3 a) LBR Surcharge Plates, b) LBR Test with Surcharge Plates ................................... 26
Figure 3-4 FDOT SMO Resilient Modulus Testing Equipment ................................................... 27
Figure 3-5 a) 4-inch (101.2-mm) Consolidation Apparatus, b) Consolidation Testing................ 28
Figure 3-6 Permeability Test Apparatus ....................................................................................... 30
Figure 3-7 Six Creep Test Devices and Data Acquisition Computer (Diouf, 2011) .................... 32
Figure 3-8 Creep Data Acquisition Program Screen (Cosentino et al., 2012) .............................. 33
Figure 4-1 Average Soaked LBR vs GTR% for High LBR/GTR Blends .................................... 36
Figure 4-2 Average Soaked LBR versus GTR% for Medium LBR/GTR Blends ........................ 36
Figure 4-3 Average Soaked LBR versus GTR% for Low LBR/GTR Blends .............................. 37
viii
Figure 4-4 High LBR Soil Decrease in LBR Value ..................................................................... 37
Figure 4-5 Medium LBR Soil Decrease in LBR Value ................................................................ 38
Figure 4-6 Low LBR Soil Decrease in LBR Value ...................................................................... 38
Figure 4-7 Dry Density versus GTR% for High LBR/GTR Blends ............................................. 39
Figure 4-8 Dry Density versus GTR% for Medium LBR/GTR Blends ....................................... 39
Figure 4-9 Dry Density versus GTR% for Low LBR/GTR Blends.............................................. 40
Figure 4-10 Variation in Resilient Modulus versus High LBR Soil GTR Blends ....................... 41
Figure 4-11 Percent GTR versus Percent Resilient Modulus for High LBR Soil GTR Blends ... 42
Figure 4-12 Variation in Resilient Modulus versus Medium LBR Soil GTR Blends .................. 42
Figure 4-13 Percent GTR versus Resilient Modulus for Medium LBR Soil GTR Blends........... 43
Figure 4-14 Variation in Resilient Modulus versus Low LBR Soil GTR Blends ........................ 43
Figure 4-15 Percent GTR versus Percent Resilient Modulus for Low LBR Soil GTR Blends .... 44
Figure 4-16 Cc versus GTR% for High LBR/GTR Blends ........................................................... 45
Figure 4-17 Cc versus GTR% for Medium LBR/GTR Blends ..................................................... 46
Figure 4-18 Cc versus GTR% for Low LBR/GTR Blends ........................................................... 46
Figure 4-19 Cv versus log-P for High LBR/GTR Blends ............................................................. 47
Figure 4-20 Cv versus log-P for Med LBR/GTR Blends .............................................................. 47
Figure 4-21 Cv versus log-P for Low LBR/GTR Blends .............................................................. 48
Figure 4-22 Hydraulic Conductivity versus GTR% for High LBR/GTR Blends ......................... 49
Figure 4-23 Hydraulic Conductivity versus GTR% for Medium LBR/GTR Blends ................... 50
Figure 4-24 Hydraulic Conductivity versus GTR% for Low LBR/GTR Blends ......................... 50
Figure 4-25 Strain versus Time (Days) for High LBR Material ................................................... 51
Figure 4-26 Strain versus Time (Days) for Medium LBR Material ............................................. 52
Figure 4-27 Strain versus Time (Days) for Low LBR Material ................................................... 52
Figure 4-28 Strain Rate versus GTR Percentage for High LBR Subgrade .................................. 53
Figure 4-29 Strain Rate versus GTR Percentage for Medium LBR Subgrade ............................. 53
Figure 4-30 Strain Rate versus GTR Percentage for Low LBR Subgrade ................................... 54
Figure 4-31 Summary of Creep Strain Rates for Various Materials with GTR Blends ............... 54
Figure 4-32 Comparisons between Mr and CBR from Low, Medium and High LBR/GTR Blends
............................................................................................................................................... 55

ix
x
List of Tables
Table 2-1 Literature Survey (after Ghazavi, 2004) ......................................................................... 5
Table 2-2 Density of Rubber/Soil Blends (Ghazavi, 2004) ............................................................ 6
Table 2-3 Confined Vertical Compressive Strain for Sand-Tire Chip Admixtures (after
Venkatappa Rao and Dutta, 2006) .......................................................................................... 9
Table 3-1 Soil Sources Selected for Investigation ........................................................................ 21
Table 3-2 Summary of GTR-Subgrade Soils Blend Percentages by Weight and Volume ........... 22
Table 3-3 Sieve Sizes .................................................................................................................... 23
Table 4-1 Summary of Grain Size Data for Three Subgrade Sources .......................................... 34
Table 4-2 Summary of Modified Proctor Tests on Subgrade Sources ......................................... 35
Table 4-3 LBR for Virgin Subgrade Soils .................................................................................... 35
Table 4-4 Compression Index for Virgin Soils ............................................................................. 44
Table 4-5 Hydraulic Conductivity Values for Virgin Soils .......................................................... 48
Table 4-6 Summary of Mr versus CBR Correlations from Subgrade/GTR Blends ...................... 56
xi
List of Abbreviations
AASHTO – American Association of State Highway and Transportation Officials
ARL – Applied Research Laboratory on FIT’s Campus
ASTM – American Standard for Testing and Materials
FDOT – Florida Department of Transportation
FIT – Florida Institute of Technology
FM – Florida Method
GTR – Ground Tire Rubber
High – High LBR Subgrade Material
LBR – Limerock Bearing Ratio
Low – Low LBR Subgrade Material
Medium – Medium LBR Subgrade Material
Mr- Resilient Modulus
SMO – State Materials Office
1
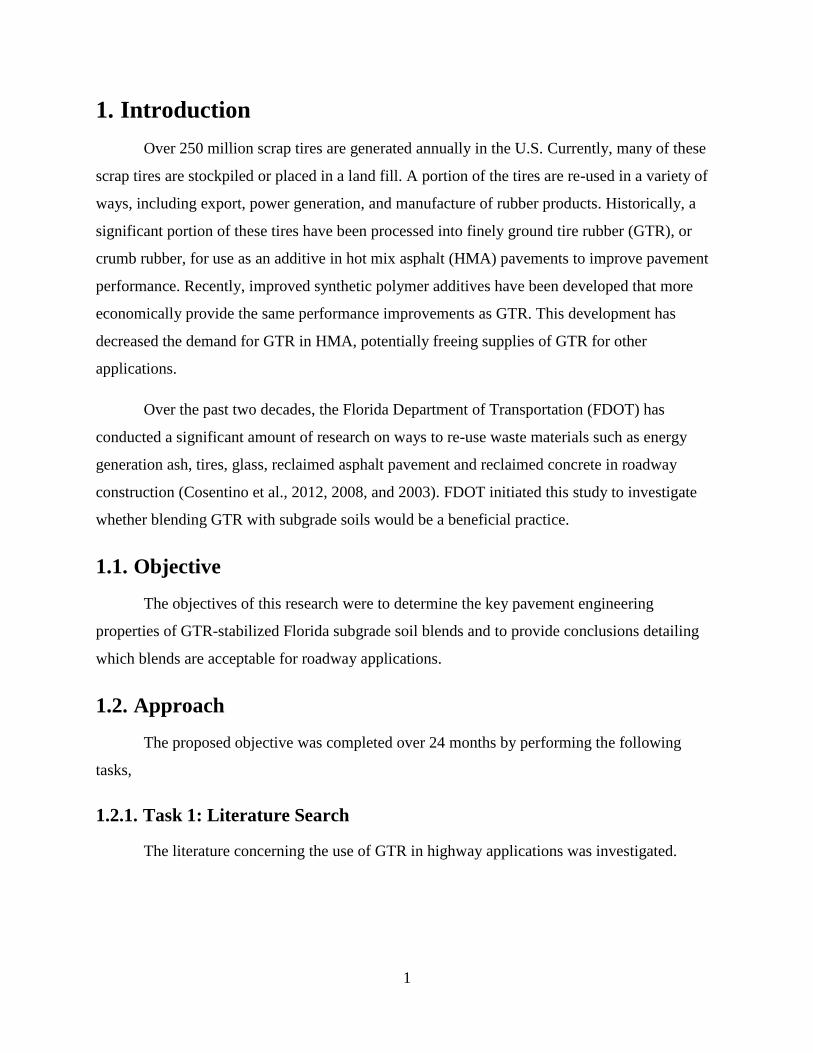
1. Introduction
Over 250 million scrap tires are generated annually in the U.S. Currently, many of these
scrap tires are stockpiled or placed in a land fill. A portion of the tires are re-used in a variety of
ways, including export, power generation, and manufacture of rubber products. Historically, a
significant portion of these tires have been processed into finely ground tire rubber (GTR), or
crumb rubber, for use as an additive in hot mix asphalt (HMA) pavements to improve pavement
performance. Recently, improved synthetic polymer additives have been developed that more
economically provide the same performance improvements as GTR. This development has
decreased the demand for GTR in HMA, potentially freeing supplies of GTR for other
applications.
Over the past two decades, the Florida Department of Transportation (FDOT) has
conducted a significant amount of research on ways to re-use waste materials such as energy
generation ash, tires, glass, reclaimed asphalt pavement and reclaimed concrete in roadway
construction (Cosentino et al., 2012, 2008, and 2003). FDOT initiated this study to investigate
whether blending GTR with subgrade soils would be a beneficial practice.
1.1. Objective
The objectives of this research were to determine the key pavement engineering
properties of GTR-stabilized Florida subgrade soil blends and to provide conclusions detailing
which blends are acceptable for roadway applications.
1.2. Approach
The proposed objective was completed over 24 months by performing the following
tasks,
1.2.1. Task 1: Literature Search
The literature concerning the use of GTR in highway applications was investigated.
2
1.2.2. Task 2: Determine GTR Sources
Several Florida GTR producers were identified and contacted. Meetings were conducted
with the key suppliers and the goals of our research were conveyed. Based on these discussions,
the team selected a GTR supplier and range of nominal sizes to test.
1.2.3. Task 3: Determine Subgrade Sources
LBR was the basic engineering property used to select sources for the subgrade materials.
FDOT’s State Materials Office (SMO) aided in obtaining these materials. A range of subgrade
soils were selected including:
1) Poor bearing materials with an LBR in the 20 to 30 range (typically an A-3 fine
sand));
2) Good bearing materials with an LBR in the 50 to 60 range (typically an A-2-4 silty or
clayey sand) and
3) Marginal bearing materials with an LBR of approximately 40 (typically borderline A-
3/A-2-4 soils).
1.2.4. Task 4: Test Program Development
A testing program was developed to evaluate engineering properties of the GTR/subgrade
soil blends. The research team determined that in addition to grain size, strength-deformation and
drainage characteristics were critical to understanding the behavior of GTR/Subgrade blends.
1.2.5. Task 5: Database Development
A database was developed to store, retrieve, and analyze specified results. This task
produced improvements in data manipulation and retrieval. Appendix H contains an outline of
the database system and portions of the software to give the reader an overview.
1.2.6. Task 6: Testing Program Sampling
Samples of sufficient size were obtained from approved FDOT GTR subgrade soil
sources. Proper sampling protocol was followed to obtain all samples. Samples were transported
from the source location to the Florida Institute of Technology Highway Engineering Research
Laboratory.
3
1.2.7. Task 7: Testing
The following tests were conducted:
1. Grain Size (FM 1-T 027 Sieve Analysis for Coarse and Fine Aggregates)
2. Atterberg Limits (ASTM T-89 and T-90)
3. Permeability (FM 1-T215 Constant Head Testing)
4. Moisture-Density (FM 1-T 180 Modified Proctor Testing)
5. Soaked LBR (FM 5-515)
6. Resilient Modulus (AASHTO T 307 Resilient Modulus) with testing performed by
FDOT SMO.
7. Consolidation testing on selected soils and associated GTR blends
8. Creep testing on selected soils and associated GTR blends (one-dimensional oedometer
test developed at FIT).
1.2.8. Task 8 Data Reduction:
The data obtained during the testing program was reduced to useful engineering tabular
and graphical formats. The database system was used to categorize the data for use in the
analysis.
1.2.9. Task 9 Data Analysis:
The reduced data was analyzed to determine useful correlations related to the overall
project objective. These findings are presented in this report.
1.2.10. Task 10 Technology Transfer:
Quarterly Progress reports were prepared throughout the research, presentations were
made to FDOT personnel throughout Florida at annual Geotechnical Research in Progress
(GRIP) meetings, and a comprehensive final report was prepared for the technology transfer.
4
2. Literature Review
The team conducted a literature search to identify previous research on blends of ground
tire rubber and base or subbase soils.
2.1. Strength-Deformation Characteristics of GTR Blends
2.1.1. Shear Strength of Waste Tires-Sand Blends
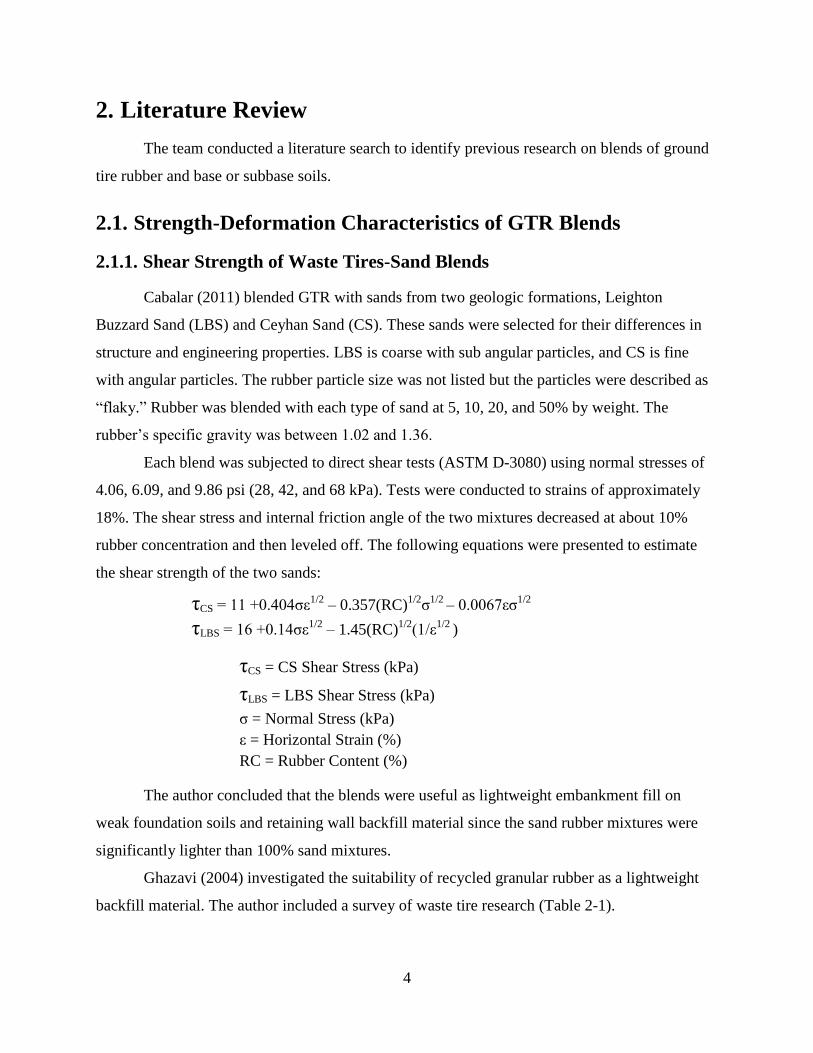
Cabalar (2011) blended GTR with sands from two geologic formations, Leighton
Buzzard Sand (LBS) and Ceyhan Sand (CS). These sands were selected for their differences in
structure and engineering properties. LBS is coarse with sub angular particles, and CS is fine
with angular particles. The rubber particle size was not listed but the particles were described as
“flaky.” Rubber was blended with each type of sand at 5, 10, 20, and 50% by weight. The
rubber’s specific gravity was between 1.02 and 1.36.
Each blend was subjected to direct shear tests (ASTM D-3080) using normal stresses of
4.06, 6.09, and 9.86 psi (28, 42, and 68 kPa). Tests were conducted to strains of approximately
18%. The shear stress and internal friction angle of the two mixtures decreased at about 10%
rubber concentration and then leveled off. The following equations were presented to estimate
the shear strength of the two sands:
τCS = 11 +0.404σε1/2
– 0.357(RC)1/2
σ1/2
– 0.0067εσ1/2
τLBS = 16 +0.14σε1/2
– 1.45(RC)1/2
(1/ε1/2
)
τCS = CS Shear Stress (kPa)
τLBS = LBS Shear Stress (kPa)
σ = Normal Stress (kPa)
ε = Horizontal Strain (%)
RC = Rubber Content (%)
The author concluded that the blends were useful as lightweight embankment fill on
weak foundation soils and retaining wall backfill material since the sand rubber mixtures were
significantly lighter than 100% sand mixtures.
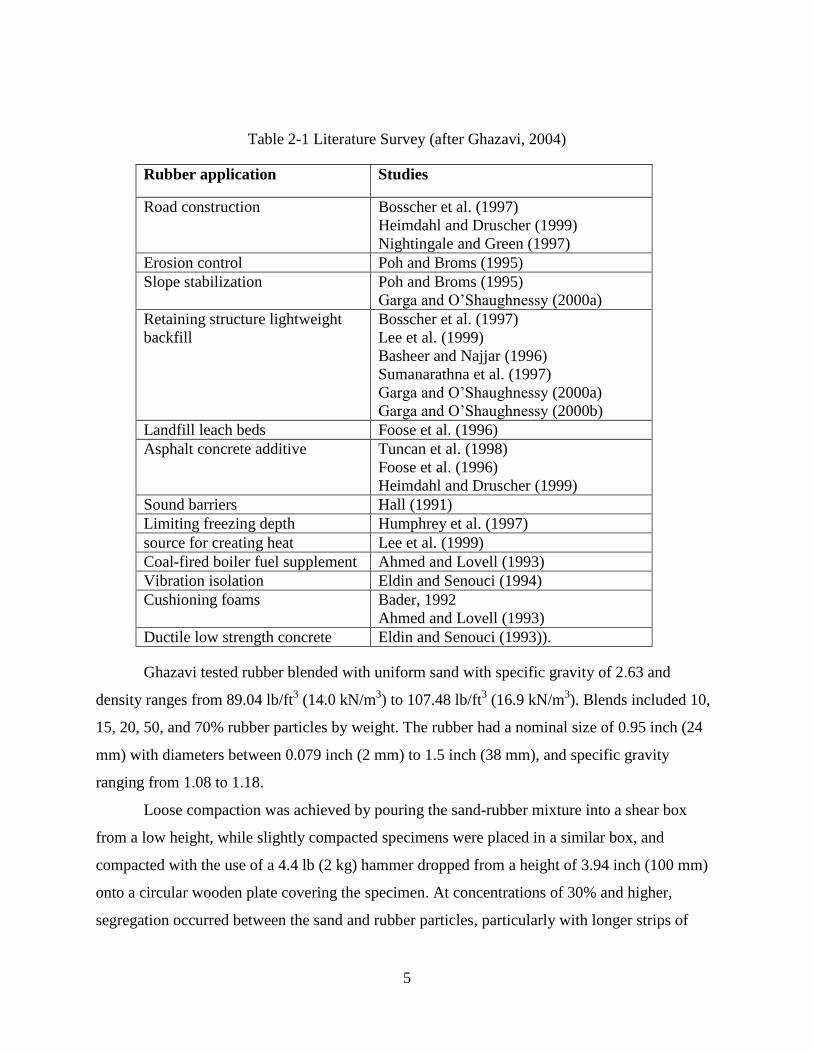
Ghazavi (2004) investigated the suitability of recycled granular rubber as a lightweight
backfill material. The author included a survey of waste tire research (Table 2-1).
5
Table 2-1 Literature Survey (after Ghazavi, 2004)
Rubber application Studies
Road construction Bosscher et al. (1997)
Heimdahl and Druscher (1999)
Nightingale and Green (1997)
Erosion control Poh and Broms (1995)
Slope stabilization Poh and Broms (1995)
Garga and O’Shaughnessy (2000a)
Retaining structure lightweight
backfill
Bosscher et al. (1997)
Lee et al. (1999)
Basheer and Najjar (1996)
Sumanarathna et al. (1997)
Garga and O’Shaughnessy (2000a)
Garga and O’Shaughnessy (2000b)
Landfill leach beds Foose et al. (1996)
Asphalt concrete additive Tuncan et al. (1998)
Foose et al. (1996)
Heimdahl and Druscher (1999)
Sound barriers Hall (1991)
Limiting freezing depth Humphrey et al. (1997)
source for creating heat Lee et al. (1999)
Coal-fired boiler fuel supplement Ahmed and Lovell (1993)
Vibration isolation Eldin and Senouci (1994)
Cushioning foams Bader, 1992
Ahmed and Lovell (1993)
Ductile low strength concrete Eldin and Senouci (1993)).
Ghazavi tested rubber blended with uniform sand with specific gravity of 2.63 and
density ranges from 89.04 lb/ft3 (14.0 kN/m
3) to 107.48 lb/ft
3 (16.9 kN/m
3). Blends included 10,
15, 20, 50, and 70% rubber particles by weight. The rubber had a nominal size of 0.95 inch (24
mm) with diameters between 0.079 inch (2 mm) to 1.5 inch (38 mm), and specific gravity
ranging from 1.08 to 1.18.
Loose compaction was achieved by pouring the sand-rubber mixture into a shear box
from a low height, while slightly compacted specimens were placed in a similar box, and
compacted with the use of a 4.4 lb (2 kg) hammer dropped from a height of 3.94 inch (100 mm)
onto a circular wooden plate covering the specimen. At concentrations of 30% and higher,
segregation occurred between the sand and rubber particles, particularly with longer strips of
6
rubber. A summary of the densities achieved with the two-compaction techniques is presented in
Table 2-2.
Table 2-2 Density of Rubber/Soil Blends (Ghazavi, 2004)
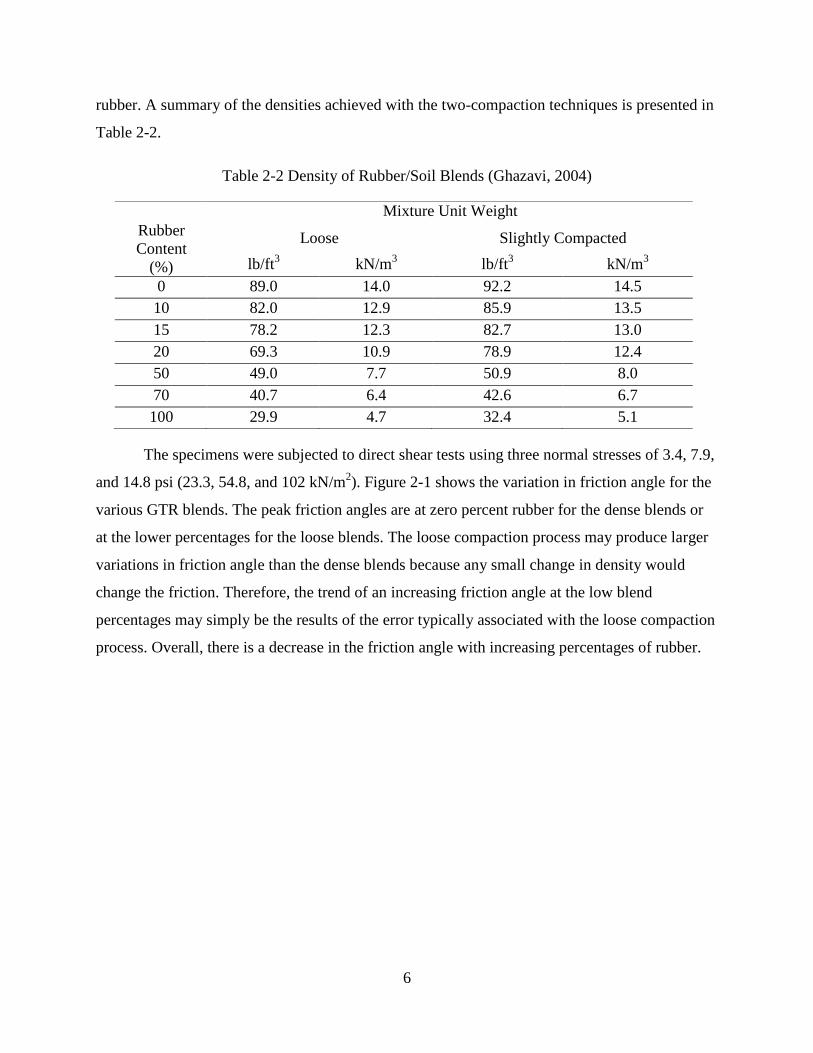
The specimens were subjected to direct shear tests using three normal stresses of 3.4, 7.9,
and 14.8 psi (23.3, 54.8, and 102 kN/m2). Figure 2-1 shows the variation in friction angle for the
various GTR blends. The peak friction angles are at zero percent rubber for the dense blends or
at the lower percentages for the loose blends. The loose compaction process may produce larger
variations in friction angle than the dense blends because any small change in density would
change the friction. Therefore, the trend of an increasing friction angle at the low blend
percentages may simply be the results of the error typically associated with the loose compaction
process. Overall, there is a decrease in the friction angle with increasing percentages of rubber.
Mixture Unit Weight
Rubber
Content
(%)
Loose Slightly Compacted
lb/ft3
kN/m3
lb/ft3 kN/m
3
0 89.0 14.0 92.2 14.5
10 82.0 12.9 85.9 13.5
15 78.2 12.3 82.7 13.0
20 69.3 10.9 78.9 12.4
50 49.0 7.7 50.9 8.0
70 40.7 6.4 42.6 6.7
100 29.9 4.7 32.4 5.1
7
Figure 2-1 Variation of Initial Friction Angle versus Rubber Content for Loose and Compacted
Blends (Ghazavi, 2004)
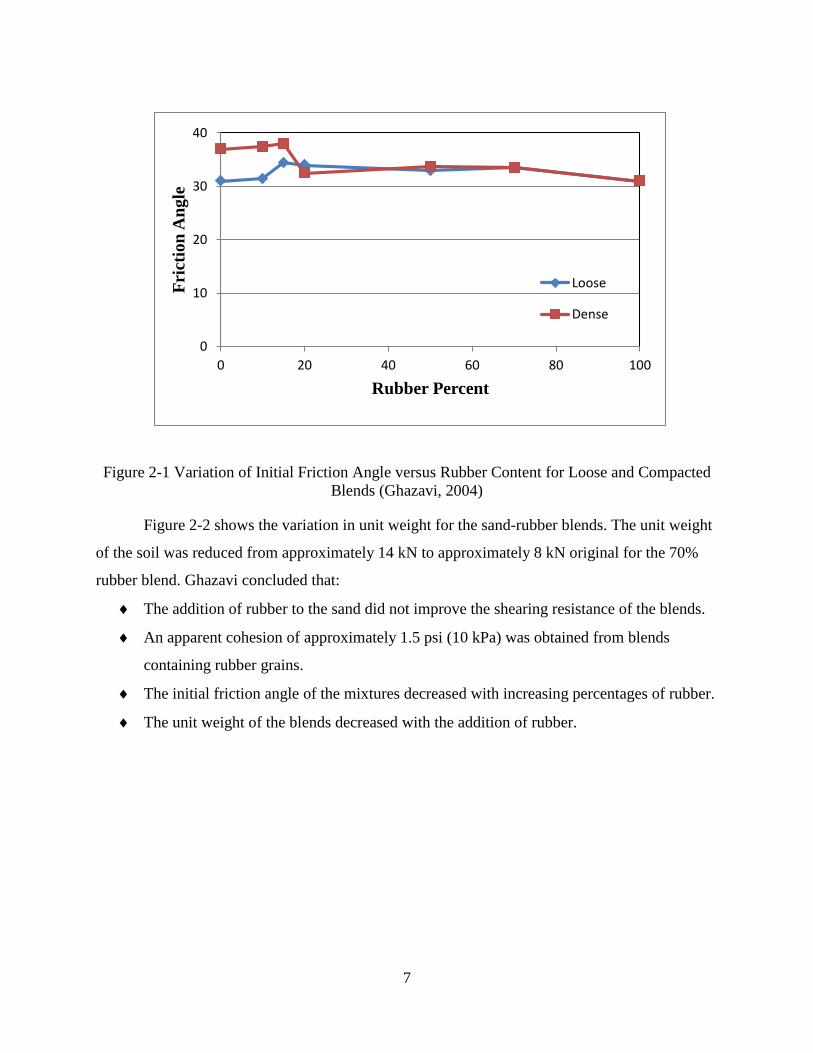
Figure 2-2 shows the variation in unit weight for the sand-rubber blends. The unit weight
of the soil was reduced from approximately 14 kN to approximately 8 kN original for the 70%
rubber blend. Ghazavi concluded that:
The addition of rubber to the sand did not improve the shearing resistance of the blends.
An apparent cohesion of approximately 1.5 psi (10 kPa) was obtained from blends
containing rubber grains.
The initial friction angle of the mixtures decreased with increasing percentages of rubber.
The unit weight of the blends decreased with the addition of rubber.
0
10
20
30
40
0 20 40 60 80 100
Fri
ctio
n A
ng
le
Rubber Percent
Loose
Dense
8
Figure 2-2 Variation in Unit Weight for Sand-Rubber Blends (Ghazavi, 2004)
2.1.2. Compressibility and Strength Behavior of Sand-Tire Chip Mixtures
Ventatappa and Dutta (2006) performed a study with the objective of determining the
compressibility and strength characteristics of sand and tire (termed “tyre”) chip mixtures. The
researchers in this study assessed the suitability of sand-tire chip mixtures for embankments or
other road development.
Three sizes of waste tire pieces were used: 0.39 inch x 0.39 inch (10 mm x 10 mm), 0.39
inch x 0.78 inch (10 mm x 20 mm), and 0.78 inch x 0.78 inch (20 mm x 20 mm). The specific
gravity of the rubber ranged from 1.02 to 1.26, with an average value used of 1.15. Rubber
content had more influence on density than compaction energy, and vibratory compaction was
ineffective. The rubber chips experienced most of their compression during initial loading stages
and had little elastic rebound, implying that preloading could be useful in reducing consolidation.
The experimental program consisted of confined compressibility, cyclic loading, and
triaxial tests. The concentrations of rubber ranged from 0-100% for compressibility, and 0-20%
for all other tests. Higher rubber concentrations deformed vertically and horizontally at stresses
of over 29 psi (200 kPa).
9
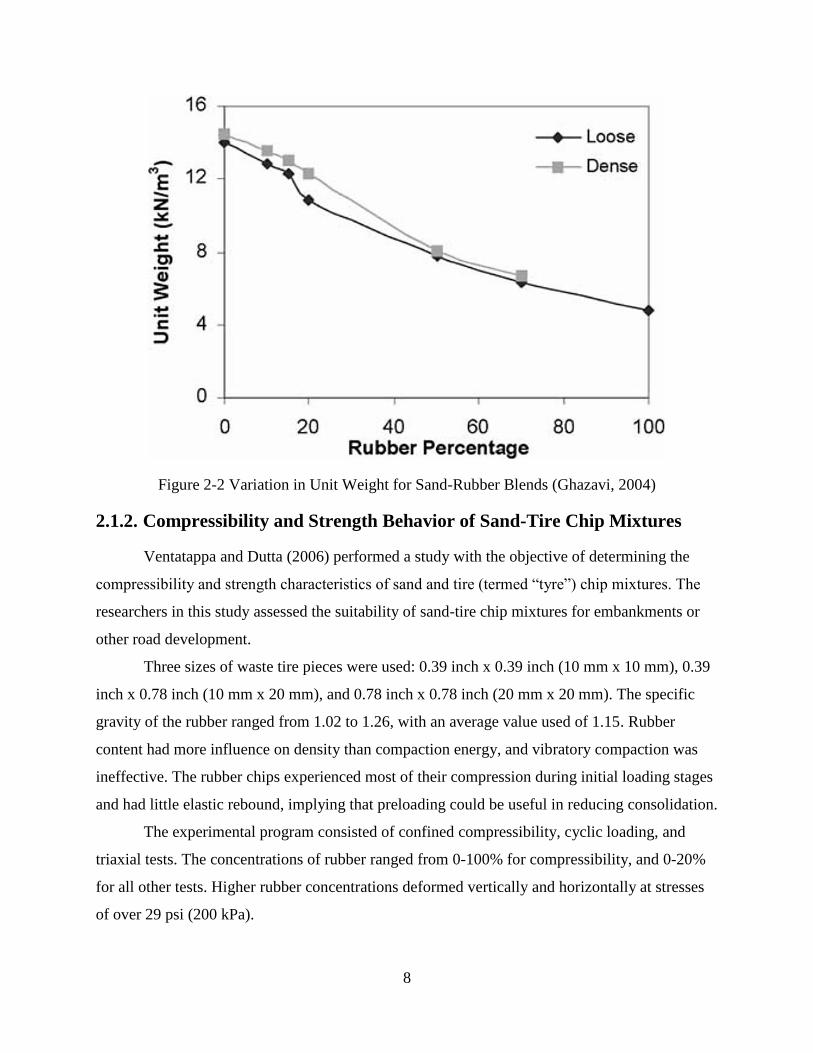
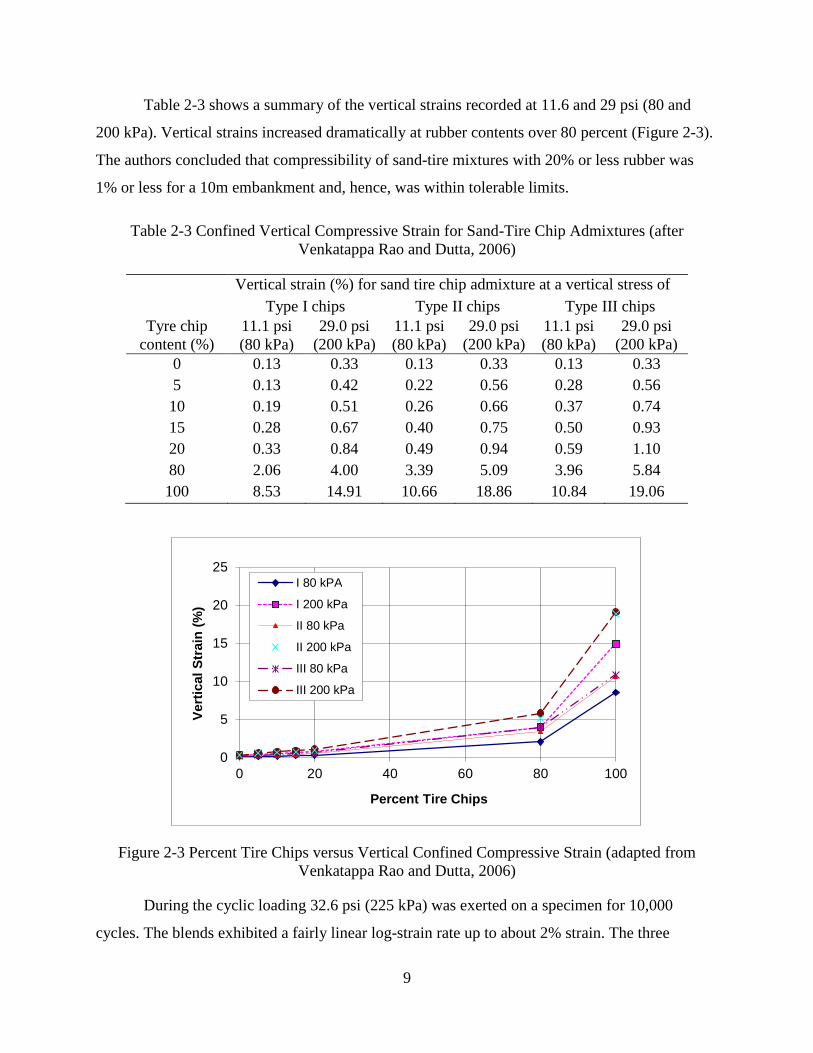
Table 2-3 shows a summary of the vertical strains recorded at 11.6 and 29 psi (80 and
200 kPa). Vertical strains increased dramatically at rubber contents over 80 percent (Figure 2-3).
The authors concluded that compressibility of sand-tire mixtures with 20% or less rubber was
1% or less for a 10m embankment and, hence, was within tolerable limits.
Table 2-3 Confined Vertical Compressive Strain for Sand-Tire Chip Admixtures (after
Venkatappa Rao and Dutta, 2006)
Vertical strain (%) for sand tire chip admixture at a vertical stress of
Type I chips Type II chips Type III chips Tyre chip
content (%) 11.1 psi
(80 kPa) 29.0 psi
(200 kPa)
11.1 psi
(80 kPa) 29.0 psi
(200 kPa) 11.1 psi
(80 kPa) 29.0 psi
(200 kPa) 0 0.13 0.33 0.13 0.33 0.13 0.33
5 0.13 0.42 0.22 0.56 0.28 0.56
10 0.19 0.51 0.26 0.66 0.37 0.74
15 0.28 0.67 0.40 0.75 0.50 0.93
20 0.33 0.84 0.49 0.94 0.59 1.10
80 2.06 4.00 3.39 5.09 3.96 5.84
100 8.53 14.91 10.66 18.86 10.84 19.06
Figure 2-3 Percent Tire Chips versus Vertical Confined Compressive Strain (adapted from
Venkatappa Rao and Dutta, 2006)
During the cyclic loading 32.6 psi (225 kPa) was exerted on a specimen for 10,000
cycles. The blends exhibited a fairly linear log-strain rate up to about 2% strain. The three
0
5
10
15
20
25
0 20 40 60 80 100
Vert
ical
Str
ain
(%
)
Percent Tire Chips
I 80 kPA
I 200 kPa
II 80 kPa
II 200 kPa
III 80 kPa
III 200 kPa
10
different types of waste tire rubber produced no measureable differences in cyclic
compressibility.
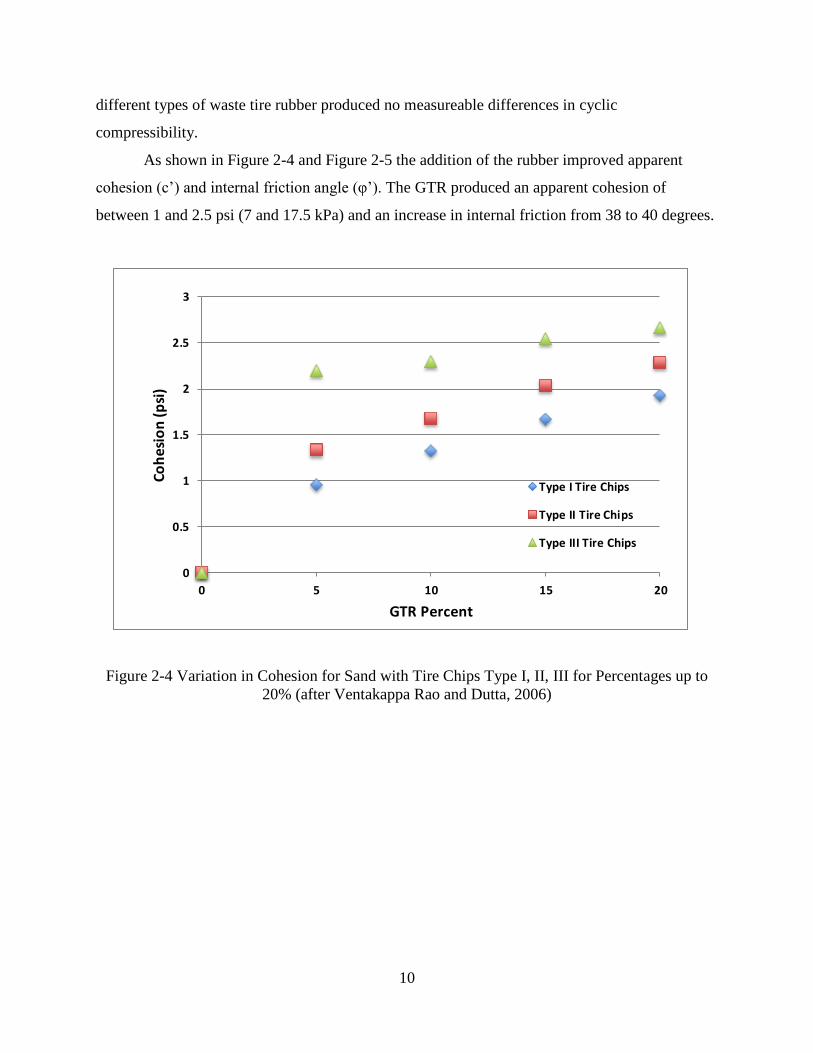
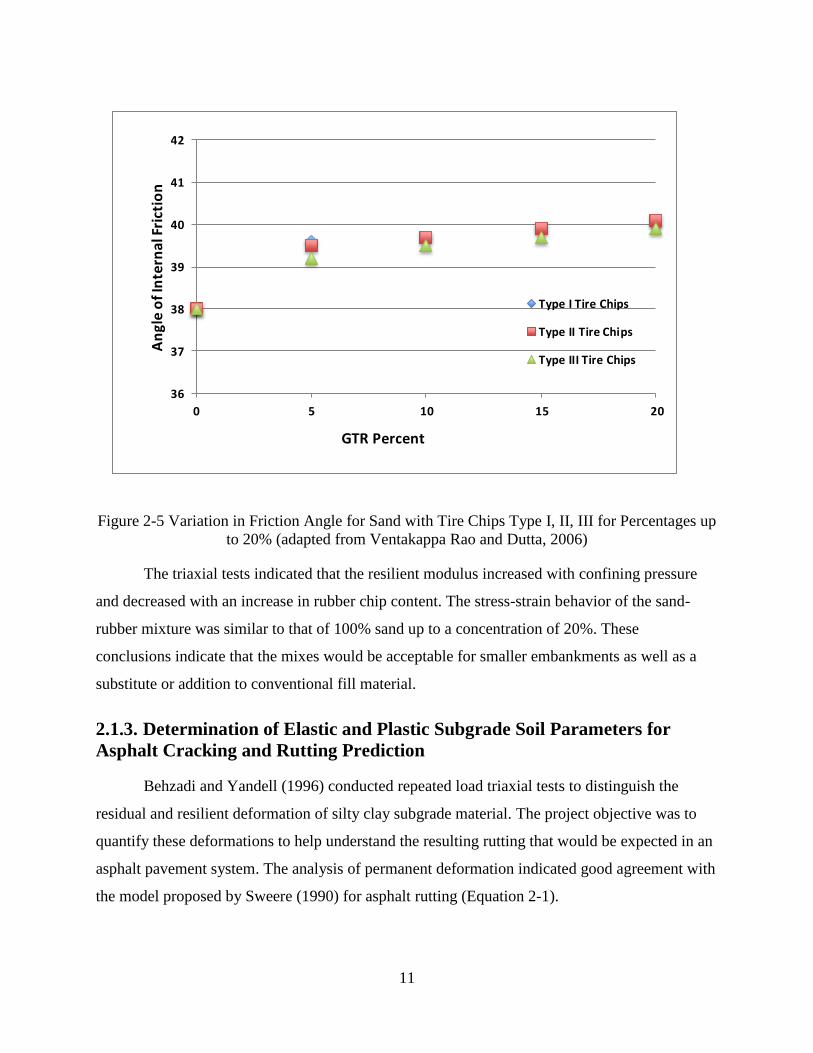
As shown in Figure 2-4 and Figure 2-5 the addition of the rubber improved apparent
cohesion (c’) and internal friction angle (φ’). The GTR produced an apparent cohesion of
between 1 and 2.5 psi (7 and 17.5 kPa) and an increase in internal friction from 38 to 40 degrees.
Figure 2-4 Variation in Cohesion for Sand with Tire Chips Type I, II, III for Percentages up to
20% (after Ventakappa Rao and Dutta, 2006)
0
0.5
1
1.5
2
2.5
3
0 5 10 15 20
Coh
esio
n (p
si)
GTR Percent
Type I Tire Chips
Type II Tire Chips
Type III Tire Chips
11
Figure 2-5 Variation in Friction Angle for Sand with Tire Chips Type I, II, III for Percentages up
to 20% (adapted from Ventakappa Rao and Dutta, 2006)
The triaxial tests indicated that the resilient modulus increased with confining pressure
and decreased with an increase in rubber chip content. The stress-strain behavior of the sand-
rubber mixture was similar to that of 100% sand up to a concentration of 20%. These
conclusions indicate that the mixes would be acceptable for smaller embankments as well as a
substitute or addition to conventional fill material.
2.1.3. Determination of Elastic and Plastic Subgrade Soil Parameters for
Asphalt Cracking and Rutting Prediction
Behzadi and Yandell (1996) conducted repeated load triaxial tests to distinguish the
residual and resilient deformation of silty clay subgrade material. The project objective was to
quantify these deformations to help understand the resulting rutting that would be expected in an
asphalt pavement system. The analysis of permanent deformation indicated good agreement with
the model proposed by Sweere (1990) for asphalt rutting (Equation 2-1).
36
37
38
39
40
41
42
0 5 10 15 20
An
gle
of
Inte
rna
l Fri
ctio
n
GTR Percent
Type I Tire Chips
Type II Tire Chips
Type III Tire Chips
12
where
εp = plastic strain (rutting)
S = the slope of the log (ε) versus log (N) plot
I = the intercept of the log (ε) versus log (N) plot
N = the number of load cycles
The slope, S, was found to be independent of stress and density, but very small increases
were observed as moisture content increased. The intercept, I, was found to be more sensitive to
deviator stress. The test results also indicated that I increased with increasing moisture content
and decreased as dry density increased. The analysis produced an exponential relationship
between I and deviator stress. This model would be able to predict the plastic strain under any
number of loads at any specified stress level. The resilient modulus rapidly decreased initially
with increasing deviator stress and then increased slightly or was nearly constant.
2.2. Laboratory Performance of GTR Blends
Papp et al., (1997) conducted research on shredded scrap tires blended with subbase soils
under flexible pavements. Resilient modulus (Mr) testing was used to determine the plastic and
elastic strains. Tests were conducted on cohesionless soils blended with varying amounts of
shredded tire chips. Blend ratios ranged from 0.1 to 0.5 tire chips to soil by dry weight. The
performance of the shredded tire blends was compared to that of the naturally occurring virgin
soil used in subbase applications in New Jersey.
The authors discussed compaction method, optimum shredded tire to soil ratio, optimum
size and gradation of shredded tire chips, and California Bearing Ratio (CBR)strength testing. .
They noted that steel protruding from the tire chips caused mixing problems. The authors cited
production costs of $0.14 per tire for 1.96 inch (50 mm) chips and $0.26 per tire for 0.98 inch
(25 mm) chips. Costs were based on a production rate of 500 tires per hour. The specific gravity
of the tire chips ranged from 1.235 to 0.986, with 1.1 used for the blending calculations. The
virgin subbase was clean well-graded sand with 2% passing #200 sieve (A-1-a).
εp = INS
Equation 2-1
13
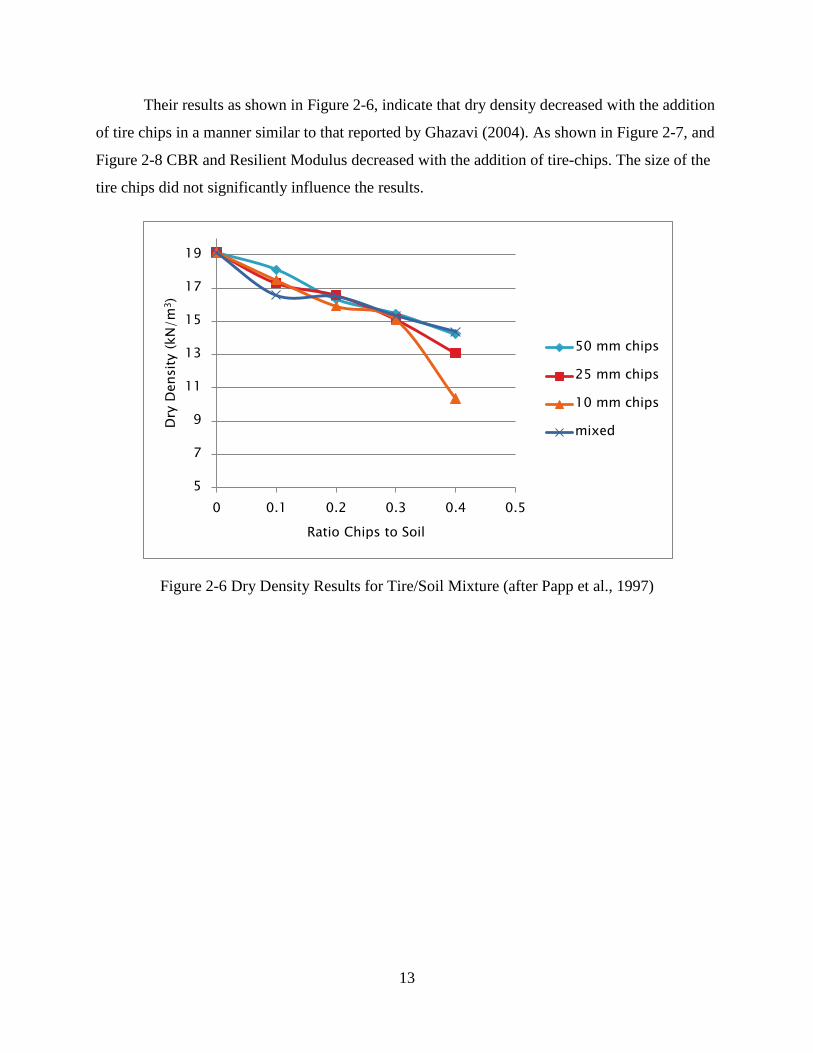
Their results as shown in Figure 2-6, indicate that dry density decreased with the addition
of tire chips in a manner similar to that reported by Ghazavi (2004). As shown in Figure 2-7, and
Figure 2-8 CBR and Resilient Modulus decreased with the addition of tire-chips. The size of the
tire chips did not significantly influence the results.
Figure 2-6 Dry Density Results for Tire/Soil Mixture (after Papp et al., 1997)
5
7
9
11
13
15
17
19
0 0.1 0.2 0.3 0.4 0.5
Dry
Densit
y (
kN
/m
3)
Ratio Chips to Soil
50 mm chips
25 mm chips
10 mm chips
mixed
14
Figure 2-7 CBR Results for Tire/Soil Mixtures (adapted from Papp et al., 1997)
Figure 2-8 Reduction in Resilient Modulus and CBR Values (adapted from Papp et al., 1997)
The authors concluded that physically mixing tire chips with the soil did not present any
problems except when excessive steel wires were protruding from the chips. The addition of the
0
5
10
15
20
25
30
0 0.1 0.2 0.3 0.4 0.5
CB
R
Chips:Soil
CBR for 50 mm chips
CBR for 25 mm chips
CBR for 10 mm chips
CBR for mixed chips
0
10
20
30
40
50
60
70
80
90
100
0 0.1 0.2 0.3 0.4 0.5
% R
edu
ctio
n in
Res
ilien
t M
od
ulu
s
Chip:Soil Ratio
AverageReduction In Mr%
AverageReduction In CBR%
15
tire chips to the soil reduced both density and strength of the soil. The 50-mm (1.96-inch) tire
chips were most economical and had the least negative strength impact.
Speir and Witczak (1996) investigated shredded rubber blended with conventional
unbound aggregate base and subbase materials for use as structural layers within a pavement
system. Two types of aggregate were selected: a graded aggregate base (GAB) and sand subbase
material. Blends of 0, 7.5, and 15% rubber by weight were evaluated. The rubber had a nominal
dimension of 3/8 inch (9.5 mm) (60 to 70 percent retained on the 3/8-inch (9.5-mm) sieve). This
size was selected to meet the ISTEA (Intermodal Surface Transportation Efficiency Act)
definition of a less finely ground scrap tire particle (shredded rubber).
The authors reported that the cost of finely ground crumb rubber for HMAC ranges
between $0.10 and $0.30/lb ($0.22 and $0.66/kg), while shredded rubber typically costs between
$0.01 and $0.03/lb ($0.02 and $0.07/kg). The authors estimated that use of shreds rather than
crumb rubber in the granular layers could save states between $0.07 and $0.29/lb ($0.15 and
$0.64/kg) of rubber. Speir and Witczak (1996) estimated that nearly 20 times more whole tires
will be consumed by blending rubber with the subbase compared with the amount of whole tires
consumed by using rubber as an admixture in hot mix asphaltic concrete.
The authors developed the following conclusions:
Shredded rubber in GAB - The addition of shredded rubber causes a decrease in the
maximum dry density and a corresponding increase in optimum moisture content for both the
modified and standard Proctor compaction. The increased rubber caused significant reductions in
CBR values (Figure 2-9). As little as 5% shredded rubber caused moderate reductions in Mr
values. On the basis of these observations, it was concluded that use of shredded rubber in a
dense-graded aggregate base course is not feasible.
Shredded rubber in sand - Adding shredded rubber to the sand subbase material resulted
in a decrease in the optimum density for both modified and standard Proctor compaction.
Increasing rubber percentages had little effect on CBR values (Figure 2-9). The coefficient of
permeability increased at higher concentrations of rubber, indicating improved drainage. Because
the observed properties of the sand in several cases were unaffected by the addition of the
rubber, the authors concluded that the use of shredded rubber in sand subbases may be a
technically feasible alternative to the use of rubber in pavement systems and that further research
is warranted.
16
Figure 2-9 CBR Values at Optimum Moisture Contents (after Speir and Witczak (1996))
2.3. Creep Behavior of Subgrade Soils
Singh and Mitchell (1968) developed equations describing the creep relationships
between strain and time, and strain rate and time for a variety of soil types. Figure 2-10 shows
the general creep behavior of soils subjected to a constant deviator stress (i.e., σ1-σ3). The stress
level shown was normalized as creep stress divided by the failure stress. At deviator stresses less
than 30% of the failure stress the creep deflections were small and ceased over time. Higher
stress levels (30 to 90% of failure) resulted in prolonged creep but not rupture. Deviator stresses
over 90% of the failure stress resulted in a secondary creep stage with constant creep rate
followed by a tertiary stage of accelerating strain rate leading to rupture. The basic Singh and
Mitchell (1968) relationship is:
0
10
20
30
40
50
60
70
80
90
100
0 3 6 9 12 15
CB
R (
%)
Rubber Content (%)
GAB Stand Comp,As-molded
GAB Mod Comp,soaked
GAB Stand Comp,As-molded
GAB Stand Comp,Soaked
Sand Mod Comp,As-molded
Sand Mod Comp,Soaked
Sand Stand Comp,As-molded
Sand Stand Comp,Soaked
17
(
)
(Equation 2-2)
=strain rate at any time t
A = the strain rate obtained by plotting log strain rate versus
deviator and finding the intercept when D = 0
= slope of the linear portion of the logarithm strain versus
deviator-stress plot
D = deviator stress
t = time
t1 = unit time baseline
m = slope of log (strain) versus log (time) line
Figure 2-10 Creep under Constant Stress (Singh and Mitchell, 1968)
The stress intensity, D, was originally taken as the triaxial creep test deviator stress (σ1-
σ3) but may be taken as uniaxial stress in an oedometer test (19). The parameters A, α and m, can
be determined by performing two or more creep tests on identical specimens at different stress
levels. Plotting the log strain rate versus log time defines m. Plotting the log strain rate versus
stress for two separate times defines α (slope) and A (intercept).
The rate of creep remains constant during the secondary phase of creep settlement. A
reasonable approximation of the secondary creep rate can be obtained by performing a
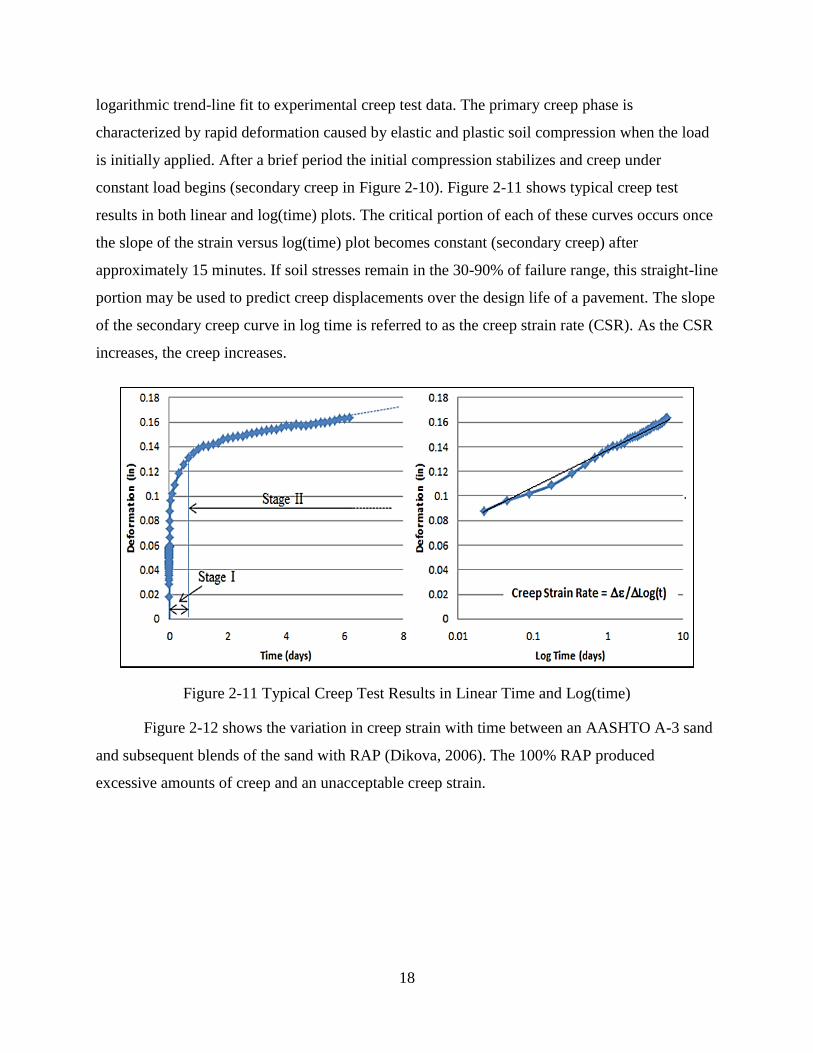
18
logarithmic trend-line fit to experimental creep test data. The primary creep phase is
characterized by rapid deformation caused by elastic and plastic soil compression when the load
is initially applied. After a brief period the initial compression stabilizes and creep under
constant load begins (secondary creep in Figure 2-10). Figure 2-11 shows typical creep test
results in both linear and log(time) plots. The critical portion of each of these curves occurs once
the slope of the strain versus log(time) plot becomes constant (secondary creep) after
approximately 15 minutes. If soil stresses remain in the 30-90% of failure range, this straight-line
portion may be used to predict creep displacements over the design life of a pavement. The slope
of the secondary creep curve in log time is referred to as the creep strain rate (CSR). As the CSR
increases, the creep increases.
Figure 2-11 Typical Creep Test Results in Linear Time and Log(time)
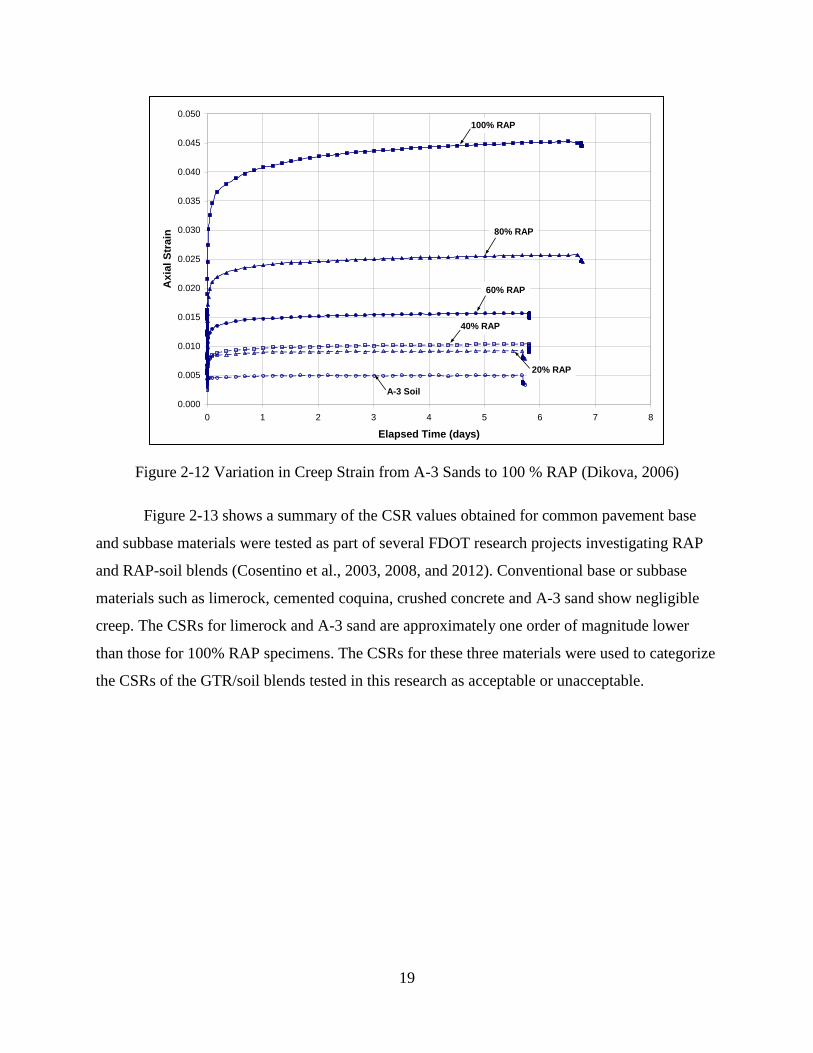
Figure 2-12 shows the variation in creep strain with time between an AASHTO A-3 sand
and subsequent blends of the sand with RAP (Dikova, 2006). The 100% RAP produced
excessive amounts of creep and an unacceptable creep strain.
19
Figure 2-12 Variation in Creep Strain from A-3 Sands to 100 % RAP (Dikova, 2006)
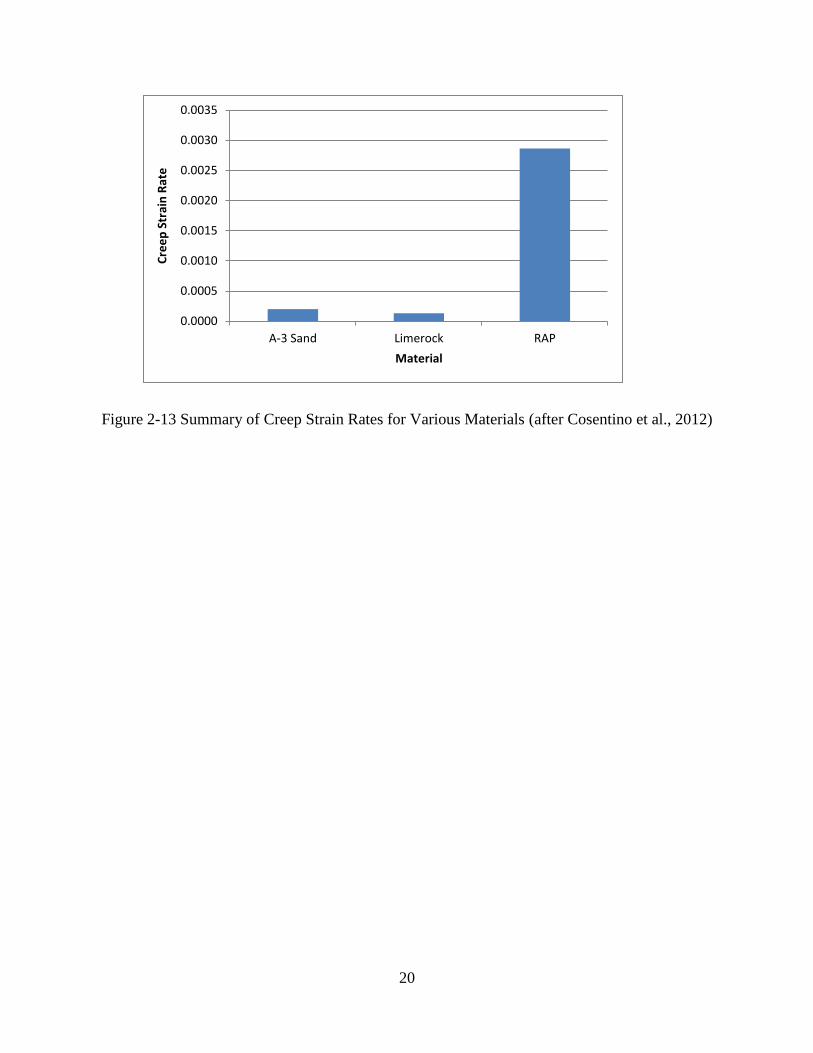
Figure 2-13 shows a summary of the CSR values obtained for common pavement base
and subbase materials were tested as part of several FDOT research projects investigating RAP
and RAP-soil blends (Cosentino et al., 2003, 2008, and 2012). Conventional base or subbase
materials such as limerock, cemented coquina, crushed concrete and A-3 sand show negligible
creep. The CSRs for limerock and A-3 sand are approximately one order of magnitude lower
than those for 100% RAP specimens. The CSRs for these three materials were used to categorize
the CSRs of the GTR/soil blends tested in this research as acceptable or unacceptable.
0.000
0.005
0.010
0.015
0.020
0.025
0.030
0.035
0.040
0.045
0.050
0 1 2 3 4 5 6 7 8
Elapsed Time (days)
Axia
l S
train
100% RAP
80% RAP
60% RAP
40% RAP
20% RAP
A-3 Soil
20
Figure 2-13 Summary of Creep Strain Rates for Various Materials (after Cosentino et al., 2012)
0.0000
0.0005
0.0010
0.0015
0.0020
0.0025
0.0030
0.0035
A-3 Sand Limerock RAP
Cre
ep
Str
ain
Rat
e
Material
21
3. Methodology
3.1. Material Selection
The testing program was developed to evaluate engineering properties of GTR/subgrade
soil blends. The research team determined that a wide range of GTR sizes and concentrations
were critical to understanding the behavior of GTR/subgrade blends. Three soil types were
selected through a coordinated effort with FDOT’s State Materials Office (SMO). FDOT SMO
also provided a list of approved ground tire rubber (GTR) distributors.
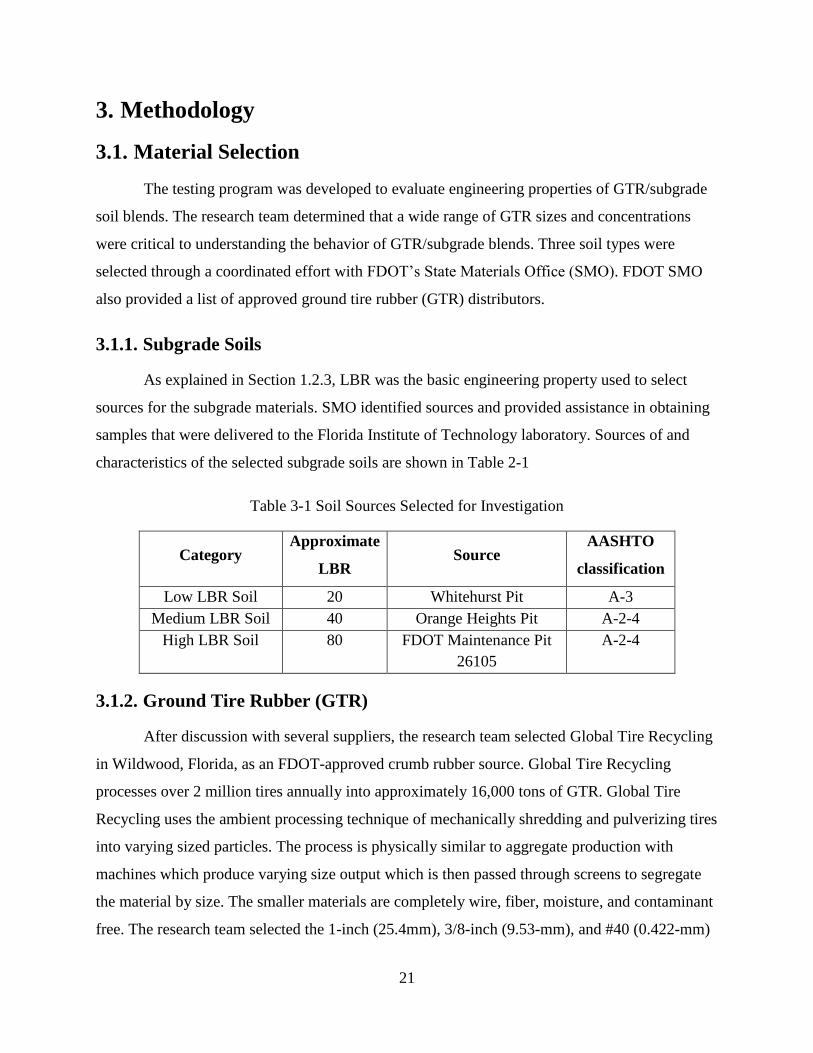
3.1.1. Subgrade Soils
As explained in Section 1.2.3, LBR was the basic engineering property used to select
sources for the subgrade materials. SMO identified sources and provided assistance in obtaining
samples that were delivered to the Florida Institute of Technology laboratory. Sources of and
characteristics of the selected subgrade soils are shown in Table 2-1
Table 3-1 Soil Sources Selected for Investigation
Category Approximate
LBR Source
AASHTO
classification
Low LBR Soil 20 Whitehurst Pit A-3
Medium LBR Soil 40 Orange Heights Pit A-2-4
High LBR Soil 80 FDOT Maintenance Pit
26105
A-2-4
3.1.2. Ground Tire Rubber (GTR)
After discussion with several suppliers, the research team selected Global Tire Recycling
in Wildwood, Florida, as an FDOT-approved crumb rubber source. Global Tire Recycling
processes over 2 million tires annually into approximately 16,000 tons of GTR. Global Tire
Recycling uses the ambient processing technique of mechanically shredding and pulverizing tires
into varying sized particles. The process is physically similar to aggregate production with
machines which produce varying size output which is then passed through screens to segregate
the material by size. The smaller materials are completely wire, fiber, moisture, and contaminant
free. The research team selected the 1-inch (25.4mm), 3/8-inch (9.53-mm), and #40 (0.422-mm)
22
mesh sizes of GTR to include the maximum, median, and minimum sizes of GTR available
(large tire strips were ruled out due to complications to be expected in the application process).
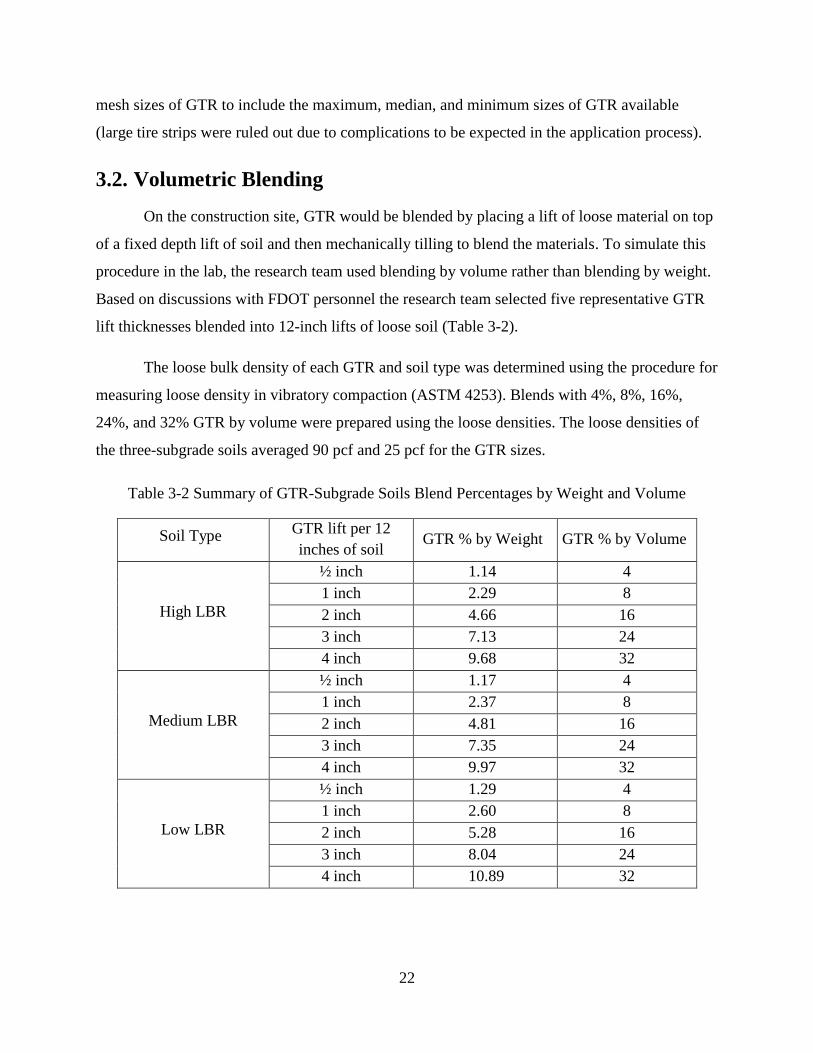
3.2. Volumetric Blending
On the construction site, GTR would be blended by placing a lift of loose material on top
of a fixed depth lift of soil and then mechanically tilling to blend the materials. To simulate this
procedure in the lab, the research team used blending by volume rather than blending by weight.
Based on discussions with FDOT personnel the research team selected five representative GTR
lift thicknesses blended into 12-inch lifts of loose soil (Table 3-2).
The loose bulk density of each GTR and soil type was determined using the procedure for
measuring loose density in vibratory compaction (ASTM 4253). Blends with 4%, 8%, 16%,
24%, and 32% GTR by volume were prepared using the loose densities. The loose densities of
the three-subgrade soils averaged 90 pcf and 25 pcf for the GTR sizes.
Table 3-2 Summary of GTR-Subgrade Soils Blend Percentages by Weight and Volume
Soil Type GTR lift per 12
inches of soil GTR % by Weight GTR % by Volume
High LBR
½ inch 1.14 4
1 inch 2.29 8
2 inch 4.66 16
3 inch 7.13 24
4 inch 9.68 32
Medium LBR
½ inch 1.17 4
1 inch 2.37 8
2 inch 4.81 16
3 inch 7.35 24
4 inch 9.97 32
Low LBR
½ inch 1.29 4
1 inch 2.60 8
2 inch 5.28 16
3 inch 8.04 24
4 inch 10.89 32
23
3.3. Testing Procedures
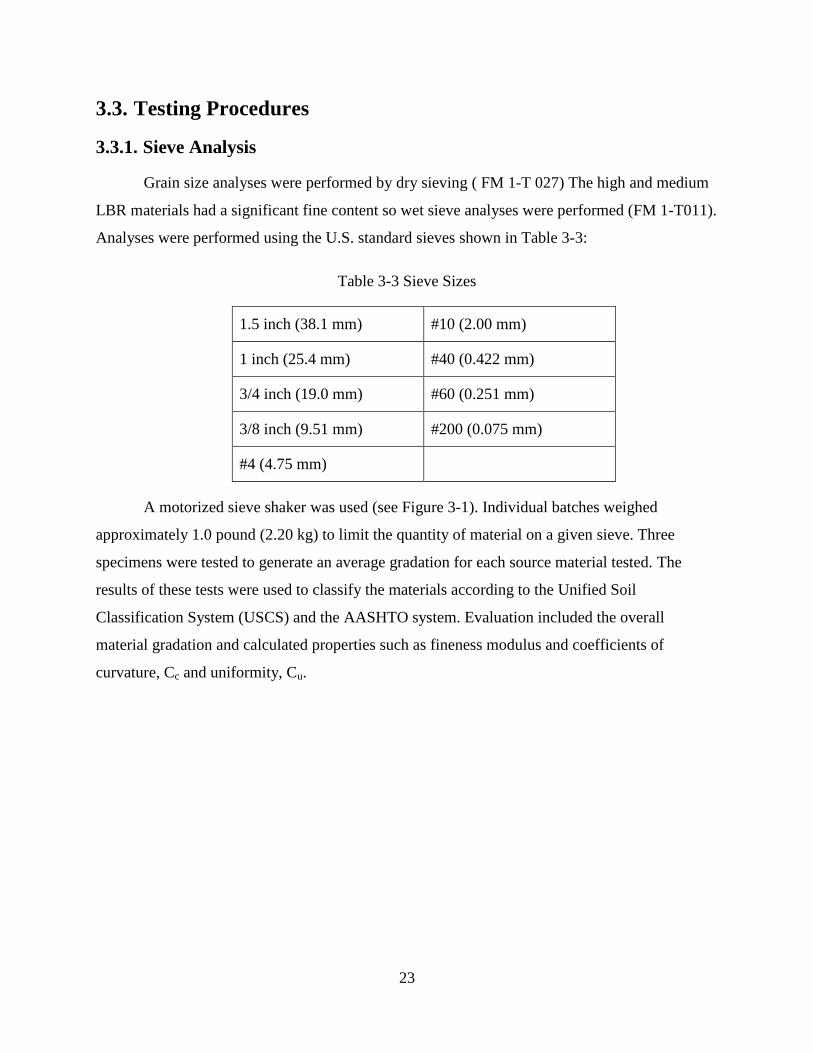
3.3.1. Sieve Analysis
Grain size analyses were performed by dry sieving ( FM 1-T 027) The high and medium
LBR materials had a significant fine content so wet sieve analyses were performed (FM 1-T011).
Analyses were performed using the U.S. standard sieves shown in Table 3-3:
Table 3-3 Sieve Sizes
1.5 inch (38.1 mm) #10 (2.00 mm)
1 inch (25.4 mm) #40 (0.422 mm)
3/4 inch (19.0 mm) #60 (0.251 mm)
3/8 inch (9.51 mm) #200 (0.075 mm)
#4 (4.75 mm)
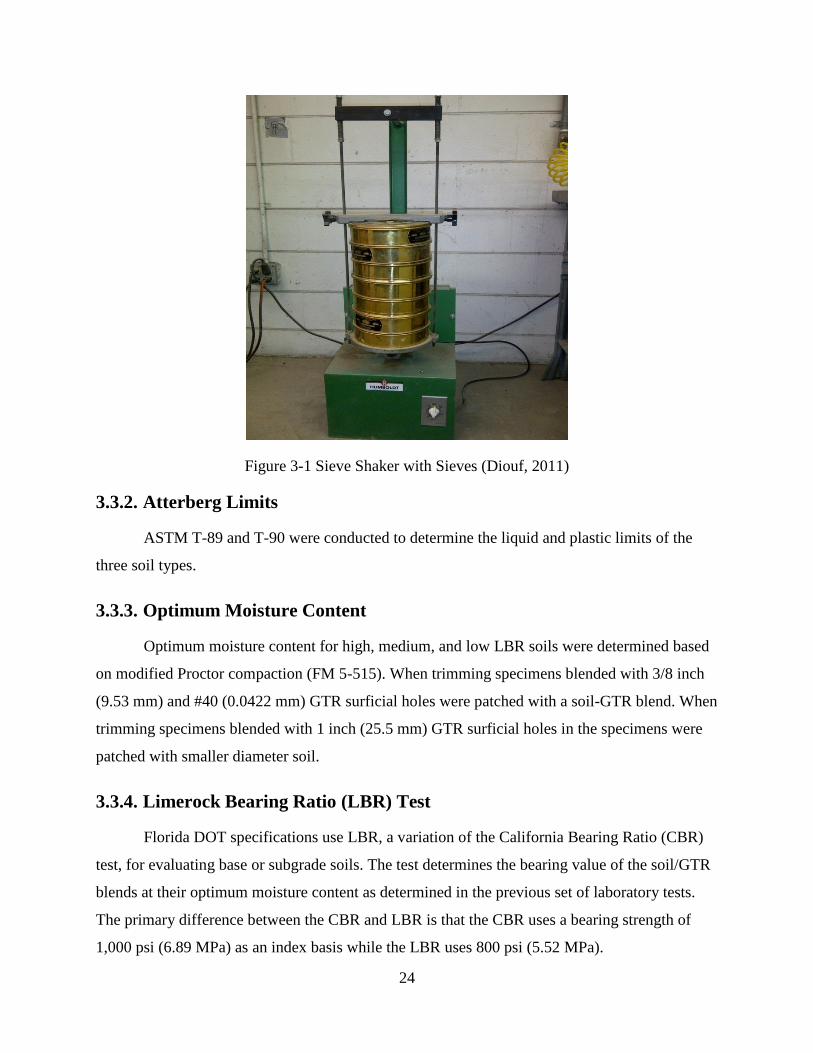
A motorized sieve shaker was used (see Figure 3-1). Individual batches weighed
approximately 1.0 pound (2.20 kg) to limit the quantity of material on a given sieve. Three
specimens were tested to generate an average gradation for each source material tested. The
results of these tests were used to classify the materials according to the Unified Soil
Classification System (USCS) and the AASHTO system. Evaluation included the overall
material gradation and calculated properties such as fineness modulus and coefficients of
curvature, Cc and uniformity, Cu.
24
Figure 3-1 Sieve Shaker with Sieves (Diouf, 2011)
3.3.2. Atterberg Limits
ASTM T-89 and T-90 were conducted to determine the liquid and plastic limits of the
three soil types.
3.3.3. Optimum Moisture Content
Optimum moisture content for high, medium, and low LBR soils were determined based
on modified Proctor compaction (FM 5-515). When trimming specimens blended with 3/8 inch
(9.53 mm) and #40 (0.0422 mm) GTR surficial holes were patched with a soil-GTR blend. When
trimming specimens blended with 1 inch (25.5 mm) GTR surficial holes in the specimens were
patched with smaller diameter soil.
3.3.4. Limerock Bearing Ratio (LBR) Test
Florida DOT specifications use LBR, a variation of the California Bearing Ratio (CBR)
test, for evaluating base or subgrade soils. The test determines the bearing value of the soil/GTR
blends at their optimum moisture content as determined in the previous set of laboratory tests.
The primary difference between the CBR and LBR is that the CBR uses a bearing strength of
1,000 psi (6.89 MPa) as an index basis while the LBR uses 800 psi (5.52 MPa).
25
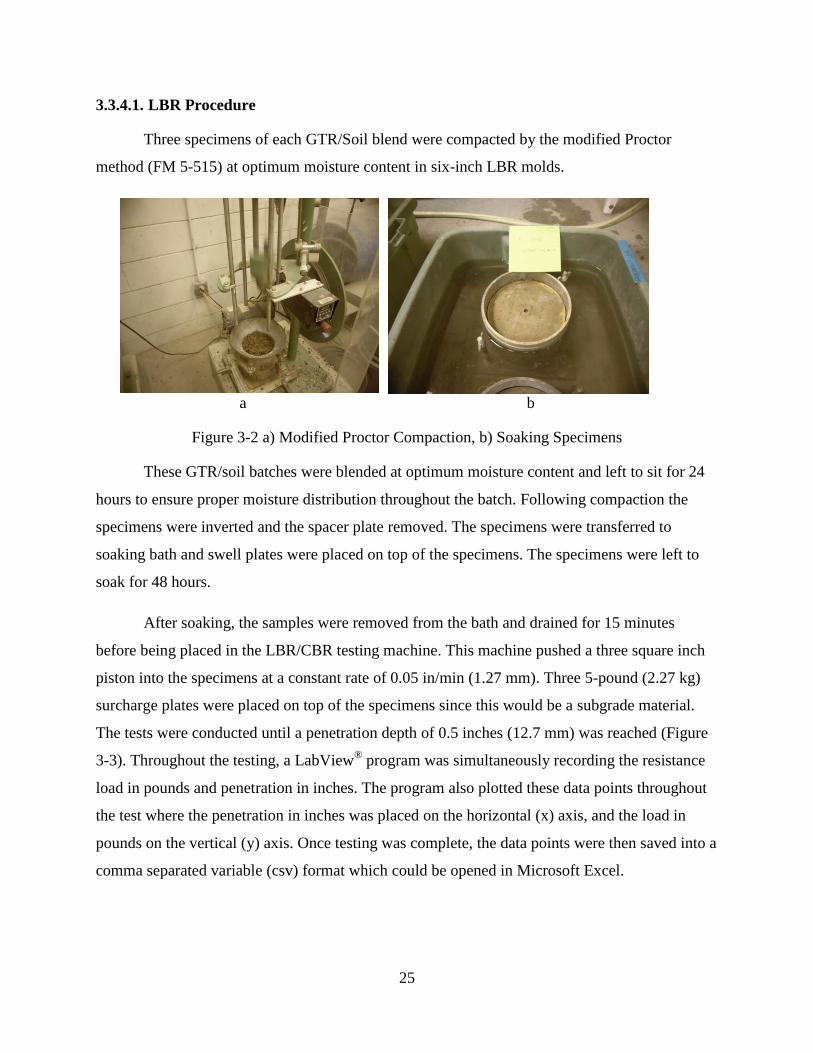
3.3.4.1. LBR Procedure
Three specimens of each GTR/Soil blend were compacted by the modified Proctor
method (FM 5-515) at optimum moisture content in six-inch LBR molds.
a b
Figure 3-2 a) Modified Proctor Compaction, b) Soaking Specimens
These GTR/soil batches were blended at optimum moisture content and left to sit for 24
hours to ensure proper moisture distribution throughout the batch. Following compaction the
specimens were inverted and the spacer plate removed. The specimens were transferred to
soaking bath and swell plates were placed on top of the specimens. The specimens were left to
soak for 48 hours.
After soaking, the samples were removed from the bath and drained for 15 minutes
before being placed in the LBR/CBR testing machine. This machine pushed a three square inch
piston into the specimens at a constant rate of 0.05 in/min (1.27 mm). Three 5-pound (2.27 kg)
surcharge plates were placed on top of the specimens since this would be a subgrade material.
The tests were conducted until a penetration depth of 0.5 inches (12.7 mm) was reached (Figure
3-3). Throughout the testing, a LabView® program was simultaneously recording the resistance
load in pounds and penetration in inches. The program also plotted these data points throughout
the test where the penetration in inches was placed on the horizontal (x) axis, and the load in
pounds on the vertical (y) axis. Once testing was complete, the data points were then saved into a
comma separated variable (csv) format which could be opened in Microsoft Excel.
26
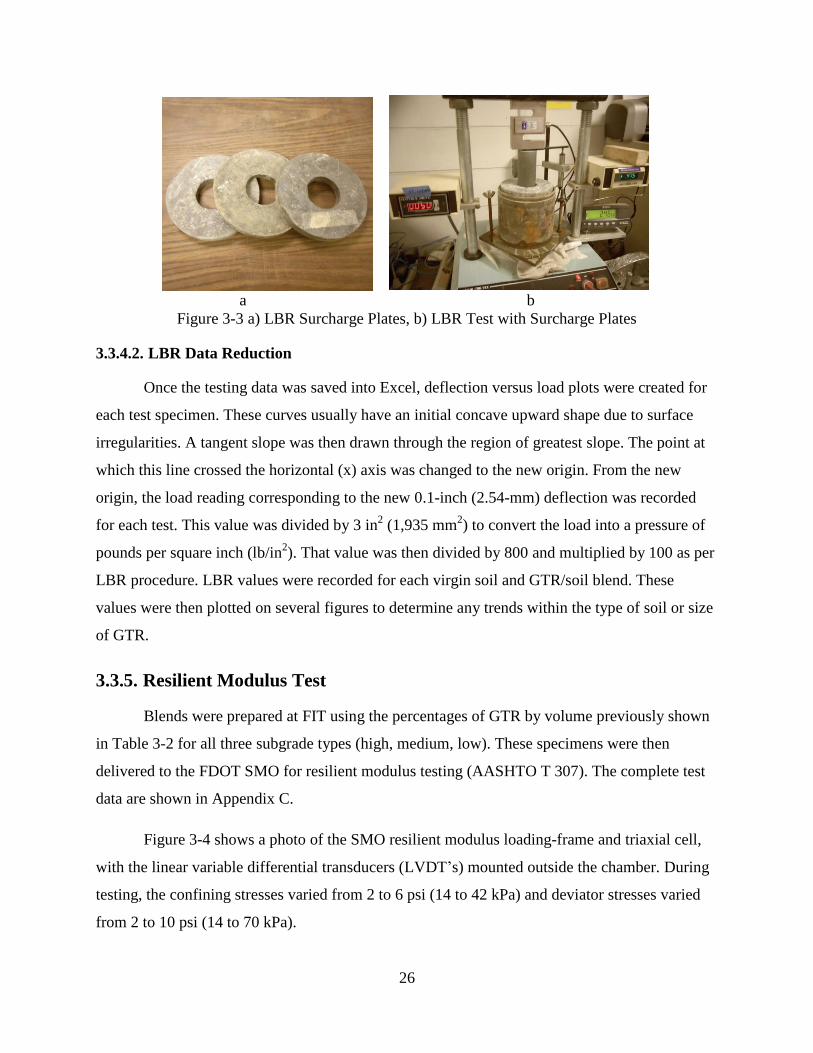
a b
Figure 3-3 a) LBR Surcharge Plates, b) LBR Test with Surcharge Plates
3.3.4.2. LBR Data Reduction
Once the testing data was saved into Excel, deflection versus load plots were created for
each test specimen. These curves usually have an initial concave upward shape due to surface
irregularities. A tangent slope was then drawn through the region of greatest slope. The point at
which this line crossed the horizontal (x) axis was changed to the new origin. From the new
origin, the load reading corresponding to the new 0.1-inch (2.54-mm) deflection was recorded
for each test. This value was divided by 3 in2 (1,935 mm
2) to convert the load into a pressure of
pounds per square inch (lb/in2). That value was then divided by 800 and multiplied by 100 as per
LBR procedure. LBR values were recorded for each virgin soil and GTR/soil blend. These
values were then plotted on several figures to determine any trends within the type of soil or size
of GTR.
3.3.5. Resilient Modulus Test
Blends were prepared at FIT using the percentages of GTR by volume previously shown
in Table 3-2 for all three subgrade types (high, medium, low). These specimens were then
delivered to the FDOT SMO for resilient modulus testing (AASHTO T 307). The complete test
data are shown in Appendix C.
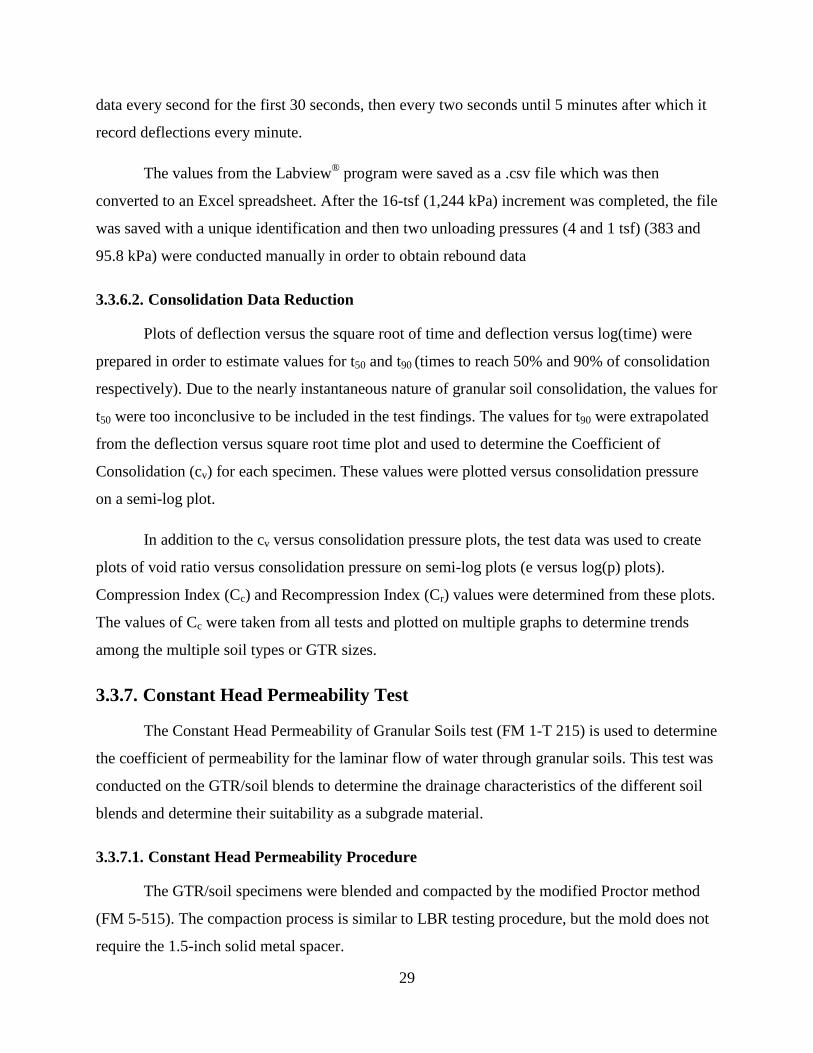
Figure 3-4 shows a photo of the SMO resilient modulus loading-frame and triaxial cell,
with the linear variable differential transducers (LVDT’s) mounted outside the chamber. During
testing, the confining stresses varied from 2 to 6 psi (14 to 42 kPa) and deviator stresses varied
from 2 to 10 psi (14 to 70 kPa).
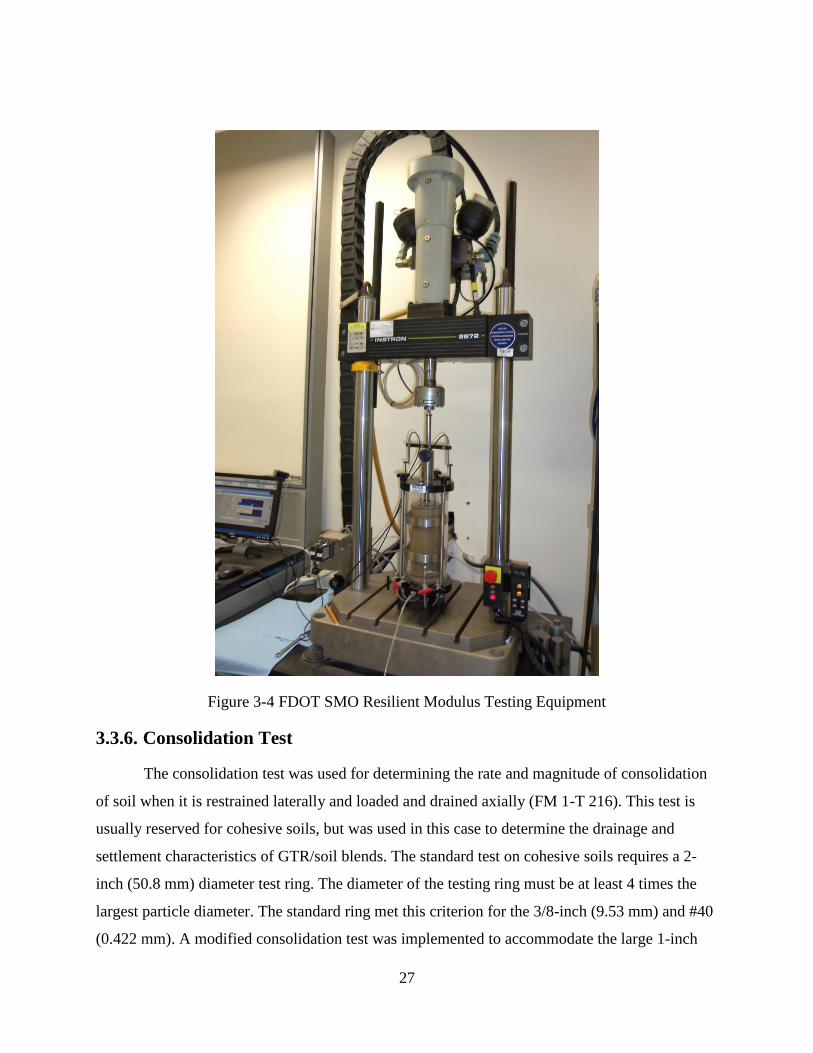
27
Figure 3-4 FDOT SMO Resilient Modulus Testing Equipment
3.3.6. Consolidation Test
The consolidation test was used for determining the rate and magnitude of consolidation
of soil when it is restrained laterally and loaded and drained axially (FM 1-T 216). This test is
usually reserved for cohesive soils, but was used in this case to determine the drainage and
settlement characteristics of GTR/soil blends. The standard test on cohesive soils requires a 2-
inch (50.8 mm) diameter test ring. The diameter of the testing ring must be at least 4 times the
largest particle diameter. The standard ring met this criterion for the 3/8-inch (9.53 mm) and #40
(0.422 mm). A modified consolidation test was implemented to accommodate the large 1-inch
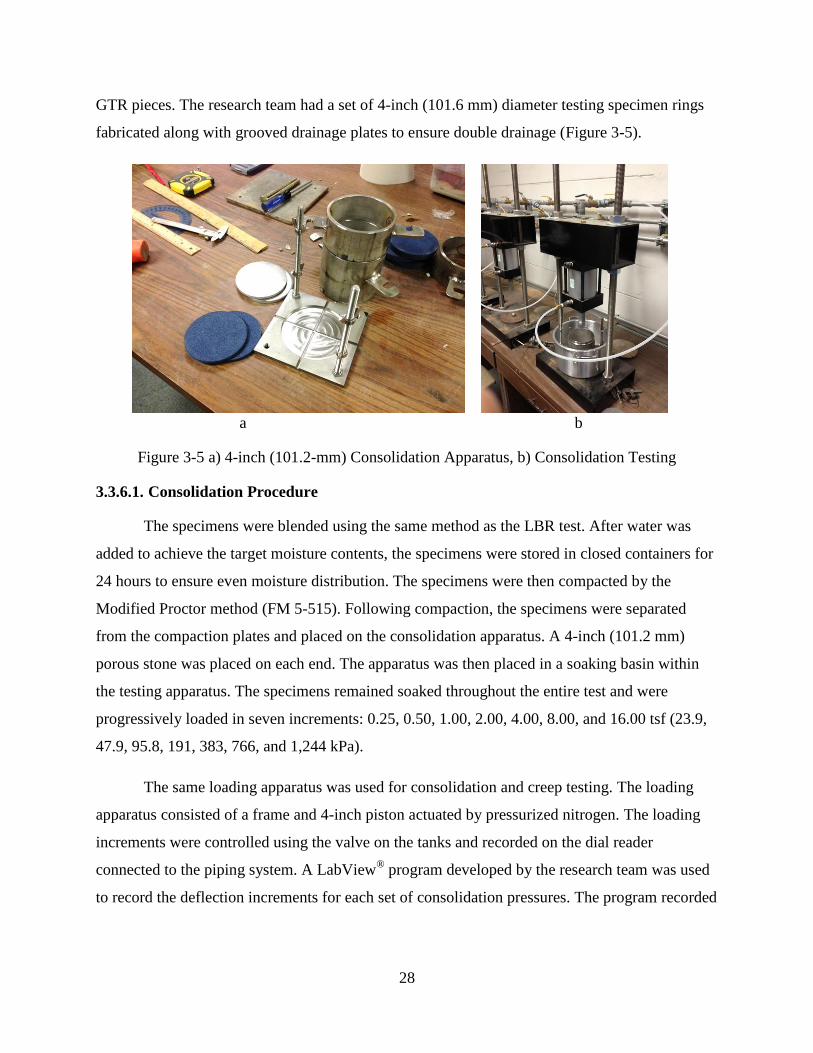
28
GTR pieces. The research team had a set of 4-inch (101.6 mm) diameter testing specimen rings
fabricated along with grooved drainage plates to ensure double drainage (Figure 3-5).
a b
Figure 3-5 a) 4-inch (101.2-mm) Consolidation Apparatus, b) Consolidation Testing
3.3.6.1. Consolidation Procedure
The specimens were blended using the same method as the LBR test. After water was
added to achieve the target moisture contents, the specimens were stored in closed containers for
24 hours to ensure even moisture distribution. The specimens were then compacted by the
Modified Proctor method (FM 5-515). Following compaction, the specimens were separated
from the compaction plates and placed on the consolidation apparatus. A 4-inch (101.2 mm)
porous stone was placed on each end. The apparatus was then placed in a soaking basin within
the testing apparatus. The specimens remained soaked throughout the entire test and were
progressively loaded in seven increments: 0.25, 0.50, 1.00, 2.00, 4.00, 8.00, and 16.00 tsf (23.9,
47.9, 95.8, 191, 383, 766, and 1,244 kPa).
The same loading apparatus was used for consolidation and creep testing. The loading
apparatus consisted of a frame and 4-inch piston actuated by pressurized nitrogen. The loading
increments were controlled using the valve on the tanks and recorded on the dial reader
connected to the piping system. A LabView® program developed by the research team was used
to record the deflection increments for each set of consolidation pressures. The program recorded
29
data every second for the first 30 seconds, then every two seconds until 5 minutes after which it
record deflections every minute.
The values from the Labview® program were saved as a .csv file which was then
converted to an Excel spreadsheet. After the 16-tsf (1,244 kPa) increment was completed, the file
was saved with a unique identification and then two unloading pressures (4 and 1 tsf) (383 and
95.8 kPa) were conducted manually in order to obtain rebound data
3.3.6.2. Consolidation Data Reduction
Plots of deflection versus the square root of time and deflection versus log(time) were
prepared in order to estimate values for t50 and t90 (times to reach 50% and 90% of consolidation
respectively). Due to the nearly instantaneous nature of granular soil consolidation, the values for
t50 were too inconclusive to be included in the test findings. The values for t90 were extrapolated
from the deflection versus square root time plot and used to determine the Coefficient of
Consolidation (cv) for each specimen. These values were plotted versus consolidation pressure
on a semi-log plot.
In addition to the cv versus consolidation pressure plots, the test data was used to create
plots of void ratio versus consolidation pressure on semi-log plots (e versus log(p) plots).
Compression Index (Cc) and Recompression Index (Cr) values were determined from these plots.
The values of Cc were taken from all tests and plotted on multiple graphs to determine trends
among the multiple soil types or GTR sizes.
3.3.7. Constant Head Permeability Test
The Constant Head Permeability of Granular Soils test (FM 1-T 215) is used to determine
the coefficient of permeability for the laminar flow of water through granular soils. This test was
conducted on the GTR/soil blends to determine the drainage characteristics of the different soil
blends and determine their suitability as a subgrade material.
3.3.7.1. Constant Head Permeability Procedure
The GTR/soil specimens were blended and compacted by the modified Proctor method
(FM 5-515). The compaction process is similar to LBR testing procedure, but the mold does not
require the 1.5-inch solid metal spacer.
30
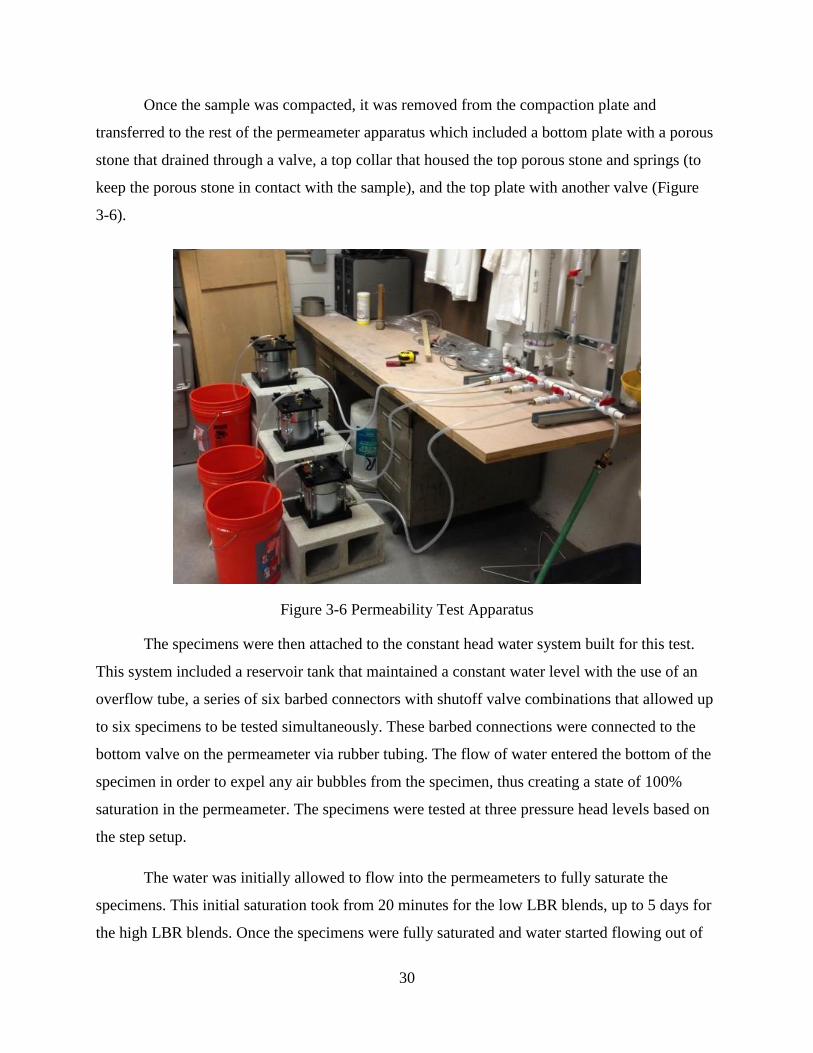
Once the sample was compacted, it was removed from the compaction plate and
transferred to the rest of the permeameter apparatus which included a bottom plate with a porous
stone that drained through a valve, a top collar that housed the top porous stone and springs (to
keep the porous stone in contact with the sample), and the top plate with another valve (Figure
3-6).
Figure 3-6 Permeability Test Apparatus
The specimens were then attached to the constant head water system built for this test.
This system included a reservoir tank that maintained a constant water level with the use of an
overflow tube, a series of six barbed connectors with shutoff valve combinations that allowed up
to six specimens to be tested simultaneously. These barbed connections were connected to the
bottom valve on the permeameter via rubber tubing. The flow of water entered the bottom of the
specimen in order to expel any air bubbles from the specimen, thus creating a state of 100%
saturation in the permeameter. The specimens were tested at three pressure head levels based on
the step setup.
The water was initially allowed to flow into the permeameters to fully saturate the
specimens. This initial saturation took from 20 minutes for the low LBR blends, up to 5 days for
the high LBR blends. Once the specimens were fully saturated and water started flowing out of
31
the top of the permeameters, a bucket was placed under each specimen to collect the water for
the duration of the test. The duration of each test varied in order to collect a sufficient amount of
water to be measured. Test results were collected and analyzed in an Excel spreadsheet.
3.3.7.2. Constant Head Permeability Data Reduction
Test data were used in Equation 3-1 to determine the coefficient of permeability (k) for
each trial. The values for each trial were averaged to determine each blend’s k value. These
values were then plotted against percentage of GTR to evaluate trends.
Q = volume of water discharged
T = time of flow
H = head difference
L = length of specimen
A = cross-sectional area of the specimen
3.3.8. Creep Test
Creep is the tendency of a solid material to slowly move or deform under constant stress.
One-dimensional creep tests were conducted to assess the long-term deformation response of
different GTR/subgrade blends subjected to a constant pressure over a seven-day period. Tests
were performed using the three GTR sizes blended with the low, medium, and high LBR
subgrade soils using 0%, 16%, and 32% GTR concentrations. These percentages were selected to
enable the creep from the virgin material to be compared to the creep from the middle and
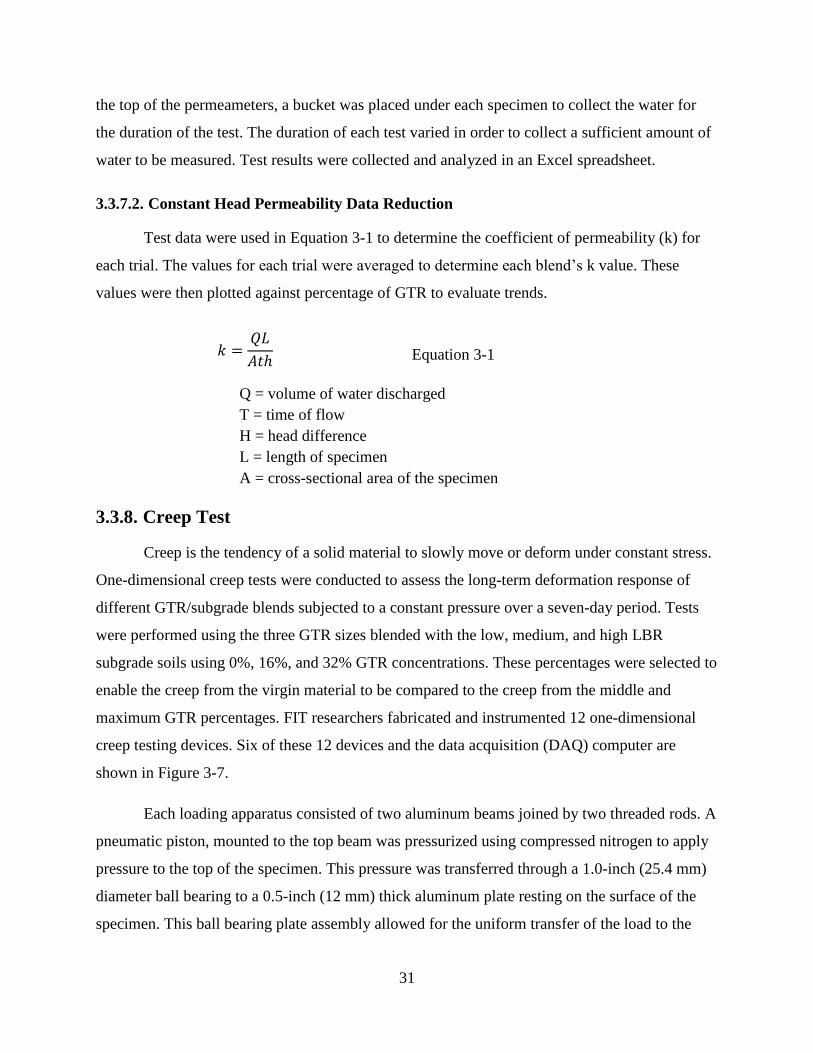
maximum GTR percentages. FIT researchers fabricated and instrumented 12 one-dimensional
creep testing devices. Six of these 12 devices and the data acquisition (DAQ) computer are
shown in Figure 3-7.
Each loading apparatus consisted of two aluminum beams joined by two threaded rods. A
pneumatic piston, mounted to the top beam was pressurized using compressed nitrogen to apply
pressure to the top of the specimen. This pressure was transferred through a 1.0-inch (25.4 mm)
diameter ball bearing to a 0.5-inch (12 mm) thick aluminum plate resting on the surface of the
specimen. This ball bearing plate assembly allowed for the uniform transfer of the load to the
Equation 3-1
32
specimen. Digital output signals from potentiometers mounted to the molds were used to record
the deflection.
Figure 3-7 Six Creep Test Devices and Data Acquisition Computer (Diouf, 2011)
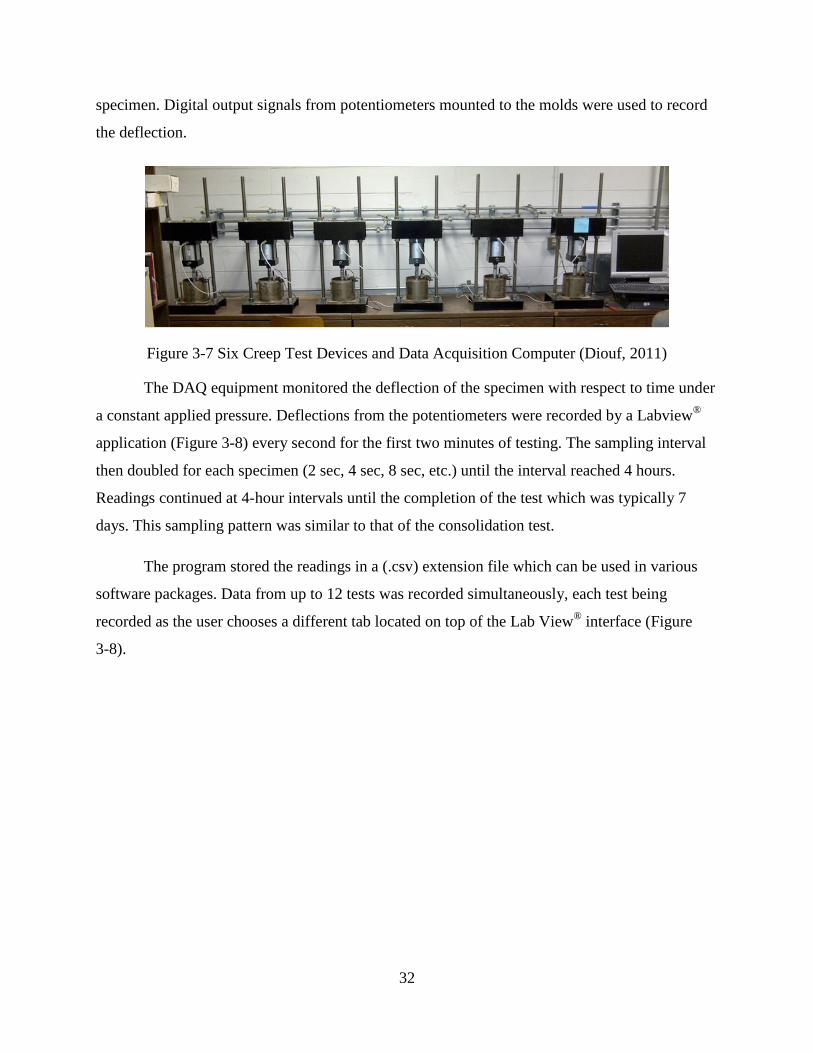
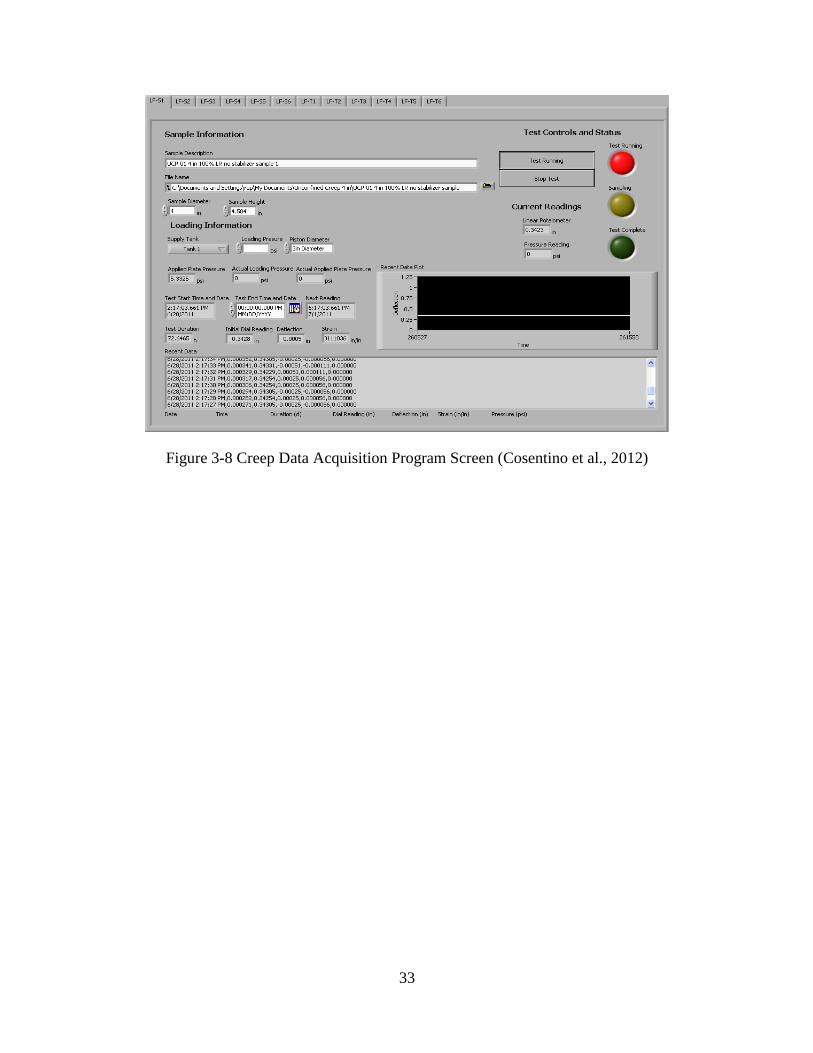
The DAQ equipment monitored the deflection of the specimen with respect to time under
a constant applied pressure. Deflections from the potentiometers were recorded by a Labview®
application (Figure 3-8) every second for the first two minutes of testing. The sampling interval
then doubled for each specimen (2 sec, 4 sec, 8 sec, etc.) until the interval reached 4 hours.
Readings continued at 4-hour intervals until the completion of the test which was typically 7
days. This sampling pattern was similar to that of the consolidation test.
The program stored the readings in a (.csv) extension file which can be used in various
software packages. Data from up to 12 tests was recorded simultaneously, each test being
recorded as the user chooses a different tab located on top of the Lab View®
interface (Figure
3-8).
33
Figure 3-8 Creep Data Acquisition Program Screen (Cosentino et al., 2012)
34
4. Findings
4.1. Sieve Analysis Test Results
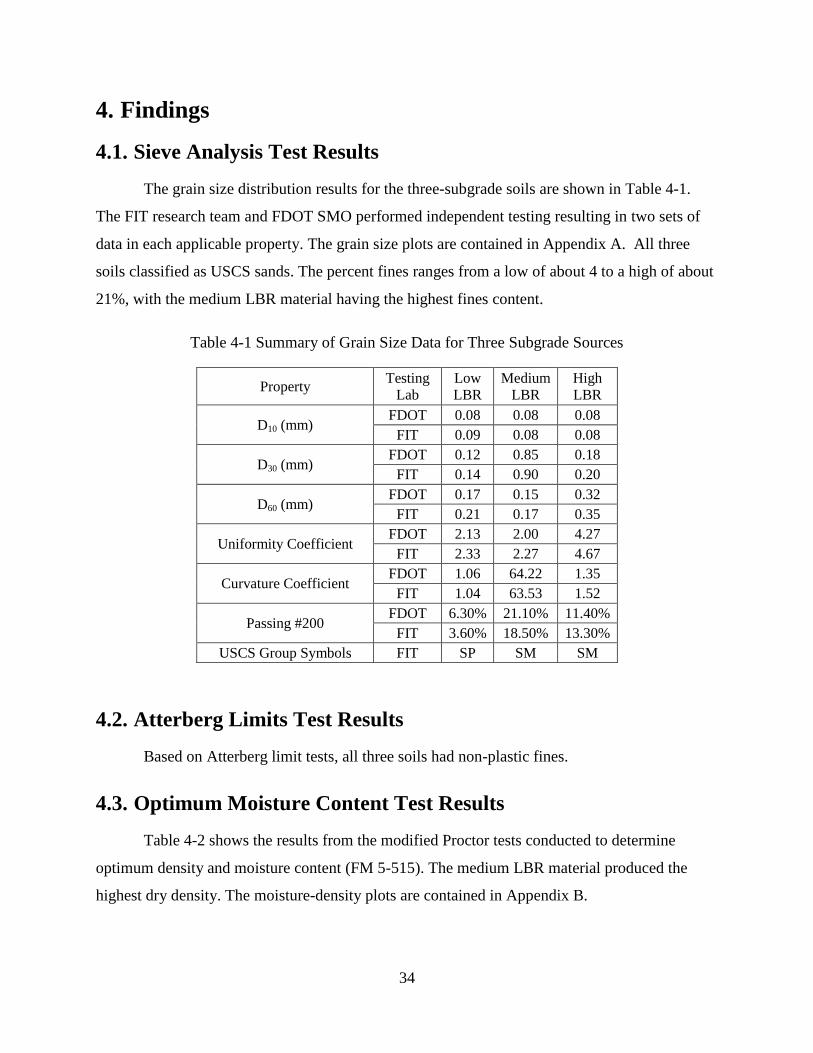
The grain size distribution results for the three-subgrade soils are shown in Table 4-1.
The FIT research team and FDOT SMO performed independent testing resulting in two sets of
data in each applicable property. The grain size plots are contained in Appendix A. All three
soils classified as USCS sands. The percent fines ranges from a low of about 4 to a high of about
21%, with the medium LBR material having the highest fines content.
Table 4-1 Summary of Grain Size Data for Three Subgrade Sources
Property Testing
Lab
Low
LBR
Medium
LBR
High
LBR
D10 (mm) FDOT 0.08 0.08 0.08
FIT 0.09 0.08 0.08
D30 (mm) FDOT 0.12 0.85 0.18
FIT 0.14 0.90 0.20
D60 (mm) FDOT 0.17 0.15 0.32
FIT 0.21 0.17 0.35
Uniformity Coefficient FDOT 2.13 2.00 4.27
FIT 2.33 2.27 4.67
Curvature Coefficient FDOT 1.06 64.22 1.35
FIT 1.04 63.53 1.52
Passing #200 FDOT 6.30% 21.10% 11.40%
FIT 3.60% 18.50% 13.30%
USCS Group Symbols FIT SP SM SM
4.2. Atterberg Limits Test Results
Based on Atterberg limit tests, all three soils had non-plastic fines.
4.3. Optimum Moisture Content Test Results
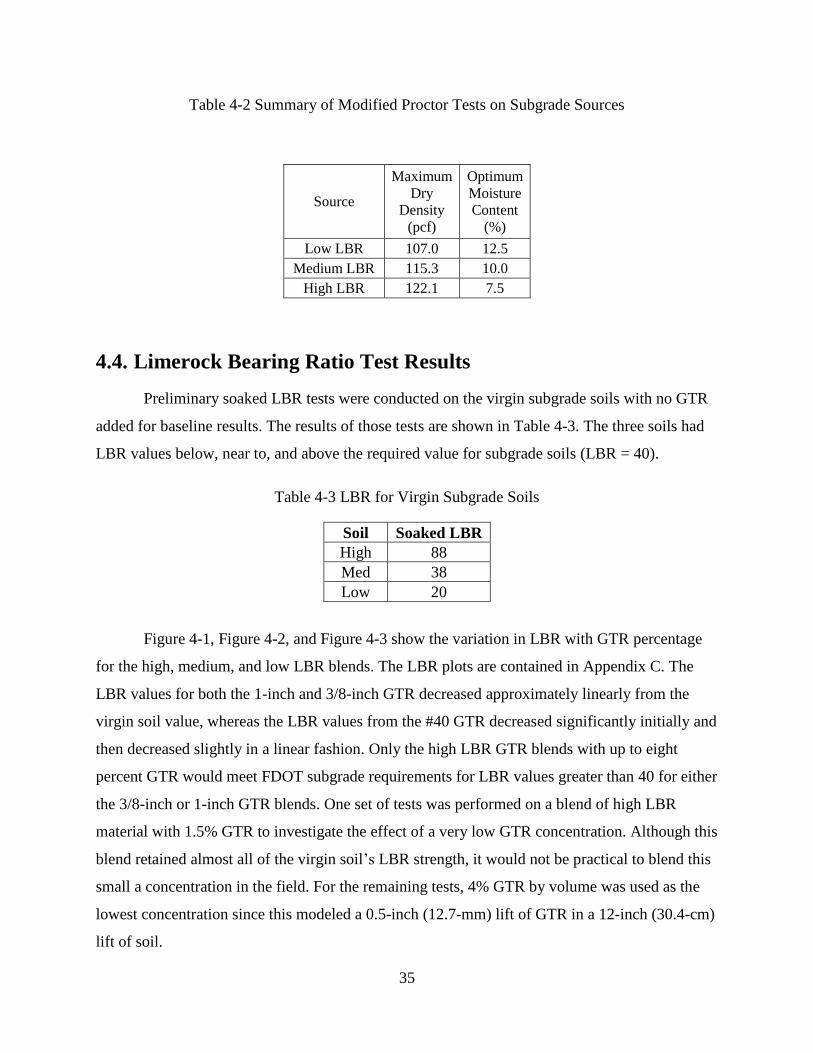
Table 4-2 shows the results from the modified Proctor tests conducted to determine
optimum density and moisture content (FM 5-515). The medium LBR material produced the
highest dry density. The moisture-density plots are contained in Appendix B.
35
Table 4-2 Summary of Modified Proctor Tests on Subgrade Sources
Source
Maximum
Dry
Density
(pcf)
Optimum
Moisture
Content
(%)
Low LBR 107.0 12.5
Medium LBR 115.3 10.0
High LBR 122.1 7.5
4.4. Limerock Bearing Ratio Test Results
Preliminary soaked LBR tests were conducted on the virgin subgrade soils with no GTR
added for baseline results. The results of those tests are shown in Table 4-3. The three soils had
LBR values below, near to, and above the required value for subgrade soils (LBR = 40).
Table 4-3 LBR for Virgin Subgrade Soils
Soil Soaked LBR
High 88
Med 38
Low 20
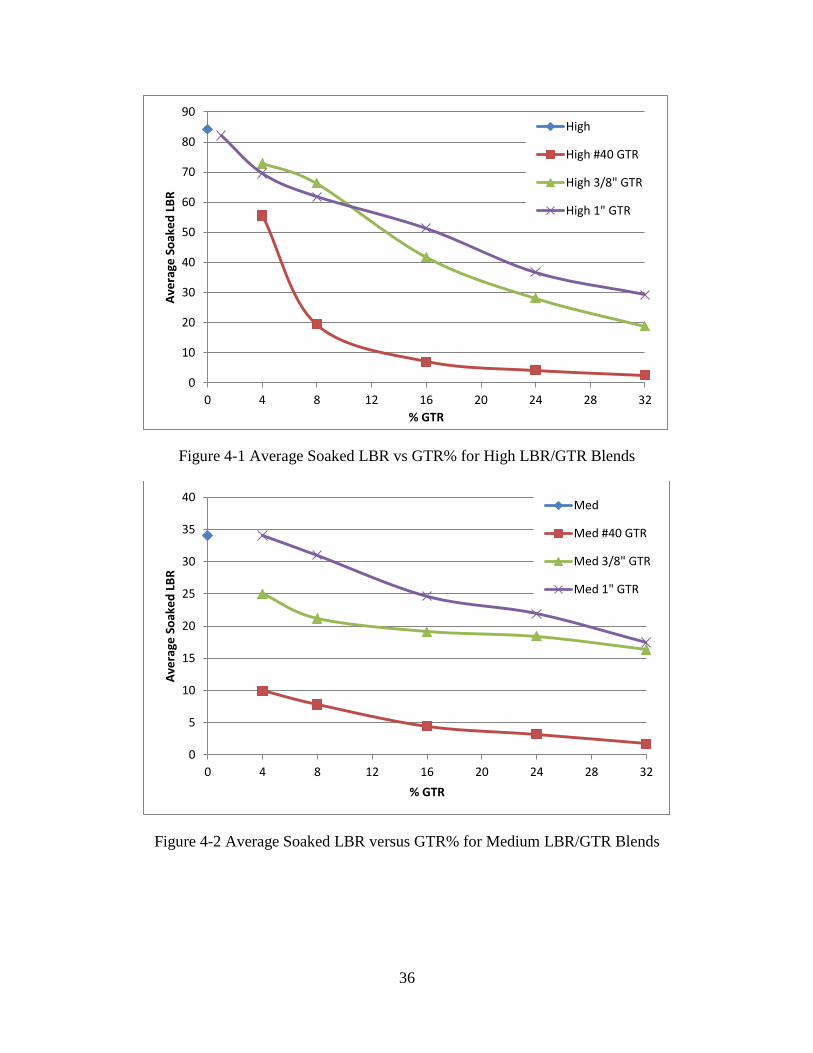
Figure 4-1, Figure 4-2, and Figure 4-3 show the variation in LBR with GTR percentage
for the high, medium, and low LBR blends. The LBR plots are contained in Appendix C. The
LBR values for both the 1-inch and 3/8-inch GTR decreased approximately linearly from the
virgin soil value, whereas the LBR values from the #40 GTR decreased significantly initially and
then decreased slightly in a linear fashion. Only the high LBR GTR blends with up to eight
percent GTR would meet FDOT subgrade requirements for LBR values greater than 40 for either
the 3/8-inch or 1-inch GTR blends. One set of tests was performed on a blend of high LBR
material with 1.5% GTR to investigate the effect of a very low GTR concentration. Although this
blend retained almost all of the virgin soil’s LBR strength, it would not be practical to blend this
small a concentration in the field. For the remaining tests, 4% GTR by volume was used as the
lowest concentration since this modeled a 0.5-inch (12.7-mm) lift of GTR in a 12-inch (30.4-cm)
lift of soil.
36
Figure 4-1 Average Soaked LBR vs GTR% for High LBR/GTR Blends
Figure 4-2 Average Soaked LBR versus GTR% for Medium LBR/GTR Blends
0
10
20
30
40
50
60
70
80
90
0 4 8 12 16 20 24 28 32
Ave
rage
So
ake
d L
BR
% GTR
High
High #40 GTR
High 3/8" GTR
High 1" GTR
0
5
10
15
20
25
30
35
40
0 4 8 12 16 20 24 28 32
Ave
rage
So
ake
d L
BR
% GTR
Med
Med #40 GTR
Med 3/8" GTR
Med 1" GTR
37
Figure 4-3 Average Soaked LBR versus GTR% for Low LBR/GTR Blends
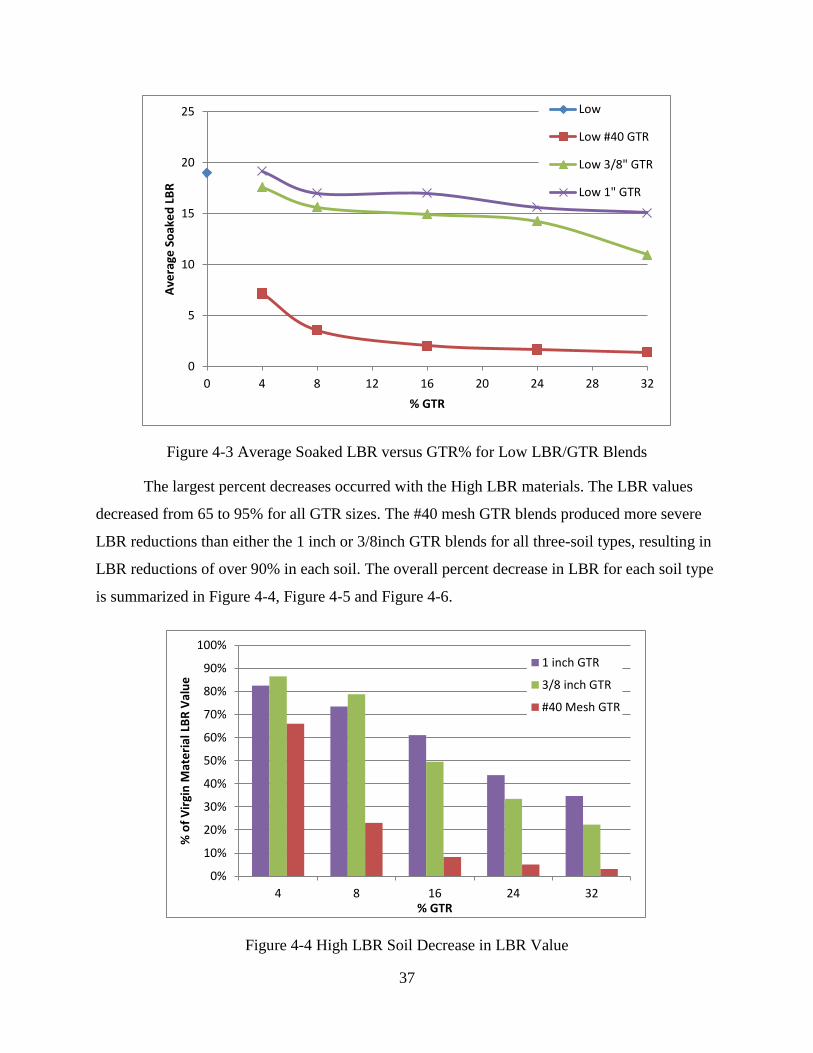
The largest percent decreases occurred with the High LBR materials. The LBR values
decreased from 65 to 95% for all GTR sizes. The #40 mesh GTR blends produced more severe
LBR reductions than either the 1 inch or 3/8inch GTR blends for all three-soil types, resulting in
LBR reductions of over 90% in each soil. The overall percent decrease in LBR for each soil type
is summarized in Figure 4-4, Figure 4-5 and Figure 4-6.
Figure 4-4 High LBR Soil Decrease in LBR Value
0
5
10
15
20
25
0 4 8 12 16 20 24 28 32
Ave
rage
So
ake
d L
BR
% GTR
Low
Low #40 GTR
Low 3/8" GTR
Low 1" GTR
0%
10%
20%
30%
40%
50%
60%
70%
80%
90%
100%
4 8 16 24 32
% o
f V
irgi
n M
ate
rial
LB
R V
alu
e
% GTR
1 inch GTR
3/8 inch GTR
#40 Mesh GTR
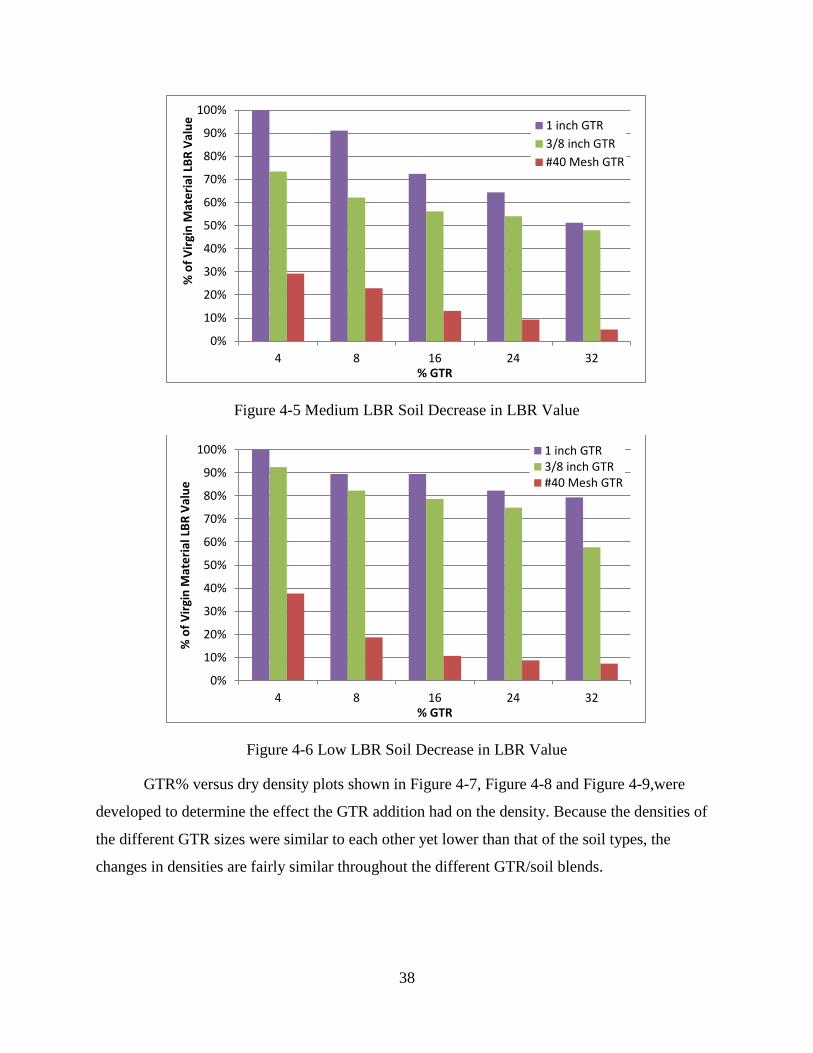
38
Figure 4-5 Medium LBR Soil Decrease in LBR Value
Figure 4-6 Low LBR Soil Decrease in LBR Value
GTR% versus dry density plots shown in Figure 4-7, Figure 4-8 and Figure 4-9,were
developed to determine the effect the GTR addition had on the density. Because the densities of
the different GTR sizes were similar to each other yet lower than that of the soil types, the
changes in densities are fairly similar throughout the different GTR/soil blends.
0%
10%
20%
30%
40%
50%
60%
70%
80%
90%
100%
4 8 16 24 32
% o
f V
irgi
n M
ate
rial
LB
R V
alu
e
% GTR
1 inch GTR
3/8 inch GTR
#40 Mesh GTR
0%
10%
20%
30%
40%
50%
60%
70%
80%
90%
100%
4 8 16 24 32
% o
f V
irgi
n M
ate
rial
LB
R V
alu
e
% GTR
1 inch GTR3/8 inch GTR#40 Mesh GTR
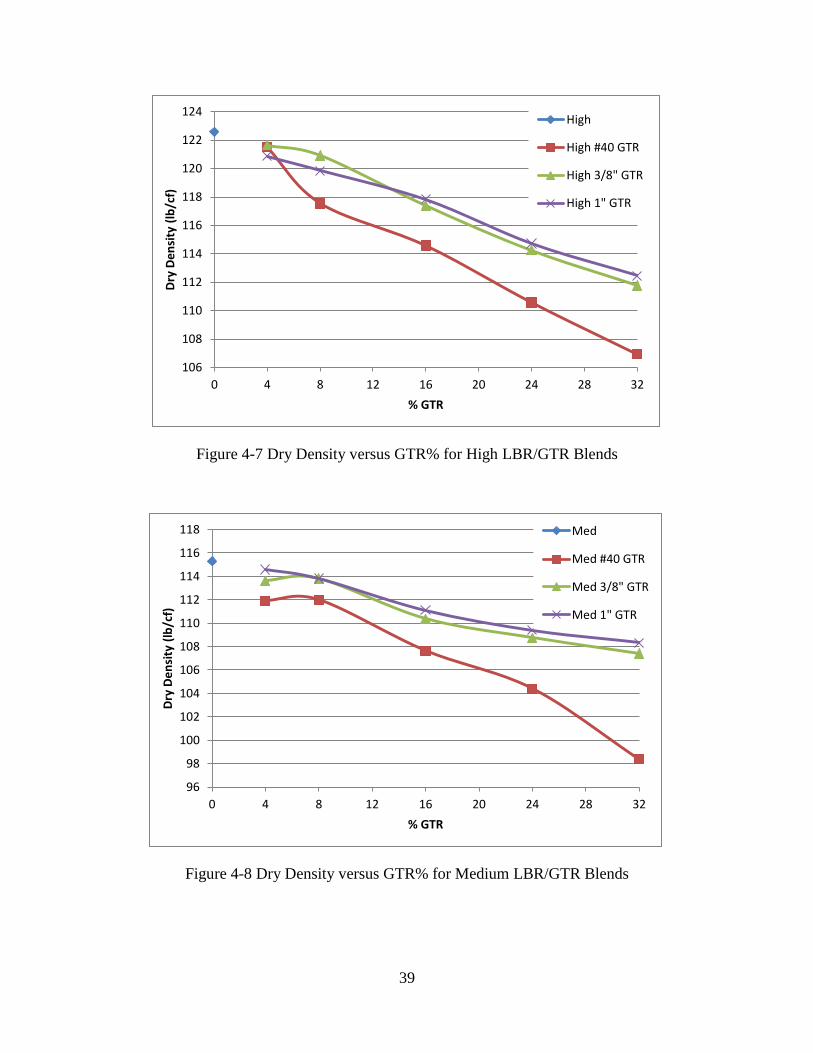
39
Figure 4-7 Dry Density versus GTR% for High LBR/GTR Blends
Figure 4-8 Dry Density versus GTR% for Medium LBR/GTR Blends
106
108
110
112
114
116
118
120
122
124
0 4 8 12 16 20 24 28 32
Dry
De
nsi
ty (
lb/c
f)
% GTR
High
High #40 GTR
High 3/8" GTR
High 1" GTR
96
98
100
102
104
106
108
110
112
114
116
118
0 4 8 12 16 20 24 28 32
Dry
De
nsi
ty (
lb/c
f)
% GTR
Med
Med #40 GTR
Med 3/8" GTR
Med 1" GTR
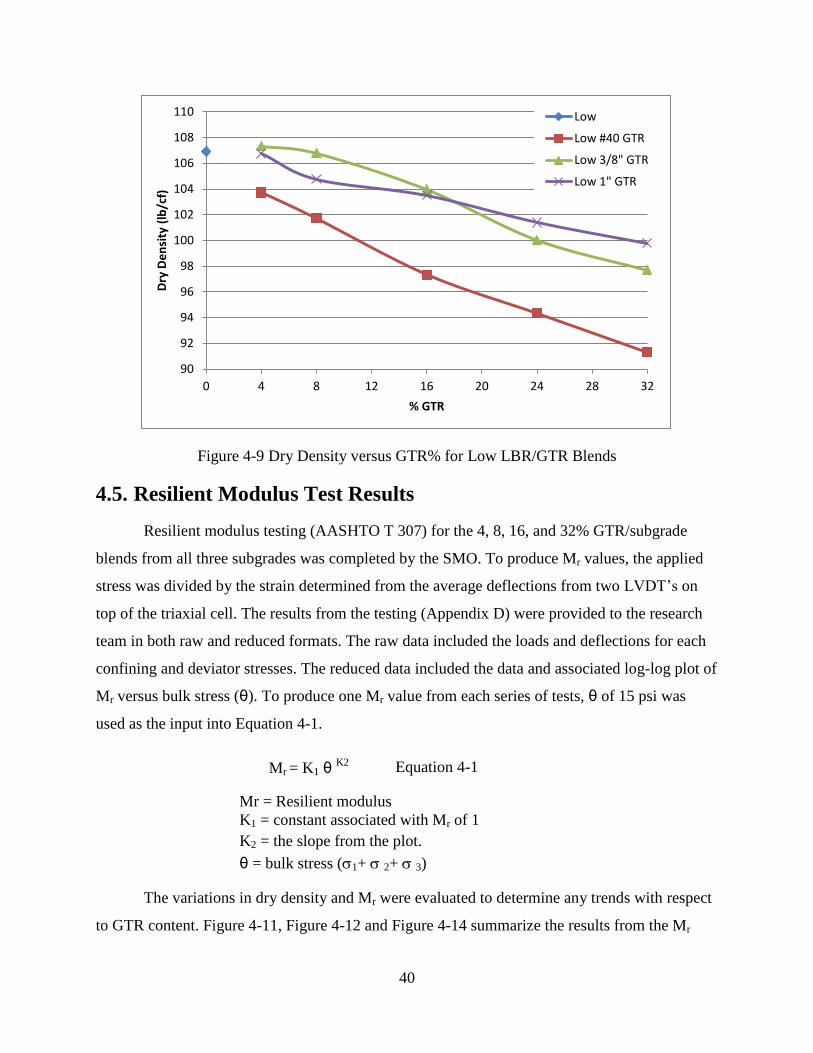
40
Figure 4-9 Dry Density versus GTR% for Low LBR/GTR Blends
4.5. Resilient Modulus Test Results
Resilient modulus testing (AASHTO T 307) for the 4, 8, 16, and 32% GTR/subgrade
blends from all three subgrades was completed by the SMO. To produce Mr values, the applied
stress was divided by the strain determined from the average deflections from two LVDT’s on
top of the triaxial cell. The results from the testing (Appendix D) were provided to the research
team in both raw and reduced formats. The raw data included the loads and deflections for each
confining and deviator stresses. The reduced data included the data and associated log-log plot of
Mr versus bulk stress (θ). To produce one Mr value from each series of tests, θ of 15 psi was
used as the input into Equation 4-1.
Mr = Resilient modulus
K1 = constant associated with Mr of 1
K2 = the slope from the plot.
θ = bulk stress (1+ 2+ 3)
The variations in dry density and Mr were evaluated to determine any trends with respect
to GTR content. Figure 4-11, Figure 4-12 and Figure 4-14 summarize the results from the Mr
90
92
94
96
98
100
102
104
106
108
110
0 4 8 12 16 20 24 28 32
Dry
De
nsi
ty (
lb/c
f)
% GTR
Low
Low #40 GTR
Low 3/8" GTR
Low 1" GTR
Mr = K1 θ K2
Equation 4-1
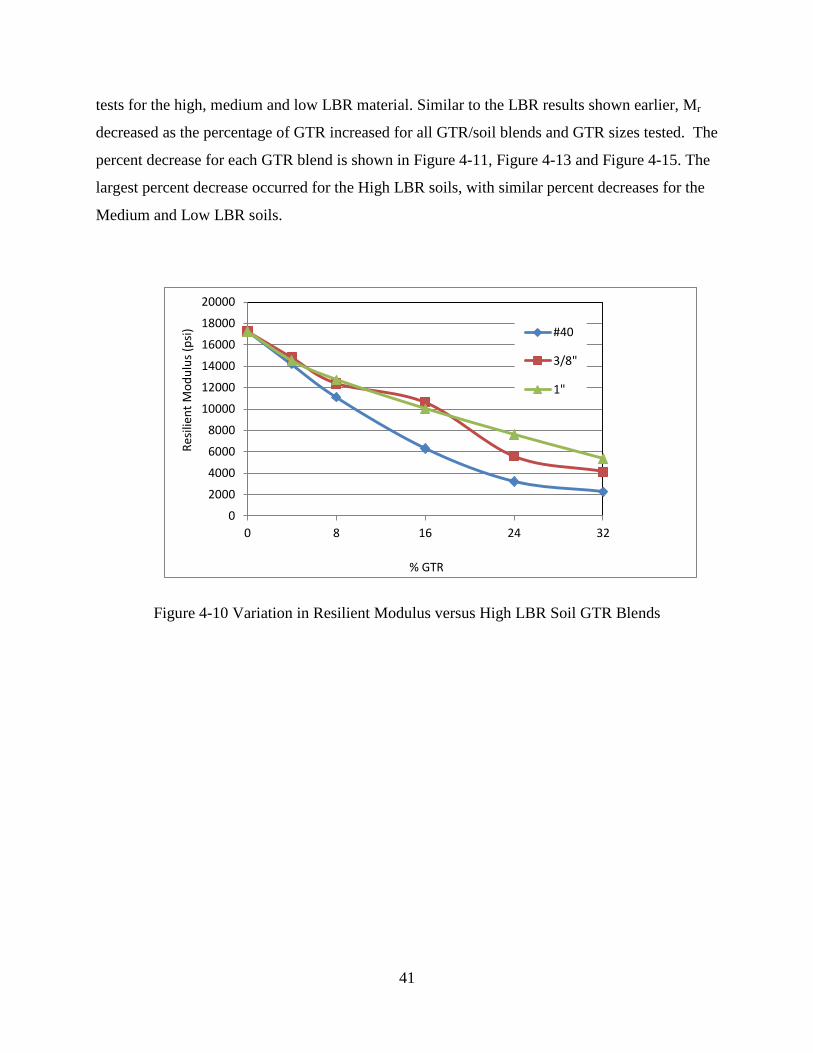
41
tests for the high, medium and low LBR material. Similar to the LBR results shown earlier, Mr
decreased as the percentage of GTR increased for all GTR/soil blends and GTR sizes tested. The
percent decrease for each GTR blend is shown in Figure 4-11, Figure 4-13 and Figure 4-15. The
largest percent decrease occurred for the High LBR soils, with similar percent decreases for the
Medium and Low LBR soils.
Figure 4-10 Variation in Resilient Modulus versus High LBR Soil GTR Blends
0
2000
4000
6000
8000
10000
12000
14000
16000
18000
20000
0 8 16 24 32
Res
ilien
t M
od
ulu
s (p
si)
% GTR
#40
3/8"
1"
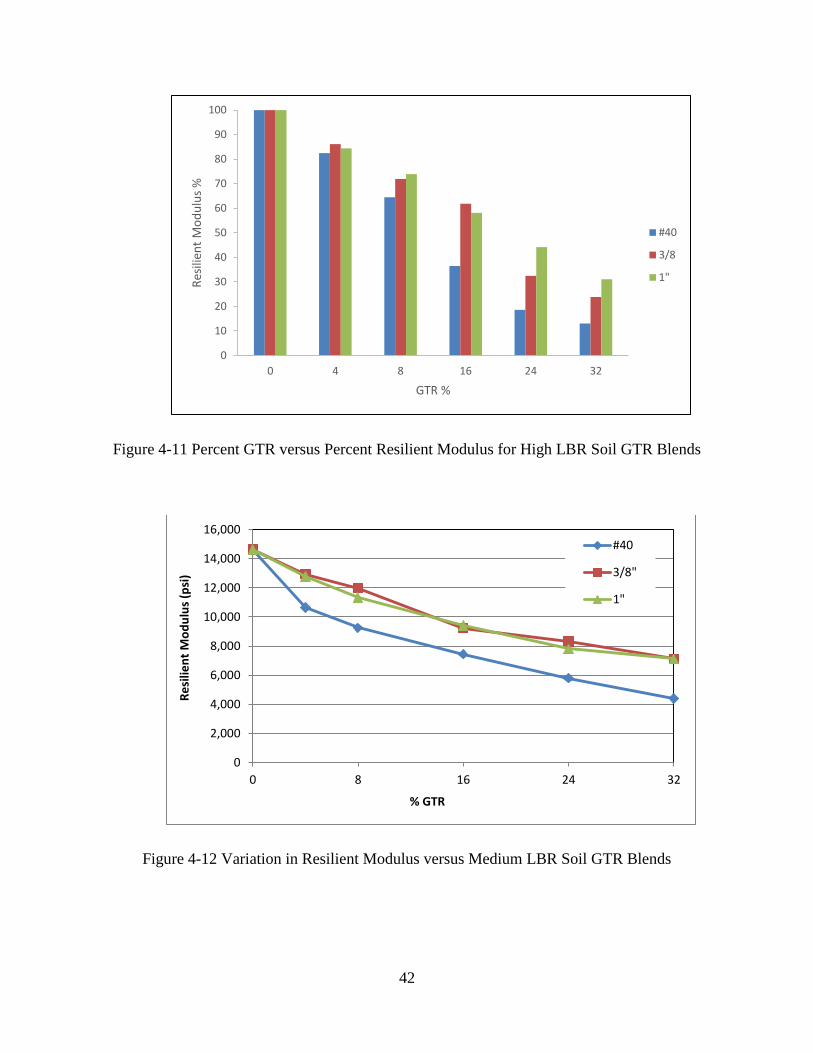
42
Figure 4-11 Percent GTR versus Percent Resilient Modulus for High LBR Soil GTR Blends
Figure 4-12 Variation in Resilient Modulus versus Medium LBR Soil GTR Blends
0
10
20
30
40
50
60
70
80
90
100
0 4 8 16 24 32
Res
ilien
t M
od
ulu
s %
GTR %
#40
3/8
1"
0
2,000
4,000
6,000
8,000
10,000
12,000
14,000
16,000
0 8 16 24 32
Re
silie
nt
Mo
du
lus
(psi
)
% GTR
#40
3/8"
1"
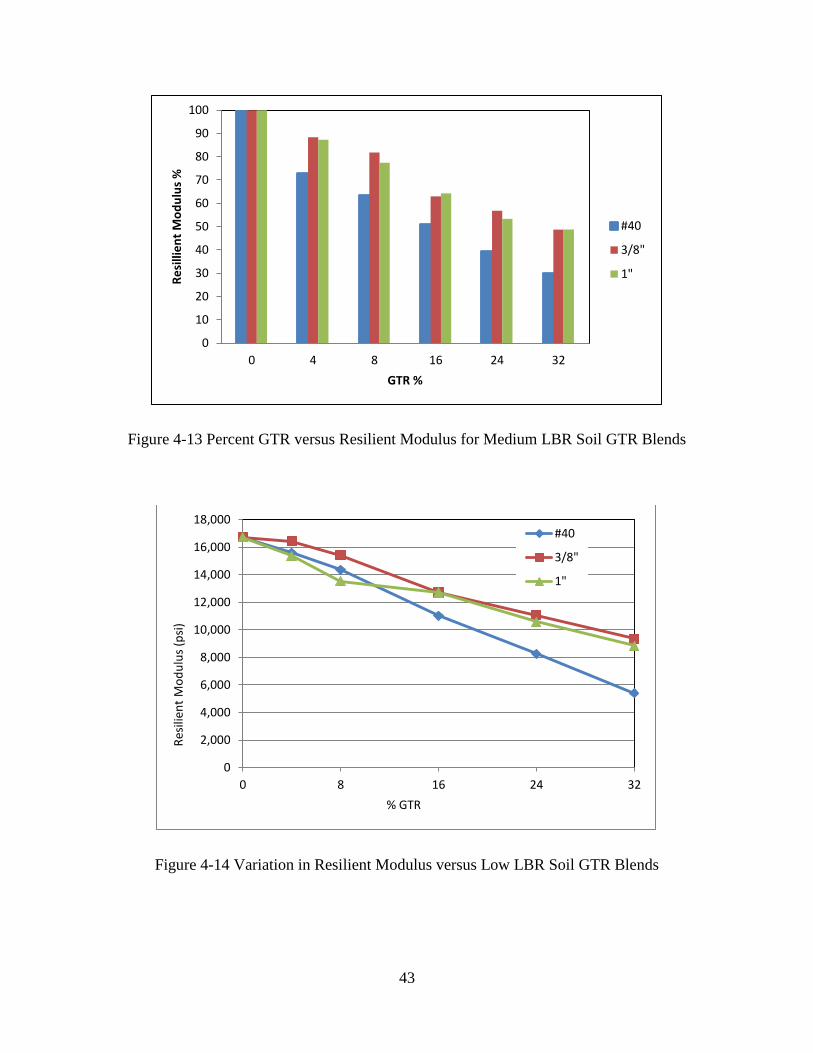
43
Figure 4-13 Percent GTR versus Resilient Modulus for Medium LBR Soil GTR Blends
Figure 4-14 Variation in Resilient Modulus versus Low LBR Soil GTR Blends
0
10
20
30
40
50
60
70
80
90
100
0 4 8 16 24 32
Re
silli
en
t M
od
ulu
s %
GTR %
#40
3/8"
1"
0
2,000
4,000
6,000
8,000
10,000
12,000
14,000
16,000
18,000
0 8 16 24 32
Res
ilien
t M
od
ulu
s (p
si)
% GTR
#40
3/8"
1"
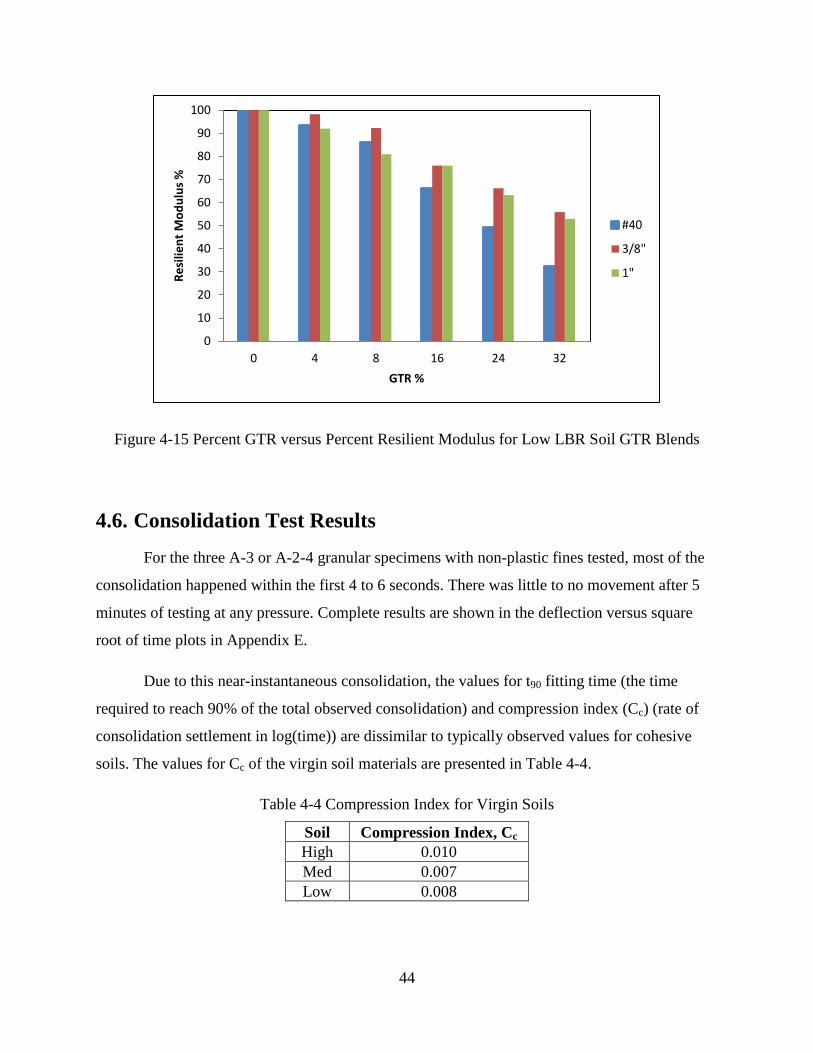
44
Figure 4-15 Percent GTR versus Percent Resilient Modulus for Low LBR Soil GTR Blends
4.6. Consolidation Test Results
For the three A-3 or A-2-4 granular specimens with non-plastic fines tested, most of the
consolidation happened within the first 4 to 6 seconds. There was little to no movement after 5
minutes of testing at any pressure. Complete results are shown in the deflection versus square
root of time plots in Appendix E.
Due to this near-instantaneous consolidation, the values for t90 fitting time (the time
required to reach 90% of the total observed consolidation) and compression index (Cc) (rate of
consolidation settlement in log(time)) are dissimilar to typically observed values for cohesive
soils. The values for Cc of the virgin soil materials are presented in Table 4-4.
Table 4-4 Compression Index for Virgin Soils
Soil Compression Index, Cc
High 0.010
Med 0.007
Low 0.008
0
10
20
30
40
50
60
70
80
90
100
0 4 8 16 24 32
Re
silie
nt
Mo
du
lus
%
GTR %
#40
3/8"
1"
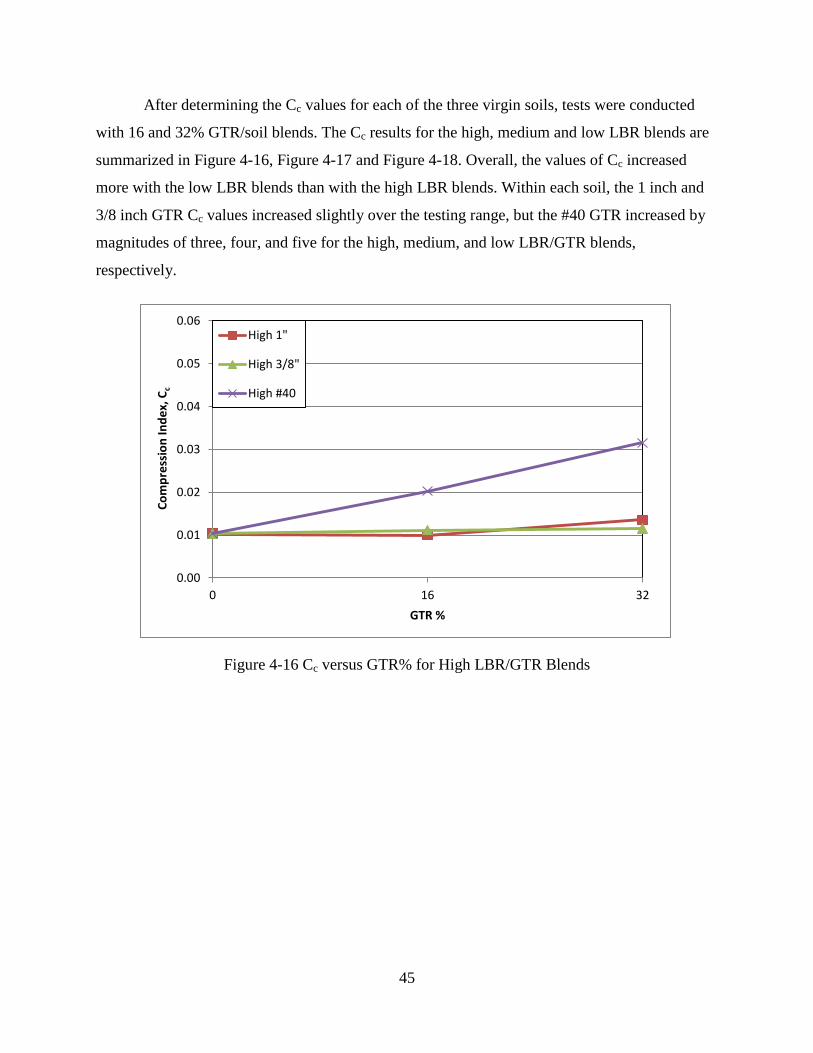
45
After determining the Cc values for each of the three virgin soils, tests were conducted
with 16 and 32% GTR/soil blends. The Cc results for the high, medium and low LBR blends are
summarized in Figure 4-16, Figure 4-17 and Figure 4-18. Overall, the values of Cc increased
more with the low LBR blends than with the high LBR blends. Within each soil, the 1 inch and
3/8 inch GTR Cc values increased slightly over the testing range, but the #40 GTR increased by
magnitudes of three, four, and five for the high, medium, and low LBR/GTR blends,
respectively.
Figure 4-16 Cc versus GTR% for High LBR/GTR Blends
0.00
0.01
0.02
0.03
0.04
0.05
0.06
0 16 32
Co
mp
ress
ion
Ind
ex,
Cc
GTR %
High 1"
High 3/8"
High #40
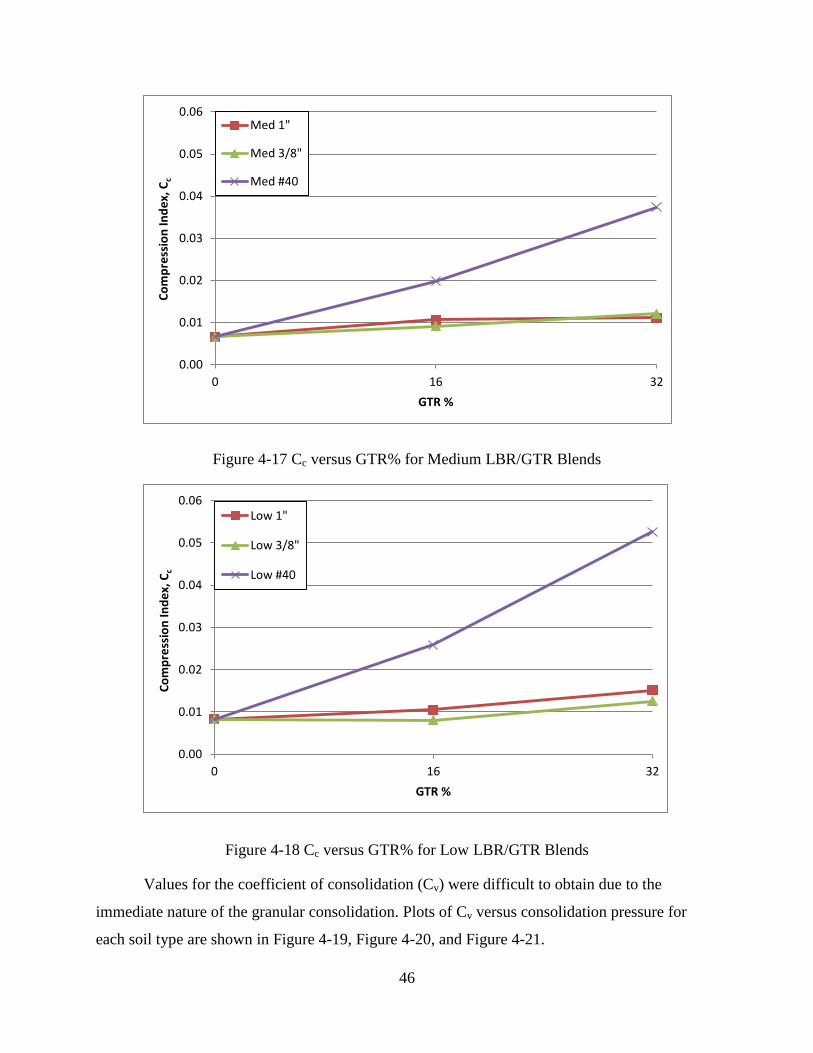
46
Figure 4-17 Cc versus GTR% for Medium LBR/GTR Blends
Figure 4-18 Cc versus GTR% for Low LBR/GTR Blends
Values for the coefficient of consolidation (Cv) were difficult to obtain due to the
immediate nature of the granular consolidation. Plots of Cv versus consolidation pressure for
each soil type are shown in Figure 4-19, Figure 4-20, and Figure 4-21.
0.00
0.01
0.02
0.03
0.04
0.05
0.06
0 16 32
Co
mp
ress
ion
Ind
ex,
Cc
GTR %
Med 1"
Med 3/8"
Med #40
0.00
0.01
0.02
0.03
0.04
0.05
0.06
0 16 32
Co
mp
ress
ion
Ind
ex,
Cc
GTR %
Low 1"
Low 3/8"
Low #40
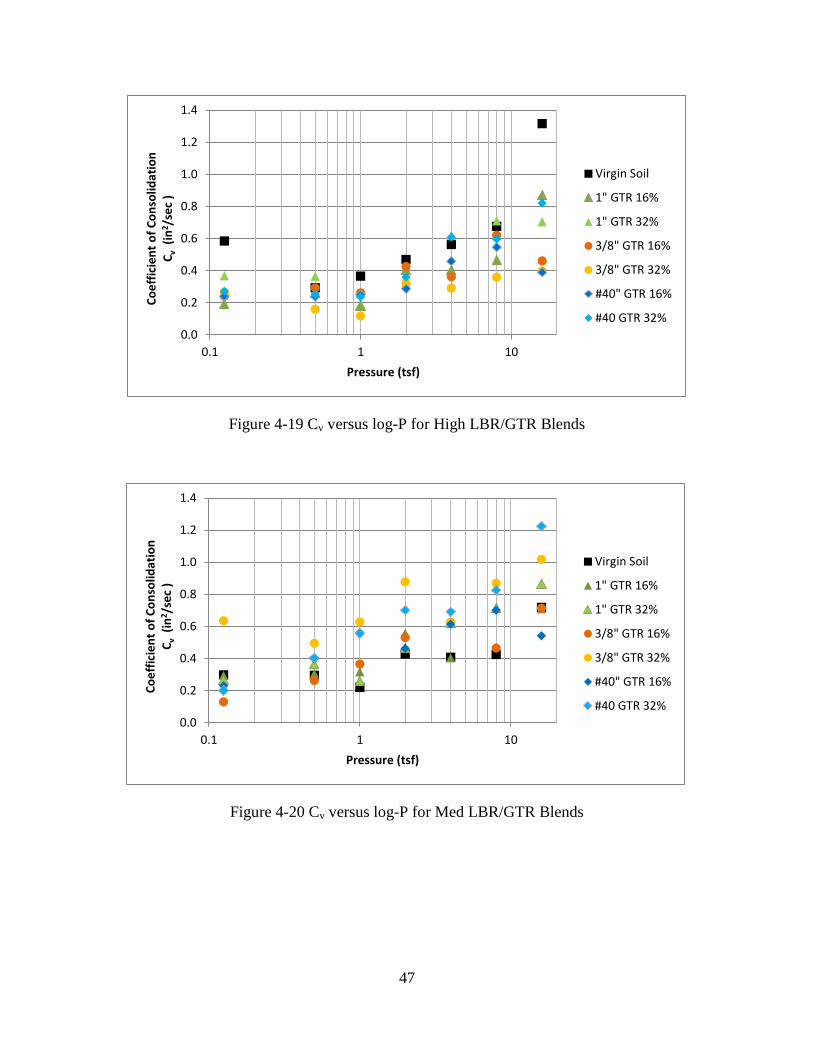
47
Figure 4-19 Cv versus log-P for High LBR/GTR Blends
Figure 4-20 Cv versus log-P for Med LBR/GTR Blends
0.0
0.2
0.4
0.6
0.8
1.0
1.2
1.4
0.1 1 10
Co
eff
icie
nt
of
Co
nso
lidat
ion
C
v (
in2/s
ec
)
Pressure (tsf)
Virgin Soil
1" GTR 16%
1" GTR 32%
3/8" GTR 16%
3/8" GTR 32%
#40" GTR 16%
#40 GTR 32%
0.0
0.2
0.4
0.6
0.8
1.0
1.2
1.4
0.1 1 10
Co
eff
icie
nt
of
Co
nso
lidat
ion
C
v (
in2 /
sec
)
Pressure (tsf)
Virgin Soil
1" GTR 16%
1" GTR 32%
3/8" GTR 16%
3/8" GTR 32%
#40" GTR 16%
#40 GTR 32%
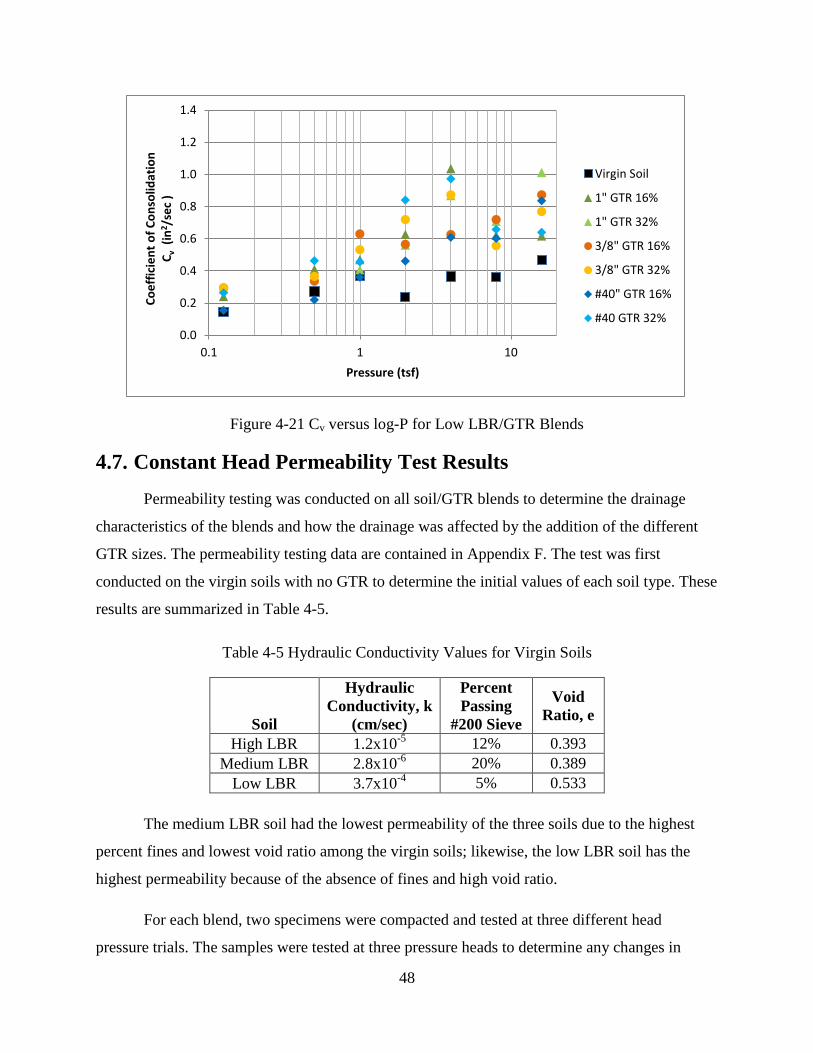
48
Figure 4-21 Cv versus log-P for Low LBR/GTR Blends
4.7. Constant Head Permeability Test Results
Permeability testing was conducted on all soil/GTR blends to determine the drainage
characteristics of the blends and how the drainage was affected by the addition of the different
GTR sizes. The permeability testing data are contained in Appendix F. The test was first
conducted on the virgin soils with no GTR to determine the initial values of each soil type. These
results are summarized in Table 4-5.
Table 4-5 Hydraulic Conductivity Values for Virgin Soils
Soil
Hydraulic
Conductivity, k
(cm/sec)
Percent
Passing
#200 Sieve
Void
Ratio, e
High LBR 1.2x10⁻⁵
12% 0.393
Medium LBR 2.8x10⁻⁶
20% 0.389
Low LBR 3.7x10⁻⁴
5% 0.533
The medium LBR soil had the lowest permeability of the three soils due to the highest
percent fines and lowest void ratio among the virgin soils; likewise, the low LBR soil has the
highest permeability because of the absence of fines and high void ratio.
For each blend, two specimens were compacted and tested at three different head
pressure trials. The samples were tested at three pressure heads to determine any changes in
0.0
0.2
0.4
0.6
0.8
1.0
1.2
1.4
0.1 1 10
Co
eff
icie
nt
of
Co
nso
lidat
ion
C
v (
in2 /
sec
)
Pressure (tsf)
Virgin Soil
1" GTR 16%
1" GTR 32%
3/8" GTR 16%
3/8" GTR 32%
#40" GTR 16%
#40 GTR 32%
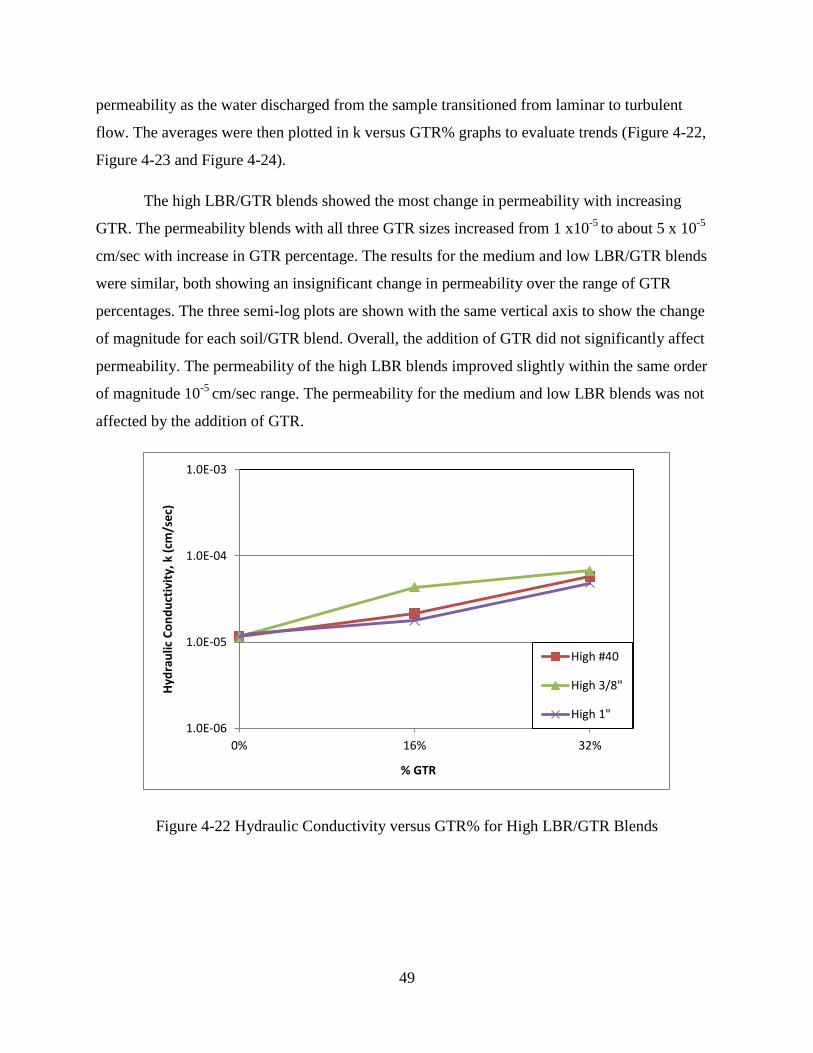
49
permeability as the water discharged from the sample transitioned from laminar to turbulent
flow. The averages were then plotted in k versus GTR% graphs to evaluate trends (Figure 4-22,
Figure 4-23 and Figure 4-24).
The high LBR/GTR blends showed the most change in permeability with increasing
GTR. The permeability blends with all three GTR sizes increased from 1 x10⁻⁵
to about 5 x 10⁻⁵
cm/sec with increase in GTR percentage. The results for the medium and low LBR/GTR blends
were similar, both showing an insignificant change in permeability over the range of GTR
percentages. The three semi-log plots are shown with the same vertical axis to show the change
of magnitude for each soil/GTR blend. Overall, the addition of GTR did not significantly affect
permeability. The permeability of the high LBR blends improved slightly within the same order
of magnitude 10-5
cm/sec range. The permeability for the medium and low LBR blends was not
affected by the addition of GTR.
Figure 4-22 Hydraulic Conductivity versus GTR% for High LBR/GTR Blends
1.0E-06
1.0E-05
1.0E-04
1.0E-03
0% 16% 32%
Hyd
rau
lic C
on
du
ctiv
ity,
k (
cm/s
ec)
% GTR
High #40
High 3/8"
High 1"
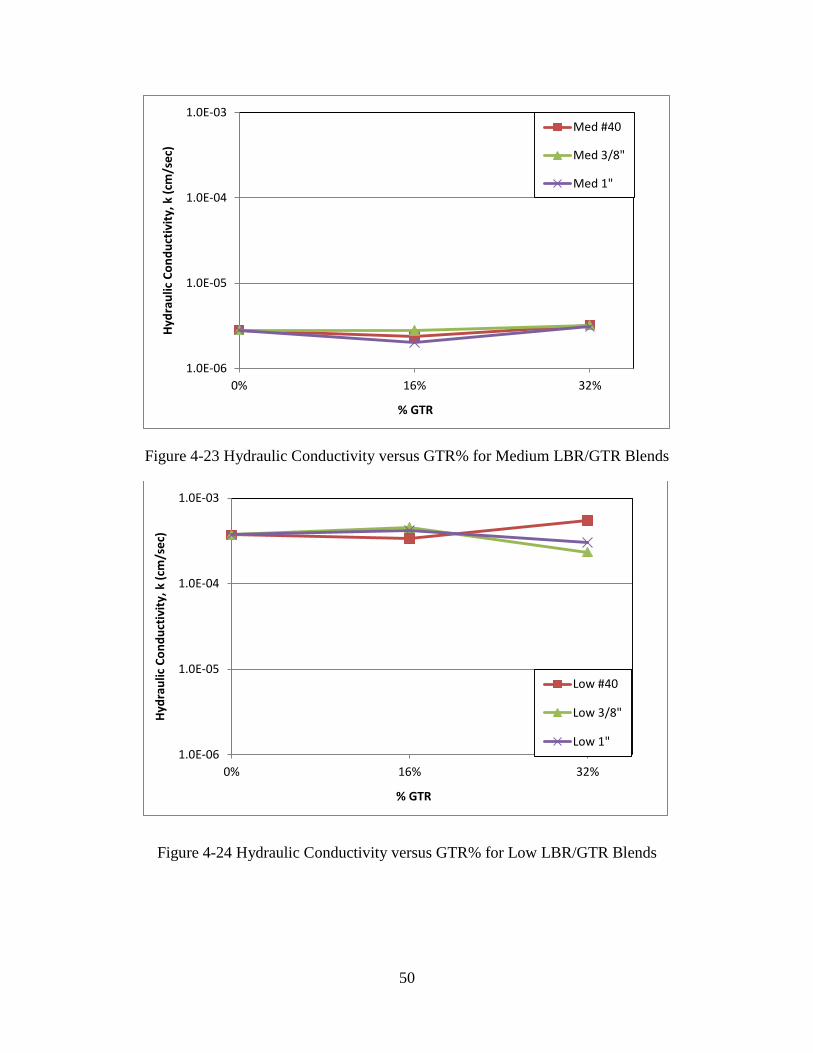
50
Figure 4-23 Hydraulic Conductivity versus GTR% for Medium LBR/GTR Blends
Figure 4-24 Hydraulic Conductivity versus GTR% for Low LBR/GTR Blends
1.0E-06
1.0E-05
1.0E-04
1.0E-03
0% 16% 32%
Hyd
rau
lic C
on
du
ctiv
ity,
k (
cm/s
ec)
% GTR
Med #40
Med 3/8"
Med 1"
1.0E-06
1.0E-05
1.0E-04
1.0E-03
0% 16% 32%
Hyd
rau
lic C
on
du
ctiv
ity,
k (
cm/s
ec)
% GTR
Low #40
Low 3/8"
Low 1"
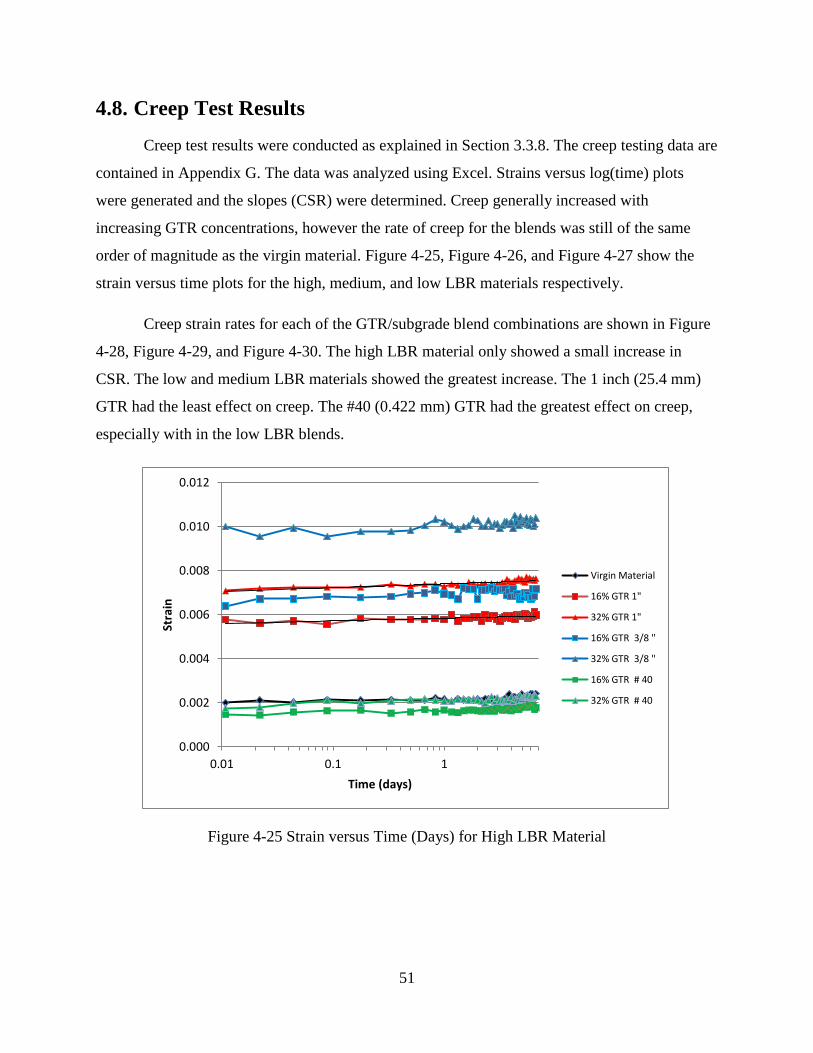
51
4.8. Creep Test Results
Creep test results were conducted as explained in Section 3.3.8. The creep testing data are
contained in Appendix G. The data was analyzed using Excel. Strains versus log(time) plots
were generated and the slopes (CSR) were determined. Creep generally increased with
increasing GTR concentrations, however the rate of creep for the blends was still of the same
order of magnitude as the virgin material. Figure 4-25, Figure 4-26, and Figure 4-27 show the
strain versus time plots for the high, medium, and low LBR materials respectively.
Creep strain rates for each of the GTR/subgrade blend combinations are shown in Figure
4-28, Figure 4-29, and Figure 4-30. The high LBR material only showed a small increase in
CSR. The low and medium LBR materials showed the greatest increase. The 1 inch (25.4 mm)
GTR had the least effect on creep. The #40 (0.422 mm) GTR had the greatest effect on creep,
especially with in the low LBR blends.
Figure 4-25 Strain versus Time (Days) for High LBR Material
0.000
0.002
0.004
0.006
0.008
0.010
0.012
0.01 0.1 1
Stra
in
Time (days)
Virgin Material
16% GTR 1"
32% GTR 1"
16% GTR 3/8 "
32% GTR 3/8 "
16% GTR # 40
32% GTR # 40
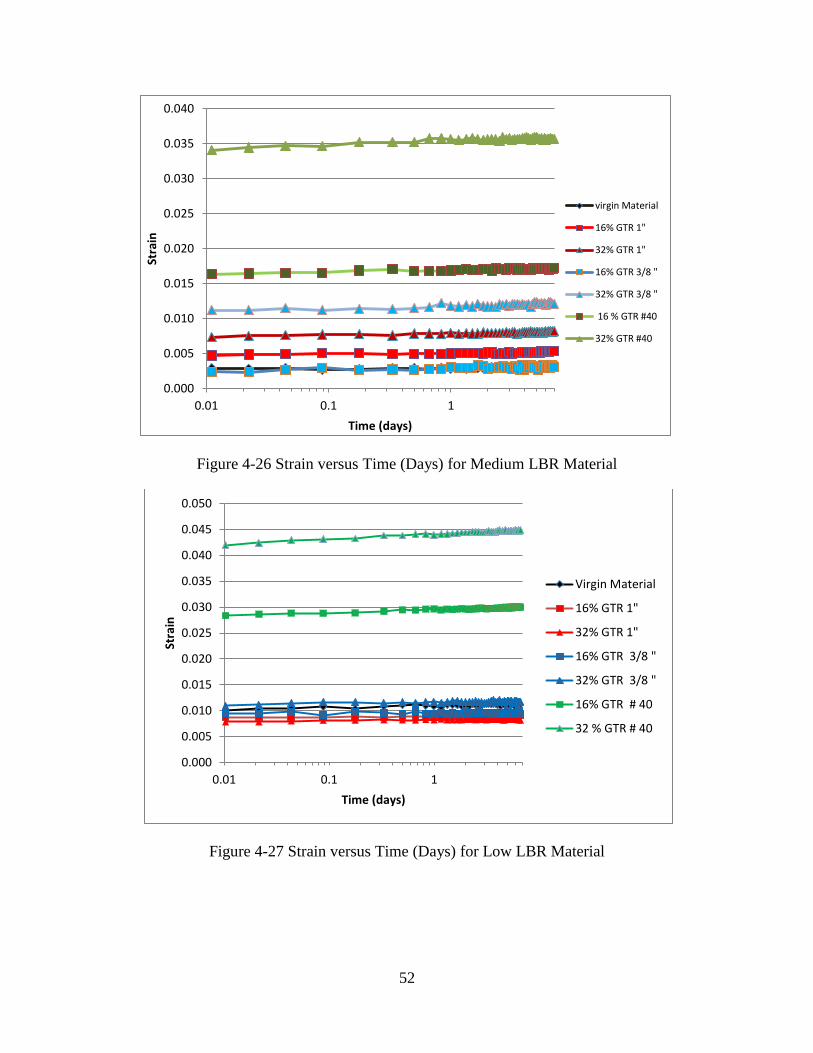
52
Figure 4-26 Strain versus Time (Days) for Medium LBR Material
Figure 4-27 Strain versus Time (Days) for Low LBR Material
0.000
0.005
0.010
0.015
0.020
0.025
0.030
0.035
0.040
0.01 0.1 1
Stra
in
Time (days)
virgin Material
16% GTR 1"
32% GTR 1"
16% GTR 3/8 "
32% GTR 3/8 "
16 % GTR #40
32% GTR #40
0.000
0.005
0.010
0.015
0.020
0.025
0.030
0.035
0.040
0.045
0.050
0.01 0.1 1
Stra
in
Time (days)
Virgin Material
16% GTR 1"
32% GTR 1"
16% GTR 3/8 "
32% GTR 3/8 "
16% GTR # 40
32 % GTR # 40
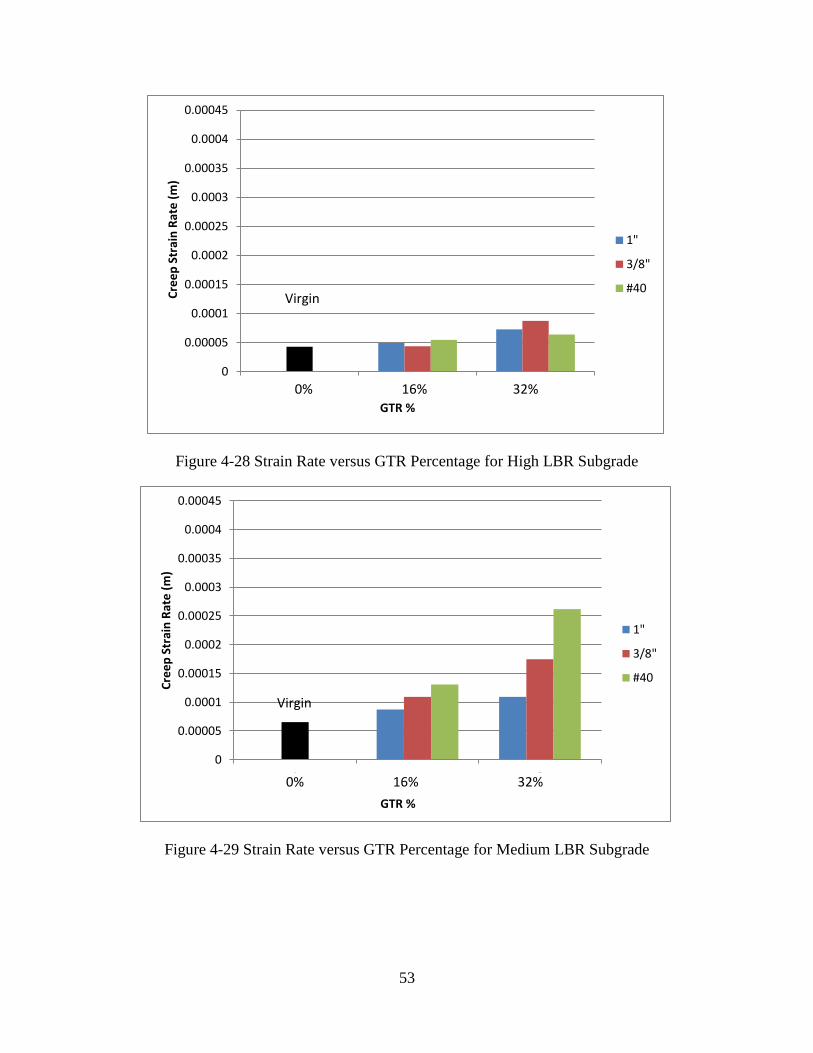
53
Figure 4-28 Strain Rate versus GTR Percentage for High LBR Subgrade
Figure 4-29 Strain Rate versus GTR Percentage for Medium LBR Subgrade
0
0.00005
0.0001
0.00015
0.0002
0.00025
0.0003
0.00035
0.0004
0.00045
1 2 3
Cre
ep
Str
ain
Rat
e (
m)
GTR %
1"
3/8"
#40
0% 16% 32%
Virgin
0
0.00005
0.0001
0.00015
0.0002
0.00025
0.0003
0.00035
0.0004
0.00045
1 2 3
Cre
ep
Str
ain
Rat
e (
m)
GTR %
1"
3/8"
#40
0% 16% 32%
Virgin
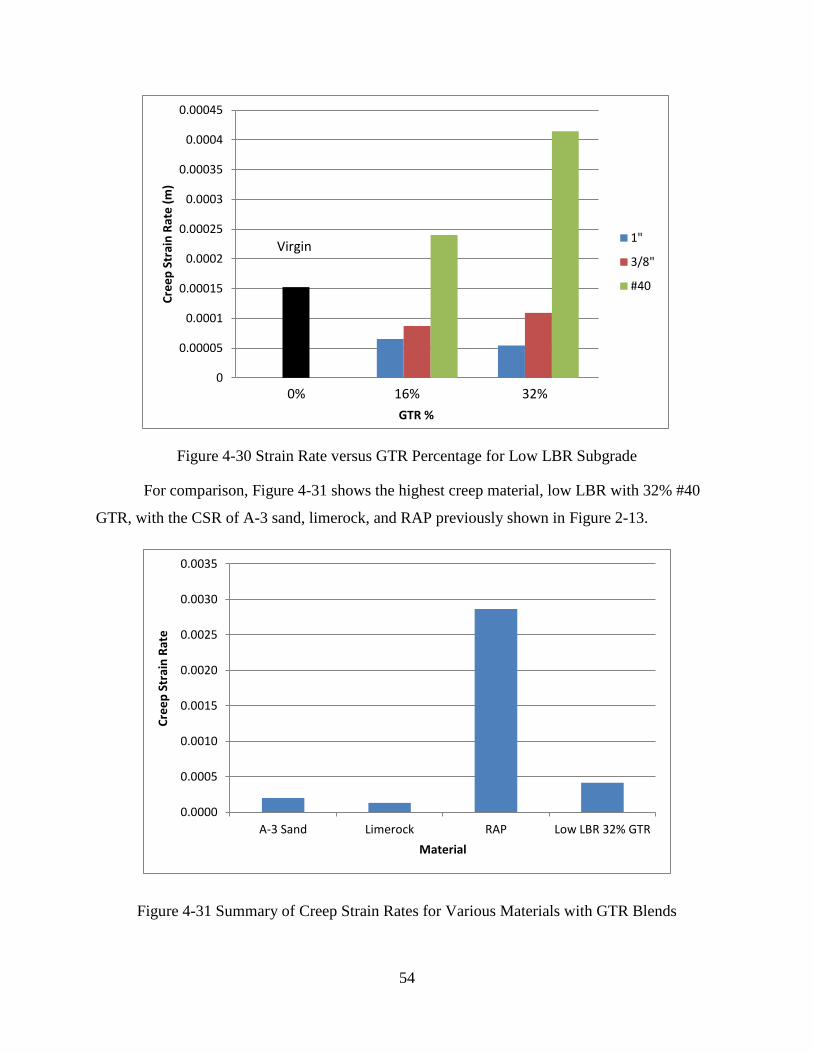
54
Figure 4-30 Strain Rate versus GTR Percentage for Low LBR Subgrade
For comparison, Figure 4-31 shows the highest creep material, low LBR with 32% #40
GTR, with the CSR of A-3 sand, limerock, and RAP previously shown in Figure 2-13.
Figure 4-31 Summary of Creep Strain Rates for Various Materials with GTR Blends
0
0.00005
0.0001
0.00015
0.0002
0.00025
0.0003
0.00035
0.0004
0.00045
Cre
ep
Str
ain
Rat
e (
m)
GTR %
1"
3/8"
#40
0% 16% 32%
0.0000
0.0005
0.0010
0.0015
0.0020
0.0025
0.0030
0.0035
A-3 Sand Limerock RAP Low LBR 32% GTR
Cre
ep
Str
ain
Rat
e
Material
Virgin
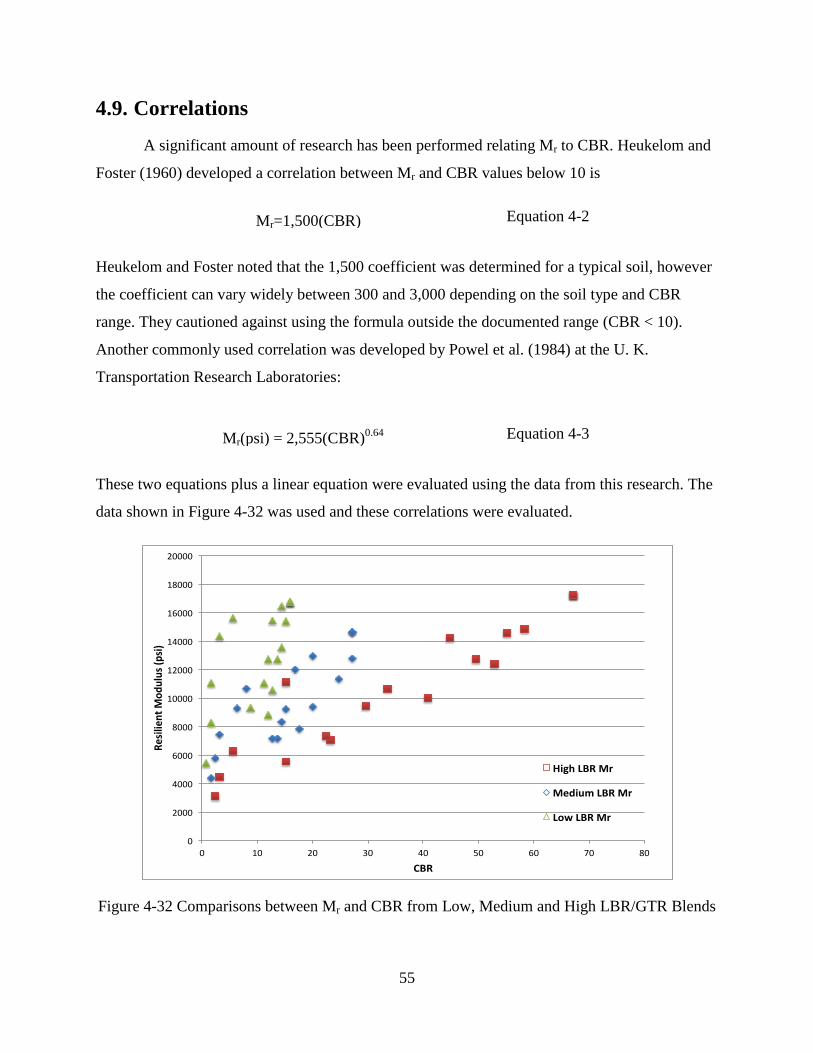
55
4.9. Correlations
A significant amount of research has been performed relating Mr to CBR. Heukelom and
Foster (1960) developed a correlation between Mr and CBR values below 10 is
Heukelom and Foster noted that the 1,500 coefficient was determined for a typical soil, however
the coefficient can vary widely between 300 and 3,000 depending on the soil type and CBR
range. They cautioned against using the formula outside the documented range (CBR < 10).
Another commonly used correlation was developed by Powel et al. (1984) at the U. K.
Transportation Research Laboratories:
These two equations plus a linear equation were evaluated using the data from this research. The
data shown in Figure 4-32 was used and these correlations were evaluated.
Figure 4-32 Comparisons between Mr and CBR from Low, Medium and High LBR/GTR Blends
0
2000
4000
6000
8000
10000
12000
14000
16000
18000
20000
0 10 20 30 40 50 60 70 80
Resilien
tModulus(psi)
CBR
HighLBRMr
MediumLBRMr
LowLBRMr
Mr=1,500(CBR) Equation 4-2
Mr(psi) = 2,555(CBR)0.64
Equation 4-3
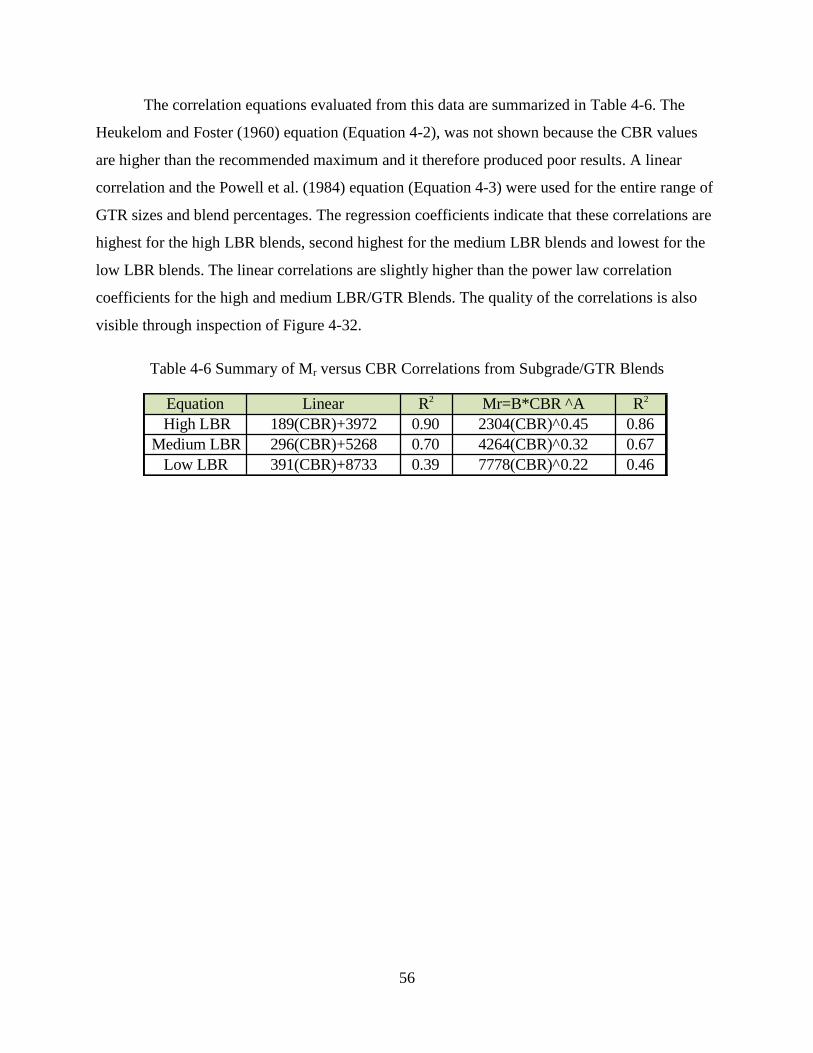
56
The correlation equations evaluated from this data are summarized in Table 4-6. The
Heukelom and Foster (1960) equation (Equation 4-2), was not shown because the CBR values
are higher than the recommended maximum and it therefore produced poor results. A linear
correlation and the Powell et al. (1984) equation (Equation 4-3) were used for the entire range of
GTR sizes and blend percentages. The regression coefficients indicate that these correlations are
highest for the high LBR blends, second highest for the medium LBR blends and lowest for the
low LBR blends. The linear correlations are slightly higher than the power law correlation
coefficients for the high and medium LBR/GTR Blends. The quality of the correlations is also
visible through inspection of Figure 4-32.
Table 4-6 Summary of Mr versus CBR Correlations from Subgrade/GTR Blends
Equation Linear R2 Mr=B*CBR ^A R2
High LBR 189(CBR)+3972 0.90 2304(CBR)^0.45 0.86
Medium LBR 296(CBR)+5268 0.70 4264(CBR)^0.32 0.67
Low LBR 391(CBR)+8733 0.39 7778(CBR)^0.22 0.46
57
5. Conclusions
5.1. Limerock Bearing Ratio Test
Blending GTR reduced the LBR of all three subgrade soils tested. The low LBR soil
failed to meet subgrade LBR requirements before blending and became worse after blending.
The medium soil was initially marginal but fell below the subgrade LBR standard with the
addition of all sizes and concentrations of GTR. Only the high LBR soil/GTR blends with up to
16% of 3/8th
inch or 1-inch nominal GTR met the FDOT subgrade specification of 40 LBR.
The density also decreased with increasing percentages of GTR for all three subgrade
blends. The density decrease was largely independent of the size of GTR used.
5.2. Resilient Modulus Test
The Mr decreases as the percentage of GTR increases for all three soils and all three GTR
sizes tested indicating that the blends would not be acceptable subgrade materials.
5.3. Consolidation Test
Compressibility of the soil/GTR blends increased slightly with the addition of 1 inch and
3/8 inch GTR and increased three to five times with the #40 GTR/soil blends.
5.4. Constant Head Permeability Test
No significant changes were observed in permeability with the addition of GTR to the
subgrade soils.
5.5. Creep Test
Blending GTR moderately increased creep in all three soils tested. The high LBR soil
showed the least increase in creep with the addition of GTR. The medium and low LBR
materials showed progressively greater creep increase with the addition of GTR. The 1-inch
(25.4 mm) GTR had the least effect on creep; the #40 (0.422 mm) GTR had the greatest effect.
Even the largest creep observed (low LBR with #40 (0.422 mm) GTR) was acceptable and
would not pose an engineering concern.

58
5.6. CBR- Mr Correlations
Equation 4-3 (Powell et al., 1984) produced strong CBR and Mr correlations for the high
and medium LBR/GTR blends. A linear correlation produced similar strong regression
coefficients for the high and medium LBR/ GTR blends. The low LBR/ GTR blends produced
medium correlations using both approaches.

59
6. Recommendations
Ground tire rubber is not recommended as a stabilizing agent for subgrade soils.
Blending GTR with soil did reduce the density of the blend; therefore, additional research
should be conducted to evaluate whether soil/GTR blends would be suitable for low-density fill
applications where the benefits from reduction in vertical and horizontal soil pressures would
offset the reduction in strength.
60
7. References
Ahmed, I. and C. Lovell. Use of Rubber Tires in Highway Construction. In Utilization of
Waste Materials in Civil Engineering Construction, American Society of Civil Engineers, New
York, N.Y., 1993, pp. 166–181.
Bader, C. Where will all the tires go? Municipal Solid Waste Management, Volume 2,
Issue 7, 1992, pp. 25-34.
Basheer, I.A. and Y.M Najjar. Rubber Tires and Geotextiles. Journal of Performance of
Constructed Facilities, 10(1), American Society of Civil Engineers, New York, N.Y., 1996,
pp.40–44.
Behzadi, G., and W. O. Yandell. Determination of Elastic and Plastic Subgrade Soil
Parameters for Asphalt Cracking and Rutting Prediction. In Transportation Research Record,
1540, TRB, National Research Council, Washington, D.C., 1996, pp.97-104.
Bosscher, P.J., T. B. Edil, and S. Kuraoke. Design of Highway Embankments using Tire
Chips. Journal of Geotechnical and Geoenviromental Engineering 123(4), American Society of
Civil Engineers, New York, N.Y., 1997, pp. 297–304.
Cabalar, A. F. Direct Shear Tests on Waste Tires-Sand Mixtures. Geotechnical and
Geological Engineering, Volume 29, Issue 4, 2011, pp. 411-418.
Cosentino, P. J., E. H. Kalajian, C. S.Shieh, W. J .K. Mathurin, F. A. Gomez, , E.
D.Cleary, A.Treerattakoon. Developing Specifications for Using Recycled Asphalt Pavement as
Base, Subbase, or General Fill Materials, Phase II. Final Report. FL/DOT/RMC/06650-7754
BC 819. Florida Departement of Transportation, Tallahassee, 2003.
Cosentino, P. J., E. H. Kalajian, D. Dikova, M. Patel, C. Sandin. Investigating the
Statewide Variability and Long Term Strength Deformation Characteristics of RAP and RAP-
Soil Mixtures: Final Report. FL/DOT/RMC/06650-7754 BCB 809. Florida Departement of
Transportation, Tallahassee, 2008.
Cosentino, P.J., E. H. Kalajian, A.M. Bleakley, B.S. Diouf, T.J. Misilo III, A. J. Petersen,
R. E. Krajcik, and A. M. Sajjadi. Improving the Properties of Reclaimed Asphalt Pavement for
61
Roadway Base Applications, Final Report. FL/DOT/BDK81 977-02. Florida Departement of
Transportation, Tallahassee, 2012.
Dikova, D. Creep Behavior of RAP-Soil Mixtures in Earthwork Applications. M.S.
Thesis, Florida Institute of Technology, 2006.
Diouf, B. Gradation Modification Effects on Engineering Performance of Reclaimed
Asphalt Pavement for Use as Roadway Base. M.S. Thesis, Florida Institute of Technology, 2011.
Edil, T.B. and P.J. Bosscher. Engineering Properties of Tire Chips and Soil Mixtures.
Geotechnical Testing Journal, Volume 17, Issue 4, 1994, pp. 453–464.
Eldin, N.N. and A.B.Senouci. Rubber-Tire Particles as Concrete Aggregate. Journal of
Materials in Civil Engineering, Volume 5, Issue 4, 1993, pp. 478–496.
Foose, G. J., C. H. Benson, and P. J. Bosscher. Sand Reinforced with Shredded Waste
Tires. Journal of Geotechnical Engineering, Volume 122, Issue 9, 1996, pp.760–767.
Garga, V.K. and V. O’Shaughnessy. Tire-Reinforced Earthfill. Part 1: Construction of a
Test Fill, Performance, and Retaining Wall Design. Canadian Geotechnical Journal, Volume 37,
2000, pp. 75–96.
Garga, V.K. and V. O’Shaughnessy. Tire-Reinforced Earthfill. Part 2: Pull-Out Behavior
and Reinforced Slope Design. Canadian Geotechnical Journal, Volume 37, 2000, pp. 97–116.
Ghazavi, M. Shear Strength Characteristics of Sand-Mixed With Granular Rubber.
Geotechnical and Geological Engineering, Volume 22, Issue 3, 2004, pp. 401-416.
Hall, T. Reuse of Shredded Tire Material for Leachate Collection System. In:
Proceedings. 14th. Annual Conference, Department of Engineering Professional Development,
University of Wisconsin, Madison, 1991, pp. 367–376.
Heimdahl, T. C. and A. Druscher. Elastic Anisotropy of Tire Shreds. Journal of
Geotechnical and Geoenviromental Engineering, Volume 125, Issue 5, 1999, pp. 383–389.
Heukelom, W., and C. R. Foster. Dynamic Testing of Pavements. Journal of Soil
Mechanics and Foundations, Volume 86, Number SM1, 1960, pp. 1-28
62
Humphrey, D. N., L.E. Katz, and M. Blumenthal. Water Quality Effects of Tire Chip Fill
Placed Above the Groundwater Table. In Testing Soil Mixed with Waste or Recycled Materials,
M.A. Wasemiller and K.B. Hoddinott (eds.), ASTM STP 1275, American Society of Testing
Materials, 1997.
Lee, J.H., R. Salgado, A. Bernal, and C. W. Lovell, Shredded Tires and Rubber-Sand as
Lightweight Backfill. Journal of Geotechnical and Geoenviromental Engineering, Volume 125,
Issue 2, 1999. pp. 132–141.
Nightingale, D.E.B. and W. P. Green. An Unsolved Riddle: Tire Chips, Two Roadbeds,
and Spontaneous Reactions. In Testing Soil Mixed with Waste or Recycled Materials, M.A.
Wasemiller and K.B. Hoddinott (eds.), ASTM STP 1275, American Society of Testing Materials,
1997.
Papp Jr., W.J., M. H. Maher, and R. F. Baker. Use of Shredded Tires in the Subbase
Layer of Asphalt Pavements. In Testing Soil Mixed with Waste or Recycled Materials, M.A.
Wasemiller and K.B. Hoddinott (eds.), ASTM STP 1275, American Society of Testing Materials,
1997.
Poh, P.S.H. and B. B. Broms. Slope Stabilization using Old Rubber Tires and
Geotextiles. Journal of Performance of Constructed Facilities, Volume 9, Issue 1, 1995, pp. 76–
80.
Powell, W. D., Potter, J. F., Mayhew, H. C., and Nunn, M. E. (1984). The Structural
Design of Bituminous Roads, TRRL report LR.
Singh, A., and Mitchell, J. K., General Stress-Strain-Time Function for Soils. Journal of
the Soil Mechanics and Foundation Division, Volume 94, Number SM1, 1968, pp. 21-47.
Speir, R. H., and M. W. Witczak. Use of Shredded Rubber in Unbound Granular
Flexible Pavement Layers. Transportation Research Record. Journal of the Transportation
Research Board, Number 1547, Transportation Research Board of the National Academies,
Washington, D.C., 1996, pp. 96-106.
63
Sumanarathna, I.H.D., D.P. Mallawarctchie, and S.A.S. Kulathilaka. Stabilization of
Slopes by Anchored Type Retaining Structures, In Proceedings 14th International Conference of
Soil Mechanics and Foundation Engineering, New Delhi, India, 1997, pp. 1261–1264.
Sweere, G.T.H.. Unbound Granular Base for Roads. Ph.D. dissertation, University of
Delft, Netherlands, 1990.
Tuncan, M., A. Cetin, M. Tuncan, and H. Koyuncu. Assessment of Waste Tires and
Plastic on Asphalt Concrete Pavement Mixtures, In: Proceedings of Third International
Congress on Environmental Geotechnics, Lisbon, Portugal, 1998, pp. 667–672.
Venkatappa Rao, G. and R. K. Dutta. Compressibility and Strength Behaviour of Sand-
Tyre Chip Mixtures. Geotechnical and Geological Engineering, Volume 24, 2006, pp.711–724.
Viyanant, C., E.M. Rathje, and A.F. Rauch. Creep of Compacted Recycled Asphalt
Pavement. Canadian Geotechnical Journal, Volume 44, Number 6, 2007, pp. 687-697.

64
Appendices
65
Appendix Contents
A. Appendix A – Sieve Analysis ............................................................................................... 72
B. Appendix B – Moisture-Density Results .............................................................................. 74
C. Appendix C – Limerock Bearing Ratio................................................................................. 76
C.1. Low LBR Soil ................................................................................................................... 76
C.2. Medium LBR Soil ............................................................................................................. 84
C.3. High LBR Soil ................................................................................................................... 92
D. Appendix D – Resilient Modulus........................................................................................ 100
D.1. Low LBR Soil ................................................................................................................. 100
D.2. Medium LBR Soil ........................................................................................................... 101
D.3. High LBR Soil ................................................................................................................ 102
E. Appendix E – Consolidation ............................................................................................... 103
E.1. Low LBR Soil ................................................................................................................. 103
E.1.1. Virgin Material ......................................................................................................... 104
E.1.2. 1” GTR ..................................................................................................................... 105
E.1.3. 3/8” GTR .................................................................................................................. 107
E.1.4. #40 mesh GTR .......................................................................................................... 109
E.2. Medium LBR Soil ........................................................................................................... 111
E.2.1. Virgin Material ......................................................................................................... 112
E.2.2. 1” GTR ..................................................................................................................... 113
E.2.3. 3/8” GTR .................................................................................................................. 115
E.2.4. #40 mesh GTR .......................................................................................................... 117
E.3. High LBR Soil ................................................................................................................. 119
E.3.1. Virgin Material ......................................................................................................... 120
E.3.2. 1” GTR ..................................................................................................................... 121
E.3.3. 3/8” GTR .................................................................................................................. 123
E.3.4. #40 mesh GTR .......................................................................................................... 125
66
F. Appendix F – Constant Head Permeability ......................................................................... 127
F.1. Low LBR Soil .................................................................................................................. 127
F.1.1. Virgin Material ......................................................................................................... 127
F.1.2. 1” GTR ...................................................................................................................... 127
F.1.3. 3/8” GTR .................................................................................................................. 128
F.1.4. #40 mesh GTR .......................................................................................................... 128
F.2. Medium LBR Soil ........................................................................................................... 129
F.2.1. Virgin Material ......................................................................................................... 129
F.2.2. 1” GTR ...................................................................................................................... 129
F.2.3. 3/8” GTR .................................................................................................................. 130
F.2.4. #40 mesh GTR .......................................................................................................... 130
F.3. High LBR Soil ................................................................................................................. 131
F.3.1. Virgin Material ......................................................................................................... 131
F.3.2. 1” GTR ...................................................................................................................... 132
F.3.3. 3/8” GTR .................................................................................................................. 133
F.3.4. #40 mesh GTR .......................................................................................................... 133
G. Appendix G – Creep ........................................................................................................... 134
H. Appendix H – Data Retrieval System ................................................................................. 137
67
Appendix Figures Figure A-1 Sieve Analysis for High LBR Material .......................................................... 72
Figure A-2 Sieve Analysis for Medium LBR Material .................................................... 73
Figure A-3 Sieve Analysis for Low LBR Material ........................................................... 73
Figure B-1 Moisture Density Low LBR Material............................................................. 74
Figure B-2 Moisture Density Medium LBR Material ...................................................... 74
Figure B-3 Moisture Density High LBR Material ............................................................ 75
Figure C-1 Deflection versus Load for Low LBR Soil..................................................... 76
Figure C-2 Deflection versus Load for Low LBR Soil and 4% 1-inch GTR ................... 76
Figure C-3 Deflection versus Load for Low LBR Soil and 8% 1-inch GTR ................... 77
Figure C-4 Deflection versus Load for Low LBR Soil and 16% 1-inch GTR ................. 77
Figure C-5 Deflection versus Load for Low LBR Soil and 24% 1-inch GTR ................. 78
Figure C-6 Deflection versus Load for Low LBR Soil and 32% 1-inch GTR ................. 78
Figure C-7 Deflection versus Load for Low LBR Soil and 4% 3/8-inch GTR ................ 79
Figure C-8 Deflection versus Load for Low LBR Soil and 8% 3/8-inch GTR ................ 79
Figure C-9 Deflection versus Load for Low LBR Soil and 16% 3/8-inch GTR .............. 80
Figure C-10 Deflection versus Load for Low LBR Soil and 24% 3/8-inch GTR ............ 80
Figure C-11 Deflection versus Load for Low LBR Soil and 32% 3/8-inch GTR ............ 81
Figure C-12 Deflection versus Load for Low LBR Soil and 4% #40 mesh GTR ............ 81
Figure C-13 Deflection versus Load for Low LBR Soil and 8% #40 mesh GTR ............ 82
Figure C-14 Deflection versus Load for Low LBR Soil and 16% #40 mesh GTR .......... 82
Figure C-15 Deflection versus Load for Low LBR Soil and 24% #40 mesh GTR .......... 83
Figure C-16 Deflection versus Load for Low LBR Soil and 32% #40 mesh GTR .......... 83
Figure C-17 Deflection versus Load for Medium LBR Soil ............................................ 84
Figure C-18 Deflection versus Load for Medium LBR Soil and 4% 1-inch GTR ........... 84
Figure C-19 Deflection versus Load for Medium LBR Soil and 8% 1-inch GTR ........... 85
Figure C-20 Deflection versus Load for Medium LBR Soil and 16% 1-inch GTR ......... 85
Figure C-21 Deflection versus Load for Medium LBR Soil and 24% 1-inch GTR ......... 86
Figure C-22 Deflection versus Load for Medium LBR Soil and 32% 1-inch GTR ......... 86
Figure C-23 Deflection versus Load for Medium LBR Soil and 4% 3/8-inch GTR ........ 87
68
Figure C-24 Deflection versus Load for Medium LBR Soil and 8% 3/8-inch GTR ........ 87
Figure C-25 Deflection versus Load for Medium LBR Soil and 16% 3/8-inch GTR ...... 88
Figure C-26 Deflection versus Load for Medium LBR Soil and 24% 3/8-inch GTR ...... 88
Figure C-27 Deflection versus Load for Medium LBR Soil and 32% 3/8-inch GTR ...... 89
Figure C-28 Deflection versus Load for Medium LBR Soil and 4% #40 mesh GTR ...... 89
Figure C-29 Deflection versus Load for Medium LBR Soil and 8% #40 mesh GTR ...... 90
Figure C-30 Deflection versus Load for Medium LBR Soil and 16% #40 mesh GTR .... 90
Figure C-31 Deflection versus Load for Medium LBR Soil and 24% #40 mesh GTR .... 91
Figure C-32 Deflection versus Load for Medium LBR Soil and 32% #40 mesh GTR .... 91
Figure C-33 Deflection versus Load for High LBR Soil .................................................. 92
Figure C-34 Deflection versus Load for High LBR Soil and 4% 1-inch GTR ................. 92
Figure C-35 Deflection versus Load for High LBR Soil and 8% 1-inch GTR ................. 93
Figure C-36 Deflection versus Load for High LBR Soil and 16% 1-inch GTR............... 93
Figure C-37 Deflection versus Load for High LBR Soil and 24% 1-inch GTR............... 94
Figure C-38 Deflection versus Load for High LBR Soil and 32% 1-inch GTR............... 94
Figure C-39 Deflection versus Load for High LBR Soil and 4% 3/8-inch GTR ............. 95
Figure C-40 Deflection versus Load for High LBR Soil and 8% 3/8-inch GTR ............. 95
Figure C-41 Deflection versus Load for High LBR Soil and 16% 3/8-inch GTR ........... 96
Figure C-42 Deflection versus Load for High LBR Soil and 24% 3/8-inch GTR ........... 96
Figure C-43 Deflection versus Load for High LBR Soil and 32% 3/8-inch GTR ........... 97
Figure C-44 Deflection versus Load for High LBR Soil and 4% #40 mesh GTR ........... 97
Figure C-45 Deflection versus Load for High LBR Soil and 8% #40 mesh GTR ........... 98
Figure C-46 Deflection versus Load for High LBR Soil and 16% #40 mesh GTR ......... 98
Figure C-47 Deflection versus Load for High LBR Soil and 24% #40 mesh GTR ......... 99
Figure C-48 Deflection versus Load for High LBR Soil and 32% #40 mesh GTR ......... 99
Figure E-1 – Void Ratio versus log-Pressure Curves for Low LBR Soil ....................... 104
Figure E-2 – Void Ratio versus log-Pressure Curves for Low LBR Soil and 16% 1-inch
GTR............................................................................................................................................. 105
Figure E-3 – Void Ratio versus log-Pressure Curves for Low LBR Soil and 32% 1-inch
GTR............................................................................................................................................. 106
69
Figure E-4 – Void Ratio versus log-Pressure Curves for Low LBR Soil and 16% 3/8-inch
GTR............................................................................................................................................. 107
Figure E-5 – Void Ratio versus log-Pressure Curves for Low LBR Soil and 32% 3/8-inch
GTR............................................................................................................................................. 108
Figure E-6 – Void Ratio versus log-Pressure Curves for Low LBR Soil and 16% #40
mesh GTR ................................................................................................................................... 109
Figure E-7 – Void Ratio versus log-Pressure Curves for Low LBR Soil and 32% #40
mesh GTR ................................................................................................................................... 110
Figure E-8 – Void Ratio versus log-Pressure Curves for Medium LBR Soil ................. 112
Figure E-9 – Void Ratio versus log-Pressure Curves for Medium LBR Soil and 16% 1-
inch GTR ..................................................................................................................................... 113
Figure E-10 – Void Ratio versus log-Pressure Curves for Medium LBR Soil and 32% 1-
inch GTR ..................................................................................................................................... 114
Figure E-11 – Void Ratio versus log-Pressure Curves for Medium LBR Soil and 16%
3/8-inch GTR .............................................................................................................................. 115
Figure E-12 – Void Ratio versus log-Pressure Curves for Medium LBR Soil and 32%
3/8-inch GTR .............................................................................................................................. 116
Figure E-13 – Void Ratio versus log-Pressure Curves for Medium LBR Soil and 16% #40
mesh GTR ................................................................................................................................... 117
Figure E-14 – Void Ratio versus log-Pressure Curves for Medium LBR Soil and 32% #40
mesh GTR ................................................................................................................................... 118
Figure E-15 – Void Ratio versus log-Pressure Curves for High LBR Soil .................... 120
Figure E-16 – Void Ratio versus log-Pressure Curves for High LBR Soil and 16% 1-inch
GTR............................................................................................................................................. 121
Figure E-17 – Void Ratio versus log-Pressure Curves for High LBR Soil and 32% 1-inch
GTR............................................................................................................................................. 122
Figure E-18 – Void Ratio versus log-Pressure Curves for High LBR Soil and 16% 3/8-
inch GTR ..................................................................................................................................... 123
Figure E-19 – Void Ratio versus log-Pressure Curves for High LBR Soil and 32% 3/8-
inch GTR ..................................................................................................................................... 124
70
Figure E-20 – Void Ratio versus log-Pressure Curves for High LBR Soil and 16% #40
mesh GTR ................................................................................................................................... 125
Figure E-21 – Void Ratio versus log-Pressure Curves for High LBR Soil and 32% #40
mesh GTR ................................................................................................................................... 126
Figure G-1 Strain versus Time for Low LBR Subgrade GTR Blends ............................ 134
Figure G-2 Strain versus Time for Medium LBR Subgrade GTR Blends ..................... 135
Figure G-3 Strain versus Time for High LBR Subgrade GTR Blends ........................... 136
Figure H-1 Home Screen ................................................................................................ 137
Figure H-2 Projects Screen ............................................................................................. 138
Figure H-3 Project Test Listing ...................................................................................... 139
Figure H-4 Add Test to Material Screen......................................................................... 140
Figure H-5 Dropdown of Tests that can be added .......................................................... 141
Figure H-6 Limerock Bearing Ratio Test Details ........................................................... 142
Figure H-7 Modified Proctor Test Details ...................................................................... 143
71
Appendix Tables
Table D-1 Whitehurst (Low LBR Blend) ....................................................................... 100
Table D-2 Orange Heights PIT (Medium LBR Blend) .................................................. 101
Table D-3 FDOT Maintenance PIT (High LBR Blend) ................................................. 102
Table E-1 – Cv values for Low LBR Soil ....................................................................... 103
Table E-2 – Cv values for Medium LBR Soil ................................................................. 111
Table E-3 – Cv values for High LBR Soil....................................................................... 119
Table F-1 – Permeability Data Sheet for Low LBR Soil ................................................ 127
Table F-2 – Permeability Data Sheet for Low LBR Soil and 1-inch GTR ..................... 127
Table F-3 – Permeability Data Sheet for Low LBR Soil and 3/8-inch GTR .................. 128
Table F-4 – Permeability Data Sheet for Low LBR Soil and #40 mesh GTR ............... 128
Table F-5 – Permeability Data Sheet for Medium LBR Soil.......................................... 129
Table F-6 – Permeability Data Sheet for Medium LBR Soil and 1-inch GTR............... 129
Table F-7 – Permeability Data Sheet for Medium LBR Soil and 3/8-inch GTR ........... 130
Table F-8 – Permeability Data Sheet for Medium LBR Soil and #40 mesh GTR ......... 130
Table F-9 – Permeability Data Sheet for High LBR Soil ............................................... 131
Table F-10 – Permeability Data Sheet for High LBR Soil and 1-inch GTR .................. 132
Table F-11 – Permeability Data Sheet for High LBR Soil and 3/8-inch GTR ............... 133
Table F-12 – Permeability Data Sheet for High LBR Soil and #40 mesh GTR ............. 133
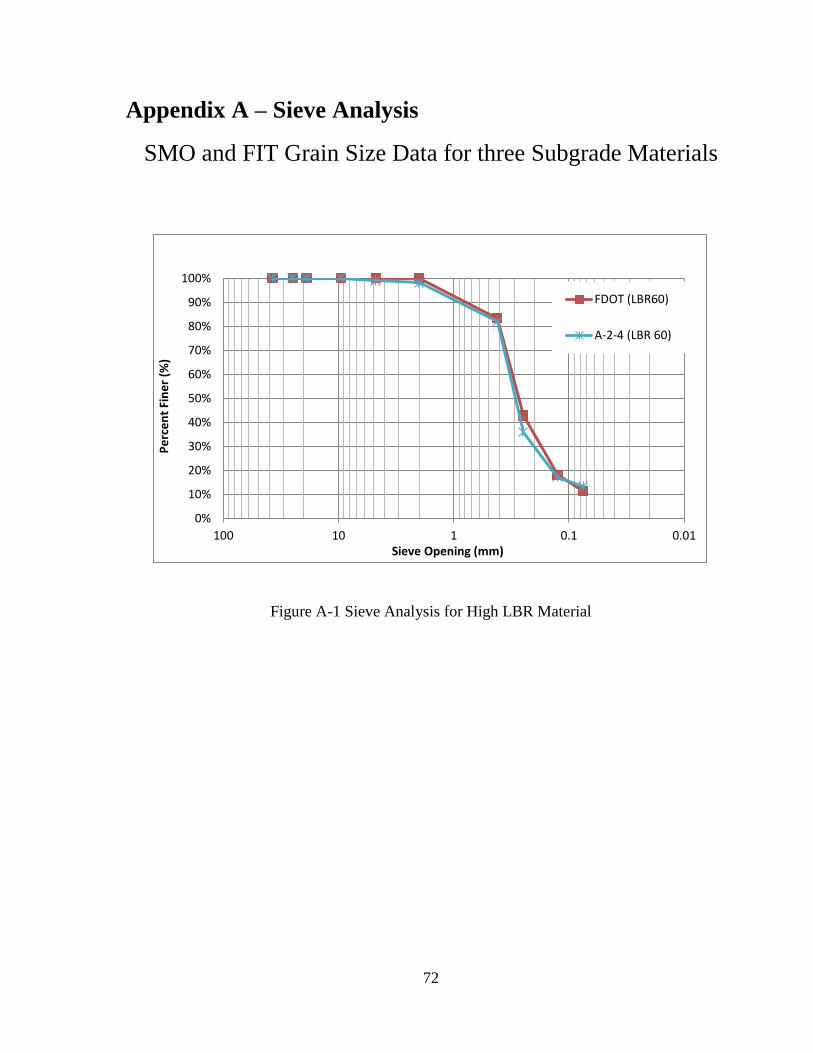
72
A. Appendix A – Sieve Analysis
SMO and FIT Grain Size Data for three Subgrade Materials
Figure A-1 Sieve Analysis for High LBR Material
0%
10%
20%
30%
40%
50%
60%
70%
80%
90%
100%
0.010.1110100
Pe
rce
nt
Fin
er
(%)
Sieve Opening (mm)
FDOT (LBR60)
A-2-4 (LBR 60)
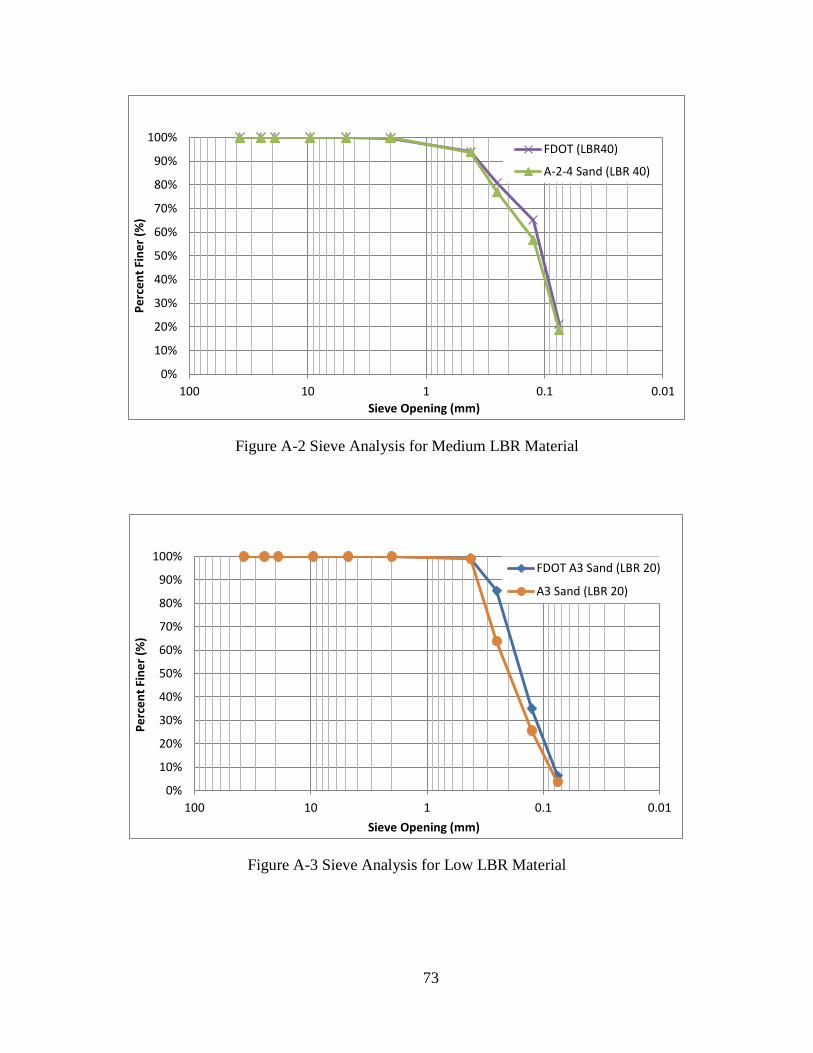
73
Figure A-2 Sieve Analysis for Medium LBR Material
Figure A-3 Sieve Analysis for Low LBR Material
0%
10%
20%
30%
40%
50%
60%
70%
80%
90%
100%
0.010.1110100
Pe
rce
nt
Fin
er
(%)
Sieve Opening (mm)
FDOT (LBR40)
A-2-4 Sand (LBR 40)
0%
10%
20%
30%
40%
50%
60%
70%
80%
90%
100%
0.010.1110100
Pe
rce
nt
Fin
er
(%)
Sieve Opening (mm)
FDOT A3 Sand (LBR 20)
A3 Sand (LBR 20)
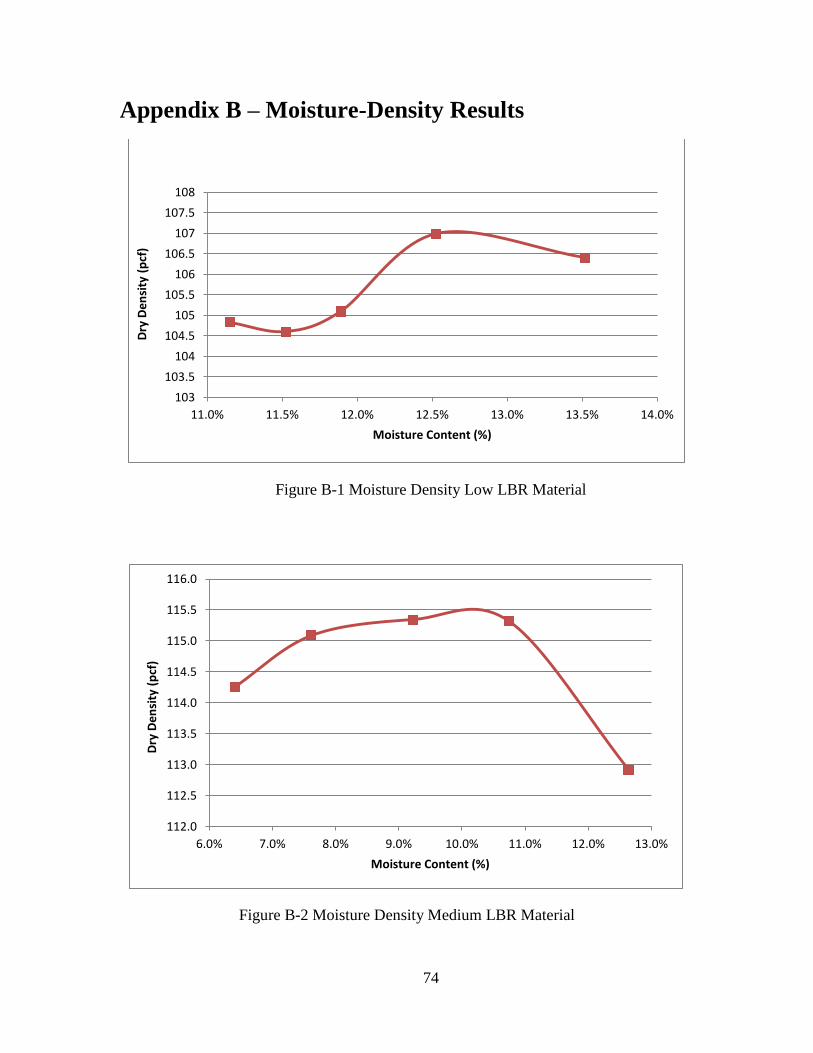
74
B. Appendix B – Moisture-Density Results
Figure B-1 Moisture Density Low LBR Material
Figure B-2 Moisture Density Medium LBR Material
103
103.5
104
104.5
105
105.5
106
106.5
107
107.5
108
11.0% 11.5% 12.0% 12.5% 13.0% 13.5% 14.0%
Dry
De
nsi
ty (
pcf
)
Moisture Content (%)
112.0
112.5
113.0
113.5
114.0
114.5
115.0
115.5
116.0
6.0% 7.0% 8.0% 9.0% 10.0% 11.0% 12.0% 13.0%
Dry
De
nsi
ty (
pcf
)
Moisture Content (%)
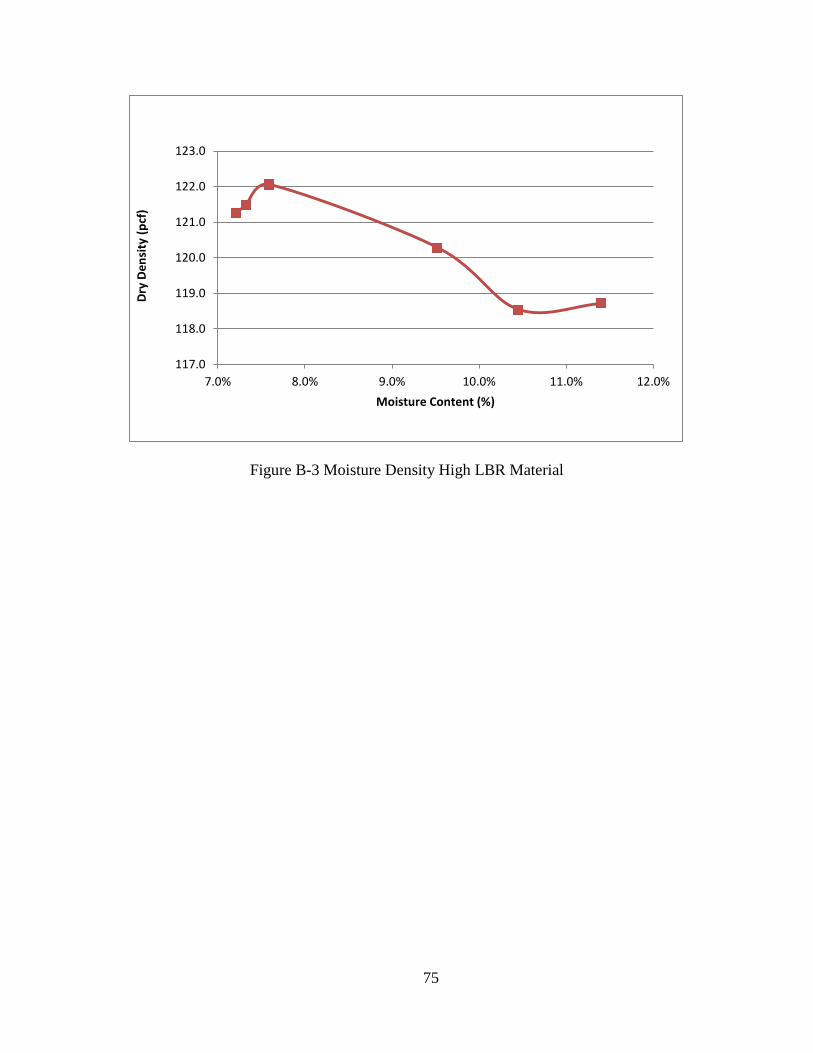
75
Figure B-3 Moisture Density High LBR Material
117.0
118.0
119.0
120.0
121.0
122.0
123.0
7.0% 8.0% 9.0% 10.0% 11.0% 12.0%
Dry
De
nsi
ty (
pcf
)
Moisture Content (%)
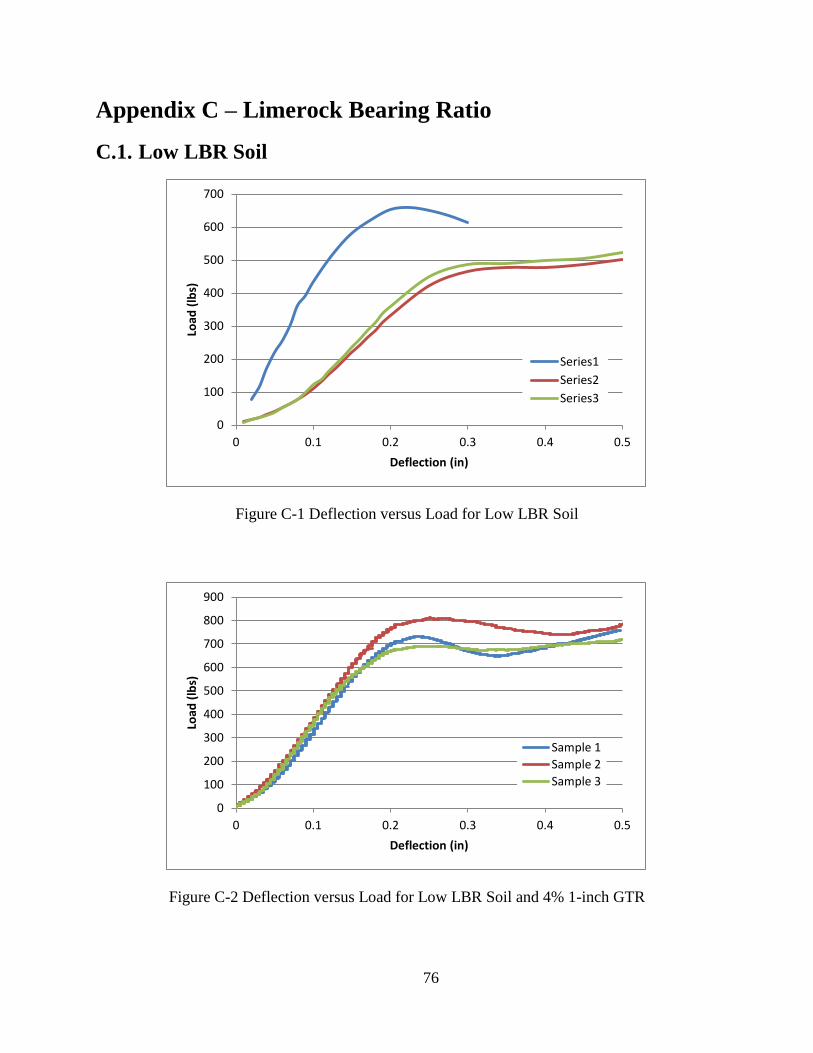
76
C. Appendix C – Limerock Bearing Ratio
C.1. Low LBR Soil
Figure C-1 Deflection versus Load for Low LBR Soil
Figure C-2 Deflection versus Load for Low LBR Soil and 4% 1-inch GTR
0
100
200
300
400
500
600
700
0 0.1 0.2 0.3 0.4 0.5
Load
(lb
s)
Deflection (in)
Series1
Series2
Series3
0
100
200
300
400
500
600
700
800
900
0 0.1 0.2 0.3 0.4 0.5
Load
(lb
s)
Deflection (in)
Sample 1
Sample 2
Sample 3
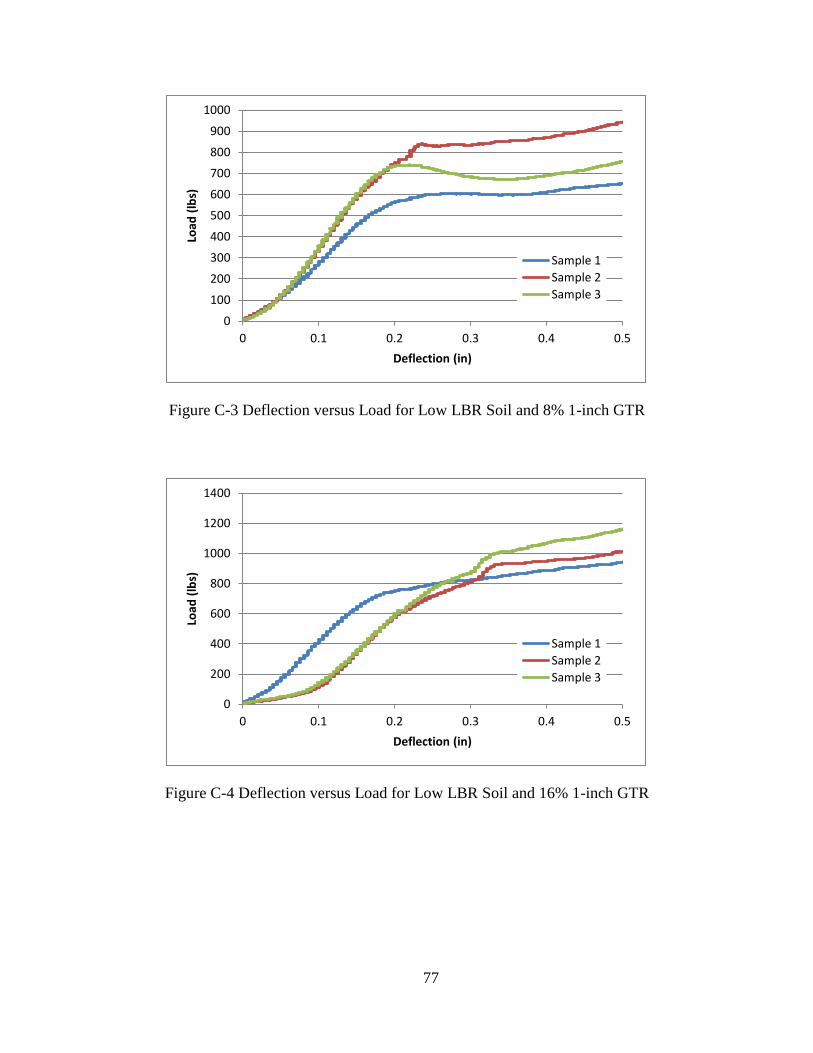
77
Figure C-3 Deflection versus Load for Low LBR Soil and 8% 1-inch GTR
Figure C-4 Deflection versus Load for Low LBR Soil and 16% 1-inch GTR
0
100
200
300
400
500
600
700
800
900
1000
0 0.1 0.2 0.3 0.4 0.5
Load
(lb
s)
Deflection (in)
Sample 1
Sample 2
Sample 3
0
200
400
600
800
1000
1200
1400
0 0.1 0.2 0.3 0.4 0.5
Load
(lb
s)
Deflection (in)
Sample 1
Sample 2
Sample 3
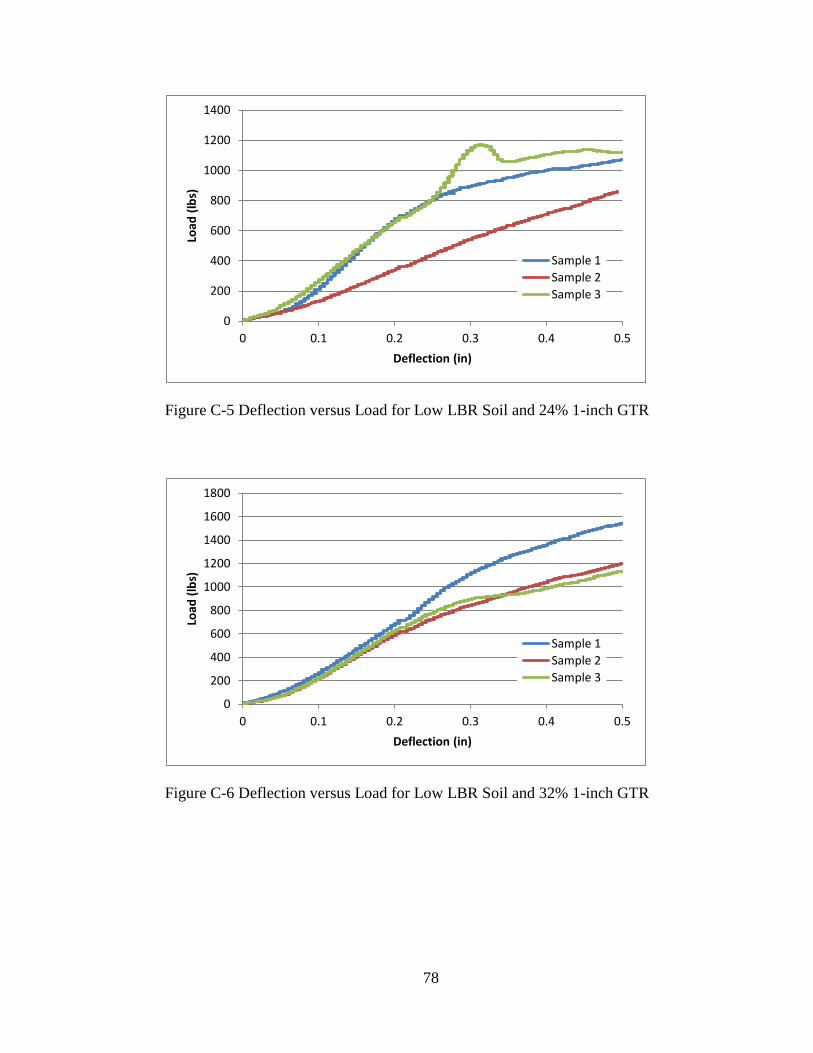
78
Figure C-5 Deflection versus Load for Low LBR Soil and 24% 1-inch GTR
Figure C-6 Deflection versus Load for Low LBR Soil and 32% 1-inch GTR
0
200
400
600
800
1000
1200
1400
0 0.1 0.2 0.3 0.4 0.5
Load
(lb
s)
Deflection (in)
Sample 1
Sample 2
Sample 3
0
200
400
600
800
1000
1200
1400
1600
1800
0 0.1 0.2 0.3 0.4 0.5
Load
(lb
s)
Deflection (in)
Sample 1
Sample 2
Sample 3
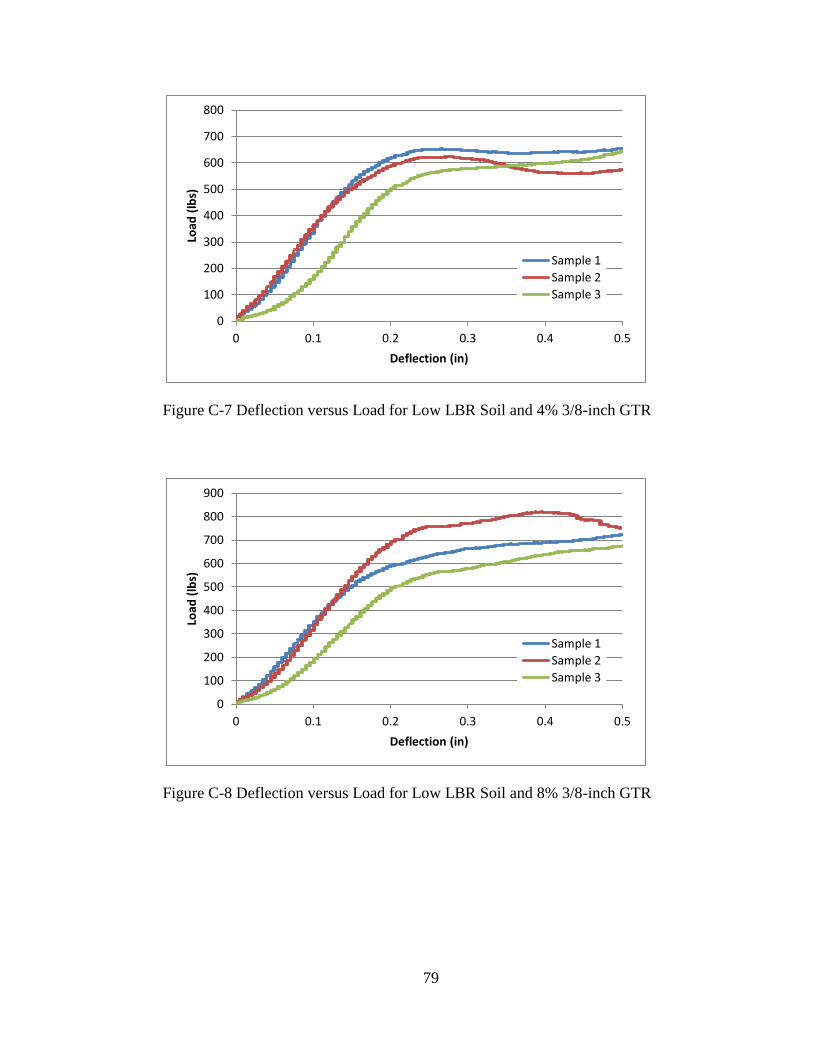
79
Figure C-7 Deflection versus Load for Low LBR Soil and 4% 3/8-inch GTR
Figure C-8 Deflection versus Load for Low LBR Soil and 8% 3/8-inch GTR
0
100
200
300
400
500
600
700
800
0 0.1 0.2 0.3 0.4 0.5
Load
(lb
s)
Deflection (in)
Sample 1
Sample 2
Sample 3
0
100
200
300
400
500
600
700
800
900
0 0.1 0.2 0.3 0.4 0.5
Load
(lb
s)
Deflection (in)
Sample 1
Sample 2
Sample 3
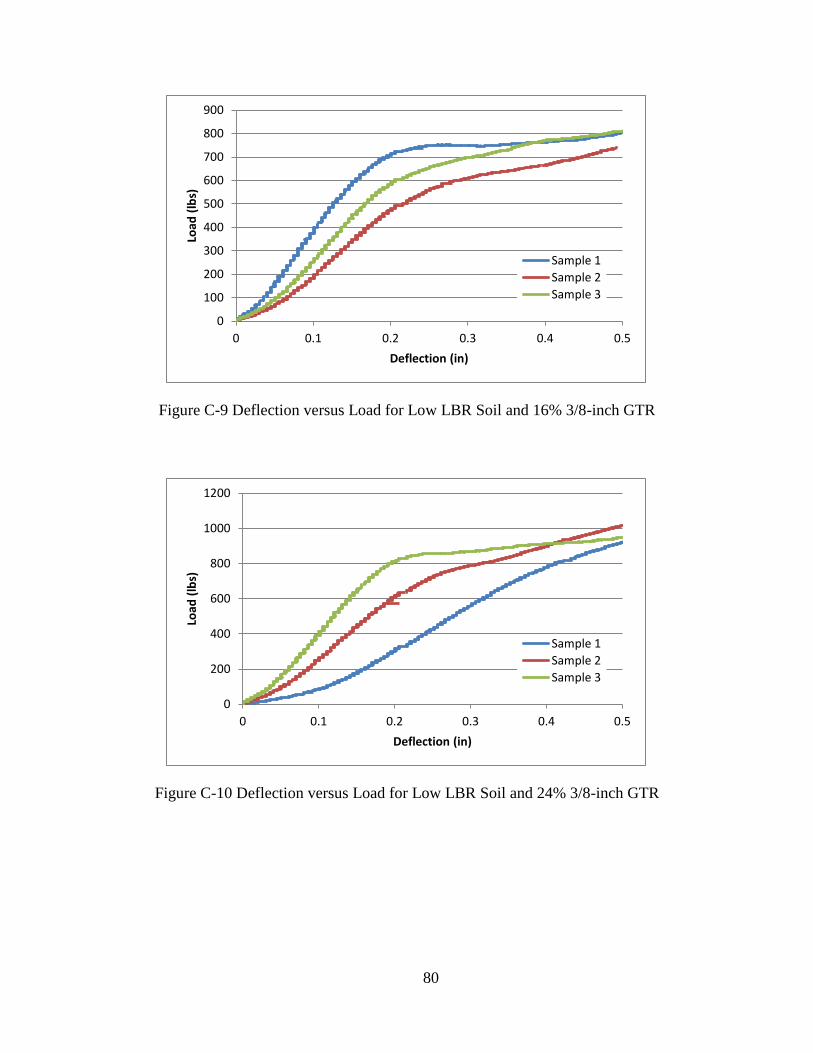
80
Figure C-9 Deflection versus Load for Low LBR Soil and 16% 3/8-inch GTR
Figure C-10 Deflection versus Load for Low LBR Soil and 24% 3/8-inch GTR
0
100
200
300
400
500
600
700
800
900
0 0.1 0.2 0.3 0.4 0.5
Load
(lb
s)
Deflection (in)
Sample 1
Sample 2
Sample 3
0
200
400
600
800
1000
1200
0 0.1 0.2 0.3 0.4 0.5
Load
(lb
s)
Deflection (in)
Sample 1
Sample 2
Sample 3
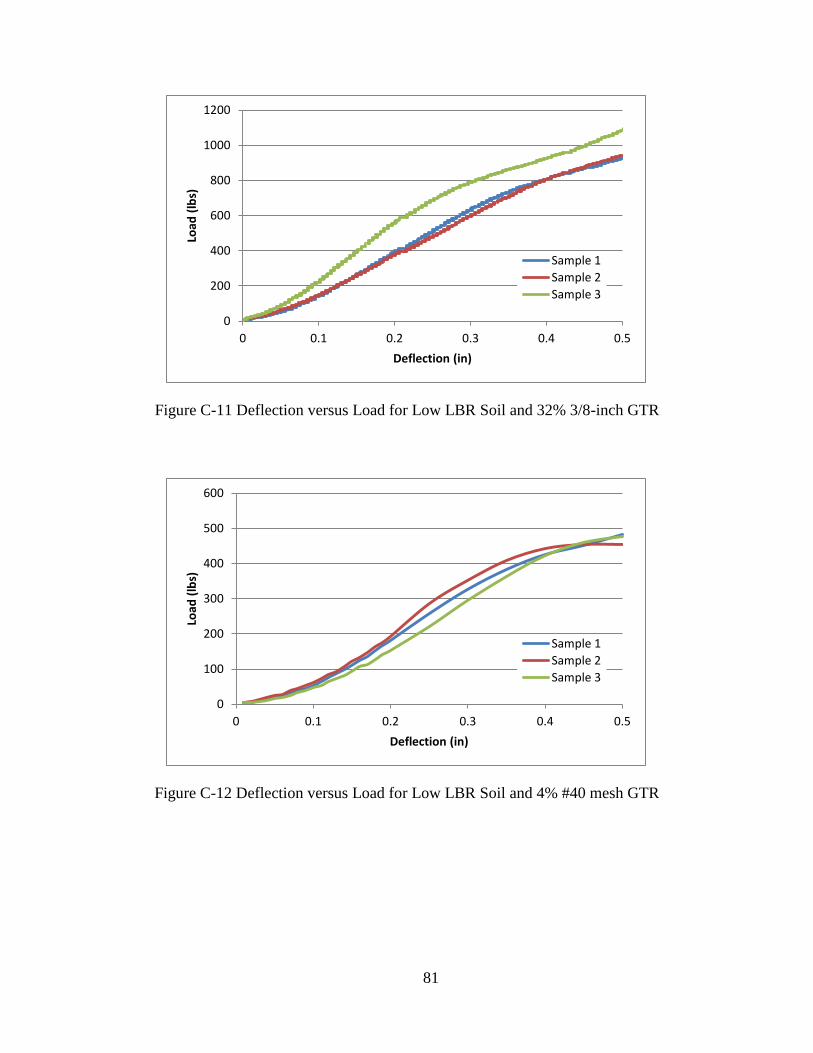
81
Figure C-11 Deflection versus Load for Low LBR Soil and 32% 3/8-inch GTR
Figure C-12 Deflection versus Load for Low LBR Soil and 4% #40 mesh GTR
0
200
400
600
800
1000
1200
0 0.1 0.2 0.3 0.4 0.5
Load
(lb
s)
Deflection (in)
Sample 1
Sample 2
Sample 3
0
100
200
300
400
500
600
0 0.1 0.2 0.3 0.4 0.5
Load
(lb
s)
Deflection (in)
Sample 1
Sample 2
Sample 3
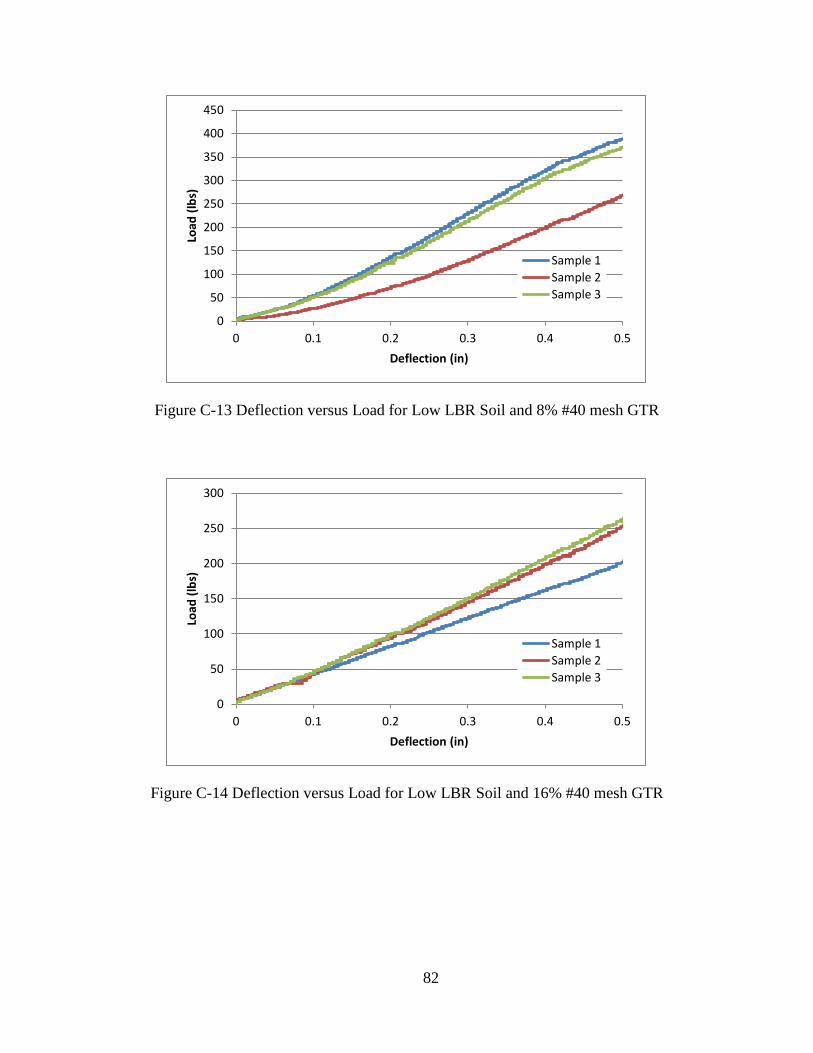
82
Figure C-13 Deflection versus Load for Low LBR Soil and 8% #40 mesh GTR
Figure C-14 Deflection versus Load for Low LBR Soil and 16% #40 mesh GTR
0
50
100
150
200
250
300
350
400
450
0 0.1 0.2 0.3 0.4 0.5
Load
(lb
s)
Deflection (in)
Sample 1
Sample 2
Sample 3
0
50
100
150
200
250
300
0 0.1 0.2 0.3 0.4 0.5
Load
(lb
s)
Deflection (in)
Sample 1
Sample 2
Sample 3
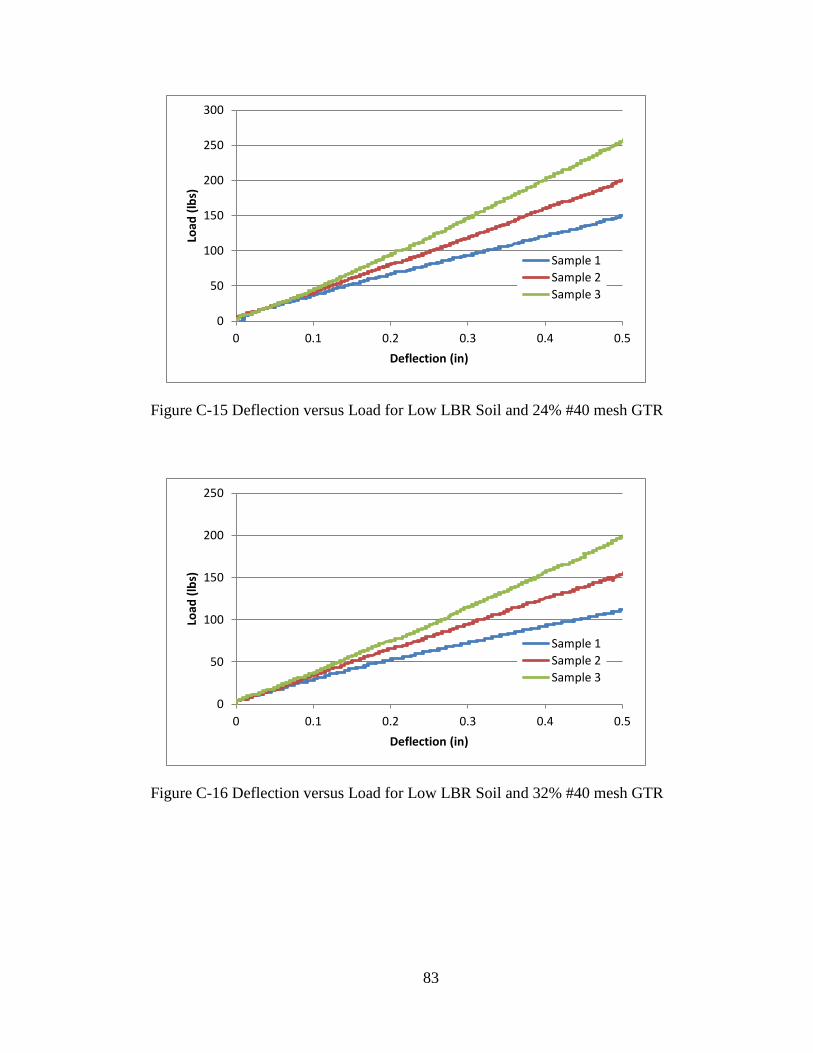
83
Figure C-15 Deflection versus Load for Low LBR Soil and 24% #40 mesh GTR
Figure C-16 Deflection versus Load for Low LBR Soil and 32% #40 mesh GTR
0
50
100
150
200
250
300
0 0.1 0.2 0.3 0.4 0.5
Load
(lb
s)
Deflection (in)
Sample 1
Sample 2
Sample 3
0
50
100
150
200
250
0 0.1 0.2 0.3 0.4 0.5
Load
(lb
s)
Deflection (in)
Sample 1
Sample 2
Sample 3
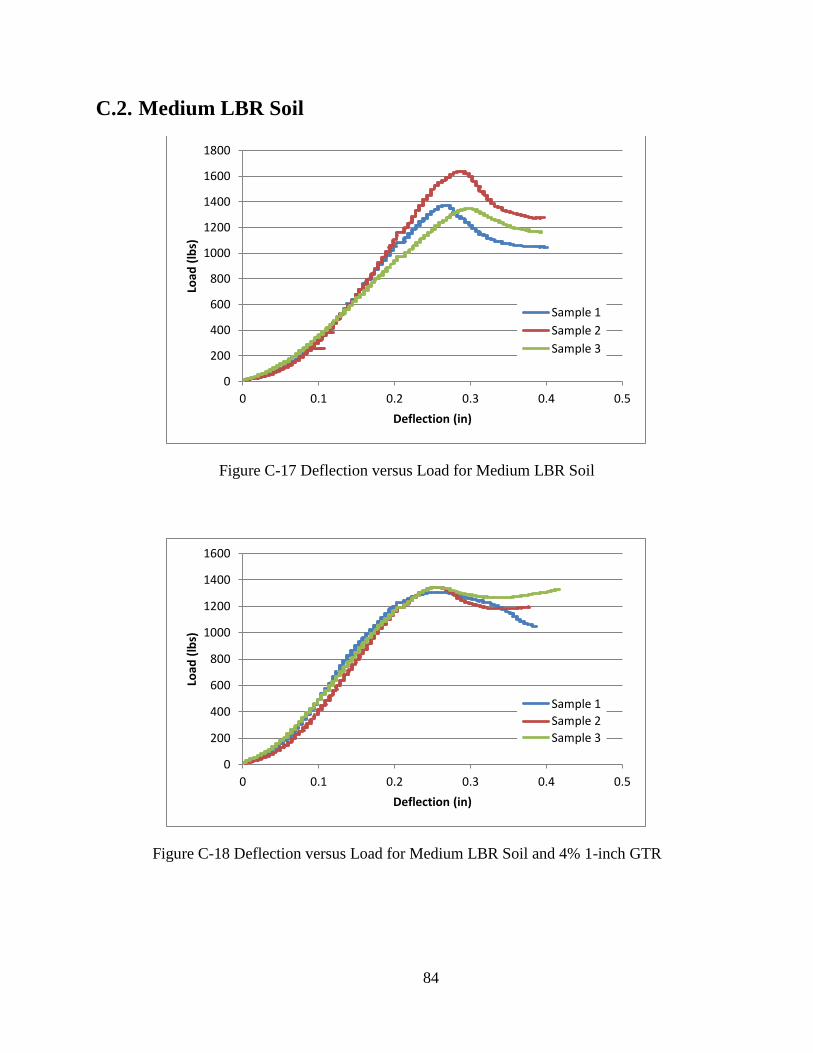
84
C.2. Medium LBR Soil
Figure C-17 Deflection versus Load for Medium LBR Soil
Figure C-18 Deflection versus Load for Medium LBR Soil and 4% 1-inch GTR
0
200
400
600
800
1000
1200
1400
1600
1800
0 0.1 0.2 0.3 0.4 0.5
Load
(lb
s)
Deflection (in)
Sample 1
Sample 2
Sample 3
0
200
400
600
800
1000
1200
1400
1600
0 0.1 0.2 0.3 0.4 0.5
Load
(lb
s)
Deflection (in)
Sample 1
Sample 2
Sample 3
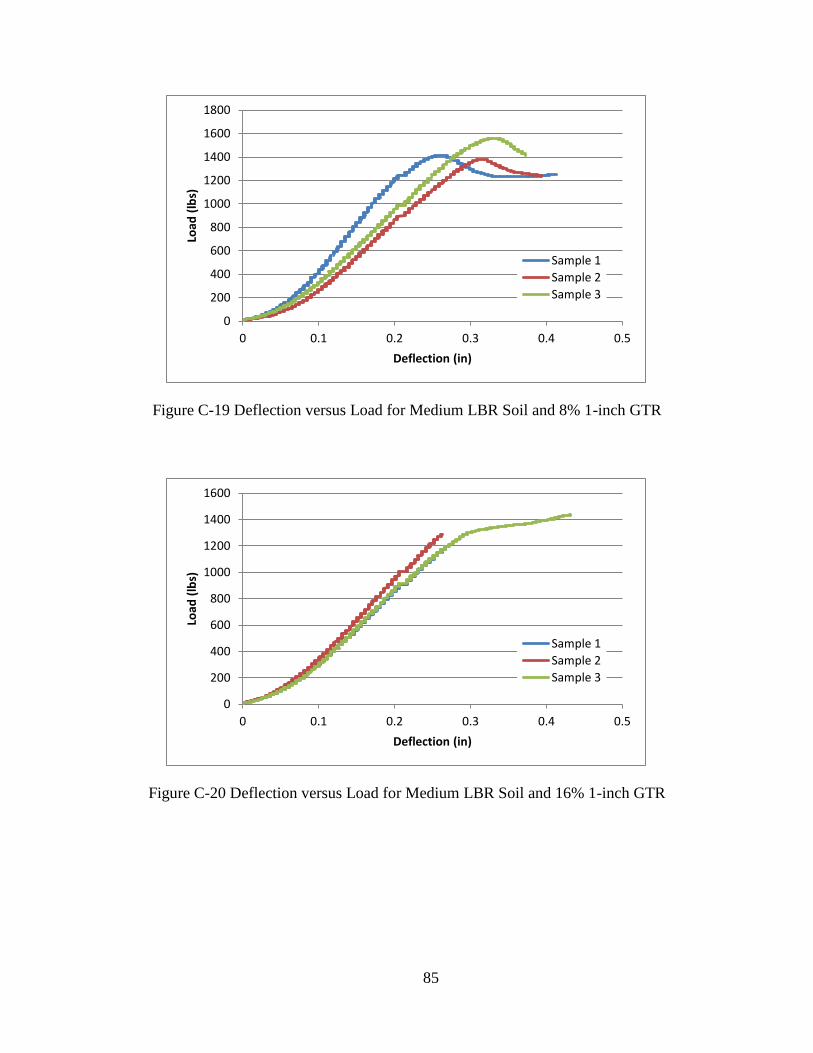
85
Figure C-19 Deflection versus Load for Medium LBR Soil and 8% 1-inch GTR
Figure C-20 Deflection versus Load for Medium LBR Soil and 16% 1-inch GTR
0
200
400
600
800
1000
1200
1400
1600
1800
0 0.1 0.2 0.3 0.4 0.5
Load
(lb
s)
Deflection (in)
Sample 1
Sample 2
Sample 3
0
200
400
600
800
1000
1200
1400
1600
0 0.1 0.2 0.3 0.4 0.5
Load
(lb
s)
Deflection (in)
Sample 1
Sample 2
Sample 3
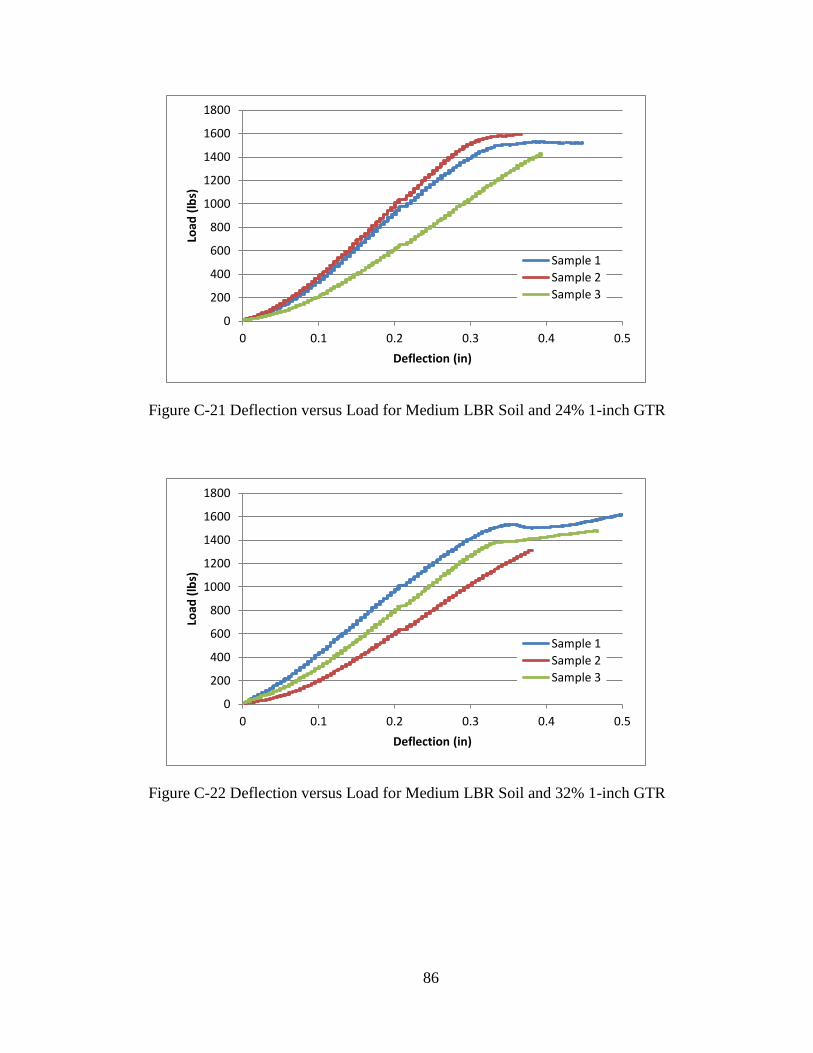
86
Figure C-21 Deflection versus Load for Medium LBR Soil and 24% 1-inch GTR
Figure C-22 Deflection versus Load for Medium LBR Soil and 32% 1-inch GTR
0
200
400
600
800
1000
1200
1400
1600
1800
0 0.1 0.2 0.3 0.4 0.5
Load
(lb
s)
Deflection (in)
Sample 1
Sample 2
Sample 3
0
200
400
600
800
1000
1200
1400
1600
1800
0 0.1 0.2 0.3 0.4 0.5
Load
(lb
s)
Deflection (in)
Sample 1
Sample 2
Sample 3
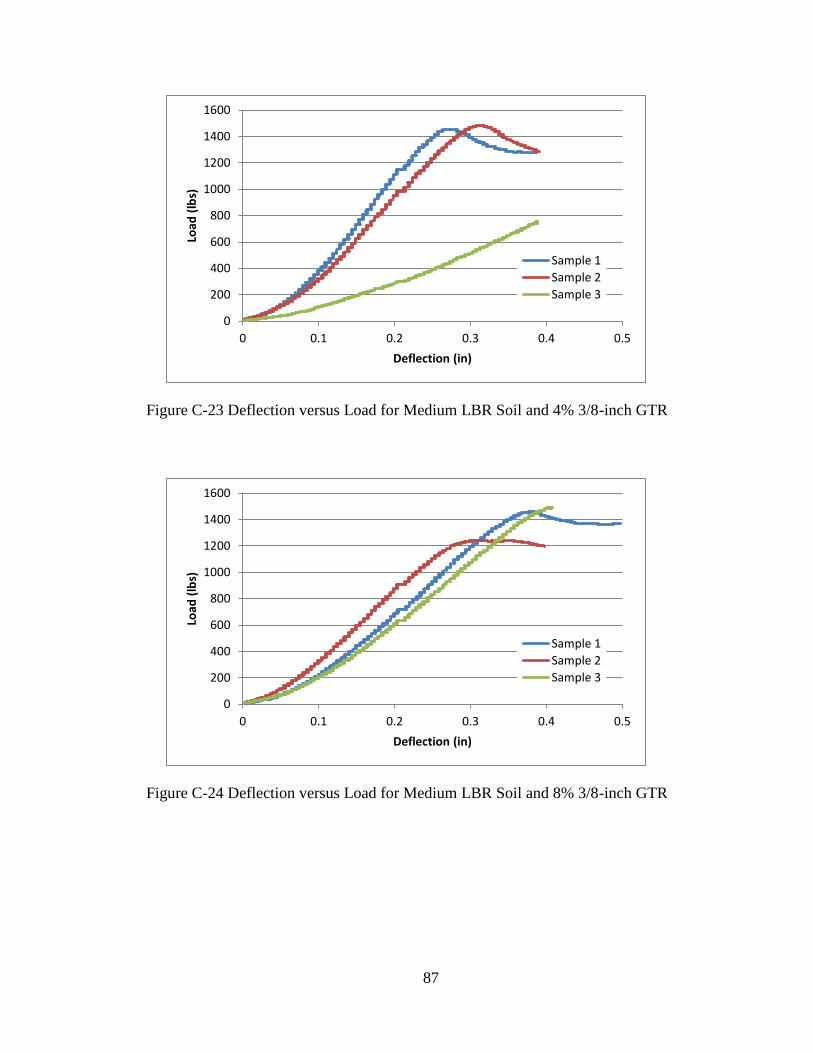
87
Figure C-23 Deflection versus Load for Medium LBR Soil and 4% 3/8-inch GTR
Figure C-24 Deflection versus Load for Medium LBR Soil and 8% 3/8-inch GTR
0
200
400
600
800
1000
1200
1400
1600
0 0.1 0.2 0.3 0.4 0.5
Load
(lb
s)
Deflection (in)
Sample 1
Sample 2
Sample 3
0
200
400
600
800
1000
1200
1400
1600
0 0.1 0.2 0.3 0.4 0.5
Load
(lb
s)
Deflection (in)
Sample 1
Sample 2
Sample 3
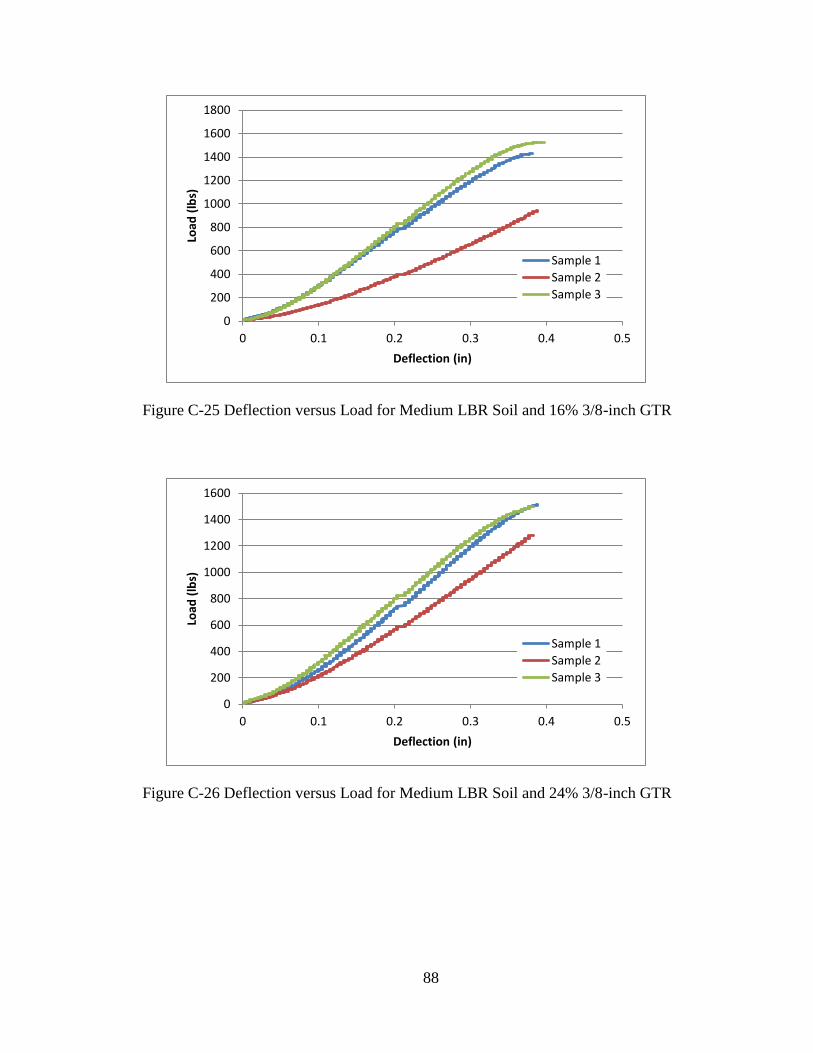
88
Figure C-25 Deflection versus Load for Medium LBR Soil and 16% 3/8-inch GTR
Figure C-26 Deflection versus Load for Medium LBR Soil and 24% 3/8-inch GTR
0
200
400
600
800
1000
1200
1400
1600
1800
0 0.1 0.2 0.3 0.4 0.5
Load
(lb
s)
Deflection (in)
Sample 1
Sample 2
Sample 3
0
200
400
600
800
1000
1200
1400
1600
0 0.1 0.2 0.3 0.4 0.5
Load
(lb
s)
Deflection (in)
Sample 1
Sample 2
Sample 3
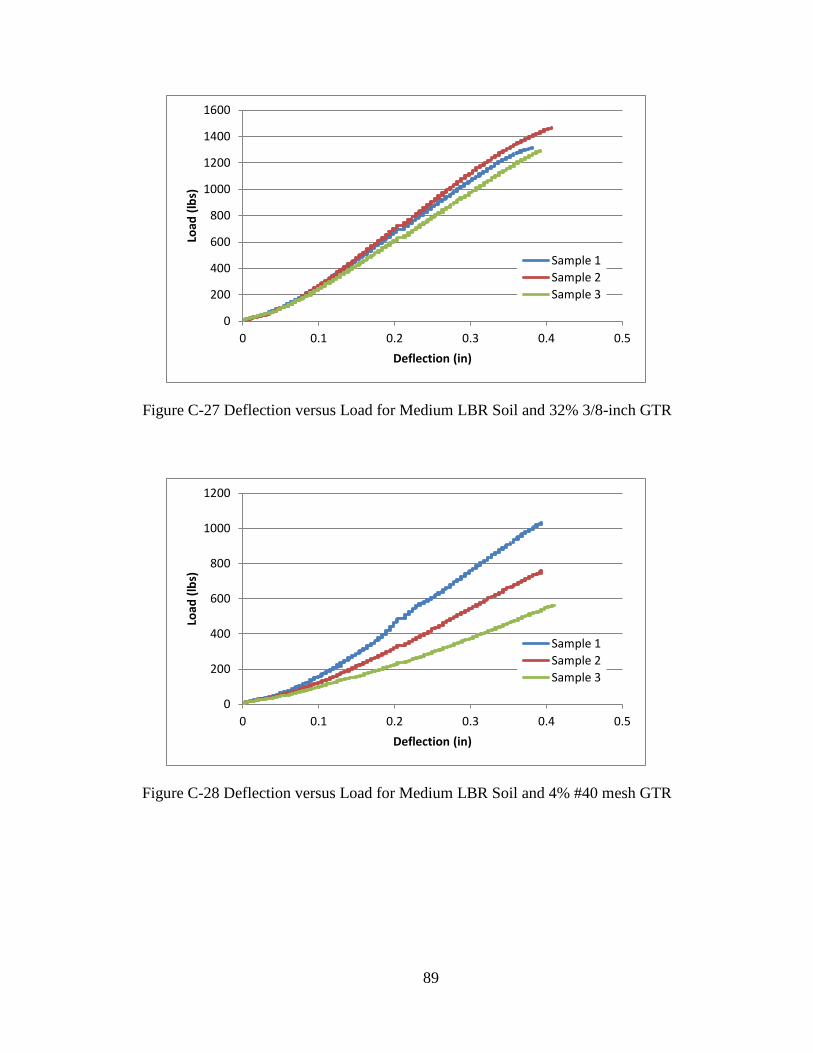
89
Figure C-27 Deflection versus Load for Medium LBR Soil and 32% 3/8-inch GTR
Figure C-28 Deflection versus Load for Medium LBR Soil and 4% #40 mesh GTR
0
200
400
600
800
1000
1200
1400
1600
0 0.1 0.2 0.3 0.4 0.5
Load
(lb
s)
Deflection (in)
Sample 1
Sample 2
Sample 3
0
200
400
600
800
1000
1200
0 0.1 0.2 0.3 0.4 0.5
Load
(lb
s)
Deflection (in)
Sample 1
Sample 2
Sample 3
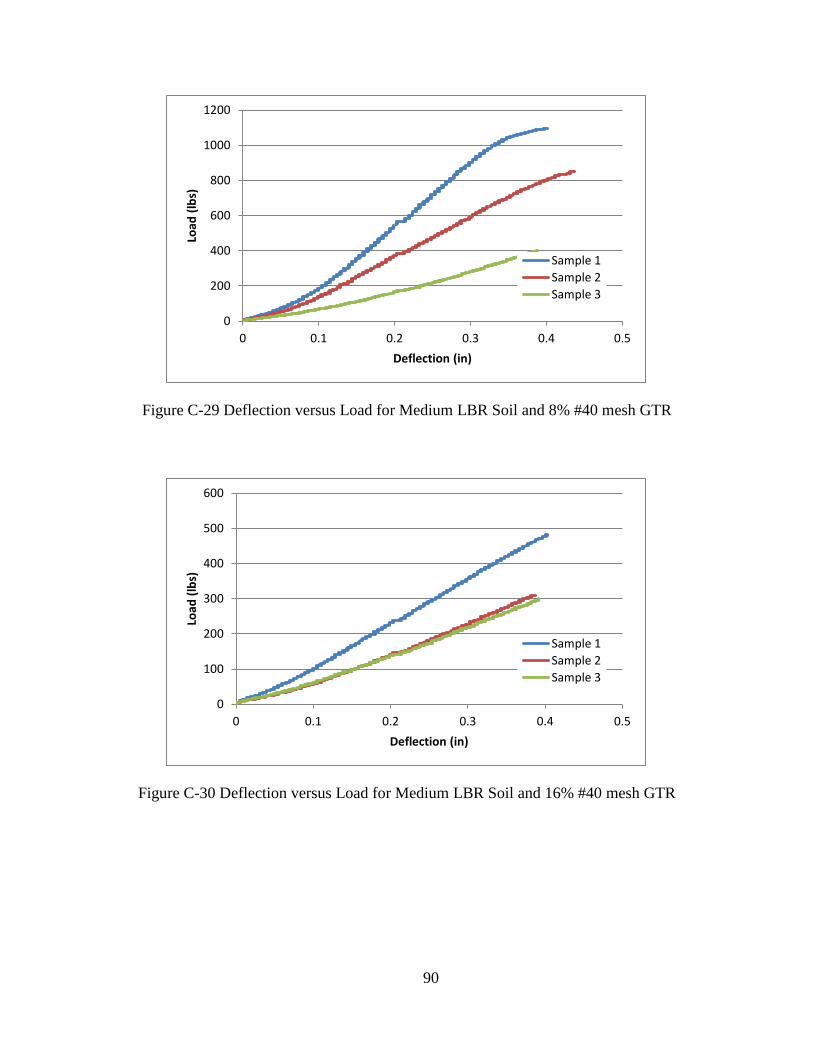
90
Figure C-29 Deflection versus Load for Medium LBR Soil and 8% #40 mesh GTR
Figure C-30 Deflection versus Load for Medium LBR Soil and 16% #40 mesh GTR
0
200
400
600
800
1000
1200
0 0.1 0.2 0.3 0.4 0.5
Load
(lb
s)
Deflection (in)
Sample 1
Sample 2
Sample 3
0
100
200
300
400
500
600
0 0.1 0.2 0.3 0.4 0.5
Load
(lb
s)
Deflection (in)
Sample 1
Sample 2
Sample 3
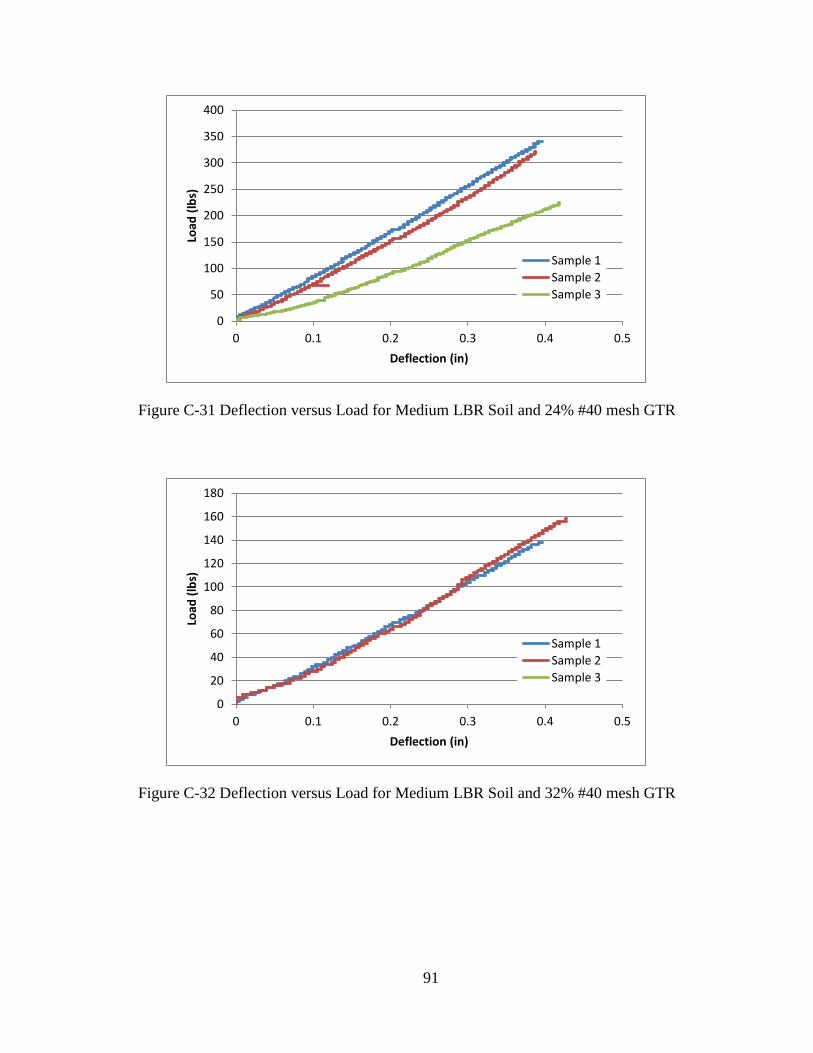
91
Figure C-31 Deflection versus Load for Medium LBR Soil and 24% #40 mesh GTR
Figure C-32 Deflection versus Load for Medium LBR Soil and 32% #40 mesh GTR
0
50
100
150
200
250
300
350
400
0 0.1 0.2 0.3 0.4 0.5
Load
(lb
s)
Deflection (in)
Sample 1
Sample 2
Sample 3
0
20
40
60
80
100
120
140
160
180
0 0.1 0.2 0.3 0.4 0.5
Load
(lb
s)
Deflection (in)
Sample 1
Sample 2
Sample 3
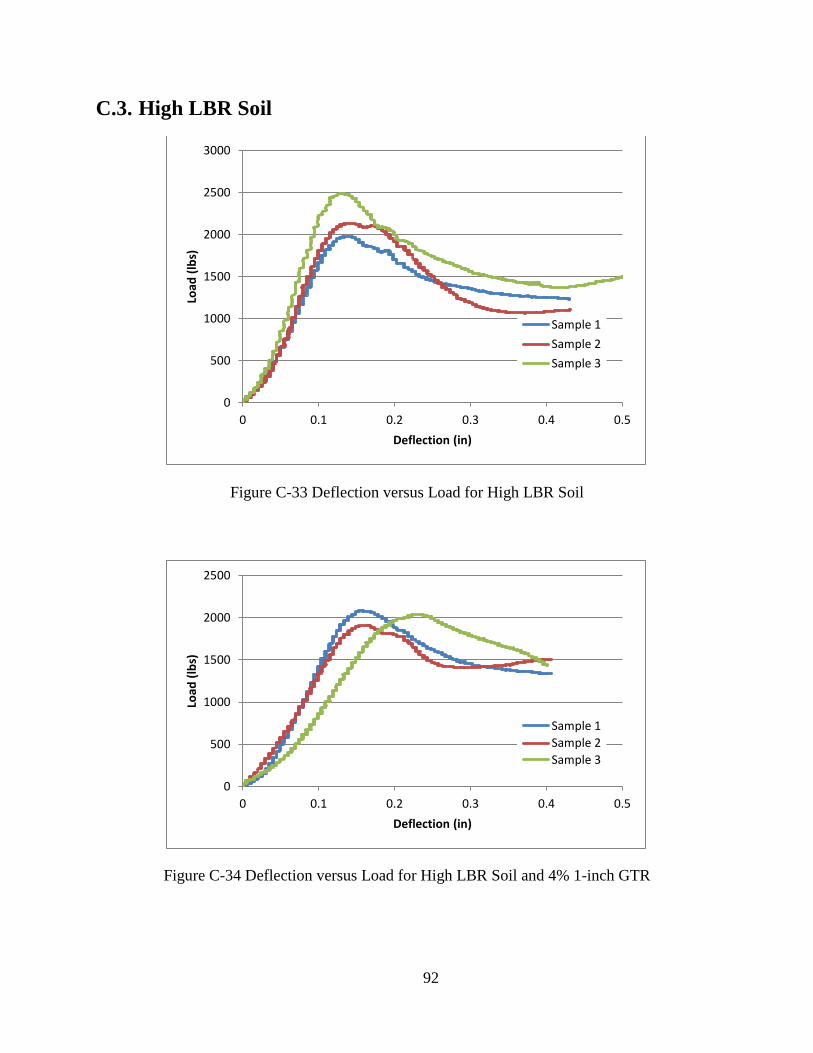
92
C.3. High LBR Soil
Figure C-33 Deflection versus Load for High LBR Soil
Figure C-34 Deflection versus Load for High LBR Soil and 4% 1-inch GTR
0
500
1000
1500
2000
2500
3000
0 0.1 0.2 0.3 0.4 0.5
Load
(lb
s)
Deflection (in)
Sample 1
Sample 2
Sample 3
0
500
1000
1500
2000
2500
0 0.1 0.2 0.3 0.4 0.5
Load
(lb
s)
Deflection (in)
Sample 1
Sample 2
Sample 3
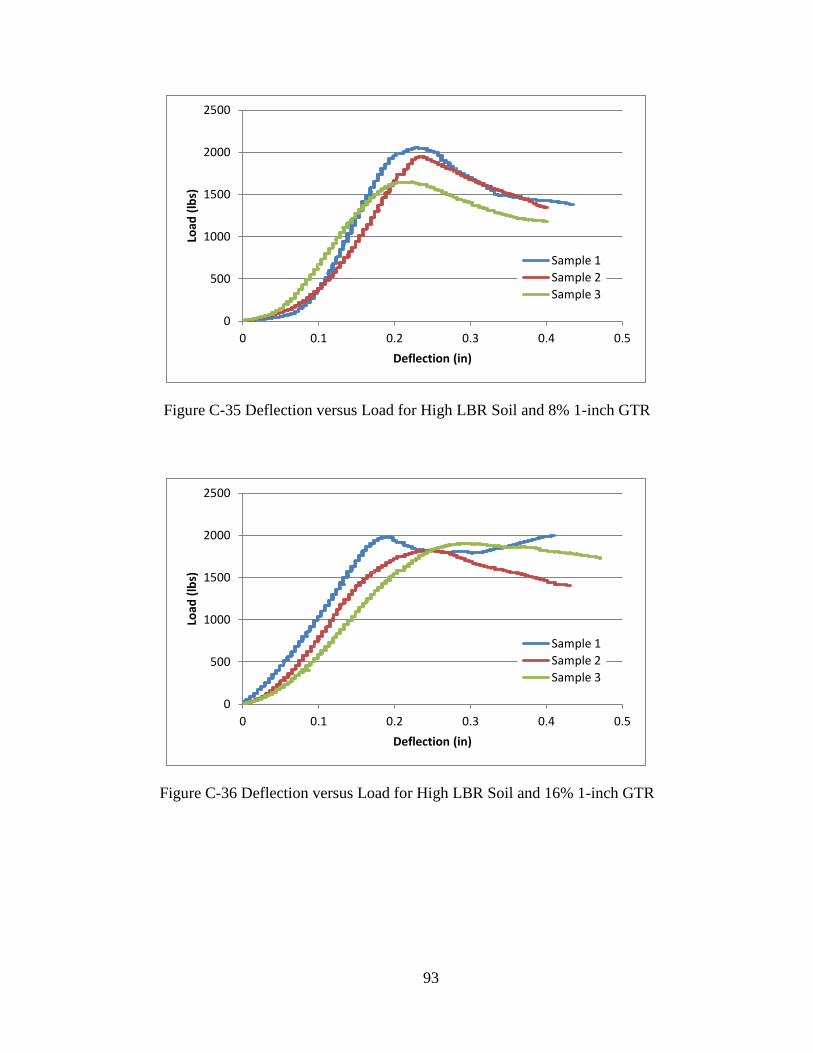
93
Figure C-35 Deflection versus Load for High LBR Soil and 8% 1-inch GTR
Figure C-36 Deflection versus Load for High LBR Soil and 16% 1-inch GTR
0
500
1000
1500
2000
2500
0 0.1 0.2 0.3 0.4 0.5
Load
(lb
s)
Deflection (in)
Sample 1
Sample 2
Sample 3
0
500
1000
1500
2000
2500
0 0.1 0.2 0.3 0.4 0.5
Load
(lb
s)
Deflection (in)
Sample 1
Sample 2
Sample 3
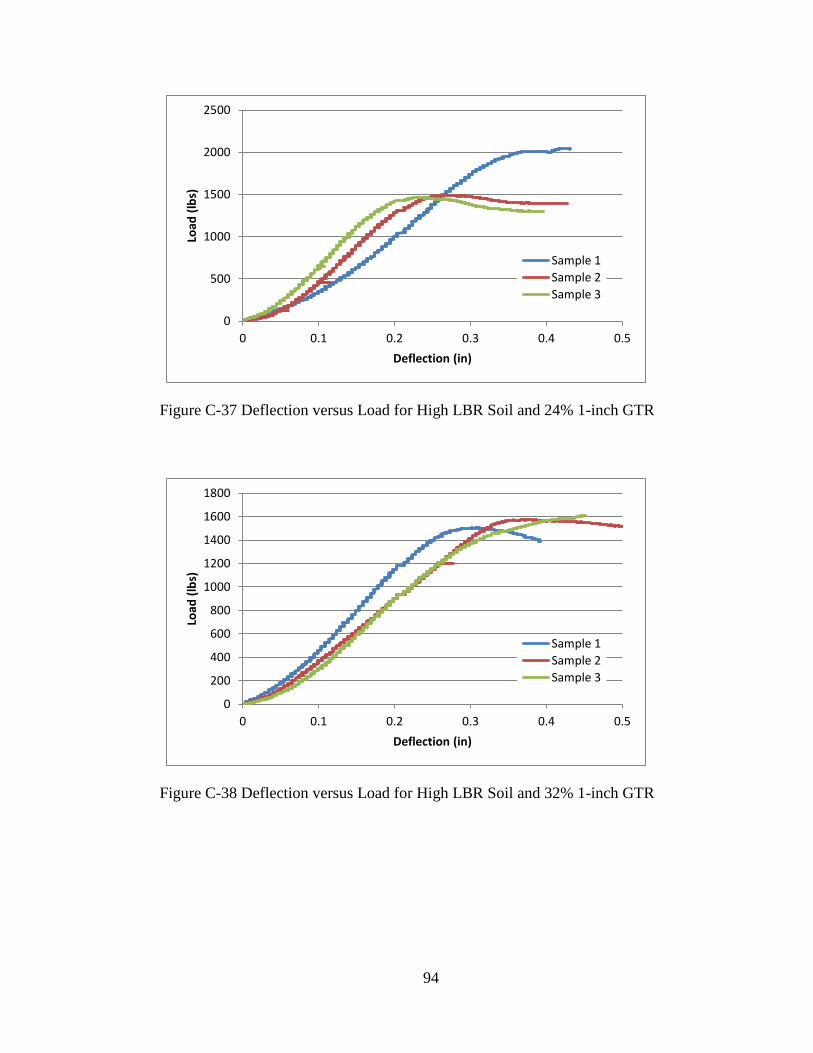
94
Figure C-37 Deflection versus Load for High LBR Soil and 24% 1-inch GTR
Figure C-38 Deflection versus Load for High LBR Soil and 32% 1-inch GTR
0
500
1000
1500
2000
2500
0 0.1 0.2 0.3 0.4 0.5
Load
(lb
s)
Deflection (in)
Sample 1
Sample 2
Sample 3
0
200
400
600
800
1000
1200
1400
1600
1800
0 0.1 0.2 0.3 0.4 0.5
Load
(lb
s)
Deflection (in)
Sample 1
Sample 2
Sample 3
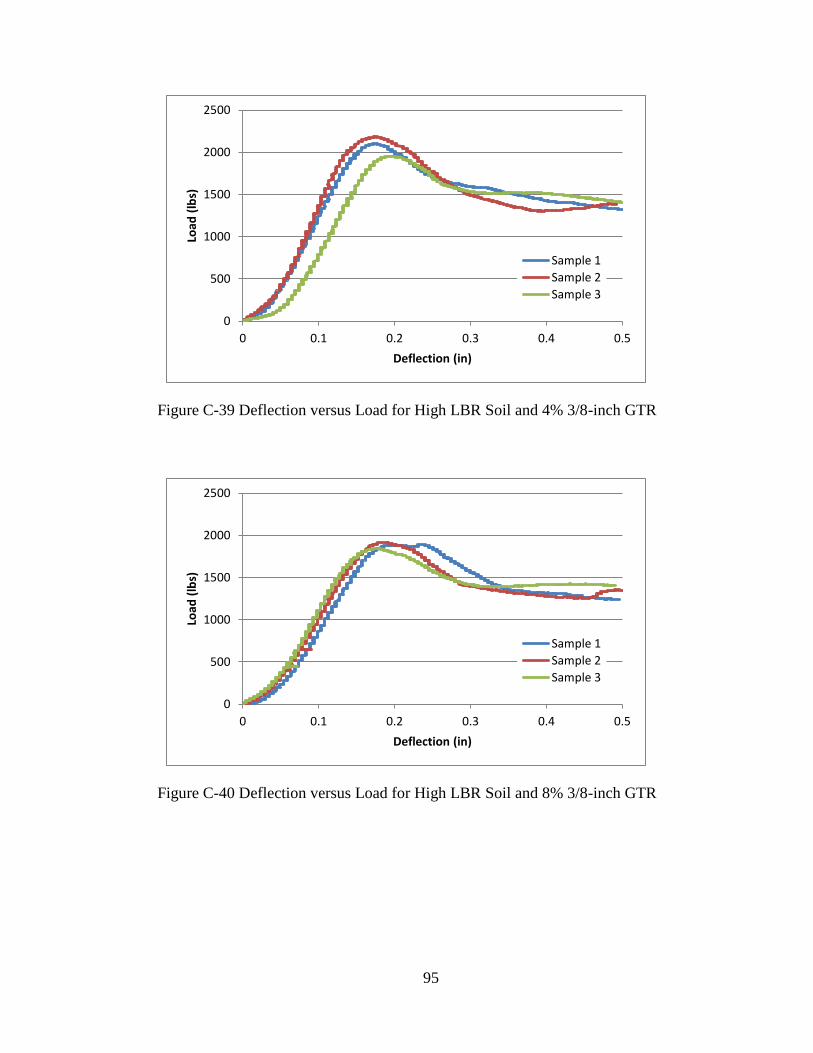
95
Figure C-39 Deflection versus Load for High LBR Soil and 4% 3/8-inch GTR
Figure C-40 Deflection versus Load for High LBR Soil and 8% 3/8-inch GTR
0
500
1000
1500
2000
2500
0 0.1 0.2 0.3 0.4 0.5
Load
(lb
s)
Deflection (in)
Sample 1
Sample 2
Sample 3
0
500
1000
1500
2000
2500
0 0.1 0.2 0.3 0.4 0.5
Load
(lb
s)
Deflection (in)
Sample 1
Sample 2
Sample 3
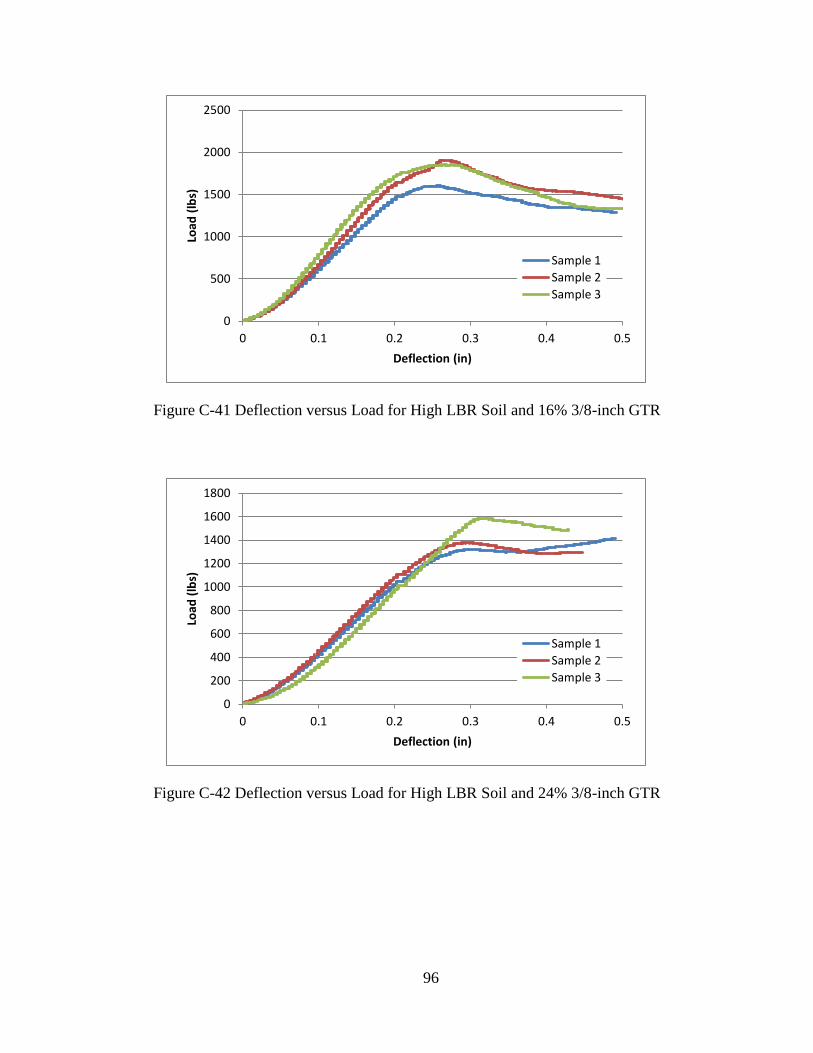
96
Figure C-41 Deflection versus Load for High LBR Soil and 16% 3/8-inch GTR
Figure C-42 Deflection versus Load for High LBR Soil and 24% 3/8-inch GTR
0
500
1000
1500
2000
2500
0 0.1 0.2 0.3 0.4 0.5
Load
(lb
s)
Deflection (in)
Sample 1
Sample 2
Sample 3
0
200
400
600
800
1000
1200
1400
1600
1800
0 0.1 0.2 0.3 0.4 0.5
Load
(lb
s)
Deflection (in)
Sample 1
Sample 2
Sample 3
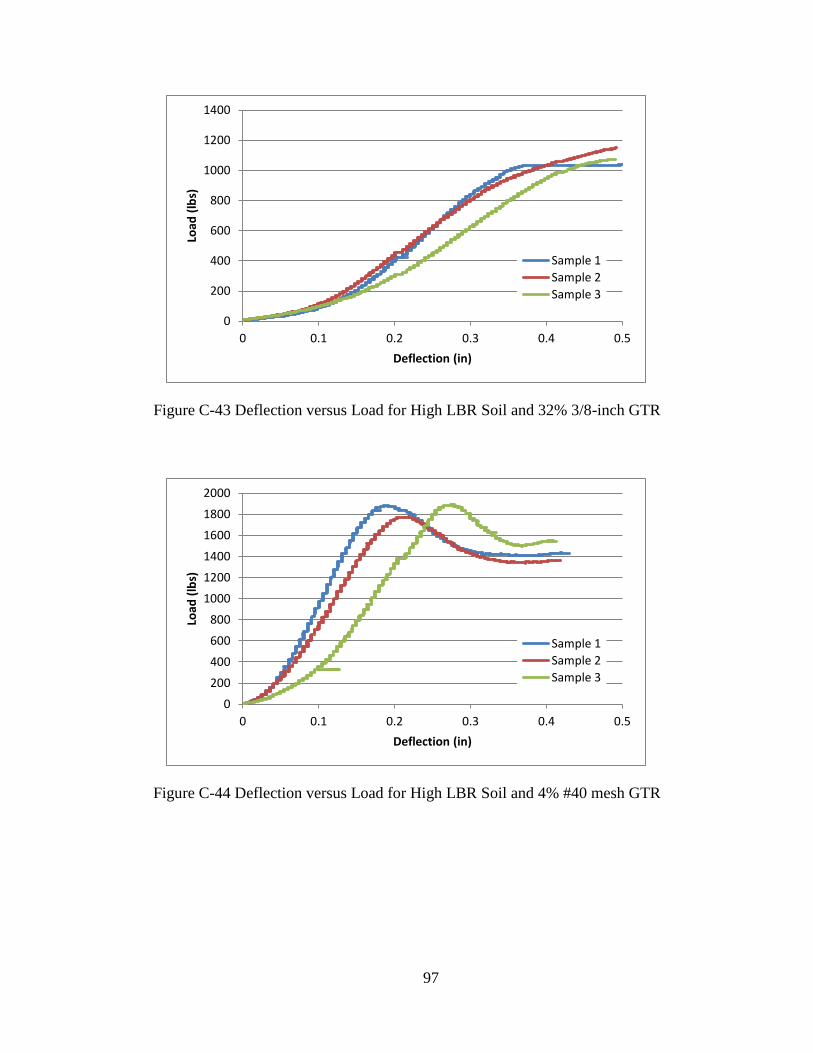
97
Figure C-43 Deflection versus Load for High LBR Soil and 32% 3/8-inch GTR
Figure C-44 Deflection versus Load for High LBR Soil and 4% #40 mesh GTR
0
200
400
600
800
1000
1200
1400
0 0.1 0.2 0.3 0.4 0.5
Load
(lb
s)
Deflection (in)
Sample 1
Sample 2
Sample 3
0
200
400
600
800
1000
1200
1400
1600
1800
2000
0 0.1 0.2 0.3 0.4 0.5
Load
(lb
s)
Deflection (in)
Sample 1
Sample 2
Sample 3
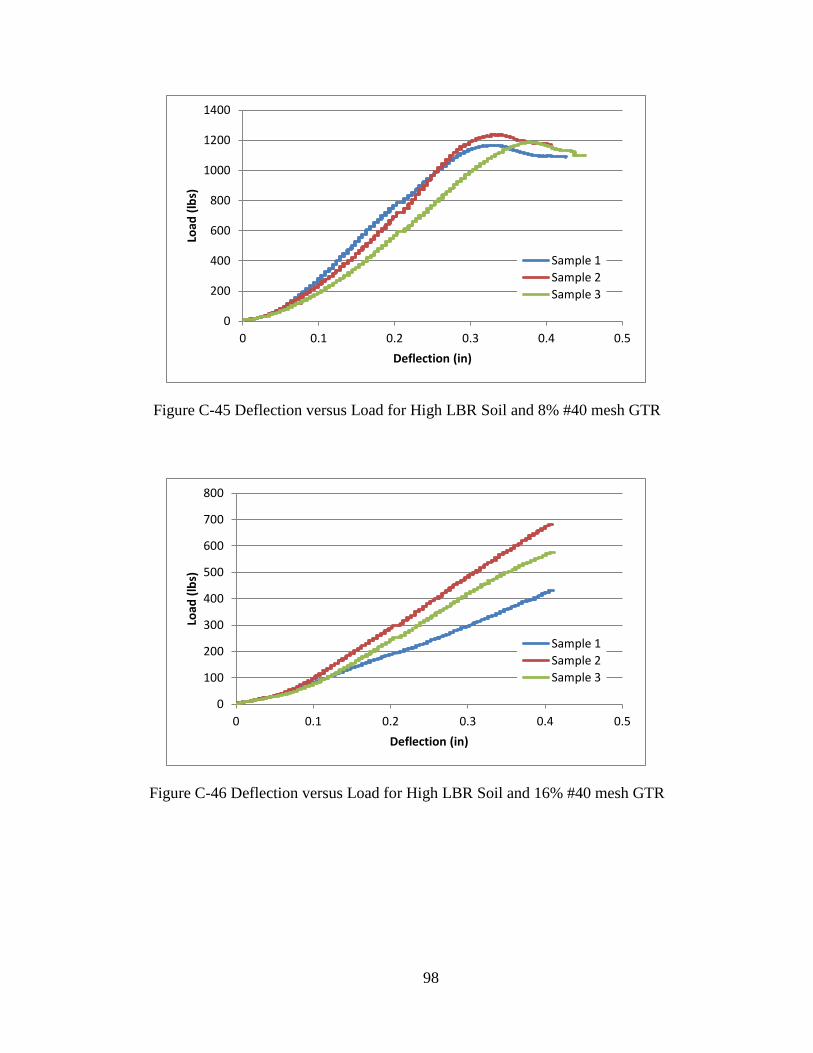
98
Figure C-45 Deflection versus Load for High LBR Soil and 8% #40 mesh GTR
Figure C-46 Deflection versus Load for High LBR Soil and 16% #40 mesh GTR
0
200
400
600
800
1000
1200
1400
0 0.1 0.2 0.3 0.4 0.5
Load
(lb
s)
Deflection (in)
Sample 1
Sample 2
Sample 3
0
100
200
300
400
500
600
700
800
0 0.1 0.2 0.3 0.4 0.5
Load
(lb
s)
Deflection (in)
Sample 1
Sample 2
Sample 3
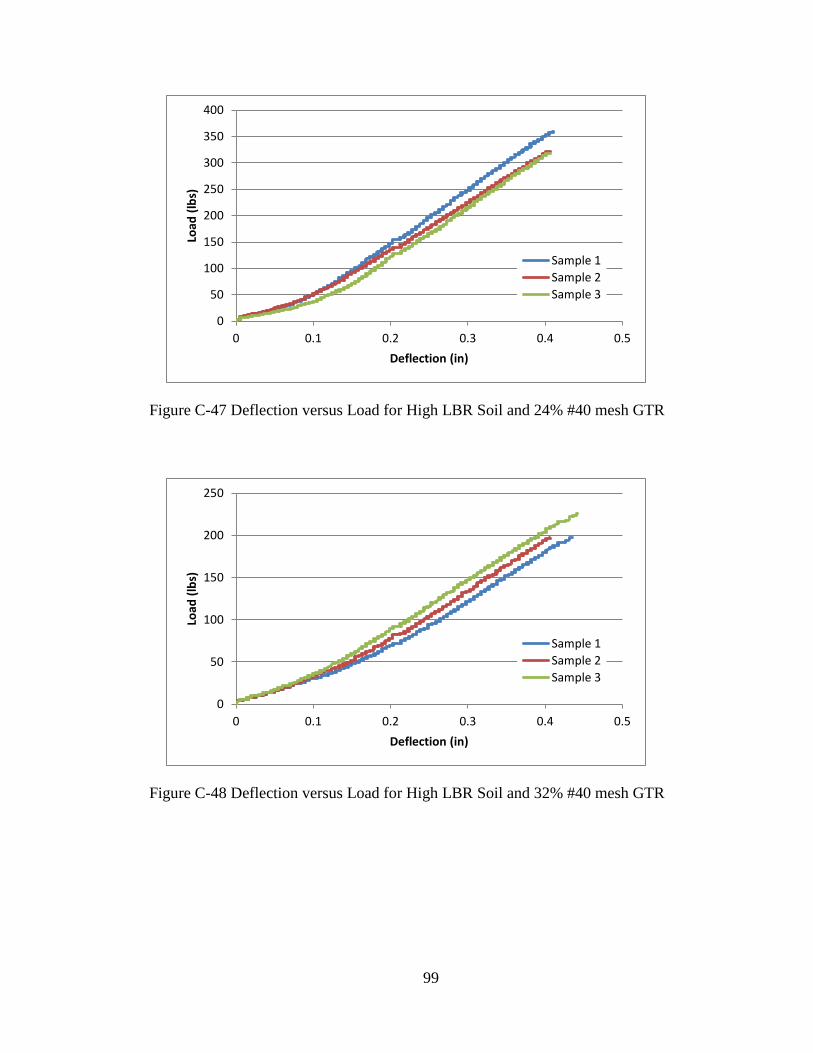
99
Figure C-47 Deflection versus Load for High LBR Soil and 24% #40 mesh GTR
Figure C-48 Deflection versus Load for High LBR Soil and 32% #40 mesh GTR
0
50
100
150
200
250
300
350
400
0 0.1 0.2 0.3 0.4 0.5
Load
(lb
s)
Deflection (in)
Sample 1
Sample 2
Sample 3
0
50
100
150
200
250
0 0.1 0.2 0.3 0.4 0.5
Load
(lb
s)
Deflection (in)
Sample 1
Sample 2
Sample 3
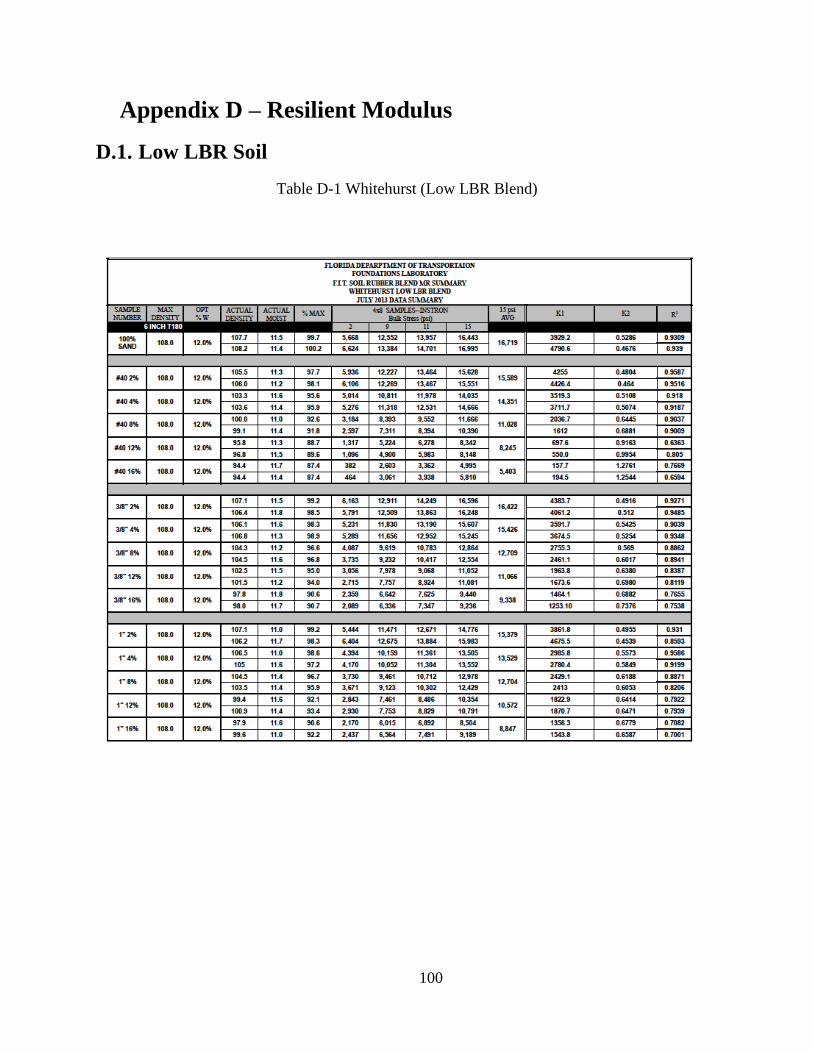
100
D. Appendix D – Resilient Modulus
D.1. Low LBR Soil
Table D-1 Whitehurst (Low LBR Blend)
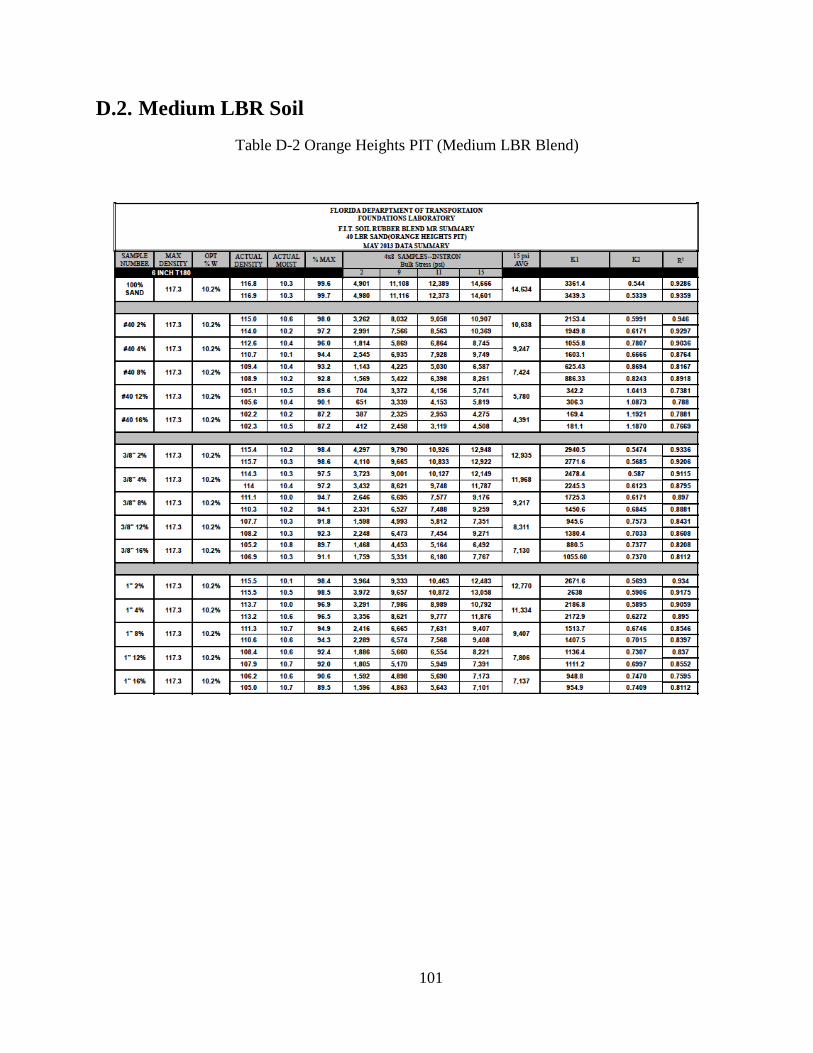
101
D.2. Medium LBR Soil
Table D-2 Orange Heights PIT (Medium LBR Blend)
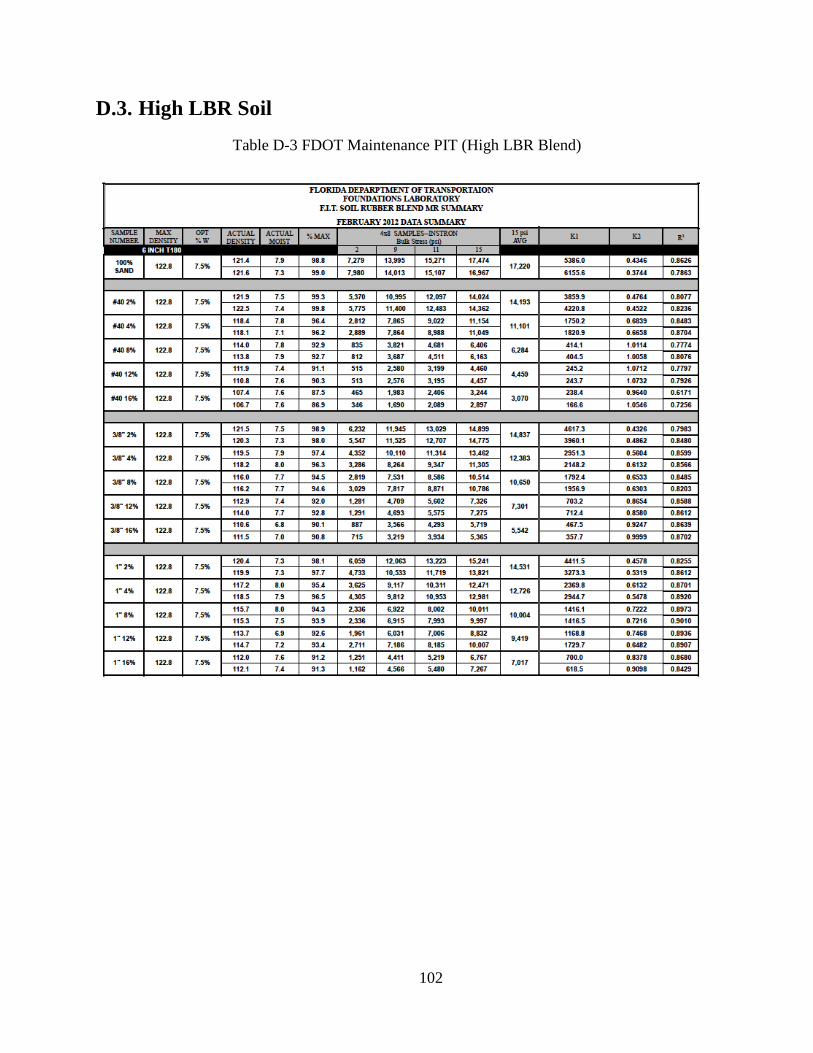
102
D.3. High LBR Soil
Table D-3 FDOT Maintenance PIT (High LBR Blend)
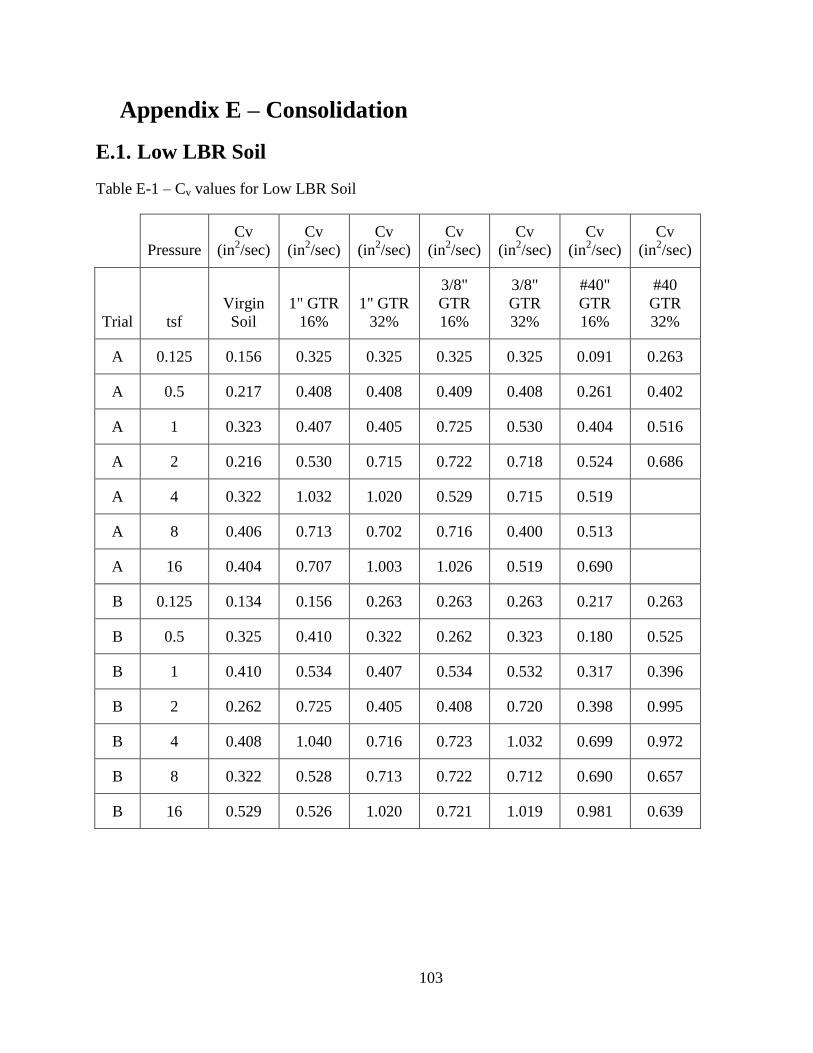
103
E. Appendix E – Consolidation
E.1. Low LBR Soil
Table E-1 – Cv values for Low LBR Soil
Pressure
Cv
(in2/sec)
Cv
(in2/sec)
Cv
(in2/sec)
Cv
(in2/sec)
Cv
(in2/sec)
Cv
(in2/sec)
Cv
(in2/sec)
Trial tsf
Virgin
Soil
1" GTR
16%
1" GTR
32%
3/8"
GTR
16%
3/8"
GTR
32%
#40"
GTR
16%
#40
GTR
32%
A 0.125 0.156 0.325 0.325 0.325 0.325 0.091 0.263
A 0.5 0.217 0.408 0.408 0.409 0.408 0.261 0.402
A 1 0.323 0.407 0.405 0.725 0.530 0.404 0.516
A 2 0.216 0.530 0.715 0.722 0.718 0.524 0.686
A 4 0.322 1.032 1.020 0.529 0.715 0.519
A 8 0.406 0.713 0.702 0.716 0.400 0.513
A 16 0.404 0.707 1.003 1.026 0.519 0.690
B 0.125 0.134 0.156 0.263 0.263 0.263 0.217 0.263
B 0.5 0.325 0.410 0.322 0.262 0.323 0.180 0.525
B 1 0.410 0.534 0.407 0.534 0.532 0.317 0.396
B 2 0.262 0.725 0.405 0.408 0.720 0.398 0.995
B 4 0.408 1.040 0.716 0.723 1.032 0.699 0.972
B 8 0.322 0.528 0.713 0.722 0.712 0.690 0.657
B 16 0.529 0.526 1.020 0.721 1.019 0.981 0.639
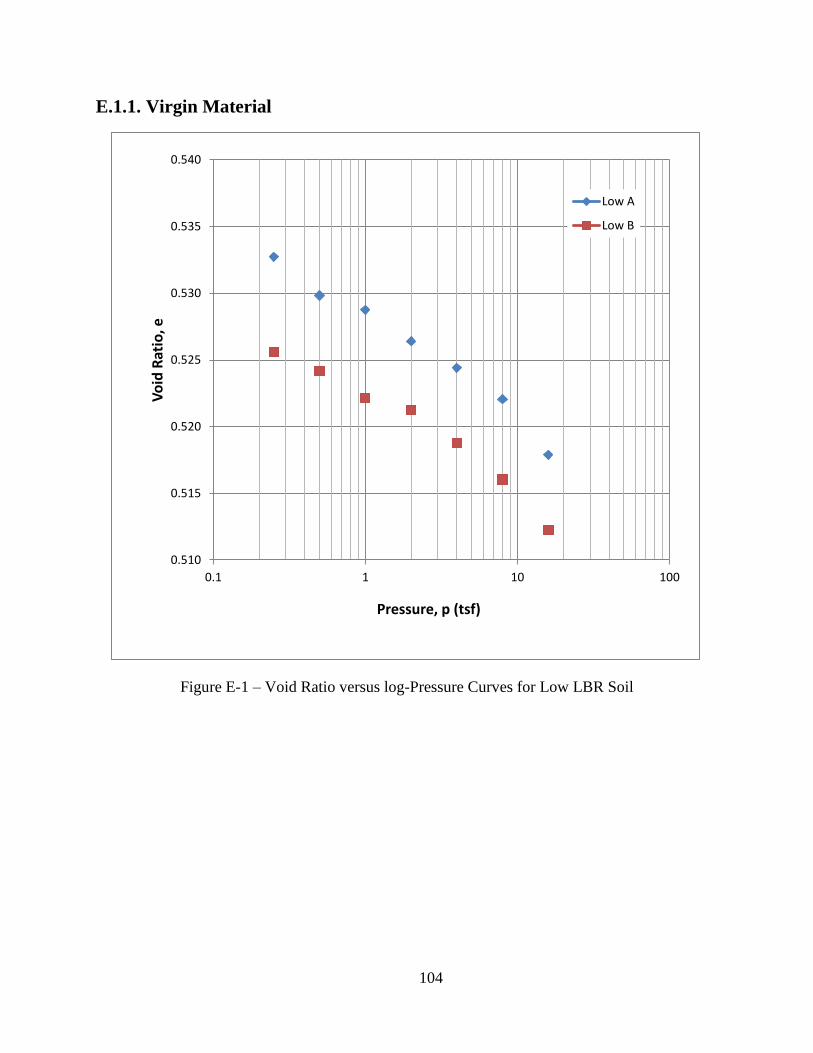
104
E.1.1. Virgin Material
Figure E-1 – Void Ratio versus log-Pressure Curves for Low LBR Soil
0.510
0.515
0.520
0.525
0.530
0.535
0.540
0.1 1 10 100
Vo
id R
atio
, e
Pressure, p (tsf)
Low A
Low B
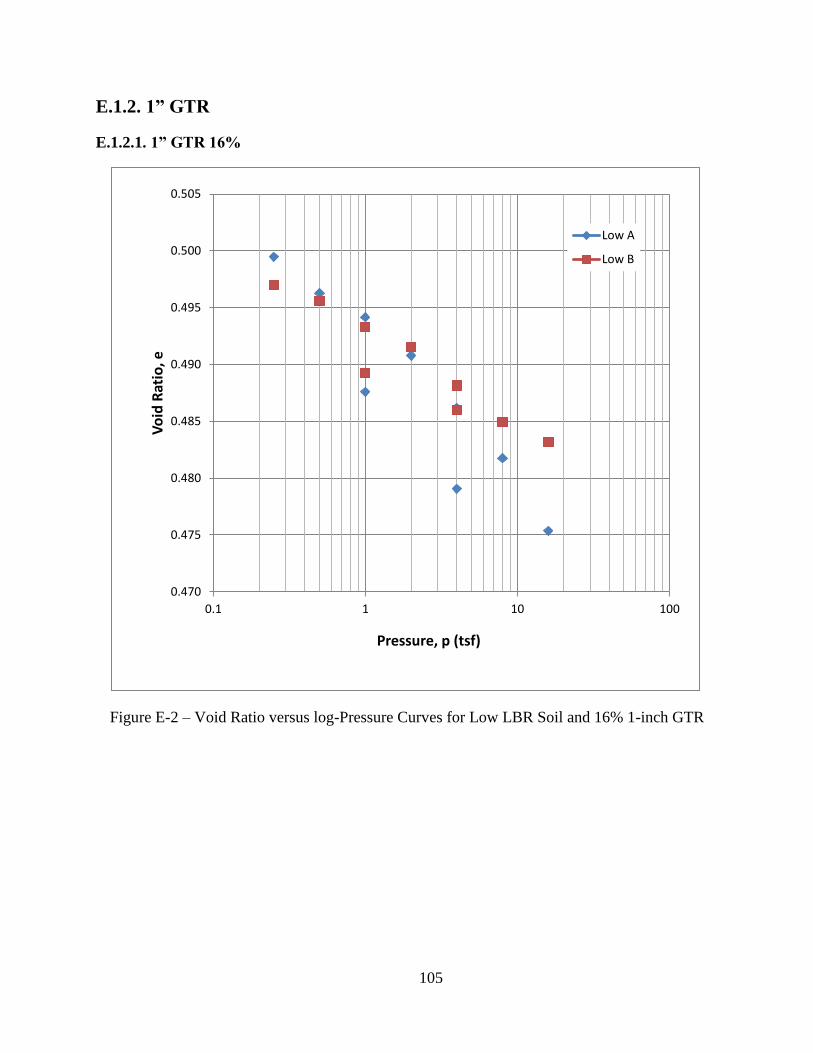
105
E.1.2. 1” GTR
E.1.2.1. 1” GTR 16%
Figure E-2 – Void Ratio versus log-Pressure Curves for Low LBR Soil and 16% 1-inch GTR
0.470
0.475
0.480
0.485
0.490
0.495
0.500
0.505
0.1 1 10 100
Vo
id R
atio
, e
Pressure, p (tsf)
Low A
Low B
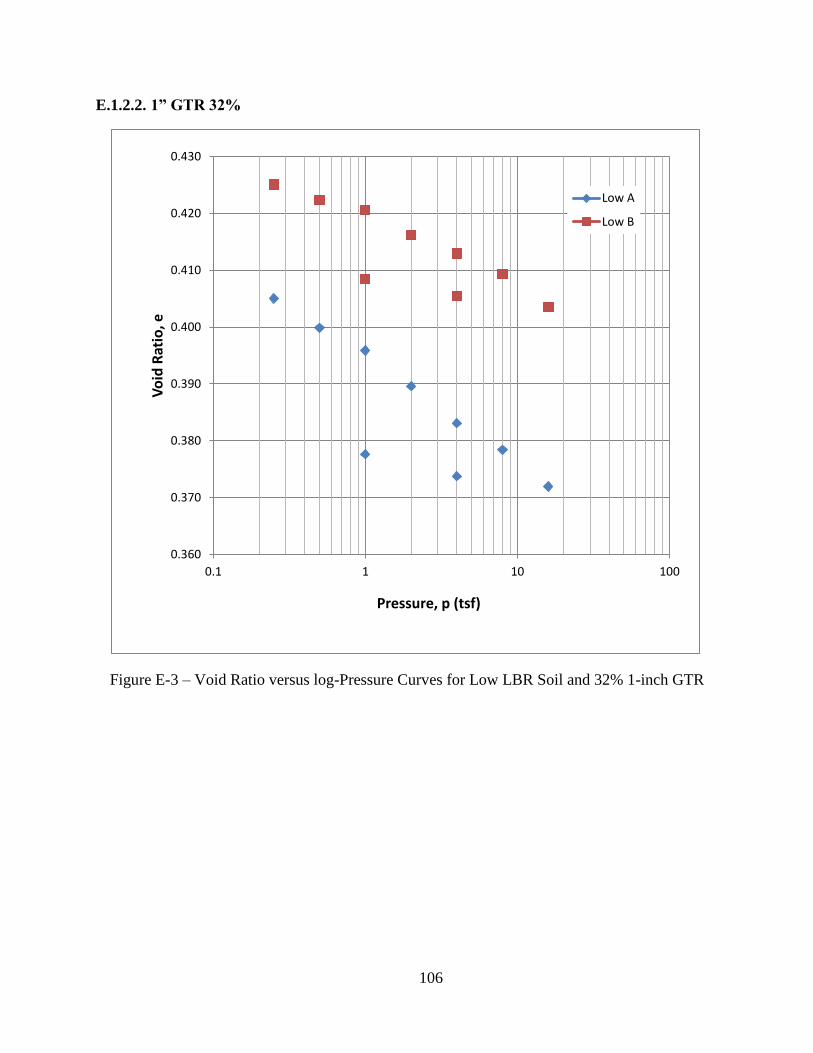
106
E.1.2.2. 1” GTR 32%
Figure E-3 – Void Ratio versus log-Pressure Curves for Low LBR Soil and 32% 1-inch GTR
0.360
0.370
0.380
0.390
0.400
0.410
0.420
0.430
0.1 1 10 100
Vo
id R
atio
, e
Pressure, p (tsf)
Low A
Low B
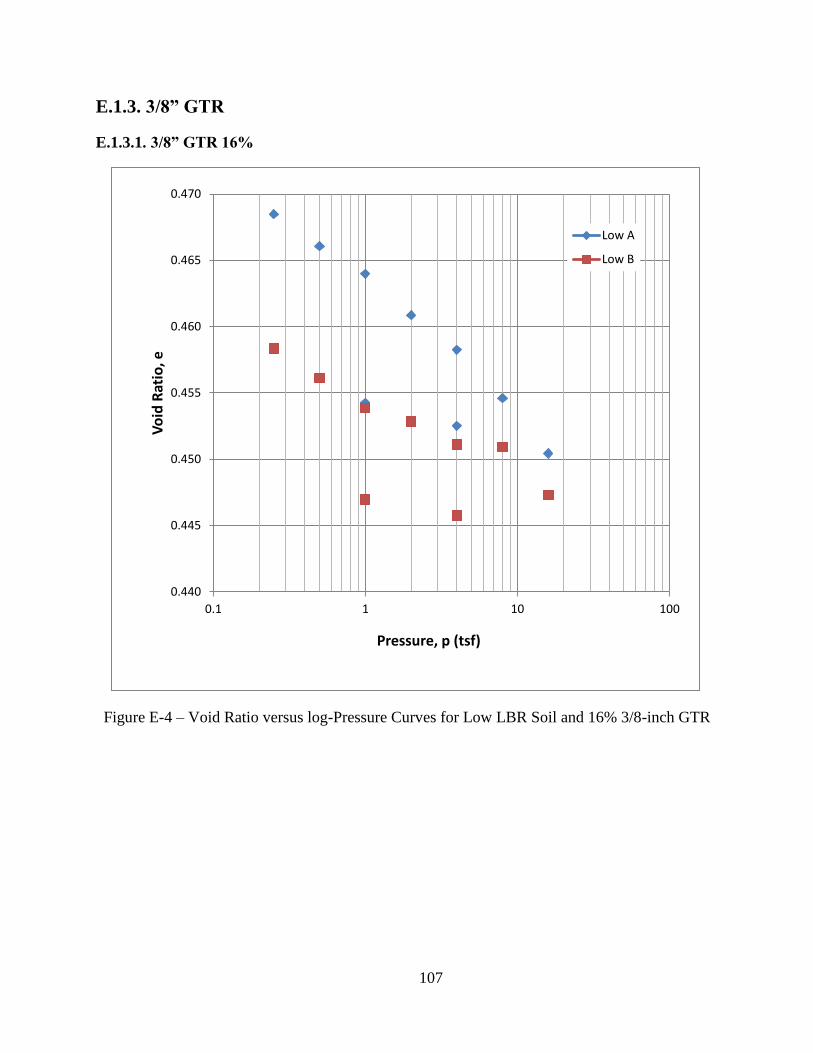
107
E.1.3. 3/8” GTR
E.1.3.1. 3/8” GTR 16%
Figure E-4 – Void Ratio versus log-Pressure Curves for Low LBR Soil and 16% 3/8-inch GTR
0.440
0.445
0.450
0.455
0.460
0.465
0.470
0.1 1 10 100
Vo
id R
atio
, e
Pressure, p (tsf)
Low A
Low B
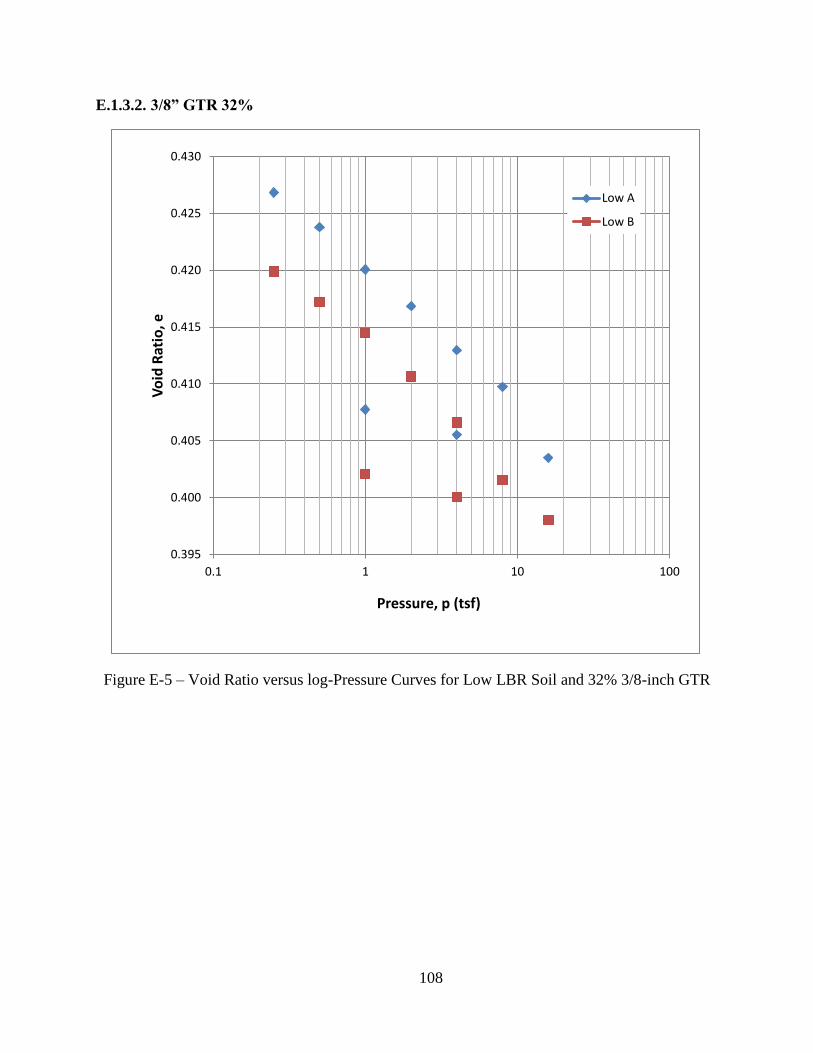
108
E.1.3.2. 3/8” GTR 32%
Figure E-5 – Void Ratio versus log-Pressure Curves for Low LBR Soil and 32% 3/8-inch GTR
0.395
0.400
0.405
0.410
0.415
0.420
0.425
0.430
0.1 1 10 100
Vo
id R
atio
, e
Pressure, p (tsf)
Low A
Low B
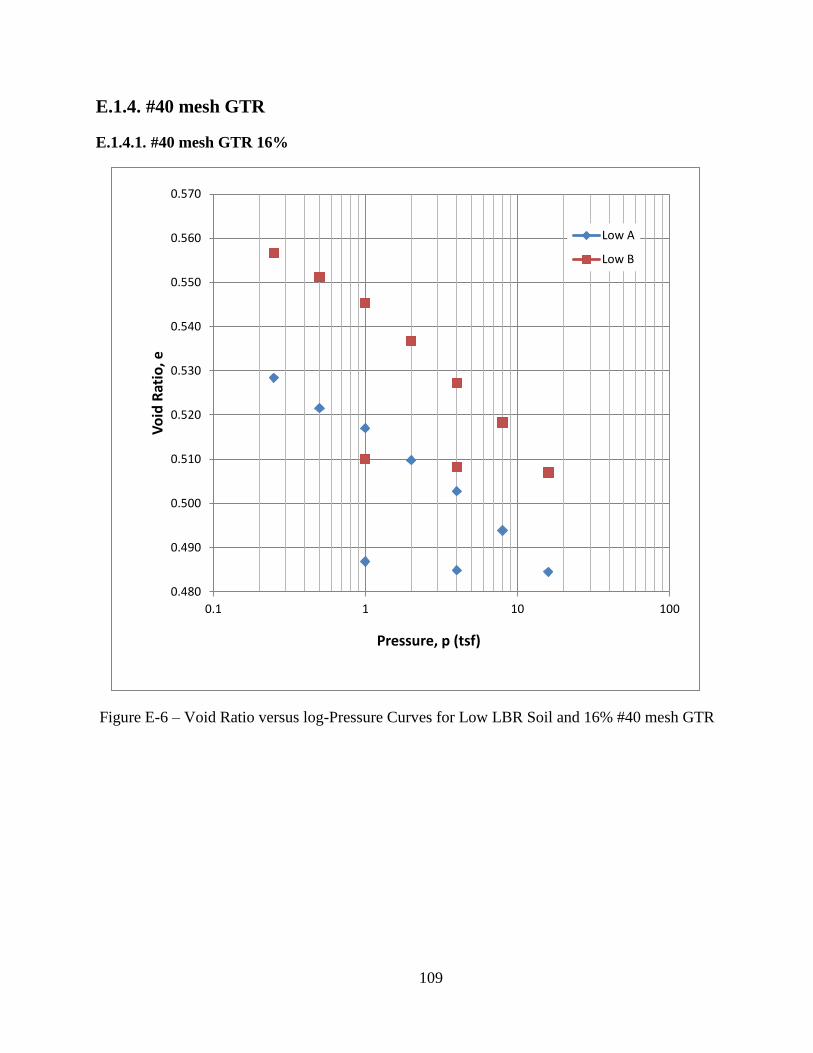
109
E.1.4. #40 mesh GTR
E.1.4.1. #40 mesh GTR 16%
Figure E-6 – Void Ratio versus log-Pressure Curves for Low LBR Soil and 16% #40 mesh GTR
0.480
0.490
0.500
0.510
0.520
0.530
0.540
0.550
0.560
0.570
0.1 1 10 100
Vo
id R
atio
, e
Pressure, p (tsf)
Low A
Low B
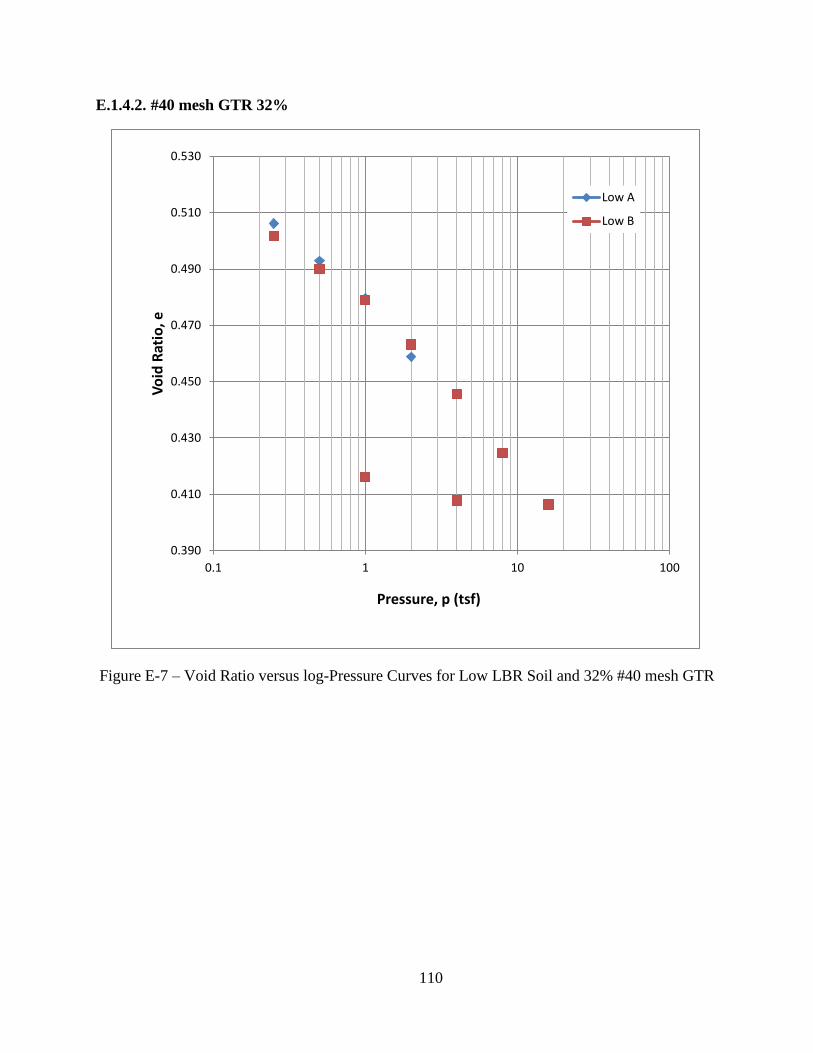
110
E.1.4.2. #40 mesh GTR 32%
Figure E-7 – Void Ratio versus log-Pressure Curves for Low LBR Soil and 32% #40 mesh GTR
0.390
0.410
0.430
0.450
0.470
0.490
0.510
0.530
0.1 1 10 100
Vo
id R
atio
, e
Pressure, p (tsf)
Low A
Low B
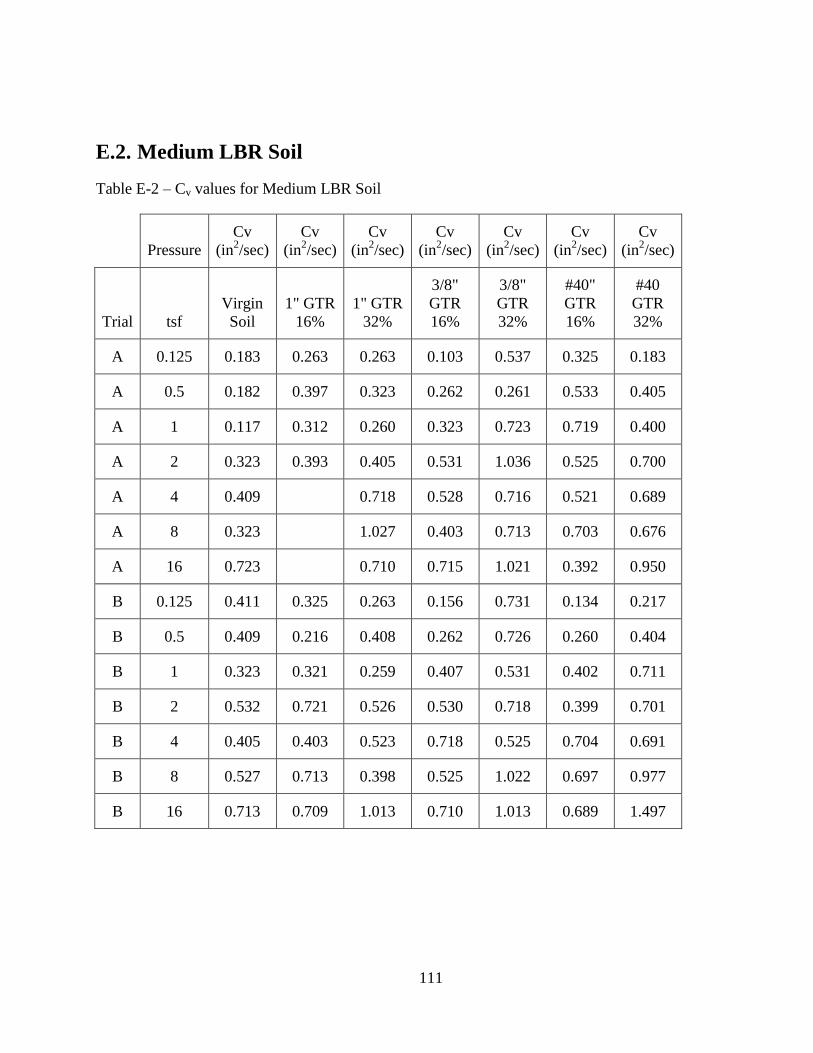
111
E.2. Medium LBR Soil
Table E-2 – Cv values for Medium LBR Soil
Pressure
Cv
(in2/sec)
Cv
(in2/sec)
Cv
(in2/sec)
Cv
(in2/sec)
Cv
(in2/sec)
Cv
(in2/sec)
Cv
(in2/sec)
Trial tsf
Virgin
Soil
1" GTR
16%
1" GTR
32%
3/8"
GTR
16%
3/8"
GTR
32%
#40"
GTR
16%
#40
GTR
32%
A 0.125 0.183 0.263 0.263 0.103 0.537 0.325 0.183
A 0.5 0.182 0.397 0.323 0.262 0.261 0.533 0.405
A 1 0.117 0.312 0.260 0.323 0.723 0.719 0.400
A 2 0.323 0.393 0.405 0.531 1.036 0.525 0.700
A 4 0.409
0.718 0.528 0.716 0.521 0.689
A 8 0.323
1.027 0.403 0.713 0.703 0.676
A 16 0.723
0.710 0.715 1.021 0.392 0.950
B 0.125 0.411 0.325 0.263 0.156 0.731 0.134 0.217
B 0.5 0.409 0.216 0.408 0.262 0.726 0.260 0.404
B 1 0.323 0.321 0.259 0.407 0.531 0.402 0.711
B 2 0.532 0.721 0.526 0.530 0.718 0.399 0.701
B 4 0.405 0.403 0.523 0.718 0.525 0.704 0.691
B 8 0.527 0.713 0.398 0.525 1.022 0.697 0.977
B 16 0.713 0.709 1.013 0.710 1.013 0.689 1.497
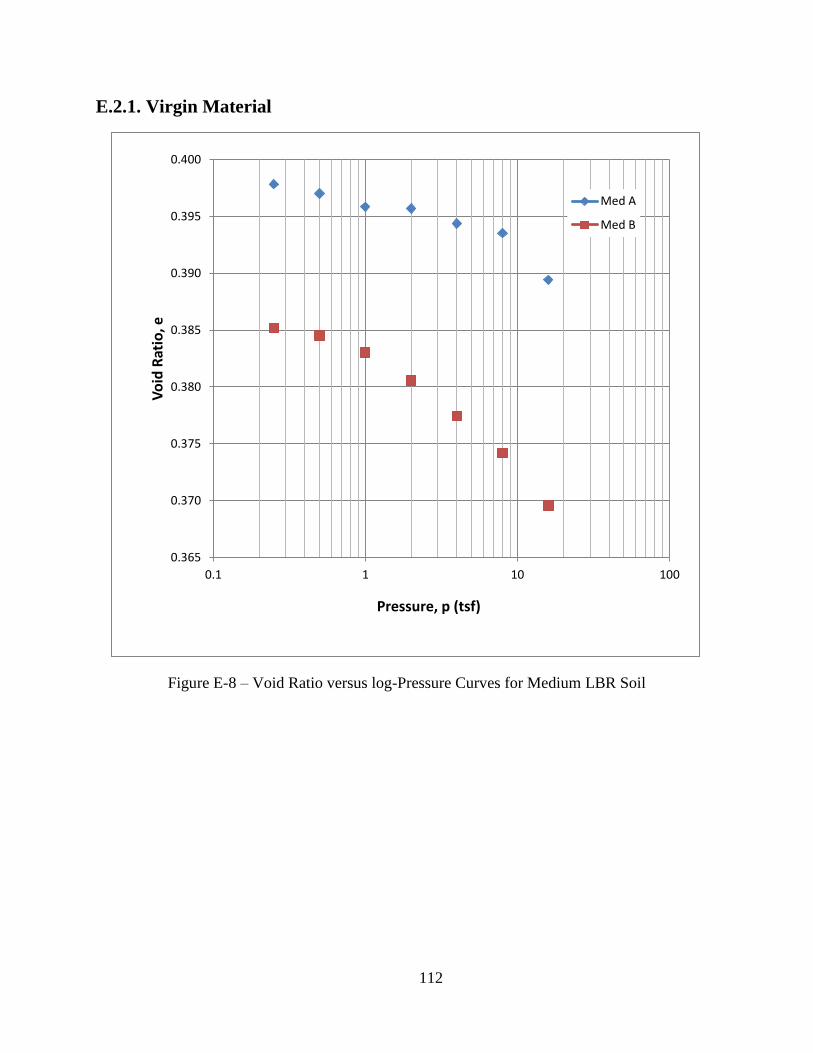
112
E.2.1. Virgin Material
Figure E-8 – Void Ratio versus log-Pressure Curves for Medium LBR Soil
0.365
0.370
0.375
0.380
0.385
0.390
0.395
0.400
0.1 1 10 100
Vo
id R
atio
, e
Pressure, p (tsf)
Med A
Med B
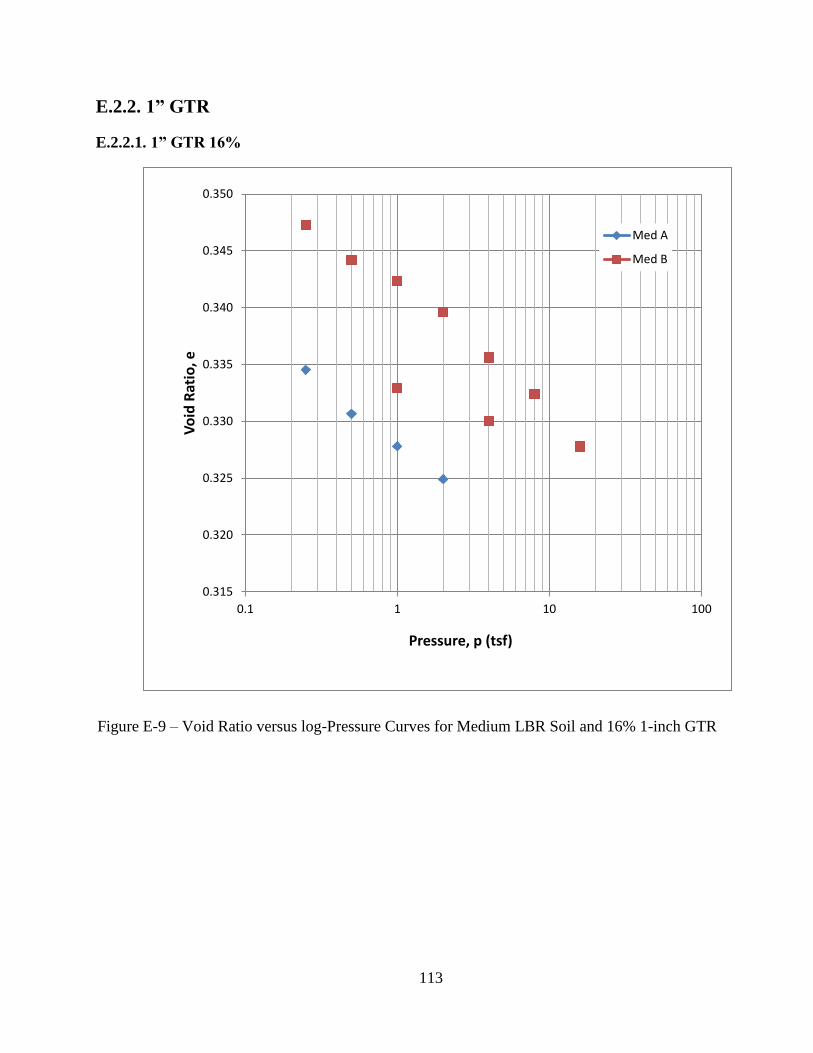
113
E.2.2. 1” GTR
E.2.2.1. 1” GTR 16%
Figure E-9 – Void Ratio versus log-Pressure Curves for Medium LBR Soil and 16% 1-inch GTR
0.315
0.320
0.325
0.330
0.335
0.340
0.345
0.350
0.1 1 10 100
Vo
id R
atio
, e
Pressure, p (tsf)
Med A
Med B
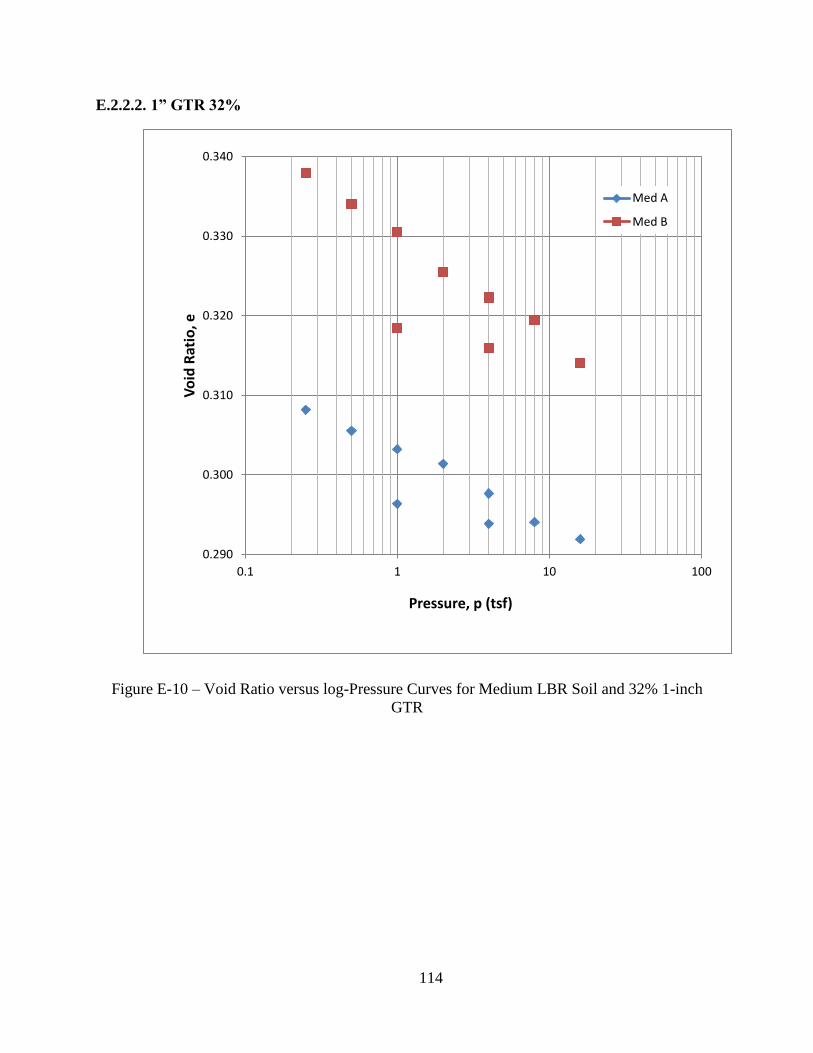
114
E.2.2.2. 1” GTR 32%
Figure E-10 – Void Ratio versus log-Pressure Curves for Medium LBR Soil and 32% 1-inch
GTR
0.290
0.300
0.310
0.320
0.330
0.340
0.1 1 10 100
Vo
id R
atio
, e
Pressure, p (tsf)
Med A
Med B
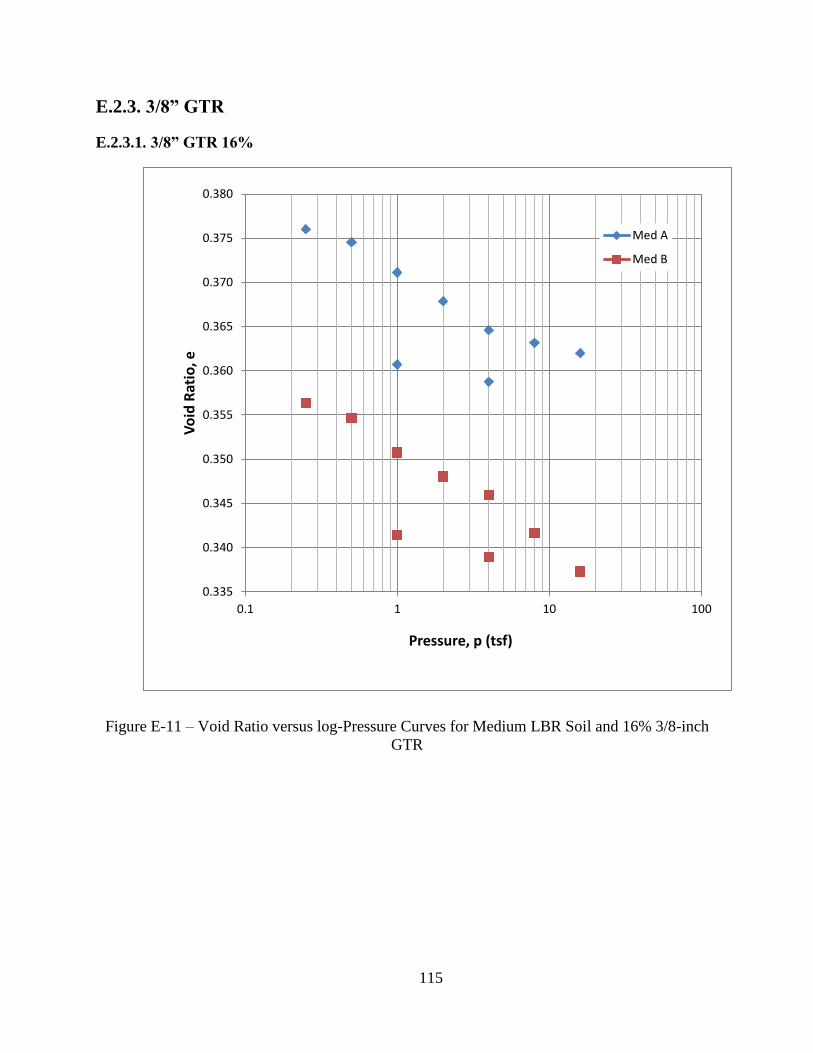
115
E.2.3. 3/8” GTR
E.2.3.1. 3/8” GTR 16%
Figure E-11 – Void Ratio versus log-Pressure Curves for Medium LBR Soil and 16% 3/8-inch
GTR
0.335
0.340
0.345
0.350
0.355
0.360
0.365
0.370
0.375
0.380
0.1 1 10 100
Vo
id R
atio
, e
Pressure, p (tsf)
Med A
Med B
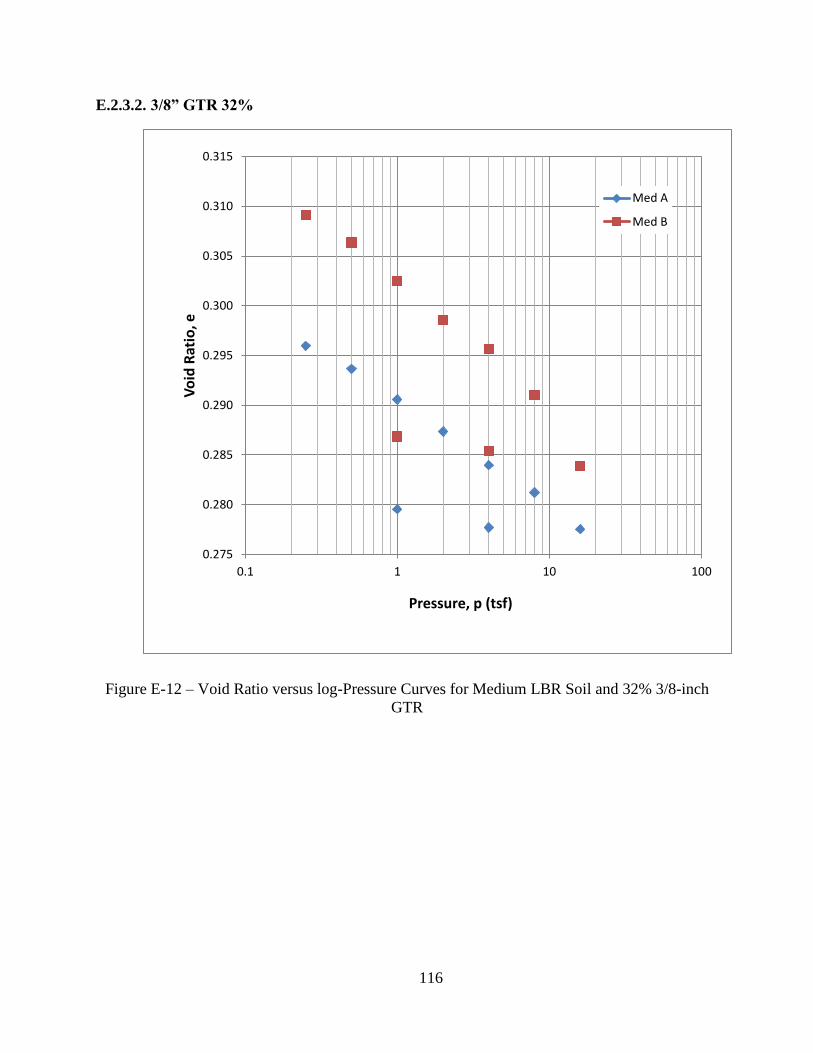
116
E.2.3.2. 3/8” GTR 32%
Figure E-12 – Void Ratio versus log-Pressure Curves for Medium LBR Soil and 32% 3/8-inch
GTR
0.275
0.280
0.285
0.290
0.295
0.300
0.305
0.310
0.315
0.1 1 10 100
Vo
id R
atio
, e
Pressure, p (tsf)
Med A
Med B
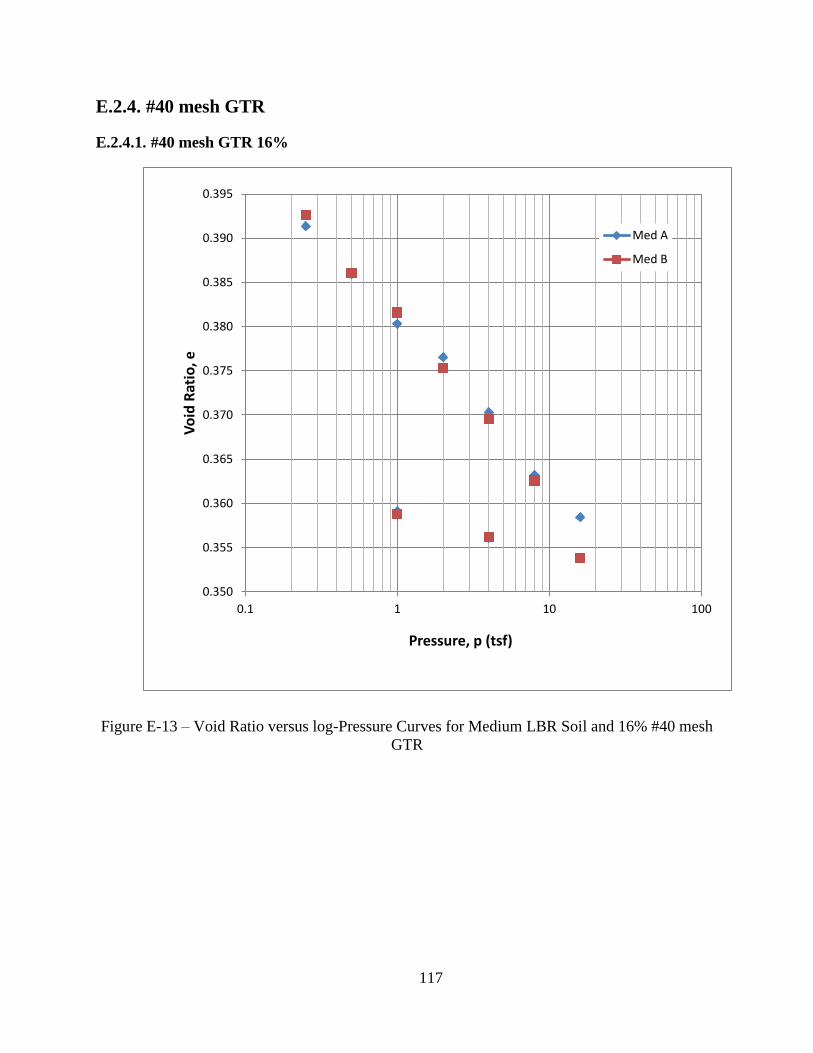
117
E.2.4. #40 mesh GTR
E.2.4.1. #40 mesh GTR 16%
Figure E-13 – Void Ratio versus log-Pressure Curves for Medium LBR Soil and 16% #40 mesh
GTR
0.350
0.355
0.360
0.365
0.370
0.375
0.380
0.385
0.390
0.395
0.1 1 10 100
Vo
id R
atio
, e
Pressure, p (tsf)
Med A
Med B
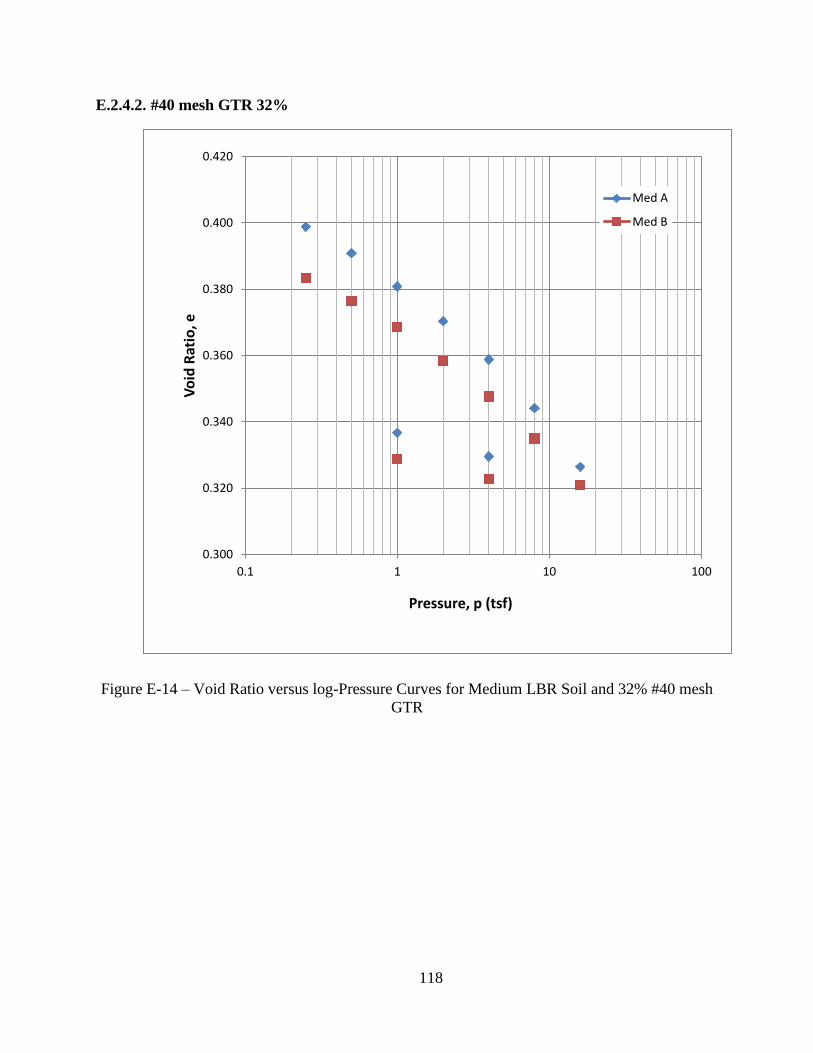
118
E.2.4.2. #40 mesh GTR 32%
Figure E-14 – Void Ratio versus log-Pressure Curves for Medium LBR Soil and 32% #40 mesh
GTR
0.300
0.320
0.340
0.360
0.380
0.400
0.420
0.1 1 10 100
Vo
id R
atio
, e
Pressure, p (tsf)
Med A
Med B
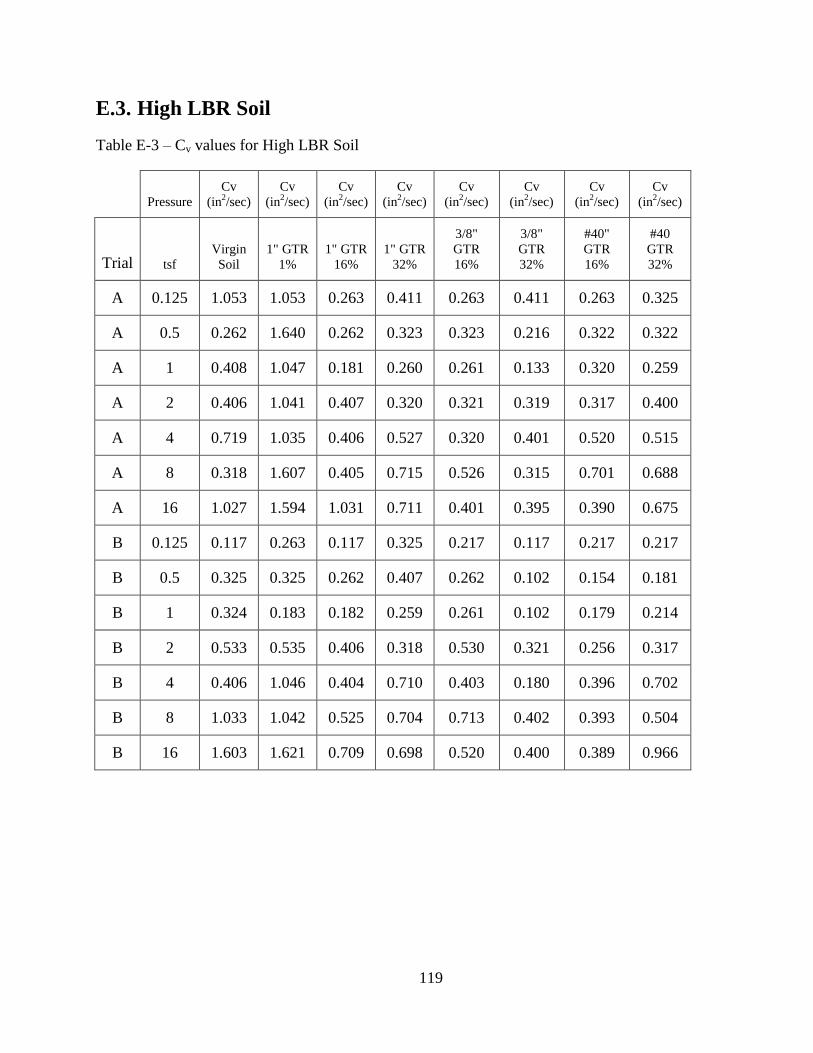
119
E.3. High LBR Soil
Table E-3 – Cv values for High LBR Soil
Pressure
Cv
(in2/sec)
Cv
(in2/sec)
Cv
(in2/sec)
Cv
(in2/sec)
Cv
(in2/sec)
Cv
(in2/sec)
Cv
(in2/sec)
Cv
(in2/sec)
Trial tsf
Virgin
Soil
1" GTR
1%
1" GTR
16%
1" GTR
32%
3/8"
GTR
16%
3/8"
GTR
32%
#40"
GTR
16%
#40
GTR
32%
A 0.125 1.053 1.053 0.263 0.411 0.263 0.411 0.263 0.325
A 0.5 0.262 1.640 0.262 0.323 0.323 0.216 0.322 0.322
A 1 0.408 1.047 0.181 0.260 0.261 0.133 0.320 0.259
A 2 0.406 1.041 0.407 0.320 0.321 0.319 0.317 0.400
A 4 0.719 1.035 0.406 0.527 0.320 0.401 0.520 0.515
A 8 0.318 1.607 0.405 0.715 0.526 0.315 0.701 0.688
A 16 1.027 1.594 1.031 0.711 0.401 0.395 0.390 0.675
B 0.125 0.117 0.263 0.117 0.325 0.217 0.117 0.217 0.217
B 0.5 0.325 0.325 0.262 0.407 0.262 0.102 0.154 0.181
B 1 0.324 0.183 0.182 0.259 0.261 0.102 0.179 0.214
B 2 0.533 0.535 0.406 0.318 0.530 0.321 0.256 0.317
B 4 0.406 1.046 0.404 0.710 0.403 0.180 0.396 0.702
B 8 1.033 1.042 0.525 0.704 0.713 0.402 0.393 0.504
B 16 1.603 1.621 0.709 0.698 0.520 0.400 0.389 0.966
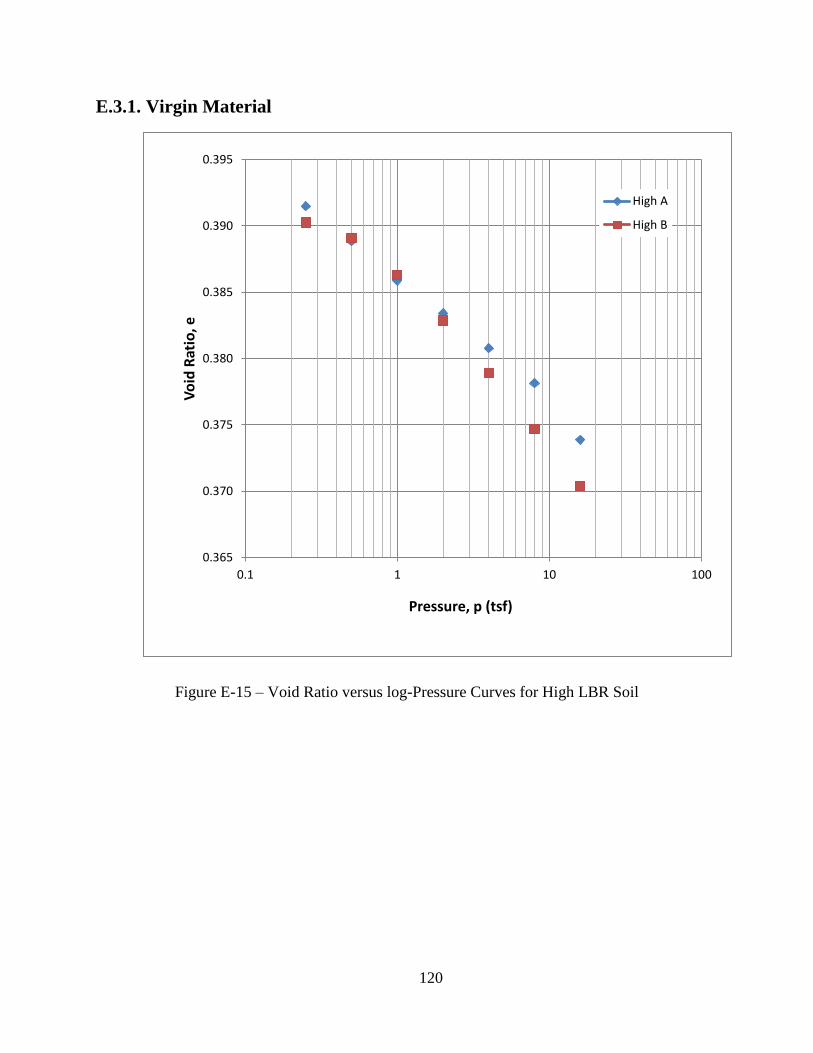
120
E.3.1. Virgin Material
Figure E-15 – Void Ratio versus log-Pressure Curves for High LBR Soil
0.365
0.370
0.375
0.380
0.385
0.390
0.395
0.1 1 10 100
Vo
id R
atio
, e
Pressure, p (tsf)
High A
High B
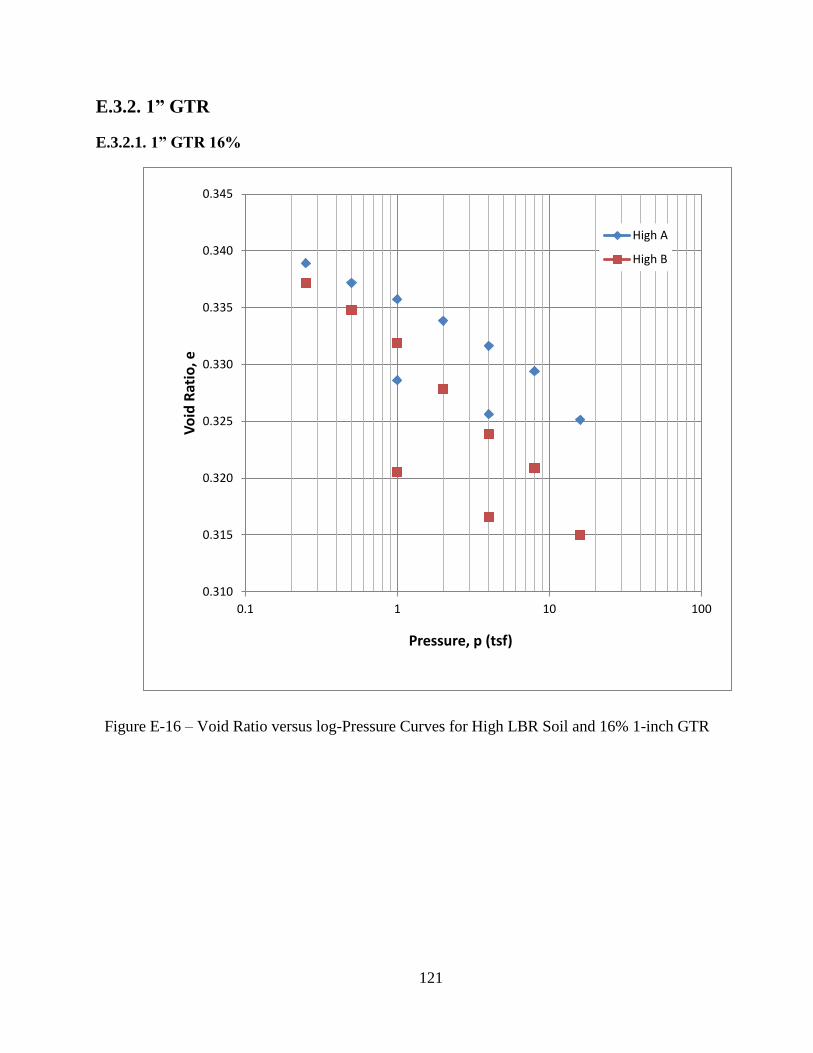
121
E.3.2. 1” GTR
E.3.2.1. 1” GTR 16%
Figure E-16 – Void Ratio versus log-Pressure Curves for High LBR Soil and 16% 1-inch GTR
0.310
0.315
0.320
0.325
0.330
0.335
0.340
0.345
0.1 1 10 100
Vo
id R
atio
, e
Pressure, p (tsf)
High A
High B
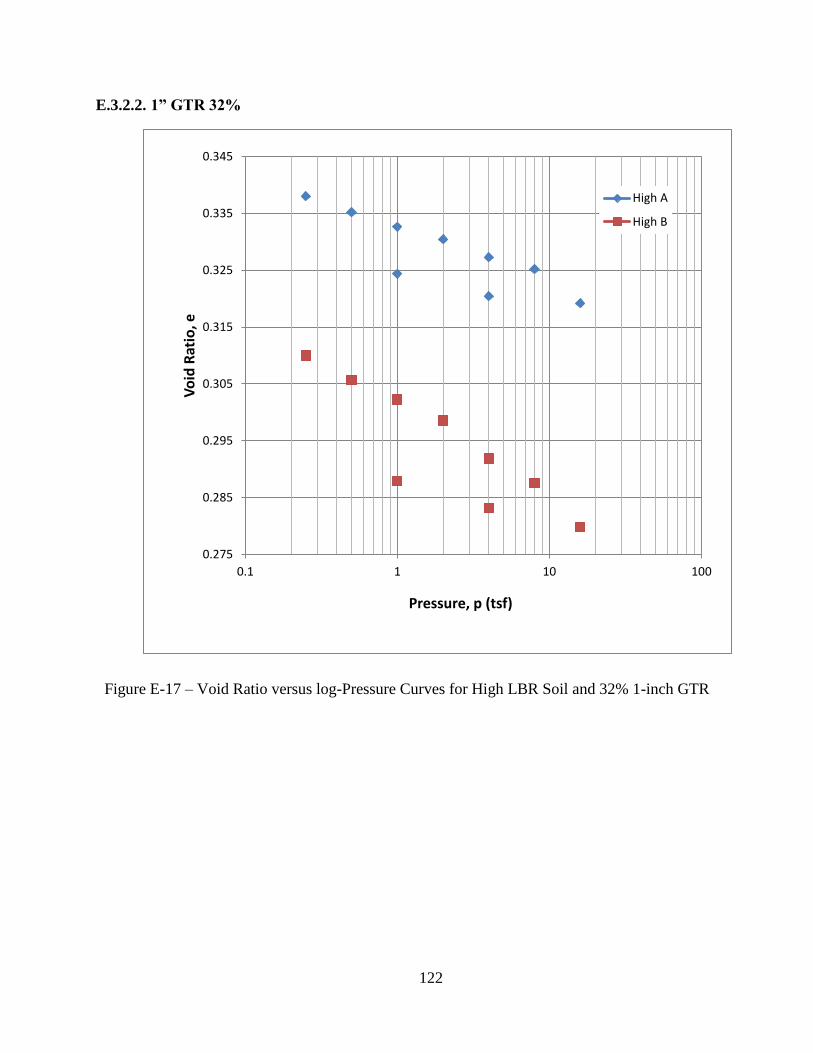
122
E.3.2.2. 1” GTR 32%
Figure E-17 – Void Ratio versus log-Pressure Curves for High LBR Soil and 32% 1-inch GTR
0.275
0.285
0.295
0.305
0.315
0.325
0.335
0.345
0.1 1 10 100
Vo
id R
atio
, e
Pressure, p (tsf)
High A
High B
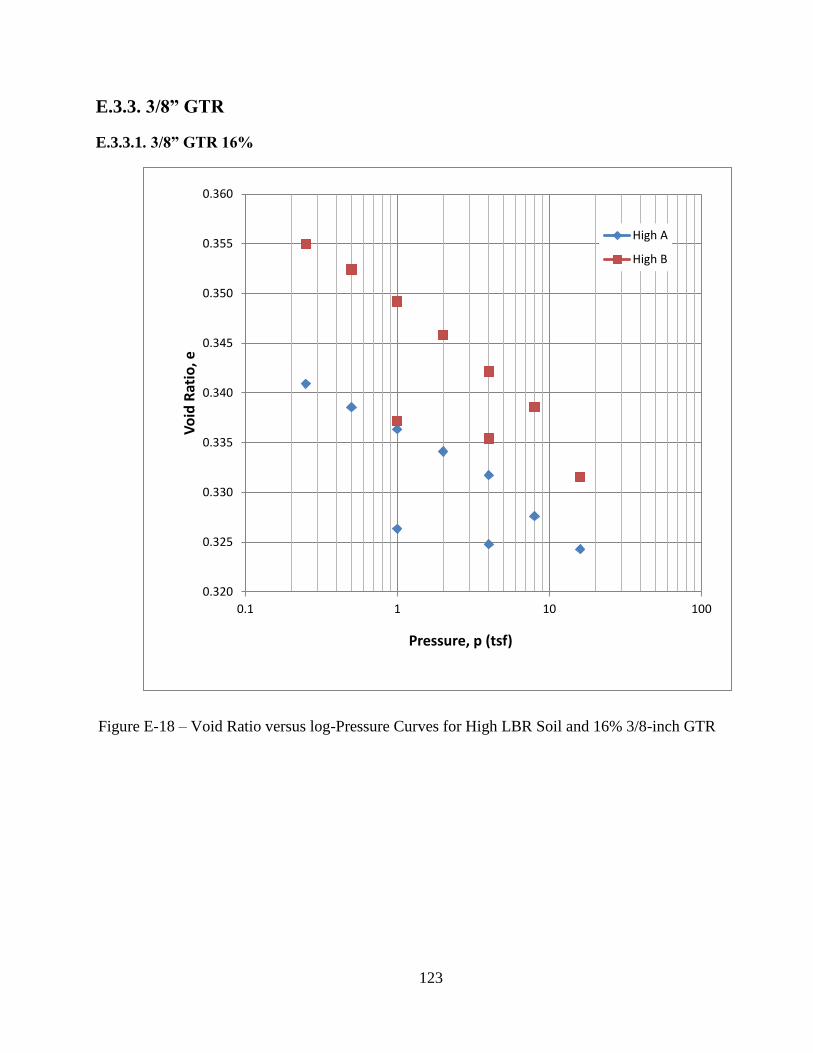
123
E.3.3. 3/8” GTR
E.3.3.1. 3/8” GTR 16%
Figure E-18 – Void Ratio versus log-Pressure Curves for High LBR Soil and 16% 3/8-inch GTR
0.320
0.325
0.330
0.335
0.340
0.345
0.350
0.355
0.360
0.1 1 10 100
Vo
id R
atio
, e
Pressure, p (tsf)
High A
High B
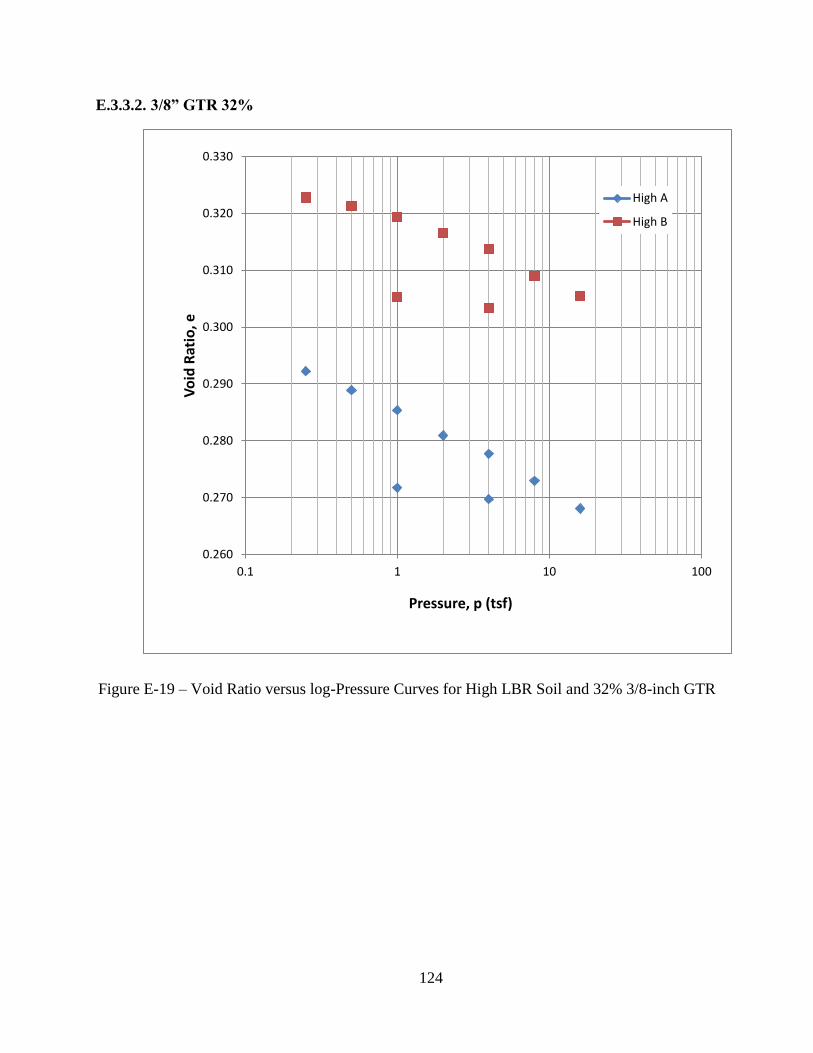
124
E.3.3.2. 3/8” GTR 32%
Figure E-19 – Void Ratio versus log-Pressure Curves for High LBR Soil and 32% 3/8-inch GTR
0.260
0.270
0.280
0.290
0.300
0.310
0.320
0.330
0.1 1 10 100
Vo
id R
atio
, e
Pressure, p (tsf)
High A
High B
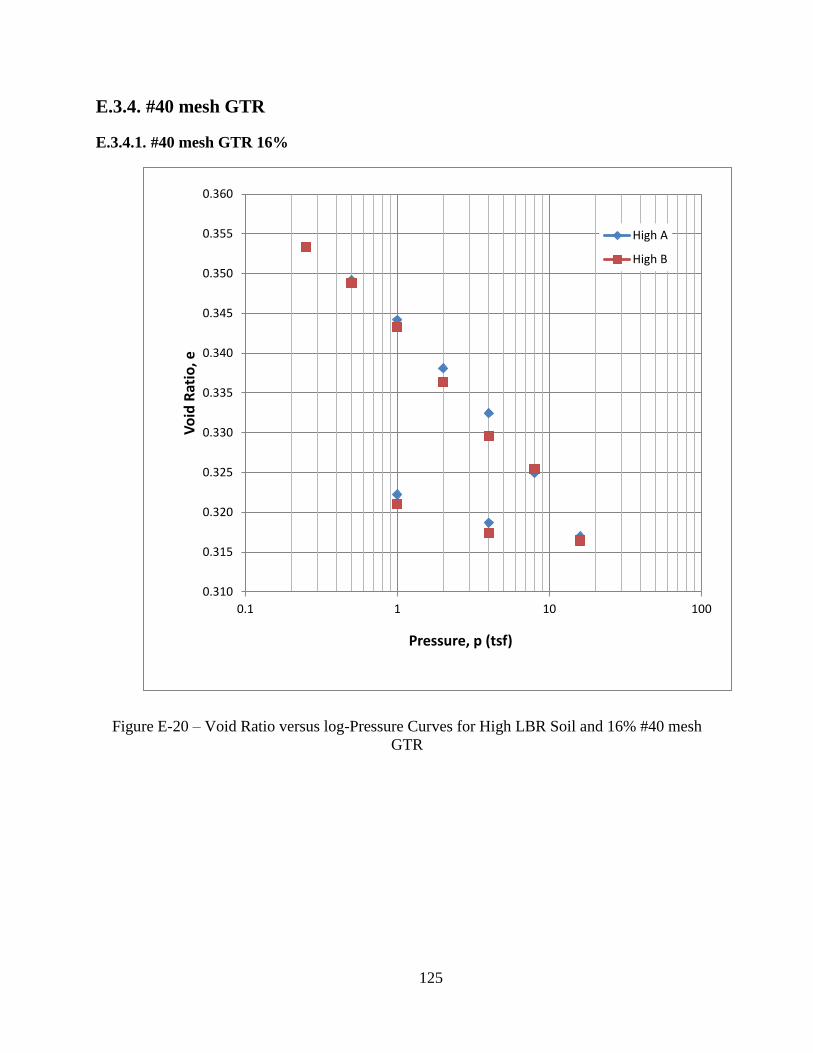
125
E.3.4. #40 mesh GTR
E.3.4.1. #40 mesh GTR 16%
Figure E-20 – Void Ratio versus log-Pressure Curves for High LBR Soil and 16% #40 mesh
GTR
0.310
0.315
0.320
0.325
0.330
0.335
0.340
0.345
0.350
0.355
0.360
0.1 1 10 100
Vo
id R
atio
, e
Pressure, p (tsf)
High A
High B
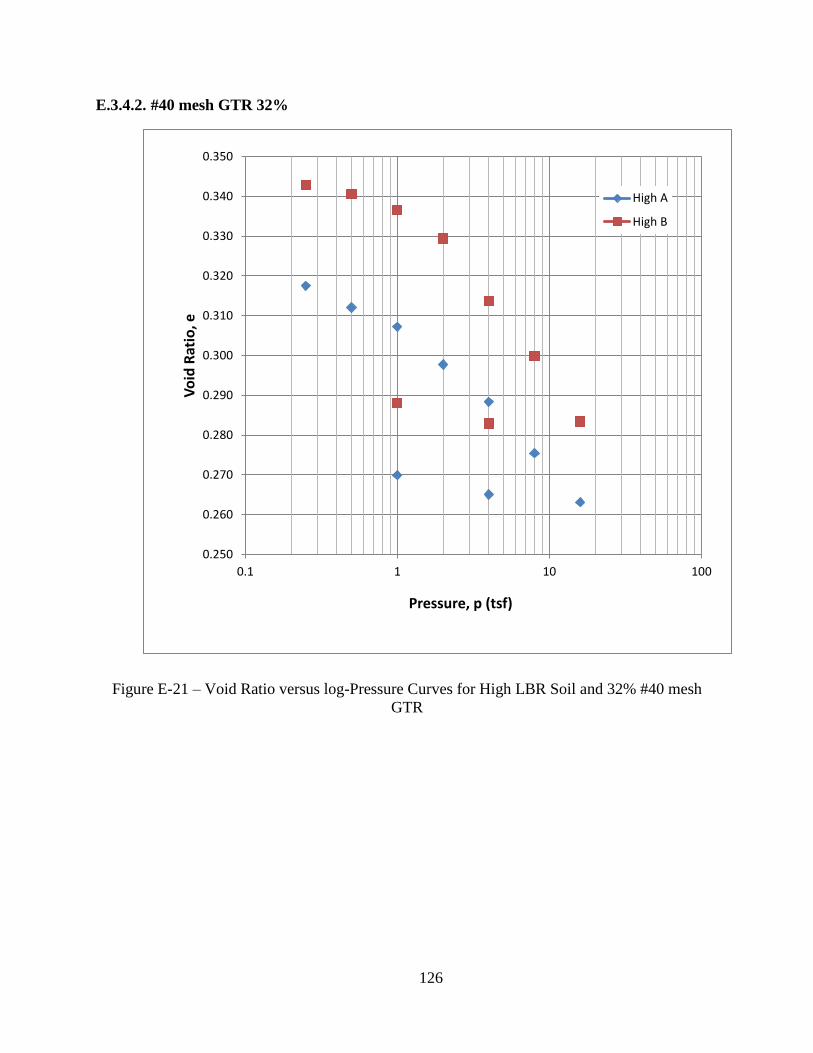
126
E.3.4.2. #40 mesh GTR 32%
Figure E-21 – Void Ratio versus log-Pressure Curves for High LBR Soil and 32% #40 mesh
GTR
0.250
0.260
0.270
0.280
0.290
0.300
0.310
0.320
0.330
0.340
0.350
0.1 1 10 100
Vo
id R
atio
, e
Pressure, p (tsf)
High A
High B
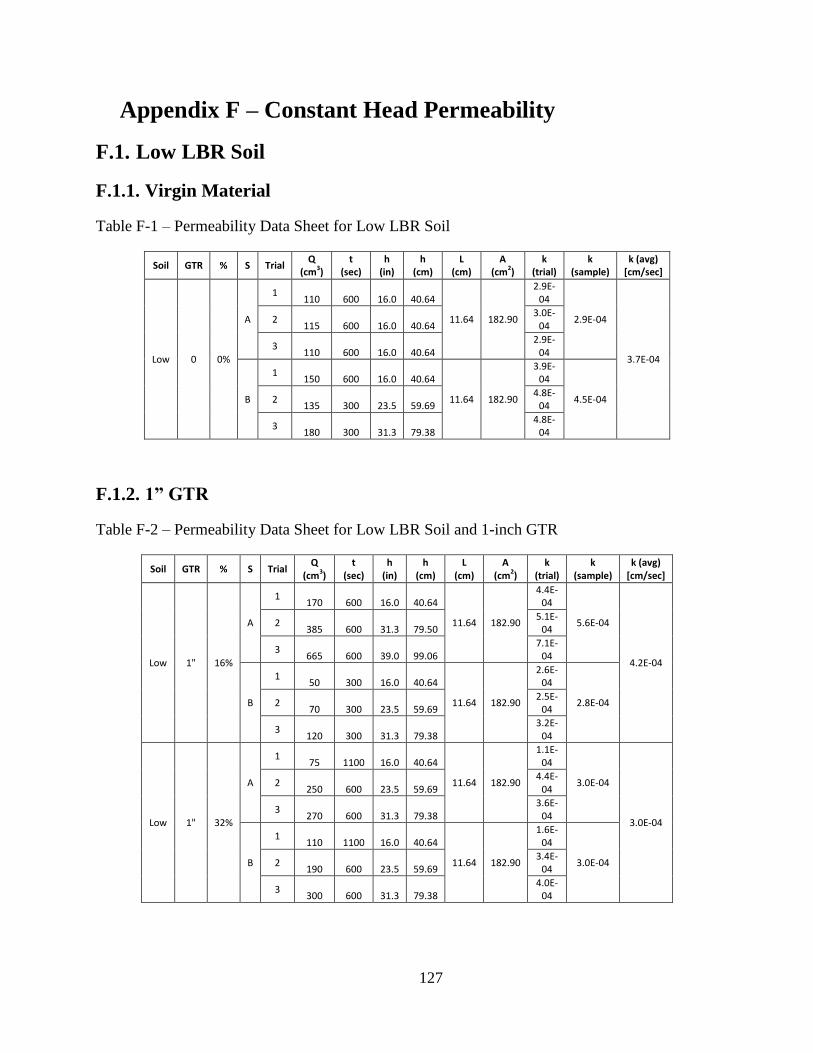
127
F. Appendix F – Constant Head Permeability
F.1. Low LBR Soil
F.1.1. Virgin Material
Table F-1 – Permeability Data Sheet for Low LBR Soil
Soil GTR % S Trial Q
(cm3) t
(sec) h
(in) h
(cm) L
(cm) A
(cm2) k
(trial) k
(sample) k (avg)
[cm/sec]
Low 0 0%
A
1 110 600 16.0 40.64
11.64 182.90
2.9E-04
2.9E-04
3.7E-04
2 115 600 16.0 40.64
3.0E-04
3 110 600 16.0 40.64
2.9E-04
B
1 150 600 16.0 40.64
11.64 182.90
3.9E-04
4.5E-04 2 135 300 23.5 59.69
4.8E-04
3 180 300 31.3 79.38
4.8E-04
F.1.2. 1” GTR
Table F-2 – Permeability Data Sheet for Low LBR Soil and 1-inch GTR
Soil GTR % S Trial Q
(cm3) t
(sec) h
(in) h
(cm) L
(cm) A
(cm2) k
(trial) k
(sample) k (avg)
[cm/sec]
Low 1" 16%
A
1 170 600 16.0 40.64
11.64 182.90
4.4E-04
5.6E-04
4.2E-04
2 385 600 31.3 79.50
5.1E-04
3 665 600 39.0 99.06
7.1E-04
B
1 50 300 16.0 40.64
11.64 182.90
2.6E-04
2.8E-04 2 70 300 23.5 59.69
2.5E-04
3 120 300 31.3 79.38
3.2E-04
Low 1" 32%
A
1 75 1100 16.0 40.64
11.64 182.90
1.1E-04
3.0E-04
3.0E-04
2 250 600 23.5 59.69
4.4E-04
3 270 600 31.3 79.38
3.6E-04
B
1 110 1100 16.0 40.64
11.64 182.90
1.6E-04
3.0E-04 2 190 600 23.5 59.69
3.4E-04
3 300 600 31.3 79.38
4.0E-04
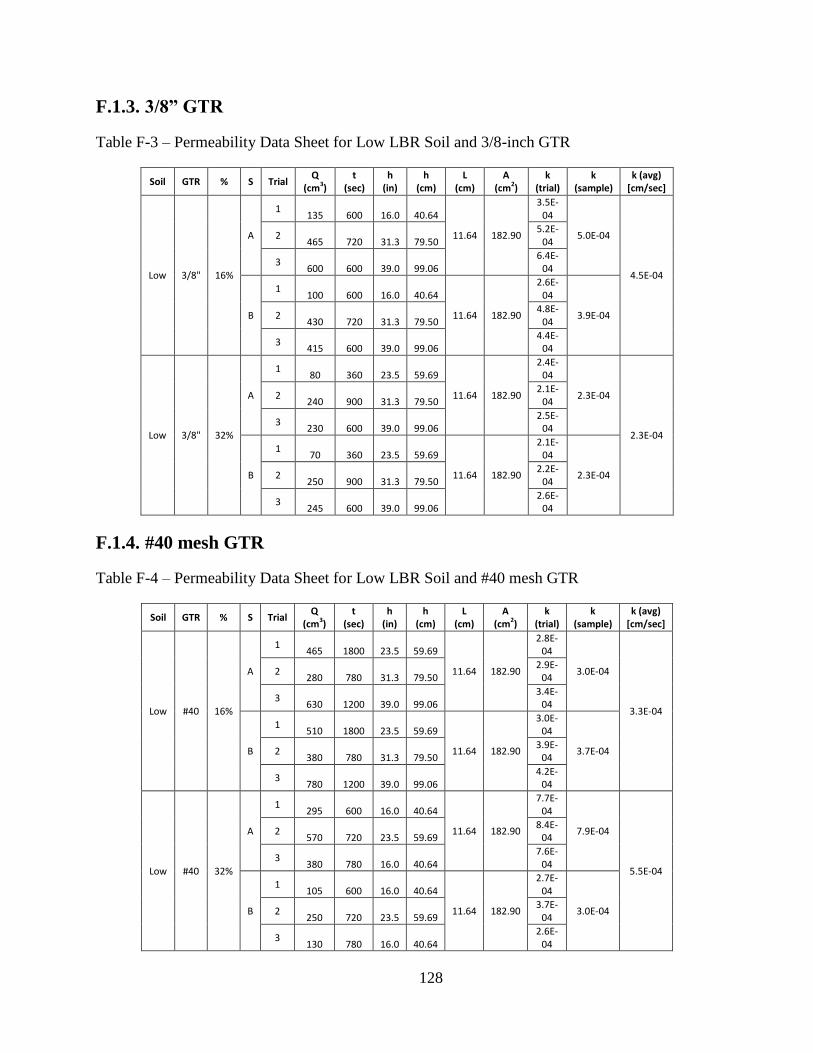
128
F.1.3. 3/8” GTR
Table F-3 – Permeability Data Sheet for Low LBR Soil and 3/8-inch GTR
Soil GTR % S Trial Q
(cm3) t
(sec) h
(in) h
(cm) L
(cm) A
(cm2) k
(trial) k
(sample) k (avg)
[cm/sec]
Low 3/8" 16%
A
1 135 600 16.0 40.64
11.64 182.90
3.5E-04
5.0E-04
4.5E-04
2 465 720 31.3 79.50
5.2E-04
3 600 600 39.0 99.06
6.4E-04
B
1 100 600 16.0 40.64
11.64 182.90
2.6E-04
3.9E-04 2 430 720 31.3 79.50
4.8E-04
3 415 600 39.0 99.06
4.4E-04
Low 3/8" 32%
A
1 80 360 23.5 59.69
11.64 182.90
2.4E-04
2.3E-04
2.3E-04
2 240 900 31.3 79.50
2.1E-04
3 230 600 39.0 99.06
2.5E-04
B
1 70 360 23.5 59.69
11.64 182.90
2.1E-04
2.3E-04 2 250 900 31.3 79.50
2.2E-04
3 245 600 39.0 99.06
2.6E-04
F.1.4. #40 mesh GTR
Table F-4 – Permeability Data Sheet for Low LBR Soil and #40 mesh GTR
Soil GTR % S Trial Q
(cm3) t
(sec) h
(in) h
(cm) L
(cm) A
(cm2) k
(trial) k
(sample) k (avg)
[cm/sec]
Low #40 16%
A
1 465 1800 23.5 59.69
11.64 182.90
2.8E-04
3.0E-04
3.3E-04
2 280 780 31.3 79.50
2.9E-04
3 630 1200 39.0 99.06
3.4E-04
B
1 510 1800 23.5 59.69
11.64 182.90
3.0E-04
3.7E-04 2 380 780 31.3 79.50
3.9E-04
3 780 1200 39.0 99.06
4.2E-04
Low #40 32%
A
1 295 600 16.0 40.64
11.64 182.90
7.7E-04
7.9E-04
5.5E-04
2 570 720 23.5 59.69
8.4E-04
3 380 780 16.0 40.64
7.6E-04
B
1 105 600 16.0 40.64
11.64 182.90
2.7E-04
3.0E-04 2 250 720 23.5 59.69
3.7E-04
3 130 780 16.0 40.64
2.6E-04
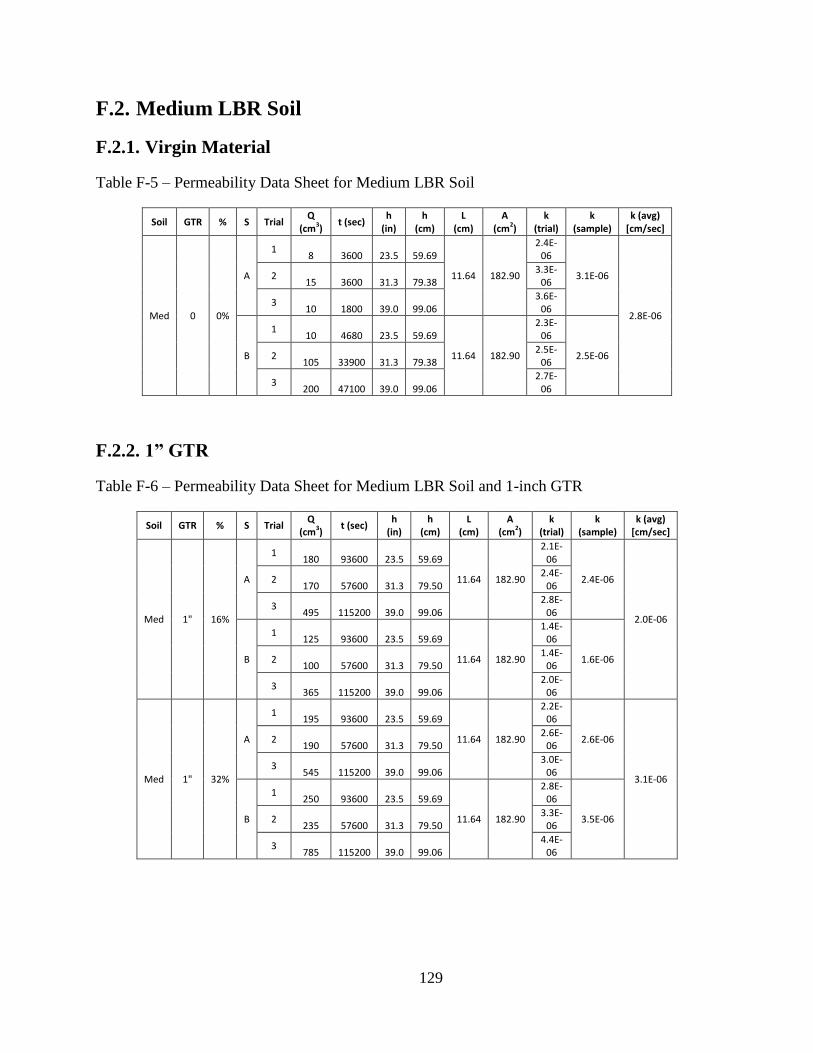
129
F.2. Medium LBR Soil
F.2.1. Virgin Material
Table F-5 – Permeability Data Sheet for Medium LBR Soil
Soil GTR % S Trial Q
(cm3) t (sec)
h (in)
h (cm)
L (cm)
A (cm2)
k (trial)
k (sample)
k (avg) [cm/sec]
Med 0 0%
A
1 8 3600 23.5 59.69
11.64 182.90
2.4E-06
3.1E-06
2.8E-06
2 15 3600 31.3 79.38
3.3E-06
3 10 1800 39.0 99.06
3.6E-06
B
1 10 4680 23.5 59.69
11.64 182.90
2.3E-06
2.5E-06 2 105 33900 31.3 79.38
2.5E-06
3 200 47100 39.0 99.06
2.7E-06
F.2.2. 1” GTR
Table F-6 – Permeability Data Sheet for Medium LBR Soil and 1-inch GTR
Soil GTR % S Trial Q
(cm3) t (sec)
h (in)
h (cm)
L (cm)
A (cm2)
k (trial)
k (sample)
k (avg) [cm/sec]
Med 1" 16%
A
1 180 93600 23.5 59.69
11.64 182.90
2.1E-06
2.4E-06
2.0E-06
2 170 57600 31.3 79.50
2.4E-06
3 495 115200 39.0 99.06
2.8E-06
B
1 125 93600 23.5 59.69
11.64 182.90
1.4E-06
1.6E-06 2 100 57600 31.3 79.50
1.4E-06
3 365 115200 39.0 99.06
2.0E-06
Med 1" 32%
A
1 195 93600 23.5 59.69
11.64 182.90
2.2E-06
2.6E-06
3.1E-06
2 190 57600 31.3 79.50
2.6E-06
3 545 115200 39.0 99.06
3.0E-06
B
1 250 93600 23.5 59.69
11.64 182.90
2.8E-06
3.5E-06 2 235 57600 31.3 79.50
3.3E-06
3 785 115200 39.0 99.06
4.4E-06
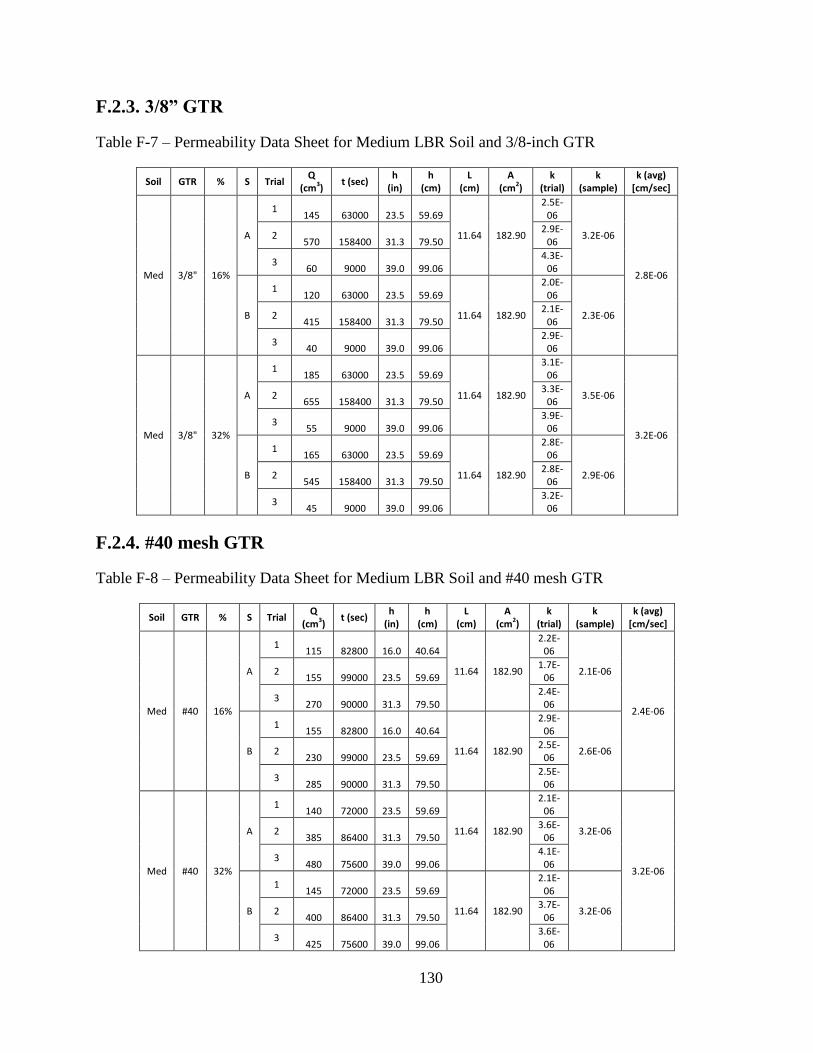
130
F.2.3. 3/8” GTR
Table F-7 – Permeability Data Sheet for Medium LBR Soil and 3/8-inch GTR
Soil GTR % S Trial Q
(cm3) t (sec)
h (in)
h (cm)
L (cm)
A (cm2)
k (trial)
k (sample)
k (avg) [cm/sec]
Med 3/8" 16%
A
1 145 63000 23.5 59.69
11.64 182.90
2.5E-06
3.2E-06
2.8E-06
2 570 158400 31.3 79.50
2.9E-06
3 60 9000 39.0 99.06
4.3E-06
B
1 120 63000 23.5 59.69
11.64 182.90
2.0E-06
2.3E-06 2 415 158400 31.3 79.50
2.1E-06
3 40 9000 39.0 99.06
2.9E-06
Med 3/8" 32%
A
1 185 63000 23.5 59.69
11.64 182.90
3.1E-06
3.5E-06
3.2E-06
2 655 158400 31.3 79.50
3.3E-06
3 55 9000 39.0 99.06
3.9E-06
B
1 165 63000 23.5 59.69
11.64 182.90
2.8E-06
2.9E-06 2 545 158400 31.3 79.50
2.8E-06
3 45 9000 39.0 99.06
3.2E-06
F.2.4. #40 mesh GTR
Table F-8 – Permeability Data Sheet for Medium LBR Soil and #40 mesh GTR
Soil GTR % S Trial Q
(cm3) t (sec)
h (in)
h (cm)
L (cm)
A (cm2)
k (trial)
k (sample)
k (avg) [cm/sec]
Med #40 16%
A
1 115 82800 16.0 40.64
11.64 182.90
2.2E-06
2.1E-06
2.4E-06
2 155 99000 23.5 59.69
1.7E-06
3 270 90000 31.3 79.50
2.4E-06
B
1 155 82800 16.0 40.64
11.64 182.90
2.9E-06
2.6E-06 2 230 99000 23.5 59.69
2.5E-06
3 285 90000 31.3 79.50
2.5E-06
Med #40 32%
A
1 140 72000 23.5 59.69
11.64 182.90
2.1E-06
3.2E-06
3.2E-06
2 385 86400 31.3 79.50
3.6E-06
3 480 75600 39.0 99.06
4.1E-06
B
1 145 72000 23.5 59.69
11.64 182.90
2.1E-06
3.2E-06 2 400 86400 31.3 79.50
3.7E-06
3 425 75600 39.0 99.06
3.6E-06
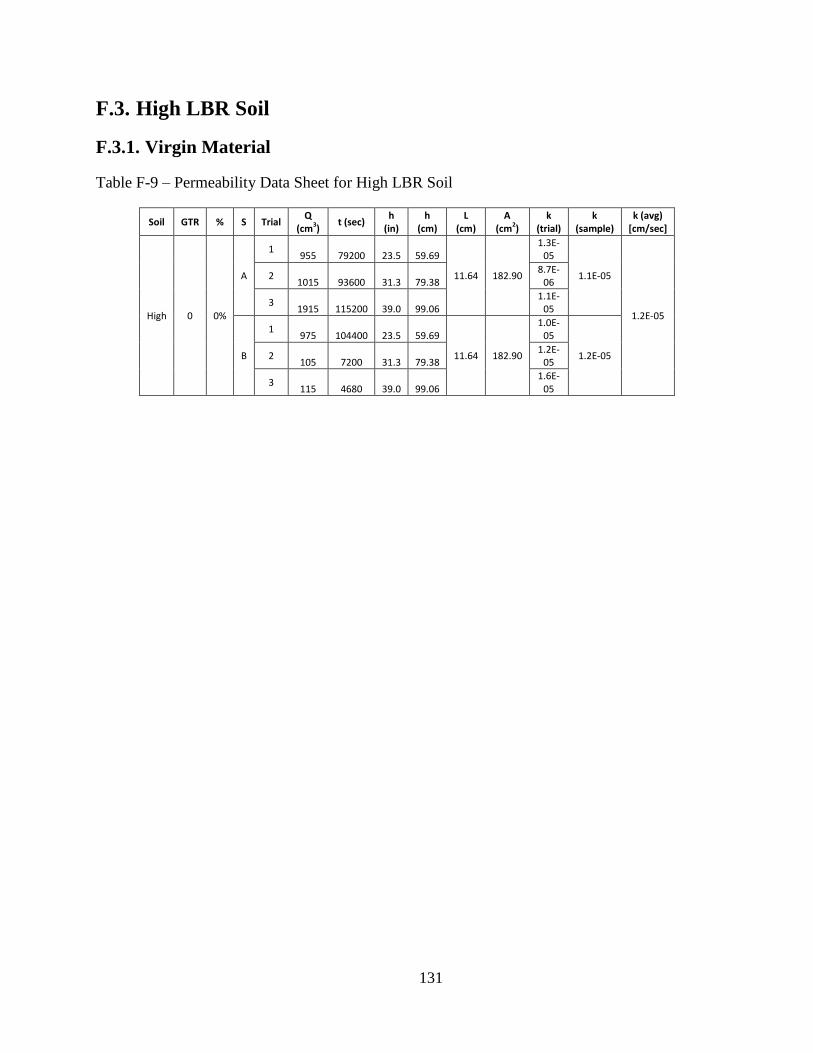
131
F.3. High LBR Soil
F.3.1. Virgin Material
Table F-9 – Permeability Data Sheet for High LBR Soil
Soil GTR % S Trial Q
(cm3) t (sec)
h (in)
h (cm)
L (cm)
A (cm2)
k (trial)
k (sample)
k (avg) [cm/sec]
High 0 0%
A
1 955 79200 23.5 59.69
11.64 182.90
1.3E-05
1.1E-05
1.2E-05
2 1015 93600 31.3 79.38
8.7E-06
3 1915 115200 39.0 99.06
1.1E-05
B
1 975 104400 23.5 59.69
11.64 182.90
1.0E-05
1.2E-05 2 105 7200 31.3 79.38
1.2E-05
3 115 4680 39.0 99.06
1.6E-05
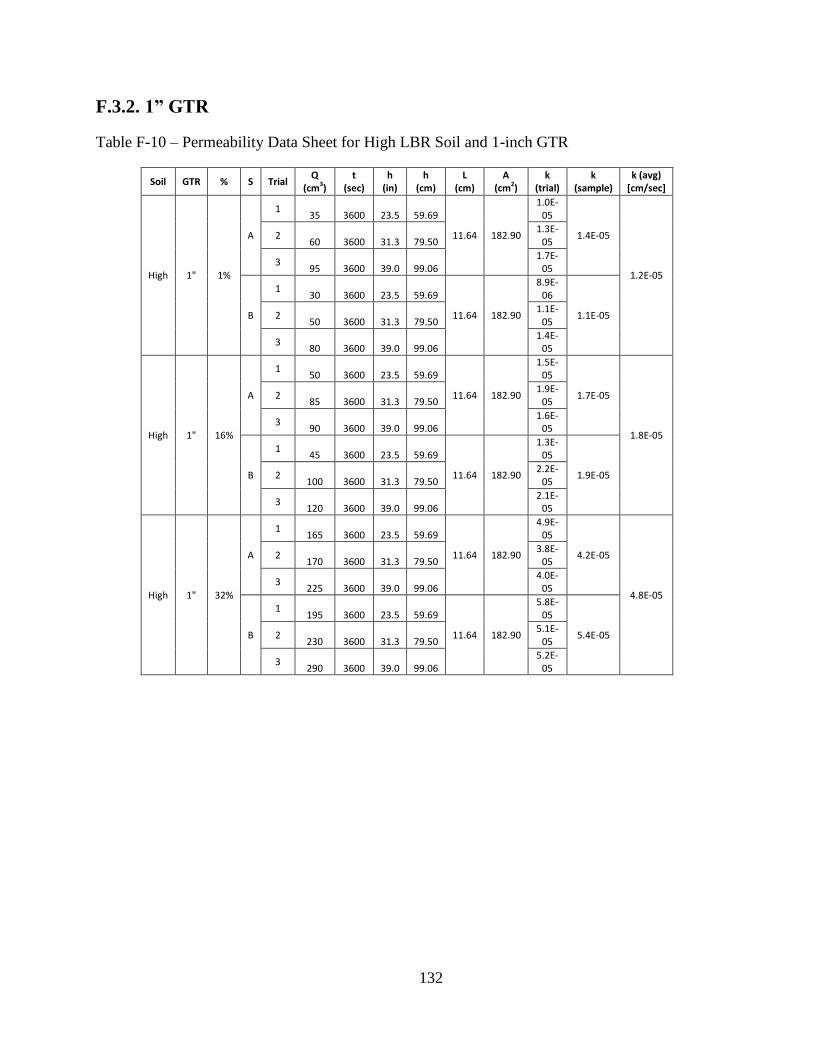
132
F.3.2. 1” GTR
Table F-10 – Permeability Data Sheet for High LBR Soil and 1-inch GTR
Soil GTR % S Trial Q
(cm3) t
(sec) h
(in) h
(cm) L
(cm) A
(cm2) k
(trial) k
(sample) k (avg)
[cm/sec]
High 1" 1%
A
1 35 3600 23.5 59.69
11.64 182.90
1.0E-05
1.4E-05
1.2E-05
2 60 3600 31.3 79.50
1.3E-05
3 95 3600 39.0 99.06
1.7E-05
B
1 30 3600 23.5 59.69
11.64 182.90
8.9E-06
1.1E-05 2 50 3600 31.3 79.50
1.1E-05
3 80 3600 39.0 99.06
1.4E-05
High 1" 16%
A
1 50 3600 23.5 59.69
11.64 182.90
1.5E-05
1.7E-05
1.8E-05
2 85 3600 31.3 79.50
1.9E-05
3 90 3600 39.0 99.06
1.6E-05
B
1 45 3600 23.5 59.69
11.64 182.90
1.3E-05
1.9E-05 2 100 3600 31.3 79.50
2.2E-05
3 120 3600 39.0 99.06
2.1E-05
High 1" 32%
A
1 165 3600 23.5 59.69
11.64 182.90
4.9E-05
4.2E-05
4.8E-05
2 170 3600 31.3 79.50
3.8E-05
3 225 3600 39.0 99.06
4.0E-05
B
1 195 3600 23.5 59.69
11.64 182.90
5.8E-05
5.4E-05 2 230 3600 31.3 79.50
5.1E-05
3 290 3600 39.0 99.06
5.2E-05
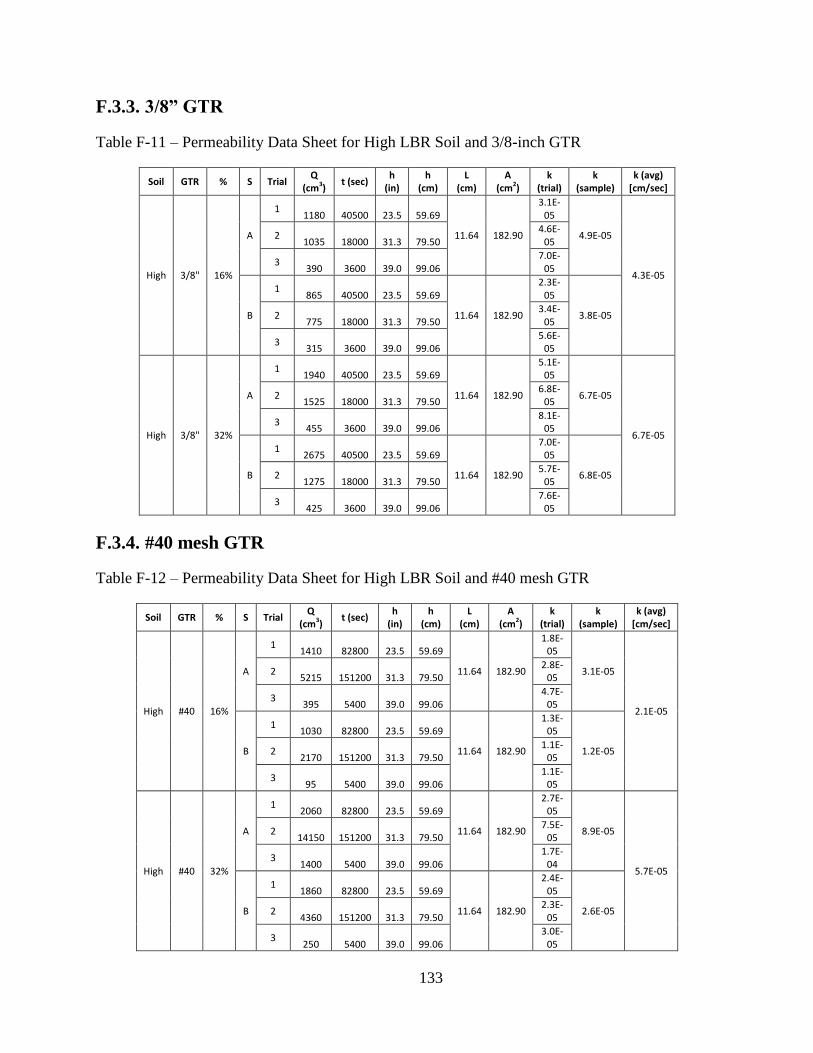
133
F.3.3. 3/8” GTR
Table F-11 – Permeability Data Sheet for High LBR Soil and 3/8-inch GTR
Soil GTR % S Trial Q
(cm3) t (sec)
h (in)
h (cm)
L (cm)
A (cm2)
k (trial)
k (sample)
k (avg) [cm/sec]
High 3/8" 16%
A
1 1180 40500 23.5 59.69
11.64 182.90
3.1E-05
4.9E-05
4.3E-05
2 1035 18000 31.3 79.50
4.6E-05
3 390 3600 39.0 99.06
7.0E-05
B
1 865 40500 23.5 59.69
11.64 182.90
2.3E-05
3.8E-05 2 775 18000 31.3 79.50
3.4E-05
3 315 3600 39.0 99.06
5.6E-05
High 3/8" 32%
A
1 1940 40500 23.5 59.69
11.64 182.90
5.1E-05
6.7E-05
6.7E-05
2 1525 18000 31.3 79.50
6.8E-05
3 455 3600 39.0 99.06
8.1E-05
B
1 2675 40500 23.5 59.69
11.64 182.90
7.0E-05
6.8E-05 2 1275 18000 31.3 79.50
5.7E-05
3 425 3600 39.0 99.06
7.6E-05
F.3.4. #40 mesh GTR
Table F-12 – Permeability Data Sheet for High LBR Soil and #40 mesh GTR
Soil GTR % S Trial Q
(cm3) t (sec)
h (in)
h (cm)
L (cm)
A (cm2)
k (trial)
k (sample)
k (avg) [cm/sec]
High #40 16%
A
1 1410 82800 23.5 59.69
11.64 182.90
1.8E-05
3.1E-05
2.1E-05
2 5215 151200 31.3 79.50
2.8E-05
3 395 5400 39.0 99.06
4.7E-05
B
1 1030 82800 23.5 59.69
11.64 182.90
1.3E-05
1.2E-05 2 2170 151200 31.3 79.50
1.1E-05
3 95 5400 39.0 99.06
1.1E-05
High #40 32%
A
1 2060 82800 23.5 59.69
11.64 182.90
2.7E-05
8.9E-05
5.7E-05
2 14150 151200 31.3 79.50
7.5E-05
3 1400 5400 39.0 99.06
1.7E-04
B
1 1860 82800 23.5 59.69
11.64 182.90
2.4E-05
2.6E-05 2 4360 151200 31.3 79.50
2.3E-05
3 250 5400 39.0 99.06
3.0E-05
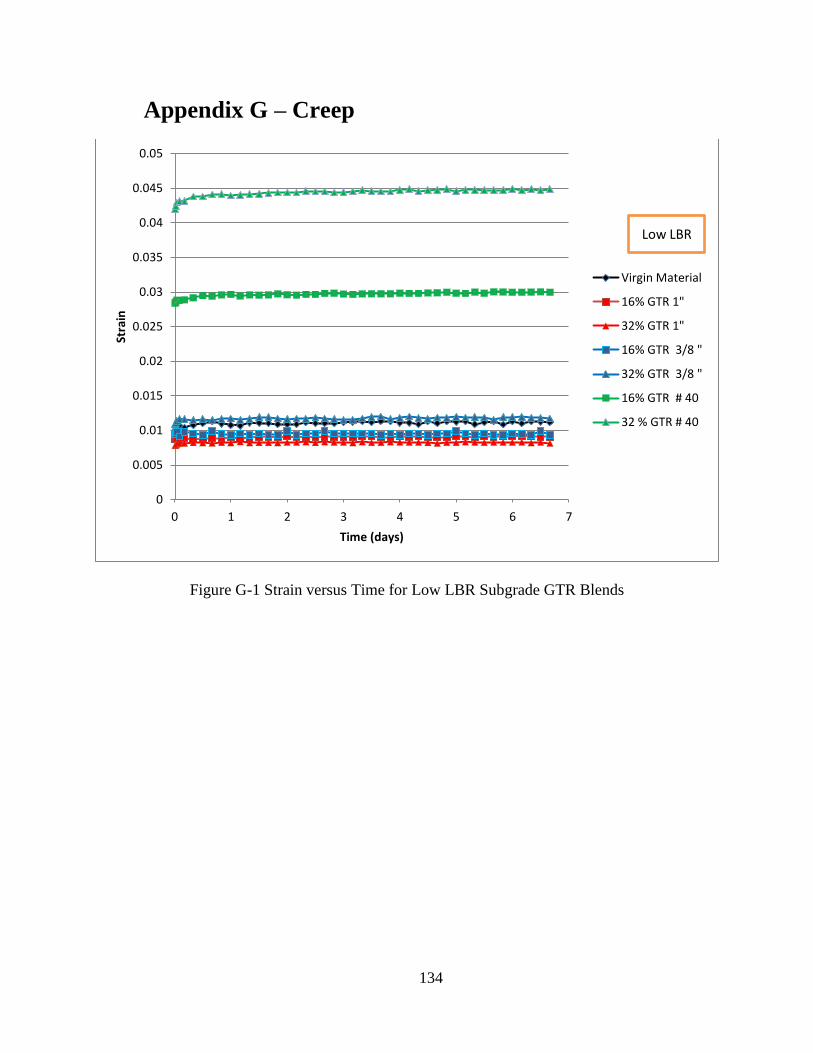
134
G. Appendix G – Creep
Figure G-1 Strain versus Time for Low LBR Subgrade GTR Blends
0
0.005
0.01
0.015
0.02
0.025
0.03
0.035
0.04
0.045
0.05
0 1 2 3 4 5 6 7
Stra
in
Time (days)
Virgin Material
16% GTR 1"
32% GTR 1"
16% GTR 3/8 "
32% GTR 3/8 "
16% GTR # 40
32 % GTR # 40
Low LBR
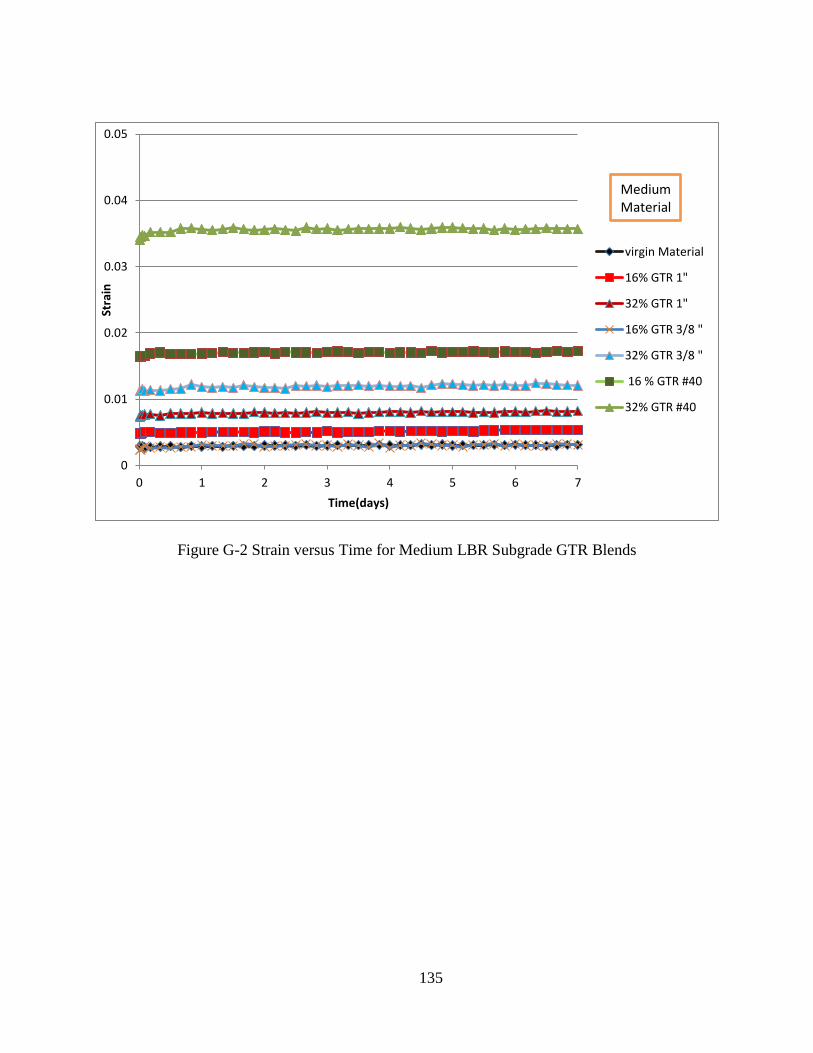
135
Figure G-2 Strain versus Time for Medium LBR Subgrade GTR Blends
0
0.01
0.02
0.03
0.04
0.05
0 1 2 3 4 5 6 7
Stra
in
Time(days)
virgin Material
16% GTR 1"
32% GTR 1"
16% GTR 3/8 "
32% GTR 3/8 "
16 % GTR #40
32% GTR #40
Medium Material
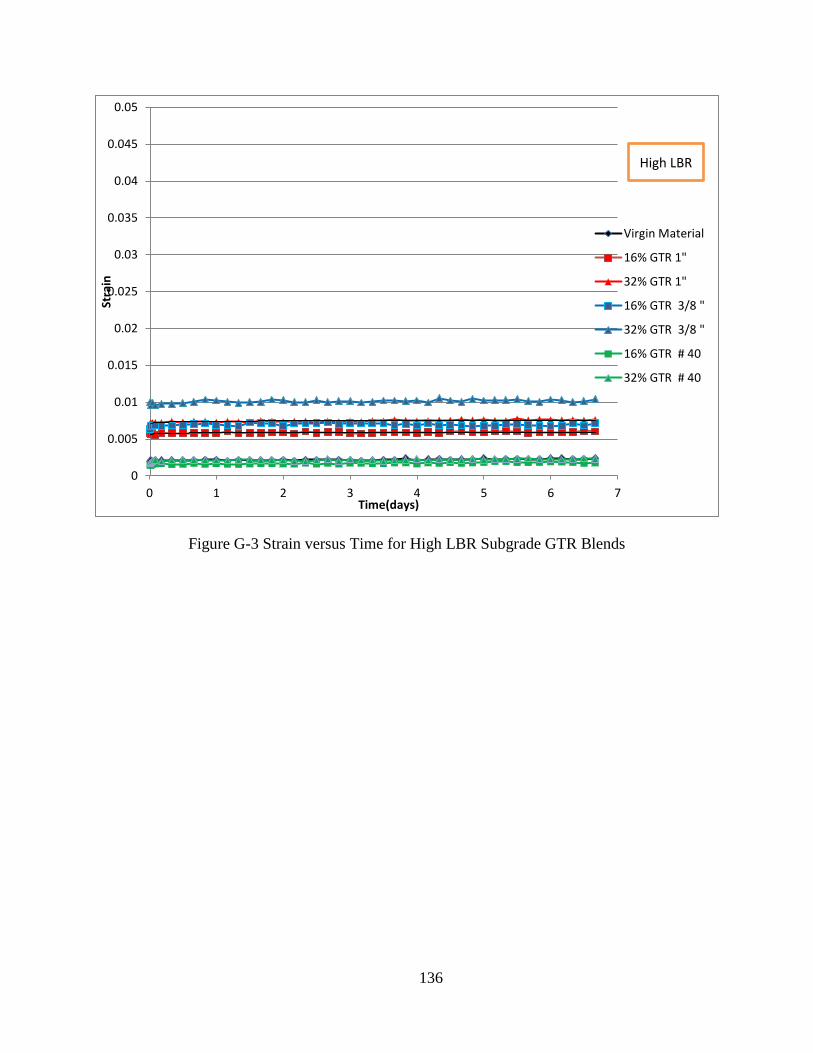
136
Figure G-3 Strain versus Time for High LBR Subgrade GTR Blends
0
0.005
0.01
0.015
0.02
0.025
0.03
0.035
0.04
0.045
0.05
0 1 2 3 4 5 6 7
Stra
in
Time(days)
Virgin Material
16% GTR 1"
32% GTR 1"
16% GTR 3/8 "
32% GTR 3/8 "
16% GTR # 40
32% GTR # 40
High LBR

137
H. Appendix H – Data Retrieval System
Part of this research project included the development of a data management system that
assists in testing management and report generation. This system was developed as a web
application that allows researchers to input data from any computer. This system also allows the
project PIs to view key results and test status at a glance without being burdened with the details
of the testing.
After logging into the system, the user is presented with the followig home screen (Figure
H-1). The User Menu of the left side of the screen is customized listing the projects depending
on the user logged in, showing only their assigned projects.
Figure H-1 Home Screen
If a user wants to create a new project they would click on the projects menu item which
will show a list of all projects that the user is associated with as shown in Figure H-2. The user
would then enter the Project name into the text entry box below the list of projects then click add
project.

138
Figure H-2 Projects Screen
Clicking on the Name of a project from either the User Menu or the Projects Page will
bring the user to a list of tests that have been created for a project, see Figure H-3. This page
shows the key results of given test as well as the status of the test. This page is provided to give
the researchers a overall picture of results and the status of testing for a project. Tests can be
added at the beginning of a project to help manage the progression of a project, and give the
users a visual representation of the testing needed to complete a project.
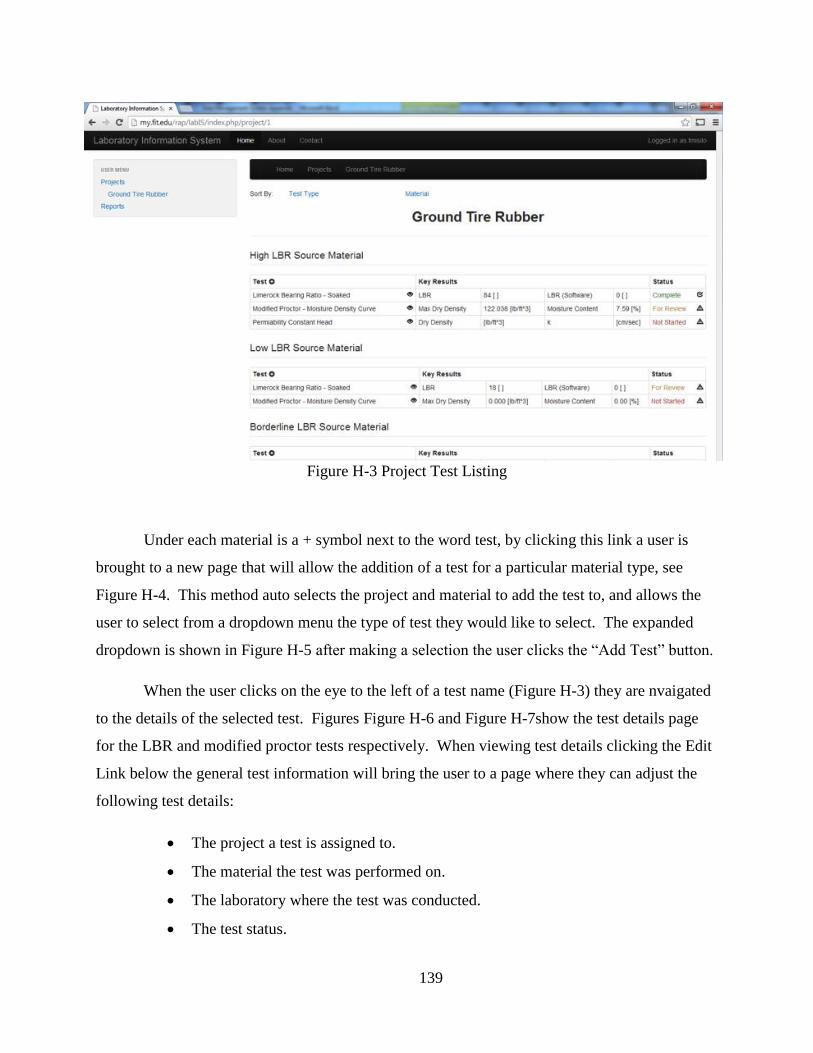
139
Figure H-3 Project Test Listing
Under each material is a + symbol next to the word test, by clicking this link a user is
brought to a new page that will allow the addition of a test for a particular material type, see
Figure H-4. This method auto selects the project and material to add the test to, and allows the
user to select from a dropdown menu the type of test they would like to select. The expanded
dropdown is shown in Figure H-5 after making a selection the user clicks the “Add Test” button.
When the user clicks on the eye to the left of a test name (Figure H-3) they are nvaigated
to the details of the selected test. Figures Figure H-6 and Figure H-7show the test details page
for the LBR and modified proctor tests respectively. When viewing test details clicking the Edit
Link below the general test information will bring the user to a page where they can adjust the
following test details:
The project a test is assigned to.
The material the test was performed on.
The laboratory where the test was conducted.
The test status.
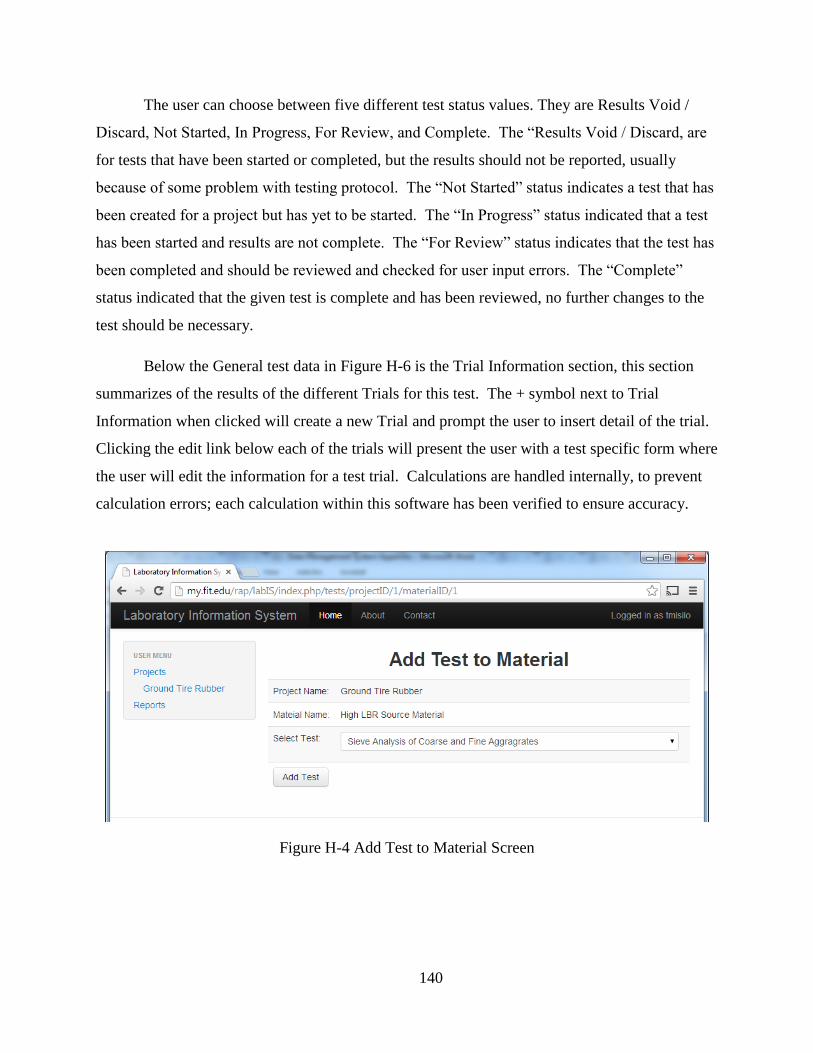
140
The user can choose between five different test status values. They are Results Void /
Discard, Not Started, In Progress, For Review, and Complete. The “Results Void / Discard, are
for tests that have been started or completed, but the results should not be reported, usually
because of some problem with testing protocol. The “Not Started” status indicates a test that has
been created for a project but has yet to be started. The “In Progress” status indicated that a test
has been started and results are not complete. The “For Review” status indicates that the test has
been completed and should be reviewed and checked for user input errors. The “Complete”
status indicated that the given test is complete and has been reviewed, no further changes to the
test should be necessary.
Below the General test data in Figure H-6 is the Trial Information section, this section
summarizes of the results of the different Trials for this test. The + symbol next to Trial
Information when clicked will create a new Trial and prompt the user to insert detail of the trial.
Clicking the edit link below each of the trials will present the user with a test specific form where
the user will edit the information for a test trial. Calculations are handled internally, to prevent
calculation errors; each calculation within this software has been verified to ensure accuracy.
Figure H-4 Add Test to Material Screen
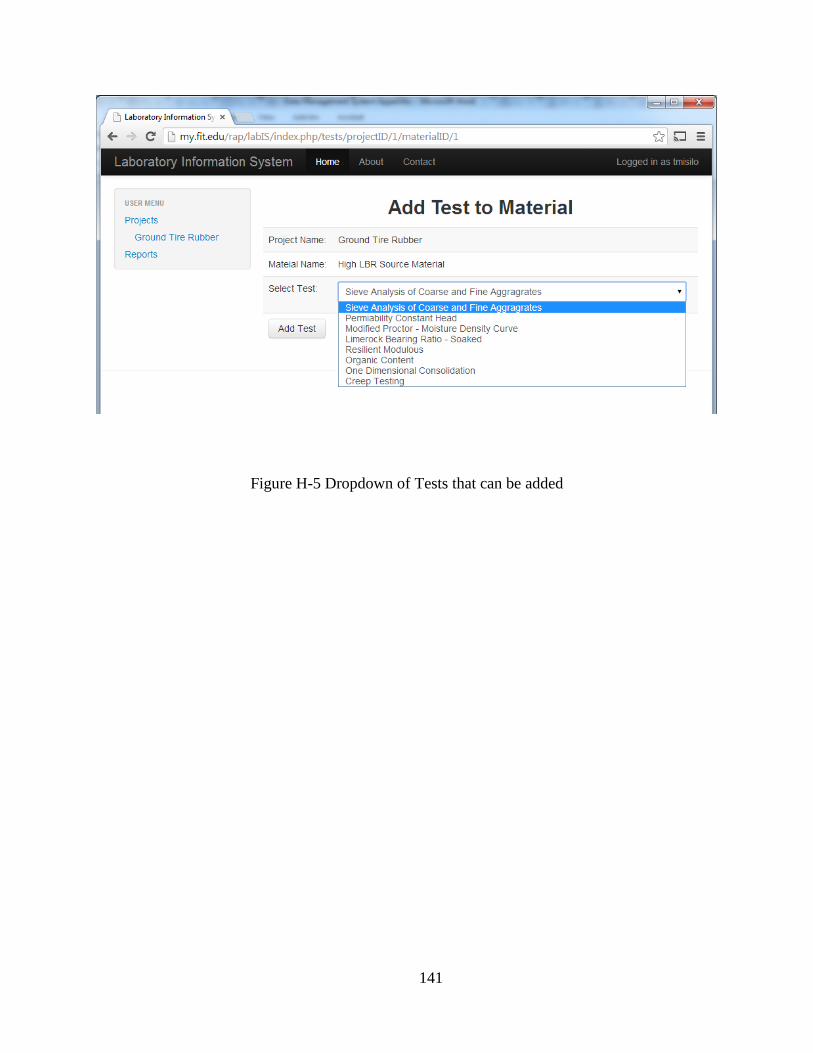
141
Figure H-5 Dropdown of Tests that can be added
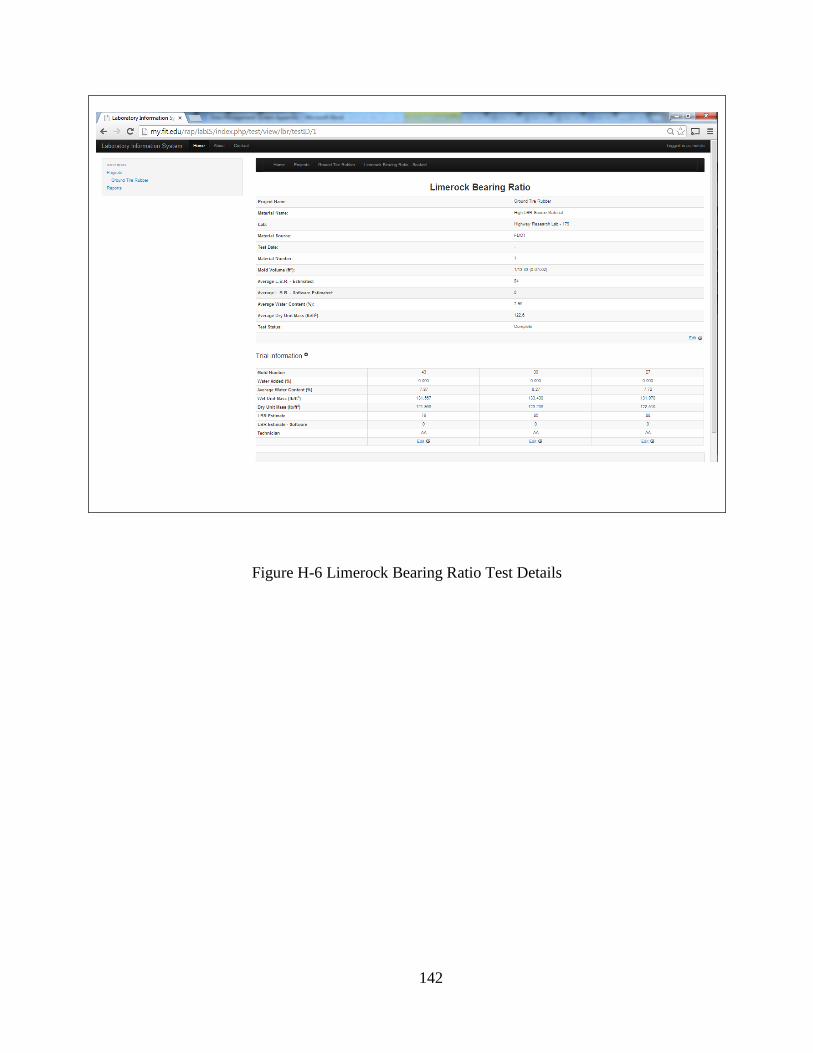
142
Figure H-6 Limerock Bearing Ratio Test Details
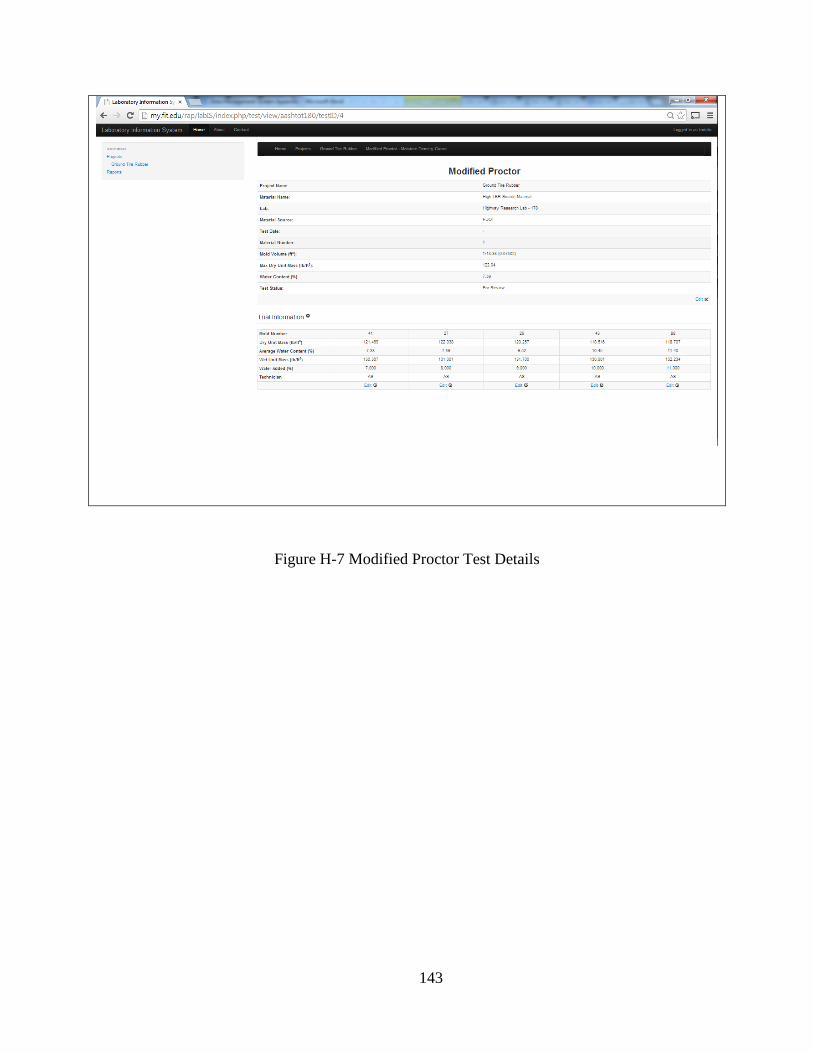
143
Figure H-7 Modified Proctor Test Details
Recommended