United StatesEnvironmental Protection Agency
Groundwater Pump and Treat Systems: Summary ofSelected Cost and Performance Information atSuperfund-financed Sites

Solid Waste and Emergency Response(5102G)
EPA 542-R-01-021bDecember 2001 clu-in.org

i
NOTICE
Work described herein was performed by GeoTrans, Inc. (GeoTrans) for the U.S. EnvironmentalProtection Agency (U.S. EPA) under Dynamac Contract No. 68-C-99-256, Subcontract No. 91517, TaskAD01-117. Mention of trade names or commercial products does not constitute endorsement orrecommendation for use.
This document, with its appendices (EPA 542-01-021b) or without its appendices (EPA 542-01-021a),may be downloaded from EPA’s Clean Up Information (CLUIN) System at http://www.clu-in.org. Alimited number of hard copies of each version are also available free of charge from the National ServiceCenter for Environmental Publications (NSCEP) at the following address:
U.S. EPA National Service Center for Environmental PublicationsP.O. Box 42419Cincinnati, OH 45242-2419Phone: (800) 490-9198 or (513) 489-8190Fax: (513) 489-8695

ii
PREFACE
This report summarizes Phase 1 (the data collection phase) of the Nationwide Fund-lead Pump and Treat Optimization Project. This phase included contacting a project liaison for each of the EPA Regions,identifying the Fund-lead pump-and-treat (P&T) systems in each Region, collecting baseline informationabout each system through a web-based questionnaire or phone interview, and selecting a total of 20Fund-lead systems to receive RSEs. Four of the 20 P&T systems (two in Region 4 and two in Region 5)were previously selected and evaluated as part of a demonstration project completed in 2000.
Data presented in this report reflect estimates provided by site Remedial Project Managers. Theseestimates may, in some cases, vary from actuality. In addition, the data—including the number,
status, and costs of systems—may change over time.

iii
ACKNOWLEDGMENTS
The project team is grateful for the help provided by the EPA Project Liaisons from each Region. Theywere vital in selecting the Fund-lead P&T systems to be evaluated and in facilitating communicationbetween the project team and the Remedial Project Managers (RPMs). The authors also extend sincerethanks to the principal investigators from the U.S. EPA Technology Innovation Office (TIO) and U.S.EPA Office of Emergency and Remedial Response (OERR).

*Net present value reflects the discounted or reduced cost of future expenditures due to interest gained between the present and thetime of the expenditure. A discount rate of 5% is assumed. Please see Section 4.0 for more information on discounting and netpresent value as they apply to the presented costs.
iv
EXECUTIVE SUMMARY
This first phase of the Nationwide Fund-lead Pump and Treat Optimization Project successfullyidentified a total of 88 Fund-lead (EPA-lead and State-lead with Fund money) pump-and-treat (P&T)systems within the Superfund Program. Of the 88 systems identified, 67 are operational and 21 are pre-operational (i.e., the Records of Decisions for the pre-operational systems specify pump-and-treat, butthese systems are in the design stage or some other stage prior to full operation). System identificationwas accomplished through use of online databases and discussions with project liaisons in each Region. The number of Fund-lead P&T systems in a Region ranged from zero in Region 8 to 22 in Region 2.
Remedial Project Managers (RPMs) of the identified systems submitted data and information on theirsystems through a web-based questionnaire. Phone interviews were utilized in a limited number ofcases. A screening methodology using the collected data was applied to prioritize these systems withrespect to potential life-cycle savings resulting from optimization. Based on this screening anddiscussions with the project liaison in each Region, specific systems in each Region were selected toreceive Remediation System Evaluations (RSEs). The RSE process was developed by the United StatesArmy Corps of Engineers (USACE) to evaluate a remediation system and provide recommendations toimprove effectiveness and reduce costs. Including the demonstration optimization project conducted in2000, a total of 20 Fund-lead P&T systems were selected to receive RSEs.
This report identifies the 88 Fund-lead P&T systems, summarizes the information submitted by theRPMs, and presents the screening and selection of those systems to receive RSEs.
Data presented in this report reflect estimates provided by site Remedial Project Managers. Theseestimates may, in some cases, vary from actuality. In addition, the data— including the number,
status, and costs of systems—may change over time.
The following summaries result from the estimated cost data and system projections provided by theRPMs:
• The estimated average annual operation and maintenance (O&M) cost for a Fund-lead P&Tsystem (based on those 79 systems providing cost data) is approximately $570,000 and themedian cost is $350,000. The discrepancy between these two statistics is due to a small numberof systems with relatively high O&M costs.
• Based on the 79 systems that provided cost information, the estimated total annual O&M cost foroperating the Fund-lead P&T systems in 2002 is approximately $38 million, with EPA incurringapproximately $32.5 million of the total annual cost and the associated States incurring theremaining $5.5 million.
• Based on the 79 systems that provided cost information, the estimated future cost for Long-termRemedial Action (LTRA) O&M for all of these systems exceeds $210 million with discounting(i.e., net present value)* and exceeds $270 million without discounting. LTRA refers to the first10 years of operation of a groundwater or surface water restoration action. During this period,

v
EPA typically funds 90% of the cost and the associated State funds 10% of the costs. Thesepercentages translate directly to the presented costs; therefore, the Superfund is expected to payapproximately $189 million ($243 million without discounting) and the States are expected topay approximately $21 million ($27 million without discounting).
• Based on the 79 systems that provided cost information, the estimated future cost for O&M ofFund-lead P&T systems until remediation completion is achieved is approximately $470 millionwith discounting (net-present value) and $790 million without discounting. (These estimates offuture O&M costs are based on the annual costs of systems and expected durations of systems asspecified by the site managers. For some systems where expected system duration is unknown,a value of 30 years may have been used as a default value for this parameter. While the practiceof using 30 years as a default was prevalent in the past, more recent EPA guidance on feasibilitystudy preparation recommends that 30 years not be used as a default.)
• 13 of the 79 systems that provided costs account for approximately 50% of the total reportedannual O&M costs.
A total of 26 States reportedly have Fund-lead P&T systems. Upon completion of the 10-year LTRAperiod each system will be transferred to its associated State and that State will assume 100% of theremaining O&M costs. For systems where restoration is not a goal (i.e., containment and water supplysystems) the systems are typically transferred to the States after one year. The collected data suggest thatthe States will incur between approximately $250 million with discounting or $520 million withoutdiscounting in post-LTRA O&M costs for Fund-lead P&T systems that reported annual O&M costs. Furthermore, the data suggest that the following five States will likely incur 78% of these post-LTRAO&M costs:
• New Jersey (27.6%)
• Massachusetts (22.6%)
• New York (9.7%)
• Pennsylvania (9.6%)
• Michigan (8.4%)
In addition to cost information, the following statistics about the Fund-lead P&T systems were alsogleaned from the information reported by the system RPMs:
• 40 of 67 operating systems are reported to be controlling plume migration.
• 60 of the 67 operating systems have groundwater restoration as a goal but 21 of that 60 do nothave estimates of the progress toward that restoration. Of the 39 systems that have bothgroundwater restoration as a goal and an estimate of progress toward restoration, 7 are estimatedto have made more than 80% progress toward restoration.
• 52 of the 88 systems have three or more primary contaminants of concern, and chlorinatedsolvents are the most prevalent contaminants as they are addressed by 56 of the 88 systems.
• 35 of the 88 Fund-lead P&T systems are associated with sites where non-aqueous phase liquid(NAPL) has either been observed or suspected.

vi
• Carbon adsorption and air stripping are the most prevalent treatment processes (carbonadsorption is used at 50 of the 88 systems and air stripping is used at 41).
• Based on 64 of 88 systems where RPMs were able to determine costs specifically used forgroundwater monitoring, Fund-lead P&T systems have, on average, 23 monitoring wells forgroundwater sampling that are sampled three to four times per year for an average cost of$112,000 per year.
• 36 of the 67 operating systems have previously had performance and effectiveness evaluated andfound “sufficient” while 7 had performance and effectiveness found “not sufficient” (theremaining systems are either being evaluated, have not been evaluated, or have not providedinformation regarding previous effectiveness evaluations).
Although the RSE selection process targeted systems in each Region that had effectiveness problems orrelatively high operating costs, a number of systems with similar issues still remain, and additional RSEsare recommended to address these remaining systems.

vii
TABLE OF CONTENTS
NOTICE . . . . . . . . . . . . . . . . . . . . . . . . . . . . . . . . . . . . . . . . . . . . . . . . . . . . . . . . . . . . . . . . . . . . . . . . . . . . . . . . i
PREFACE . . . . . . . . . . . . . . . . . . . . . . . . . . . . . . . . . . . . . . . . . . . . . . . . . . . . . . . . . . . . . . . . . . . . . . . . . . . . . . ii
ACKNOWLEDGMENTS . . . . . . . . . . . . . . . . . . . . . . . . . . . . . . . . . . . . . . . . . . . . . . . . . . . . . . . . . . . . . . . . . . iii
EXECUTIVE SUMMARY . . . . . . . . . . . . . . . . . . . . . . . . . . . . . . . . . . . . . . . . . . . . . . . . . . . . . . . . . . . . . . . . . iv
TABLE OF CONTENTS . . . . . . . . . . . . . . . . . . . . . . . . . . . . . . . . . . . . . . . . . . . . . . . . . . . . . . . . . . . . . . . . . . vii
LIST OF FIGURES . . . . . . . . . . . . . . . . . . . . . . . . . . . . . . . . . . . . . . . . . . . . . . . . . . . . . . . . . . . . . . . . . . . . . . viii
LIST OF TABLES . . . . . . . . . . . . . . . . . . . . . . . . . . . . . . . . . . . . . . . . . . . . . . . . . . . . . . . . . . . . . . . . . . . . . . . ix
LIST OF APPENDICES . . . . . . . . . . . . . . . . . . . . . . . . . . . . . . . . . . . . . . . . . . . . . . . . . . . . . . . . . . . . . . . . . . . x
1.0 INTRODUCTION . . . . . . . . . . . . . . . . . . . . . . . . . . . . . . . . . . . . . . . . . . . . . . . . . . . . . . . . . . . . . . . . . . . . 11.1 BACKGROUND . . . . . . . . . . . . . . . . . . . . . . . . . . . . . . . . . . . . . . . . . . . . . . . . . . . . . . . . . . . . . 11.2 DEMONSTRATION FUND-LEAD PUMP AND TREAT OPTIMIZATION PROJECT . . . . . . . . . . . . . . . . 11.3 NATIONWIDE FUND-LEAD PUMP AND TREAT OPTIMIZATION PROJECT . . . . . . . . . . . . . . . . . . . . 1
2.0 SYSTEM IDENTIFICATION . . . . . . . . . . . . . . . . . . . . . . . . . . . . . . . . . . . . . . . . . . . . . . . . . . . . . . . . . . . . 3
3.0 DATA COLLECTION . . . . . . . . . . . . . . . . . . . . . . . . . . . . . . . . . . . . . . . . . . . . . . . . . . . . . . . . . . . . . . . . . 6
4.0 SUMMARIES OF COLLECTED DATA . . . . . . . . . . . . . . . . . . . . . . . . . . . . . . . . . . . . . . . . . . . . . . . . . . . 104.1 SUMMARIES OF SYSTEM COSTS AND PROJECTIONS . . . . . . . . . . . . . . . . . . . . . . . . . . . . . . . . . 104.2 SUMMARY OF COST DATA AS IT PERTAINS TO THE STATES . . . . . . . . . . . . . . . . . . . . . . . . . . . 114.3 STATUS AND PROGRESS OF THE FUND-LEAD P&T SYSTEMS . . . . . . . . . . . . . . . . . . . . . . . . . . 134.4 SYSTEM GOALS . . . . . . . . . . . . . . . . . . . . . . . . . . . . . . . . . . . . . . . . . . . . . . . . . . . . . . . . . . . 134.5 CONTAMINANTS OF CONCERN, TREATMENT PROCESSES, AND MONITORING . . . . . . . . . . . . . 134.6 SUMMARY OF PREVIOUS EFFECTIVENESS EVALUATIONS . . . . . . . . . . . . . . . . . . . . . . . . . . . . . 14
5.0 SYSTEM SCREENING AND PRIORITIZATION WITH RESPECT TO OPTIMIZATION POTENTIAL . 43
6.0 SYSTEM SELECTION . . . . . . . . . . . . . . . . . . . . . . . . . . . . . . . . . . . . . . . . . . . . . . . . . . . . . . . . . . . . . . . . 46
7.0 CONCLUSIONS AND LESSONS LEARNED . . . . . . . . . . . . . . . . . . . . . . . . . . . . . . . . . . . . . . . . . . . . . . 59
APPENDICES . . . . . . . . . . . . . . . . . . . . . . . . . . . . . . . . . . . . . . . . . . . . . . . . . . . . . . . . . . . . . . . . . . . . . . . . . . 63

viii
LIST OF FIGURES
Figure 4-1: Trend of Financial Responsibility of Fund-lead P&T SystemsFigure 4-2: Trend of Estimated Annual O&M Costs of Fund-lead P&T SystemsFigure 4-3: Status of Fund-lead P&T SystemsFigure 4-4: Progress of the 67 Operational Fund-lead P&T SystemsFigure 4-5: Treatment Processes at Fund-lead P&T SystemsFigure 6-1: Fund-lead P&T Systems Ranked by “Estimated Potential Life-cycle Savings ($)”Figure 6-2: Fund-lead P&T Systems Ranked by Annual O&M Cost and the Cumulative Distribution of System
Annual O&M Costs

ix
LIST OF TABLES
Table 2-1: Number of Identified Fund-lead P&T Systems in each RegionTable 4-1: Region 1 Fund-lead P&T System Performance and Cost InformationTable 4-2: Region 2 Fund-lead P&T System Performance and Cost InformationTable 4-3: Region 3 Fund-lead P&T System Performance and Cost InformationTable 4-4: Region 4 Fund-lead P&T System Performance and Cost InformationTable 4-5: Region 5 Fund-lead P&T System Performance and Cost InformationTable 4-6: Region 6 Fund-lead P&T System Performance and Cost InformationTable 4-7: Region 7 Fund-lead P&T System Performance and Cost InformationTable 4-8: Region 9 Fund-lead P&T system Performance and Cost InformationTable 4-9: Region 10 Fund-lead P&T system performance and Cost InformationTable 4-10: Future O&M Costs of Fund-lead P&T Systems Expected to be Incurred by each StateTable 4-11: Region 1 Fund-lead P&T System O&M Costs According to StateTable 4-12: Region 2 Fund-lead P&T System O&M Costs According to StateTable 4-13: Region 3 Fund-lead P&T System O&M Costs According to StateTable 4-14: Region 4 Fund-lead P&T System O&M Costs According to StateTable 4-15: Region 5 Fund-lead P&T System O&M Costs According to StateTable 4-16: Region 6 Fund-lead P&T System O&M Costs According to StateTable 4-17: Region 7 Fund-lead P&T System O&M Costs According to StateTable 4-18: Region 9 Fund-lead P&T System O&M Costs According to StateTable 4-19: Region 10 Fund-lead P&T System O&M Costs According to StateTable 4-20: Categories of Contaminants Prevalent at Sites with Fund-lead P&T SystemsTable 5-1: Site-Specific Criteria Used to Calculate the “Estimated Potential Life-cycle Savings (%)” from
Optimization of each of the Identified Fund-lead P&T Systems (Page 1 of 2)Table 6-1: For each Region Systems Selected for RSEs and the “Estimated Potential Life-cycle Savings ($)”
Suggested by Screening AnalysisTable 6-2: Fund-lead P&T Systems Ranked in Terms of “Estimated Potential Life-cycle Savings ($)” as
Calculated by the Screening MethodologyTable 6-3: Fund-lead P&T Systems Ranked According to Annual O&M Cost

x
LIST OF APPENDICES
Appendix A: Information Sheets for each Fund-lead P&T SystemAppendix B: Summary Phase 1 Reports of each RegionAppendix C: Screening Calculations for each Fund-lead P&T System

1
1.0 INTRODUCTION
1.1 BACKGROUND
As part of an overall commitment toward optimization, U.S. Environmental Protection Agency (EPA)Headquarters continually offers resources and support to the EPA Regions to improve their operatingremedies. A large percentage of these remedies are pump-and-treat (P&T) systems designed to restoregroundwater, contain contaminant sources, or supply water. Thus, the EPA Technology InnovationOffice (TIO) and Office of Emergency and Remedial Response (OERR) have commissionedRemediation System Evaluations (RSEs) for Fund-lead P&T systems in each of the EPA Regions in aneffort to optimize their performance.
The Remediation System Evaluation (RSE) concept was developed by the U.S. Army Corps of Engineers(USACE) to improve remedies already in place. An RSE begins with the formation of a team of expertsincluding experienced engineers and hydrogeologists. Once a system has been selected for an RSE, theteam reviews site-related documents, visits the site to tour the facility and interview the site managers,and compiles a report to document findings and any recommendations to improve the remedy. Recommendations typically fall into the following categories:
• recommendations to improve system effectiveness;
• recommendations to reduce operation and maintenance (O&M) costs;
• recommendations for technical improvement; and
• recommendations to gain site close out.
1.2 DEMONSTRATION FUND-LEAD PUMP AND TREAT OPTIMIZATION PROJECT
A demonstration optimization project of Fund-lead pump and treat systems conducted in Regions 4 and5 identified a total of 28 planned or operating pump-and-treat (P&T) systems that are Fund-lead (orstate-lead with Superfund financing). On average, those systems cost approximately $300,000 per yearper site for operations and maintenance (O&M). Extrapolation of these results suggested that 140 suchsystems might exist through the nation at a total estimated O&M cost of $4 million per year. Many ofthese systems are anticipated to operate for decades with costs split between Superfund and theindividual states. For the first 10 years of operation of most Fund-lead sites, the Superfund Programpays for 90% of the O&M costs and the State pays the remaining 10%. The State then assumes 100% ofthe costs incurred after the initial 10 year period.
In addition to identifying the Fund-lead P&T systems, the pilot optimization study also includedRemediation System Evaluations (RSEs) of four P&T systems. These four evaluations resulted in anumber of recommendations to improve effectiveness and/or reduce O&M costs for each of the systems. Thus, the results of this pilot study highlighted the benefits of optimizing Fund-lead systems.
1.3 NATIONWIDE FUND-LEAD PUMP AND TREAT OPTIMIZATION PROJECT
Based in part on the results of the demonstration project described above, OSWER Directive No. 9200.0-33 (Transmittal of Final FY00 - FY01 Superfund Reforms Strategy, dated July 7,2000)

2
http://www.epa.gov/superfund/programs/reforms/docs/strat00.pdf outlined a commitment to optimize theFund-lead P&T systems. To achieve that goal, a Nationwide RSE Optimization Project wascommissioned to accomplish the following tasks:
• identify the Fund-lead P&T systems in each of the EPA Regions;
• gather baseline data and information on these identified systems;
• prioritize the systems in terms of optimization potential;
• select 16 additional systems to receive RSEs;
• conduct these RSEs; and
• follow up with EPA project managers to track and facilitate implementation of resultingrecommendations.
This report summarizes Phase 1 of this project, which entails the first four of these six elements.

3
2.0 SYSTEM IDENTIFICATION
The first step of the project involved determining the number of Fund-lead P&T systems in each EPARegion and identifying key aspects of those systems for assessing optimization potential. For this project,a Fund-lead P&T system must meet the following criteria:
• pump-and-treat (sometimes referred to as groundwater extraction and treatment) must beidentified as a remedy in the Record of Decision (ROD) for the site;
• the system must be either EPA-lead or State-lead with funding from the Superfund Program; and
• the system must be operational or pre-operational (i.e., pre-design, design, being installed, orinstalled but not yet operating). It should be noted that, consistent with the first criteria, “pre-design” refers to systems that have RODs specifying pump and treat but that have not begun thedesign process.
Thus, this project does not include Fund-lead P&T systems that are no longer operating due to a changein remedy or Fund-lead P&T systems that have been fully transferred to States or responsible parties. Insome cases, sites were identified where a P&T system will likely not be installed even though it isspecified in the ROD. Such systems are included as Fund-lead P&T systems in this project unless theROD already has been changed. In addition to systems not meeting the above criteria, Fund-lead well-head treatment systems in Region 9 and a Fund-lead NAPL (non-aqueous phase liquid) extractionsystem in Region 8 were not included in the project.
During the demonstration project in Region 4 and Region 5, it was initially hoped that the Fund-leadP&T systems could be easily identified by an on-line search of the Superfund Hazardous Waste Sites:
http://www.epa.gov/superfund/sites/query/advquery.htm
However, it was quickly determined that no set of search criteria would specifically yield the Fund-leadP&T systems. Therefore, an initial set of sites was developed with the following query:
Category Entry Display Count
Site Name “blank” T
State/Territory/EPA Region Region 1 (example) T
Activity Type Remedial DesignConstruction CompletionRemedial Action
T
Activity Lead EPA Fund-financedState, Fund-financedTribal-lead, Fund-financed
T
Contaminated Media Groundwater T
Site Listing Narrative T
Site Fact Sheet T
Site Cleanup Decision T

4
ROD abstracts for these sites were reviewed and those sites without existing or planned P&T systemswere removed from the list.
During that process it became evident that isolating Fund-lead P&T systems was not straightforward. One complication is that the on-line databases are not completely up-to-date, and some systems that areFund-lead at one point in time become “PRP-lead” once responsible parties are defined and/or consentdecrees are put in place. As a result, the project liaisons for each Region were asked to identify theFund-lead or Fund-financed P&T systems in their Regions, which they typically did by interviewing thebranch chiefs and/or individual Remedial Project Managers (RPMs). The project liaisons were able toquickly remove sites from the initial list because there was no P&T system (existing or planned) orbecause the system was no longer Fund-lead. In some cases, the project liaisons also added systems thatdid not appear on the initial list. In rare cases the on-line databases identified Fund-lead P&T systemsnot identified by the EPA project liaison.
The identified systems are presented in table format in Section 4.0; however, the following tablesummarizes for each Region the number of operational and pre-operational (i.e., pre-design, design,being installed, or installed but not yet operating) Fund-lead P&T systems.

5
Table 2-1: Number of Identified Fund-lead P&T Systems in each Region
Region# of Pre-operational Fund-
lead P&T Systems# of Operational
Fund-lead P&T Systems Total
Region 1 1 7 8
Region 2 4 18 22
Region 3 2 10 12
Region 4 3 7 10
Region 5 3 12 15
Region 6 3 6 9
Region 7 2 1 3
Region 8 0 0 0
Region 9 2 2 4
Region 10 1 4 5
Total 21 67 88
Presented data reflect estimates provided by site Remedial Project Managers between February and May 2001. These estimates may vary from actual values. Data, including the number and status of sites, may change overtime.
Notes:1. Fund-lead refers to systems where oversight is provided by the EPA or by a State with financial support from
Superfund.2. Pump-and-treat (P&T) systems are those systems in which the extraction of groundwater and subsequent treatment is
specified in the Record of Decision (ROD). In this study, systems designed for water supply in Region 9 and a non-aqueous phase liquid (NAPL) extraction system in Region 8 were not included.
3. Pre-operational P&T systems refer to those systems that are pre-design, design, being installed, or installed but not yetoperating. The systems must have RODs specifying P&T.
4. Operational P&T systems are those that currently are operating or have operated and are shutdown temporarily.5. The demonstration project yielded 14 operational and 4 pre-operational P&T systems for Region 5. Information
collected during the nationwide effort determined that site enforcement had changed for three sites in Region 5. Theabove chart reflects the updated information.

6
3.0 DATA COLLECTION
Once the Fund-lead P&T systems were identified, a web-based questionnaire, accessed from the EPA-TIO webpage, was completed for each system by the EPA or State project manager for the associatedsite. The questionnaire required responses to the following items or questions.
1. Site or system name, location, and CERCLIS number
2. Name and contact information of the individual that completed the questionnaire
3. Is the site Fund-lead (or State-lead and financed by Superfund) with a ROD and a P&T system that currently exists or is planned?
Explanation: If the answer to this question is “no”, then the system is no longer consideredfor this project.
4. EPA Remedial Project Manager (RPM) name and contact information
5. State Manager or Regulator name and contact information
6. Contractor name and contact information
7. Site lead or management (EPA/Fund-lead or State-lead financed by Superfund)
8. The date the Record of Decision (ROD) for the remedy was signed
9. The date of most recent ROD modification, if any
10. Type of ROD (for an interim remedy or for a final remedy)
11. Status of P&T system Explanation: One of the following responses could be selected:
• pre-design• design• designed/not installed• being installed• installed• operational• completed
It should be noted that a system classified as “pre-design” must have a ROD that specifies P&T. In addition, for the purposes of data analysis, “pre-operational” refers to those classifications inthe above list that precede operational.
12. Primary goal of the P&T system Explanation: One of the following responses could be selected:
• restoration • containment• both restoration and containment• water supply
7
13. Primary contaminants of concern
14. Presence or absence of contamination as a non-aqueous phase liquid (NAPL)
15. Approximate annual O&M costsExplanation: This is an approximate (i.e., plus or minus 25%) value of annual O&M costs($/yr) including monitoring and analysis costs. Typical components of annual O&M costsinclude labor, electricity, materials, discharge fees, analytical costs, consulting costs, etc.
16. Portion of that cost used for monitoringExplanation: Of the approximate annual O&M cost ($/yr), this cost is the portion costsassociated with long-term groundwater monitoring of the aquifer (labor associated withsample collection and data reduction, analytical costs, etc.). It should not include processmonitoring of the above-ground treatment components, or monitoring associated withdischarge of treated water.
17. An approximate representative pumping rate in gallons per minute (gpm)
18. Number of extraction wells (not including injection wells, drains, or trenches)
19. The date (month and year) when construction of the systems was completed
20. The date (month and year) when the system became operational and functional
21. The date (month and year) when the system is expected to be transitioned to the StateExplanation: For Fund-lead remedies of surface or groundwater where restoration is thegoal, EPA typically manages the site and funds 90% of the cost (versus 10% from the State)for the first 10 years after the site becomes operational and functional. This period isknown as a Long-term Remedial Action (LTRA). After this 10-year period the site is fullytransitioned to the State, and the State is responsible for site management and 100% of thefunding.
22. The date (month and year) the remedial action is expected to be completeExplanation: This estimate for system shut-off date is subject to great uncertainty. Anestimate of 30 years from the date the system became operational and functional is oftenused for financial reasons and may not represent operational projections. Other estimatesmay be taken directly from the Record of Decision (ROD), and given that a ROD is writtenbefore operation of a system, this estimate may not reflect operation data.
23. Approximate amount of system downtime per yearExplanation: The estimated number of weeks per year that the system does not operate asanticipated.

8
24. Types of above-ground treatment processesExplanation: This item includes above-ground treatment processes only. It does notinclude in-situ processes. One or more of the following processes could be selected.
metals precipitation filtration
air stripping ion exchange
biological treatment reverse osmosis
UV oxidation off-gas treatment
carbon adsorption other/not sure
25. Number of groundwater monitoring wells regularly monitored
26. Frequency of groundwater monitoring (i.e., annually, semi-annually, quarterly, etc.)
27. Assessment of plume migration controlExplanation: Based on current information, if any portion of the plume is continuing tomigrate beyond the current plume extent in a manner that is of concern, the answer is YES.If plume is migration is currently controlled, the answer is NO. If current information is notadequate to make this determination, the answer is DON'T KNOW. If plume migrationbeyond the current plume extent is not a concern, the answer is CONTROLLING PLUMEMIGRATION IS NOT A GOAL OF THIS SYSTEM.
28. Progress toward cleanupExplanation: The purpose of this item is to determine if the progress regarding plumerestoration, in terms of plume area reduction, is known, and if so, how much progress interms plume area reduction has been achieved. Note this question is not asking about massremoval, but instead is asking about plume area. One of the following descriptions could bechosen:
• A small portion (e.g., less than 20%) of the original plume area has been restored torequired cleanup levels.
• A “significant” portion of the original plume area (e.g., more than about 20%) hasbeen restored to required cleanup levels.
• Most of the original plume area (e.g., more than about 80%) has been restored torequired cleanup levels.
• Don’t know• Aquifer restoration is not a goal of this system.
29. Result of previous (if any) evaluations of performance and effectivenessExplanation: According to the Comprehensive Environmental Response, Compensation,and Liability Act (CERCLA) and the National Contingency Plan (NCP), a 5-year reviewmust be conducted for all remedial actions that do not allow unlimited use and unrestrictedexposure. The purpose of these reviews is to ensure that the remedies are protective ofhuman health and the environment and therefore include a statement regarding theeffectiveness and performance of the system. This item refers to 5-year reviews or othersuch evaluations but does not refer to the RSEs conducted as part of this project. One ofthree choices could be selected in response to this item:

9
• Performance/effectiveness has not been adequately evaluated.• Performance/effectiveness has been evaluated, and is not sufficient.• Performance/effectiveness is sufficient, further evaluation should be prioritized
based on potential cost savings that maintain equivalent effectiveness.
30. Degree of difficulty (socially or politically) in implementing recommendationsExplanation: Answers to this item could range from “little difficulty expected for minor ormajor changes” to “severe difficulty expected for minor or major changes”.
31. Other comments
In cases where RPMs had technical difficulty with the questionnaire, information was gathered via aphone interview with the RPM or the State project manager. In addition, phone interviews were usedfor this nationwide project to confirm or update the information gathered during the demonstrationproject from RPMs in Regions 4 and 5. Information sheets with the information and data for eachsystem are provided as Appendix A. Summary information and data for each Region were provided inthe form of Region-specific summary reports, which are included as Appendix B.

10
4.0 SUMMARIES OF COLLECTED DATA
A note on discounting (net present value) as it applies to the reported estimates of future costs
Because funds not spent at present can be invested a rate that exceeds inflation, current funds can yieldadditional money for future expenditures thereby making present-day dollars worth more than futuredollars. As a result, future costs are often discounted and reported in net present value (NPV).
The net present value of a series of annual future costs with discounting in all but the first year isdetermined with the following relationship:
Cc
DNPVA
ii
n
=+ −
=∑ ( )1 1
1
where:
CNPV = NPV of all of the annual costs incurred between the present and n years from the present cA = annual costs incurred each year between the present and n years from the present D = discount rate (e.g., use 0.05 for 5%)
The actual discount rate (D) is a function of inflation, investment rates, and other opportunity costsassociated with present and future value of money. Complications in calculating net-present value caninclude formulation of the discount rate with or without inflation, variation in the discount rate overtime, and a change in annual costs over time. A full explanation of the discount rate is beyond the scopeof this document. The reader is referred to the following references for a detailed explanation.
• Damodaran, Aswath, 1994. Damodaran on Valuation, John Wiley & Sons.
• Ross, Stephen A., Randolf W. Westerfield, and Bradford D. Jordan, 1995. Fundamentals ofCorporate Finance, 3rd edition, Irwin Publishing.
For the future cost estimates discussed herein, a discount rate of 5% is applied and assumed constant.
4.1 SUMMARIES OF SYSTEM COSTS AND PROJECTIONS
Tables 4-1 through 4-9 present the following summary information for each Region (except Region 8,which had no Fund-lead P&T systems):
• the result of previous evaluations with respect to performance and effectiveness (see item 29 inSection 3.0);
• the estimated time remaining in the LTRA period (see item 21 in Section 3.0);
• the estimated time remaining until remediation is complete (see item 22 in Section 3.0);
• the annual O&M cost for each system (see item 15 in Section 3.0);
• the expected future cost (in net present value) to be incurred by Superfund for LTRA O&M;

11
• the expected future cost (in net present value) of O&M remaining to be incurred untilremediation is complete; and
• the systems selected for RSEs in bold.
In these tables, net-present value is calculated with a 5% discount rate, with no discounting in the firstyear. Compiling information from Table 4-1 through Table 4-9 yields the following results regardingsystem O&M costs:
• The estimated average annual O&M cost of a system (based on the 79 systems providing costdata) is approximately $570,000 and the median is $350,000. This discrepancy is due to a smallnumber of systems with relatively high O&M costs.
• The estimated total annual O&M cost for operating the Fund-lead P&T systems in 2002 isapproximately $38 million, with EPA incurring approximately $32.5 million of the total annualcost and the associated States incurring the remaining $5.5 million.
• The estimated future cost for LTRA O&M at all of these systems exceeds $210 million withdiscounting (i.e., net present value) and exceeds $270 million without discounting. For eachsystem, Superfund is expected to pay 90% of the O&M cost and the associated State is expectedto pay 10%. These percentages translate directly to the presented costs; therefore, the Superfundis expected to pay approximately $189 million ($243 million without discounting) and the Statesare expected to pay $21 million ($27 million without discounting).
• The estimated future cost to reach remediation completion for all Fund-lead P&T systems isapproximately $470 million with discounting (i.e., net present value) and $790 million withoutdiscounting. (These estimates of future O&M costs are based on the annual costs of systems andexpected durations of systems as specified by the site managers. For some systems whereexpected system duration is unknown, a value of 30 years may have been used as a default valuefor this parameter. While the practice of using 30 years as a default was prevalent in the past,more recent EPA guidance on feasibility study preparation recommends that 30 years not beused as a default.)
4.2 SUMMARY OF COST DATA AS IT PERTAINS TO THE STATES
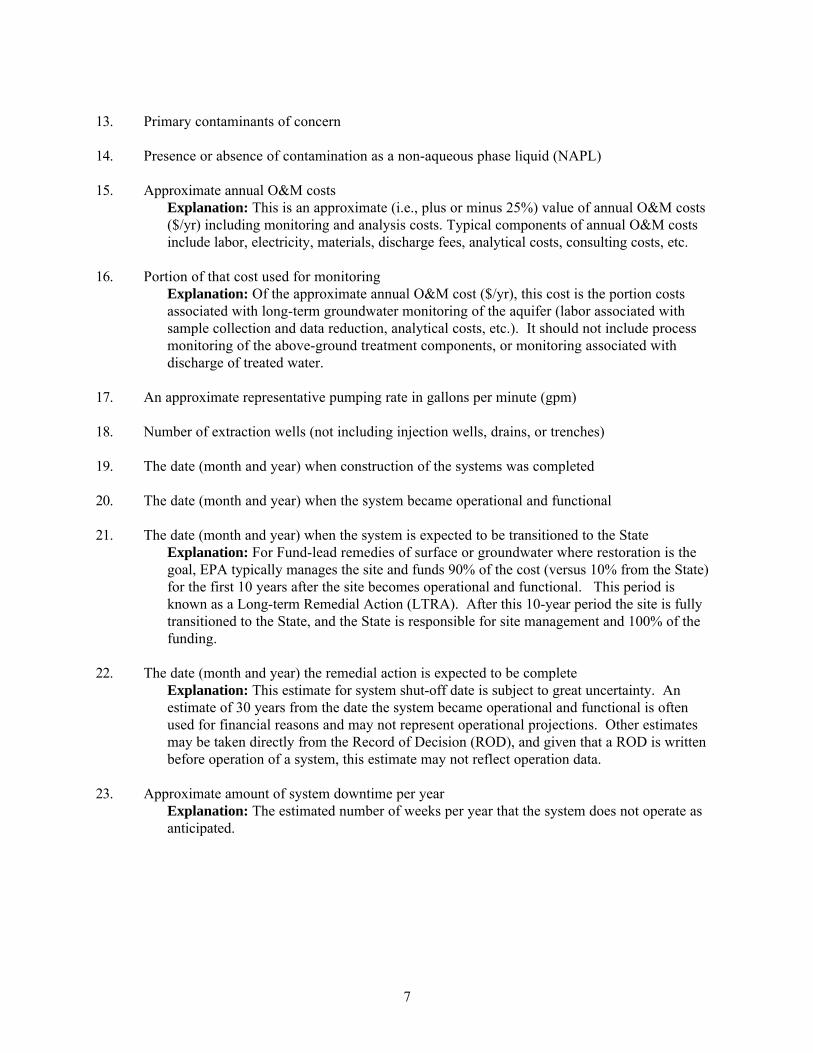
Assuming no viable parties are found for these 88 Fund-lead P&T systems, the States will eventuallyassume both management and funding responsibility for the systems. Figures 4-1 and 4-2 showprojected trends of agency financial responsibility and annual costs from 2001 through 2015. Thesetrends are best estimates based on the data provided by the site RPMs. Furthermore, because the actualO&M costs and site enforcement may change with time, these projected trends may also change.
Figure 4-1 shows two projected trends between 2001 and 2015 for 78 Fund-lead P&T systems (the 10systems with unknown costs or transition dates are excluded). The first trend is the number of Fund-leadP&T systems funded 90% by EPA and 10% by the States. The second trend is the number of Fund-leadP&T systems that are the full responsibility of the States. When counting the number of systems for aparticular year, if the system transfer from the EPA to the State occurs before July, then the system iscounted as a State system. If the system transfer from EPA to the State occurs after July, then the systemis counted as an EPA system.
Figure 4-2 also shows two trends between 2001 and 2015 for the same 78 systems. The first trend is the

12
total annual cost of Fund-lead P&T systems assumed by the EPA. This cost is 90% of the O&M costs ofthe Fund-lead P&T systems. The second trend is the total annual cost of Fund-lead systems assumed bythe States. This cost is 10% of the O&M costs of Fund-lead P&T systems before transition to the Stateand 100% of the cost subsequent to the transition. When calculating the costs of systems for a particularyear, if the system transfer from the EPA to the State occurs before July, then the State assumes the costfor that year. If the system transfer from EPA to the State occurs after July, then the EPA assumes thecost for that year.
Table 4-10 provides a list of the States that currently have operational or pre-operational Fund-lead P&Tsystems. It also provides the number of Fund-lead P&T systems in each State and the expected futurecosts (based on the estimates provided) each State is likely to incur from future O&M of these systems. These future costs are provided both with discounting (net present value) and without discounting. Discounted costs assume a 5% discount rate with no discounting in the first year. The expected futurecosts are calculated based on the following information:
• the current annual O&M estimates for each system (see item 15 in Section 3.0);
• the estimated date of transition to the State (see item 21 in Section 3.0); and
• the estimated date the remedy will be complete (see item 22 in Section 3.0).
An analysis of the data in Table 4-10 shows that a total of 26 States currently have operational or pre-operational Fund-lead P&T systems. The estimated total post-LTRA O&M costs expected to be incurredby all of the States ranges from approximately $250 million with discounting to $520 million withoutdiscounting. Approximately 78% of these costs, however, will be incurred by the following five theStates:
• New Jersey (27.6%)
• Massachusetts (22.6%)
• New York (9.7%)
• Pennsylvania (9.6%)
• Michigan (8.4%)
It should be noted that the expected future costs to be incurred by the States are only estimates and aresubject to variation. This variation may result from a number of reasons:
• the estimated annual O&M costs will likely change in the future;
• the estimated dates, especially the dates the remedies are expected to be complete, may varysignificantly from the actual dates;
• the expected future costs do not include the cost of aquifer monitoring subsequent to remedycompletion. Additional Fund-lead P&T systems may arise in the future and eventually betransitioned to the States; and
• the responsible parties at some of the current Fund-lead P&T systems may assume the financialburden for their systems.

13
The Fund-lead P&T systems in each Region and the associated costs are listed according to State inTable 4-11 through Table 4-19. For each system, the table provides the date of transition to the State, theestimated annual O&M cost, and the expected future O&M cost (with and without discounting) to beassumed by the State.
4.3 STATUS AND PROGRESS OF THE FUND-LEAD P&T SYSTEMS
The collected data can be used to categorize the 88 Fund-lead P&T systems according to their statusand/or progress. The status may range from the “pre-design” to “operational” as described in item 11 ofSection 3.0, and the progress of systems with restoration as a goal may range from less than 20%progress toward restoration to more than 80% progress toward restoration as described in item 28 inSection 3.0.
Figure 4-3 groups the 88 Fund-lead systems according to their status (i.e., pre-design, design,designed/not installed, being installed, installed but not operational, or operational). Of the 88 systems,67 are operational systems. As shown in Figure 4-4, 60 of the 67 operating systems are reported to havegroundwater restoration as a goal, but 21 of that 60 do not have estimates of the progress toward thatrestoration. Of the 39 systems that have both groundwater restoration as a goal and an estimate ofprogress toward restoration, 20 are estimated to have made less than 20% progress toward restorationand 7 are estimated to have made more than 80% progress toward restoration. The remaining 12systems are estimated to have made between 20% and 80% progress toward restoration. Those systemsthat report less than 20% restoration have operated, on average, for approximately 4 years. Thosesystems that report 20% to 80% restoration have operated, on average, for approximately 6 years. Finally, those systems that report more than 80% restoration have operated, on average, for 7 years.
In addition to progress toward restoration, the submitted information (not shown in a figure) indicatethat 40 of the 67 operating systems are reportedly controlling migration of the plume.
4.4 SYSTEM GOALS
The majority of the systems have aquifer restoration specified in the ROD as a remedy objective. Duringdata collection for this project, the remedy goal was not ascertained for two systems. Of the remainingsystems, one has public water supply as a goal (restoration may also be a goal) and seven havecontainment as the only goal. Aquifer restoration is the primary goal for 22 of the systems and 56 of thesystems have both containment and restoration as primary goals.
4.5 CONTAMINANTS OF CONCERN, TREATMENT PROCESSES, AND MONITORING
The collected data show that more than three contaminants of concern are identified for 52 of the 88Fund-lead P&T systems. The prevalence of certain categories of contaminants, as identified by thesystem RPMs, are highlighted in Table 4-20. Chlorinated solvents such as tetrachlorethylene (PCE)represent the most prevalent contaminant category identified by RPMs with this contaminant categoryaddressed by 56 of the 88 systems.
Non-aqueous phase liquids (NAPLs) (see item 14 in Section 3.0), if present in the subsurface, will act ascontinuing sources of some contaminants. The collected data indicate that 35 of the 88 Fund-lead P&Tsystems are associated with sites where NAPL has either been observed or is suspected. The collecteddata also indicate that 38 of the Fund-lead P&T systems are associated with sites where NAPL is notpresent. The presence of NAPL at sites for the remaining 15 systems is not known.

14
Many of the P&T systems use multiple treatment processes to remove these contaminants from theextracted water. Of the 88 systems, 32 are reported to have three or more treatment processes. Figure 4-5 shows the number of systems that use each of the 10 treatment processes (see item 24 in Section 3.0). Carbon adsorption and air stripping are the most prevalent treatment processes. These two statisticscorrelate with the prevalence of chlorinated solvents as identified contaminants of concern, becausethese two treatment processes are commonly used to address those contaminants.
The collected data include the number of monitoring wells, the frequency of monitoring, and costsassociated with monitoring (see items 25, 26, and 16 in Section 3.0). As identified in the collected data,the number of monitoring wells associated with a Fund-lead P&T system ranges from 3 to 80 with anaverage of approximately 23 wells per system (based on 79 of 88 systems where RPMs provided non-zero responses). The minimum sampling frequency (other than no sampling) is once per year whereasthe maximum sampling frequency is once per week. On average, monitoring wells at the Fund-leadP&T systems are sampled between 3 and 4 times per year, and on average there are more than 80samples of groundwater collected per Fund-lead P&T system in a year. As identified by the RPM,monitoring costs range from as little as $5,000 per year to as much as $800,000 per year with an averageof approximately $112,000 per year (based on 64 of 88 systems where RPMs were able to determinecosts specifically used for groundwater monitoring).
4.6 SUMMARY OF PREVIOUS EFFECTIVENESS EVALUATIONS
According to the Comprehensive Environmental Response, Compensation, and Liability Act (CERCLA)and the National Contingency Plan (NCP), a 5-year review must be conducted for all remedial actionsthat do not allow unlimited use and unrestricted exposure. The purpose of these 5-year reviews is toensure that the remedies are protective of human health and the environment. They therefore include astatement regarding the effectiveness and performance of the system. Tables 4-1 through 4-9 providethe results of 5-year reviews or other such evaluations, if they have been conducted, at each site. Itshould be emphasized that these are not the results of RSEs conducted as part of this project. They arethe findings from 5-year reviews or similar evaluations that were conducted at these sites prior to thisNationwide Optimization Project and reported by the RPM as part of this survey. The following pointssummarize these results.
• 36 of the 67 operating systems are reported to have had performance and effectiveness evaluatedand found to be sufficient;
• 7 of the 67 operating systems are reported to have had performance and effectiveness evaluatedand found to be not sufficient;
• 22 of the 67 operating systems reportedly are either currently being evaluated or have not beenevaluated with respect to effectiveness; and
• the evaluation status of two of the systems was not determined.
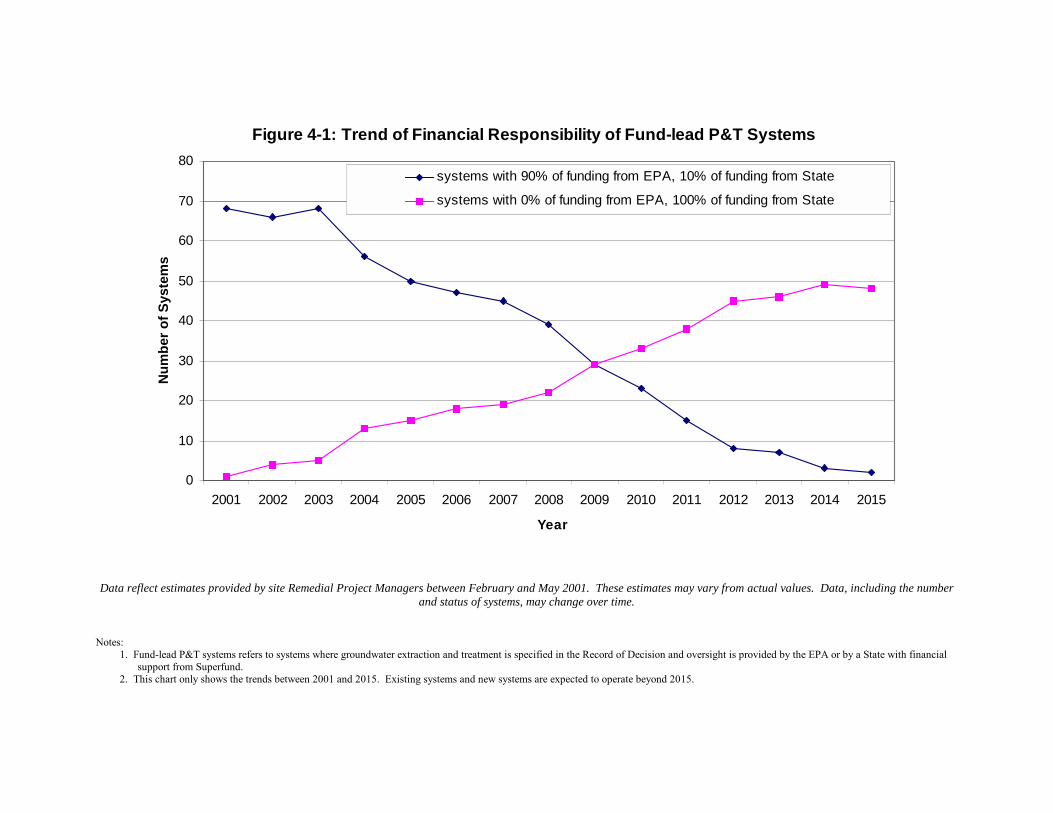
Figure 4-1: Trend of Financial Responsibility of Fund-lead P&T Systems
0
10
20
30
40
50
60
70
80
2001 2002 2003 2004 2005 2006 2007 2008 2009 2010 2011 2012 2013 2014 2015
Year
Nu
mb
er o
f S
yste
ms
systems with 90% of funding from EPA, 10% of funding from State
systems with 0% of funding from EPA, 100% of funding from State
Data reflect estimates provided by site Remedial Project Managers between February and May 2001. These estimates may vary from actual values. Data, including the numberand status of systems, may change over time.
Notes:1. Fund-lead P&T systems refers to systems where groundwater extraction and treatment is specified in the Record of Decision and oversight is provided by the EPA or by a State with financial
support from Superfund.2. This chart only shows the trends between 2001 and 2015. Existing systems and new systems are expected to operate beyond 2015.

Figure 4-2: Trend of Estimated Annual O&M Costs of Fund-lead P&T Systems
$0
$5,000,000
$10,000,000
$15,000,000
$20,000,000
$25,000,000
$30,000,000
$35,000,000
$40,000,000
2001 2002 2003 2004 2005 2006 2007 2008 2009 2010 2011 2012 2013 2014 2015
Year
To
tal A
nn
ual
O&
M C
ost
sO&M cost paid by EPA
O&M cost paid by States
Data reflect estimates provided by site Remedial Project Managers between February and May 2001. These estimates may vary from actual values. Data, including the numberand status of systems, may change over time.
Notes:1. Fund-lead P&T systems refers to systems where groundwater extraction and treatment is specified in the Record of Decision and oversight is provided by the EPA or by a State with financial
support from Superfund.2. Annual O&M costs are estimates and include such components as labor, utilities, materials, analytical costs, etc.3. This chart only shows the trends between 2001 and 2015. Existing systems and new systems are expected to operate beyond 2015.

Figure 4-3: Status of Fund-lead P&T Systems
0
10
20
30
40
50
60
70
Pre
-des
ign
Des
ign
Des
igne
d/N
otIn
stal
led
Bei
ng In
stal
led
Inst
alle
d bu
tno
t ope
ratio
nal
Ope
ratio
nal
Nu
mb
er o
f S
yste
ms
Data reflect estimates provided by site Remedial Project Managers between February and May 2001. These estimates may vary from actual values. Data, including the numberand status of systems, may change over time.
Notes:1. Fund-lead P&T systems are those systems where groundwater extraction and treatment is specified in the Record of Decision and oversight is provided by the EPA or by a State with financial
support from Superfund.2. Pre-designed Fund-lead P&T systems refer to those systems that have P&T specified in the Record of Decision but are not yet in the design stage.

Figure 4-4: Progress of the 67 Operational Fund-lead P&T Systems
0
5
10
15
20
25
Less
than
20%
rest
ored
20-8
0%re
stor
ed
Mor
e th
an 8
0%re
stor
ed
No
estim
ate
ofpr
ogre
sspr
ovid
ed
Gro
undw
ater
rest
orat
ion
not
a go
al
Nu
mb
er o
f S
yste
ms
Data reflect estimates provided by site Remedial Project Managers between February and May 2001. These estimates may vary from actual values. Data, including the numberand status of systems, may change over time.
Notes:1. Fund-lead P&T systems are those systems where groundwater extraction and treatment is specified in the Record of Decision and oversight is provided by the EPA or by a State with financial
support from Superfund.

Figure 4-5: Distribution of Treatment Processes at Fund-lead P&T Systems
0
10
20
30
40
50
60
Car
bon
adso
rptio
n
Air
strip
ping
Filt
ratio
n
Met
als
prec
ipita
tion
Oth
er/n
ot s
ure
Off-
gas
trea
tmen
t
Bio
logi
cal
trea
tmen
t
Ion
exch
ange
UV
oxi
datio
n
Rev
erse
osm
osis
Nu
mb
er o
f S
yste
ms
Data reflect information provided by site Remedial Project Managers between February and May 2001. This information—including the number of systems, system status, andtypes of treatment processes—may change over time.
Notes:1. Fund-lead P&T systems are those systems where groundwater extraction and treatment is specified in the Record of Decision and oversight is provided by the EPA or by a State with financial
support from Superfund.2. Individual systems may have multiple treatment processes.3. The treatment processes listed correspond to those shown in item 24 of Section 3.0.

20
Table 4-1: Region 1 Fund-lead P&T System Performance and Cost Information
SitePerformance &
Effectiveness
EstimatedRemaining
Time inLTRA(yrs)
EstimatedDuration
(yrs)
Annual O&M($/yr)
ExpectedRemaining
Cost forLTRAO&M
ExpectedTotal
RemainingO&M Cost
Operational Systems
Baird andMcGuire
Sufficient 2.25 21.3 $3,500K $7.6M $47.5M
Charles GeorgeLandfill
Not Evaluated 7.7 26.7 $450K $3.0M $6.9M
Groveland Wells Sufficient 9.3 29.3 $500K $3.8M $8.0M
KearsargeMetallurgical
Sufficient 1.7 3.7 $250K $0.4M $0.9M
Keefe Sufficient 1.7 1.7 $200K $0.3M $0.3M
Savage Well Not Evaluated 7.2 7.2 $500K $3.1M $3.1M
SilresimChemical
Not Sufficient 5.7 15.9 $1,400K $7.1M $15.9M
Pre-operational Systems
Eastern Surplus Not Evaluated 9.7 5.7 $200K $1.0M $1.0M
Total $7.0M $26.3M $83.6MData reflect estimates provided by site Remedial Project Managers between February and May 2001. These estimates mayvary from actual values. Data, including the number and status of systems, may change over time.
Notes:1. Fund-lead P&T systems: systems where pump and treat (groundwater extraction and treatment) is specified in the Record of Decision
and oversight is provided by the EPA or by a State with financial support from Superfund.2. Systems that appear in bold were selected for Remediation System Evaluations (RSEs).3. Descriptions of “Performance and Effectiveness” refer to results of previous evaluations such as the 5-year reviews and not from
RSEs conducted as part of this project.4. Long-term Remedial Action (LTRA): the first 10 years of operation and function of a Superfund restoration action for surface or
groundwater. Operation and maintenance costs of the remedy are 90% funded by Superfund and 10% funded by the associated Stateduring this time period. Thereafter, 100% of the costs are assumed by the States.
5. “Estimated Time Remaining in LTRA” and “Expected Duration” are calculated by determining the number of years between January 1,2002 and time frame estimates provided by the site Remedial Project Managers. For some systems where the expected systemduration is unknown, a value of 30 years may have been used as a default and may underestimate the expected duration of systems,especially those located at sites with continuing sources of groundwater contamination such as LNAPL and DNAPL.
6. Reported annual O&M costs are estimates and include such components as labor, utilities, materials, analytical costs, etc.7. Expected costs are shown in net present value, calculated with a 5% discount rate with no discounting in the first year.8. For Eastern Surplus, collected data indicate that remedy completion is expected prior to the end of LTRA. Expected remaining costs
for Superfund do not exceed the expected total remaining costs.

21
Table 4-2: Region 2 Fund-lead P&T System Performance and Cost Information (Page 1 of 3)
SitePerformance &
Effectiveness
EstimatedRemaining
Time inLTRA(yrs)
EstimatedDuration
(yrs)
Annual O&M($/yr)
ExpectedRemaining
Cost forLTRAO&M
ExpectedTotal
RemainingO&M Cost
Operational Systems
AmericanThermostat
Sufficient 6.8 26.7 $1,175K $6.9M $18.0M
Bog Creek Sufficient 2.7 22.9 $460K $1.2M $6.5M
Brewster WellField
Not Evaluated 5.8 5.8 $400K $2.1M $2.1M
Circuitron Sufficient 8.4 1.4 $480K $0.7M $0.7M
ClaremontPolychemical
Not Evaluated 8.1 18.1 $740K $5.1M $9.1M
Combe Fill South Not Sufficient 6.7 26.7 $920K $5.4M $14.1M
Garden StateCleaners
Not Evaluated 7.8 27.8 $500K $3.3M $7.8M
Higgins Farm Not Evaluated 7.0 26.7 $1,000K $6.1M $15.3M
Islip MunicipalLandfill
Sufficient 4.7 1.0 $225K $0.2M $0.2M
Lang Property Sufficient 3.75 2.75 $700K $1.9M $1.9MData reflect estimates provided by site Remedial Project Managers between February and May 2001. These estimates mayvary from actual values. Data, including the number and status of systems, may change over time.
Notes:1. Fund-lead P&T systems: systems where pump and treat (groundwater extraction and treatment) is specified in the Record of Decision
and oversight is provided by the EPA or by a State with financial support from Superfund.2. Systems that appear in bold were selected for Remediation System Evaluations (RSEs).3. Descriptions of “Performance and Effectiveness” refer to results of previous evaluations such as the 5-year reviews and not from
RSEs conducted as part of this project.4. Long-term Remedial Action (LTRA): the first 10 years of operation and function of a Superfund restoration action for surface or
groundwater. Operation and maintenance costs of the remedy are 90% funded by Superfund and 10% funded by the associated Stateduring this time period. Thereafter, 100% of the costs are assumed by the States.
5. “Estimated Time Remaining in LTRA” and “Expected Duration” are calculated by determining the number of years between January 1,2002 and time frame estimates provided by the site Remedial Project Managers. For some systems where the expected systemduration is unknown, a value of 30 years may have been used as a default and may underestimate the expected duration of systems,especially those located at sites with continuing sources of groundwater contamination such as LNAPL and DNAPL.
6. Reported annual O&M costs are estimates and include such components as labor, utilities, materials, analytical costs, etc.7. Expected costs are shown in net present value, calculated with a 5% discount rate with no discounting in the first year.8. For Circuitron, Islip Municipal Landfill, Lang Property, and SMS Instruments, collected data indicate that remedy completion is
expected prior to the end of LTRA. Expected remaining costs for Superfund do not exceed the expected total remaining costs.9. The Army Corps of Engineers conducted an RSE of Lipari Landfill prior to this project.10. The “Estimated Time Remaining in LTRA” exceeds 10 years for Lipari Landfill because this remedy is part of a source control
action.

22
Table 4-2: Region 2 Fund-lead P&T System Performance and Cost Information (Page 2 of 3)
SitePerformance &
Effectiveness
EstimatedRemaining
Time inLTRA(yrs)
EstimatedDuration
(yrs)
Annual O&M($/yr)
ExpectedRemaining
Cost forLTRAO&M
ExpectedTotal
RemainingO&M Cost
Operational Systems (continued)
Lipari Landfill Sufficient 17.8 2.9 $2,500K $7.0M $7.0M
MattiacePetrochemical
Sufficient 7.2 27.6 $700K $4.3M $10.9M
Mohonk Road Not Evaluated 9.5 29.5 Unknown Unknown Unknown
SMS Instruments Sufficient 3.4 2.2 $400K $1.3M $0.8M
Syncon Resins Not Sufficient 0.0 26.7 $350K $0.0M $5.4M
Vestal WaterSupply
Sufficient 3.2 13.2 $180K $0.5M $1.8M
VinelandChemical
Not Evaluated 9.4 29.4 $4,000K $30.9M $64.0M
Williams Property Sufficient 0.0 0.0 $350K $0.0M $0.0MData reflect estimates provided by site Remedial Project Managers between February and May 2001. These estimates mayvary from actual values. Data, including the number and status of systems, may change over time.
Notes:1. Fund-lead P&T systems: systems where pump and treat (groundwater extraction and treatment) is specified in the Record of Decision
and oversight is provided by the EPA or by a State with financial support from Superfund.2. Systems that appear in bold were selected for Remediation System Evaluations (RSEs).3. Descriptions of “Performance and Effectiveness” refer to results of previous evaluations such as the 5-year reviews and not from
RSEs conducted as part of this project.4. Long-term Remedial Action (LTRA): the first 10 years of operation and function of a Superfund restoration action for surface or
groundwater. Operation and maintenance costs of the remedy are 90% funded by Superfund and 10% funded by the associated Stateduring this time period. Thereafter, 100% of the costs are assumed by the States.
5. “Estimated Time Remaining in LTRA” and “Expected Duration” are calculated by determining the number of years between January 1,2002 and time frame estimates provided by the site Remedial Project Managers. For some systems where the expected systemduration is unknown, a value of 30 years may have been used as a default and may underestimate the expected duration of systems,especially those located at sites with continuing sources of groundwater contamination such as LNAPL and DNAPL.
6. Reported annual O&M costs are estimates and include such components as labor, utilities, materials, analytical costs, etc.7. Expected costs are shown in net present value, calculated with a 5% discount rate with no discounting in the first year.8. For Circuitron, Islip Municipal Landfill, Lang Property, and SMS Instruments, collected data indicate that remedy completion is
expected prior to the end of LTRA. Expected remaining costs for Superfund do not exceed the expected total remaining costs.9. The Army Corps of Engineers conducted an RSE of Lipari Landfill prior to this project.10. The “Estimated Time Remaining in LTRA” exceeds 10 years for Lipari Landfill because this remedy is part of a source control
action.
23
Table 4-2: Region 2 Fund-lead P&T System Performance and Cost Information (Page 3 of 3)
Site
Performance&
Effectiveness
EstimatedRemaining
Time inLTRA(yrs)
EstimatedDuration
(yrs)
Annual O&M($/yr)
ExpectedRemaining
Cost forLTRAO&M
ExpectedTotal
RemainingO&M Cost
Pre-operational Systems
Dover MunicipalWell 4
Not Evaluated 10.0 Unknown Unknown Unknown Unknown
MetalTEC/Aerosystems
Not Evaluated Unknown Unknown Unknown Unknown Unknown
MontgomeryTownship/RockyHill
Not Evaluated 10.0 30.0 $400K $2.6M $5.8M
Stanton Cleaners Not Evaluated 9.7 19.7 $270K $2.1M $3.5M
Total >$17.5M >$81.1M >$174.9MData reflect estimates provided by site Remedial Project Managers between February and May 2001. These estimates mayvary from actual values. Data, including the number and status of systems, may change over time.
Notes:1. Fund-lead P&T systems: systems where pump and treat (groundwater extraction and treatment) is specified in the Record of Decision
and oversight is provided by the EPA or by a State with financial support from Superfund.2. Systems that appear in bold were selected for Remediation System Evaluations (RSEs).3. Descriptions of “Performance and Effectiveness” refer to results of previous evaluations such as the 5-year reviews and not from
RSEs conducted as part of this project.4. Long-term Remedial Action (LTRA): the first 10 years of operation and function of a Superfund restoration action for surface or
groundwater. Operation and maintenance costs of the remedy are 90% funded by Superfund and 10% funded by the associated Stateduring this time period. Thereafter, 100% of the costs are assumed by the States.
5. “Estimated Time Remaining in LTRA” and “Expected Duration” are calculated by determining the number of years between January 1,2002 and time frame estimates provided by the site Remedial Project Managers. For some systems where the expected systemduration is unknown, a value of 30 years may have been used as a default and may underestimate the expected duration of systems,especially those located at sites with continuing sources of groundwater contamination such as LNAPL and DNAPL.
6. Reported annual O&M costs are estimates and include such components as labor, utilities, materials, analytical costs, etc.7. Expected costs are shown in net present value, calculated with a 5% discount rate with no discounting in the first year.8. For Circuitron, Islip Municipal Landfill, Lang Property, and SMS Instruments, collected data indicate that remedy completion is
expected prior to the end of LTRA. Expected remaining costs for Superfund do not exceed the expected total remaining costs.9. The Army Corps of Engineers conducted an RSE of Lipari Landfill prior to this project.10. The “Estimated Time Remaining in LTRA” exceeds 10 years for Lipari Landfill because this remedy is part of a source control
action.
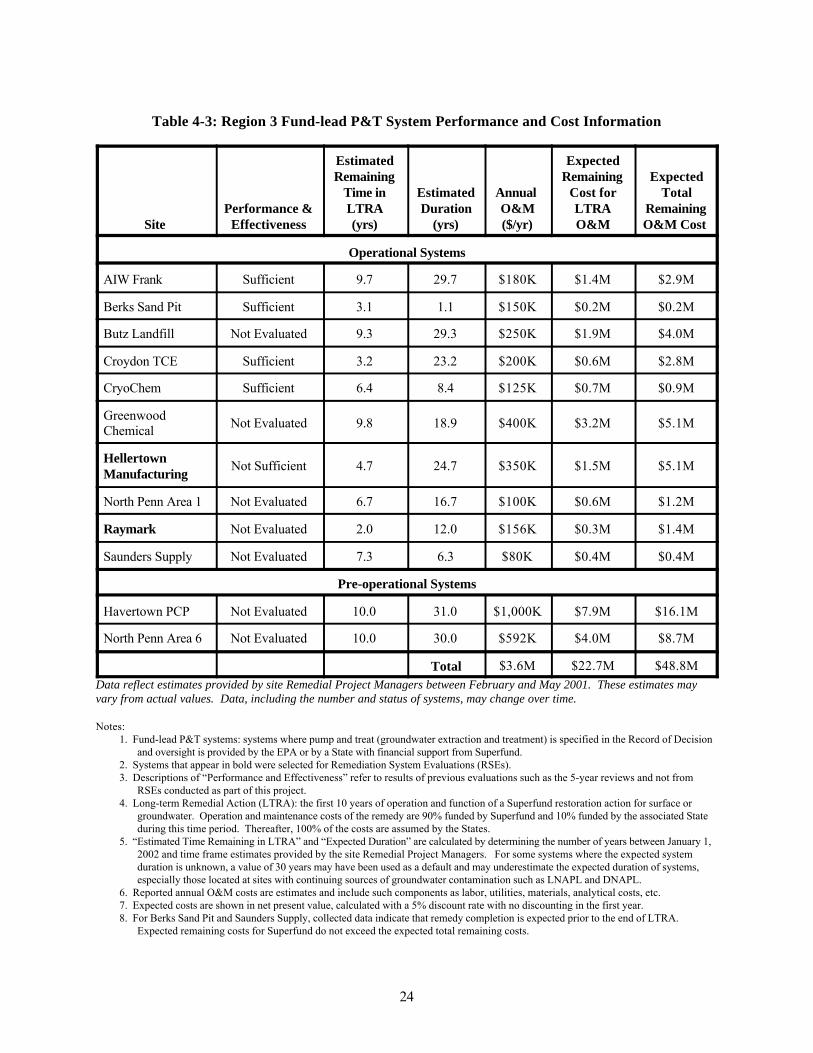
24
Table 4-3: Region 3 Fund-lead P&T System Performance and Cost Information
SitePerformance &
Effectiveness
EstimatedRemaining
Time inLTRA(yrs)
EstimatedDuration
(yrs)
Annual O&M($/yr)
ExpectedRemaining
Cost forLTRAO&M
ExpectedTotal
RemainingO&M Cost
Operational Systems
AIW Frank Sufficient 9.7 29.7 $180K $1.4M $2.9M
Berks Sand Pit Sufficient 3.1 1.1 $150K $0.2M $0.2M
Butz Landfill Not Evaluated 9.3 29.3 $250K $1.9M $4.0M
Croydon TCE Sufficient 3.2 23.2 $200K $0.6M $2.8M
CryoChem Sufficient 6.4 8.4 $125K $0.7M $0.9M
GreenwoodChemical
Not Evaluated 9.8 18.9 $400K $3.2M $5.1M
HellertownManufacturing
Not Sufficient 4.7 24.7 $350K $1.5M $5.1M
North Penn Area 1 Not Evaluated 6.7 16.7 $100K $0.6M $1.2M
Raymark Not Evaluated 2.0 12.0 $156K $0.3M $1.4M
Saunders Supply Not Evaluated 7.3 6.3 $80K $0.4M $0.4M
Pre-operational Systems
Havertown PCP Not Evaluated 10.0 31.0 $1,000K $7.9M $16.1M
North Penn Area 6 Not Evaluated 10.0 30.0 $592K $4.0M $8.7M
Total $3.6M $22.7M $48.8MData reflect estimates provided by site Remedial Project Managers between February and May 2001. These estimates mayvary from actual values. Data, including the number and status of systems, may change over time.
Notes:1. Fund-lead P&T systems: systems where pump and treat (groundwater extraction and treatment) is specified in the Record of Decision
and oversight is provided by the EPA or by a State with financial support from Superfund.2. Systems that appear in bold were selected for Remediation System Evaluations (RSEs).3. Descriptions of “Performance and Effectiveness” refer to results of previous evaluations such as the 5-year reviews and not from
RSEs conducted as part of this project.4. Long-term Remedial Action (LTRA): the first 10 years of operation and function of a Superfund restoration action for surface or
groundwater. Operation and maintenance costs of the remedy are 90% funded by Superfund and 10% funded by the associated Stateduring this time period. Thereafter, 100% of the costs are assumed by the States.
5. “Estimated Time Remaining in LTRA” and “Expected Duration” are calculated by determining the number of years between January 1,2002 and time frame estimates provided by the site Remedial Project Managers. For some systems where the expected systemduration is unknown, a value of 30 years may have been used as a default and may underestimate the expected duration of systems,especially those located at sites with continuing sources of groundwater contamination such as LNAPL and DNAPL.
6. Reported annual O&M costs are estimates and include such components as labor, utilities, materials, analytical costs, etc.7. Expected costs are shown in net present value, calculated with a 5% discount rate with no discounting in the first year.8. For Berks Sand Pit and Saunders Supply, collected data indicate that remedy completion is expected prior to the end of LTRA.
Expected remaining costs for Superfund do not exceed the expected total remaining costs.

25
Table 4-4: Region 4 Fund-lead P&T System Performance and Cost Information
Site
Performance&
Effectiveness
EstimatedRemaining
Time inLTRA(yrs)
EstimatedDuration
(yrs)
Annual O&M($/yr)
ExpectedRemaining
Cost forLTRAO&M
ExpectedTotal
RemainingO&M Cost
Operational Systems
ABC Cleaners Unknown Unknown Unknown Unknown Unknown Unknown
American CreosoteWorks (DNAPL)
Not Evaluated 1.3 1.3 $300K $0.4M $0.4M
Benfield Industries Not Evaluated 9.3 19.3 $30K $0.2M $0.4M
Elmore WasteDisposal
Sufficient 6.7 16.7 $180K $1.1M $2.1M
FCX Statesville Sufficient 6.3 6.3 $150K $0.8M $0.8M
Miami Drum Unknown 0.7 Unknown $1,000K $0.7M Unknown
Palmetto Wood Sufficient 6.3 6.3 $300K $1.7M $1.7M
Pre-operational Systems
American CreosoteWorks (solute)
Not Evaluated 10.0 5.0 $452K $0.9M $0.9M
Cape Fear WoodPreserving
Not Evaluated 9.8 7.3 $40K $0.2M $0.2M
Coleman EvansWood Preserving
Not Evaluated Unknown Unknown Unknown Unknown Unknown
Total >$2.5M >$6.0M $7.2MData reflect estimates provided by site Remedial Project Managers between February and May 2001. These estimates mayvary from actual values. Data, including the number and status of systems, may change over time.
Notes:1. Fund-lead P&T systems: systems where pump and treat (groundwater extraction and treatment) is specified in the Record of Decision
and oversight is provided by the EPA or by a State with financial support from Superfund.2. Systems that appear in bold were selected for Remediation System Evaluations (RSEs).3. Descriptions of “Performance and Effectiveness” refer to results of previous evaluations such as the 5-year reviews and not from
RSEs conducted as part of this project.4. Long-term Remedial Action (LTRA): the first 10 years of operation and function of a Superfund restoration action for surface or
groundwater. Operation and maintenance costs of the remedy are 90% funded by Superfund and 10% funded by the associated Stateduring this time period. Thereafter, 100% of the costs are assumed by the States.
5. “Estimated Time Remaining in LTRA” and “Expected Duration” are calculated by determining the number of years between January 1,2002 and time frame estimates provided by the site Remedial Project Managers. For some systems where the expected systemduration is unknown, a value of 30 years may have been used as a default and may underestimate the expected duration of systems,especially those located at sites with continuing sources of groundwater contamination such as LNAPL and DNAPL.
6. Reported annual O&M costs are estimates and include such components as labor, utilities, materials, analytical costs, etc.7. Expected costs are shown in net present value, calculated with a 5% discount rate with no discounting in the first year.8. For American Creosote Works (solute) and Cape Fear Wood Preserving, collected data indicate that remedy completion is expected
by the end of LTRA. Expected remaining costs for Superfund do not exceed the expected total remaining costs.9. The sum of the “Total Expected Remaining Costs” includes the LTRA cost for Miami Drum as it is expected that O&M will continue
beyond LTRA.

26
Table 4-5: Region 5 Fund-lead P&T System Performance and Cost Information (Page 1 of 2)
SitePerformance &
Effectiveness
EstimatedRemaining
Time inLTRA(yrs)
EstimatedDuration
(yrs)
Annual O&M($/yr)
ExpectedRemaining
Cost forLTRAO&M
ExpectedTotal
RemainingO&M Cost
Operational Systems
ArrowheadRefinery
Sufficient 1.5 2.2 $70K $0.1M $0.2M
Better Brite Sufficient 4.4 28.3 $36K $0.1M $0.6M
Eau Claire Sufficient Unknown Unknown $175K Unknown Unknown
La Salle Sufficient 2.2 3.2 $230K $0.5M $0.7M
Long Prairie Not Evaluated 5.8 13.8 $300K $1.5M $3.1M
MacGillis &Gibbs
Not Evaluated 7.8 27.8 $300K $2.0M $4.7M
Oconomowoc Sufficient 4.7 24.7 $471K $2.0M $6.9M
Onalaska Sufficient 2.4 0.5 $200K $0.1M $0.1M
Ott/Story Not Evaluated 8.6 28.6 $2,400K $17.2M $37.9M
U.S. Aviex Sufficient 1.7 1.7 $300K $0.5M $0.5M
Verona Well Field Not Evaluated 4.4 Indefinite $225K $0.9M Indefinite
Wash King Not Evaluated 9.3 19.3 $75K $0.6M $1.0MData reflect estimates provided by site Remedial Project Managers between February and May 2001. These estimates mayvary from actual value. Data, including the number and status of systems, may change over time.
Notes:1. Fund-lead P&T systems: systems where pump and treat (groundwater extraction and treatment) is specified in the Record of Decision
and oversight is provided by the EPA or by a State with financial support from Superfund.2. Systems that appear in bold were selected for Remediation System Evaluations (RSEs).3. Descriptions of “Performance and Effectiveness” refer to results of previous evaluations such as the 5-year reviews and not from
RSEs conducted as part of this project.4. Long-term Remedial Action (LTRA): the first 10 years of operation and function of a Superfund restoration action for surface or
groundwater. Operation and maintenance costs of the remedy are 90% funded by Superfund and 10% funded by the associated Stateduring this time period. Thereafter, 100% of the costs are assumed by the States.
5. “Estimated Time Remaining in LTRA” and “Expected Duration” are calculated by determining the number of years between January 1,2002 and time frame estimates provided by the site Remedial Project Managers. For some systems where the expected systemduration is unknown, a value of 30 years may have been used as a default and may underestimate the expected duration of systems,especially those located at sites with continuing sources of groundwater contamination such as LNAPL and DNAPL.
6. Reported annual O&M costs are estimates and include such components as labor, utilities, materials, analytical costs, etc.7. Expected costs are shown in net present value, calculated with a 5% discount rate with no discounting in the first year.8. For Onalaska, collected data indicate that remedy completion is expected prior to the end of LTRA. Expected remaining costs for
Superfund do not exceed the expected total remaining costs.9. The sum of “Total Expected Remaining Cost” includes the LTRA cost for Verona Well Field as it is expected that O&M will continue
at this system beyond LTRA.

27
Table 4-5: Region 5 Fund-lead P&T System Performance and Cost Information (Page 2 of 2)
SitePerformance &
Effectiveness
EstimatedRemaining
Time inLTRA(yrs)
EstimatedDuration
(yrs)
Annual O&M($/yr)
ExpectedRemaining
Cost forLTRAO&M
ExpectedTotal
Remaining O&M Cost
Pre-operational Systems
Douglass Road Not Evaluated 8.7 28.3 $120K $0.9M $1.9M
Duell and Gardner Not Evaluated 9.5 5.5 Unknow Unknown Unknown
Peerless Plating Sufficient Unknown Unknown $400K Unknown Unknown
Total >$5.3M >$26.4M >$58.5MData reflect estimates provided by site Remedial Project Managers between February and May 2001. These estimates mayvary from actual values. Data, including the number and status of systems, may change over time.
Notes:1. Fund-lead P&T systems: systems where pump and treat (groundwater extraction and treatment) is specified in the Record of Decision
and oversight is provided by the EPA or by a State with financial support from Superfund.2. Systems that appear in bold were selected for Remediation System Evaluations (RSEs).3. Descriptions of “Performance and Effectiveness” refer to results of previous evaluations such as the 5-year reviews and not from
RSEs conducted as part of this project.4. Long-term Remedial Action (LTRA): the first 10 years of operation and function of a Superfund restoration action for surface or
groundwater. Operation and maintenance costs of the remedy are 90% funded by Superfund and 10% funded by the associated Stateduring this time period. Thereafter, 100% of the costs are assumed by the States.
5. “Estimated Time Remaining in LTRA” and “Expected Duration” are calculated by determining the number of years between January 1,2002 and time frame estimates provided by the site Remedial Project Managers. For some systems where the expected systemduration is unknown, a value of 30 years may have been used as a default and may underestimate the expected duration of systems,especially those located at sites with continuing sources of groundwater contamination such as LNAPL and DNAPL.
6. Reported annual O&M costs are estimates and include such components as labor, utilities, materials, analytical costs, etc.7. Expected costs are shown in net present value, calculated with a 5% discount rate with no discounting in the first year.8. For Onalaska, collected data indicate that remedy completion is expected prior to the end of LTRA. Expected remaining costs for
Superfund do not exceed the expected total remaining costs.9. The sum of “Total Expected Remaining Cost” includes the LTRA cost for Verona Well Field as it is expected that O&M will continue
at this system beyond LTRA.

28
Table 4-6: Region 6 Fund-lead P&T System Performance and Cost Information
SitePerformance &
Effectiveness
EstimatedRemaining
Time inLTRA(yrs)
EstimatedDuration
(yrs)
Annual O&M($/yr)
ExpectedRemaining
Cost forLTRAO&M
ExpectedTotal
RemainingO&M Cost
Operational Systems
AmericanCreosote Works
Sufficient 25.1 25.1 $360K $5.3M $5.3M
Bayou Bonfouca Sufficient 1.5 19.5 $402K $0.6M $5.1M
Cimarron Mining Not Sufficient 2.8 Indefinite $1,000K $2.6M Indefinite
Geneva Industries Sufficient 2.0 2.0 $240K $0.5M $0.5M
MidlandProducts
Sufficient 2.0 32.0 $180K $0.4M $3.0M
OdessaChromium #1
Sufficient 0.0 0.0 $500K $0M $0M
Pre-operational Systems
City of PerrytonWell #2
Not Evaluated 10.0 20.0 $37K $0.2M $0.4M
North Cavalcade Not Evaluated 0.0 5.0 Unknown Unknown Unknown
Sprague Road Not Evaluated 10.0 25.2 $1,200K $7.8M $15.8M
Total >$3.9M >$17.4M >$32.7MData reflect estimates provided by site Remedial Project Managers between February and May 2001. These estimates mayvary from actual values. Data, including the number and status of systems, may change over time.
Notes:1. Fund-lead P&T systems: systems where groundwater extraction and treatment is specified in the Record of Decision and oversight is
provided by the EPA or by a State with financial support from Superfund.2. Systems that appear in bold were selected for Remediation System Evaluations (RSEs).3. Descriptions of “Performance and Effectiveness” refer to results from previous evaluations such as 5-year reviews and not from RSEs
conducted as part of this project.4. LTRA refers to Long-term Remedial Action, the first 10 years of operation and function of a Superfund restoration action for surface
or groundwater. Operation and maintenance costs of the remedy are 90% funded by Superfund and 10% funded by the associated Stateduring this time period. Thereafter, 100% of the costs are assumed by the States.
5. “Estimated Time Remaining in LTRA” and “Expected Duration” are calculated by determining the number of years between January 1,2002 and time frame estimates provided by the site Remedial Project Managers. For some systems where the expected systemduration is unknown, a value of 30 years may have been used as a default and may underestimate the expected duration of systems,especially those located at sites with continuing sources of groundwater contamination such as LNAPL and DNAPL.
6. Annual O&M costs are estimates and include such components as labor, utilities, materials, analytical costs, etc.7. Expected costs are presented in net present value, calculated with a 5% discount rate with no discounting in the first year.8. The sum of “Total Expected Remaining Cost” includes the LTRA cost for Cimarron Mining as it is expected that O&M will continue
at this system beyond LTRA.9. The “Estimated Time Remaining in LTRA” exceeds 10 years for American Creosote Works because this remedy is part of a source
control action.

29
Table 4-7: Region 7 Fund-lead P&T System Performance and Cost Information
SitePerformance &
Effectiveness
EstimatedRemaining
Time inLTRA(yrs)
EstimatedDuration
(yrs)
Annual O&M($/yr)
ExpectedRemaining
Cost forLTRAO&M
ExpectedTotal
RemainingO&M Cost
Operational Systems
Cleburn StreetWell Site/OU2
Not Evaluated 7.9 17.9 $100K $0.7M $1.2M
Pre-operational Systems
Ace Services Not Evaluated 10.0 12.1 $500K $3.2M $3.8M
Valley ParkTCE/OU2
Not Evaluated 0.0 10.0 Unknown Unknown Unknown
Total >$0.6M >$3.9M >$5.0MData reflect estimates provided by site Remedial Project Managers between February and May 2001. These estimates mayvary from actual values. Data, including the number and status of systems, may change over time.
Notes:1. Fund-lead P&T systems: systems where groundwater extraction and treatment is specified in the Record of Decision and oversight is
provided by the EPA or by a State with financial support from Superfund.2. Systems that appear in bold were selected for Remediation System Evaluations (RSEs).3. Descriptions of “Performance and Effectiveness” refer to results from previous evaluations such as 5-year reviews and not from RSEs
conducted as part of this project.4. LTRA refers to Long-term Remedial Action, the first 10 years of operation and function of a Superfund restoration action for surface
or groundwater. Operation and maintenance costs of the remedy are 90% funded by Superfund and 10% funded by the associated Stateduring this time period. Thereafter, 100% of the costs are assumed by the States.
5. “Estimated Time Remaining in LTRA” and “Expected Duration” are calculated by determining the number of years between January 1,2002 and time frame estimates provided by the site Remedial Project Managers. For some systems where the expected systemduration is unknown, a value of 30 years may have been used as a default and may underestimate the expected duration of systems,especially those located at sites with continuing sources of groundwater contamination such as LNAPL and DNAPL.
6. Annual O&M costs are estimates and include such components as labor, utilities, materials, analytical costs, etc.7. Expected costs are presented in net present value, calculated with a 5% discount rate with no discounting in the first year.

30
Table 4-8: Region 9 Fund-lead P&T System Performance and Cost Information
SitePerformance &
Effectiveness
EstimatedRemaining
Time inLTRA(yrs)
EstimatedDuration
(yrs)
Annual O&M($/yr)
ExpectedRemaining
Cost forLTRAO&M
ExpectedTotal
RemainingO&M Cost
Operational Systems
Newmark Not Evaluated 6.8 26.8 $900K $5.3M $13.8M
Selma TreatingCo.
Sufficient 6.8 6.8 $300K $1.8M $1.8M
Pre-operational Systems
Modesto Not Evaluated 10.0 20.0 $300K $2.3M $3.8M
Muscoy Not Evaluated 10.0 20.0 $1,100K $6.0M $11.5M
Total $2.6M $15.4M $30.9MData reflect estimates provided by site Remedial Project Managers between February and May 2001. These estimates mayvary from actual values. Data, including the number and status of systems, may change over time.
Notes:1. Fund-lead P&T systems: systems where groundwater extraction and treatment is specified in the Record of Decision and oversight is
provided by the EPA or by a State with financial support from Superfund.2. Systems that appear in bold were selected for Remediation System Evaluations (RSEs).3. Descriptions of “Performance and Effectiveness” refer to results from previous evaluations such as 5-year reviews and not from RSEs
conducted as part of this project.4. LTRA refers to Long-term Remedial Action, the first 10 years of operation and function of a Superfund restoration action for surface
or groundwater. Operation and maintenance costs of the remedy are 90% funded by Superfund and 10% funded by the associated Stateduring this time period. Thereafter, 100% of the costs are assumed by the States.
5. “Estimated Time Remaining in LTRA” and “Expected Duration” are calculated by determining the number of years between January 1,2002 and time frame estimates provided by the site Remedial Project Managers. For some systems where the expected systemduration is unknown, a value of 30 years may have been used as a default and may underestimate the expected duration of systems,especially those located at sites with continuing sources of groundwater contamination such as LNAPL and DNAPL.
6. Annual O&M costs are estimates and include such components as labor, utilities, materials, analytical costs, etc.7. Expected costs are presented in net present value, calculated with a 5% discount rate with no discounting in the first year.
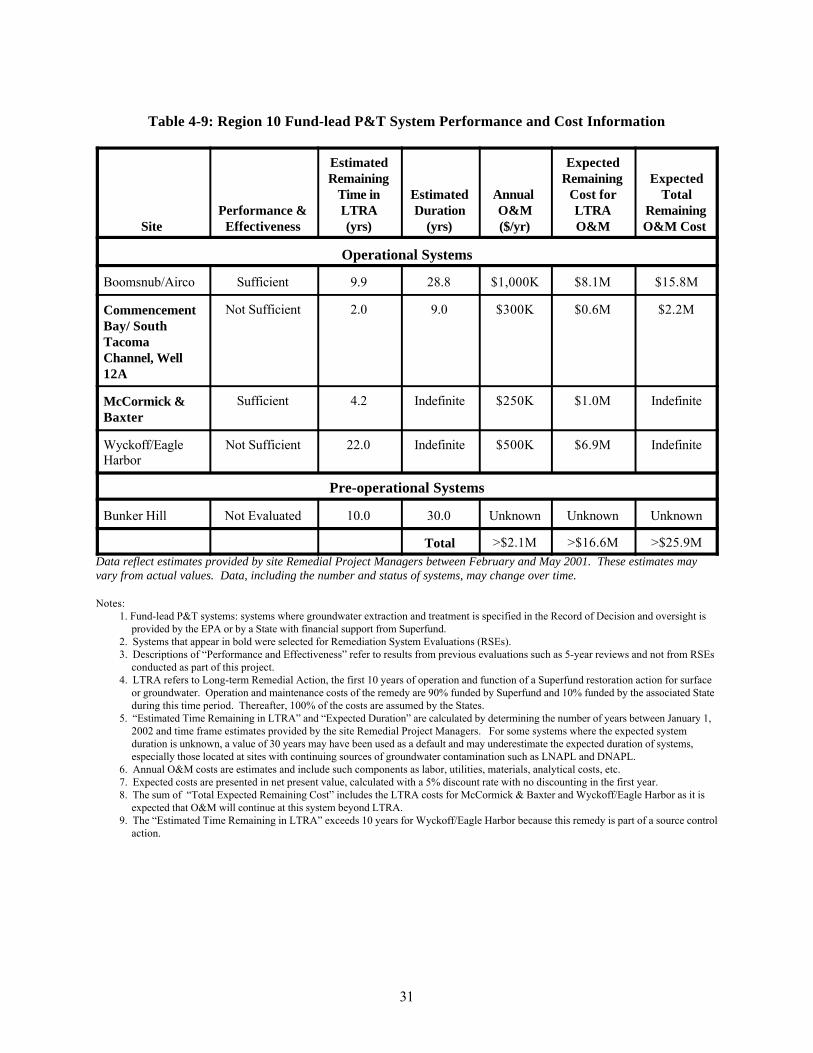
31
Table 4-9: Region 10 Fund-lead P&T System Performance and Cost Information
SitePerformance &
Effectiveness
EstimatedRemaining
Time inLTRA(yrs)
EstimatedDuration
(yrs)
Annual O&M($/yr)
ExpectedRemaining
Cost forLTRAO&M
ExpectedTotal
RemainingO&M Cost
Operational Systems
Boomsnub/Airco Sufficient 9.9 28.8 $1,000K $8.1M $15.8M
CommencementBay/ SouthTacomaChannel, Well12A
Not Sufficient 2.0 9.0 $300K $0.6M $2.2M
McCormick &Baxter
Sufficient 4.2 Indefinite $250K $1.0M Indefinite
Wyckoff/EagleHarbor
Not Sufficient 22.0 Indefinite $500K $6.9M Indefinite
Pre-operational Systems
Bunker Hill Not Evaluated 10.0 30.0 Unknown Unknown Unknown
Total >$2.1M >$16.6M >$25.9MData reflect estimates provided by site Remedial Project Managers between February and May 2001. These estimates mayvary from actual values. Data, including the number and status of systems, may change over time.
Notes:1. Fund-lead P&T systems: systems where groundwater extraction and treatment is specified in the Record of Decision and oversight is
provided by the EPA or by a State with financial support from Superfund.2. Systems that appear in bold were selected for Remediation System Evaluations (RSEs).3. Descriptions of “Performance and Effectiveness” refer to results from previous evaluations such as 5-year reviews and not from RSEs
conducted as part of this project.4. LTRA refers to Long-term Remedial Action, the first 10 years of operation and function of a Superfund restoration action for surface
or groundwater. Operation and maintenance costs of the remedy are 90% funded by Superfund and 10% funded by the associated Stateduring this time period. Thereafter, 100% of the costs are assumed by the States.
5. “Estimated Time Remaining in LTRA” and “Expected Duration” are calculated by determining the number of years between January 1,2002 and time frame estimates provided by the site Remedial Project Managers. For some systems where the expected systemduration is unknown, a value of 30 years may have been used as a default and may underestimate the expected duration of systems,especially those located at sites with continuing sources of groundwater contamination such as LNAPL and DNAPL.
6. Annual O&M costs are estimates and include such components as labor, utilities, materials, analytical costs, etc.7. Expected costs are presented in net present value, calculated with a 5% discount rate with no discounting in the first year.8. The sum of “Total Expected Remaining Cost” includes the LTRA costs for McCormick & Baxter and Wyckoff/Eagle Harbor as it is
expected that O&M will continue at this system beyond LTRA.9. The “Estimated Time Remaining in LTRA” exceeds 10 years for Wyckoff/Eagle Harbor because this remedy is part of a source control
action.

32
Table 4-10: Future O&M Costs of Fund-lead P&T Systems Expected to be Incurred by eachState after LTRA
StateNumber of
Systems
Total O&M Cost Expected to be Incurred by State after LTRA
NPV (Discount Rate of 5%) No Discounting
Arkansas 1 $2.6M $5.4M
California 4 $15.5M $32.0M
Florida 4 Unknown Unknown
Idaho 1 Unknown Unknown
Illinois 1 $0.2M $0.2M
Indiana 1 $1.0M $2.4M
Kansas 1 $0.6M $1.0M
Louisiana 2 $4.5M $7.2M
Maine 1 $0.0M $0.0M
Massachusetts 4 $56.8M $99.6M
Michigan 6 > $21.1M > $48.8M
Minnesota 3 $4.4M $8.4M
Missouri 1 Unknown Unknown
Nebraska 1 $0.5M $1.0M
New Hampshire 3 $0.5M $0.5M
New Jersey 12 $69.4M $154.7M
New Mexico 1 Unknown Unknown
New York 10 $24.4M $49.6M
North Carolina 4 >$0.2M >$0.3M
Oregon 1 Unknown Unknown
Pennsylvania 10 $24.2M $56.5M
South Carolina 2 $1.0M $1.8M
Texas 5 > $8.2M > $18.4M
Virginia 2 $1.9M $3.6M
Washington 3 > $9.3M > $21.0M
Wisconsin 4 > $5.4M > $10.3M
Total 88 > $251.7M > $522.7MData reflect estimates provided by site Remedial Project Managers between February and May 2001. These estimates mayvary from actual values. Data, including the number and status of systems, may change over time.
Notes:1. Fund-lead P&T systems are those systems where groundwater extraction and treatment is specified in the Record of Decision and
oversight is provided by the EPA or by a State with financial support from Superfund.2. Annual O&M costs are estimates and include such components as labor, utilities, materials, analytical costs, etc.3. “Total O&M Cost Expected to be Incurred by State” refers to those costs incurred by the State after the Long-term Remedial Action
(LTRA). LTRA is the first 10 years of operation and function of a Superfund restoration action for surface or groundwater. Operationand maintenance costs of the remedy are 90% funded by Superfund and 10% funded by the associated State during this time period. Thereafter, 100% of the costs are assumed by the States.
4. For some systems where the expected system duration is unknown, a value of 30 years may have been used as a default and mayunderestimate the expected duration of systems, especially those located at sites with continuing sources of groundwatercontamination such as LNAPL and DNAPL.

33
Table 4-11: Region 1 Fund-lead P&T System O&M Costs According to State
Site
Expecteddate of
TransitionAnnual O&M
Cost ($/yr)
Expected Cost to be Incurred by Stateafter LTRA
NPV (DiscountRate of 5%)
No Discounting
Maine
Eastern Surplus 9/2011 $200K $0.0M $0.0M
Massachusetts
Baird and McGuire 4/2004 $3,500K $39.9M $66.5M
Charles George Landfill 9/2009 $450K $3.9M $8.6M
Groveland Wells 4/2011 $500K $4.2M $10.0M
Silresim Chemical 9/2007 $1,400K $8.8M $14.4M
New Hampshire
Kearsarge Metallurgical 9/2003 $250K $0.5M $0.5M
Keefe 9/2003 $200K $0.0M $0.0M
Savage Well 3/2009 $500K $0.0M $0.0MData reflect estimates provided by site Remedial Project Managers between February and May 2001. These estimates mayvary from actual values. Data, including the number and status of systems, may change over time.
Notes:1. Fund-lead P&T systems are those systems where groundwater extraction and treatment is specified in the Record of Decision and
oversight is provided by the EPA or by a State with financial support from Superfund.2. Systems that appear in bold were selected for Remediation System Evaluations (RSEs).3. Annual O&M costs are estimates and include such components as labor, utilities, materials, analytical costs, etc.4. “Expected Cost to be Incurred by State” refers to those costs incurred by the State after the Long-term Remedial Action (LTRA). LTRA
is the first 10 years of operation and function of a Superfund restoration action for surface or groundwater. Operation and maintenancecosts of the remedy are 90% funded by Superfund and 10% funded by the associated State during this time period. Thereafter, 100%of the costs are assumed by the States.
5. For systems where site Remedial Project Managers estimated remedy completion earlier than the end of LTRA, expected costs afterLTRA appear as $0.0M.
6. For some systems where the expected system duration is unknown, a value of 30 years may have been used as a default and mayunderestimate the expected duration of systems, especially those located at sites with continuing sources of groundwatercontamination such as LNAPL and DNAPL. Therefore, total future cost estimates for some sites could be underestimated.

34
Table 4-12: Region 2 Fund-lead P&T System O&M Costs According to State
Site
Expecteddate of
TransitionAnnual O&M
Cost ($/yr)
Expected Cost to be Incurred by Stateafter LTRA
NPV (DiscountRate of 5%)
No Discounting
New Jersey
Bog Creek 9/2004 $460K $5.3M $9.3M
Combe Fill South 9/2008 $920K $8.7M $18.4M
Dover Municipal Well 4 Unknown Unknown $0.0M $0.0M
Garden State Cleaners 10/2009 $500K $4.5M $10.0M
Higgins Farm 1/2009 $1,000K $9.2M $19.7M
Lang Property 10/2005 $700K $0.0M $0.0M
Lipari Landfill 10/2019 $2,500K $0.0M $0.0M
Metal TEC/Aerosystems Unknown Unknown $0.0M $0.0M
Montgomery Township/Rocky Hill 9/2013 $400K $3.2M $8.0M
Syncon Resins 4/2001 $350K $5.4M $9.3M
Vineland Chemical 6/2011 $4,000K $33.1M $80.0M
Williams Property 6/2001 $350K $0.0M $0.0M
New York
American Thermostat 10/2008 $1,175K $11.1M $23.4M
Brewster Well Field 10/2007 $400K $0.0M $0.0M
Circuitron 6/2010 $480K $0.0M $0.0M
Claremont Polychemical 2/2010 $740K $4.0M $7.4M
Islip Municipal Landfill 9/2006 $225K $0.0M $0.0M
Mattiace Petrochemical 3/2009 $700K $6.6M $14.3M
Mohonk Road 7/2011 Unknown $0.0M $0.0M
SMS Instruments 6/2005 $400K $0.0M $0.0M
Stanton Cleaners 9/2011 $270K $1.4M $2.7M
Vestal Water Supply 3/2005 $180K $1.3M $1.8M
Data reflect estimates provided by site Remedial Project Managers between February and May 2001. Theseestimates may vary from actual values. Data, including the number and status of systems, may change over time.
Notes:1. Fund-lead P&T systems are those systems where groundwater extraction and treatment is specified in the Record of Decision and
oversight is provided by the EPA or by a State with financial support from Superfund.2. Systems that appear in bold were selected for Remediation System Evaluations (RSEs).3. Annual O&M costs are estimates and include such components as labor, utilities, materials, analytical costs, etc.4. “Expected Cost to be Incurred by State” refers to those costs incurred by the State after the Long-term Remedial Action (LTRA). LTRA
is the first 10 years of operation and function of a Superfund restoration action for surface or groundwater. Operation and maintenancecosts of the remedy are 90% funded by Superfund and 10% funded by the associated State during this time period. Thereafter, 100%of the costs are assumed by the States.
5. For systems where site Remedial Project Managers estimated remedy completion earlier than the end of LTRA, expected costs afterLTRA appear as $0.0M.
6. For some systems where the expected system duration is unknown, a value of 30 years may have been used as a default and mayunderestimate the expected duration of systems, especially those located at sites with continuing sources of groundwatercontamination such as LNAPL and DNAPL. Therefore, total future cost estimates for some sites could be underestimated.

35
Table 4-13: Region 3 Fund-lead P&T System O&M Costs According to State
Site
Expecteddate of
TransitionAnnual O&M
Cost ($/yr)
Expected Cost to be Incurred by Stateafter LTRA
NPV (DiscountRate of 5%)
No Discounting
Pennsylvania
AIW Frank 9/2011 $180K $1.5M $3.6M
Berks Sand Pit 2/2005 $150K $0.0M $0.0M
Butz Landfill 4/2011 $250K $2.1M $5.0M
Croydon TCE 3/2005 $200K $2.2M $4.0M
CryoChem 6/2008 $125K $0.2M $0.3M
Hellertown Manufacturing 9/2006 $350K $3.6M $7.0M
North Penn Area 1 9/2008 $100K $0.6M $1.0M
Raymark 1/2004 $156K $1.1M $1.6M
Havertown PCP 4/2012 $1,000K $8.2M $21.0M
North Penn Area 6 6/2013 $592K $4.7M $11.9M
Virginia
Greenwood Chemical 11/2011 $400K $1.9M $3.6M
Saunders Supply 5/2009 $80K $0.0M $0.0MData reflect estimates provided by site Remedial Project Managers between February and May 2001. These estimates mayvary from actual values. Data, including the number and status of systems, may change over time.
Notes:1. Fund-lead P&T systems are those systems where groundwater extraction and treatment is specified in the Record of Decision and
oversight is provided by the EPA or by a State with financial support from Superfund.2. Systems that appear in bold were selected for Remediation System Evaluations (RSEs).3. Annual O&M costs are estimates and include such components as labor, utilities, materials, analytical costs, etc.4. “Expected Cost to be Incurred by State” refers to those costs incurred by the State after the Long-term Remedial Action (LTRA). LTRA
is the first 10 years of operation and function of a Superfund restoration action for surface or groundwater. Operation and maintenancecosts of the remedy are 90% funded by Superfund and 10% funded by the associated State during this time period. Thereafter, 100%of the costs are assumed by the States.
5. For systems where site Remedial Project Managers estimated remedy completion earlier than the end of LTRA, expected costs afterLTRA appear as $0.0M.
6. For some systems where the expected system duration is unknown, a value of 30 years may have been used as a default and mayunderestimate the expected duration of systems, especially those located at sites with continuing sources of groundwatercontamination such as LNAPL and DNAPL. Therefore, total future cost estimates for some sites could be underestimated.

36
Table 4-14: Region 4 Fund-lead P&T System O&M Costs According to State
Site
Expecteddate of
TransitionAnnual O&M
Cost ($/yr)
Expected Cost to be Incurred by Stateafter LTRA
NPV (DiscountRate of 5%)
No Discounting
Florida
American Creosote Works(DNAPL)
5/2003 $300K $0.0M $0.0M
American Creosote Works(solute)
9/2014 $452K $0.0M $0.0M
Coleman Evans WoodPreserving
Unknown Unknown Unknown Unknown
Miami Drum 9/2002 $1,000K Unknown Unknown
North Carolina
ABC Cleaners Unknown Unknown Unknown Unknown
Benfield Industries 5/2011 $30K $0.2M $0.3M
Cape Fear Wood Preserving 10/2011 $40K $0.0M $0.0M
FCX Statesville 5/2008 $150K $0.0M $0.0M
South Carolina
Elmore Waste Disposal 9/2008 $180K $1.0M $1.8M
Palmetto Wood 5/2008 $300K $0.0M $0.0MData reflect estimates provided by site Remedial Project Managers between February and May 2001. These estimates mayvary from actual values. Data, including the number and status of systems, may change over time.
Notes:1. Fund-lead P&T systems are those systems where groundwater extraction and treatment is specified in the Record of Decision and
oversight is provided by the EPA or by a State with financial support from Superfund.2. Systems that appear in bold were selected for Remediation System Evaluations (RSEs).3. Annual O&M costs are estimates and include such components as labor, utilities, materials, analytical costs, etc.4. “Expected Cost to be Incurred by State” refers to those costs incurred by the State after the Long-term Remedial Action (LTRA). LTRA
is the first 10 years of operation and function of a Superfund restoration action for surface or groundwater. Operation and maintenancecosts of the remedy are 90% funded by Superfund and 10% funded by the associated State during this time period. Thereafter, 100%of the costs are assumed by the States.
5. For systems where site Remedial Project Managers estimated remedy completion earlier than the end of LTRA, expected costs afterLTRA appear as $0.0M.
6. For some systems where the expected system duration is unknown, a value of 30 years may have been used as a default and mayunderestimate the expected duration of systems, especially those located at sites with continuing sources of groundwatercontamination such as LNAPL and DNAPL. Therefore, total future cost estimates for some sites could be underestimated.

37
Table 4-15: Region 5 Fund-lead P&T System O&M Costs According to State
Site
Expecteddate of
TransitionAnnual O&M
Cost ($/yr)
Expected Cost to be Incurred by Stateafter LTRA
NPV (DiscountRate of 5%)
No Discounting
Illinois
La Salle 3/2004 $230K $0.2M $0.2M
Indiana
Douglass Road 9/2010 $120K $1.0M $2.4M
Michigan
Duell and Gardner 7/2011 Unknown Unknown $0.0M
Ott/Story 8/2010 $2,400K $20.7M $48.0M
Peerless Plating Unknown $400K Unknown $0.0M
U.S. Aviex 9/2003 $300K $0.0M $0.0M
Verona 6/2006 $225K Unknown Unknown
Wash King 4/2011 $75K $0.4M $0.8M
Minnesota
Arrowhead Refinery 7/2003 $70K $0.1M $0.1M
Long Prairie 10/2007 $300K $1.6M $2.4M
MacGillis & Gibbs 10/2009 $300K $2.7M $6.0M
Wisconsin
Better Brite 6/2006 $36K $0.5M $0.9M
Eau Claire Unknown $175K Unknown Unknown
Oconomowoc 9/2006 $471K $4.9M $9.4M
Onalaska 6/2004 $200K $0.0M $0.0M
Data reflect estimates provided by site Remedial Project Managers between February and May 2001. Theseestimates may vary from actual values. Data, including the number and status of systems, may change over time.
Notes:1. Fund-lead P&T systems are those systems where groundwater extraction and treatment is specified in the Record of Decision and
oversight is provided by the EPA or by a State with financial support from Superfund.2. Systems that appear in bold were selected for Remediation System Evaluations (RSEs).3. Annual O&M costs are estimates and include such components as labor, utilities, materials, analytical costs, etc.4. “Expected Cost to be Incurred by State” refers to those costs incurred by the State after the Long-term Remedial Action (LTRA). LTRA
is the first 10 years of operation and function of a Superfund restoration action for surface or groundwater. Operation and maintenancecosts of the remedy are 90% funded by Superfund and 10% funded by the associated State during this time period. Thereafter, 100%of the costs are assumed by the States.
5. For systems where site Remedial Project Managers estimated remedy completion earlier than the end of LTRA, expected costs afterLTRA appear as $0.0M.
6. For some systems where the expected system duration is unknown, a value of 30 years may have been used as a default and mayunderestimate the expected duration of systems, especially those located at sites with continuing sources of groundwatercontamination such as LNAPL and DNAPL. Therefore, total future cost estimates for some sites could be underestimated.

38
Table 4-16: Region 6 Fund-lead P&T System O&M Costs According to State
Site
Expecteddate of
TransitionAnnual O&M
Cost ($/yr)
Expected Cost to be Incurred by Stateafter LTRA
NPV (DiscountRate of 5%)
No Discounting
Arkansas
Midland Products 1/2004 $180K $2.6M $5.4M
Louisiana
American Creosote Works 2/2027 $360K $0.0M $0.0M
Bayou Bonfouca 7/2003 $402K $4.5M $7.2M
New Mexico
Cimarron Mining 10/2004 $1,000K Unknown Unknown
Texas
City of Perryton Well #2 8/2013 $37K $0.2M $0.4M
Geneva Industries 1/2004 $240K $0.0M $0.0M
North Cavalcade 12/2005 Unknown Unknown Unknown
Odessa Chromium #1 12/2001 $500K $0.0M $0.0M
Sprague Road 9/2013 $1,200K $8.0M $18.0MData reflect estimates provided by site Remedial Project Managers between February and May 2001. These estimates mayvary from actual values. Data, including the number and status of systems, may change over time.
Notes:1. Fund-lead P&T systems are those systems where groundwater extraction and treatment is specified in the Record of Decision and
oversight is provided by the EPA or by a State with financial support from Superfund.2. Systems that appear in bold were selected for Remediation System Evaluations (RSEs).3. Annual O&M costs are estimates and include such components as labor, utilities, materials, analytical costs, etc.4. “Expected Cost to be Incurred by State” refers to those costs incurred by the State after the Long-term Remedial Action (LTRA). LTRA
is the first 10 years of operation and function of a Superfund restoration action for surface or groundwater. Operation and maintenancecosts of the remedy are 90% funded by Superfund and 10% funded by the associated State during this time period. Thereafter, 100%of the costs are assumed by the States.
5. For systems where site Remedial Project Managers estimated remedy completion earlier than the end of LTRA, expected costs afterLTRA appear as $0.0M.
6. For some systems where the expected system duration is unknown, a value of 30 years may have been used as a default and mayunderestimate the expected duration of systems, especially those located at sites with continuing sources of groundwatercontamination such as LNAPL and DNAPL. Therefore, total future cost estimates for some sites could be underestimated.

39
Table 4-17: Region 7 Fund-lead P&T System O&M Costs According to State
Site
Expecteddate of
TransitionAnnual O&M
Cost ($/yr)
Expected Cost to be Incurred by Stateafter LTRA
NPV (DiscountRate of 5%)
No Discounting
Kansas
Ace Services 9/2013 $500K $0.6M $1.0M
Missouri
Valley Park TCE/OU2 1/2006 Unknown Unknown Unknown
Nebraska
Cleburn Street Well Site/OU2 12/2009 $100K $0.5M $1.0MData reflect estimates provided by site Remedial Project Managers between February and May 2001. These estimates mayvary from actual values. Data, including the number and status of systems, may change over time.
Notes:1. Fund-lead P&T systems are those systems where groundwater extraction and treatment is specified in the Record of Decision and
oversight is provided by the EPA or by a State with financial support from Superfund.2. Systems that appear in bold were selected for Remediation System Evaluations (RSEs).3. Annual O&M costs are estimates and include such components as labor, utilities, materials, analytical costs, etc.4. “Expected Cost to be Incurred by State” refers to those costs incurred by the State after the Long-term Remedial Action (LTRA). LTRA
is the first 10 years of operation and function of a Superfund restoration action for surface or groundwater. Operation and maintenancecosts of the remedy are 90% funded by Superfund and 10% funded by the associated State during this time period. Thereafter, 100%of the costs are assumed by the States.
5. For systems where site Remedial Project Managers estimated remedy completion earlier than the end of LTRA, expected costs afterLTRA appear as $0.0M.
6. For some systems where the expected system duration is unknown, a value of 30 years may have been used as a default and mayunderestimate the expected duration of systems, especially those located at sites with continuing sources of groundwatercontamination such as LNAPL and DNAPL. Therefore, total future cost estimates for some sites could be underestimated.

40
Table 4-18: Region 9 Fund-lead P&T System O&M Costs According to State
Site
Expecteddate of
TransitionAnnual O&M
Cost ($/yr)
Expected Cost to be Incurred by Stateafter LTRA
NPV (DiscountRate of 5%)
No Discounting
California
Modesto 5/2012 $300K $1.5M $3.0M
Muscoy 10/2014 $1,100K $5.5M $11.0M
Newmark 10/2008 $900K $8.5M $18.0M
Selma Treating Co. 10/2008 $300K $0.0M $0.0MData reflect estimates provided by site Remedial Project Managers between February and May 2001. These estimates mayvary from actual values. Data, including the number and status of systems, may change over time.
Notes:1. Fund-lead P&T systems are those systems where groundwater extraction and treatment is specified in the Record of Decision and
oversight is provided by the EPA or by a State with financial support from Superfund.2. Systems that appear in bold were selected for Remediation System Evaluations (RSEs).3. Annual O&M costs are estimates and include such components as labor, utilities, materials, analytical costs, etc.4. “Expected Cost to be Incurred by State” refers to those costs incurred by the State after the Long-term Remedial Action (LTRA). LTRA
is the first 10 years of operation and function of a Superfund restoration action for surface or groundwater. Operation and maintenancecosts of the remedy are 90% funded by Superfund and 10% funded by the associated State during this time period. Thereafter, 100%of the costs are assumed by the States.
5. For systems where site Remedial Project Managers estimated remedy completion earlier than the end of LTRA, expected costs afterLTRA appear as $0.0M.
6. For some systems where the expected system duration is unknown, a value of 30 years may have been used as a default and mayunderestimate the expected duration of systems, especially those located at sites with continuing sources of groundwatercontamination such as LNAPL and DNAPL. Therefore, total future cost estimates for some sites could be underestimated.

41
Table 4-19: Region 10 Fund-lead P&T System O&M Costs According to State
Site
Expecteddate of
TransitionAnnual O&M
Cost ($/yr)
Expected Cost to be Incurred by Stateafter LTRA
NPV (DiscountRate of 5%)
No Discounting
Idaho
Bunker Hill 12/2030 Unknown Unknown Unknown
Oregon
McCormick & Baxter 3/2006 $250K Unknown Unknown
Washington
Boomsnub/Airco 12/2011 $1,000K $7.7M $18.9M
Commencement Bay/SouthTacoma Channel, Well 12A
1/2004 $300K $1.6M $2.1M
Wyckoff/Eagle Harbor 1/2024 $500K Unknown UnknownData reflect estimates provided by site Remedial Project Managers between February and May 2001. These estimates mayvary from actual values. Data, including the number and status of systems, may change over time.
Notes:1. Fund-lead P&T systems are those systems where groundwater extraction and treatment is specified in the Record of Decision and
oversight is provided by the EPA or by a State with financial support from Superfund.2. Systems that appear in bold were selected for Remediation System Evaluations (RSEs).3. Annual O&M costs are estimates and include such components as labor, utilities, materials, analytical costs, etc.4. “Expected Cost to be Incurred by State” refers to those costs incurred by the State after the Long-term Remedial Action (LTRA). LTRA
is the first 10 years of operation and function of a Superfund restoration action for surface or groundwater. Operation and maintenancecosts of the remedy are 90% funded by Superfund and 10% funded by the associated State during this time period. Thereafter, 100%of the costs are assumed by the States.
5. For systems where site Remedial Project Managers estimated remedy completion earlier than the end of LTRA, expected costs afterLTRA appear as $0.0M.
6. For some systems where the expected system duration is unknown, a value of 30 years may have been used as a default and mayunderestimate the expected duration of systems, especially those located at sites with continuing sources of groundwatercontamination such as LNAPL and DNAPL. Therefore, total future cost estimates for some sites could be underestimated.

42
Table 4-20: Categories of Contaminants Prevalent at Sites with Fund-lead P&T Systems
Contaminant CategoryNumber of Systems that Address that Contaminant
Category
Chlorinated solvents and degradation products:• tetrachloroethylene (PCE)• trichloroethylene (TCE)• dichloroethlyene (DCE)• trichloroethane (TCA)• dichloroethane (DCA)• methylene chloride• vinyl chloride
56 of 88 systems
BTEX (one or more of the following):• benzene• toluene• ethylbenze• xylene
19 of 88 systems
Metals• Arsenic• Cadmium• Chromium• other metals
22 of 88 systems
Polyaromatic hydrocarbons (PAHs):• anthracene• benzo(a)pyrene• benzo(k)fluoranthene• fluoranthene• napthalene• other PAHs
17 of 88 systems
Data reflect estimates provided by site Remedial Project Managers between February and May 2001. These estimates mayvary from actuality. Data, including the number and status of systems and contaminants of concern, may change over time.
Notes:1. Fund-lead P&T systems are those systems where groundwater extraction and treatment is specified in the Record of Decision and
oversight is provided by the EPA or by a State with financial support from Superfund.2. Individual systems may address more than one contaminant.3. Presented data reflect estimates provided by site Remedial Project Managers between February and May 2001. These estimates,
including the number and status of systems and contaminants of concern, may change over time.

43
5.0 SYSTEM SCREENING AND PRIORITIZATION WITH RESPECT TOOPTIMIZATION POTENTIAL
A simple spreadsheet screening process was developed and implemented by the project team forassessing the optimization potential of each Fund-lead P&T system. The screening process consists ofthe following steps:
• calculate the “Baseline Present Value ($)” of the system by multiplying the annual cost by theestimated system duration, and including a discount rate (5%) to account for the future value ofmoney;
• assume that a typical RSE will save 20% of the annual cost of the system;
• determine site-specific “Estimated Potential Reduction in Life-cycle Costs (%)” from an RSE byadjusting the assumed 20% savings according to site-specific factors that increase or decrease thelikelihood that savings will be identified by the RSE process; and
• determine “Estimated Potential Life-cycle Savings ($)” from an RSE by multiplying the “BaselinePresent Value ($)” by the “Estimated Potential Reduction in Life Cycle Costs (%)”, andsubtracting the approximate cost of a RSE evaluation ($25,000).
The factors that were used to calculate the site-specific “Estimated Potential Reduction in Life-cycleCosts (%)” (starting from the assumed 20% value) are listed in Table 5-1. The base savings value of20%, and the subsequent adjustment factors, were determined by consensus of the project team based onthe assumption that, on average, all systems can benefit from optimization and more complex systemswould have greater opportunity for improvement. For each item, a “blank” response was allowed, anddid not impact the calculations. A positive adjustment was made to “Estimated Potential Reduction inLife-cycle Costs (%)” for items that would increase the optimization potential (e.g., many wells, highpumping rate, many above-ground treatment processes), and a negative adjustment was made to“Estimated Potential Reduction in Life-cycle Costs (%)” for items that would decrease the optimizationpotential (e.g., few pumping wells, short system duration). The “Estimated Potential Reduction in Life-cycle Costs (%)” was not allowed to be less than 5%, and not allowed to be greater than 45%. Thepurpose of this step was to identify systems with the highest potential for cost reduction and those mostlikely to benefit from optimization. All potential cost savings are estimates and are intended to be usedprimarily for prioritizing systems.
Summaries of the screening calculations are included in the screening summary reports for each Region,which are provided as Appendix B. The actual screening calculations for each system are presented inAppendix C. Note that these calculation are all based on estimates provided by the RPMs, and in somecases the “Estimated Potential Savings ($)” is negative, indicating that the estimated potential savingsfrom an RSE are not anticipated to offset the cost of the RSE itself.

44
Table 5-1: Site-Specific Criteria Used to Calculate the “Estimated Potential Life-cycle Savings (%)” from Optimization of each of the Identified Fund-lead P&T Systems (Page 1 of 2)
Result of performance and effectiveness evaluation (item 29, Section 3.0)
+0.0% default for blank value+2.5% performance & effectiveness not evaluated+5.0% performance & effectiveness evaluated and found not sufficient-2.5% performance & effectiveness evaluated and found sufficient
Number of pumping wells (item 18, Section 3.0) +0.0% default for blank value
+0.0% no wells (e.g., drains, etc.)-5.0% 1 to 2 wells-2.5% 3 to 4 wells+0.0% 5 to 9 wells+2.5% 10 or more wells
Pumping rate (item 17, Section 3.0) +0.0% default for blank value
-5.0% <10 gpm-2.5% 10 to 99.99 gpm+0.0% 100 to 500 gpm+2.5% >500 gpm
Down time per year (item 23, Section 3.0) +0.0% default for blank value
+0.0% <2 wks+2.5% 2.00 - 3.99 wks+5.0% 4 wks or more
Number of above-ground treatment processes (item 24, Section 3.0)
+0.0% default for blank value-2.5% 0 or 1 processes+0.0% 2 processes+2.5% 3 processes+5.0% 4 processes
Groundwater monitoring (number wells × events per year) (items 25-26, Section 3.0) +0.0% default for blank value
-2.5% <25+0.0% 25 to 49+2.5% 50 to 74+5.0% >75
Expected duration (item 22, Section 3.0) +0.0% default for blank value
-20.0% <2 yrs-15.0% 2.00 - 4.99yrs-5.0% 5.00 - 9.99 yrs-2.5% 10.00 - 19.99 yrs+0.0% 20 yrs or more

45
Table 5-1: Site-Specific Criteria Used to Calculate the “Estimated Potential Life-cycle Savings (%)” from Optimization of each of the Identified Fund-lead P&T Systems (Page 1 of 2)
Difficulty in making minor changes to system due to political/socialfactors (item 30, Section 3.0)
-5.0% default for blank value-10.0% severe difficulty expected-5.0% moderate difficulty expected+0.0% little difficulty expected

46
6.0 SYSTEM SELECTION
The intent of the project was to select two operational Fund-lead P&T systems in each Region to receiveRSEs. However, the site-identification process demonstrated that Region 7 had only one operationalFund-lead P&T system and Region 8 had none. As a result, these extra three RSEs were allocated toother Regions.
The selection of systems was based on satisfying most of the following factors:
• system is operating (required)
• Region agreed system is suitable for optimization (required)
• system effectiveness is questioned or found not sufficient
• system has high potential for life-cycle cost-savings ($), based on the screening calculations,relative to other systems
• no major problems identified for potentially implementing RSE recommendations
• RPM request for involvement
For a variety of reasons, including recent optimization or litigation, some of the systems with the highestpotential for life-cycle savings in a Region were not selected for RSEs. Narratives describing the systemselection for each Region are included the Regional summary screening reports included in Appendix B. Table 6-1 lists for each Region the systems selected to receive RSEs and the “Estimated Potential Savings($)” from system optimization.
Table 6-2 ranks each Fund-lead P&T system according to “Estimated Potential Life-cycle Savings ($)” ascalculated by the screening methodology. In addition, the systems that were selected for RSEs appear inbold. A graphical representation of this table is presented in Figure 6-1. Three of the top four rankedsystems were selected for RSEs. Out of 20 total RSEs, 14 of them were allocated to a system that isranked in the top 44 systems (top 50%). Summing the “Estimated Potential Life-cycle Savings ($)” ofthe systems selected for RSEs, the screening methodology suggests a total potential savings ofapproximately $48 million. The methodology also suggests approximately $134 million could be savedif RSEs are conducted at all 68 of the systems that indicate a positive “Estimated Potential Life-cycleSavings ($)”.
Because the screening methodology is sensitive to the estimated duration of the P&T systems and thisestimated duration could vary significantly from actuality, it is of significant interest to rank the systemsaccording to estimated annual O&M costs. This ranking is provided in Table 6-3 and shown graphicallyin Figure 6-2. Figure 6-2 also shows the cumulative contribution of the systems to the total annual cost. It appears that 13 of the systems account for over 50% of the annual O&M costs of all systemscombined. Regarding these thirteen systems, the following issues should be noted:
• three are selected to receive RSEs;
• one has previously received an RSE (by USACE);

47
• one has recently received an outside optimization evaluation;
• three are pre-operational and were therefore not selected to receive RSEs; and
• the remaining five were deemed inappropriate by the Regions for outside evaluations.

Figure 6-1: Fund-lead P&T Systems Ranked by "Estimated Potential Life-cycle Savings ($)"
$0
$2,000,000
$4,000,000
$6,000,000
$8,000,000
$10,000,000
$12,000,000
$14,000,000
1 11 21 31 41 51 61
Site Rank
Est
imat
ed P
ote
nti
al L
ife-
cycl
e S
avin
gs
($)Systems Selected for RSEs
$18,300,000
Data reflect estimates provided by site Remedial Project Managers between February and May 2001. These estimates may vary from actual values. Data, including the numberand status of systems, may change over time.
Notes:1. Fund-lead P&T systems refers to systems where groundwater extraction and treatment is specified in the Record of Decision and oversight is provided by the EPA or by a State with financial
support from Superfund.2. “Estimated Potential Life-cycle Savings ($)” is calculated based on the screening methodology summarized in Section 5.0 and Table 5-1. The screening calculations for each system are
presented in Appendix C and summarized in Appendix B.3. Values are shown for the 68 systems with positive “Estimated Potential Life-cycle Savings ($)” . This parameter was less than zero for 12 systems and could not be calculated for 8 systems
because of incomplete cost data.4. For some systems where the expected system duration is unknown, a value of 30 years may have been used as a default and may underestimate the expected duration of systems, especially
those located at sites with continuing sources of groundwater contamination such as LNAPL and DNAPL. Therefore, life-cycle costs and life-cycle cost savings could be underestimated forsome sites.
5. Cost information was reported for 79 of the 88 Fund-lead P&T systems. Costs for the remaining 9 systems are shown as $0 in this figure.

Figure 6-2: Fund-lead P&T Systems Ranked by Annual O&M Cost and the Cumulative Distribution of System Annual O&M Costs
$0
$500
$1,000
$1,500
$2,000
$2,500
$3,000
$3,500
$4,000
1 11 21 31 41 51 61 71 81
The 88 Fund-lead P&T Systems Ranked by Estimated Annual O&M Costs
An
nu
al O
&M
Co
st (
$1,0
00/y
ear)
0
10
20
30
40
50
60
70
80
90
100
Cu
mu
lati
ve D
istr
ibu
tio
n o
f C
ost
(% o
f to
tal a
nn
ual
co
sts)
System Annual O&M Costs
Cumulative Distribution ofAnnual O&M Costs
The top 13 systems represent over 50% of the total reported annual O&M cost for all systems
Systems Selected for RSEs
The top 13 systems each cost over $1,000,000 per year.
Data reflect estimates provided by site Remedial Project Managers between February and May 2001. These estimates may vary from actual values. Data, including the numberand status of systems, may change over time.
Notes:1. Fund-lead P&T systems refers to systems where groundwater extraction and treatment is specified in the Record of Decision and oversight is provided by the EPA or by a State with financial
support from Superfund.2. Annual operation and maintenance (O&M) costs are estimates and include such items as labor, utilities, materials, analytical work, etc.3. Cost information was reported for 79 of the 88 Fund-lead P&T systems. Costs for the remaining 9 systems are shown as $0 in this figure.

50
Table 6-1: For each Region Systems Selected for RSEs and the “Estimated Potential Life-cycleSavings ($)” Suggested by Screening Analysis
Region Number of Systems SelectedEstimated Potential
Life-cycle Savings ($)**
Region 1 Baird and McGuire $12,402,549
Savage Municipal Water Supply Well $934,042
Silresim Chemical Corp. $6,025,600
Region 2 Claremont Polychemical $2,578,700
Mattiace Petrochemical $2,357,411
Brewster Well Field $317,513
Region 3 Hellertown Manufacturing $979,619
Raymark $216,640
Region 4 Elmore Waste Disposal (RSE demonstration project) $375,872
FCX Statesville (RSE demonstration project) $134,513
Region 5 MacGillis and Gibbs (RSE demonstration project) $1,399,624
Oconomowoc Electroplating (RSE demonstration project) $1,590,721
Ott/Story $14,418,502
Region 6 Bayou Bonfouca $1,233,790
Midland Products $528,408
Region 7 Cleburn St. Well $179,042
Region 8 — —
Region 9 Modesto $730,227
Selma Pressure Treating $261,332
Region 10 Commencement Bay/South Tacoma Channel, Well 12A $465,677
McCormick and Baxter $1,127,934Data reflect estimates provided by site Remedial Project Managers between February and May 2001. These estimates mayvary from actual values. Data, including the number and status of systems, may change over time.
Notes:1. Fund-lead P&T systems refers to systems where groundwater extraction and treatment is specified in the Record of Decision and
oversight is provided by the EPA or by a State with financial support from Superfund.2. “Estimated Potential Life-cycle Savings ($)” is calculated based on the screening methodology summarized in Section 5.0 and Table 5-
1. The screening calculations for each system are presented in Appendix C and summarized in Appendix B.3. Modesto is classified as a pre-operational system; however, it will have changed status and have operated for two months prior to the
RSE visit.

51
Table 6-2: Fund-lead P&T Systems Ranked in Terms of “Estimated Potential Life-cycle Savings ($)” as Calculated by the Screening Methodology (Page 1 of 4)
Rank Site name Region
EstimatedPotential
Reduction in Life-cycle Costs
EstimatedPotential Life-cycle Savings
($)
1 Vineland Chemical Co. 2 30.0% $18,266,000
2 Ott/Story/Cordova Chem Co. 5 40.0% $14,419,000
3 Baird & McGuire Superfund Site 1 27.5% $12,403,000
4 Silresim Chemical Corp. 1 40.0% $6,026,000
5 Higgins Farm 2 40.0% $5,799,000
6 Sprague Road Ground Water Plume 6 32.5% $5,653,000
7 Combe Fill South Landfill 2 38.0% $5,065,000
8 American Thermostat 2 29.5% $5,022,000
9 Boomsnub/Airco / Site-Wide Ground Water OU 10 27.5% $4,124,000
10 Muscoy 9 27.0% $3,959,000
11 Havertown PCP OU2 3 25.5% $3,895,000
12 Newmark 9 25.5% $3,322,000
13 North Penn Area 6 3 35.5% $3,211,000
14 Claremont Polychemical 2 30.0% $2,579,000
15 Garden State Cleaners/South Jersey Clothing Company 2 32.5% $2,383,000
16 Mattiace Petrochemical 2 23.0% $2,357,000
17 Cimarron Mining 6 15.0% $2,281,000
18 Groveland Wells Superfund Site 1 27.5% $2,066,000
19 Wyckoff/Eagle Harbor Superfund Site 10 25.5% $1,935,000
20 Montgomery Township/Rocky Hill 2 30.5% $1,850,000
21 Bog Creek Farm LTRA 2 30.0% $1,833,000
22 Oconomowoc Electroplating 5 24.5% $1,591,000
23 Ace Services 7 32.5% $1,557,000Data reflect estimates provided by site Remedial Project Managers between February and May 2001. These estimates mayvary from actual values. Data, including the number and status of systems, may change over time.
Notes:1. Fund-lead P&T systems refers to systems where groundwater extraction and treatment is specified in the Record of Decision and
oversight is provided by the EPA or by a State with financial support from Superfund.2. “Estimated Potential Life-cycle Savings ($)” is calculated based on the screening methodology summarized in Section 5.0 and Table 5-
1. The screening calculations for each system are presented in Appendix C and summarized in Appendix B.3. For a variety of reasons, including recent optimization or litigation, some of the systems with the highest potential for life-cycle
savings in a Region were not selected for RSEs. Narratives describing the system selection for each Region are included theRegional summary screening reports included in Appendix B.
4. For some systems where the expected system duration is unknown, a value of 30 years may have been used as a default and mayunderestimate the expected duration of systems, especially those located at sites with continuing sources of groundwatercontamination such as LNAPL and DNAPL. Therefore, life-cycle costs and life-cycle cost savings could be underestimated for somesites.

52
Table 6-2: Fund-lead P&T Systems Ranked in Terms of “Estimated Potential Life-cycle Savings ($)” as Calculated by the Screening Methodology (Page 2 of 4)
Rank Site name Region
EstimatedPotential
Reduction in Life-cycle Costs
EstimatedPotential Life-cycle Savings
($)
24 Greenwood Chemical Site 3 32.5% $1,538,000
25 Syncon Resins 2 28.0% $1,402,000
26 MacGillis and Gibbs/Bell Lumber & Pole 5 32.0% $1,400,000
27 Bayou Bonfouca 6 25.5% $1,234,000
28 Lipari Landfill site 2 17.5% $1,136,000
29 McCormick & Baxter Creosoting Co. 10 30.0% $1,128,000
30 Charles George Landfill Superfund Site 1 17.5% $1,122,000
31 American Creosote Works 6 22.0% $1,094,000
32 Hellertown Manufacturing 3 20.5% $980,000
33 Savage Well Municipal Water System 1 32.5% $934,000
34 Butz Landfill 3 25.0% $925,000
35 Stanton Cleaners Area Groundwater Contamination Site 2 28.0% $908,000
36 Verona Well Field 5 25.5% $857,000
37 AIW Frank/Mid-County Mustang Site, OU#1 3 28.0% $746,000
38 Modesto Superfund Site 9 20.0% $730,000
39 Douglass Road 5 32.5% $563,000
40 Midland Products 6 20.0% $528,000
41 Croydon TCE 3 20.0% $517,000
42 American Creosote Works (solute) 4 17.5% $469,000
43 Commencement Bay, South Tacoma Channel, Well 10 23.0% $466,000
44 Long Prairie 5 15.5% $430,000
45 Elmore Waste Disposal 4 20.0% $376,000
46 Brewster Wellfield 2 17.5% $318,000Data reflect estimates provided by site Remedial Project Managers between February and May 2001. These estimates mayvary from actual values. Data, including the number and status of systems, may change over time.
Notes:1. Fund-lead P&T systems refers to systems where groundwater extraction and treatment is specified in the Record of Decision and
oversight is provided by the EPA or by a State with financial support from Superfund.2. “Estimated Potential Life-cycle Savings ($)” is calculated based on the screening methodology summarized in Section 5.0 and Table 5-
1. The screening calculations for each system are presented in Appendix C and summarized in Appendix B.3. For a variety of reasons, including recent optimization or litigation, some of the systems with the highest potential for life-cycle
savings in a Region were not selected for RSEs. Narratives describing the system selection for each Region are included theRegional summary screening reports included in Appendix B.
4. For some systems where the expected system duration is unknown, a value of 30 years may have been used as a default and mayunderestimate the expected duration of systems, especially those located at sites with continuing sources of groundwatercontamination such as LNAPL and DNAPL. Therefore, life-cycle costs and life-cycle cost savings could be underestimated for somesites.

53
Table 6-2: Fund-lead P&T Systems Ranked in Terms of “Estimated Potential Life-cycle Savings ($)” as Calculated by the Screening Methodology (Page 3 of 4)
Rank Site name Region
EstimatedPotential
Reduction in Life-cycle Costs
EstimatedPotential Life-cycle Savings
($)
47 Palmetto Wood 4 18.0% $262,000
48 Selma Treating Co. 9 17.0% $261,000
49 Eastern Surplus Company Superfund Site 1 28.0% $246,000
50 Raymark 3 17.5% $217,000
51 Wash King Laundry 5 23.0% $185,000
52 Cleburn Street Well Site/OU2 7 17.5% $179,000
53 Vestal Water Supply Well 1-1 2 10.0% $146,000
54 FCX Statesville 4 20.0% $135,000
55 North Penn Area 1 3 10.0% $86,000
56 Lang Property 2 5.0% $63,000
57 City of Perryton Well #2 6 17.5% $59,000
58 La Salle Electrical Utilities 5 12.5% $57,000
59 Kearsarge Metallurgical Corp. 1 10.0% $57,000
60 Saunders Supply Company 3 17.0% $47,000
61 CryoChem 3 8.0% $42,000
62 Better Brite Plating Co. Chrome and Zinc Shops 5 12.0% $40,000
63 SMS Instruments 2 7.5% $35,000
64 Cape Fear Wood Preserving 4 22.5% $33,000
65 Benfield Industries 4 15.0% $30,000
66 Circuitron 2 8.0% $26,000
67 Geneva Industries 6 8.0% $11,000
68 American Creosote Works (DNAPL) 4 7.5% $3,000
69 Keefe Environmental Systems 1 7.5% -$2,000Data reflect estimates provided by site Remedial Project Managers between February and May 2001. These estimates mayvary from actual values. Data, including the number and status of systems, may change over time.
Notes:1. Fund-lead P&T systems refers to systems where groundwater extraction and treatment is specified in the Record of Decision and
oversight is provided by the EPA or by a State with financial support from Superfund.2. “Estimated Potential Life-cycle Savings ($)” is calculated based on the screening methodology summarized in Section 5.0 and Table 5-
1. The screening calculations for each system are presented in Appendix C and summarized in Appendix B.3. For a variety of reasons, including recent optimization or litigation, some of the systems with the highest potential for life-cycle
savings in a Region were not selected for RSEs. Narratives describing the system selection for each Region are included theRegional summary screening reports included in Appendix B.
4. For some systems where the expected system duration is unknown, a value of 30 years may have been used as a default and mayunderestimate the expected duration of systems, especially those located at sites with continuing sources of groundwatercontamination such as LNAPL and DNAPL. Therefore, life-cycle costs and life-cycle cost savings could be underestimated for somesites.

54
Table 6-2: Fund-lead P&T Systems Ranked in Terms of “Estimated Potential Life-cycle Savings ($)” as Calculated by the Screening Methodology (Page 4 of 4)
Rank Site name Region
EstimatedPotential
Reduction in Life-cycle Costs
EstimatedPotential Life-cycle Savings
($)
70 U.S. Aviex 5 5.0% -$2,000
71 Islip Municipal Landfill 2 7.5% -$9,000
72 Berks Sand Pit 3 5.0% -$17,000
73 Arrowhead Refinery 5 5.0% -$18,000
74 Onalaska Municipal Landfill 5 5.0% -$20,000
75 Williams Property 2 5.0% -$25,000
76 Odessa Chromium #1 6 5.0% -$25,000
77 North Cavalcade Superfund Site 6 27.5% -$25,000
78 Mohonk Road Industrial Plant Site 2 unknown unknown
79 Dover Municipal Well 4 2 unknown unknown
80 Metal TEC/Aerosystems 2 unknown unknown
81 ABC Cleaners 4 unknown unknown
82 Miami Drum 4 unknown unknown
83 Coleman Evans Wood Preserving 4 unknown unknown
84 Eau Claire Municipal Well Field 5 unknown unknown
85 Duell and Gardner 5 unknown unknown
86 Peerless Plating 5 unknown unknown
87 Valley Park TCE Site - OU2 7 unknown unknown
88 Bunker Hill Superfund Site 10 unknown unknownData reflect estimates provided by site Remedial Project Managers between February and May 2001. These estimates mayvary from actual values. Data, including the number and status of systems, may change over time.
Notes:1. Fund-lead P&T systems refers to systems where groundwater extraction and treatment is specified in the Record of Decision and
oversight is provided by the EPA or by a State with financial support from Superfund.2. “Estimated Potential Life-cycle Savings ($)” is calculated based on the screening methodology summarized in Section 5.0 and Table 5-
1. The screening calculations for each system are presented in Appendix C and summarized in Appendix B.3. For a variety of reasons, including recent optimization or litigation, some of the systems with the highest potential for life-cycle
savings in a Region were not selected for RSEs. Narratives describing the system selection for each Region are included theRegional summary screening reports included in Appendix B.
4. For some systems where the expected system duration is unknown, a value of 30 years may have been used as a default and mayunderestimate the expected duration of systems, especially those located at sites with continuing sources of groundwatercontamination such as LNAPL and DNAPL. Therefore, life-cycle costs and life-cycle cost savings could be underestimated for somesites.

55
Table 6-3: Fund-lead P&T Systems Ranked According to Annual O&M Cost (Page 1 of 4)
Rank Site name Region Annual O&M Cost
1 Vineland Chemical Co. 2 $4,000,000
2 Baird & McGuire Superfund Site 1 $3,500,000
3 Lipari Landfill site 2 $2,500,000
4 Ott/Story/Cordova Chem Co. 5 $2,400,000
5 Silresim Chemical Corp. 1 $1,400,000
6 Sprague Road Ground Water Plume 6 $1,200,000
7 American Thermostat 2 $1,175,000
8 Muscoy 9 $1,100,000
9 Higgins Farm 2 $1,000,000
10 Havertown PCP OU2 3 $1,000,000
11 Miami Drum 4 $1,000,000
12 Cimarron Mining 6 $1,000,000
13 Boomsnub/Airco 10 $1,000,000
14 Combe Fill South Landfill 2 $920,000
15 Newmark 9 $900,000
16 Claremont Polychemical Corp. 2 $740,000
17 Lang Property Superfund Site 2 $700,000
18 Mattiace Petrochemical 2 $700,000
19 North Penn Area 6 3 $592,900
20 Groveland Wells Superfund Site 1 $500,000
21 Savage Well Municipal Water System 1 $500,000
22 Garden State Cleaners/South Jersey Clothing Company 2 $500,000
23 Odessa Chromium #1 6 $500,000
24 Ace Services 7 $500,000
25 Wyckoff/Eagle Harbor Superfund Site 10 $500,000
26 Circuitron 2 $480,000
27 Oconomowoc Electroplating 5 $471,000
Data reflect estimates provided by site Remedial Project Managers between February and May 2001. These estimates mayvary from actual values. Data, including the number and status of systems, may change over time.
Notes:1. Fund-lead P&T systems refers to systems where groundwater extraction and treatment is specified in the Record of Decision and
oversight is provided by the EPA or by a State with financial support from Superfund.2. Annual operation and maintenance (O&M) costs are estimates and include such items as labor, utilities, materials, analytical work, etc.3. For a variety of reasons, including recent optimization or litigation, some of the systems with the highest annual O&M costs in a
Region were not selected for RSEs. Narratives describing the system selection for each Region are included the Regional summaryscreening reports included in Appendix B.

56
Table 6-3: Fund-lead P&T Systems Ranked According to Annual O&M Cost (Page 2 of 4)
Rank Site name Region Annual O&M Cost
28 Bog Creek Farm LTRA 2 $460,000
29 American Creosote Works (solute) 4 $452,000
30 Charles George Landfill Superfund Site 1 $450,000
31 Bayou Bonfouca 6 $402,000
32 Brewster Wellfield 2 $400,000
33 SMS Instruments 2 $400,000
34 Montgomery Township/Rocky Hill 2 $400,000
35 Greenwood Chemical Site 3 $400,000
36 Peerless Plating 5 $400,000
37 American Creosote Works 6 $360,000
38 Syncon Resins 2 $350,000
39 Williams Property 2 $350,000
40 Hellertown Manufacturing 3 $350,000
41 American Creosote Works (DNAPL) 4 $300,000
42 Palmetto Wood 4 $300,000
43 Long Prairie Groundwater Contamination 5 $300,000
44 MacGillis and Gibbs/Bell Lumber & Pole 5 $300,000
45 U.S. Aviex 5 $300,000
46 Modesto Superfund Site 9 $300,000
47 Selma Treating Co. 9 $300,000
48 Commencement Bay, South Tacoma Channel, Well 10 $300,000
49 Stanton Cleaners Area Groundwater Contamination Site 2 $270,000
50 Kearsarge Metallurgical Corp. 1 $250,000
51 Butz Landfill 3 $250,000
52 McCormick & Baxter Creosoting Co. 10 $250,000
53 Geneva Industries 6 $240,000
54 La Salle Electrical Utilities 5 $230,000 Data reflect estimates provided by site Remedial Project Managers between February and May 2001. These estimates mayvary from actual values. Data, including the number and status of systems, may change over time.
Notes:1. Fund-lead P&T systems refers to systems where groundwater extraction and treatment is specified in the Record of Decision and
oversight is provided by the EPA or by a State with financial support from Superfund.2. Annual operation and maintenance (O&M) costs are estimates and include such items as labor, utilities, materials, analytical work, etc.3. For a variety of reasons, including recent optimization or litigation, some of the systems with the highest O&M costs in a Region
were not selected for RSEs. Narratives describing the system selection for each Region are included the Regional summaryscreening reports included in Appendix B.

57
Table 6-3: Fund-lead P&T Systems Ranked According to Annual O&M Cost (Page 3 of 4)
Rank Site name Region Annual O&M Cost
55 Islip Municipal Landfill 2 $225,000
56 Verona Well Field 5 $225,000
57 Eastern Surplus Company Superfund Site 1 $200,000
58 Keefe Environmental Systems 1 $200,000
59 Croydon TCE 3 $200,000
60 Onalaska Municipal Landfill 5 $200,000
61 Vestal Water Supply Well 1-1 2 $180,000
62 AIW Frank/Mid-County Mustang Site, OU#1 3 $180,000
63 Elmore Waste Disposal 4 $180,000
64 Midland Products 6 $180,000
65 Eau Claire Municipal Wel Field 5 $175,000
66 Raymark 3 $155,711
67 Berks Sand Pit 3 $150,000
68 FCX Statesville 4 $150,000
69 CryoChem 3 $125,000
70 Douglass Road 5 $120,000
71 North Penn Area 1 3 $100,000
72 Cleburn Street Well Site/OU2 7 $100,000
73 Saunders Supply Company 3 $80,000
74 Wash King Laundry 5 $75,000
75 Arrowhead Refinery 5 $70,000
76 Cape Fear Wood Preserving 4 $40,000
77 City of Perryton Well #2 6 $37,000
78 Better Brite Plating Co. Chrome and Zinc Shops 5 $36,000
79 Benfield Industries 4 $30,000
80 Mohonk Road Industrial Plant Site 2 unknown
81 Dover Municipal Well 4 2 unknown Data reflect estimates provided by site Remedial Project Managers between February and May 2001. These estimates mayvary from actual values. Data, including the number and status of systems, may change over time.
Notes:1. Fund-lead P&T systems refers to systems where groundwater extraction and treatment is specified in the Record of Decision and
oversight is provided by the EPA or by a State with financial support from Superfund.2. Annual operation and maintenance (O&M) costs are estimates and include such items as labor, utilities, materials, analytical work, etc.3. For a variety of reasons, including recent optimization or litigation, some of the systems with the highest O&M costs in a Region
were not selected for RSEs. Narratives describing the system selection for each Region are included the Regional summaryscreening reports included in Appendix B.

58
Table 6-3: Fund-lead P&T Systems Ranked According to Annual O&M Cost (Page 4 of 4)
Rank Site name Region Annual O&M Cost
82 Metal TEC 2 unknown
83 ABC Cleaners 4 unknown
84 Coleman Evans Wood Preserving 4 unknown
85 Duell and Gardner 5 unknown
86 North Cavalcade Superfund Site 6 unknown
87 Valley Park TCE Site - OU2 7 unknown
88 Bunker Hill Superfund Site 10 unknownData reflect estimates provided by site Remedial Project Managers between February and May 2001. These estimates mayvary from actual values. Data, including the number and status of systems, may change over time.
Notes:1. Fund-lead P&T systems refers to systems where groundwater extraction and treatment is specified in the Record of Decision and
oversight is provided by the EPA or by a State with financial support from Superfund.2. Annual operation and maintenance (O&M) costs are estimates and include such items as labor, utilities, materials, analytical work, etc.3. For a variety of reasons, including recent optimization or litigation, some of the systems with the highest O&M costs in a Region
were not selected for RSEs. Narratives describing the system selection for each Region are included the Regional summaryscreening reports included in Appendix B.

59
7.0 CONCLUSIONS AND LESSONS LEARNED
This nationwide effort to identify and gather information on Fund-lead P&T systems resulted in animproved understanding of the number of Fund-lead P&T systems, the specifications and performanceof these systems, and the estimated costs required to operate and maintain these systems. In total, 88operational and pre-operational Fund-lead P&T systems were identified, with pre-operational referringto systems that are identified in a ROD and are in a stage of pre-design, design, or installed but not yetoperating. Of these 88 systems, 67 are operational and 21 are pre-operational. Annual costs for eachsystem ranged from less than $100,000 per year to approximately $4,000,000 per year. The followingfindings result from the cost information for Fund-lead P&T systems:
• The estimated average annual operation and maintenance (O&M) cost for a Fund-lead P&Tsystem (based on those 79 systems providing cost data) is approximately $570,000 and themedian cost is $350,000. The discrepancy between these two statistics is due to a small numberof systems with relatively high O&M costs.
• Based on the 79 systems that provided cost information, the estimated total annual O&M cost foroperating the Fund-lead P&T systems in 2002 is approximately $38 million, with EPA incurringapproximately $32.5 million of the total annual cost and the associated States incurring theremaining $5.5 million.
• Based on the 79 systems that provided cost information, the estimated future cost for Long-termRemedial Action (LTRA) O&M for all of these systems exceeds $210 million with discounting(i.e., net present value) and exceeds $270 million without discounting. LTRA refers to the first10 years of operation of a groundwater or surface water restoration action. During this period,EPA typically funds 90% of the cost and the associated State funds 10% of the costs. Thesepercentages translate directly to the presented costs; therefore, the Superfund is expected to payapproximately $189 million ($243 million without discounting) and the States are expected topay approximately $21 million ($27 million without discounting).
• Based on the 79 systems that provided cost information, the estimated future cost for O&M ofFund-lead P&T systems until remediation completion is achieved is approximately $470 millionwith discounting (net-present value) and $790 million without discounting. (These estimates offuture O&M costs are based on the annual costs of systems and expected durations of systems asspecified by the site managers. For some systems where expected system duration is unknown,a value of 30 years may have been used as a default value for this parameter. While the practiceof using 30 years as a default was prevalent in the past, more recent EPA guidance on feasibilitystudy preparation recommends that 30 years not be used as a default.)
• 13 of the 79 systems that provided costs account for approximately 50% of the total reportedannual O&M costs.
A total of 26 States reportedly have Fund-lead P&T systems. Upon completion of the 10-year LTRAperiod each system will be transferred to its associated State and that State will assume 100% of theremaining O&M costs. For systems where restoration is not a goal (i.e., containment and water supply

60
systems) the systems are typically transferred to the States after one year. The collected data suggest thatthe States will incur between approximately $250 million with discounting or $520 million withoutdiscounting in post-LTRA O&M costs for Fund-lead P&T systems that reported annual O&M costs. Furthermore, the data suggest that the following five States will likely incur 78% of these post-LTRAO&M costs:
• New Jersey (27.6%)
• Massachusetts (22.6%)
• New York (9.7%)
• Pennsylvania (9.6%)
• Michigan (8.4%)
In addition to cost information, the following statistics about the Fund-lead P&T systems were alsogleaned from the information reported by the system RPMs:
• 40 of 67 operating systems are reported to be controlling plume migration.
• 60 of the 67 operating systems have groundwater restoration as a goal but 21 of that 60 do nothave estimates of the progress toward that restoration. Of the 39 systems that have bothgroundwater restoration as a goal and an estimate of progress toward restoration, 7 are estimatedto have made more than 80% progress toward restoration.
• 52 of the 88 systems have three or more primary contaminants of concern, and chlorinatedsolvents are the most prevalent contaminants as they are addressed by 56 of the 88 systems.
• 35 of the 88 Fund-lead P&T systems are associated with sites where non-aqueous phase liquid(NAPL) has either been observed or suspected.
• Carbon adsorption and air stripping are the most prevalent treatment processes (carbonadsorption is used at 50 of the 88 systems and air stripping is used at 41).
• Based on 64 of 88 systems where RPMs were able to determine costs specifically used forgroundwater monitoring, Fund-lead P&T systems have, on average, 23 monitoring wells forgroundwater sampling that are sampled three to four times per year for an average cost of$112,000 per year.
• 36 of the 67 operating systems have previously had performance and effectiveness evaluated andfound “sufficient” while 7 had performance and effectiveness found “not sufficient” (theremaining systems are either being evaluated, have not been evaluated, or have not providedinformation regarding previous effectiveness evaluations).

61
The following items detail lessons learned from this data-collection phase of the NationwideRemediation System Evaluation (RSE) Optimization Project.
Additional RSEs should be commissioned
Although the screening methodology targeted systems in each Region that had effectiveness problems orrelatively high operating costs, a number of systems with similar issues were not selected for RSEs. Some of these unselected systems are receiving third-party optimization evaluations not associated withthis project. Many of the other unselected systems, however, would benefit from third-party optimizatonevaluations such as an RSE. Therefore, additional RSEs should be commissioned to optimize some ofthe remaining Fund-lead systems.
A central database or other information system for Fund-lead systems (not limited to P&T) should bedeveloped and maintained through annual or semi-annual updates by Remedial Project Managers. Consideration should also be given to extend such a database to include non-Fund-lead systems aswell.
• Identifying all of the Fund-lead P&T systems in each Region was greatly facilitated by the projectliaisons in each Region. However, to identify these systems, liaisons were required to interviewbranch chiefs and individual Remedial Project Managers. A central, up-to-date database wouldeliminate the need for repeating this interview process in the future. Managers for each site,including sites new to Superfund, should be required to update site information in a centralinformation system (e.g., a database). The database created for this project offers a solidbeginning. The data in the current database could be made available to site managers so that theymay update it when required rather than reentering all of the information.
• Questions as to the definition of “pump-and-treat” arose repeatedly. In Region 9 well-headtreatment systems were not included, and in Region 8, a NAPL-recovery system was notincluded. Furthermore, soil-vapor-extraction (SVE) systems were also not included. By notincluding these systems in the study, the total amount of Fund-lead expenditures could not beestimated and these systems were not considered for optimization.
• Within each Region, “fact sheets” are prepared for each system by the system’s Remedial ProjectManager (RPMs). As these “fact sheets” are already updated on a regular basis, broadening therequired information on each “fact sheet” would make them the primary information source oneach system. Because they are written documents, these “fact sheets” are more flexible thandatabases. First, they are not constrained to single preformatted answers (e.g., a selection from alist or single number) as is typically required for database questionnaires. Second, they can beused for any type of system or site whereas database questionnaires are typically tailored for aspecific type of system or site. Future databases for specific projects could be easily generatedfrom these “fact sheets”.
• The CERCLIS database and many resources or databases within each Region are available. Consideration should be given to linking the proposed central database to CERCLIS and theseRegional resources.
• Some of the data collected as part of this project may also be relevant for tracking the progress ofnon-Fund-lead systems. Consideration should be given to collecting information on thesesystems as well.

62
Future web-based questionnaires may need to be more lenient in accepting data.
A number of RPMs did not complete questionnaires because information required by the web-basedsurvey (i.e., “required fields”) was not available for the specific system. This repeatedly occurred forplanned P&T systems for which RPMs did not yet have cost estimates or system specifications. Becausethese fields were required in order to save the input, information on many systems had to be gatheredthrough phone interviews.

63
APPENDICES

APPENDIX A

REGION 1 INFORMATION SHEETS

3
State Regulator ContractorDorothy Allen Don Dwight
One Winter Street 30 Harvard Mill Sq.Boston, MA 02108 Wakefield, MA 01880617-292-5795 (phone) 781-224-6286 (phone)617-292-5530 (fax) 781-224-6880 (fax)[email protected] [email protected]
EPA-lead Number of extraction wells: 7
9/30/86 Date of construction completion: 4/1993
Date of operational and functional: 4/1994
Final Expected date of turnover to state: 4/2004
Operational Expected date of completion: 4/2023
Primary goal of system: Containment & Restoration Approximate downtime per year: 2 weeks
Presence of NAPLs Observed Number of monitoring wells used: 80
Approximate annual O&M costs: $3,500,000 Frequency of sampling: 1 times per year
Costs related to monitoring: $200,000 Is plume migration controlled? Yes
Approximate pumping rate: 150 gpm Progress of aquifer restoration: 20% to 80% restored
Evaluated and found sufficient moderate/severe
Contaminants of Concern: Treatment Processes:
192 Heavy metals Metals precipitation yes
227 LNAPL Air stripping yes
291 Pesticides Biological treatment
319 Semi-volatile organic compounds (SVOC) UV oxidation
372 Volatile organic compounds (VOCs) Carbon adsorption yes
Arsenic, BTEX, PAHs Filtration yes
Ion Exchange
2 Reverse Osmosis
108 Off-gas treatment
120 other/not sure
354
Comments:
An LNAPL collection system is currently in place at the site that collects approximately 8 gal/day of pure product. The LNAPL is then shipped off site for incineration.
A full evaluation of the groundwater pump and treat system was just completed in January 2001 and is expected to be implemented within the next calendar year. The major recommendations of this evaluation are to move an extraction well from an area of limited plume contaminantion to the center of the contaminant plume; and the installation of an additional extraction well to address low concentrations of VOCs and aresenic found to the north of the main plume body.
Contact Information
System Information and Data
One Congress Street 11th floor MADEP
Date original ROD was signed:
Date of last modification to ROD:
Boston, MA 02114617-918-1310 (phone)617-918-1291 (fax)
Baird & McGuire Superfund SiteHolbrook, MA (Region 1)
CERCLIS ID MAD001041987
Metcalf & Eddy
RPMMelissa Taylor
Type of Fund-lead Site:
Result of previous evaluation of peformance/effectiveness:
Difficulty (due to social/political factors) of implementing minor/major changes:
Type of ROD:
Status of P&T system:

4
State Regulator ContractorDavid Buckley David O'Connor
One Winter Street 50 McArthur Avenue, Box 689Boston, MA 02108 Devens, MA 01432-4400617-556-1184 (phone) 978-772-0148 (phone)617-292-5530 (fax) 978-772-3104 (fax)[email protected] david.o'[email protected]
EPA-lead Number of extraction wells: 9
3/23/88 Date of construction completion: 9/1998
9/26/98 Date of operational and functional: 9/1999
Final Expected date of turnover to state: 9/2009
Operational Expected date of completion: 9/2028
Primary goal of system: Containment & Restoration Approximate downtime per year: 2 weeks
Presence of NAPLs Don't know Number of monitoring wells used: 20
Approximate annual O&M costs: $450,000 Frequency of sampling: 2 times per year
Costs related to monitoring: $200,000 Is plume migration controlled? Yes
Approximate pumping rate: 30 gpm Progress of aquifer restoration: less than 20% restored
Not evaluated moderate/severe
Contaminants of Concern: Treatment Processes:
62 Arsenic Metals precipitation
66 BTEX Air stripping
114 Chlorobenzene Biological treatment
238 Mercury UV oxidation
340 Tetrahydrofuran Carbon adsorption
1,4-Dioxane Filtration
Ion Exchange
2 Reverse Osmosis
108 Off-gas treatment
120 other/not sure yes
354
Comments:
This system pumps the effluent off-site to a POTW, via the municipal sewer system under a discharge permit. Ground water and leachate are "treated" or let's say, managed by adding an iron sequestering agent (citric acid) to keep iron from precipitating out and clogging the system and weekly biocide shocking to aid in minimizing bacterial growth in the system.
Contact Information
System Information and Data
One Congress Street, Suite 1100 (HBO) MADEP
Date original ROD was signed:
Date of last modification to ROD:
Boston, MA 02114-2023617-918-1332 (phone)617-918-1291 (fax)
Charles George Landfill Superfund SiteTyngsboro, MA (Region 1)
CERCLIS ID MAD003809266
USACE North Central Residnet Office
RPMElaine Stanley
Type of Fund-lead Site:
Result of previous evaluation of peformance/effectiveness:
Difficulty (due to social/political factors) of implementing minor/major changes:
Type of ROD:
Status of P&T system:

2
State Regulator ContractorRebecca Hewett Gordon Bullard
17 State House Station 55 Jonspin RoadAugusta, ME 04333-0017 Wilmington, MA 01887207-287-8554 (phone) 978-658-7899 (phone)207-287-7826 (fax) 978-658-7870 (fax)[email protected] [email protected]
EPA-lead Number of extraction wells: 12
9/28/00 Date of construction completion: 8/2001
Date of operational and functional: 10/2001
Final Expected date of turnover to state: 9/2011
Being Installed Expected date of completion: 9/2007
Primary goal of system: Containment & Restoration Approximate downtime per year: 2 weeks
Presence of NAPLs Suspected Number of monitoring wells used: 30
Approximate annual O&M costs: $200,000 Frequency of sampling: 2 times per year
Costs related to monitoring: $0 Is plume migration controlled?
Approximate pumping rate: 20 gpm Progress of aquifer restoration:
Not evaluated minor/moderate
Contaminants of Concern: Treatment Processes:
249 Methylene Chloride Metals precipitation
PCE Air stripping
Biological treatment
UV oxidation
Carbon adsorption yes
Filtration yes
Ion Exchange yes
2 Reverse Osmosis
108 Off-gas treatment
120 other/not sure
354
Comments:
There is a limited system in place as part of a NTCRA to control plume migration. The ROD requires that the system be upgraded for groundwater restoration. The design will complete in May and final construction could occur this summer.
Contact Information
System Information and Data
1 Congress Street, Suite 1100, mailcode: HBT Maine DEP
Date original ROD was signed:
Date of last modification to ROD:
Boston, MA 02114617-918-1372 (phone)617-918-1291 (fax)
Eastern Surplus Company Superfund SiteMeddybemps, ME (Region 1)CERCLIS ID MED981073711
TTNUS
RPMEdward Hathaway
Type of Fund-lead Site:
Result of previous evaluation of peformance/effectiveness:
Difficulty (due to social/political factors) of implementing minor/major changes:
Type of ROD:
Status of P&T system:

5
State Regulator ContractorJanet Waldron Cinthia Mclane
One Winter Street 30 Harvard Mill SquareBoston, MA 02108 Wakefield, MA 01880617-556-1156 (phone) 781-224-6377 (phone)617-556-1118 (fax) 781-245-6293 (fax)[email protected] [email protected]
EPA-lead Number of extraction wells: 10
9/9/91 Date of construction completion: 4/2000
11/15/96 Date of operational and functional: 5/2001
Final Expected date of turnover to state: 4/2011
Operational Expected date of completion: 4/2031
Primary goal of system: Containment & Restoration Approximate downtime per year: 1 week
Presence of NAPLs Don't know Number of monitoring wells used: 21
Approximate annual O&M costs: $500,000 Frequency of sampling: 1 times per year
Costs related to monitoring: $50,000 Is plume migration controlled? Don't know
Approximate pumping rate: 140 gpm Progress of aquifer restoration: Don't know
Evaluated and found sufficient minor/minor
Contaminants of Concern: Treatment Processes:
354 Trichlorethylene (TCE)/Tetrachloroelthylene (PCE) Metals precipitation yes
Air stripping
Biological treatment
UV oxidation yes
Carbon adsorption yes
Filtration yes
Ion Exchange
2 Reverse Osmosis
108 Off-gas treatment
120 other/not sure
354
Comments:
Contact Information
System Information and Data
One Congress Street - Suite 1100 (HBO) MADEP
Date original ROD was signed:
Date of last modification to ROD:
Boston, MA 02114617-918-1448 (phone)617-918-1291 (fax)
Groveland Wells Superfund SiteGroveland, MA (Region 1)
CERCLIS ID MAD980732317
Metcalf & Eddy
RPMDerrick Golden
Type of Fund-lead Site:
Result of previous evaluation of peformance/effectiveness:
Difficulty (due to social/political factors) of implementing minor/major changes:
Type of ROD:
Status of P&T system:

7
State Regulator ContractorPaul Lincoln Bette Nowack
6 Hazen Drive 1 Wall St.Concord, NH 03301 Manchester, NH 03101603-271-2911 (phone) 603-656-5400 (phone)603-271-2456 (fax)[email protected]
State-lead w/ Fund $ Number of extraction wells: 14
9/28/90 Date of construction completion: 9/1993
Date of operational and functional: 9/1993
Final Expected date of turnover to state: 9/2003
Operational Expected date of completion: 9/2005
Primary goal of system: Restoration Approximate downtime per year: 4 weeks
Presence of NAPLs Suspected Number of monitoring wells used: 30
Approximate annual O&M costs: $250,000 Frequency of sampling: 2 times per year
Costs related to monitoring: $30,000 Is plume migration controlled? Yes
Approximate pumping rate: 42 gpm Progress of aquifer restoration: more than 80% restored
Evaluated and found sufficient moderate/moderate
Contaminants of Concern: Treatment Processes:
2 1,1,1-Trichloroethane Metals precipitation
357 Trichloroethylene (TCE) Air stripping yes
Biological treatment
UV oxidation
Carbon adsorption
Filtration
Ion Exchange
2 Reverse Osmosis
108 Off-gas treatment yes
120 other/not sure
354
Comments:
RPMDick Goehlert
Type of Fund-lead Site:
Result of previous evaluation of peformance/effectiveness:
Difficulty (due to social/political factors) of implementing minor/major changes:
Type of ROD:
Status of P&T system:
Kearsarge Metallurgical Corp.Conway, NH (Region 1)
CERCLIS ID NHD062002001
Weston
Doug Sutton filled out this form based on a phone interview with Dick Goehlert.
The 2005 completion date is an estimate for 90% of the system. A few wells, pumping at a much lower rate will likely continue for longer
Contact Information
System Information and Data
One Congress Street NHDES
Date original ROD was signed:
Date of last modification to ROD:
Boston, MA 02114-2023617-918-1335 (phone)617-918-1291 (fax)
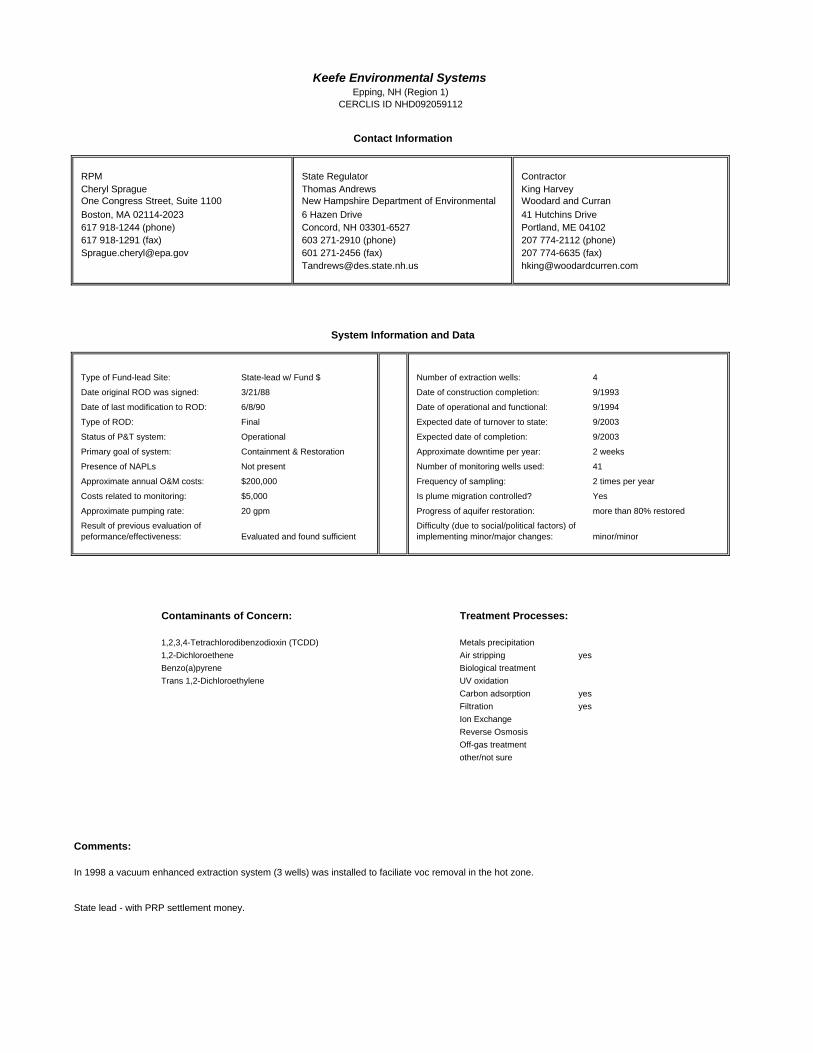
8
State Regulator ContractorThomas Andrews King Harvey
6 Hazen Drive 41 Hutchins DriveConcord, NH 03301-6527 Portland, ME 04102603 271-2910 (phone) 207 774-2112 (phone)601 271-2456 (fax) 207 774-6635 (fax)[email protected] [email protected]
State-lead w/ Fund $ Number of extraction wells: 4
3/21/88 Date of construction completion: 9/1993
6/8/90 Date of operational and functional: 9/1994
Final Expected date of turnover to state: 9/2003
Operational Expected date of completion: 9/2003
Primary goal of system: Containment & Restoration Approximate downtime per year: 2 weeks
Presence of NAPLs Not present Number of monitoring wells used: 41
Approximate annual O&M costs: $200,000 Frequency of sampling: 2 times per year
Costs related to monitoring: $5,000 Is plume migration controlled? Yes
Approximate pumping rate: 20 gpm Progress of aquifer restoration: more than 80% restored
Evaluated and found sufficient minor/minor
Contaminants of Concern: Treatment Processes:
7 1,2,3,4-Tetrachlorodibenzodioxin (TCDD) Metals precipitation
15 1,2-Dichloroethene Air stripping yes
73 Benzo(a)pyrene Biological treatment
352 Trans 1,2-Dichloroethylene UV oxidation
Carbon adsorption yes
Filtration yes
Ion Exchange
2 Reverse Osmosis
108 Off-gas treatment
120 other/not sure
354
Comments:
RPMCheryl Sprague
Type of Fund-lead Site:
Result of previous evaluation of peformance/effectiveness:
Difficulty (due to social/political factors) of implementing minor/major changes:
Type of ROD:
Status of P&T system:
Keefe Environmental SystemsEpping, NH (Region 1)
CERCLIS ID NHD092059112
Woodard and Curran
In 1998 a vacuum enhanced extraction system (3 wells) was installed to faciliate voc removal in the hot zone.
State lead - with PRP settlement money.
Contact Information
System Information and Data
One Congress Street, Suite 1100 New Hampshire Department of Environmental Services
Date original ROD was signed:
Date of last modification to ROD:
Boston, MA 02114-2023617 918-1244 (phone)617 918-1291 (fax)
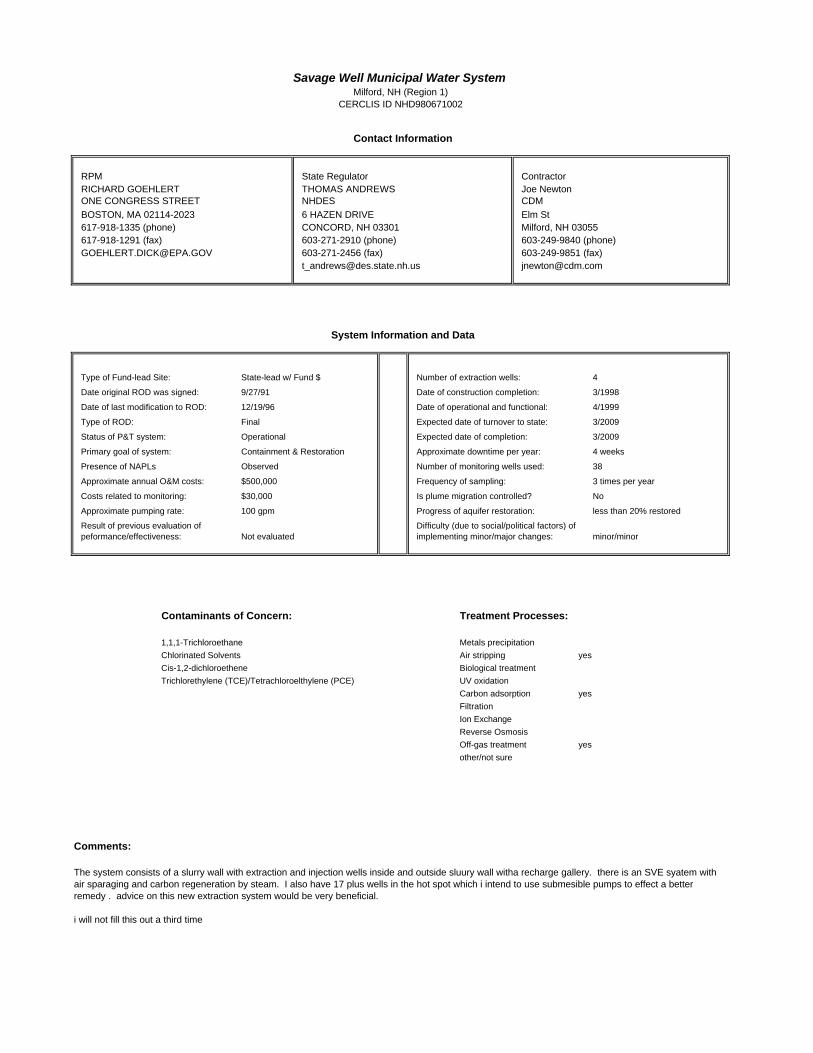
6
State Regulator ContractorTHOMAS ANDREWS Joe Newton
6 HAZEN DRIVE Elm StCONCORD, NH 03301 Milford, NH 03055603-271-2910 (phone) 603-249-9840 (phone)603-271-2456 (fax) 603-249-9851 (fax)[email protected] [email protected]
State-lead w/ Fund $ Number of extraction wells: 4
9/27/91 Date of construction completion: 3/1998
12/19/96 Date of operational and functional: 4/1999
Final Expected date of turnover to state: 3/2009
Operational Expected date of completion: 3/2009
Primary goal of system: Containment & Restoration Approximate downtime per year: 4 weeks
Presence of NAPLs Observed Number of monitoring wells used: 38
Approximate annual O&M costs: $500,000 Frequency of sampling: 3 times per year
Costs related to monitoring: $30,000 Is plume migration controlled? No
Approximate pumping rate: 100 gpm Progress of aquifer restoration: less than 20% restored
Not evaluated minor/minor
Contaminants of Concern: Treatment Processes:
2 1,1,1-Trichloroethane Metals precipitation
108 Chlorinated Solvents Air stripping yes
120 Cis-1,2-dichloroethene Biological treatment
354 Trichlorethylene (TCE)/Tetrachloroelthylene (PCE) UV oxidation
Carbon adsorption yes
Filtration
Ion Exchange
2 Reverse Osmosis
108 Off-gas treatment yes
120 other/not sure
354
Comments:
The system consists of a slurry wall with extraction and injection wells inside and outside sluury wall witha recharge gallery. there is an SVE syatem with air sparaging and carbon regeneration by steam. I also have 17 plus wells in the hot spot which i intend to use submesible pumps to effect a better remedy . advice on this new extraction system would be very beneficial.
i will not fill this out a third time
Contact Information
System Information and Data
ONE CONGRESS STREET NHDES
Date original ROD was signed:
Date of last modification to ROD:
BOSTON, MA 02114-2023617-918-1335 (phone)617-918-1291 (fax)
Savage Well Municipal Water SystemMilford, NH (Region 1)
CERCLIS ID NHD980671002
CDM
RPMRICHARD GOEHLERT
Type of Fund-lead Site:
Result of previous evaluation of peformance/effectiveness:
Difficulty (due to social/political factors) of implementing minor/major changes:
Type of ROD:
Status of P&T system:

1
State Regulator ContractorJanet Waldron John Haley
One Winter Street, 7th Floor 133 Federal Street, 6th FloorBoston, MA 02108 Boston, MA 02110617-556-1156 (phone) 617-457-8200 (phone)617-292-5530 (fax) 617-457-8498 (fax)[email protected] [email protected]
EPA-lead Number of extraction wells: 31
9/19/91 Date of construction completion: 11/1995
Date of operational and functional: 9/1997
Final Expected date of turnover to state: 9/2007
Operational Expected date of completion: 12/2017
Primary goal of system: Containment & Restoration Approximate downtime per year: 2 weeks
Presence of NAPLs Observed Number of monitoring wells used: 47
Approximate annual O&M costs: $1,400,000 Frequency of sampling: 2 times per year
Costs related to monitoring: $160,000 Is plume migration controlled? No
Approximate pumping rate: 25 gpm Progress of aquifer restoration: less than 20% restored
Evaluated and found not sufficient minor/minor
Contaminants of Concern: Treatment Processes:
3 1,1,2,2-Tetrachloroethane Metals precipitation yes
6 1,1-Dichloroethylene (DCE) Air stripping yes
42 Acids Biological treatment
74 Benzo(b)fluoranthene UV oxidation
250 Methylphenol Carbon adsorption
324 Solid Propellants Filtration yes
352 Trans 1,2-Dichloroethylene Ion Exchange
2 371 Volatile chlorinated organics Reverse Osmosis
108 Off-gas treatment yes
120 other/not sure
354
Comments:
Operations Contractor provides semi-annual status reports of the P&T system including recommendations for P&T improvements. Improvements to the source control approach are currently being evaluated and a ROD Amendment is anticipated.
Contact Information
System Information and Data
1 Congress Street, Suite 1100, HBO MADEP
Date original ROD was signed:
Date of last modification to ROD:
Boston, MA 02114-2023617-918-1324 (phone)617-918-1291 (fax)
Silresim Chemical Corp.Lowell, MA (Region 1)
CERCLIS ID MAD000192393
Foster Wheeler Env. Corp.
RPMChester Janowski
Type of Fund-lead Site:
Result of previous evaluation of peformance/effectiveness:
Difficulty (due to social/political factors) of implementing minor/major changes:
Type of ROD:
Status of P&T system:

REGION 2 INFORMATION SHEETS

14
State Regulator ContractorJoseph Yavonditte Feeney Richard
50 Wolf Road 1000 The American RoadAlbany, NY 12233 Morris Plains, NJ 07950518-457-9285 (phone) 973-630-8092 (phone)518-457-7743 (fax) 973-630-8111 (fax)[email protected] [email protected]
EPA-lead Number of extraction wells: 14
6/29/90 Date of construction completion: 9/1998
Date of operational and functional: 9/1998
Final Expected date of turnover to state: 10/2008
Operational Expected date of completion: 9/2028
Primary goal of system: Containment & Restoration Approximate downtime per year: 0 weeks
Presence of NAPLs Suspected Number of monitoring wells used: 19
Approximate annual O&M costs: $1,175,000 Frequency of sampling: 12 times per year
Costs related to monitoring: Is plume migration controlled? Yes
Approximate pumping rate: 70 gpm Progress of aquifer restoration: less than 20% restored
Evaluated and found sufficient minor/severe
Contaminants of Concern: Treatment Processes:
17 1,2-Dichloropropane Metals precipitation yes
355 Trichlorobenzene Air stripping yes
Tetrachloroethylene (PCE) Biological treatment
UV oxidation
Carbon adsorption yes
Filtration yes
Ion Exchange
2 Reverse Osmosis
108 Off-gas treatment
120 other/not sure
354
Comments:
Based on cumulative long-term monitoring data, the system has currently been modified in order to optimize performance.
Contact Information
System Information and Data
290 Broadway NYSDEC
Date original ROD was signed:
Date of last modification to ROD:
New York, NY 12233212-637-4257 (phone)212-637-3966 (fax)
American ThermostatSouth Cairo, NY (Region 2)
CERCLIS ID NYD002066330
Foster Wheeler Env. Corporation
RPMChristos Tsiamis
Type of Fund-lead Site:
Result of previous evaluation of peformance/effectiveness:
Difficulty (due to social/political factors) of implementing minor/major changes:
Type of ROD:
Status of P&T system:

15
State Regulator ContractorCraig Wallace George Paprocki
401 E State St. Ft. MonmouthTrenton, NJ 08625 Eatontown, NJ 07703609 984 2990 (phone) 732 389 3040 (phone)609 633 2360 (fax) 732 389 1564 (fax)[email protected] [email protected]
EPA-lead Number of extraction wells: 33
6/28/89 Date of construction completion: 5/1994
Date of operational and functional: 8/1994
Final Expected date of turnover to state: 9/2004
Operational Expected date of completion: 12/2024
Primary goal of system: Containment & Restoration Approximate downtime per year: 4 weeks
Presence of NAPLs Observed Number of monitoring wells used: 9
Approximate annual O&M costs: $460,000 Frequency of sampling: 1 times per year
Costs related to monitoring: $100,000 Is plume migration controlled? Yes
Approximate pumping rate: 30 gpm Progress of aquifer restoration: 20% to 80% restored
Evaluated and found sufficient minor/minor
Contaminants of Concern: Treatment Processes:
2 1,1,1-Trichloroethane Metals precipitation yes
352 Trans 1,2-Dichloroethylene Air stripping yes
71 Benzene and Toluene Biological treatment
28 2,4-Dimethylphenol UV oxidation
294 Phenol Carbon adsorption yes
copper, lead,zinc Filtration yes
Ion Exchange
2 Reverse Osmosis
108 Off-gas treatment
120 other/not sure
354
Comments:
RPMEdward Finnerty
Type of Fund-lead Site:
Result of previous evaluation of peformance/effectiveness:
Difficulty (due to social/political factors) of implementing minor/major changes:
Type of ROD:
Status of P&T system:
Bog Creek Farm LTRAHowell, NJ (Region 2)
CERCLIS ID NJD063157150
USACE
The EPA will not meet the cleanup goal of 5ppb for benzene in the first ten years. The State's new criteria for benzene is 1ppb. This cleanup target may not be achievable, hence a 30 year remediation time (to the year 2024) was used as a default. The costs in #16 ($100,000) include sampling 9 monitoring wells and 33 extractions wells.
Contact Information
System Information and Data
290 Broadway NJDEP
Date original ROD was signed:
Date of last modification to ROD:
New York, NY 10007212 637 4367 (phone)212-637-4393 (fax)

16
State Regulator ContractorGeorge Momberger Dawn Cermak
50 Wolf Road Box 71A Route 518, Franklin TwspAlbany, NY 12233 Princeton, NJ 08540518-457-0927 (phone) 732-297-0432 (phone)518-457-8989 (fax) 732-297-0441 (fax)[email protected] [email protected]
EPA-lead Number of extraction wells: 4
9/30/86 Date of construction completion: 4/1997
12/2/96 Date of operational and functional: 9/1997
Final Expected date of turnover to state: 10/2007
Operational Expected date of completion: 10/2007
Primary goal of system: Containment & Restoration Approximate downtime per year:
Presence of NAPLs Suspected Number of monitoring wells used: 16
Approximate annual O&M costs: $400,000 Frequency of sampling: 4 times per year
Costs related to monitoring: $244,000 Is plume migration controlled? Yes
Approximate pumping rate: 50 gpm Progress of aquifer restoration: Don't know
Not evaluated minor/minor
Contaminants of Concern: Treatment Processes:
16 1,2-Dichloroethylene (DCE) Metals precipitation
354 Trichlorethylene (TCE)/Tetrachloroelthylene (PCE) Air stripping yes
Biological treatment
UV oxidation
Carbon adsorption
Filtration
Ion Exchange
2 Reverse Osmosis
108 Off-gas treatment
120 other/not sure
354
Comments:
Qs #15 & 16: Breakdown of approximate annual O&M cost for long-term groundwater monitoring is of ballpark rough estimate. Qs #25 & 26: 8 monitoring wells are monitored quarterly and 8 other monitoring wells are monitored annually (concurrent w/ one of the quarterly monitoring).
Contact Information
System Information and Data
290 Broadway NYSDEC
Date original ROD was signed:
Date of last modification to ROD:
New York, NY 10007212-637-4267 (phone)212-637-3966 (fax)
Brewster WellfieldBrewster, NY (Region 2)CERCLIS ID 0202153
Sevenson Env.Services, Inc
RPMLisa Wong
Type of Fund-lead Site:
Result of previous evaluation of peformance/effectiveness:
Difficulty (due to social/political factors) of implementing minor/major changes:
Type of ROD:
Status of P&T system:

17
State Regulator ContractorJeffrey Trad Shewen Bian
50 Wolf Road 1900 Hempstead Turnpike, Suite 16Albany, NY 12233-7010 East Meadow, NY 11554518-457-9285 (phone) 516-794-2913 (phone)518-457-7743 (fax) 516-794-2975 (fax)[email protected]
EPA-lead Number of extraction wells: 3
9/30/94 Date of construction completion: 6/2000
Date of operational and functional: 5/15/2001
Final Expected date of turnover to state: 6/2010
Operational Expected date of completion: 6/2003
Primary goal of system: Restoration Approximate downtime per year: 6 weeks
Presence of NAPLs Not present Number of monitoring wells used: 19
Approximate annual O&M costs: $480,000 Frequency of sampling: 4 times per year
Costs related to monitoring: $45,000 Is plume migration controlled? Yes
Approximate pumping rate: 80 gpm Progress of aquifer restoration: less than 20% restored
Evaluated and found sufficient minor/moderate
Contaminants of Concern: Treatment Processes:
2 1,1,1-Trichloroethane Metals precipitation
5 1,1-Dichloroethane Air stripping yes
6 1,1-Dichloroethylene (DCE) Biological treatment
357 Trichloroethylene (TCE) UV oxidation
Carbon adsorption yes
Filtration yes
Ion Exchange
2 Reverse Osmosis
108 Off-gas treatment
120 other/not sure
354
Comments:
Doug Sutton completed this questionnaire based on a phone interview with Sharon Trocher.
1,1,1 TCA is primary contaminant of concern
The remedial action is expected to be complete before turnover to the state.
Monitoring frequency will soon decrease from quarterly to semi-annually or annually.
Contact Information
System Information and Data
290 Broadway NYSDEC
Date original ROD was signed:
Date of last modification to ROD:
New York, NY 10007-1866212-637-3965 (phone)212-637-3966 (fax)
CircuitronEast Farmingdale, NY (Region 2)
CERCLIS ID NYD981184229
USACE, New York District
RPMSharon Trocher
Type of Fund-lead Site:
Result of previous evaluation of peformance/effectiveness:
Difficulty (due to social/political factors) of implementing minor/major changes:
Type of ROD:
Status of P&T system:

18
State Regulator ContractorJeff Trad Mark Kucera
50 Wolf Road 501 Winding RoadAlbany, NY 12218 Old Bethpage, NY 11804518-457-9285 (phone) 516-249-8912 (phone)518-457-7743 (fax) 516-249-8928 (fax)[email protected] [email protected]
EPA-lead Number of extraction wells: 3
9/28/90 Date of construction completion: 12/1998
Date of operational and functional: 2/2000
Final Expected date of turnover to state: 2/2010
Operational Expected date of completion: 2/2020
Primary goal of system: Containment & Restoration Approximate downtime per year: 2 weeks
Presence of NAPLs Don't know Number of monitoring wells used: 14
Approximate annual O&M costs: $740,000 Frequency of sampling: 4 times per year
Costs related to monitoring: Is plume migration controlled? Yes
Approximate pumping rate: 420 gpm Progress of aquifer restoration: Don't know
Not evaluated minor/minor
Contaminants of Concern: Treatment Processes:
2 1,1,1-Trichloroethane Metals precipitation yes
346 Toluene Air stripping yes
373 Xylene Biological treatment
PCE UV oxidation
Carbon adsorption yes
Filtration
Ion Exchange
2 Reverse Osmosis
108 Off-gas treatment
120 other/not sure
354
Comments:
RPMMaria Jon
Type of Fund-lead Site:
Result of previous evaluation of peformance/effectiveness:
Difficulty (due to social/political factors) of implementing minor/major changes:
Type of ROD:
Status of P&T system:
Claremont Polychemical Corp.Town of Oyster Bay, NY (Region 2)
CERCLIS ID NYD002044584
U.S. Army Corps of Engineers
The date in #22 is an estimate.
Contact Information
System Information and Data
290 Broadway, 20th Floor NYSDEC
Date original ROD was signed:
Date of last modification to ROD:
New York, NY 10007212-637-3967 (phone)212-637-4284 (fax)

19
State Regulator ContractorPaula Walshe James Nash
401 East State St. 25 West Highand AvenueTrenton, NJ 08625 Atlantic Highlands, NJ 07716609-633-1119 (phone) 732-291-7773 (phone)609-292-1975 (fax) 732-291-7776 (fax)[email protected]
State-lead w/ Fund $ Number of extraction wells: 19
9/23/86 Date of construction completion: 6/1998
Date of operational and functional: 9/1998
Final Expected date of turnover to state: 9/2008
Operational Expected date of completion: 9/2028
Primary goal of system: Containment & Restoration Approximate downtime per year: 1 week
Presence of NAPLs Not present Number of monitoring wells used: 36
Approximate annual O&M costs: $920,000 Frequency of sampling: 2 times per year
Costs related to monitoring: $480,000 Is plume migration controlled? No
Approximate pumping rate: 121 gpm Progress of aquifer restoration: Don't know
Evaluated and found not sufficient minor/moderate
Contaminants of Concern: Treatment Processes:
19 1,4-Dichlorobenzene Metals precipitation yes
70 Benzene Air stripping
97 Carbon tetrachloride Biological treatment yes
114 Chlorobenzene UV oxidation
115 Chloroform Carbon adsorption yes
170 Ethylbenzene Filtration yes
249 Methylene Chloride Ion Exchange
2 346 Toluene Reverse Osmosis
108 Off-gas treatment
120 other/not sure
354
Comments:
Combe Fill South is currently the subject of litigation.
Contact Information
System Information and Data
290 Broadway NJDEP
Date original ROD was signed:
Date of last modification to ROD:
New York, NY 10007-1866212-637-4416 (phone)212-637-4393 (fax)
Combe Fill South LandfillChester Township, NJ (Region 2)
CERCLIS ID NJD94966611
Chapman, Inc.
RPMPamela J. Baxter
Type of Fund-lead Site:
Result of previous evaluation of peformance/effectiveness:
Difficulty (due to social/political factors) of implementing minor/major changes:
Type of ROD:
Status of P&T system:

33
State Regulator ContractorMary Lou Parra Kamala Morgan
401 East State Street 601 East 12th StreetTrenton, NJ 08625 Kansas City, MO 64106609-633-3618 (phone) 818-983-3577 (phone)
EPA-lead Number of extraction wells:
9/30/92 Date of construction completion:
Date of operational and functional:
Final Expected date of turnover to state:
Predesign Expected date of completion:
Primary goal of system: Restoration Approximate downtime per year:
Presence of NAPLs Not present Number of monitoring wells used:
Approximate annual O&M costs: Frequency of sampling:
Costs related to monitoring: Is plume migration controlled?
Approximate pumping rate: Progress of aquifer restoration:
minor/minor
Contaminants of Concern: Treatment Processes:
354 Trichlorethylene (TCE)/Tetrachloroelthylene (PCE) Metals precipitation
Air stripping
Biological treatment
UV oxidation
Carbon adsorption
Filtration
Ion Exchange
2 Reverse Osmosis
108 Off-gas treatment
120 other/not sure
354
Comments:
Do not know if pump and treat will be used. May decide against it and may use well head treatment.
Light industrial site with many sources; trying to find sources.
No NAPL observed, but some may be down gradient and not addressed by addressor or by the state.
Contact Information
System Information and Data
290 Broadway NJDEP
Date original ROD was signed:
Date of last modification to ROD:
New York, NY 10007-1866212-637-4947 (phone)
Dover Municipal Well 4Dover, NJ (Region 2)
CERCLIS ID NJD980654131
USACE
RPMDiego Garcia
Type of Fund-lead Site:
Result of previous evaluation of peformance/effectiveness:
Difficulty (due to social/political factors) of implementing minor/major changes:
Type of ROD:
Status of P&T system:

20
State Regulator ContractorAkshay Parikh Steven Gillespie
401 E. State Street, P.O. Box 413 2749 Lockport RoadTrenton, NJ 08625 Niagara Falls, NY 14305609-777-0693 (phone) 856-905-0782 (phone)609-633-2360 (fax) 856-697-9187 (fax)[email protected] [email protected]
EPA-lead Number of extraction wells: 15
9/26/91 Date of construction completion: 3/1999
Date of operational and functional: 9/2000
Final Expected date of turnover to state: 10/2009
Operational Expected date of completion: 9/2029
Primary goal of system: Containment & Restoration Approximate downtime per year:
Presence of NAPLs Not present Number of monitoring wells used: 27
Approximate annual O&M costs: $500,000 Frequency of sampling: 2 times per year
Costs related to monitoring: $125,000 Is plume migration controlled? No
Approximate pumping rate: 300 gpm Progress of aquifer restoration: Don't know
Currently being evaluated minor/minor
Contaminants of Concern: Treatment Processes:
352 Trans 1,2-Dichloroethylene Metals precipitation
354 Trichlorethylene (TCE)/Tetrachloroelthylene (PCE) Air stripping yes
Biological treatment
UV oxidation
Carbon adsorption yes
Filtration
Ion Exchange
2 Reverse Osmosis
108 Off-gas treatment
120 other/not sure
354
Comments:
First this questionaire only allowed one Cerclis ID to be entered, even though these are two separate sites being remediated under one ROD. The South Jersey Clothing Company. The pump and treat system has been recovering and treating groundwater with lower concentrations of TCE and PCE than expected. In addition, both TCE and PCE have been detected in the furthest downgradient sentinel wells, implying that a portion of the plume has migrated beyond the current network of extraction wells. The USACE has been tasked by the USEPA to determine if there are additional sources of contamination downgradient of the original source areas and to determine more optimal locations of groundwater extraction wells. Additionally, the Army Corp, through their contractor, will review the treatment system design in an effort to optimize the treatment process and hydraulic capacity of the system. ID is NJD980766828.
Contact Information
System Information and Data
290 Broadway, 19th Floor N.J.D.E.P.
Date original ROD was signed:
Date of last modification to ROD:
New York, NY 10007212-637-4381 (phone)212-637-4393 (fax)
Garden State Cleaners/South Jersey Clothing CompanyMinotola, NJ (Region 2)
CERCLIS ID NJD053280160
Sevenson Env. Services, Inc.
RPMBrian Quinn
Type of Fund-lead Site:
Result of previous evaluation of peformance/effectiveness:
Difficulty (due to social/political factors) of implementing minor/major changes:
Type of ROD:
Status of P&T system:

21
State Regulator ContractorDawn Cermail
401 East State St. 71A Route 518Trenton, NJ 08625 Princeton, NJ 08540
732-297-0432 (phone)732-297-0441 (fax)[email protected]
EPA-lead Number of extraction wells: 20
9/30/92 Date of construction completion: 5/1998
Date of operational and functional: 1/1999
Final Expected date of turnover to state: 1/2009
Operational Expected date of completion: 9/2028
Primary goal of system: Containment & Restoration Approximate downtime per year: 4 weeks
Presence of NAPLs Not present Number of monitoring wells used: 34
Approximate annual O&M costs: $1,000,000 Frequency of sampling: 3 times per year
Costs related to monitoring: $800,000 Is plume migration controlled? Yes
Approximate pumping rate: 30 gpm Progress of aquifer restoration: less than 20% restored
Not evaluated minor/moderate
Contaminants of Concern: Treatment Processes:
41 Acetone Metals precipitation yes
62 Arsenic Air stripping yes
105 Chloride Biological treatment
114 Chlorobenzene UV oxidation
346 Toluene Carbon adsorption
373 Xylene Filtration yes
Ion Exchange yes
2 Reverse Osmosis
108 Off-gas treatment
120 other/not sure
354
Comments:
RPMPamela J. Baxter
Type of Fund-lead Site:
Result of previous evaluation of peformance/effectiveness:
Difficulty (due to social/political factors) of implementing minor/major changes:
Type of ROD:
Status of P&T system:
Higgins FarmFranklin Township, NJ (Region 2)
CERCLIS ID NJD981490261
Sevenson Env. Service, Inc.
Site is currently the subject of litigation.17: Designed for 100 gpm actually getting 30gpm20: Month of O&F is an estimate26: This represents an average. Some wells are sampled semi-annually and some quarterlyFrom Region 2 Hydrogeologist Rob Alvey--Fractured rock site.Stringent discharge permit.
Contact Information
System Information and Data
290 Broadway NJDEP
Date original ROD was signed:
Date of last modification to ROD:
New York, NY 10007-1866212-637-4416 (phone)212-637-4393 (fax)

22
State Regulator ContractorCarl Hoffman Paul DiMaria
50 Wolf Road 401 Main StreetAlbany, NY 12233 Islip, NY 11751518-457-9538 (phone) 631-224-5644 (phone)518-457-4198 (fax) 631-224-5645 (fax)[email protected] [email protected]
State-lead w/ Fund $ Number of extraction wells: 6
9/19/92 Date of construction completion: 9/1996
Date of operational and functional: 9/1997
Final Expected date of turnover to state: 9/2006
Operational Expected date of completion: 1/2003
Primary goal of system: Containment & Restoration Approximate downtime per year: 1 week
Presence of NAPLs Not present Number of monitoring wells used: 24
Approximate annual O&M costs: $225,000 Frequency of sampling: 4 times per year
Costs related to monitoring: $95,000 Is plume migration controlled? Yes
Approximate pumping rate: 300 gpm Progress of aquifer restoration: 20% to 80% restored
Evaluated and found sufficient minor/minor
Contaminants of Concern: Treatment Processes:
372 Volatile organic compounds (VOCs) Metals precipitation yes
Air stripping yes
Biological treatment
UV oxidation
Carbon adsorption
Filtration
Ion Exchange
2 Reverse Osmosis
108 Off-gas treatment
120 other/not sure
354
Comments:
RPMMark Dannenberg
Type of Fund-lead Site:
Result of previous evaluation of peformance/effectiveness:
Difficulty (due to social/political factors) of implementing minor/major changes:
Type of ROD:
Status of P&T system:
Islip Municipal LandfillIslip, NY (Region 2)
CERCLIS ID NYD980506901
Islip Resource Recovery Agency
Contact Information
System Information and Data
290 Broadway NYSDEC
Date original ROD was signed:
Date of last modification to ROD:
New York, NY 10007212-637-4251 (phone)212-637-3966 (fax)
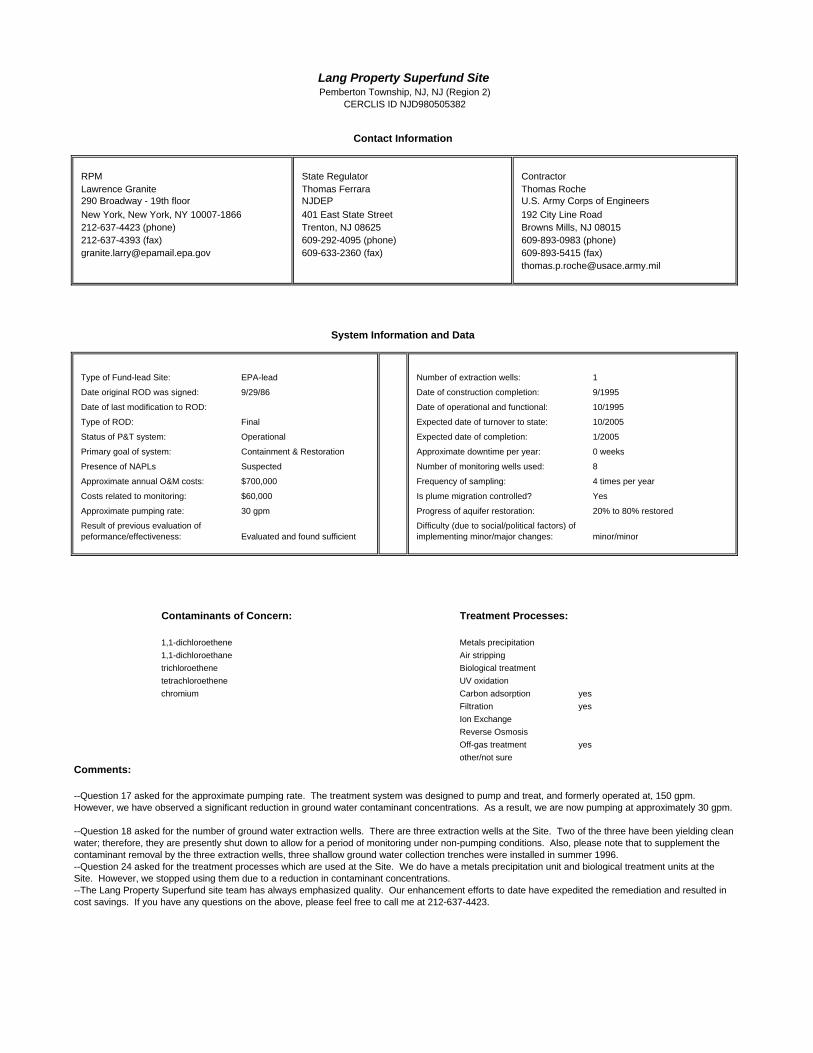
23
State Regulator ContractorThomas Ferrara Thomas Roche
401 East State Street 192 City Line RoadTrenton, NJ 08625 Browns Mills, NJ 08015609-292-4095 (phone) 609-893-0983 (phone)609-633-2360 (fax) 609-893-5415 (fax)
EPA-lead Number of extraction wells: 1
9/29/86 Date of construction completion: 9/1995
Date of operational and functional: 10/1995
Final Expected date of turnover to state: 10/2005
Operational Expected date of completion: 1/2005
Primary goal of system: Containment & Restoration Approximate downtime per year: 0 weeks
Presence of NAPLs Suspected Number of monitoring wells used: 8
Approximate annual O&M costs: $700,000 Frequency of sampling: 4 times per year
Costs related to monitoring: $60,000 Is plume migration controlled? Yes
Approximate pumping rate: 30 gpm Progress of aquifer restoration: 20% to 80% restored
Evaluated and found sufficient minor/minor
Contaminants of Concern: Treatment Processes:
8 1,1-dichloroethene Metals precipitation
1,1-dichloroethane Air stripping
trichloroethene Biological treatment
tetrachloroethene UV oxidation
chromium Carbon adsorption yes
Filtration yes
Ion Exchange
2 Reverse Osmosis
108 Off-gas treatment yes
120 other/not sure
Comments:
RPMLawrence Granite
Type of Fund-lead Site:
Result of previous evaluation of peformance/effectiveness:
Difficulty (due to social/political factors) of implementing minor/major changes:
Type of ROD:
Status of P&T system:
Lang Property Superfund SitePemberton Township, NJ, NJ (Region 2)
CERCLIS ID NJD980505382
U.S. Army Corps of Engineers
--Question 17 asked for the approximate pumping rate. The treatment system was designed to pump and treat, and formerly operated at, 150 gpm. However, we have observed a significant reduction in ground water contaminant concentrations. As a result, we are now pumping at approximately 30 gpm.
--Question 18 asked for the number of ground water extraction wells. There are three extraction wells at the Site. Two of the three have been yielding clean water; therefore, they are presently shut down to allow for a period of monitoring under non-pumping conditions. Also, please note that to supplement the contaminant removal by the three extraction wells, three shallow ground water collection trenches were installed in summer 1996. --Question 24 asked for the treatment processes which are used at the Site. We do have a metals precipitation unit and biological treatment units at the Site. However, we stopped using them due to a reduction in contaminant concentrations. --The Lang Property Superfund site team has always emphasized quality. Our enhancement efforts to date have expedited the remediation and resulted in cost savings. If you have any questions on the above, please feel free to call me at 212-637-4423.
Contact Information
System Information and Data
290 Broadway - 19th floor NJDEP
Date original ROD was signed:
Date of last modification to ROD:
New York, New York, NY 10007-1866212-637-4423 (phone)212-637-4393 (fax)

24
State Regulator ContractorMichael Burlingame Lee Anne Simmler
P.O. Box 413 743 Mullica Hill RoadTrenton, NJ 08625-0413 Glassboro, NJ 08028609-292-1424 (phone) 856-582-6000 (phone)609-292-1975 (fax) 856-582-6946 (fax)[email protected] [email protected]
EPA-lead Number of extraction wells: 25
9/30/85 Date of construction completion: 12/1992
Date of operational and functional: 6/1993
Final Expected date of turnover to state: 10/2019
Operational Expected date of completion: 12/2004
Primary goal of system: Containment & Restoration Approximate downtime per year: 2 weeks
Presence of NAPLs Suspected Number of monitoring wells used: 39
Approximate annual O&M costs: $2,500,000 Frequency of sampling: 1 times per year
Costs related to monitoring: $30,000 Is plume migration controlled? Yes
Approximate pumping rate: 125 gpm Progress of aquifer restoration: 20% to 80% restored
Evaluated and found sufficient minor/minor
Contaminants of Concern: Treatment Processes:
71 Benzene and Toluene Metals precipitation yes
82 Bis(2-chloroethyl) ether Air stripping
373 Xylene Biological treatment
14 1,2-Dichloroethane UV oxidation
249 Methylene Chloride Carbon adsorption yes
294 Phenol Filtration
118 Chromium Ion Exchange
2 228 Lead Reverse Osmosis
108 374 Zinc Off-gas treatment yes
120 other/not sure yes
354
Comments:
RPMFerdinand Cataneo
Type of Fund-lead Site:
Result of previous evaluation of peformance/effectiveness:
Difficulty (due to social/political factors) of implementing minor/major changes:
Type of ROD:
Status of P&T system:
Lipari Landfill siteMantua Township, NJ (Region 2)
CERCLIS ID NJD980505416
URS/Radian International
The system has been evaluated and improved on an annual basis since it began operating in 1993. The most significant improvement was designed in April 1999 and constructed last year. The improvement converted the system to dual phase operation, which has doubled the rate of contaminated ground water extraction while providing for soil vapor/air extraction that has increased the rate of BTEX/VOC removal from the site containment by an order of magnitude.
In June 1999, the USACE Hazardous, Toxic, and Radioactive Waste Center of Expertise conducted a workshop on Lipari Landfill site system operation, maintenance, monitoring and optimization.
Contact Information
System Information and Data
290 Broadway NJDEP
Date original ROD was signed:
Date of last modification to ROD:
New York City, NY 10007-1866212-637-4428 (phone)212-637-4393 (fax)

25
State Regulator ContractorMichael Mason Karuppenan Subburamu
50 Wolf Road 1000 the American RoadAlbany, NY 12233 Morris Plains, NJ 07950518-457-9285 (phone) 973-630-8518 (phone)518-457-7743 (fax) 973-630-8111 (fax)[email protected] [email protected]
EPA-lead Number of extraction wells: 9
6/27/91 Date of construction completion: 8/1998
Date of operational and functional: 9/1999
Final Expected date of turnover to state: 3/2009
Operational Expected date of completion: 8/2029
Primary goal of system: Containment & Restoration Approximate downtime per year: 2 weeks
Presence of NAPLs Observed Number of monitoring wells used: 15
Approximate annual O&M costs: $700,000 Frequency of sampling: 1 times per year
Costs related to monitoring: $50,000 Is plume migration controlled? Yes
Approximate pumping rate: 10 gpm Progress of aquifer restoration: less than 20% restored
Evaluated and found sufficient minor/moderate
Contaminants of Concern: Treatment Processes:
61 Aromatic VOCs Metals precipitation yes
106 Chlorinated Aliphatics Air stripping yes
108 Chlorinated Solvents Biological treatment
170 Ethylbenzene UV oxidation
Carbon adsorption yes
Filtration yes
Ion Exchange
2 Reverse Osmosis
108 Off-gas treatment yes
120 other/not sure
354
Comments:
Q#18. Of the 9 extraction wells, 3 extract almost 9 gallons/minute. The other 6 extract betw 1-2 gallons/minute.
Q#26. Wells were sampled twice in 1st year, will be sampled annually thereafter.
Contact Information
System Information and Data
290 Broadway NY State Department of Environmental Conservation
Date original ROD was signed:
Date of last modification to ROD:
NYC, NY 10007-1866212-637-4272 (phone)212-637-3966 (fax)[email protected]
Mattiace PetrochemicalGlen Cove, Nassau County, NY (Region 2)
CERCLIS ID NYD000512459
Foster Wheeler Env.Corp.
Tetrachloroethylene, Trichloroethylene, Ethylbenzene, Toluene, Xylenes, Methylene Chloride, Dichlorobenzene, Acetone
RPMEdward Als
Type of Fund-lead Site:
Result of previous evaluation of peformance/effectiveness:
Difficulty (due to social/political factors) of implementing minor/major changes:
Type of ROD:
Status of P&T system:
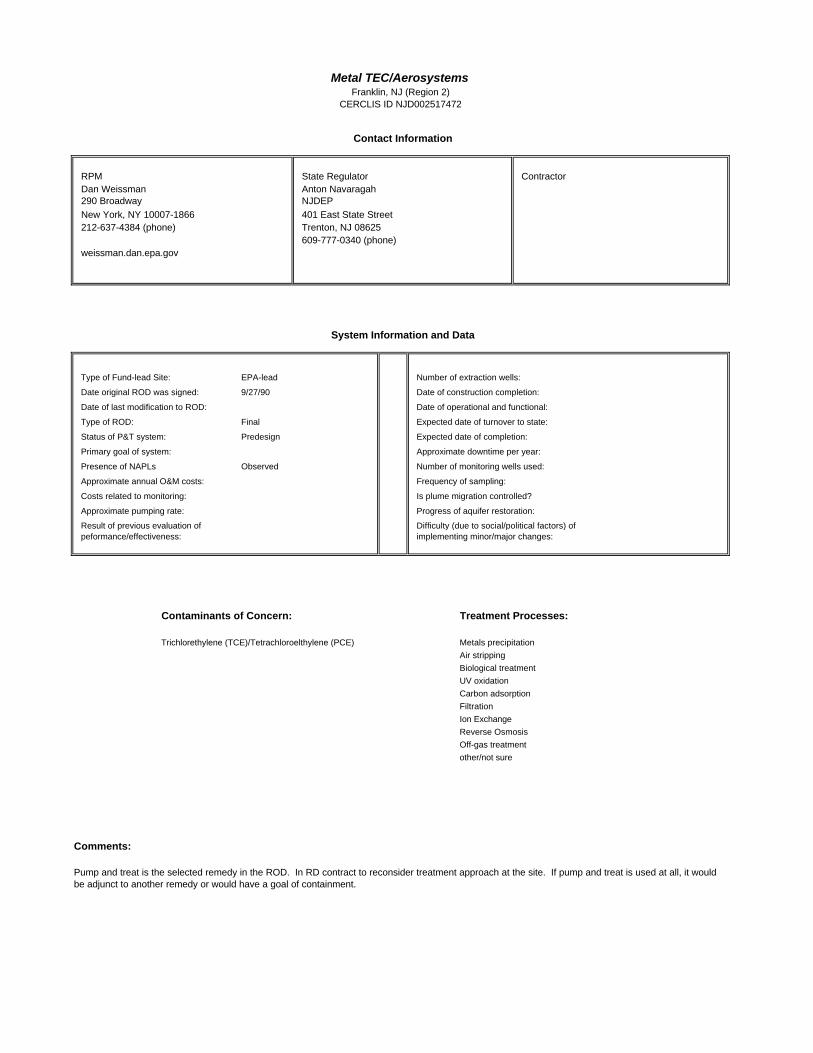
34
State Regulator ContractorAnton Navaragah
401 East State StreetTrenton, NJ 08625609-777-0340 (phone)
EPA-lead Number of extraction wells:
9/27/90 Date of construction completion:
Date of operational and functional:
Final Expected date of turnover to state:
Predesign Expected date of completion:
Primary goal of system: Approximate downtime per year:
Presence of NAPLs Observed Number of monitoring wells used:
Approximate annual O&M costs: Frequency of sampling:
Costs related to monitoring: Is plume migration controlled?
Approximate pumping rate: Progress of aquifer restoration:
Contaminants of Concern: Treatment Processes:
354 Trichlorethylene (TCE)/Tetrachloroelthylene (PCE) Metals precipitation
Air stripping
Biological treatment
UV oxidation
Carbon adsorption
Filtration
Ion Exchange
2 Reverse Osmosis
108 Off-gas treatment
120 other/not sure
354
Comments:
Pump and treat is the selected remedy in the ROD. In RD contract to reconsider treatment approach at the site. If pump and treat is used at all, it would be adjunct to another remedy or would have a goal of containment.
Contact Information
System Information and Data
290 Broadway NJDEP
Date original ROD was signed:
Date of last modification to ROD:
New York, NY 10007-1866212-637-4384 (phone)
Metal TEC/AerosystemsFranklin, NJ (Region 2)
CERCLIS ID NJD002517472
RPMDan Weissman
Type of Fund-lead Site:
Result of previous evaluation of peformance/effectiveness:
Difficulty (due to social/political factors) of implementing minor/major changes:
Type of ROD:
Status of P&T system:
weissman.dan.epa.gov

26
State Regulator ContractorMichael Komoroske Eric Hamilton
50 Wolf Road, Room 242 7870 Villa Park Drive, Suite 400Albany, NY 12233-7010 Richmond, VA 23228518-457-3395 (phone) 804-515-8300 (phone)518-457-4198 (fax) 804-515-8414 (fax)[email protected] [email protected]
EPA-lead Number of extraction wells: 3
3/31/00 Date of construction completion: 5/2000
Date of operational and functional: 7/2001
Final Expected date of turnover to state: 7/2011
Operational Expected date of completion: 7/2031
Primary goal of system: Containment & Restoration Approximate downtime per year:
Presence of NAPLs Not present Number of monitoring wells used: 17
Approximate annual O&M costs: Frequency of sampling: 2 times per year
Costs related to monitoring: Is plume migration controlled? Don't know
Approximate pumping rate: 40 gpm Progress of aquifer restoration: Don't know
Currently being evaluated minor/moderate
Contaminants of Concern: Treatment Processes:
2 1,1,1-Trichloroethane Metals precipitation
5 1,1-Dichloroethane Air stripping yes
6 1,1-Dichloroethylene (DCE) Biological treatment
357 Trichloroethylene (TCE) UV oxidation
Carbon adsorption yes
Filtration yes
Ion Exchange
2 Reverse Osmosis
108 Off-gas treatment yes
120 other/not sure
354
Comments:
This groundwater extraction and treatment system was constructed by the Region 2 Removal Program in May 2000 as a Non-Time Critical Removal Action to address the 'nearfield plume', and underwent shakedown until responsibility for the system was transferred to the remedial program in February 2001. For approximatey the next 5 months, the Remedial Program will be operate the system as a remedial action in order to complete shakedown activities. After this period, the system will be operated as a Long-Term Response Action (beginning July 2001). Additional groundwater extraction wells may be added to capture the 'farfield plume'.
Contact Information
System Information and Data
290 Broadway, 20th Floor NYSDEC
Date original ROD was signed:
Date of last modification to ROD:
New York, NY 10007-1866212-637-3314 (phone)212-637-3966 (fax)
Mohonk Road Industrial Plant SiteHigh Falls, NY (Region 2)
CERCLIS ID NYD986950012
EarthTech
RPMPatrick Hamblin
Type of Fund-lead Site:
Result of previous evaluation of peformance/effectiveness:
Difficulty (due to social/political factors) of implementing minor/major changes:
Type of ROD:
Status of P&T system:

35
State Regulator ContractorLarry Quinn Geoffrey McKenzie
401 East State Street 107-F Corporate Blvd.Trenton, NJ 08625 South Plainfield, NJ 07080609-633-0766 (phone) 908-757-9500 (phone)
[email protected] [email protected]
EPA-lead Number of extraction wells: 3
6/27/88 Date of construction completion: 9/2003
Date of operational and functional: 9/2003
Final Expected date of turnover to state: 9/2013
Design Expected date of completion: 9/2033
Primary goal of system: Restoration Approximate downtime per year:
Presence of NAPLs Don't know Number of monitoring wells used: 40
Approximate annual O&M costs: $400,000 Frequency of sampling: 2 times per year
Costs related to monitoring: $80,000 Is plume migration controlled?
Approximate pumping rate: 250 gpm Progress of aquifer restoration:
minor/moderate
Contaminants of Concern: Treatment Processes:
357 Trichloroethylene (TCE) Metals precipitation
Air stripping yes
Biological treatment
UV oxidation
Carbon adsorption yes
Filtration
Ion Exchange
2 Reverse Osmosis
108 Off-gas treatment
120 other/not sure
354
Comments:
This is actually two sites, Montgomery Township and Rocky Hill, that will share a single P&T system.In litigation with PRP.
Contact Information
System Information and Data
290 Broadway NJDEP
Date original ROD was signed:
Date of last modification to ROD:
New York, NY 10007-1866212-637-3942 (phone)
Montgomery Township/Rocky HillMontgomery Township, NJ (Region 2)
CERCLIS ID NJD980654164
CDM
RPMMonica Mahar
Type of Fund-lead Site:
Result of previous evaluation of peformance/effectiveness:
Difficulty (due to social/political factors) of implementing minor/major changes:
Type of ROD:
Status of P&T system:

27
State Regulator ContractorJoseph Yavonditte Paul Hagerman
50 Wolf Road 125 Maiden LaneAlbany, NY 12233 New York, NY 10038518-457-9280 (phone) 212-785-9123 (phone)518-457-4198 (fax) 212-785-6114 (fax)[email protected] [email protected]
EPA-lead Number of extraction wells: 2
9/29/89 Date of construction completion: 6/1994
Date of operational and functional: 6/1995
Final Expected date of turnover to state: 6/2005
Operational Expected date of completion: 3/2004
Primary goal of system: Containment & Restoration Approximate downtime per year: 2 weeks
Presence of NAPLs Not present Number of monitoring wells used: 18
Approximate annual O&M costs: $400,000 Frequency of sampling: 4 times per year
Costs related to monitoring: $130,000 Is plume migration controlled? Yes
Approximate pumping rate: 100 gpm Progress of aquifer restoration: 20% to 80% restored
Evaluated and found sufficient minor/minor
Contaminants of Concern: Treatment Processes:
373 Xylene Metals precipitation
Air stripping yes
Biological treatment
UV oxidation
Carbon adsorption yes
Filtration
Ion Exchange
2 Reverse Osmosis
108 Off-gas treatment
120 other/not sure
354
Comments:
Contact Information
System Information and Data
290 Broadway NYSDEC
Date original ROD was signed:
Date of last modification to ROD:
New York, NY 10007212-637-4251 (phone)212-637-3966 (fax)
SMS InstrumentsDeer Park, NY (Region 2)
CERCLIS ID NYD001533165
CDM Federal
RPMMark Dannenberg
Type of Fund-lead Site:
Result of previous evaluation of peformance/effectiveness:
Difficulty (due to social/political factors) of implementing minor/major changes:
Type of ROD:
Status of P&T system:
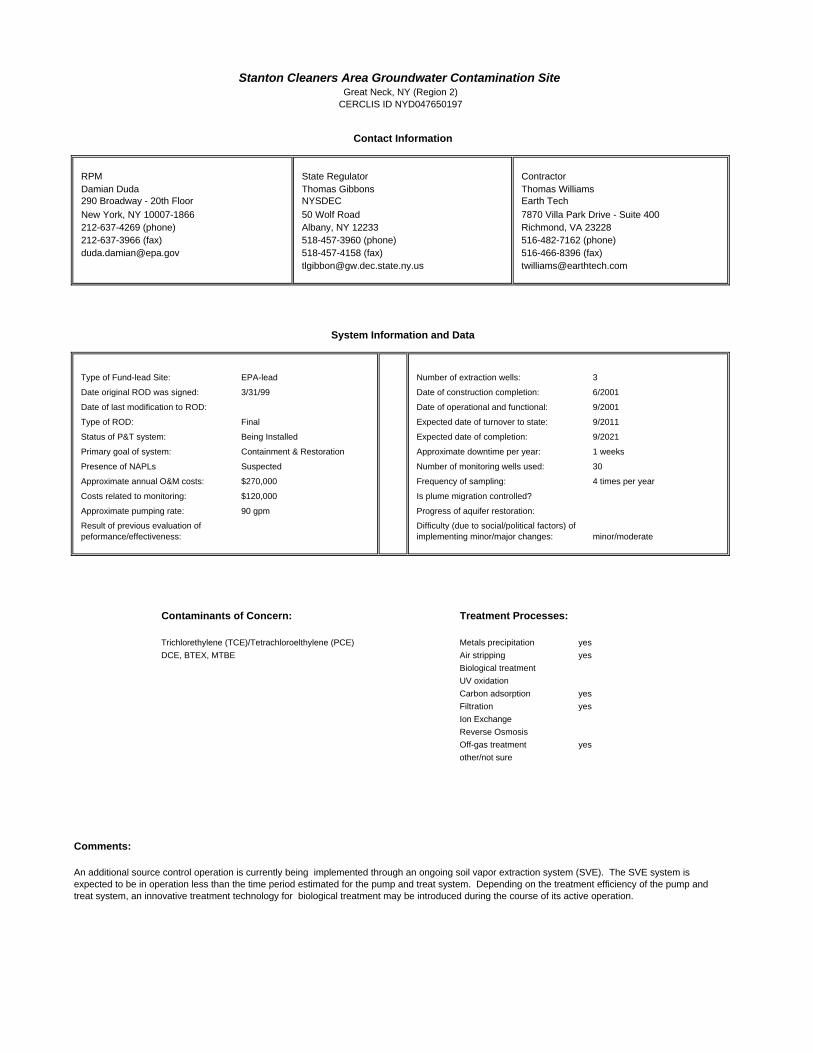
28
State Regulator ContractorThomas Gibbons Thomas Williams
50 Wolf Road 7870 Villa Park Drive - Suite 400Albany, NY 12233 Richmond, VA 23228518-457-3960 (phone) 516-482-7162 (phone)518-457-4158 (fax) 516-466-8396 (fax)[email protected] [email protected]
EPA-lead Number of extraction wells: 3
3/31/99 Date of construction completion: 6/2001
Date of operational and functional: 9/2001
Final Expected date of turnover to state: 9/2011
Being Installed Expected date of completion: 9/2021
Primary goal of system: Containment & Restoration Approximate downtime per year: 1 weeks
Presence of NAPLs Suspected Number of monitoring wells used: 30
Approximate annual O&M costs: $270,000 Frequency of sampling: 4 times per year
Costs related to monitoring: $120,000 Is plume migration controlled?
Approximate pumping rate: 90 gpm Progress of aquifer restoration:
minor/moderate
Contaminants of Concern: Treatment Processes:
354 Trichlorethylene (TCE)/Tetrachloroelthylene (PCE) Metals precipitation yes
DCE, BTEX, MTBE Air stripping yes
Biological treatment
UV oxidation
Carbon adsorption yes
Filtration yes
Ion Exchange
2 Reverse Osmosis
108 Off-gas treatment yes
120 other/not sure
354
Comments:
An additional source control operation is currently being implemented through an ongoing soil vapor extraction system (SVE). The SVE system is expected to be in operation less than the time period estimated for the pump and treat system. Depending on the treatment efficiency of the pump and treat system, an innovative treatment technology for biological treatment may be introduced during the course of its active operation.
Contact Information
System Information and Data
290 Broadway - 20th Floor NYSDEC
Date original ROD was signed:
Date of last modification to ROD:
New York, NY 10007-1866212-637-4269 (phone)212-637-3966 (fax)
Stanton Cleaners Area Groundwater Contamination SiteGreat Neck, NY (Region 2)
CERCLIS ID NYD047650197
Earth Tech
RPMDamian Duda
Type of Fund-lead Site:
Result of previous evaluation of peformance/effectiveness:
Difficulty (due to social/political factors) of implementing minor/major changes:
Type of ROD:
Status of P&T system:

29
State Regulator ContractorJeanette Abels John Sperber
401 East State St. P.O. Box 316Trenton, NJ 08625 Closter, NJ 07624609-292-4873 (phone) 201-750-6880 (phone)609-633-2360 (fax) 201-750-6890 (fax)[email protected] [email protected]
State-lead w/ Fund $ Number of extraction wells: 3
9/29/86 Date of construction completion: 4/1991
9/27/00 Date of operational and functional: 4/1991
Final Expected date of turnover to state: 4/2001
Operational Expected date of completion: 9/2028
Primary goal of system: Containment & Restoration Approximate downtime per year: 3 weeks
Presence of NAPLs Observed Number of monitoring wells used: 0
Approximate annual O&M costs: $350,000 Frequency of sampling: 0 times per year
Costs related to monitoring: Is plume migration controlled? Yes
Approximate pumping rate: 20 gpm Progress of aquifer restoration: less than 20% restored
Evaluated and found not sufficient minor/moderate
Contaminants of Concern: Treatment Processes:
41 Acetone Metals precipitation yes
70 Benzene Air stripping yes
114 Chlorobenzene Biological treatment yes
170 Ethylbenzene UV oxidation
346 Toluene Carbon adsorption yes
373 Xylene Filtration yes
Ion Exchange
2 Reverse Osmosis
108 Off-gas treatment yes
120 other/not sure
354
Comments:
18: Wells used for water control. Also, there is a trench and three sump wells located in areas that flood locally.
21: Date of 10/93 is provided. This would mean it has already been transferred to the state. 10/93 is not a possible response given the format of the webpage. 4/2001 is provided temporarily until more information is available.
27: A slurry wall is providing the control
Contact Information
System Information and Data
290 Broadway NJDEP
Date original ROD was signed:
Date of last modification to ROD:
New York, NY 10007-1866212-637-4416 (phone)212-637-4393 (fax)
Syncon ResinsKearny, NJ (Region 2)
CERCLIS ID NJD064263817
LSR Levine and Fricke
RPMPamela J. Baxter
Type of Fund-lead Site:
Result of previous evaluation of peformance/effectiveness:
Difficulty (due to social/political factors) of implementing minor/major changes:
Type of ROD:
Status of P&T system:

30
State Regulator ContractorJeffrey Trad Heidemarie Adenau
50 Wolf Road 1000 The American RoadAlbany, NY 12233-7010 Morris Plains, NJ 07950518-457-9285 (phone) 973-630-7197 (phone)518-457-7743 (fax) 973-630-8025 (fax)[email protected] [email protected]
EPA-lead Number of extraction wells: 1
6/27/86 Date of construction completion: 12/1993
Date of operational and functional: 3/1995
Final Expected date of turnover to state: 3/2005
Operational Expected date of completion: 3/2015
Primary goal of system: Containment & Restoration Approximate downtime per year: 1 week
Presence of NAPLs Not present Number of monitoring wells used: 12
Approximate annual O&M costs: $180,000 Frequency of sampling: 1 times per year
Costs related to monitoring: $30,000 Is plume migration controlled? Yes
Approximate pumping rate: 450 gpm Progress of aquifer restoration: less than 20% restored
Evaluated and found sufficient minor/minor
Contaminants of Concern: Treatment Processes:
2 1,1,1-Trichloroethane Metals precipitation
5 1,1-Dichloroethane Air stripping yes
6 1,1-Dichloroethylene (DCE) Biological treatment
16 1,2-Dichloroethylene (DCE) UV oxidation
357 Trichloroethylene (TCE) Carbon adsorption
Filtration
Ion Exchange
2 Reverse Osmosis
108 Off-gas treatment
120 other/not sure
354
Comments:
RPMSharon Trocher
Type of Fund-lead Site:
Result of previous evaluation of peformance/effectiveness:
Difficulty (due to social/political factors) of implementing minor/major changes:
Type of ROD:
Status of P&T system:
Vestal Water Supply Well 1-1Vestal, NY (Region 2)
CERCLIS ID NYD980763767
Foster Wheeler Env.Corporation
Contact Information
System Information and Data
290 Broadway NYSDEC
Date original ROD was signed:
Date of last modification to ROD:
New York, NY 10007-1866212-637-3965 (phone)212-637-3966 (fax)

31
State Regulator ContractorCraig Wallace Gillespie Steve
401 East State Street CN413 1405A North Mill RoadTrenton, NJ 08625-0413 Vineland, NJ 08360609 984-3727 (phone) 856 690-1758 (phone)609 633-2360 (fax) 856 690-1759 (fax)[email protected] [email protected]
EPA-lead Number of extraction wells: 13
9/28/89 Date of construction completion: 4/2000
Date of operational and functional: 6/2000
Final Expected date of turnover to state: 6/2011
Operational Expected date of completion: 6/2031
Primary goal of system: Containment & Restoration Approximate downtime per year: 0 weeks
Presence of NAPLs Not present Number of monitoring wells used: 40
Approximate annual O&M costs: $4,000,000 Frequency of sampling: 52 times per year
Costs related to monitoring: $750,000 Is plume migration controlled? Yes
Approximate pumping rate: 1400 gpm Progress of aquifer restoration: Don't know
Currently being evaluated moderate/severe
Contaminants of Concern: Treatment Processes:
62 Arsenic Metals precipitation yes
Air stripping
Biological treatment
UV oxidation
Carbon adsorption
Filtration yes
Ion Exchange
2 Reverse Osmosis
108 Off-gas treatment
120 other/not sure
354
Comments:
RPMMatthew Westgate
Type of Fund-lead Site:
Result of previous evaluation of peformance/effectiveness:
Difficulty (due to social/political factors) of implementing minor/major changes:
Type of ROD:
Status of P&T system:
Vineland Chemical Co. Groundwater Treatment PlantVineland, NJ (Region 2)
CERCLIS ID NJD002385664
Sevenson Env. Services
Currently we are pumping 700 gpm. Major modifications are required to increase plant flow to maximum flow rate -1400 gpm.
We are in the process of hiring a contractor, SAIC of Harrisburg, PA, through the Philadelphia District Army Corps of Engineers, to perform a "SmartSite" Optimization Study. Kickoff meeting is scheduled for March 1 2001. If you want to study this site and perform the optimization study, call me now at 212 637-4422.
Contact Information
System Information and Data
290 Broadway 19th floor N.J. Dept. of Environmental Protection
Date original ROD was signed:
Date of last modification to ROD:
New York City, NY 10007-1866212 637-4422 (phone)212 637-4429 (fax)

32
State Regulator ContractorSteve Wohleb Richard Talbot
P.O. Box 413 24 South Newton Street Road, Suite 1BTrenton, NJ 08625-0413 Newton Square, PA 19073609-633-3970 (phone) 610-356-3790 (phone)609-292-1975 (fax) 610-356-4780 (fax)[email protected] [email protected]
State-lead w/ Fund $ Number of extraction wells: 2
9/29/87 Date of construction completion: 1/1995
Date of operational and functional: 1/1995
Final Expected date of turnover to state: 1/2001
Operational Expected date of completion: 12/2002
Primary goal of system: Restoration Approximate downtime per year: 0 weeks
Presence of NAPLs Not present Number of monitoring wells used: 18
Approximate annual O&M costs: $350,000 Frequency of sampling: 2 times per year
Costs related to monitoring: Is plume migration controlled? Yes
Approximate pumping rate: 80 gpm Progress of aquifer restoration: more than 80% restored
Evaluated and found sufficient minor/minor
Contaminants of Concern: Treatment Processes:
82 Bis(2-chloroethyl) ether Metals precipitation
354 Trichlorethylene (TCE)/Tetrachloroelthylene (PCE) Air stripping
41 Acetone Biological treatment yes
217 Isophorone UV oxidation yes
244 Methyl ethyl ketone (MEK) Carbon adsorption yes
245 Methyl isobutyl ketone (MIBK) Filtration
373 Xylene Ion Exchange
2 Reverse Osmosis
108 Off-gas treatment
120 other/not sure
354
Comments:
RPMFerdinand Cataneo
Type of Fund-lead Site:
Result of previous evaluation of peformance/effectiveness:
Difficulty (due to social/political factors) of implementing minor/major changes:
Type of ROD:
Status of P&T system:
Williams PropertySwainton, Middle Township, NJ (Region 2)
CERCLIS ID NJD980529945
TurnKey Env. Services, Inc
At this time the plume appears to have been remediated except for low level PCE and TCE tailing. The pump and treat is expected to be shut down later this year with the system maintained in a "ready-to-run" state. Long term monitoring for possible rebound of contamination will follow. Resumption of operations would be triggered if rebound, as defined in a long-term testing plan,occurs.
Regarding Question #21, please note that the NJDEP has been running the p&t since operations began in January 1995.
Contact Information
System Information and Data
290 Broadway NJDEP
Date original ROD was signed:
Date of last modification to ROD:
New York City, NY 10007-1866212-637-4428 (phone)212-637-4393 (fax)

REGION 3 INFORMATION SHEETS

44
State Regulator ContractorRagesh Patel Neil Teamerson
Lee Park, Suite 6010 555 North Lane 600 Clark Avenue, Suite 3Conshohocken, PA 19428 King of Prussia, PA 19406610-832-6161 (phone) 610-491-9688 (phone)610-832-6260 (fax) 610-491-9645 (fax)[email protected] [email protected]
EPA-lead Number of extraction wells: 5
9/29/95 Date of construction completion: 11/2000
Date of operational and functional: 9/2001
Final Expected date of turnover to state: 9/2011
Operational Expected date of completion: 9/2031
Primary goal of system: Restoration Approximate downtime per year: 1 week
Presence of NAPLs Not present Number of monitoring wells used: 15
Approximate annual O&M costs: $180,000 Frequency of sampling: 4 times per year
Costs related to monitoring: $50,000 Is plume migration controlled? Don't know
Approximate pumping rate: 118 gpm Progress of aquifer restoration: Don't know
Evaluated and found sufficient minor/moderate
Contaminants of Concern: Treatment Processes:
3 1,1,2,2-Tetrachloroethane Metals precipitation
352 Trans 1,2-Dichloroethylene Air stripping yes
Biological treatment
UV oxidation
Carbon adsorption yes
Filtration yes
Ion Exchange
2 Reverse Osmosis
108 Off-gas treatment yes
120 other/not sure
354
Comments:
This Pump and Treat is only a few months old and there is not enough performance data to date to make any recomendations regarding optimization.
Contact Information
System Information and Data
1650 Arch Street (3HS21) PADEP
Date original ROD was signed:
Date of last modification to ROD:
Philadelphia, PA 19103215-814-3193 (phone)215-814-3002 (fax)
AIW Frank/Mid-County Mustang Site, OU#1Exton, PA (Region 3)
CERCLIS ID PAD004351003
TetraTech NUS
RPMCharlie Root
Type of Fund-lead Site:
Result of previous evaluation of peformance/effectiveness:
Difficulty (due to social/political factors) of implementing minor/major changes:
Type of ROD:
Status of P&T system:

45
State Regulator ContractorElise Juers Ed Kashdan
909 Elmerton Av. PO Box 80794Harrisburg, PA 17110-8200 Valley Forge, PA 19484717-705-4852 (phone) 610-650-8101 (phone)717-705-4830 (fax) 610-650-8190 (fax)[email protected] [email protected]
EPA-lead Number of extraction wells: 1
9/29/88 Date of construction completion: 2/1995
2/2/94 Date of operational and functional: 2/1995
Final Expected date of turnover to state: 2/2005
Operational Expected date of completion: 2/2003
Primary goal of system: Restoration Approximate downtime per year:
Presence of NAPLs Not present Number of monitoring wells used: 48
Approximate annual O&M costs: $150,000 Frequency of sampling: 1 times per year
Costs related to monitoring: $25,000 Is plume migration controlled? Yes
Approximate pumping rate: 90 gpm Progress of aquifer restoration: 20% to 80% restored
Evaluated and found sufficient minor/minor
Contaminants of Concern: Treatment Processes:
2 1,1,1-Trichloroethane Metals precipitation
6 1,1-Dichloroethylene (DCE) Air stripping yes
Biological treatment
UV oxidation
Carbon adsorption
Filtration
Ion Exchange
2 Reverse Osmosis
108 Off-gas treatment
120 other/not sure
354
Comments:
Maximum TCA and DCE concentrations in 1988 were 7,300 and 3,500 ppb, respectivly. By 1999 concentrations have been reduced to 470 ppb and 78 ppb for TCA and DCE respectively. This has been accomplished by maximizing pump rate with respect to contaminant concentrartions. Currently there is one area that is less responcive to the pumping system. A pilot scale fentons reagent injection study will be conducted in this area in the Spring of 2001. If successful oxidant injection will be used throughout the plume.
Contact Information
System Information and Data
1650 Arch Street PADEP
Date original ROD was signed:
Date of last modification to ROD:
Philadephia, PA 19103-2087215-814-3317 (phone)215-814-3015 (fax)
Berks Sand PitHuffs Church, PA (Region 3)CERCLIS ID PAD980691794
Gannett Fleming
RPMBruce Rundell
Type of Fund-lead Site:
Result of previous evaluation of peformance/effectiveness:
Difficulty (due to social/political factors) of implementing minor/major changes:
Type of ROD:
Status of P&T system:

46
State Regulator ContractorPADEP Paul Panek Charles Huval
4530 Bath Pike 14649 Highway 41 NBethlehem, PA 18017 Evansville, IN 47725610-861-2070 (phone) 812-483-4516 (phone)610-861-2072 (fax)[email protected]
EPA-lead Number of extraction wells: 3
6/30/92 Date of construction completion: 4/2001
8/27/99 Date of operational and functional: 4/2001
Final Expected date of turnover to state: 4/2011
Operational Expected date of completion: 4/2031
Primary goal of system: Restoration Approximate downtime per year: 0 weeks
Presence of NAPLs Not present Number of monitoring wells used: 17
Approximate annual O&M costs: $250,000 Frequency of sampling: 4 times per year
Costs related to monitoring: $125,000 Is plume migration controlled? Don't know
Approximate pumping rate: 90 gpm Progress of aquifer restoration: less than 20% restored
Not evaluated minor/minor
Contaminants of Concern: Treatment Processes:
155 Diesel fuel Metals precipitation
355 Trichlorobenzene Air stripping yes
Vinyl Chloride Biological treatment
UV oxidation
Carbon adsorption
Filtration
Ion Exchange
2 Reverse Osmosis
108 Off-gas treatment yes
120 other/not sure
354
Comments:
Doug Sutton completed this questionnaire based on phone interviews with Rom Roman (RPM) and Bruce Rundell (hydrogeologist).
At the time of this survey, the site was to begin operation within a couple of weeks. Thus, many of the responses are estimates including costs, flow rates, and expected date of completion.
Contact Information
System Information and Data
1650 Arch Street PADEP
Date original ROD was signed:
Date of last modification to ROD:
Philadelphia, PA 19103-2087215-814-3212 (phone)215-814-3015 (fax)
Butz LandfillMonroe Township, PA (Region 3)
CERCLIS ID PAD981034705
Koester Environmental Services
RPMRom Roman
Type of Fund-lead Site:
Result of previous evaluation of peformance/effectiveness:
Difficulty (due to social/political factors) of implementing minor/major changes:
Type of ROD:
Status of P&T system:

47
State Regulator ContractorEwald Dave Harish Mital
Lee Park, Suite 6010 Plaza 273, 56 West Main StreetConshohocken, PA 19428 Christiana, DE 19702610-832-6200 (phone) 302-738-7551 (phone)610-832-5950 (fax) 302-454-5988 (fax)[email protected] [email protected]
EPA-lead Number of extraction wells: 6
6/29/90 Date of construction completion: 3/1995
Date of operational and functional: 3/1995
Final Expected date of turnover to state: 3/2005
Operational Expected date of completion: 3/2025
Primary goal of system: Containment & Restoration Approximate downtime per year:
Presence of NAPLs Suspected Number of monitoring wells used: 7
Approximate annual O&M costs: $200,000 Frequency of sampling: 4 times per year
Costs related to monitoring: $100,000 Is plume migration controlled? Yes
Approximate pumping rate: 25 gpm Progress of aquifer restoration: less than 20% restored
Evaluated and found sufficient minor/minor
Contaminants of Concern: Treatment Processes:
4 1,1,2-Trichloroethane Metals precipitation
6 1,1-Dichloroethylene (DCE) Air stripping yes
354 Trichlorethylene (TCE)/Tetrachloroelthylene (PCE) Biological treatment
357 Trichloroethylene (TCE) UV oxidation
Carbon adsorption yes
Filtration
Ion Exchange
2 Reverse Osmosis
108 Off-gas treatment
120 other/not sure
354
Comments:
RPMCesar Lee
Type of Fund-lead Site:
Result of previous evaluation of peformance/effectiveness:
Difficulty (due to social/political factors) of implementing minor/major changes:
Type of ROD:
Status of P&T system:
Croydon TCEBristol Township, PA (Region 3)
CERCLIS ID PAD981035009
Tetra Tech, Inc.
Contact Information
System Information and Data
1650 Arch St PADEP
Date original ROD was signed:
Date of last modification to ROD:
Philadelphia, PA 19103215-814-3205 (phone)215-814-3205 (fax)

48
State Regulator ContractorRich Morgan Don Koch
909 Elmerton Ave 9115 Guilford Road Suite 100Harrisburg, PA 17110 Columbia, MD 21046610-916-0122 (phone) 410-461-9920 (phone)610-916-0100 (fax) 410-750-8565 (fax)[email protected] [email protected]
EPA-lead Number of extraction wells: 9
9/30/91 Date of construction completion: 2/1998
Date of operational and functional: 6/1998
Final Expected date of turnover to state: 6/2008
Operational Expected date of completion: 6/2010
Primary goal of system: Containment & Restoration Approximate downtime per year: 1 week
Presence of NAPLs Don't know Number of monitoring wells used: 4
Approximate annual O&M costs: $125,000 Frequency of sampling: 1 times per year
Costs related to monitoring: $40,000 Is plume migration controlled? Yes
Approximate pumping rate: 60 gpm Progress of aquifer restoration: Don't know
Evaluated and found sufficient minor/moderate
Contaminants of Concern: Treatment Processes:
2 1,1,1-Trichloroethane Metals precipitation
5 1,1-Dichloroethane Air stripping yes
6 1,1-Dichloroethylene (DCE) Biological treatment
UV oxidation
Carbon adsorption
Filtration
Ion Exchange
2 Reverse Osmosis
108 Off-gas treatment
120 other/not sure
354
Comments:
RPMJoseph McDowell
Type of Fund-lead Site:
Result of previous evaluation of peformance/effectiveness:
Difficulty (due to social/political factors) of implementing minor/major changes:
Type of ROD:
Status of P&T system:
CryoChemEarl Township, PA (Region 3)CERCLIS ID PAD002360444
ETA
Contact Information
System Information and Data
1650 Arch Street PADEP
Date original ROD was signed:
Date of last modification to ROD:
Phila, PA 19103215-814-3192 (phone)215-814-3002 (fax)

49
State Regulator ContractorBerry Wright Jeff Waters
629 E. Main Street 1700 Market Street, Suite 1600Richmond, VA 23219 Philadelphia, PA 19103804-698-4012 (phone) 215-563-4220 (phone)804-698-4234 (fax) 215-563-3828 (fax)[email protected] [email protected]
EPA-lead Number of extraction wells: 5
12/30/90 Date of construction completion: 11/2000
Date of operational and functional: 11/2001
Interim Expected date of turnover to state: 11/2011
Operational Expected date of completion: 11/2020
Primary goal of system: Containment & Restoration Approximate downtime per year:
Presence of NAPLs Don't know Number of monitoring wells used: 34
Approximate annual O&M costs: $400,000 Frequency of sampling: 4 times per year
Costs related to monitoring: $50,000 Is plume migration controlled? Not a goal
Approximate pumping rate: 45 gpm Progress of aquifer restoration: Don't know
Not evaluated minor/minor
Contaminants of Concern: Treatment Processes:
5 1,1-Dichloroethane Metals precipitation yes
41 Acetone Air stripping
62 Arsenic Biological treatment
71 Benzene and Toluene UV oxidation yes
83 Carbon adsorption yes
114 Filtration yes
115 Ion Exchange
2 130 Reverse Osmosis
108 249 Off-gas treatment yes
120 260 other/not sure
354 319
340
346
354
Comments:
RPMPhilip Rotstein
Type of Fund-lead Site:
Result of previous evaluation of peformance/effectiveness:
Difficulty (due to social/political factors) of implementing minor/major changes:
Type of ROD:
Status of P&T system:
[email protected] (fax)
Greenwood Chemical SiteGreenwood, VA (Region 3)
CERCLIS ID VAD003125374
CH2M Hill
Naphthalene, Acetic Acid, 1,2-Dichloroethane, SVOC TICs, Dibutyl phthalate, 2,4,6,-Trichlorophenol
Initial startup and testing of the pump and treat system began in November 2000. The system became fully operational in March 2001. Actual operational costs (O&M) not known at this time.
Contact Information
System Information and Data
1650 Arch Street Department of Environmental Quality
Date original ROD was signed:
Date of last modification to ROD:
Philadelphia, PA 19103215-814-3232 (phone)

50
State Regulator ContractorApril Flipse Lori Stoll
555 North Lane, Suite 6010 200 Orchard Ridge Drive, Suite 101Conshohocken, PA 19428 Gaithersburg, MD 20878-1978610-832-5937 (phone) 301-258-9780 (phone)610-832-6143 (fax) 301-869-2043 (fax)[email protected] [email protected]
EPA-lead Number of extraction wells: 4
9/30/91 Date of construction completion: 5/2001
Date of operational and functional: 4/2002
Interim Expected date of turnover to state: 4/2012
Being Installed Expected date of completion: 4/2033
Primary goal of system: Containment & Restoration Approximate downtime per year:
Presence of NAPLs Observed Number of monitoring wells used: 15
Approximate annual O&M costs: $1,000,000 Frequency of sampling: 2 times per year
Costs related to monitoring: $283,300 Is plume migration controlled?
Approximate pumping rate: 45 gpm Progress of aquifer restoration:
Not evaluated minor/moderate
Contaminants of Concern: Treatment Processes:
71 Benzene and Toluene Metals precipitation yes
164 Dioxin (TCDD equivalents) Air stripping
290 Pentachlorophenol (PCP) Biological treatment
357 Trichloroethylene (TCE) UV oxidation yes
Carbon adsorption yes
Filtration yes
Ion Exchange
2 Reverse Osmosis
108 Off-gas treatment
120 other/not sure
354
Comments:
RPMGregory Ham
Type of Fund-lead Site:
Result of previous evaluation of peformance/effectiveness:
Difficulty (due to social/political factors) of implementing minor/major changes:
Type of ROD:
Status of P&T system:
Havertown PCP OU2Havertown, PA (Region 3)
CERCLIS ID PAD002338010
URS Corporation
This system includes a 200 foot long collection trench and four oil/water extraction wells. There is free product (PCP/oil) being recovered from most of the wells.
Contact Information
System Information and Data
1650 Arch Street (3HS21) PADEP
Date original ROD was signed:
Date of last modification to ROD:
Philadelphia, PA 19103-2029215-814-3194 (phone)215-814-3002 (fax)

51
State Regulator ContractorMeg Mustard Jim Romig
4530 Bath Pike 993 Old Eagle School Road, Suite 408Bethlehem, PA 18017 Wayne, PA 19087610-861-2076 (phone) 610-293-0450 (phone)610-861-2072 (fax) 610-293-1920 (fax)[email protected] [email protected]
EPA-lead Number of extraction wells: 1
9/3/91 Date of construction completion: 9/1996
Date of operational and functional: 3/1996
Final Expected date of turnover to state: 9/2006
Operational Expected date of completion: 9/2026
Primary goal of system: Containment & Restoration Approximate downtime per year: 0 weeks
Presence of NAPLs Not present Number of monitoring wells used: 12
Approximate annual O&M costs: $350,000 Frequency of sampling: 4 times per year
Costs related to monitoring: $150,000 Is plume migration controlled? Yes
Approximate pumping rate: 50 gpm Progress of aquifer restoration: Don't know
Evaluated and found not sufficient minor/moderate
Contaminants of Concern: Treatment Processes:
70 Benzene Metals precipitation
120 Cis-1,2-dichloroethene Air stripping yes
332 TCE and Vinyl chloride Biological treatment
352 Trans 1,2-Dichloroethylene UV oxidation
354 Trichlorethylene (TCE)/Tetrachloroelthylene (PCE) Carbon adsorption yes
Filtration
Ion Exchange
2 Reverse Osmosis
108 Off-gas treatment
120 other/not sure
354
Comments:
RPMCesar Lee
Type of Fund-lead Site:
Result of previous evaluation of peformance/effectiveness:
Difficulty (due to social/political factors) of implementing minor/major changes:
Type of ROD:
Status of P&T system:
Hellertown ManufacturingBethlehem, PA (Region 3)
CERCLIS ID PAD002390748
CDM Federal Corporation
Doug Sutton filled this out based on hand written notes of Cesar Lee.
Contact Information
System Information and Data
1650 Arch Street PADEP
Date original ROD was signed:
Date of last modification to ROD:
Philadelphia, PA 19103215-814-3205 (phone)215-814-3205 (fax)

52
State Regulator ContractorApril Flipse Policarpio Mijares
Lee Park, Suite 6010 555 North Lane P.O. Box 1715Conshohocken, PA 19428 Baltimore, PA 21203610-832-5937 (phone) 410-962-2782 (phone)610-832-6143 (fax) 410-962-2318 (fax)
EPA-lead Number of extraction wells: 1
9/30/94 Date of construction completion: 7/1998
9/24/98 Date of operational and functional: 9/1998
Final Expected date of turnover to state: 9/2008
Operational Expected date of completion: 9/2018
Primary goal of system: Containment & Restoration Approximate downtime per year: 0 weeks
Presence of NAPLs Not present Number of monitoring wells used: 4
Approximate annual O&M costs: $100,000 Frequency of sampling: 2 times per year
Costs related to monitoring: $25,000 Is plume migration controlled? Don't know
Approximate pumping rate: 2 gpm Progress of aquifer restoration: Don't know
Not evaluated minor/minor
Contaminants of Concern: Treatment Processes:
2 1,1,1-Trichloroethane Metals precipitation
5 1,1-Dichloroethane Air stripping
6 1,1-Dichloroethylene (DCE) Biological treatment
120 Cis-1,2-dichloroethene UV oxidation
352 Trans 1,2-Dichloroethylene Carbon adsorption
354 Trichlorethylene (TCE)/Tetrachloroelthylene (PCE) Filtration
372 Volatile organic compounds (VOCs) Ion Exchange
2 Reverse Osmosis
108 Off-gas treatment
120 other/not sure yes
354
Comments:
RPMMaria de los A. Garcia
Type of Fund-lead Site:
Result of previous evaluation of peformance/effectiveness:
Difficulty (due to social/political factors) of implementing minor/major changes:
Type of ROD:
Status of P&T system:
North Penn Area 1Souderton, Montgomery County, PA (Region 3)
CERCLIS ID PAD096834494
U.S. Army Corps of Engineers
The system in this site consists of an extraction system that discharges to a local wastewater treatment facility. There is no conventional treatment system at the site.
Contact Information
System Information and Data
1650 Arch Street Pennsylvania Department of Env. Protection
Date original ROD was signed:
Date of last modification to ROD:
Philadelphia, PA 19103215-814-3199 (phone)215-814-3002 (fax)

53
State Regulator ContractorRobert Zang Ray Lees
555 North Lane, Suite 6010 1220 Ward Avenue, Suite 300Conshohocken, PA 19428 West Chester, PA 19380-3409610-832-6152 (phone) 610-241-5000 (phone)610-832-6259 (fax) 610-241-5050 (fax)[email protected] [email protected]
EPA-lead Number of extraction wells: 10
8/10/00 Date of construction completion: 9/2002
Date of operational and functional: 6/2003
Final Expected date of turnover to state: 6/2013
Design Expected date of completion: 6/2033
Primary goal of system: Containment & Restoration Approximate downtime per year:
Presence of NAPLs Suspected Number of monitoring wells used: 30
Approximate annual O&M costs: $592,900 Frequency of sampling: 4 times per year
Costs related to monitoring: $216,000 Is plume migration controlled?
Approximate pumping rate: 300 gpm Progress of aquifer restoration:
Not evaluated minor/moderate
Contaminants of Concern: Treatment Processes:
97 Carbon tetrachloride Metals precipitation yes
332 TCE and Vinyl chloride Air stripping yes
354 Trichlorethylene (TCE)/Tetrachloroelthylene (PCE) Biological treatment
UV oxidation
Carbon adsorption
Filtration
Ion Exchange
2 Reverse Osmosis
108 Off-gas treatment yes
120 other/not sure
354
Comments:
This site consists of a groundwater plume covering an area approximately 3 square miles, with multiple identified sources. It will be done as a mixed work site (some wells installed and operated by EPA, some by PRPs). The first two wells are being done under a non-time critical removal action, the remainder as a remedial action.
Contact Information
System Information and Data
1650 Arch Street (3HS21) Pennsylvania Dept. of Env. Protection
Date original ROD was signed:
Date of last modification to ROD:
Philadelphia, PA 19103-2029215-814-3194 (phone)215-814-3002 (fax)
North Penn Area 6Lansdale, PA (Region 3)
CERCLIS ID PAD980926976
It Corporation
RPMGregory Ham
Type of Fund-lead Site:
Result of previous evaluation of peformance/effectiveness:
Difficulty (due to social/political factors) of implementing minor/major changes:
Type of ROD:
Status of P&T system:

54
State Regulator ContractorDavid Minsker Andy Hopton
Lee Park Suite 6010 555 North Lane 993 Old Eagle School RoadConshohocken, PA 19428 Wayne, PA 19083610-832-6193 (phone) 610-293-0450 (phone)610-832-6143 (fax) 610-293-1920 (fax)[email protected] [email protected]
EPA-lead Number of extraction wells: 2
9/28/90 Date of construction completion: 1/1994
Date of operational and functional: 6/1995
Final Expected date of turnover to state: 1/2004
Operational Expected date of completion: 1/2014
Primary goal of system: Containment & Restoration Approximate downtime per year: 2 weeks
Presence of NAPLs Not present Number of monitoring wells used: 0
Approximate annual O&M costs: $155,711 Frequency of sampling: 0 times per year
Costs related to monitoring: $140,000 Is plume migration controlled? Don't know
Approximate pumping rate: 62 gpm Progress of aquifer restoration: Don't know
Not evaluated minor/minor
Contaminants of Concern: Treatment Processes:
99 Carbozol Metals precipitation
355 Trichlorobenzene Air stripping
Biological treatment
UV oxidation
Carbon adsorption yes
Filtration
Ion Exchange
2 Reverse Osmosis
108 Off-gas treatment yes
120 other/not sure
354
Comments:
Originally, the time frame for aquifer restoration was 20 years from system startup but we are currently re-evaluating the effectiveness of the remedy and that time frame may change.
Contact Information
System Information and Data
1650 Arch Street PADEP
Date original ROD was signed:
Date of last modification to ROD:
Philadelphia, PA 19103215-814-5125 (phone)215-814-3002 (fax)
RaymarkHatboro, PA (Region 3)CERCLIS ID 0300894
CDM Federal Programs
RPMDeanna Moultrie
Type of Fund-lead Site:
Result of previous evaluation of peformance/effectiveness:
Difficulty (due to social/political factors) of implementing minor/major changes:
Type of ROD:
Status of P&T system:

55
State Regulator ContractorThomas Modena Marc Gutterman
629 East Main Street 803 Front StreetRichmond, VA 23219 Norfolk, VA 23510804-698-4183 (phone) 757-441-7669 (phone)804-698-4500 (fax) 757-441-7478 (fax)[email protected] [email protected]
EPA-lead Number of extraction wells: 4
9/27/96 Date of construction completion: 4/1998
Date of operational and functional: 5/1999
Final Expected date of turnover to state: 5/2009
Operational Expected date of completion: 4/2008
Primary goal of system: Containment & Restoration Approximate downtime per year: 2 weeks
Presence of NAPLs Suspected Number of monitoring wells used: 10
Approximate annual O&M costs: $80,000 Frequency of sampling: 4 times per year
Costs related to monitoring: $25,000 Is plume migration controlled? Yes
Approximate pumping rate: 2 gpm Progress of aquifer restoration: Don't know
Not evaluated minor/severe
Contaminants of Concern: Treatment Processes:
62 Arsenic Metals precipitation yes
290 Pentachlorophenol (PCP) Air stripping
Biological treatment
UV oxidation
Carbon adsorption yes
Filtration yes
Ion Exchange
2 Reverse Osmosis
108 Off-gas treatment
120 other/not sure
354
Comments:
To clarify #19 above: The system was constructed by Removal because the plume was getting close to a drinking reservoir.
To clarify #30: The treatment plant is located on the PRP's property but the recovery wells and monitorong wells are located on the adjoining property. We placed piping and power in the utilities conduit trench for another recovery well. We have access to these wells and the conduit trench through an access agreement between the PRP and the owner of the adjoining property. However, any work outside of this area could be very difficult to implement because it would probably require another access agreement.
Contact Information
System Information and Data
1650 Arch Street Virginia Department of Env.Quality
Date original ROD was signed:
Date of last modification to ROD:
Philadelphia, PA 19103215-814-3233 (phone)215-814-3002 (fax)
Saunders Supply CompanyChuckatuck, VA (Region 3)
CERCLIS ID VAD003117389
U.S. Army Corps of Engineers
RPMAndrew Palestini
Type of Fund-lead Site:
Result of previous evaluation of peformance/effectiveness:
Difficulty (due to social/political factors) of implementing minor/major changes:
Type of ROD:
Status of P&T system:

REGION 4 INFORMATION SHEETS

60
State Regulator ContractorNile Testerman
401 Oberlin RoadRaleigh, NC 27605919-733-2801 (phone)919-733-4811 (fax)[email protected]
EPA-lead Number of extraction wells:
1/26/93 Date of construction completion:
Date of operational and functional:
Final Expected date of turnover to state:
Operational Expected date of completion:
Primary goal of system: Restoration Approximate downtime per year:
Presence of NAPLs Not present Number of monitoring wells used:
Approximate annual O&M costs: Frequency of sampling:
Costs related to monitoring: Is plume migration controlled?
Approximate pumping rate: Progress of aquifer restoration:
Contaminants of Concern: Treatment Processes:
6 1,1-Dichloroethylene (DCE) Metals precipitation
354 Trichlorethylene (TCE)/Tetrachloroelthylene (PCE) Air stripping yes
vinyl chloride Biological treatment
UV oxidation
Carbon adsorption
Filtration yes
Ion Exchange
2 Reverse Osmosis
108 Off-gas treatment
120 other/not sure
354
Comments:
Douglas Sutton completed this form based on a phone interview with Luis Flores.
The site has been shut down for approximately 1 year.
The EPA and the previous site contractor are currently in litigation and additional site details could not be discussed.
Contact Information
System Information and Data
61 Forsyth Street, SW NCDENR
Date original ROD was signed:
Date of last modification to ROD:
Atlanta, GA 30303-8960404-562-8807 (phone)
ABC CleanersJacksonville, NC (Region 4)
CERCLIS ID NCD024644494
RPMLuis Flores
Type of Fund-lead Site:
Result of previous evaluation of peformance/effectiveness:
Difficulty (due to social/political factors) of implementing minor/major changes:
Type of ROD:
Status of P&T system:
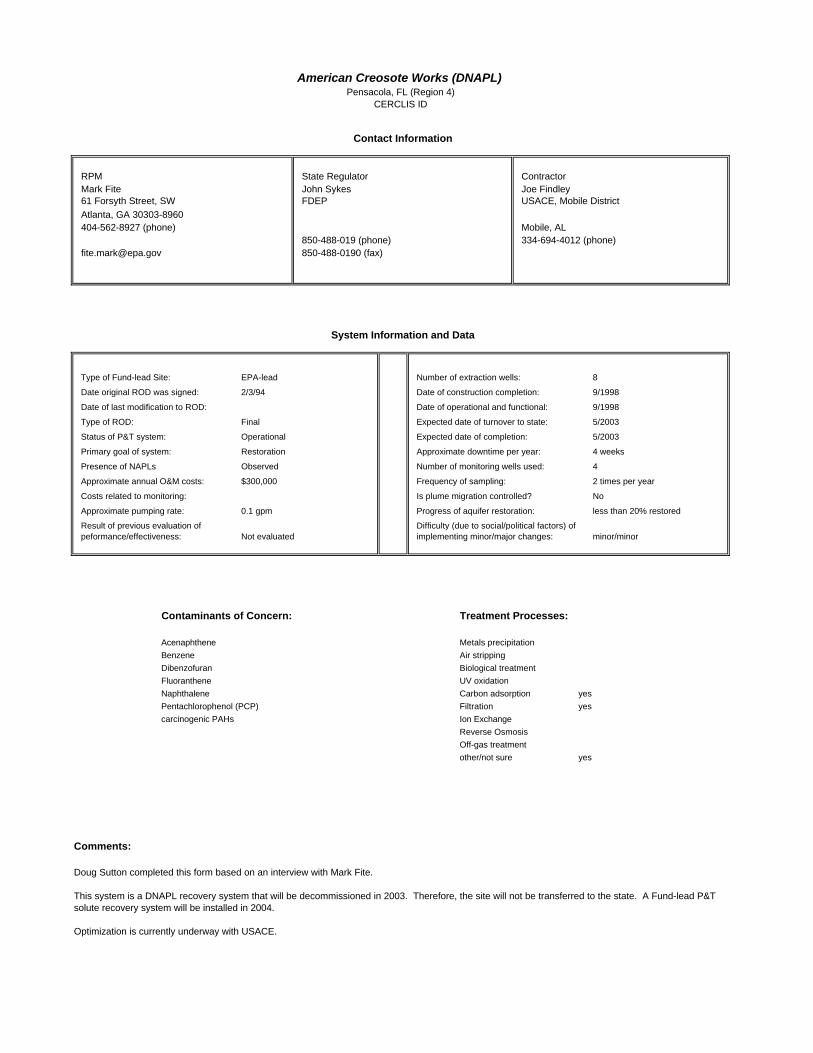
61
State Regulator ContractorJohn Sykes Joe Findley
Mobile, AL 850-488-019 (phone) 334-694-4012 (phone)850-488-0190 (fax)
EPA-lead Number of extraction wells: 8
2/3/94 Date of construction completion: 9/1998
Date of operational and functional: 9/1998
Final Expected date of turnover to state: 5/2003
Operational Expected date of completion: 5/2003
Primary goal of system: Restoration Approximate downtime per year: 4 weeks
Presence of NAPLs Observed Number of monitoring wells used: 4
Approximate annual O&M costs: $300,000 Frequency of sampling: 2 times per year
Costs related to monitoring: Is plume migration controlled? No
Approximate pumping rate: 0.1 gpm Progress of aquifer restoration: less than 20% restored
Not evaluated minor/minor
Contaminants of Concern: Treatment Processes:
39 Acenaphthene Metals precipitation
70 Benzene Air stripping
144 Dibenzofuran Biological treatment
175 Fluoranthene UV oxidation
260 Naphthalene Carbon adsorption yes
290 Pentachlorophenol (PCP) Filtration yes
carcinogenic PAHs Ion Exchange
2 Reverse Osmosis
108 Off-gas treatment
120 other/not sure yes
354
Comments:
RPMMark Fite
Type of Fund-lead Site:
Result of previous evaluation of peformance/effectiveness:
Difficulty (due to social/political factors) of implementing minor/major changes:
Type of ROD:
Status of P&T system:
American Creosote Works (DNAPL)Pensacola, FL (Region 4)
CERCLIS ID
USACE, Mobile District
Doug Sutton completed this form based on an interview with Mark Fite.
This system is a DNAPL recovery system that will be decommissioned in 2003. Therefore, the site will not be transferred to the state. A Fund-lead P&T solute recovery system will be installed in 2004.
Optimization is currently underway with USACE.
Contact Information
System Information and Data
61 Forsyth Street, SW FDEP
Date original ROD was signed:
Date of last modification to ROD:
Atlanta, GA 30303-8960404-562-8927 (phone)

62
State Regulator ContractorJohn Sykes Joe Findley
Mobile, AL 850-488-0190 (phone) 334-694-4012 (phone)
EPA-lead Number of extraction wells: 3
2/3/94 Date of construction completion: 9/2004
Date of operational and functional: 9/2004
Final Expected date of turnover to state: 9/2014
Predesign Expected date of completion: 9/2009
Primary goal of system: Containment & Restoration Approximate downtime per year: 0 weeks
Presence of NAPLs Observed Number of monitoring wells used: 10
Approximate annual O&M costs: $452,000 Frequency of sampling: 2 times per year
Costs related to monitoring: Is plume migration controlled?
Approximate pumping rate: 105 gpm Progress of aquifer restoration:
Not evaluated minor/minor
Contaminants of Concern: Treatment Processes:
39 Acenaphthene Metals precipitation
70 Benzene Air stripping
144 Dibenzofuran Biological treatment yes
175 Fluoranthene UV oxidation
260 Naphthalene Carbon adsorption yes
290 Pentachlorophenol (PCP) Filtration
carcinogenic PAHs Ion Exchange
2 Reverse Osmosis
108 Off-gas treatment
120 other/not sure
354
Comments:
RPMMark Fite
Type of Fund-lead Site:
Result of previous evaluation of peformance/effectiveness:
Difficulty (due to social/political factors) of implementing minor/major changes:
Type of ROD:
Status of P&T system:
American Creosote Works (solute)Pensacola, FL (Region 4)
CERCLIS ID
USACE, Mobile District
Douglas Sutton completed this form based on a phone interview with Mark Fite.
This system is planned to address dissolved groundwater contamination in 2004 after the associated DNAPL recovery system is decommissioned.
Data provided here are estimates taken from the ROD.
Contact Information
System Information and Data
61 Forsyth Street, SW FDEP
Date original ROD was signed:
Date of last modification to ROD:
Atlanta, GA 30303-8960404-562-8927 (phone)

63
State Regulator ContractorNile Testerman Chris Leggett
401 Oberlin RoadRaleigh, NC 27605 Newport, TN 919-733-2801 (phone) 423-625-0557 (phone)919-733-4811 (fax)[email protected]
EPA-lead Number of extraction wells: 2
7/31/92 Date of construction completion: 4/2001
Date of operational and functional: 5/2001
Final Expected date of turnover to state: 5/2011
Operational Expected date of completion: 5/2021
Primary goal of system: Containment & Restoration Approximate downtime per year: 0 weeks
Presence of NAPLs Not present Number of monitoring wells used: 8
Approximate annual O&M costs: $30,000 Frequency of sampling: 4 times per year
Costs related to monitoring: $10,000 Is plume migration controlled? Don't know
Approximate pumping rate: 16 gpm Progress of aquifer restoration: less than 20% restored
Not evaluated minor/minor
Contaminants of Concern: Treatment Processes:
127 Creosote and petroleum hydrocarbons Metals precipitation
Air stripping
Biological treatment
UV oxidation
Carbon adsorption
Filtration
Ion Exchange
2 Reverse Osmosis
108 Off-gas treatment
120 other/not sure yes
354
Comments:
RPMJon Bornholm
Type of Fund-lead Site:
Result of previous evaluation of peformance/effectiveness:
Difficulty (due to social/political factors) of implementing minor/major changes:
Type of ROD:
Status of P&T system:
Benfield IndustriesHazelwood, NC (Region 4)
CERCLIS ID NCD981026479
CMC
This form was completed by Douglas Sutton based on a phone interview with Jon Bornholm.
Monitoring frequency is expected to drop from quarterly to annually.
Contact Information
System Information and Data
61 Forsyth Street, SW NCDENR
Date original ROD was signed:
Date of last modification to ROD:
Atlanta, GA 30303-8960404-562-8820 (phone)

59
State Regulator ContractorNile Testerman Ed Hicks
401 Oberlin Road 1145 Sanctuary Parkway, Suite 475Raleigh, NC 27605 Alpharetta, GA 30004919-733-2901 (phone) 770-521-8141 (phone)919-733-4811 (fax) 770-751-8322 (fax)[email protected] [email protected]
EPA-lead Number of extraction wells: 7
6/30/89 Date of construction completion: 9/2001
3/23/01 Date of operational and functional: 9/2002
Final Expected date of turnover to state: 10/2011
Design/Not Installed Expected date of completion: 12/2009
Primary goal of system: Containment & Restoration Approximate downtime per year:
Presence of NAPLs Observed Number of monitoring wells used: 25
Approximate annual O&M costs: $40,000 Frequency of sampling: 4 times per year
Costs related to monitoring: $30,000 Is plume migration controlled?
Approximate pumping rate: 43 gpm Progress of aquifer restoration:
Not evaluated minor/minor
Contaminants of Concern: Treatment Processes:
70 Benzene Metals precipitation
72 Benzo(a)anthracene Air stripping
73 Benzo(a)pyrene Biological treatment
74 Benzo(b)fluoranthene UV oxidation
75 Benzo(g,h,i)perylene Carbon adsorption yes
Filtration
Ion Exchange
2 Reverse Osmosis
108 Off-gas treatment
120 other/not sure
354
Comments:
Contact Information
System Information and Data
61 Forsyth Street, SW NCDENR
Date original ROD was signed:
Date of last modification to ROD:
Atlanta, GA 30303-3104404-562-8820 (phone)404-562-8788 (fax)
Cape Fear Wood PreservingFayetteville, NC (Region 4)
CERCLIS ID NCD003188828
Black & Veatch
RPMJon Bornholm
Type of Fund-lead Site:
Result of previous evaluation of peformance/effectiveness:
Difficulty (due to social/political factors) of implementing minor/major changes:
Type of ROD:
Status of P&T system:

64
State Regulator ContractorJohn Sykes Todd Trulock
Jacksonville, FL 850-413-0066 (phone) 904-232-1110 (phone)
EPA-lead Number of extraction wells:
9/25/86 Date of construction completion:
9/25/97 Date of operational and functional:
Interim Expected date of turnover to state:
Predesign Expected date of completion:
Primary goal of system: Restoration Approximate downtime per year:
Presence of NAPLs Observed Number of monitoring wells used:
Approximate annual O&M costs: Frequency of sampling:
Costs related to monitoring: Is plume migration controlled?
Approximate pumping rate: Progress of aquifer restoration:
Not evaluated
Contaminants of Concern: Treatment Processes:
163 Dioxin Metals precipitation
290 Pentachlorophenol (PCP) Air stripping
Biological treatment
UV oxidation
Carbon adsorption
Filtration
Ion Exchange
2 Reverse Osmosis
108 Off-gas treatment
120 other/not sure
354
Comments:
RPMRandall Chaffins
Type of Fund-lead Site:
Result of previous evaluation of peformance/effectiveness:
Difficulty (due to social/political factors) of implementing minor/major changes:
Type of ROD:
Status of P&T system:
Coleman Evans Wood PreservingWhitehouse, FL (Region 4)
CERCLIS ID FLD991279894
USACE, Jacksonville District
This form was completed by Douglas Sutton based on a phone interview with Randall Chaffins.
There are three RODs for this OU. The first is dated 1986 and the last is dated 1997.
As the system is in the pre-design stage, no information is availabe about system operations.
Contact Information
System Information and Data
61 Forsyth Street, SW FDEP
Date original ROD was signed:
Date of last modification to ROD:
Atlanta, GA 30303-8960404-562-8929 (phone)
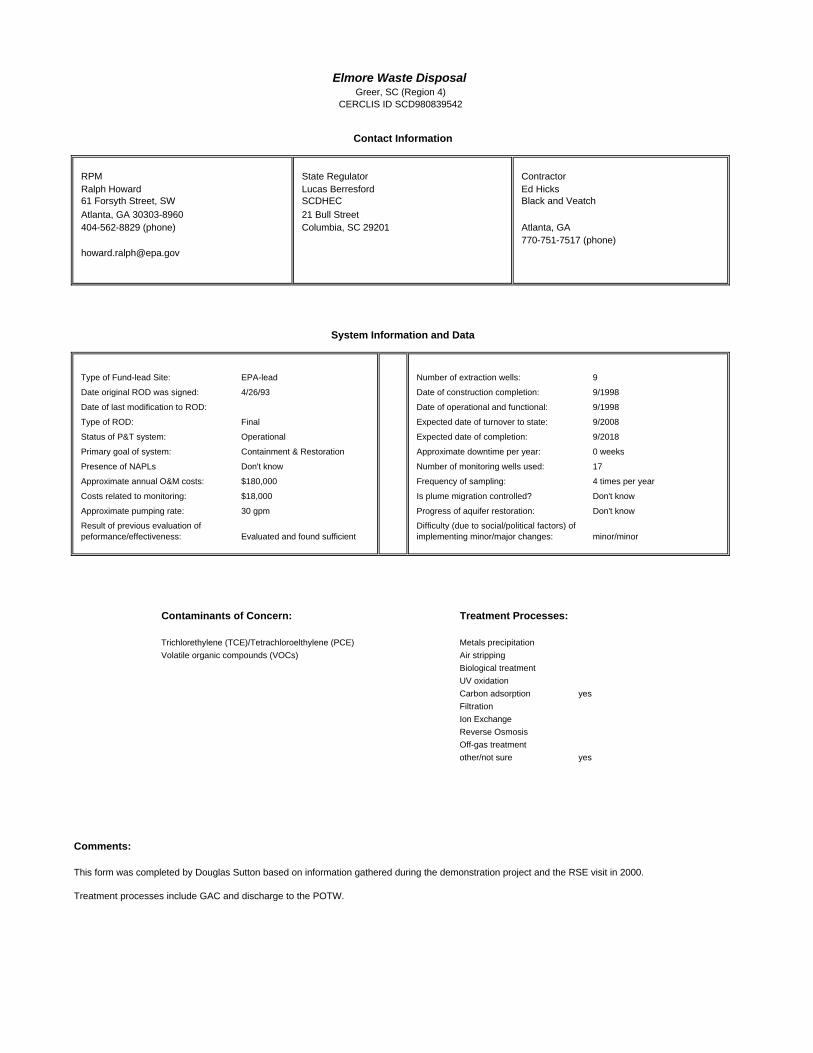
65
State Regulator ContractorLucas Berresford Ed Hicks
21 Bull StreetColumbia, SC 29201 Atlanta, GA
770-751-7517 (phone)
EPA-lead Number of extraction wells: 9
4/26/93 Date of construction completion: 9/1998
Date of operational and functional: 9/1998
Final Expected date of turnover to state: 9/2008
Operational Expected date of completion: 9/2018
Primary goal of system: Containment & Restoration Approximate downtime per year: 0 weeks
Presence of NAPLs Don't know Number of monitoring wells used: 17
Approximate annual O&M costs: $180,000 Frequency of sampling: 4 times per year
Costs related to monitoring: $18,000 Is plume migration controlled? Don't know
Approximate pumping rate: 30 gpm Progress of aquifer restoration: Don't know
Evaluated and found sufficient minor/minor
Contaminants of Concern: Treatment Processes:
354 Trichlorethylene (TCE)/Tetrachloroelthylene (PCE) Metals precipitation
372 Volatile organic compounds (VOCs) Air stripping
Biological treatment
UV oxidation
Carbon adsorption yes
Filtration
Ion Exchange
2 Reverse Osmosis
108 Off-gas treatment
120 other/not sure yes
354
Comments:
This form was completed by Douglas Sutton based on information gathered during the demonstration project and the RSE visit in 2000.
Treatment processes include GAC and discharge to the POTW.
Contact Information
System Information and Data
61 Forsyth Street, SW SCDHEC
Date original ROD was signed:
Date of last modification to ROD:
Atlanta, GA 30303-8960404-562-8829 (phone)
Elmore Waste DisposalGreer, SC (Region 4)
CERCLIS ID SCD980839542
Black and Veatch
RPMRalph Howard
Type of Fund-lead Site:
Result of previous evaluation of peformance/effectiveness:
Difficulty (due to social/political factors) of implementing minor/major changes:
Type of ROD:
Status of P&T system:

66
State Regulator ContractorNile Testerman Ralph McKeen
401 Oberlin RoadRaleigh, NC 27605 Atlanta, GA 919-733-2801 (phone) 770-263-5438 (phone)919-733-4811 (fax)[email protected]
EPA-lead Number of extraction wells: 10
9/27/93 Date of construction completion:
9/30/96 Date of operational and functional: 5/1998
Final Expected date of turnover to state: 5/2008
Operational Expected date of completion: 5/2008
Primary goal of system: Containment & Restoration Approximate downtime per year:
Presence of NAPLs Don't know Number of monitoring wells used: 18
Approximate annual O&M costs: $150,000 Frequency of sampling: 4 times per year
Costs related to monitoring: $40,000 Is plume migration controlled? Don't know
Approximate pumping rate: 20 gpm Progress of aquifer restoration: less than 20% restored
Evaluated and found sufficient minor/minor
Contaminants of Concern: Treatment Processes:
291 Pesticides Metals precipitation
372 Volatile organic compounds (VOCs) Air stripping
PCE Biological treatment
UV oxidation
Carbon adsorption yes
Filtration yes
Ion Exchange
2 Reverse Osmosis
108 Off-gas treatment
120 other/not sure
354
Comments:
This form was completed by Douglas Sutton based on information collected during the demonstration project. Data on the extraction, treatment, and monitoring systems were obtained from the report resultingn from the RSE conducted in 2000.
Contact Information
System Information and Data
61 Forsyth Street, SW NCDENR
Date original ROD was signed:
Date of last modification to ROD:
Atlanta, GA 30303-8960404-562-8802 (phone)
FCX StatesvilleStatesville, NC (Region 4)
CERCLIS ID NCD095458527
Roy F. Weston
RPMKen Mallory
Type of Fund-lead Site:
Result of previous evaluation of peformance/effectiveness:
Difficulty (due to social/political factors) of implementing minor/major changes:
Type of ROD:
Status of P&T system:

67
State Regulator Contractor
State-lead w/ Fund $ Number of extraction wells: 40
1/0/00 Date of construction completion: 9/1992
Date of operational and functional: 9/1992
Final Expected date of turnover to state: 9/2002
Operational Expected date of completion:
Primary goal of system: Water supply Approximate downtime per year:
Presence of NAPLs Not present Number of monitoring wells used:
Approximate annual O&M costs: $1,000,000 Frequency of sampling:
Costs related to monitoring: Is plume migration controlled?
Approximate pumping rate: 104000 gpm Progress of aquifer restoration:
Contaminants of Concern: Treatment Processes:
357 Trichloroethylene (TCE) Metals precipitation
Air stripping yes
Biological treatment
UV oxidation
Carbon adsorption
Filtration
Ion Exchange
2 Reverse Osmosis
108 Off-gas treatment
120 other/not sure
354
Comments:
Douglas Sutton completed this form based on a phone interview with Jim McGuire.
No current RPM is appointed to this site. Jim McGuire is the point of contact.
EPA Region 4 provides $1,000,000 per year to Dade County to operate 40 air strippers that have been installed to remediate aquifer and to treat water extracted from public well fields and used for water supply.
The total number of wells is not known but this number is likely similar to number of airstrippers (40).
Contact Information
System Information and Data
61 Forsyth Street, SW
Date original ROD was signed:
Date of last modification to ROD:
Atlanta, GA 30303-8960404-562-8911 (phone)
Miami DrumHialeah, FL (Region 4)
CERCLIS ID FLD076027820
RPMJim McGuire
Type of Fund-lead Site:
Result of previous evaluation of peformance/effectiveness:
Difficulty (due to social/political factors) of implementing minor/major changes:
Type of ROD:
Status of P&T system:

68
State Regulator ContractorKeisha Long Tim Eggert
21 Bull Street 2030 Powers Ferry Road, Suite 325Columbia, SC 29201 Atlanta, GA 30339803-896-4073 (phone) 678-202-8912 (phone)
770-951-8910 (fax)[email protected]
EPA-lead Number of extraction wells: 10
9/30/87 Date of construction completion: 5/1997
8/4/93 Date of operational and functional: 1/1998
Final Expected date of turnover to state: 5/2008
Operational Expected date of completion: 5/2008
Primary goal of system: Containment & Restoration Approximate downtime per year: 4 weeks
Presence of NAPLs Not present Number of monitoring wells used: 8
Approximate annual O&M costs: $300,000 Frequency of sampling: 2 times per year
Costs related to monitoring: $25,000 Is plume migration controlled? Yes
Approximate pumping rate: 130 gpm Progress of aquifer restoration: 20% to 80% restored
Evaluated and found sufficient minor/moderate
Contaminants of Concern: Treatment Processes:
118 Chromium Metals precipitation
Air stripping
Biological treatment
UV oxidation
Carbon adsorption
Filtration
Ion Exchange
2 Reverse Osmosis
108 Off-gas treatment
120 other/not sure yes
354
Comments:
This form was completed by Doug Sutton based on a phone interview with Al Cherry and Tim Eggert.
11 of 17 original wells have met clean-up standards
expected time to remediation completion is an estimate
treatment processes include pH adjustment and discharge to the POTW
Contact Information
System Information and Data
61 Forsyth Street, SW SCDH
Date original ROD was signed:
Date of last modification to ROD:
Atlanta, GA 30303-8960404-562-8807 (phone)
Palmetto WoodLexington, SC (Region 4)
CERCLIS ID SCD003362217
CDM
RPMAl Cherry
Type of Fund-lead Site:
Result of previous evaluation of peformance/effectiveness:
Difficulty (due to social/political factors) of implementing minor/major changes:
Type of ROD:
Status of P&T system:

REGION 5 INFORMATION SHEETS

71
State Regulator ContractorMaureen Johnson Gary Schroeher
520 Lafayette Road 2770 Cleveland AveSt. Paul, MN 55155-4194 Roseville, MN 55113-1127651-296-7353 (phone) 651-639-9449 (phone)
State-lead w/ Fund $ Number of extraction wells: 0
9/30/86 Date of construction completion: 6/1993
2/9/94 Date of operational and functional: 7/1993
Final Expected date of turnover to state: 7/2003
Operational Expected date of completion: 4/2004
Primary goal of system: Containment & Restoration Approximate downtime per year: 0 weeks
Presence of NAPLs Not present Number of monitoring wells used: 18
Approximate annual O&M costs: $70,000 Frequency of sampling: 2 times per year
Costs related to monitoring: $10,000 Is plume migration controlled? Yes
Approximate pumping rate: 25 gpm Progress of aquifer restoration: more than 80% restored
Evaluated and found sufficient minor/moderate
Contaminants of Concern: Treatment Processes:VOCs, PNAs, VC
290 Pentachlorophenol (PCP) Metals precipitation
Air stripping
Biological treatment
UV oxidation
Carbon adsorption
Filtration
Ion Exchange
2 Reverse Osmosis
108 Off-gas treatment
120 other/not sure yes
354
Comments:
This form was completed by Douglas Sutton based on information collected during the demonstration project in 4/2000 and on phone interviews with Darryl Owens and Maureen Johnson in 5/2001.
There are no extraction wells, but there is over 700 feet of trenches at a depth of 25 feet.
Contact Information
System Information and Data
77 West Jackson Boulevard MPCA
Date original ROD was signed:
Date of last modification to ROD:
Chicago, IL 60604-3507312-886-7089 (phone)
Arrowhead RefineryHermantown, MN (Region 5)CERCLIS ID MND980823975
Delta Environmental
RPMDarryl Owens
Type of Fund-lead Site:
Result of previous evaluation of peformance/effectiveness:
Difficulty (due to social/political factors) of implementing minor/major changes:
Type of ROD:
Status of P&T system:

72
State Regulator ContractorKeld Lauredsen
1125 Military Ave. Box 10448Green Bay, WI 54307920-492-5921 (phone)920-492-5913 (fax)[email protected]
State-lead w/ Fund $ Number of extraction wells: 0
9/24/96 Date of construction completion: 8/2000
Date of operational and functional: 4/1993
Expected date of turnover to state: 6/2006
Operational Expected date of completion: 4/2030
Primary goal of system: Containment & Restoration Approximate downtime per year: 0 weeks
Presence of NAPLs Not present Number of monitoring wells used: 14
Approximate annual O&M costs: $36,000 Frequency of sampling: 2 times per year
Costs related to monitoring: $10,000 Is plume migration controlled? Yes
Approximate pumping rate: 0 gpm Progress of aquifer restoration: less than 20% restored
Evaluated and found sufficient minor/severe
Contaminants of Concern: Treatment Processes:
118 Chromium Metals precipitation yes
Air stripping
Biological treatment
UV oxidation
Carbon adsorption
Filtration
Ion Exchange
2 Reverse Osmosis
108 Off-gas treatment
120 other/not sure
Comments:
This form was completed by Douglas Sutton based on information collected during the demonstration project in 4/2000 and on phone interviews with John Peterson and Keld Lauredsen.
This site consists of two different contaminant areas. The P&T system operated in the chrome shop from 1993 to 1999 and was moved to the zinc shop in 2000.
DNR provides the oversight; therefore, a contractor contact was not given.
The site has no extraction wells but has two trenches.
Contact Information
System Information and Data
77 West Jackson Boulevard WDNR
Date original ROD was signed:
Date of last modification to ROD:
Chicago, IL 60604-3507312-353-1264 (phone)
Better Brite Plating Co. Chrome and Zinc ShopsDepere, WI (Region 5)
CERCLIS ID WIT560010118
RPMJohn Peterson
Type of Fund-lead Site:
Result of previous evaluation of peformance/effectiveness:
Difficulty (due to social/political factors) of implementing minor/major changes:
Type of ROD:
Status of P&T system:

73
State Regulator ContractorKevin Herron Dan Plomb
135 S. 84th Street Suite 325Milwaukee, WI 53214
317-234-0354 (phone) 414-272-2426 (phone)
EPA-lead Number of extraction wells: 5
5/3/96 Date of construction completion: 9/2000
Date of operational and functional: 7/2001
Final Expected date of turnover to state: 9/2010
Installed Expected date of completion: 10/2030
Primary goal of system: Containment & Restoration Approximate downtime per year: 2 weeks
Presence of NAPLs Not present Number of monitoring wells used: 36
Approximate annual O&M costs: $120,000 Frequency of sampling: 2 times per year
Costs related to monitoring: $60,000 Is plume migration controlled?
Approximate pumping rate: 1000 gpm Progress of aquifer restoration:
Not evaluated minor/minor
Contaminants of Concern: Treatment Processes:
62 Arsenic Metals precipitation
332 TCE and Vinyl chloride Air stripping
340 Tetrahydrofuran Biological treatment
354 Trichlorethylene (TCE)/Tetrachloroelthylene (PCE) UV oxidation
Carbon adsorption
Filtration
Ion Exchange
2 Reverse Osmosis
108 Off-gas treatment
120 other/not sure yes
354
Comments:
Site is currently operating at approximately 60%.
Contact Information
System Information and Data
77 West Jackson Blvd.
Date original ROD was signed:
Date of last modification to ROD:
Chicago, IL 60604-3507312-886-4737 (phone)
Douglass RoadMishawaka, IN (Region 5)
CERCLIS ID IND980607881
CH2MHILL
RPMDion Novak
Type of Fund-lead Site:
Result of previous evaluation of peformance/effectiveness:
Difficulty (due to social/political factors) of implementing minor/major changes:
Type of ROD:
Status of P&T system:

74
State Regulator ContractorWalelign Wagaw Tim Gouger
P.O. Box 30426 12565 West Center RoadLansing, MI 48909 Omaha, NE 68144-3869517-373-9896 (phone) 402-293-2514 (phone)
402-291-8177 (fax)[email protected]
EPA-lead Number of extraction wells: 2
9/30/93 Date of construction completion: 7/2001
5/31/01 Date of operational and functional: 7/2001
Interim Expected date of turnover to state: 7/2011
Installed Expected date of completion: 7/2007
Primary goal of system: Restoration Approximate downtime per year: 0 weeks
Presence of NAPLs Not present Number of monitoring wells used: 25
Approximate annual O&M costs: Frequency of sampling: 2 times per year
Costs related to monitoring: Is plume migration controlled?
Approximate pumping rate: 80 gpm Progress of aquifer restoration:
Not evaluated minor/minor
Contaminants of Concern: Treatment Processes:
58 Anthracene Metals precipitation
99 Carbozol Air stripping
116 Chloromethane Biological treatment
N-N dimethylanaline, Gentin Violet UV oxidation
Carbon adsorption yes
Filtration
Ion Exchange
2 Reverse Osmosis
108 Off-gas treatment
120 other/not sure
354
Comments:
RPMKyle Rogers
Type of Fund-lead Site:
Result of previous evaluation of peformance/effectiveness:
Difficulty (due to social/political factors) of implementing minor/major changes:
Type of ROD:
Status of P&T system:
Duell and GardnerDalton Township, MI (Region 5)
CERCLIS ID MID980504716
USACE, Rapid Response
This form was completed by Douglas Sutton based on information collected during the demonstration project in 4/2000 and on a phone interview with Kyle Rogers in 5/2001.
One well is currently installed and pumping. Another well will be installed in July 2001 marking the beginning of O&F.
Contact Information
System Information and Data
77 West Jackson Boulevard MDEQ
Date original ROD was signed:
Date of last modification to ROD:
Chicago, IL 60604-3507312-886-1995 (phone)

75
State Regulator Contractor
State-lead w/ Fund $ Number of extraction wells: 14
3/31/88 Date of construction completion: 6/1987
8/1/90 Date of operational and functional: 3/1991
Expected date of turnover to state:
Operational Expected date of completion:
Primary goal of system: Approximate downtime per year:
Presence of NAPLs Don't know Number of monitoring wells used:
Approximate annual O&M costs: $175,000 Frequency of sampling:
Costs related to monitoring: Is plume migration controlled? Don't know
Approximate pumping rate: 4500 gpm Progress of aquifer restoration: Don't know
Evaluated and found sufficient severe/severe
Contaminants of Concern: Treatment Processes:
352 Trans 1,2-Dichloroethylene Metals precipitation
370 Vernolate Air stripping yes
Biological treatment
UV oxidation
Carbon adsorption
Filtration
Ion Exchange
2 Reverse Osmosis
108 Off-gas treatment
120 other/not sure
Comments:
RPMSheri Bianchin
Type of Fund-lead Site:
Result of previous evaluation of peformance/effectiveness:
Difficulty (due to social/political factors) of implementing minor/major changes:
Type of ROD:
Status of P&T system:
Eau Claire Municipal Wel FieldEau Claire, WI (Region 5)
CERCLIS ID WID980820054
This form was completed by Douglas Sutton based on information obtained from
1) www.epa.gov/R5Super/npl/wisconsin/WID980820054.htm
and
2) Information Paper #61: Contaminated Land and Brownfields Cleanup Programs State of Wisconsin Legislative Bureau, 1/2001
The EPA RPM was not available for comment.
Reference on stated that as of 6/30/00 the EPA had spent $5.9M dollars on the site and Wisconsin had spent $175K on the site. If the state assumes approximately 10% of the O&M costs and the site ran for approximately 9 years (up to 6/30/00) then this translates to an approximate O&M cost of $175K. This approximation is entered as the approximate O&M cost for item 15.
System goals appear to be both restoration and water supply.
Contact Information
System Information and Data
77 West Jackson Boulevard
Date original ROD was signed:
Date of last modification to ROD:
Chicago, IL 60604-3507312-886-4745 (phone)

76
State Regulator ContractorRich Lang Neil Brown
P.O. Box 1515 33 N. Deerborne St.La Salle, IL 61301 Chicago, IL 60602815-223-6836 (phone) 312-578-9243 (phone)
State-lead w/ Fund $ Number of extraction wells: 0
8/29/86 Date of construction completion: 2/1998
3/30/88 Date of operational and functional: 3/1994
Final Expected date of turnover to state: 3/2004
Operational Expected date of completion: 3/2005
Primary goal of system: Containment & Restoration Approximate downtime per year: 2 weeks
Presence of NAPLs Not present Number of monitoring wells used: 25
Approximate annual O&M costs: $230,000 Frequency of sampling: 4 times per year
Costs related to monitoring: $50,000 Is plume migration controlled? Yes
Approximate pumping rate: 20 gpm Progress of aquifer restoration: 20% to 80% restored
Evaluated and found sufficient minor/minor
Contaminants of Concern: Treatment Processes:
353 Transuranic wastes Metals precipitation
PCB, TCA Air stripping
Biological treatment
UV oxidation
Carbon adsorption yes
Filtration
Ion Exchange
2 Reverse Osmosis
108 Off-gas treatment
120 other/not sure yes
354
Comments:
RPMSteve Padovani
Type of Fund-lead Site:
Result of previous evaluation of peformance/effectiveness:
Difficulty (due to social/political factors) of implementing minor/major changes:
Type of ROD:
Status of P&T system:
La Salle Electrical UtilitiesLa Salle, IL (Region 5)
CERCLIS ID ILD980794333
Ecology and Environment
This form was completed by Douglas Sutton based information collected during the demonstration project in 4/2000 and on a phone interview with Steve Padovani in 4/2001.
There are no extraction wells, but there are 4 trenches.
Treatment processes include treatment with liquid and vapor phase carbon and discharge to the POTW.
Contact Information
System Information and Data
77 West Jackson Boulevard IEPA
Date original ROD was signed:
Date of last modification to ROD:
Chicago, IL 60604-3507312-353-6755 (phone)

77
State Regulator ContractorMariam Horneff Bill Bangsund
520 Lafayette RoadSt. Paul, MN 55155-4194651-296-7228 (phone) 612-832-2738 (phone)
State-lead w/ Fund $ Number of extraction wells: 9
6/14/88 Date of construction completion: 11/1996
Date of operational and functional: 8/1996
Final Expected date of turnover to state: 10/2007
Operational Expected date of completion: 10/2015
Primary goal of system: Restoration Approximate downtime per year: 2 weeks
Presence of NAPLs Observed Number of monitoring wells used: 22
Approximate annual O&M costs: $300,000 Frequency of sampling: 1 times per year
Costs related to monitoring: $56,000 Is plume migration controlled? Yes
Approximate pumping rate: 227 gpm Progress of aquifer restoration: 20% to 80% restored
Not evaluated minor/moderate
Contaminants of Concern: Treatment Processes:
150 Dichloroethylene Metals precipitation
354 Trichlorethylene (TCE)/Tetrachloroelthylene (PCE) Air stripping
VC Biological treatment
UV oxidation
Carbon adsorption yes
Filtration
Ion Exchange
2 Reverse Osmosis
108 Off-gas treatment
120 other/not sure
354
Comments:
RPMSheila Sullivan
Type of Fund-lead Site:
Result of previous evaluation of peformance/effectiveness:
Difficulty (due to social/political factors) of implementing minor/major changes:
Type of ROD:
Status of P&T system:
Long Prairie Groundwater ContaminationLong Prairie, MN (Region 5)
CERCLIS ID MND980904072
Barr Engineering
This form was completed by Douglas Sutton based on information collected during the demonstration project in 4/2000 and on phone interviews with Sheila Sullivan and Mariam Horneff in 5/2001.
Contact Information
System Information and Data
77 West Jackson Boulevard MPCA
Date original ROD was signed:
Date of last modification to ROD:
Chicago, IL 60604-3507312-886-5251 (phone)

78
State Regulator ContractorNile Fellows Larry Campbell
520 Lafayette RoadSt. Paul, MN 55155-4194 Chicago, IL 651-296-6300 (phone)
EPA-lead Number of extraction wells: 14
9/30/91 Date of construction completion: 10/1999
9/22/94 Date of operational and functional: 10/1999
Final Expected date of turnover to state: 10/2009
Operational Expected date of completion: 10/2029
Primary goal of system: Restoration Approximate downtime per year:
Presence of NAPLs Observed Number of monitoring wells used: 30
Approximate annual O&M costs: $300,000 Frequency of sampling: 2 times per year
Costs related to monitoring: Is plume migration controlled? Don't know
Approximate pumping rate: 60 gpm Progress of aquifer restoration: less than 20% restored
Not evaluated minor/severe
Contaminants of Concern: Treatment Processes:
118 Chromium Metals precipitation
290 Pentachlorophenol (PCP) Air stripping
carcinogenic PAHs Biological treatment yes
UV oxidation
Carbon adsorption yes
Filtration yes
Ion Exchange
2 Reverse Osmosis
108 Off-gas treatment yes
120 other/not sure
354
Comments:
RPMDarryl Owens
Type of Fund-lead Site:
Result of previous evaluation of peformance/effectiveness:
Difficulty (due to social/political factors) of implementing minor/major changes:
Type of ROD:
Status of P&T system:
MacGillis and Gibbs/Bell Lumber & PoleNew Brighton, MN (Region 5)CERCLIS ID MND006192694
Black and Veatch
This form was completed by Douglas Sutton based on information collected during the demonstration project in 4/2001.
Data regarding the extraction, treatment, and monitoring systems was updated using information from the report generated from the RSE conducted in 2000.
Contact Information
System Information and Data
77 West Jackson Boulevard MPCA
Date original ROD was signed:
Date of last modification to ROD:
Chicago, IL 60604-3507312-886-7089 (phone)

79
State Regulator ContractorPaul Kozol Craig Evans
3911 Fish Hatchery Road 190 Fifth Street EastFitchburg, WI 53711 St. Paul, MN 55101-1638608-275-3301 (phone) 651-290-5594 (phone)608-275-3338 (fax) 651-290-5800 (fax)[email protected] [email protected]
EPA-lead Number of extraction wells: 5
9/20/90 Date of construction completion: 9/1996
Date of operational and functional: 9/1996
Final Expected date of turnover to state: 9/2006
Operational Expected date of completion: 9/2026
Primary goal of system: Containment & Restoration Approximate downtime per year: 4 weeks
Presence of NAPLs Not present Number of monitoring wells used: 20
Approximate annual O&M costs: $471,000 Frequency of sampling: 2 times per year
Costs related to monitoring: $70,000 Is plume migration controlled? Don't know
Approximate pumping rate: 30 gpm Progress of aquifer restoration: Don't know
Evaluated and found sufficient minor/severe
Contaminants of Concern: Treatment Processes:
92 Cadmium Metals precipitation yes
130 Cyanide Air stripping yes
372 Volatile organic compounds (VOCs) Biological treatment
UV oxidation
Carbon adsorption yes
Filtration
Ion Exchange
2 Reverse Osmosis
108 Off-gas treatment
120 other/not sure
354
Comments:
RPMSteve Padovani
Type of Fund-lead Site:
Result of previous evaluation of peformance/effectiveness:
Difficulty (due to social/political factors) of implementing minor/major changes:
Type of ROD:
Status of P&T system:
Oconomowoc ElectroplatingAshippun, WI (Region 5)
CERCLIS ID WID006100275
USACE, St. Paul District
This form was completed by Douglas Sutton based on information collected during the demonstration project inn 4/2000.
Data regarding the extraction, treatment, and monitoring systems were updated based on the report generated from the RSE conducted in 2000.
Contact Information
System Information and Data
77 West Jackson Boulevard WDNR
Date original ROD was signed:
Date of last modification to ROD:
Chicago, IL 60604-3507312-353-6755 (phone)

80
State Regulator ContractorDave Carper Jim Fisher
3550 Mormon Coulee RoadLa Crosse, WI 54601 Milwaukee, WI 608-785-9973 (phone) 414-272-1052 (phone)608-785-9990 (fax)[email protected] [email protected]
EPA-lead Number of extraction wells: 5
8/14/90 Date of construction completion: 7/1994
Date of operational and functional: 8/1995
Final Expected date of turnover to state: 6/2004
Operational Expected date of completion: 7/2002
Primary goal of system: Containment & Restoration Approximate downtime per year: 1 week
Presence of NAPLs Not present Number of monitoring wells used: 10
Approximate annual O&M costs: $200,000 Frequency of sampling: 2 times per year
Costs related to monitoring: $80,000 Is plume migration controlled? Yes
Approximate pumping rate: 560 gpm Progress of aquifer restoration: more than 80% restored
Evaluated and found sufficient minor/minor
Contaminants of Concern: Treatment Processes:
73 Benzo(a)pyrene Metals precipitation yes
352 Trans 1,2-Dichloroethylene Air stripping yes
371 Volatile chlorinated organics Biological treatment
UV oxidation
Carbon adsorption
Filtration
Ion Exchange
2 Reverse Osmosis
108 Off-gas treatment
120 other/not sure
354
Comments:
This form was completed by Douglas Sutton based on information collected during the demonstration project in 4/2000 and a phone interview with Timothy Prendiville in 5/2001.
Contact Information
System Information and Data
77 West Jackson Boulevard WDNR
Date original ROD was signed:
Date of last modification to ROD:
Chicago, IL 60604-3507312-886-5122 (phone)
Onalaska Municipal LandfillOnalaska, WI (Region 5)
CERCLIS ID WID980821656
CH2MHill
RPMTimothy Prendiville
Type of Fund-lead Site:
Result of previous evaluation of peformance/effectiveness:
Difficulty (due to social/political factors) of implementing minor/major changes:
Type of ROD:
Status of P&T system:
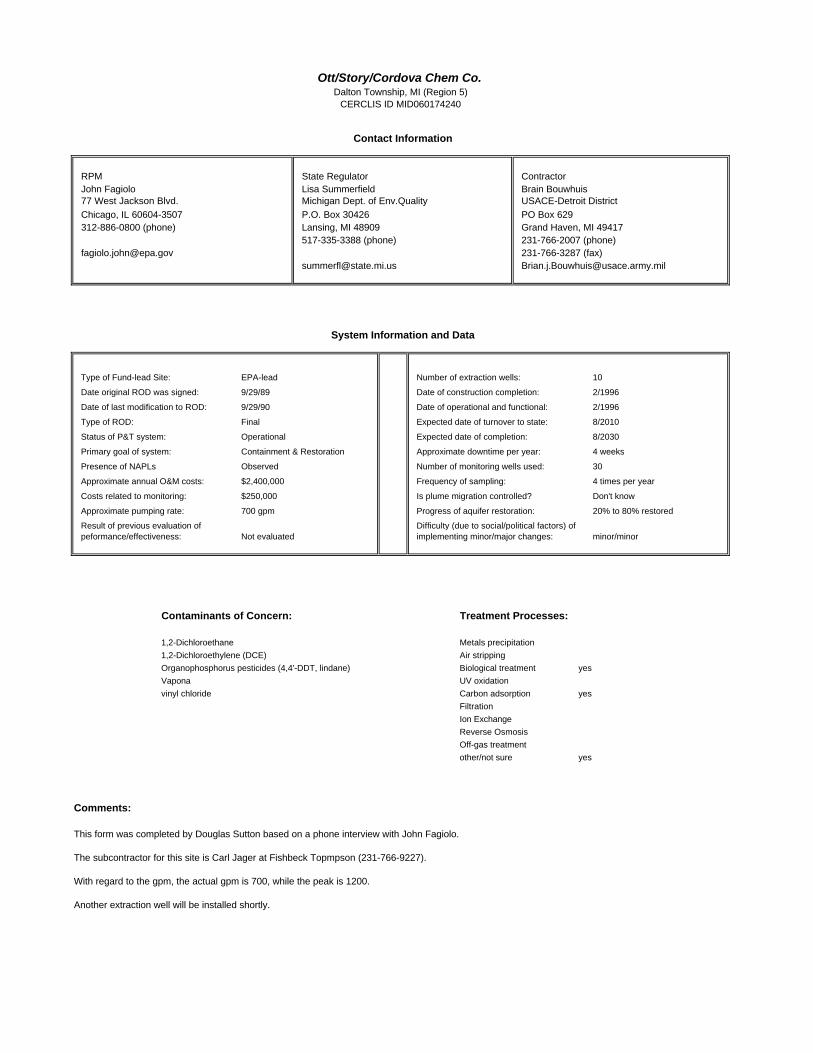
81
State Regulator ContractorLisa Summerfield Brain Bouwhuis
P.O. Box 30426 PO Box 629Lansing, MI 48909 Grand Haven, MI 49417517-335-3388 (phone) 231-766-2007 (phone)
231-766-3287 (fax)[email protected] [email protected]
EPA-lead Number of extraction wells: 10
9/29/89 Date of construction completion: 2/1996
9/29/90 Date of operational and functional: 2/1996
Final Expected date of turnover to state: 8/2010
Operational Expected date of completion: 8/2030
Primary goal of system: Containment & Restoration Approximate downtime per year: 4 weeks
Presence of NAPLs Observed Number of monitoring wells used: 30
Approximate annual O&M costs: $2,400,000 Frequency of sampling: 4 times per year
Costs related to monitoring: $250,000 Is plume migration controlled? Don't know
Approximate pumping rate: 700 gpm Progress of aquifer restoration: 20% to 80% restored
Not evaluated minor/minor
Contaminants of Concern: Treatment Processes:
14 1,2-Dichloroethane Metals precipitation
16 1,2-Dichloroethylene (DCE) Air stripping
280 Organophosphorus pesticides (4,4'-DDT, lindane) Biological treatment yes
369 Vapona UV oxidation
vinyl chloride Carbon adsorption yes
Filtration
Ion Exchange
2 Reverse Osmosis
108 Off-gas treatment
120 other/not sure yes
354
Comments:
This form was completed by Douglas Sutton based on a phone interview with John Fagiolo.
The subcontractor for this site is Carl Jager at Fishbeck Topmpson (231-766-9227).
With regard to the gpm, the actual gpm is 700, while the peak is 1200.
Another extraction well will be installed shortly.
Contact Information
System Information and Data
77 West Jackson Blvd. Michigan Dept. of Env.Quality
Date original ROD was signed:
Date of last modification to ROD:
Chicago, IL 60604-3507312-886-0800 (phone)
Ott/Story/Cordova Chem Co.Dalton Township, MI (Region 5)
CERCLIS ID MID060174240
USACE-Detroit District
RPMJohn Fagiolo
Type of Fund-lead Site:
Result of previous evaluation of peformance/effectiveness:
Difficulty (due to social/political factors) of implementing minor/major changes:
Type of ROD:
Status of P&T system:

82
State Regulator Contractor Mike Johnson
312-856-8796 (phone)
Number of extraction wells: 6
9/21/92 Date of construction completion: 11/2000
Date of operational and functional:
Final Expected date of turnover to state:
Installed Expected date of completion:
Primary goal of system: Restoration Approximate downtime per year:
Presence of NAPLs Don't know Number of monitoring wells used: 6
Approximate annual O&M costs: $400,000 Frequency of sampling: 4 times per year
Costs related to monitoring: Is plume migration controlled?
Approximate pumping rate: 165 gpm Progress of aquifer restoration:
Evaluated and found sufficient minor/minor
Contaminants of Concern: Treatment Processes:
92 Cadmium Metals precipitation yes
357 Trichloroethylene (TCE) Air stripping yes
Biological treatment
UV oxidation
Carbon adsorption
Filtration
Ion Exchange
2 Reverse Osmosis
108 Off-gas treatment yes
120 other/not sure
354
Comments:
This form was completed by Douglas Sutton based on information collected during the demonstration project in 4/2000 and
www.epa.gov/R5Super/npl/michigan/MID006031348.htm
The RPM was not successfully contacted.
Contact Information
System Information and Data
77 West Jackson Boulevard
Date original ROD was signed:
Date of last modification to ROD:
Chicago, IL 60604-3507312-886-4592 (phone)
Peerless PlatingMuskegon Township, MI (Region 5)
CERCLIS ID MID006031348
Tetra Tech
RPMMike Ribordy
Type of Fund-lead Site:
Result of previous evaluation of peformance/effectiveness:
Difficulty (due to social/political factors) of implementing minor/major changes:
Type of ROD:
Status of P&T system:

83
State Regulator ContractorJudy Gapp Jack Brunner
P.O. Box 30426Lansing, MI 48909517-335-3391 (phone) 312-856-8788 (phone)517-335-4887 (fax)[email protected]
State-lead w/ Fund $ Number of extraction wells: 6
9/7/88 Date of construction completion: 9/1993
Date of operational and functional: 9/1993
Final Expected date of turnover to state: 9/2003
Operational Expected date of completion: 9/2003
Primary goal of system: Restoration Approximate downtime per year: 1 week
Presence of NAPLs Not present Number of monitoring wells used: 30
Approximate annual O&M costs: $300,000 Frequency of sampling: 4 times per year
Costs related to monitoring: Is plume migration controlled? No
Approximate pumping rate: 170 gpm Progress of aquifer restoration: 20% to 80% restored
Evaluated and found sufficient minor/minor
Contaminants of Concern: Treatment Processes:
2 1,1,1-Trichloroethane Metals precipitation
5 1,1-Dichloroethane Air stripping yes
14 1,2-Dichloroethane Biological treatment
diethylether UV oxidation
Carbon adsorption
Filtration
Ion Exchange
2 Reverse Osmosis
108 Off-gas treatment
120 other/not sure
354
Comments:
This form was completed by Douglas Sutton based on information collected during the demonstration project in 4/2000 and on phone interviews with Ken Glatz and Judy Gapp.
Contact Information
System Information and Data
77 West Jackson Boulevard MDEQ
Date original ROD was signed:
Date of last modification to ROD:
Chicago, IL 60604-3507312-886-1434 (phone)
U.S. AviexHoward Township, MI (Region 5)
CERCLIS ID MID980794556
Tetra Tech
RPMKen Glatz
Type of Fund-lead Site:
Result of previous evaluation of peformance/effectiveness:
Difficulty (due to social/political factors) of implementing minor/major changes:
Type of ROD:
Status of P&T system:

84
State Regulator ContractorBeth O'Brien
P.O. Box 30426Lansing, MI 48909517-335-3908 (phone)
EPA-lead Number of extraction wells: 6
8/12/85 Date of construction completion: 6/1996
Date of operational and functional: 6/1996
Final Expected date of turnover to state: 6/2006
Operational Expected date of completion: Indefinite
Primary goal of system: Containment & Restoration Approximate downtime per year: 2 weeks
Presence of NAPLs Not present Number of monitoring wells used: 10
Approximate annual O&M costs: $225,000 Frequency of sampling: 1 times per year
Costs related to monitoring: Is plume migration controlled? Yes
Approximate pumping rate: 250 gpm Progress of aquifer restoration: more than 80% restored
Not evaluated minor/moderate
Contaminants of Concern: Treatment Processes:
17 1,2-Dichloropropane Metals precipitation
344 Tin Air stripping yes
352 Trans 1,2-Dichloroethylene Biological treatment
371 Volatile chlorinated organics UV oxidation
Carbon adsorption
Filtration
Ion Exchange
2 Reverse Osmosis
108 Off-gas treatment yes
120 other/not sure
354
Comments:
This form was completed by Douglas Sutton based on information collected during the demonstration project in 4/2000 and on phone interviews with Richard Boice and Beth O'Brien.
At times, NAPL is pulled in from offsite.
Contact Information
System Information and Data
77 West Jackson Boulevard MDEQ
Date original ROD was signed:
Date of last modification to ROD:
Chicago, IL 60604-3507312-886-4740 (phone)
Verona Well FieldBattle Creek, MI (Region 5)CERCLIS ID MID980793806
RPMRichard Boice
Type of Fund-lead Site:
Result of previous evaluation of peformance/effectiveness:
Difficulty (due to social/political factors) of implementing minor/major changes:
Type of ROD:
Status of P&T system:

85
State Regulator ContractorSally Beebe
P.O. Box 30426Lansing, MI 48909517-373-4110 (phone) 517-337-0111 (phone)517-335-4887 (fax)[email protected]
State-lead w/ Fund $ Number of extraction wells: 5
3/31/93 Date of construction completion: 4/2001
7/31/96 Date of operational and functional: 4/2001
Final Expected date of turnover to state: 4/2011
Operational Expected date of completion: 4/2021
Primary goal of system: Restoration Approximate downtime per year: 0 weeks
Presence of NAPLs Don't know Number of monitoring wells used: 23
Approximate annual O&M costs: $75,000 Frequency of sampling: 2 times per year
Costs related to monitoring: $15,000 Is plume migration controlled? Don't know
Approximate pumping rate: 250 gpm Progress of aquifer restoration: less than 20% restored
Not evaluated minor/moderate
Contaminants of Concern: Treatment Processes:
354 Trichlorethylene (TCE)/Tetrachloroelthylene (PCE) Metals precipitation
Air stripping yes
Biological treatment
UV oxidation
Carbon adsorption
Filtration
Ion Exchange
2 Reverse Osmosis
108 Off-gas treatment yes
120 other/not sure
354
Comments:
This form was completed by Douglas Sutton based on information collected during the demonstration project and a phone interview with Russell Hart.
There are 8 monitoring wells sampled quarterly and 14 monitoring wells sampled annually for a total of 46 samples per year. The 23 wells and semi-annual sampling were input to suggest 46 samples per year.
Contact Information
System Information and Data
77 West Jackson Boulevard MDEQ-ERD
Date original ROD was signed:
Date of last modification to ROD:
Chicago, IL 60604-3507312-886-4844 (phone)
Wash King LaundryPleasant Plains Township, MI (Region 5)
CERCLIS ID MID980701247
Malcolm Pirnie
RPMRussell Hart
Type of Fund-lead Site:
Result of previous evaluation of peformance/effectiveness:
Difficulty (due to social/political factors) of implementing minor/major changes:
Type of ROD:
Status of P&T system:

REGION 6 INFORMATION SHEETS

93
State Regulator ContractorJanaye Danage Bill Faught
P.O. Box 82178 7600 W. Tidwell, Suite 400Baton Rouge, LA 70884-2178 Houston, TX 77040-5719225-765-0475 (phone) 713-462-0161 (phone)225-765-0484 (fax) 713-462-0165 (fax)[email protected] [email protected]
EPA-lead Number of extraction wells: 18
4/28/93 Date of construction completion: 2/1997
Date of operational and functional: 2/1997
Final Expected date of turnover to state: 2/2027
Operational Expected date of completion: 2/2027
Primary goal of system: Containment Approximate downtime per year: 1 week
Presence of NAPLs Observed Number of monitoring wells used: 18
Approximate annual O&M costs: $360,000 Frequency of sampling: 4 times per year
Costs related to monitoring: $360,000 Is plume migration controlled? Yes
Approximate pumping rate: 5 gpm Progress of aquifer restoration: Not a goal
Evaluated and found sufficient minor/severe
Contaminants of Concern: Treatment Processes:
112 Chlorinated polyaromatic hydrocarbons (CPAHs) Metals precipitation
127 Creosote and petroleum hydrocarbons Air stripping
Biological treatment yes
UV oxidation
Carbon adsorption yes
Filtration yes
Ion Exchange
2 Reverse Osmosis
108 Off-gas treatment
120 other/not sure
Comments:
The ROD states that the in-situ bioremediation and groundwater p&T as a long-term remedial action for this site. According to the ROD and the State Superfund Contract(SSC), the EPA will finance 90% of the in-situ bioremediation system and the GW pump and treat system until the ROD performance criteria are met. The SSC states that, "there are no technically-separable construction/operational functions associated specifically with groundwater pump and treat since this will occur incidentally with in-situ soil treatment. Therefore, the time limitation (10 years) stated in 40 CFR Section 300.435(f)(3) concerning the treatment of groundwater is not applicable." This is the reason why I did not put a date in which the pump and treatment system was deemed functional and operational, because this is not applicable for this site. What the ROD is saying in plain English is that the in-situ bioremediation treatment is the primary treatment. Until we reach the goals of the in-situ bioremediation, it will be impossible to determine whether groundwater goals are being met. The success of the groundwater P& T is actually predicated on the successful completion of the in-situ bioremediation treatment.
Also, note that the State (LDEQ) does not assume O& M, according to the ROD, until in-situ bioremediation is completed, which is 20 years from construction. After that time, the groundwater p&T system will operate for 5-10 years to determine whether we are meeting the GW ROD goals. If ROD GW goals are met, then LDEQ will assume O&M. Therefore, it will be approximately 30 years before LDEQ assumes 100% responsibility for the P&T system.
A five-year review was completed in August 2000. We are currently in the process of taking additional sampling parameters and making adjustments to the plant to determine if we can speed up the success of the in-situ bioremediation process and GW p&T system.
If you need more information, call me at (214)665-6729. Stacey Bennett, RPM Region 6
Contact Information
System Information and Data
1445 Ross Avenue Louisiana Dept.of Env.Quality
Date original ROD was signed:
Date of last modification to ROD:
Dallas, TX 75202-2733214-665-6729 (phone)214-665-6660 (fax)
American Creosote WorksWinnfield, LA (Region 6)
CERCLIS ID LAD000239814
CH2MHill
RPMStacey Bennett
Type of Fund-lead Site:
Result of previous evaluation of peformance/effectiveness:
Difficulty (due to social/political factors) of implementing minor/major changes:
Type of ROD:
Status of P&T system:

92
State Regulator ContractorRich Johnson Lee Guillory
P.O. Box 82282 P.O. Box 60267Baton Rouge, LA 70884-2282 New Orleans, LA 70160-0267225-765-0487 (phone) 504-862-2934 (phone)225-765-0435 (fax) 504-862-2896 (fax)[email protected] [email protected]
EPA-lead Number of extraction wells: 44
3/31/87 Date of construction completion: 7/2000
7/20/95 Date of operational and functional: 3/2001
Final Expected date of turnover to state: 7/2003
Operational Expected date of completion: 7/2021
Primary goal of system: Containment & Restoration Approximate downtime per year: 0 weeks
Presence of NAPLs Observed Number of monitoring wells used: 11
Approximate annual O&M costs: $402,000 Frequency of sampling: 12 times per year
Costs related to monitoring: Is plume migration controlled? Don't know
Approximate pumping rate: 22.5 gpm Progress of aquifer restoration: Don't know
Evaluated and found sufficient minor/moderate
Contaminants of Concern: Treatment Processes:
72 Benzo(a)anthracene Metals precipitation
73 Benzo(a)pyrene Air stripping
74 Benzo(b)fluoranthene Biological treatment
76 Benzo(k)fluoranthene UV oxidation
210 Indeno(1,2,3-cd)pyrene Carbon adsorption yes
119 Chrysene Filtration yes
Ion Exchange
2 Reverse Osmosis
108 Off-gas treatment
120 other/not sure yes
354
Contact Information
System Information and Data
1445 Ross Avenue Louisiana Dept.of Env.Quality
Date original ROD was signed:
Date of last modification to ROD:
Dallas, TX 75202214-665-8143 (phone)214-665-6660 (fax)
Bayou BonfoucaSlidell, LA (Region 6)
CERCLIS ID LAD980745632
USACE-New Orleans District
RPMKatrina Coltrain
Type of Fund-lead Site:
Result of previous evaluation of peformance/effectiveness:
Difficulty (due to social/political factors) of implementing minor/major changes:
Type of ROD:
Status of P&T system:

Comments to Bayou Bonfouca:
Note to questions:
#9--An ESD was signed on February 5, 1990 which made adjustments to the ROD. The ROD amendment only stated that the incinerator at Bonfouca would be used to treat soils from Southern Ship Superfund site.
#13 and 14-- The cost is estimated between 360K to 444K per year and is all attributable to LTRA.
#15--There are three arrays on site with 44 individual wells. Individually the wells pump at 1/4gpm. Each array is estimated at 5-10gpm. The pumping rate is dependent on the drawdown and is adjusted to maintain a -4fmsl.
#17--Array 2 was completed in 1991 and brought on line that same year. Based on the ESD and subsequent reports, new wells were constructed and completed in 2000.
#18--The EPA, along with LDEQ, will meet to determine O&F March 2001.
#20--The aquifer is not currently used and will unlikly be used in the future as a drinking water source due to insufficient yield. The ESD states that a risk based 10-4 to 10-6 level will be used or whatever is technologically feasible. The main objective of the system is to contain migration and prevent recontamination of the bayou.
#21--There is not planned down time for the system. The system is set up with bypass measures when maintenance is needed. The system is only shut down when there is a threat of freezing.
#22--Treatment involves an oil/water separator, sand filter, oleophilic filter, granular activated carbon, and post aeration.
#24--The monitoring wells are monitored daily to ensure that the -4fmsl drawdown is maintained. These wells are surveyed once a month to monitor subsidence. The system is sampled quarterly for pH, Ar, Zn, total Chromium, Purgeable organics, and acid extractable organics and is sampled monthly for base/neutral extractable organics and other water quality parameters (see the O&M plan).
#27 and #28--reports on the effectiveness of the system was done and resulted in the upgrades to the system and the installation of additional wells which was completed in 2000.

96
State Regulator ContractorDavid Henry Brian D. Jordan
PO Box 26110 1190 St. Francis Drive 4101 Jefferson Plaza NESanta Fe, NM 87505 Albuquerque, NM 87109214-827-0037 (phone) 505-342-3472 (phone)214-827-2965 (fax) 505-342-3208 (fax)[email protected] [email protected]
EPA-lead Number of extraction wells: 3
9/21/90 Date of construction completion: 4/1991
Date of operational and functional: 12/1991
Final Expected date of turnover to state: 10/2004
Operational Expected date of completion: Indefinite
Primary goal of system: Containment & Restoration Approximate downtime per year: 4 weeks
Presence of NAPLs Not present Number of monitoring wells used: 3
Approximate annual O&M costs: $1,000,000 Frequency of sampling: 4 times per year
Costs related to monitoring: $60,000 Is plume migration controlled? Don't know
Approximate pumping rate: 1 gpm Progress of aquifer restoration: Don't know
Evaluated and found not sufficient moderate/severe
Contaminants of Concern: Treatment Processes:
264 Nitrate Metals precipitation
Air stripping
Biological treatment
UV oxidation
Carbon adsorption
Filtration
Ion Exchange
2 Reverse Osmosis
108 Off-gas treatment
120 other/not sure yes
354
Comments:
RPMPetra Sanchez
Type of Fund-lead Site:
Result of previous evaluation of peformance/effectiveness:
Difficulty (due to social/political factors) of implementing minor/major changes:
Type of ROD:
Status of P&T system:
Cimarron MiningCarizozo, NM (Region 6)
CERCLIS ID NMD980749378
USACE
Contact Information
System Information and Data
1445 Ross Ave. Suite 1200 6SF-LT New Mexico Env. Department
Date original ROD was signed:
Date of last modification to ROD:
Dallas, TX 75202-2733214-665-6686 (phone)214-665-6660 (fax)

94
State Regulator ContractorJames Sher Sanjay Ramabhadran
P.O.Box 13087 1500 CitywestAustin, TX 78711-3087 Houston, TX 77042512-239-2444 (phone) 713-266-6900 (phone)512-239-2450 (fax) 713-266-8971 (fax)[email protected] [email protected]
State-lead w/ Fund $ Number of extraction wells: 13
9/18/86 Date of construction completion: 4/1993
Date of operational and functional: 7/1993
Final Expected date of turnover to state: 1/2004
Operational Expected date of completion: 1/2004
Primary goal of system: Containment & Restoration Approximate downtime per year: 52 weeks
Presence of NAPLs Not present Number of monitoring wells used: 13
Approximate annual O&M costs: $240,000 Frequency of sampling: 2 times per year
Costs related to monitoring: $240,000 Is plume migration controlled? Yes
Approximate pumping rate: 5 gpm Progress of aquifer restoration: Don't know
Evaluated and found sufficient minor/moderate
Contaminants of Concern: Treatment Processes:
354 Trichlorethylene (TCE)/Tetrachloroelthylene (PCE) Metals precipitation
PCB, Benzene, Toluene, Chlorobenzene Air stripping
Biological treatment
UV oxidation
Carbon adsorption yes
Filtration
Ion Exchange
2 Reverse Osmosis
108 Off-gas treatment
120 other/not sure yes
354
Comments:
RPMRuben Moya
Type of Fund-lead Site:
Result of previous evaluation of peformance/effectiveness:
Difficulty (due to social/political factors) of implementing minor/major changes:
Type of ROD:
Status of P&T system:
Geneva IndustriesHouston, TX (Region 6)
CERCLIS ID TXD980748453
Lockwood, Andrews & Newman Inc.
***NOTE*** The Geneva Superfund Site has remained "shutdown" due to contractual problems between contractor and sub-contractor. The amount of time site has been shutdown is now approximately 1 year.
Contact Information
System Information and Data
1445 Ross Ave., Suite 1200 TNRCC
Date original ROD was signed:
Date of last modification to ROD:
Dallas, TX 75202214-665-2755 (phone)214-665-6660 (fax)

95
State Regulator ContractorDiane Poteet Peter van Noort
P.O. Box 13087 5339 Alpha Road, Suite 300Austin, TX 78711 Dallas, TX 75240512-239-2502 (phone) 972-980-2170 (phone)512-239-2450 (fax) 972-385-0846 (fax)[email protected] [email protected]
EPA-lead Number of extraction wells: 1
9/29/99 Date of construction completion: 8/2001
Date of operational and functional: 8/2003
Interim Expected date of turnover to state: 8/2013
Design Expected date of completion: 8/2023
Primary goal of system: Containment Approximate downtime per year:
Presence of NAPLs Not present Number of monitoring wells used: 10
Approximate annual O&M costs: $37,000 Frequency of sampling: 2 times per year
Costs related to monitoring: Is plume migration controlled?
Approximate pumping rate: 150 gpm Progress of aquifer restoration:
Not evaluated minor/minor
Contaminants of Concern: Treatment Processes:
97 Carbon tetrachloride Metals precipitation
115 Chloroform Air stripping yes
Biological treatment
UV oxidation
Carbon adsorption
Filtration
Ion Exchange
2 Reverse Osmosis
108 Off-gas treatment
120 other/not sure
354
Comments:
RPMVincent Malott
Type of Fund-lead Site:
Result of previous evaluation of peformance/effectiveness:
Difficulty (due to social/political factors) of implementing minor/major changes:
Type of ROD:
Status of P&T system:
City of Perryton Well #2Perryton, TX (Region 6)
CERCLIS ID TX0001399435
CH2M Hill
The interim remedy for this site consists of operating a municipal well (currently inactive) together with an air stripper to begin mass removal with limited hydraulic control of the contaminant plume. The treated water will be supplied to the city water supply system. The final remedy for this site has yet to be selected pending completion of the RI/FS reports and a final site-wide ROD scheduled for FY2001. A ground water monitoring schedule will also be selected pending the final site-wide remedy. There are no indications of a DNAPL based on the site data. The O&F date was set at 2 years past the construction date in case additional remedial measures are selected in the final ROD.
Contact Information
System Information and Data
1445 Ross Avenue TNRCC
Date original ROD was signed:
Date of last modification to ROD:
Dallas, TX 75202214-665-8313 (phone)214-665-6660 (fax)

99
State Regulator ContractorClark McWilliams Russell Perry
P.O. Box 8913 13111 NW Highway, Suite 310Little Rock, AR 72219 Houston, TX 77040-6392501-682-0850 (phone) 713-996-4400 (phone)501-682-0565 (fax) 713-939-9546 (fax)[email protected] [email protected]
State-lead w/ Fund $ Number of extraction wells: 8
3/24/88 Date of construction completion: 11/1993
Date of operational and functional: 1/1994
Final Expected date of turnover to state: 1/2004
Operational Expected date of completion: 1/2034
Primary goal of system: Restoration Approximate downtime per year: 1 week
Presence of NAPLs Suspected Number of monitoring wells used: 20
Approximate annual O&M costs: $180,000 Frequency of sampling: 2 times per year
Costs related to monitoring: $60,000 Is plume migration controlled? Yes
Approximate pumping rate: 3 gpm Progress of aquifer restoration: less than 20% restored
Evaluated and found sufficient minor/minor
Contaminants of Concern: Treatment Processes:
58 Anthracene Metals precipitation
175 Fluoranthene Air stripping
260 Naphthalene Biological treatment
290 Pentachlorophenol (PCP) UV oxidation
Carbon adsorption yes
Filtration yes
Ion Exchange
2 Reverse Osmosis
108 Off-gas treatment
120 other/not sure yes
354
Comments:
Contact Information
System Information and Data
1445 Ross Avenue Arkansas Dept.of Env.Quality
Date original ROD was signed:
Date of last modification to ROD:
Dallas, TX 75202214-665-8507 (phone)214-665-6660 (fax)
Midland ProductsOla, AR (Region 6)
CERCLIS ID ARD98074566
IT Corp.
RPMCarlos Sanchez
Type of Fund-lead Site:
Result of previous evaluation of peformance/effectiveness:
Difficulty (due to social/political factors) of implementing minor/major changes:
Type of ROD:
Status of P&T system:
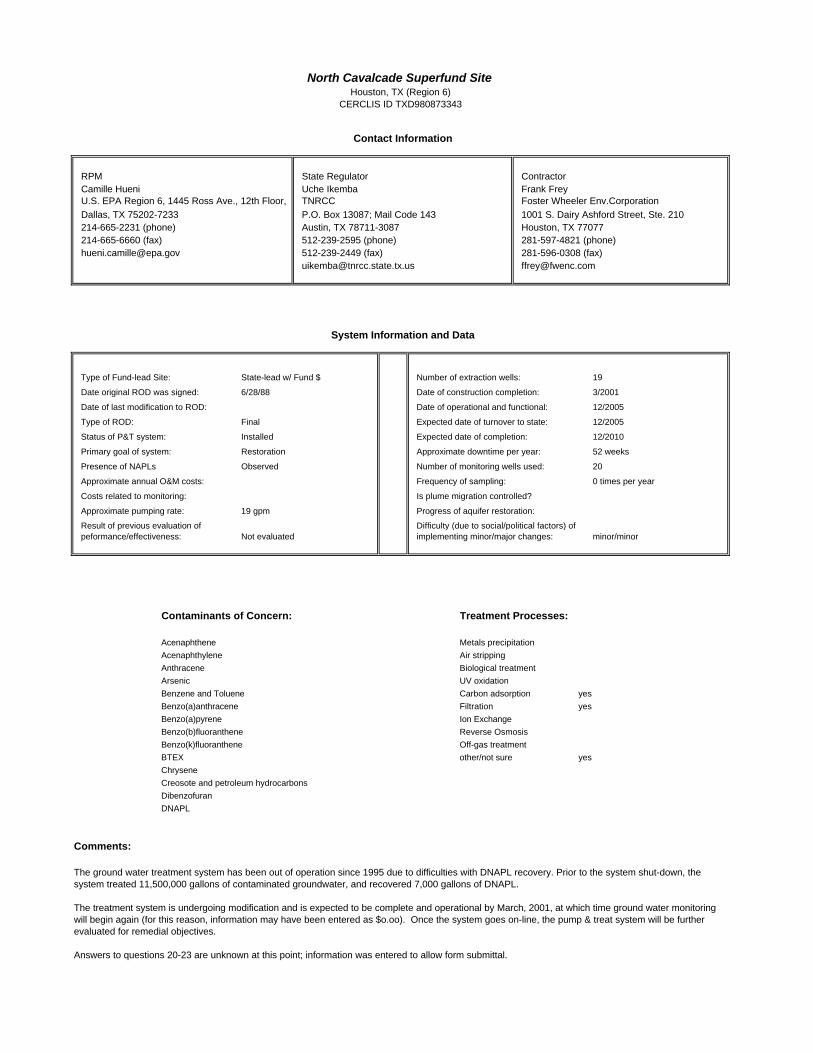
98
State Regulator ContractorUche Ikemba Frank Frey
P.O. Box 13087; Mail Code 143 1001 S. Dairy Ashford Street, Ste. 210Austin, TX 78711-3087 Houston, TX 77077512-239-2595 (phone) 281-597-4821 (phone)512-239-2449 (fax) 281-596-0308 (fax)[email protected] [email protected]
State-lead w/ Fund $ Number of extraction wells: 19
6/28/88 Date of construction completion: 3/2001
Date of operational and functional: 12/2005
Final Expected date of turnover to state: 12/2005
Installed Expected date of completion: 12/2010
Primary goal of system: Restoration Approximate downtime per year: 52 weeks
Presence of NAPLs Observed Number of monitoring wells used: 20
Approximate annual O&M costs: Frequency of sampling: 0 times per year
Costs related to monitoring: Is plume migration controlled?
Approximate pumping rate: 19 gpm Progress of aquifer restoration:
Not evaluated minor/minor
Contaminants of Concern: Treatment Processes:
39 Acenaphthene Metals precipitation
40 Acenaphthylene Air stripping
58 Anthracene Biological treatment
62 Arsenic UV oxidation
71 Benzene and Toluene Carbon adsorption yes
72 Benzo(a)anthracene Filtration yes
73 Benzo(a)pyrene Ion Exchange
2 74 Benzo(b)fluoranthene Reverse Osmosis
108 76 Benzo(k)fluoranthene Off-gas treatment
120 66 BTEX other/not sure yes
354 119 Chrysene
127 Creosote and petroleum hydrocarbons
144 Dibenzofuran
137 DNAPL
170
Comments:
The ground water treatment system has been out of operation since 1995 due to difficulties with DNAPL recovery. Prior to the system shut-down, the system treated 11,500,000 gallons of contaminated groundwater, and recovered 7,000 gallons of DNAPL.
The treatment system is undergoing modification and is expected to be complete and operational by March, 2001, at which time ground water monitoring will begin again (for this reason, information may have been entered as $o.oo). Once the system goes on-line, the pump & treat system will be further evaluated for remedial objectives.
Answers to questions 20-23 are unknown at this point; information was entered to allow form submittal.
Contact Information
System Information and Data
U.S. EPA Region 6, 1445 Ross Ave., 12th Floor, MC: 6SF-AP
TNRCC
Date original ROD was signed:
Date of last modification to ROD:
Dallas, TX 75202-7233214-665-2231 (phone)214-665-6660 (fax)
North Cavalcade Superfund SiteHouston, TX (Region 6)
CERCLIS ID TXD980873343
Foster Wheeler Env.Corporation
RPMCamille Hueni
Type of Fund-lead Site:
Result of previous evaluation of peformance/effectiveness:
Difficulty (due to social/political factors) of implementing minor/major changes:
Type of ROD:
Status of P&T system:

100
State Regulator ContractorUche Ikemba William Brown
12100 Park Circle Bldg. D , P.O. Box 13087 575 Oak Ridge Turnpike,Suite B-4Austin, TX 78711 Oak Ridge, TN 37830512-239-2595 (phone) 865-483-0554 (phone)512-239-2449 (fax) 865-483-8838 (fax)[email protected] [email protected]
State-lead w/ Fund $ Number of extraction wells: 6
3/18/88 Date of construction completion: 11/1993
11/23/99 Date of operational and functional: 12/2001
Final Expected date of turnover to state: 12/2001
Operational Expected date of completion: 12/2001
Primary goal of system: Restoration Approximate downtime per year: 15 weeks
Presence of NAPLs Not present Number of monitoring wells used: 7
Approximate annual O&M costs: $500,000 Frequency of sampling: 2 times per year
Costs related to monitoring: $8,000 Is plume migration controlled? Yes
Approximate pumping rate: 60 gpm Progress of aquifer restoration: more than 80% restored
Evaluated and found sufficient minor/minor
Contaminants of Concern: Treatment Processes:
118 Chromium Metals precipitation
Air stripping
Biological treatment
UV oxidation
Carbon adsorption
Filtration
Ion Exchange
2 Reverse Osmosis
108 Off-gas treatment
120 other/not sure yes
354
Comments:
In-Situ Ferrous Sulfate treatment added by an ESD to the ROD had enhanced remedial efforts
Contact Information
System Information and Data
1445 Ross Avenue Texas Natural Resource Commission
Date original ROD was signed:
Date of last modification to ROD:
Dallas, TX 75202214-665-8521 (phone)214-665-6660 (fax)
Odessa Chromium #1Odessa, TX (Region 6)
CERCLIS ID TXD980867279
Pacific Western Technologies, Ltd.
RPMErnest Franke
Type of Fund-lead Site:
Result of previous evaluation of peformance/effectiveness:
Difficulty (due to social/political factors) of implementing minor/major changes:
Type of ROD:
Status of P&T system:
franke,[email protected]

97
State Regulator ContractorDiane Poteet Cristina Radu
P.O. Box 13087 6121 Indian School Road NE, Suite 205Austin, TX 78711 Albuquerque, TX 87110512-239-2502 (phone) 505-881-3188 (phone)512-239-2450 (fax) 505-881-3283 (fax)[email protected] [email protected]
EPA-lead Number of extraction wells: 22
9/29/00 Date of construction completion: 9/2002
Date of operational and functional: 9/2003
Final Expected date of turnover to state: 9/2013
Design Expected date of completion: 9/2028
Primary goal of system: Restoration Approximate downtime per year:
Presence of NAPLs Not present Number of monitoring wells used: 50
Approximate annual O&M costs: $1,200,000 Frequency of sampling: 4 times per year
Costs related to monitoring: $80,000 Is plume migration controlled?
Approximate pumping rate: 200 gpm Progress of aquifer restoration:
Not evaluated minor/minor
Contaminants of Concern: Treatment Processes:
118 Chromium Metals precipitation
Air stripping
Biological treatment
UV oxidation
Carbon adsorption
Filtration
Ion Exchange yes
2 Reverse Osmosis
108 Off-gas treatment
120 other/not sure
354
Comments:
RPMVincent Malott
Type of Fund-lead Site:
Result of previous evaluation of peformance/effectiveness:
Difficulty (due to social/political factors) of implementing minor/major changes:
Type of ROD:
Status of P&T system:
Sprague Road Ground Water PlumeOdessa, TX (Region 6)
CERCLIS ID TX0001407444
Tetra Tech EMI
This site consists of three separate chromium contaminant plumes originating from three different facilities. The plume size and chromium concentrations are different between all three plumes. Since the contaminant is a metal there is no DNAPL or LNAPL.
Contact Information
System Information and Data
1445 Ross Avenue TNRCC
Date original ROD was signed:
Date of last modification to ROD:
Dallas, TX 75202214-665-8313 (phone)214-665-6660 (fax)

REGION 7 INFORMATION SHEETS

106
State Regulator ContractorCynthia Randall Gary Felkner
Forbes Field, Bldg 20 8400 Ward ParkwayTopeka, KS 66620 Kansas City, MO 64114785-291-3245 (phone) 913-458-6583 (phone)785-296-4823 (fax) 913-458-9391 (fax)[email protected] [email protected]
EPA-lead Number of extraction wells: 12
5/5/99 Date of construction completion: 9/2002
Date of operational and functional: 9/2003
Final Expected date of turnover to state: 9/2013
Design Expected date of completion: 9/2015
Primary goal of system: Containment & Restoration Approximate downtime per year:
Presence of NAPLs Not present Number of monitoring wells used: 62
Approximate annual O&M costs: $500,000 Frequency of sampling: 2 times per year
Costs related to monitoring: $50,000 Is plume migration controlled?
Approximate pumping rate: 800 gpm Progress of aquifer restoration:
Not evaluated minor/minor
Contaminants of Concern: Treatment Processes:
118 Chromium Metals precipitation
Air stripping
Biological treatment
UV oxidation
Carbon adsorption
Filtration
Ion Exchange yes
2 Reverse Osmosis
108 Off-gas treatment
120 other/not sure
354
Comments:
Contact Information
System Information and Data
901 N. 5th St Kansas Dept of Health and Environment
Date original ROD was signed:
Date of last modification to ROD:
Kansas City, KS 66101913-551-7654 (phone)913-551-9654 (fax)
Ace ServicesColby, KS (Region 7)
CERCLIS ID KSD046746731
Black & Veatch Special Projects Corp
RPMBob Stewart
Type of Fund-lead Site:
Result of previous evaluation of peformance/effectiveness:
Difficulty (due to social/political factors) of implementing minor/major changes:
Type of ROD:
Status of P&T system:

107
State Regulator ContractorRalph Martin David Sanders
1200 N Street, Suite 400 The Atrium 6601 College BoulevardLincoln, NE 68509-8922 Overland Park, KS 66211402-471-3120 (phone) 913-458-6605 (phone)402-471-2909 (fax) 913-458-0000 (fax)[email protected] [email protected]
EPA-lead Number of extraction wells: 3
6/7/96 Date of construction completion: 9/1998
Date of operational and functional: 10/1999
Final Expected date of turnover to state: 12/2009
Operational Expected date of completion: 12/2019
Primary goal of system: Containment & Restoration Approximate downtime per year: 1 week
Presence of NAPLs Suspected Number of monitoring wells used: 8
Approximate annual O&M costs: $100,000 Frequency of sampling: 4 times per year
Costs related to monitoring: $25,000 Is plume migration controlled? Don't know
Approximate pumping rate: 90 gpm Progress of aquifer restoration: Don't know
Not evaluated minor/minor
Contaminants of Concern: Treatment Processes:
354 Trichlorethylene (TCE)/Tetrachloroelthylene (PCE) Metals precipitation
Air stripping yes
Biological treatment
UV oxidation
Carbon adsorption
Filtration
Ion Exchange
2 Reverse Osmosis
108 Off-gas treatment
120 other/not sure
354
Comments:
In order to evaluate the effectiveness of containment, the contractor has been tasked to perform pumping tests. These tests are currently planned to take place during the next quarterly sampling event which is scheduled for April 2001.
It is pertinent to note that significant progress is being made toward aquifer restoration. However, that progress has not been quantified to date.
Contact Information
System Information and Data
901 North 5th Street Nebraska Dept.of Env.Quality
Date original ROD was signed:
Date of last modification to ROD:
Kansas City, KS 66101913-551-7882 (phone)913-551-7063 (fax)
Cleburn Street Well Site/OU2Grand Island, NE (Region 7)CERCLIS ID NED981499312
Black and Veatch Special Projects Corp.
RPMMary Peterson
Type of Fund-lead Site:
Result of previous evaluation of peformance/effectiveness:
Difficulty (due to social/political factors) of implementing minor/major changes:
Type of ROD:
Status of P&T system:

108
State Regulator ContractorDave Mosby
P.O. Box 176Jefferson City, MO 65102-0176573-751-1288 (phone)573-751-7869 (fax)[email protected]
State-lead w/ Fund $ Number of extraction wells:
8/15/01 Date of construction completion: 1/2005
Date of operational and functional: 1/2006
Final Expected date of turnover to state: 1/2006
Predesign Expected date of completion: 1/2016
Primary goal of system: Containment & Restoration Approximate downtime per year:
Presence of NAPLs Suspected Number of monitoring wells used:
Approximate annual O&M costs: Frequency of sampling:
Costs related to monitoring: Is plume migration controlled?
Approximate pumping rate: Progress of aquifer restoration:
Not evaluated minor/minor
Contaminants of Concern: Treatment Processes:
2 1,1,1-Trichloroethane Metals precipitation
354 Trichlorethylene (TCE)/Tetrachloroelthylene (PCE) Air stripping yes
Biological treatment
UV oxidation
Carbon adsorption
Filtration
Ion Exchange
2 Reverse Osmosis
108 Off-gas treatment
120 other/not sure
354
Comments:
This project is only now completing the ROD in FY2001. Negotiations and consent decree lodging and entry will carry through 2002. Design is planned for 2003 and construction through mid 2005.
Part of the construction may be imlemented by the responsible parties, but we are planning for the main system to be fund-lead with MDNR using federal funds via a cooperative agreement.
Contact Information
System Information and Data
901 N. 5th St. MDNR - Superfund Unit
Date original ROD was signed:
Date of last modification to ROD:
Kansas City, KS 66101913-551-7778 (phone)913-551-7437 (fax)
Valley Park TCE Site - OU2Valley Park, MO (Region 7)CERCLIS ID MOD98096834
RPMSteve Auchterlonie
Type of Fund-lead Site:
Result of previous evaluation of peformance/effectiveness:
Difficulty (due to social/political factors) of implementing minor/major changes:
Type of ROD:
Status of P&T system:

REGION 9 INFORMATION SHEETS

114
State Regulator ContractorEmanuel Mensah Chris Lichens
916-255-3704 (phone) 415-981-2811 (phone)
EPA-lead Number of extraction wells: 1
9/26/97 Date of construction completion: 7/2000
Date of operational and functional: 5/2002
Interim Expected date of turnover to state: 5/2012
Installed Expected date of completion: 5/2022
Primary goal of system: Containment Approximate downtime per year:
Presence of NAPLs Don't know Number of monitoring wells used: 10
Approximate annual O&M costs: $300,000 Frequency of sampling: 4 times per year
Costs related to monitoring: $25,000 Is plume migration controlled? #N/A
Approximate pumping rate: 50 gpm Progress of aquifer restoration: #N/A
Not evaluated minor/minor
Contaminants of Concern: Treatment Processes:
0 perchloroethylene Metals precipitation
Air stripping yes
Biological treatment
UV oxidation
Carbon adsorption yes
Filtration
Ion Exchange
2 Reverse Osmosis
108 Off-gas treatment
120 other/not sure
354
Comments:
The answers to items 20-23 are estimates.
Contact Information
System Information and Data
75 Hawthorne Street State of California, DTSC
Date original ROD was signed:
Date of last modification to ROD:
San Francisco, CA 94105415-744-2212 (phone)
Modesto Superfund SiteModesto, CA (Region 9)
CERCLIS ID CAD981997752
Ecology and Environment
RPMDavid Seter
Type of Fund-lead Site:
Result of previous evaluation of peformance/effectiveness:
Difficulty (due to social/political factors) of implementing minor/major changes:
Type of ROD:
Status of P&T system:

115
State Regulator ContractorYasser Aref Dwayne Duetcher
5796 Corporate AvenueCypress, CA 90630714-484-5349 (phone)
EPA-lead Number of extraction wells: 5
3/24/95 Date of construction completion: 10/2003
Date of operational and functional: 10/2004
Interim Expected date of turnover to state: 10/2014
Installed Expected date of completion: 10/2024
Primary goal of system: Containment Approximate downtime per year:
Presence of NAPLs Don't know Number of monitoring wells used: 15
Approximate annual O&M costs: $1,100,000 Frequency of sampling: 4 times per year
Costs related to monitoring: $100,000 Is plume migration controlled?
Approximate pumping rate: 9000 gpm Progress of aquifer restoration:
Not evaluated minor/severe
Contaminants of Concern: Treatment Processes:
354 Trichlorethylene (TCE)/Tetrachloroelthylene (PCE) Metals precipitation
Air stripping
Biological treatment
UV oxidation
Carbon adsorption yes
Filtration
Ion Exchange
2 Reverse Osmosis
108 Off-gas treatment
120 other/not sure
354
Comments:
Doug Sutton filled out this questionnaire based on notes he took during a conversation with Kim Hoang.
James Bye from the San Bernadino Water Department is familiar with the site and should be noted along with the state regulator and contractor
Contact Information
System Information and Data
75 Hawthorne Street CalEPA Dept.of Toxic Substances Control
Date original ROD was signed:
Date of last modification to ROD:
San Francisco, CA 94105415-744-2370 (phone) (fax)
MuscoySan Bernadino, CA (Region 9)
CERCLIS ID CA1234
URS
RPMKim Hoang
Type of Fund-lead Site:
Result of previous evaluation of peformance/effectiveness:
Difficulty (due to social/political factors) of implementing minor/major changes:
Type of ROD:
Status of P&T system:

116
State Regulator ContractorYasser Aref Dwayne Duetcher
5796 Corporate Ave.Cypress, CA 90630714-484-5349 (phone)
EPA-lead Number of extraction wells: 8
8/4/93 Date of construction completion: 10/1998
Date of operational and functional: 10/1998
Interim Expected date of turnover to state: 10/2008
Operational Expected date of completion: 10/2028
Primary goal of system: Containment Approximate downtime per year:
Presence of NAPLs Don't know Number of monitoring wells used: 15
Approximate annual O&M costs: $900,000 Frequency of sampling: 2 times per year
Costs related to monitoring: $100,000 Is plume migration controlled? Yes
Approximate pumping rate: 12000 gpm Progress of aquifer restoration: Don't know
Not evaluated minor/moderate
Contaminants of Concern: Treatment Processes:
354 Trichlorethylene (TCE)/Tetrachloroelthylene (PCE) Metals precipitation
Air stripping
Biological treatment
UV oxidation
Carbon adsorption yes
Filtration
Ion Exchange
2 Reverse Osmosis
108 Off-gas treatment
120 other/not sure
354
Comments:
RPMKim Hoang
Type of Fund-lead Site:
Result of previous evaluation of peformance/effectiveness:
Difficulty (due to social/political factors) of implementing minor/major changes:
Type of ROD:
Status of P&T system:
NewmarkSan Bernadino, CA (Region 9)CERCLIS ID CAD981434517
URS
Doug Sutton completed this questionnaire based on notes taken during a conversation with Kim Hoang.
A settlement in the near future may change the lead on this porject.
Contact Information
System Information and Data
75 Hawthorne Street CalEPA Dept Toxic Substances Control
Date original ROD was signed:
Date of last modification to ROD:
San Francisco, CA 94105415-744-2370 (phone) (fax)

117
State Regulator ContractorChris Sherman John Kirschbaum
10151 Croyden Way, Suite 3 12565 West Center RoadSacramento, CA 95827 Omaha, NE 68144-3869916-255-3706 (phone) 402-293-2525 (phone)916-255-3697 (fax) 402-221-7838 (fax)
EPA-lead Number of extraction wells: 6
9/24/88 Date of construction completion: 9/1998
6/30/01 Date of operational and functional: 10/1998
Final Expected date of turnover to state: 10/2008
Operational Expected date of completion: 10/2008
Primary goal of system: Containment & Restoration Approximate downtime per year: 0 weeks
Presence of NAPLs Not present Number of monitoring wells used: 20
Approximate annual O&M costs: $300,000 Frequency of sampling: 4 times per year
Costs related to monitoring: $35,000 Is plume migration controlled? Yes
Approximate pumping rate: 150 gpm Progress of aquifer restoration: less than 20% restored
Evaluated and found sufficient minor/severe
Contaminants of Concern: Treatment Processes:
118 Chromium Metals precipitation
Air stripping
Biological treatment
UV oxidation
Carbon adsorption
Filtration yes
Ion Exchange
2 Reverse Osmosis
108 Off-gas treatment
120 other/not sure
354
Comments:
RPMMichelle Lau
Type of Fund-lead Site:
Result of previous evaluation of peformance/effectiveness:
Difficulty (due to social/political factors) of implementing minor/major changes:
Type of ROD:
Status of P&T system:
Selma Treating Co.Selma, CA (Region 9)
CERCLIS ID CAD29452141
USACE, Omaha District
Doug Sutton completed this questionnaire based on a phone interview with Michelle Lau, the RPM for the site.
Regarding items 27 and 29, a recent 5-year review found that the plume was controleed in the shallow aquifer but that additional monitoring is required to determine if it is controlled in the intermediate and deep aquifers.
The entry in item 22 is an estimate.
Contact Information
System Information and Data
75 Hawthorne Street DPES
Date original ROD was signed:
Date of last modification to ROD:
San Francisco, CA 94105415-744-2227 (phone)415-744-2180 (fax)

REGION 10 INFORMATION SHEETS

130
State Regulator ContractorDan Alexanian Jerry DeMuro
P.0. Box 47775 1500 Century Square, 1501 4th Ave, Suite 1500Olympia, WA 98504 Seattle, WA 98101360-407-6249 (phone) 206-674-1800 (phone)360-407-6305 (fax) 206-674-1801 (fax)[email protected] [email protected]
EPA-lead Number of extraction wells: 22
2/3/00 Date of construction completion: 10/2000
Date of operational and functional: 12/2001
Final Expected date of turnover to state: 12/2011
Operational Expected date of completion: 10/2030
Primary goal of system: Containment & Restoration Approximate downtime per year: 3 weeks
Presence of NAPLs Suspected Number of monitoring wells used: 80
Approximate annual O&M costs: $1,000,000 Frequency of sampling: 2 times per year
Costs related to monitoring: $204,000 Is plume migration controlled? Yes
Approximate pumping rate: 135 gpm Progress of aquifer restoration: Don't know
Evaluated and found sufficient moderate/severe
Contaminants of Concern: Treatment Processes:
2 1,1,1-Trichloroethane Metals precipitation
6 1,1-Dichloroethylene (DCE) Air stripping yes
14 1,2-Dichloroethane Biological treatment
354 Trichlorethylene (TCE)/Tetrachloroelthylene (PCE) UV oxidation
Hexavalent Chromium Carbon adsorption yes
Total Chromium Filtration
Ion Exchange yes
2 Reverse Osmosis
108 Off-gas treatment
120 other/not sure
354
Comments:
Question #20) the O&F is not yet complete, construction of a sewer line will take place this year. When that is complete extraction rates will increase up to 240 GPM. The date of O&F is not known at this time.
Question #21) The State will take over 10 years from the above date.
Question #26) Ground water long term monitoring takes place twice a year. The extraction wells are sampled quarterly and special ground water sampling may take place monthly, e.g. sampling at the toe of the plume.
Contact Information
System Information and Data
1200 Sixth Avenue - ECL-113 Dept.of Ecology - SWRO
Date original ROD was signed:
Date of last modification to ROD:
Seattle, WA 98101206-553-7216 (phone)206-553-0124 (fax)
Boomsnub/Airco / Site-Wide Ground Water OUHazel Dell, WA (Region 10)
CERCLIS ID WAD009624453
URS, Inc.
RPMDebra Yamamoto
Type of Fund-lead Site:
Result of previous evaluation of peformance/effectiveness:
Difficulty (due to social/political factors) of implementing minor/major changes:
Type of ROD:
Status of P&T system:
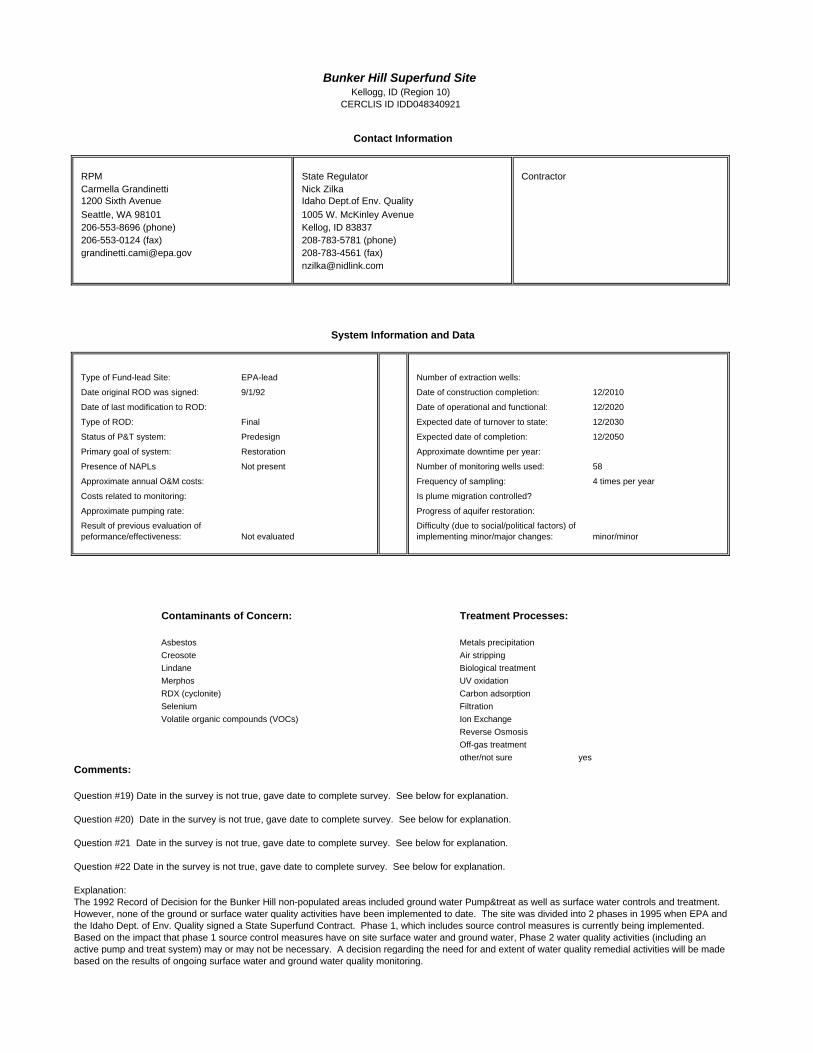
133
State Regulator ContractorNick Zilka
1005 W. McKinley AvenueKellog, ID 83837208-783-5781 (phone)208-783-4561 (fax)[email protected]
EPA-lead Number of extraction wells:
9/1/92 Date of construction completion: 12/2010
Date of operational and functional: 12/2020
Final Expected date of turnover to state: 12/2030
Predesign Expected date of completion: 12/2050
Primary goal of system: Restoration Approximate downtime per year:
Presence of NAPLs Not present Number of monitoring wells used: 58
Approximate annual O&M costs: Frequency of sampling: 4 times per year
Costs related to monitoring: Is plume migration controlled?
Approximate pumping rate: Progress of aquifer restoration:
Not evaluated minor/minor
Contaminants of Concern: Treatment Processes:
63 Asbestos Metals precipitation
126 Creosote Air stripping
230 Lindane Biological treatment
239 Merphos UV oxidation
310 RDX (cyclonite) Carbon adsorption
318 Selenium Filtration
372 Volatile organic compounds (VOCs) Ion Exchange
2 Reverse Osmosis
108 Off-gas treatment
120 other/not sure yes
Comments:
RPMCarmella Grandinetti
Type of Fund-lead Site:
Result of previous evaluation of peformance/effectiveness:
Difficulty (due to social/political factors) of implementing minor/major changes:
Type of ROD:
Status of P&T system:
Bunker Hill Superfund SiteKellogg, ID (Region 10)
CERCLIS ID IDD048340921
Question #19) Date in the survey is not true, gave date to complete survey. See below for explanation.
Question #20) Date in the survey is not true, gave date to complete survey. See below for explanation.
Question #21 Date in the survey is not true, gave date to complete survey. See below for explanation.
Question #22 Date in the survey is not true, gave date to complete survey. See below for explanation.
Explanation: The 1992 Record of Decision for the Bunker Hill non-populated areas included ground water Pump&treat as well as surface water controls and treatment. However, none of the ground or surface water quality activities have been implemented to date. The site was divided into 2 phases in 1995 when EPA and the Idaho Dept. of Env. Quality signed a State Superfund Contract. Phase 1, which includes source control measures is currently being implemented. Based on the impact that phase 1 source control measures have on site surface water and ground water, Phase 2 water quality activities (including an active pump and treat system) may or may not be necessary. A decision regarding the need for and extent of water quality remedial activities will be made in the future based on the results of ongoing surface water and ground water quality monitoring.
Contact Information
System Information and Data
1200 Sixth Avenue Idaho Dept.of Env. Quality
Date original ROD was signed:
Date of last modification to ROD:
Seattle, WA 98101206-553-8696 (phone)206-553-0124 (fax)
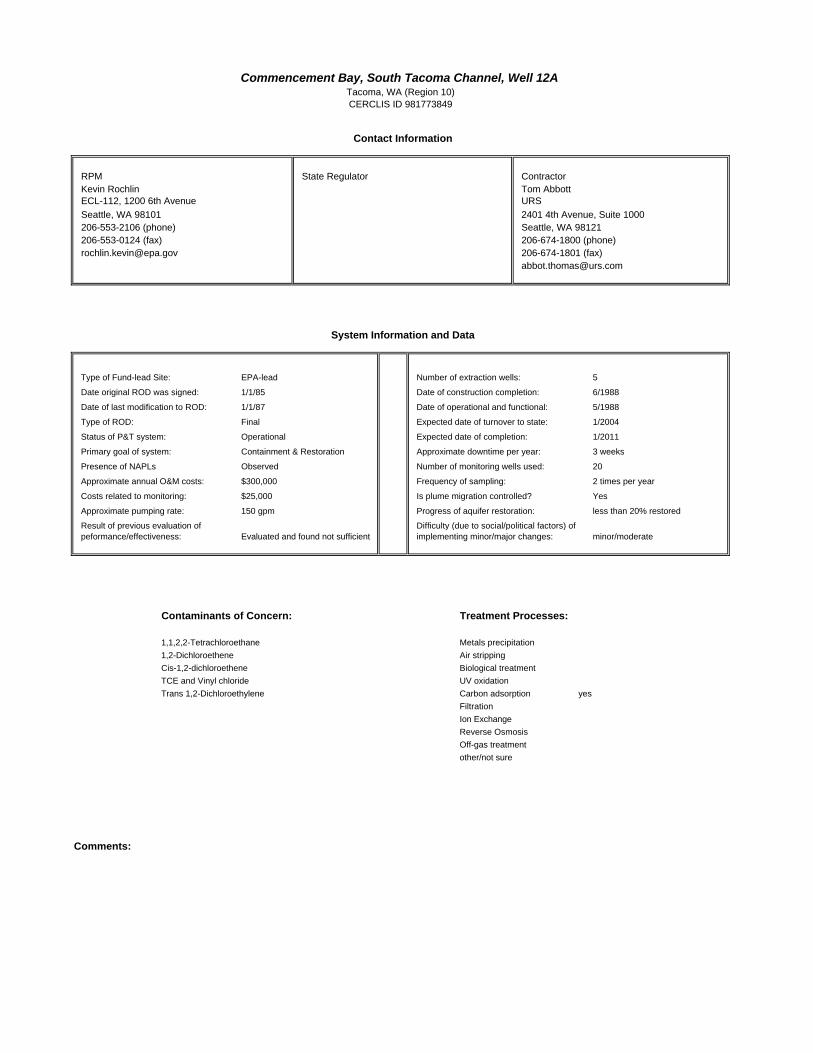
131
State Regulator ContractorTom Abbott
2401 4th Avenue, Suite 1000Seattle, WA 98121206-674-1800 (phone)206-674-1801 (fax)[email protected]
EPA-lead Number of extraction wells: 5
1/1/85 Date of construction completion: 6/1988
1/1/87 Date of operational and functional: 5/1988
Final Expected date of turnover to state: 1/2004
Operational Expected date of completion: 1/2011
Primary goal of system: Containment & Restoration Approximate downtime per year: 3 weeks
Presence of NAPLs Observed Number of monitoring wells used: 20
Approximate annual O&M costs: $300,000 Frequency of sampling: 2 times per year
Costs related to monitoring: $25,000 Is plume migration controlled? Yes
Approximate pumping rate: 150 gpm Progress of aquifer restoration: less than 20% restored
Evaluated and found not sufficient minor/moderate
Contaminants of Concern: Treatment Processes:
3 1,1,2,2-Tetrachloroethane Metals precipitation
15 1,2-Dichloroethene Air stripping
120 Cis-1,2-dichloroethene Biological treatment
332 TCE and Vinyl chloride UV oxidation
352 Trans 1,2-Dichloroethylene Carbon adsorption yes
Filtration
Ion Exchange
2 Reverse Osmosis
108 Off-gas treatment
120 other/not sure
354
Comments:
Contact Information
System Information and Data
ECL-112, 1200 6th Avenue
Date original ROD was signed:
Date of last modification to ROD:
Seattle, WA 98101206-553-2106 (phone)206-553-0124 (fax)
Commencement Bay, South Tacoma Channel, Well 12ATacoma, WA (Region 10)CERCLIS ID 981773849
URS
RPMKevin Rochlin
Type of Fund-lead Site:
Result of previous evaluation of peformance/effectiveness:
Difficulty (due to social/political factors) of implementing minor/major changes:
Type of ROD:
Status of P&T system:

132
State Regulator ContractorWilliam Dana John Montgomery
811 SW 6th Avenue 333 SW FifthPortland, OR 97204 Portland, OR 97204503-229-6530 (phone) 503-248-5600 (phone)503-229-5830 (fax) 503-248-5577 (fax)[email protected] [email protected]
State-lead w/ Fund $ Number of extraction wells: 6
3/1/96 Date of construction completion: 3/1996
3/1/98 Date of operational and functional: 3/1996
Final Expected date of turnover to state: 3/2006
Operational Expected date of completion: Indefinite
Primary goal of system: Containment Approximate downtime per year: 5 weeks
Presence of NAPLs Observed Number of monitoring wells used: 25
Approximate annual O&M costs: $250,000 Frequency of sampling: 2 times per year
Costs related to monitoring: $40,000 Is plume migration controlled? No
Approximate pumping rate: 3 gpm Progress of aquifer restoration: Not a goal
Evaluated and found sufficient minor/minor
Contaminants of Concern: Treatment Processes:
62 Arsenic Metals precipitation
112 Chlorinated polyaromatic hydrocarbons (CPAHs) Air stripping
128 Creosote/Pentachlorophenol (PCP) Biological treatment
290 Pentachlorophenol (PCP) UV oxidation
Carbon adsorption yes
Filtration yes
Ion Exchange yes
2 Reverse Osmosis
108 Off-gas treatment
120 other/not sure yes
354
Comments:
RPMAlan Goodman
Type of Fund-lead Site:
Result of previous evaluation of peformance/effectiveness:
Difficulty (due to social/political factors) of implementing minor/major changes:
Type of ROD:
Status of P&T system:
McCormick & Baxter Creosoting Co.Portland, OR (Region 10)
CERCLIS ID OR009020603
Ecology and Environment
The site RPM says that a barrier system is being design to prevent the PAHs and PCP from discharging to the river. The barrier design will be completed this year or next. The site treatment processes also include NAPL/water separation and dissolved air flotation (DAF).
Contact Information
System Information and Data
811 SW 6th Avenue, 3rd Floor Oregon Dept. Env. Quality
Date original ROD was signed:
Date of last modification to ROD:
Portland, OR 97204503-326-3685 (phone)503-326-3399 (fax)

129
State Regulator ContractorGuy Barrett Ken Scheffler
P.O. Box 47600 P.O. Box 91500Olympia, WA 98504-7600 Bellevue, WA 98009-2050360-407-7244 (phone) 425-453-5000 (phone)360-407-7154 (fax) 425-462-5957 (fax)[email protected] [email protected]
EPA-lead Number of extraction wells: 8
9/29/94 Date of construction completion: 2/1990
Date of operational and functional: 2/1990
Interim Expected date of turnover to state: 1/2024
Operational Expected date of completion: Indefinite
Primary goal of system: Containment Approximate downtime per year:
Presence of NAPLs Observed Number of monitoring wells used: 20
Approximate annual O&M costs: $500,000 Frequency of sampling: 1 times per year
Costs related to monitoring: $20,000 Is plume migration controlled? Yes
Approximate pumping rate: 80 gpm Progress of aquifer restoration: Not a goal
Evaluated and found not sufficient minor/moderate
Contaminants of Concern: Treatment Processes:
72 Benzo(a)anthracene Metals precipitation
73 Benzo(a)pyrene Air stripping
74 Benzo(b)fluoranthene Biological treatment yes
75 Benzo(g,h,i)perylene UV oxidation
290 Pentachlorophenol (PCP) Carbon adsorption yes
Polynuclear Aromatic Hydrocarbons Filtration yes
Ion Exchange
2 Reverse Osmosis
108 Off-gas treatment
120 other/not sure
354
Comments:
The P&T system was constructed by the PRPs as part of an administrative order. When EPA took over operations of the system in 1993, it was in a severe state of disrepair. In the 1994 interim ROD, EPA determined that the system is not effective at hydraulic containment of L- and DNAPL, and a new pump & treat system and barrier wall was deemed appropriate (i.e., containment remedy). This remedy was never implemented, however, in February 2000, EPA signed a final ROD selecting thermal remediation, or steam injection, as the remedy for soil and groundwater. Steam injection remediation will begin with an onsite pilot study. The current pump & treat system will be used to treat extracted contaminants during the operation of this pilot study. Construction of the pilot system will begin summer 2001 and operation is anticipated to begin early 2002. If the pilot study is successful at meeting performance objectives, EPA will expand the system for full-scale cleanup. Therefore, optimization analysis is not applicable or appropriate for this pump & treat system. It should be noted that a sheet pile wall has been constructed around this site to significantly reduce migration of contaminants to Eagle Harbor and Puget Sound.
Contact Information
System Information and Data
1200 Sixth Avenue, ECL-115 State of Washington Dept.of Ecology
Date original ROD was signed:
Date of last modification to ROD:
Seattle, WA 98101206-553-0171 (phone)206-553-0124 (fax)
Wyckoff/Eagle Harbor Superfund SiteBainbridge Island, WA (Region 10)
CERCLIS ID WAD009248295
CH2M HILL
RPMHanh Gold
Type of Fund-lead Site:
Result of previous evaluation of peformance/effectiveness:
Difficulty (due to social/political factors) of implementing minor/major changes:
Type of ROD:
Status of P&T system:

APPENDIX B

Nationwide Superfund Reform InitiativePhase 1– Data Collection and System Screening
Region 1July 3, 2001
In the OSWER Directive No. 9200.0-33, Transmittal of Final FY00 - FY01 Superfund ReformsStrategy, dated July 7,2000, the Office of Solid Waste and Emergency Response outlined acommitment to optimize our Fund-lead, pump-and-treat (P&T) systems. To fulfill this commitment,Headquarters is assisting Regions in evaluating their Fund-lead operating P&T systems. Phase 1 of thisinitiative involves identifying all Fund-lead P&T system, collecting baseline cost and performance dataon them, and selecting up to two sites in each Region for a Remediation System Evaluation (RSE).
This report summarizes the screening process for Region 1 which was conducted during January 2001. The first section of this report presents the cost and performance data for the Region while the seconddescribes the screening process and system selection.
The data presented in this report reflect estimates provided by the site Remedial ProjectManagers between January and May 2001. These estimates may vary from actuality. Thedata– including the number, status, cost, specifications, and projections of systems– may
change over time.
Cost and Performance Data
A total of eight pre-operational and operational Fund-lead P&T systems were identified in Region 1. Of this eight, seven are operational and one is pre-operational (i.e., pre-design, design, being installed,installed but not yet operating)
In addition, the remedial action for one Fund-lead P&T system has been completed and two Fund-leadP&T systems are no longer operating. One of the two systems that are no longer operating, NorwoodPCBs, has been shut down to determine if new groundwater standards set by the state are being met. Pinette’s Salvage Yard is also no longer operating. The system has been shut down and the sitemanagers are monitoring concentrations to determine if contamination is contained. An Explanation ofSignificant Differences will be filed in the near future.
Cost and performance data and other information pertaining to the identified Fund-lead P&T systems(estimates for the pre-operational system) were collected with a web-based questionnaire accessedfrom http://www.cluin.org/optimization and stored in a database. This information is summarized inTable 1 and provided in detail in five additional tables:

July 3, 2001 Nationwide Superfund Reform InitiativePhase 1– Data Collection and Site Screening, Region 1
Page 2 of 3
• Table 2 provides overviews of the systems by providing items such as annual costs, lead,status, goals, and progress of each system.
• Table 3 includes the dates marking the signing of the ROD, construction completion,
system operation and function, turnover to the state, and expected close-out.
• Table 4 lists for each system the contact information for the site Remedial ProjectManager, the State Regulator, and the Contractor.
• Table 5 notes for each system and the associated site if NAPLS are present, the topcontaminants of concern, and the above-ground treatment processes.
• Table 6 lists system specifications such as the pumping rate, number of wells, number ofmonitoring events per year, and other items used to determine the complexity of a systemand its potential for optimization.
Projected dates for turnover to the States and for system completion are depicted in Figure 1, andannual costs for each system are depicted in Figure 2.
RSE Site Selection
Evaluation of Sites for Optimization Potential
Once the information is gathered from each of the Fund-lead P&T systems in a given Region, itbecomes input for a screening methodology that attempts to determine the optimization potential foreach system. This, in turn, provides a basis for selecting two systems where RSEs will be performed. Because some EPA Regions do not have two Fund-lead P&T systems, an additional RSE may beallocated to Region 1 allowing a total of three RSEs to be conducted in this Region as part of thisproject.
The factors affecting the optimization potential of a system are
• the overall cost of a given system, • the expected duration of the system, • the number of above-ground treatment processes, • the number of extraction wells,• the number of monitoring events per year,• the system downtime per year,

July 3, 2001 Nationwide Superfund Reform InitiativePhase 1– Data Collection and Site Screening, Region 1
Page 3 of 3
• the pumping rate,• the results (if any) of a previous performance and effectiveness evaluation, and• any social or political obstacles to implementing modifications to the system.
Table 6 summarizes the results of the screening process including the estimated life-cycle cost savingsthat may result from performing an RSE.
Selecting Sites for RSEs
The following is a list of the identified Fund-lead P&T systems in Region 1 classified as completed,operational, planned, and no-longer operating. Those in bold were selected or are being consideredfor RSEs.
CompletedSylvester/Gilson Road
OperationalBaird and McGuireCharles George LandfillGroveland WellsKearsarge Metallurgical Corp.Keefe Environmental SystemsSavage Well Municipal Water SupplySilresim Chemical Corp.
Pre-OperationalEastern Surplus Company Superfund Site
No-longer OperatingNorwood PCBsPinette’s
Only operational systems were considered in selecting the three systems to receive RSEs. Based onthe screening methodology employed in this project, Baird and McGuire, Savage Well MunicipalWater Supply, and Silresim Chemical Corp. were the sites with sufficient operating histories whereoptimization would yield the greatest percentage reduction in life-cycle costs. In addition, the RemedialProject Manager (RPM) of the Savage site expressed interest in having an RSE conducted at the site,and the 5-year review of the Silresim site noted that the system performance and effectiveness wereinsufficient. Collectively, the life-cycle savings, RPM interest, and effectiveness issues provided thecriteria for selecting Baird and McGuire, Savage Well Municipal Water Supply, and Silresim ChemicalCorp. for receiving RSEs.

Nationwide Superfund Reform Initiative
Phase 1 -- Data Collection and System Screening, Region 1
Number of systems 8Number that are EPA lead 5 of 8Number that are State lead 3 of 8
Number that are operational 7Number that are pre-operational 1Number where restoration is a goal 8 of 8Number where the plume is controlled* 4 of 7Number that are estimated to be more than 80% complete* 2 of 7Number previously evaluated and effectiveness found sufficient* 4 of 7Number previously evaluated and effectiveness found not sufficient* 1 of 7
Number where NAPLs are observed 3 of 8Number with more than 1 major contaminant identified 7 of 8Number with 3 or more treatment processes 6 of 8
Average estimated annual O&M cost (including monitoring) $875,000Average estimated annual monitoring cost $84,375Average number of years until turnover to the States 6.1Average number of years until completion 14.4
*Operational sites only
Pinette's Salvage Yard
Norwood PCBs
Data reflect estimates provided by site Remedial Project Managers between February and May 2001. These estimates may, in some cases, vary from actuality. Data-- including the number, status, cost, projections, and specifications of systems-- may change overtime.
No-Longer-Operating Fund-lead P&T Systems
Extent of Contamination
Average Costs and Time Frames
Region 1, Table 1 -- SummaryJuly 3, 2001
System Status
Operational and Pre-operational Fund-lead P&T Systems
Completed Fund-lead P&T Systems
Sylvester/Gilson Road
Region 1 Fund-lead, P&T systems Data provided by the site RPMs

Nationwide SuperfundReform Initiative
Phase 1 -- Data Collection and System Screening, Region 1
SystemEstimated
Annual Cost LeadType of
RODSystem Status System Goals
Plume Under Control?
Estimated Progress of Restoration
Previous Evaluation of Effectiveness
Baird & McGuire Superfund Site
$3,500,000 EPA Final OperationalContainment &
RestorationYes 20% - 80% Sufficient
Charles George Landfill Superfund Site
$450,000 EPA Final OperationalContainment &
RestorationYes less than 20% Not evaluated
Eastern Surplus Company Superfund Site
$200,000 EPA FinalBeing
InstalledContainment &
RestorationN/A N/A Not evaluated
Groveland Wells Superfund Site
$500,000 EPA Final OperationalContainment &
RestorationUnknown Unknown Sufficient
Kearsarge Metallurgical Corp.
$250,000 State with
Fund MoneyFinal Operational Restoration Yes
more than 80%
Sufficient
Keefe Environmental Systems
$200,000 State with
Fund MoneyFinal Operational
Containment & Restoration
Yesmore than
80%Sufficient
Savage Well Municipal Water System
$500,000 State with
Fund MoneyFinal Operational
Containment & Restoration
No less than 20% Not evaluated
Silresim Chemical Corp. $1,400,000 EPA Final OperationalContainment &
RestorationNo less than 20% Not Sufficient
Notes:
3. Previous evaluations of effectiveness may include 5-year reviews but do not include Remediation Systems Evaluations.
Region 1, Table 2 -- System OverviewsJuly 3, 2001
Data reflect estimates provided by site Remedial Project Managers between February and May 2001. These estimates may, in some cases, vary from actuality. Data-- including the number, status, cost, projections, and specifications of systems-- may change overtime.
1. Easter Surplus Company Superfund Site is pre-operational; therefore, the associated data are estimates and some items are unknown.2. "Estimated Progress of Restoration" refers to the estimated portion of the plume that has been restored to cleanup levels.
Region 1 Fund-lead, P&T systems Data provided by the site RPMs

Nationwide Superfund Reform Initiative
Phase 1 -- Data Collection and System Screening, Region 1
System Original RODLast ROD
ModificationConstruction Completed
Operational and Functional
Turnover to State
Years Until Turnover
Expected Completion
Years Until Completion
Baird & McGuire Superfund Site
9/30/86 4/1993 4/1994 4/2004 2.7 4/2023 21.8
Charles George Landfill Superfund Site
3/23/88 9/26/98 9/1998 9/1999 9/2009 8.2 9/2028 27.2
Eastern Surplus Company Superfund Site
9/28/00 8/2001 10/2001 9/2011 10.2 9/2007 6.2
Groveland Wells Superfund Site
9/9/91 11/15/96 4/2000 5/2001 4/2011 9.8 4/2031 29.8
Kearsarge Metallurgical Corp.
9/28/90 9/1993 9/1993 9/2003 2.2 9/2005 4.2
Keefe Environmental Systems
3/21/88 6/8/90 9/1993 9/1994 9/2003 2.2 9/2003 2.2
Savage Well Municipal Water System
9/27/91 12/19/96 3/1998 4/1999 3/2009 7.7 3/2009 7.7
Silresim Chemical Corp. 9/19/91 11/1995 9/1997 9/2007 6.2 12/2017 16.4
Region 1, Table 3 -- P&T System Histories and Projections
Date
July 3, 2001
Data reflect estimates provided by site Remedial Project Managers between February and May 2001. These estimates may, in some cases, vary from actuality. Data-- including the number, status, cost, projections, and specifications of systems-- may change overtime.
Region 1 Fund-lead, P&T systems Data provided by the site RPMs

Nationwide Superfund Reform Initiative
Phase 1 -- Data Collection and System Screening, Region 1
RPM State Regulator Primary Contractor
1 Taylor Melissa Dorothy Allen Don DwightEPA Region 1 MADEP Metcalf & EddyOne Congress Street 11th floor One Winter Street 30 Harvard Mill Sq.Boston, MA 02114 Boston, MA 02108 Wakefield, MA 01880617-918-1310 617-292-5795 781-224-6286617-918-1291 (fax) 617-292-5530 (fax) 781-224-6880 (fax)[email protected] [email protected] [email protected]
2 Stanley Elaine David Buckley David O'Connor
EPA Region 1Massachusetts Department of Environmental Protection
U.S. Army Corps of Engineers, North Central Residnet Office
One Congress Street, Suite 1100 One Winter Street 50 McArthur Avenue, Box 689Boston, MA 02114-2023 Boston, MA 02108 Devens, MA 01432-4400617-918-1332 617-556-1184 978-772-0148617-918-1291 (fax) 617-292-5530 (fax) 978-772-3104 (fax)[email protected] [email protected] david.o'[email protected]
3 Hathaway Edward Rebecca Hewett Gordon BullardEPA Region 1 Maine DEP TTNUS1 Congress Street, Suite 1100, mailcode: HBT
17 State House Station 55 Jonspin Road
Boston, MA 02114 Augusta, ME 04333-0017 Wilmington, MA 01887617-918-1372 207-287-8554 978-658-7899617-918-1291 (fax) 207-287-7826 (fax) 978-658-7870 (fax)[email protected] [email protected] [email protected]
4 Golden Derrick Janet Waldron Cinthia Mclane
EPA Region 1Massachusetts Department of Environmental Protection
Metcalf & Eddy
One Congress Street - Suite 1100 (HBO)
One Winter Street 30 Harvard Mill Square
Boston, MA 02114 Boston, MA 02108 Wakefield, MA 01880617-918-1448 617-556-1156 781-224-6377617-918-1291 (fax) 617-556-1118 (fax) 781-245-6293 (fax)[email protected] [email protected] [email protected]
Charles George Landfill Superfund Site
Eastern Surplus Company Superfund Site
Groveland Wells Superfund Site
Region 1, Table 4 -- System Contact InformationJuly 3, 2001
SystemBaird & McGuire Superfund Site
Region 1 Fund-lead, P&T Systems Information provided by site RPMs

Nationwide Superfund Reform Initiative
Phase 1 -- Data Collection and System Screening, Region 1
RPM State Regulator Primary Contractor
Region 1, Table 4 -- System Contact InformationJuly 3, 2001
SystemBaird & McGuire Superfund 5 Goehlert Dick Paul Lincoln Bette Nowack
EPA Region 1 NHDES WestonOne Congress Street 6 Hazen Drive 1 Wall St.Boston, MA 02114-2023 Concord, NH 03301 Manchester, NH 03101617-918-1335 603-271-2911 603-656-5400617-918-1291 (fax) 603-271-2456 (fax) [email protected] [email protected]
6 Sprague Cheryl Thomas Andrews Harvey King
EPA Region 1New Hampshire Department of Environmental Services
Woodard and Curran
One Congress Street, Suite 1100 6 Hazen Drive 41 Hutchins DriveBoston, MA 02114-2023 Concord, NH 03301-6527 Portland, ME 04102617 918-1244 603 271-2910 207 774-2112617 918-1291 (fax) 601 271-2456 (fax) 207 774-6635 (fax)[email protected] [email protected] [email protected]
7 GOEHLERT RICHARD THOMAS ANDREWS Joe NewtonEPA Region 1 NHDES CDMONE CONGRESS STREET 6 HAZEN DRIVE Elm StBOSTON, MA 02114-2023 CONCORD, NH 03301 Milford, NH 03055617-918-1335 603-271-2910 603-249-9840617-918-1291 (fax) 603-271-2456 (fax) 603-249-9851 (fax)[email protected] [email protected] [email protected]
8 Janowski Chester Janet Waldron John HaleyEPA Region 1 MADEP Foster Wheeler Environmental Corp.1 Congress Street, Suite 1100, HBO One Winter Street, 7th Floor 133 Federal Street, 6th FloorBoston, MA 02114-2023 Boston, MA 02108 Boston, MA 02110617-918-1324 617-556-1156 617-457-8200617-918-1291 (fax) 617-292-5530 (fax) 617-457-8498 (fax)[email protected] [email protected] [email protected]
Savage Well Municipal Water System
Silresim Chemical Corp.
Kearsarge Metallurgical Corp.
Keefe Environmental Systems
Region 1 Fund-lead, P&T Systems Information provided by site RPMs

Nationwide Superfund Reform Initiative
Phase 1 -- Data Collection and System Screening, Region 1
NAPLS Present?
# of Identified Contam. Contaminants Treatment Processes
Observed 8 Heavy metals Metals Precipitation LNAPL Air Stripping
Pesticides Carbon Adsorption Semi-volatile organic compounds (SVOC) Filtration
Volatile organic compounds (VOCs) Aresenic BTEX
PAHsDon't know 6 Arsenic Other/Not Sure
BTEX Chlorobenzene Mercury Tetrahydrofuran 1,4-Dioxane
Suspected 2 Methylene Chloride Carbon AdsorptionPCE Filtration
Ion ExchangeDon't know 1 Trichlorethylene (TCE)/Tetrachloroelthylene (PCE) Metals Precipitation
UV oxidationCarbon AdsorptionFiltration
Suspected 2 1,1,1-Trichloroethane Air Stripping Trichloroethylene (TCE) Off-Gas Treatment
Not present 4 1,2,3,4-Tetrachlorodibenzodioxin (TCDD) Air Stripping 1,2-Dichloroethene Carbon Adsorption Benzo(a)pyrene Filtration Trans 1,2-Dichloroethylene
Observed 4 1,1,1-Trichloroethane Air Stripping Chlorinated Solvents Carbon Adsorption Cis-1,2-dichloroethene Off-Gas Treatment Trichlorethylene (TCE)/Tetrachloroelthylene (PCE)
Observed 8 1,1,2,2-Tetrachloroethane Metals Precipitation1,1-Dichloroethylene (DCE) Air StrippingAcids FiltrationBenzo(b)fluoranthene Off-Gas TreatmentMethylphenol Solid Propellants Trans 1,2-Dichloroethylene Volatile chlorinated organics
Keefe Environmental Systems
Kearsarge Metallurgical
Data reflect estimates provided by site Remedial Project Managers between February and May 2001. These estimates may, in some cases, vary from actuality. Data-- including the number, status, cost, projections, and
specifications of systems-- may change overtime.
Region 1, Table 5 -- Top Contaminants Identified by RPMsJuly 3, 2001
Baird & McGuire Superfund Site
System
Savage Well Municipal Water System
Silresim Chemical Corp.
Charles George Landfill Superfund Site
Groveland Wells Superfund Site
Eastern Surplus Company Superfund Site
Region 1 Fund-lead, P&T system Data provided by site RPMs

Nationwide Superfund Reform Initiative
Phase 1 -- Data Collection and System Screening, Region 1
System
Potential Reduction in
Life-Cycle Costs
Potential Life-Cycle Savings
Expected Duration
Previous Evaluation of Effectiveness
Approximate Pumping
Rate (gpm)
Number of Extraction
Wells
Number of Treatment Processes
Groundwater Samples per
Year
Obstacles to making
(minor/major) changes
Baird & McGuire Superfund Site
27.5% $12,402,549 21.8 Sufficient 150 7 4 80Moderate Severe
Charles George Landfill Superfund Site
17.5% $1,121,604 27.2 Not evaluated 30 9 1 40Moderate Severe
Groveland Wells Superfund Site
27.5% $2,065,504 29.8 Sufficient 140 10 4 21Minor Minor
Kearsarge Metallurgical Corp.
10.0% $56,941 4.2 Sufficient 42 14 2 60Moderate Moderate
Keefe Environmental Systems
7.5% ($1,583) 2.2 Sufficient 20 4 3 82Minor Minor
2. "Potential Life-cycle Savings" were estimated using using system-specific information and incorporate the cost of the RSE. Values in parentheses denote costs (negative savings).3. "Groundwater Samples per Year" is calculated by multiplying the number of monitoring wells sampled by the number of monitoring events per year.4. Previous evaluations of effectiveness may include 5-year reviews but do not include Remediation System Evaluations.
Region 1, Table 6 -- Screening SummaryJuly 3, 2001
Operational
Data reflect estimates provided by site Remedial Project Managers between February and May 2001. These estimates may, in some cases, vary from actuality. Data-- including the number, status, cost, projections, and specifications of systems-- may change overtime.
Notes: 1. "Potential Reduction in Life-cycle Costs" result from a screening methodology that incorporates system-specific information. The reductions do not include the cost of an RSE.
Region 1 Fund-lead, P&T system Data provided by site RPMs

Nationwide Superfund Reform Initiative
Phase 1 -- Data Collection and System Screening, Region 1
System
Potential Reduction in
Life-Cycle Costs
Potential Life-Cycle Savings
Expected Duration
Previous Evaluation of Effectiveness
Approximate Pumping
Rate (gpm)
Number of Extraction
Wells
Number of Treatment Processes
Groundwater Samples per
Year
Obstacles to making
(minor/major) changes
Region 1, Table 6 -- Screening SummaryJuly 3, 2001
Operational
Savage Well Municipal Water System
32.5% $934,042 7.7 Not evaluated 100 4 3 114Minor Minor
Silresim Chemical Corp.
40.0% $6,025,600 16.4 Not Sufficient 25 31 4 94Minor Minor
Eastern Surplus Company Superfund Site
28.0% $245,611 6.2 Not evaluated 20 12 3 60Minor
Moderate
2. "Potential Life-cycle Savings" were estimated using using system-specific information and incorporate the cost of the RSE. Values in parentheses denote costs (negative savings).3. "Groundwater Samples per Year" is calculated by multiplying the number of monitoring wells sampled by the number of monitoring events per year.4. Previous evaluations of effectiveness may include 5-year reviews but do not include Remediation System Evaluations.
1. "Potential Reduction in Life-cycle Costs" result from a screening methodology that incorporates system-specific information. The reductions do not include the cost of an RSE.
Notes:
Data reflect estimates provided by site Remedial Project Managers between February and May 2001. These estimates may, in some cases, vary from actuality. Data-- including the number, status, cost, projections, and specifications of systems-- may change overtime.
Pre-Operational
Region 1 Fund-lead, P&T system Data provided by site RPMs

Nationwide SuperfundReform Initiative
Phase 1 -- Data Collection and System Screening, Region 1
Data reflect estimates provided by site Remedial Project Managers between February and May 2001. These estimates may, in some cases, vary from actuality. Data-- including the number, status, cost, projections, and specifications of systems-- may change overtime.
Region 1, Figure 1 -- Estimated Annual Costs of SystemsJuly 3, 2001
$3,500
$450 $500$250 $200
$500
$1,400
$200
$0
$500
$1,000
$1,500
$2,000
$2,500
$3,000
$3,500B
aird
&M
cGui
reS
uper
fund
Site
Cha
rles
Geo
rge
Land
fill
Sup
erfu
nd S
ite
Eas
tern
Sur
plus
Com
pany
Sup
erfu
nd S
ite
Gro
vela
ndW
ells
Sup
erfu
nd S
ite
Kea
rsar
geM
etal
lurg
ical
Cor
p.
Kee
feE
nviro
nmen
tal
Sys
tem
s
Sav
age
Wel
lM
unic
ipal
Wat
er S
yste
m
Silr
esim
Che
mic
alC
orp.
$100
0/yr
Operational Systems
Pre-operational Systems
Region 1 Fund-lead, P&T systems Data provided by the site RPMs

Nationwide Superfund Reform Initiative
Phase 1 -- Data Collection and System Screening, Region 1
Data reflect estimates provided by site Remedial Project Managers between February and May 2001. These estimates may, in some cases, vary from actuality. Data-- including the number, status, cost, projections, and specifications of systems-- may change overtime.
July 3, 2001
Region 1, Figure 2 -- System Projections
0.0
5.0
10.0
15.0
20.0
25.0
30.0
Bai
rd &
McG
uire
Sup
erfu
nd S
ite
Cha
rles
Geo
rge
Land
fill
Sup
erfu
nd S
ite
Eas
tern
Sur
plus
Com
pany
Sup
erfu
nd S
ite
Gro
vela
nd W
ells
Sup
erfu
nd S
ite
Kea
rsar
geM
etal
lurg
ical
Cor
p.
Kee
feE
nviro
nmen
tal
Sys
tem
s
Sav
age
Wel
lM
unic
ipal
Wat
erS
yste
m
Silr
esim
Che
mic
al C
orp.
year
s
Years Until Turnover
Years Until Completion
2021
2026
2031
2001
2006
2011
2016
Region 1 Fund-lead, P&T systems Data provided by the site RPMs

Nationwide Superfund Reform InitiativePhase 1– Data Collection and System Screening
Region 2July 3, 2001
In the OSWER Directive No. 9200.0-33, Transmittal of Final FY00 - FY01 Superfund ReformsStrategy, dated July 7,2000, the Office of Solid Waste and Emergency Response outlined acommitment to optimize our Fund-lead, pump-and-treat (P&T) systems. To fulfill this commitment,Headquarters is assisting Regions in evaluating their Fund-lead operating P&T systems. Phase 1 of thisinitiative involves identifying all Fund-lead P&T system, collecting baseline cost and performance dataon them, and selecting up to two sites in each Region for a Remediation System Evaluation (RSE).
This report summarizes the screening process for Region 2 which began in January 2001. The firstsection of this report presents the cost and performance data for the Region while the second describesthe screening process and system selection.
The data presented in this report reflect estimates provided by the site Remedial ProjectManagers between January and May 2001. These estimates may vary from actuality. Thedata– including the number, status, cost, specifications, and projections of systems– may
change over time.
Cost and Performance Data
Twenty-two Fund-lead P&T systems were identified in Region 2. Of these twenty-two systems, 18are operational and four are pre-operational (i.e., pre-design, design, being installed, installed but notyet operating). In addition, pump-and-treat may be selected as a remedy for one Fund-lead site whenthe Record of Decision is completed.
Cost and performance data and other information pertaining to the identified Fund-lead P&T systems(estimates for the pre-operational system) were collected with a web-based questionnaire accessedfrom http://www.cluin.org/optimization and stored in a database. This information is summarized inTable 1 and provided in detail in five additional tables (Note: two of the pre-operational systems,Dover Municipal Well 4 and Metal TEC/Aerosystems, may ultimately use a remedy other than P&T):
• Table 2 provides overviews of the systems by providing items such as annual costs, lead,status, goals, and progress of each system.
• Table 3 includes the dates marking the signing of the ROD, construction completion,
system operation and function, turnover to the state, and expected close-out.

July 3, 2001 Nationwide Superfund Reform InitiativePhase 1– Data Collection and Site Screening, Region 2
Page 2 of 4
• Table 4 lists for each system the contact information for the site Remedial ProjectManager, the State Regulator, and the Contractor.
• Table 5 notes for each system and the associated site if NAPLS are present, the topcontaminants of concern, and the above-ground treatment processes.
• Table 6 lists system specifications such as the pumping rate, number of wells, number ofmonitoring events per year, and other items used to determine the complexity of a systemand its potential for optimization.
Projected dates for turnover to the States and for system completion are depicted in Figure 1, andannual costs for each system are depicted in Figure 2.
RSE Site Selection
Evaluation of Sites for Optimization Potential
Once the information is gathered from each of the Fund-lead P&T systems in a given Region, itbecomes input for a screening methodology that attempts to determine the optimization potential foreach system. This, in turn, provides a basis for selecting two systems where RSEs will be performed.The factors affecting the optimization potential of a system are
• the overall cost of a given system, • the expected duration of the system, • the number of above-ground treatment processes, • the number of extraction wells,• the number of monitoring events per year,• the system downtime per year,• the pumping rate,• the results (if any) of a previous performance and effectiveness evaluation, and• any social or political obstacles to implementing modifications to the system.
To estimate potential life-cycle savings from optimization, a default reduction in life-cycle costs of 20%is assumed and is adjusted based on the above factors. For example, according to the screeningmethodology, a system with many above-ground treatment processes and a high pumping rate mayexhibit greater than a 20% reduction in life-cycle costs whereas a system with few extraction wells andone treatment process may exhibit less than a 20% reduction in life-cycle costs.
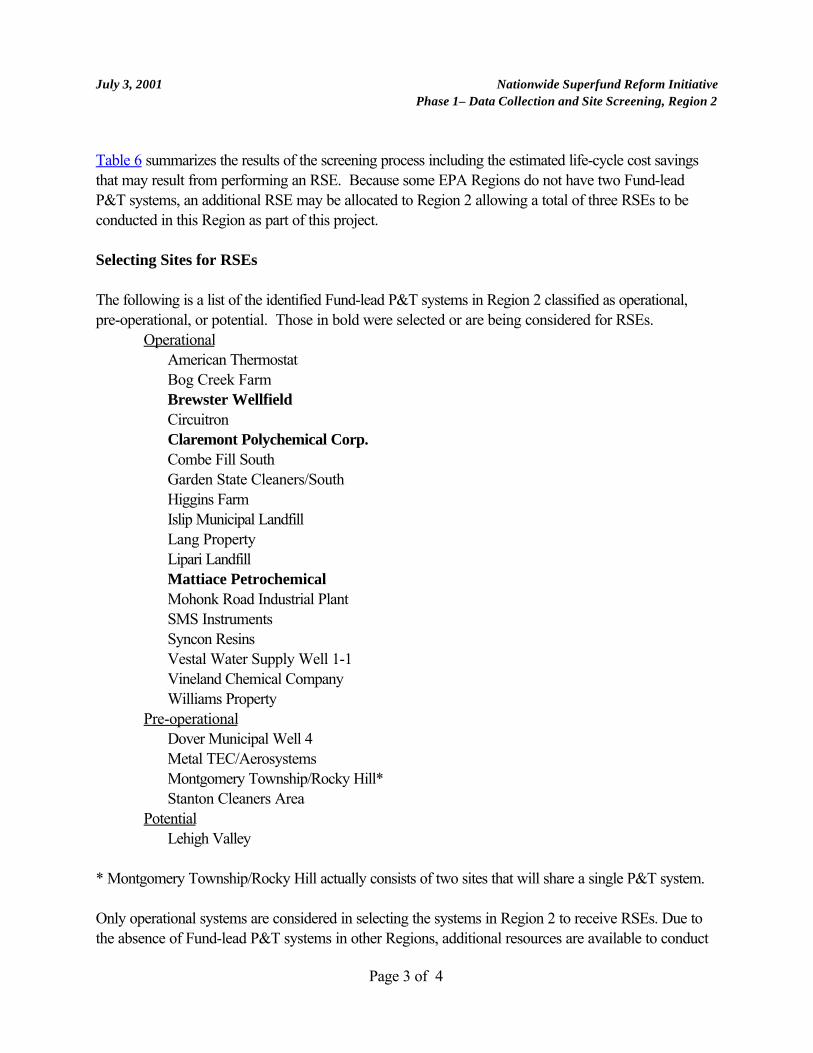
July 3, 2001 Nationwide Superfund Reform InitiativePhase 1– Data Collection and Site Screening, Region 2
Page 3 of 4
Table 6 summarizes the results of the screening process including the estimated life-cycle cost savingsthat may result from performing an RSE. Because some EPA Regions do not have two Fund-leadP&T systems, an additional RSE may be allocated to Region 2 allowing a total of three RSEs to beconducted in this Region as part of this project.
Selecting Sites for RSEs
The following is a list of the identified Fund-lead P&T systems in Region 2 classified as operational,pre-operational, or potential. Those in bold were selected or are being considered for RSEs.
OperationalAmerican ThermostatBog Creek FarmBrewster WellfieldCircuitronClaremont Polychemical Corp.Combe Fill SouthGarden State Cleaners/SouthHiggins FarmIslip Municipal LandfillLang PropertyLipari LandfillMattiace PetrochemicalMohonk Road Industrial PlantSMS InstrumentsSyncon ResinsVestal Water Supply Well 1-1Vineland Chemical CompanyWilliams Property
Pre-operationalDover Municipal Well 4Metal TEC/AerosystemsMontgomery Township/Rocky Hill*Stanton Cleaners Area
PotentialLehigh Valley
* Montgomery Township/Rocky Hill actually consists of two sites that will share a single P&T system.
Only operational systems are considered in selecting the systems in Region 2 to receive RSEs. Due tothe absence of Fund-lead P&T systems in other Regions, additional resources are available to conduct
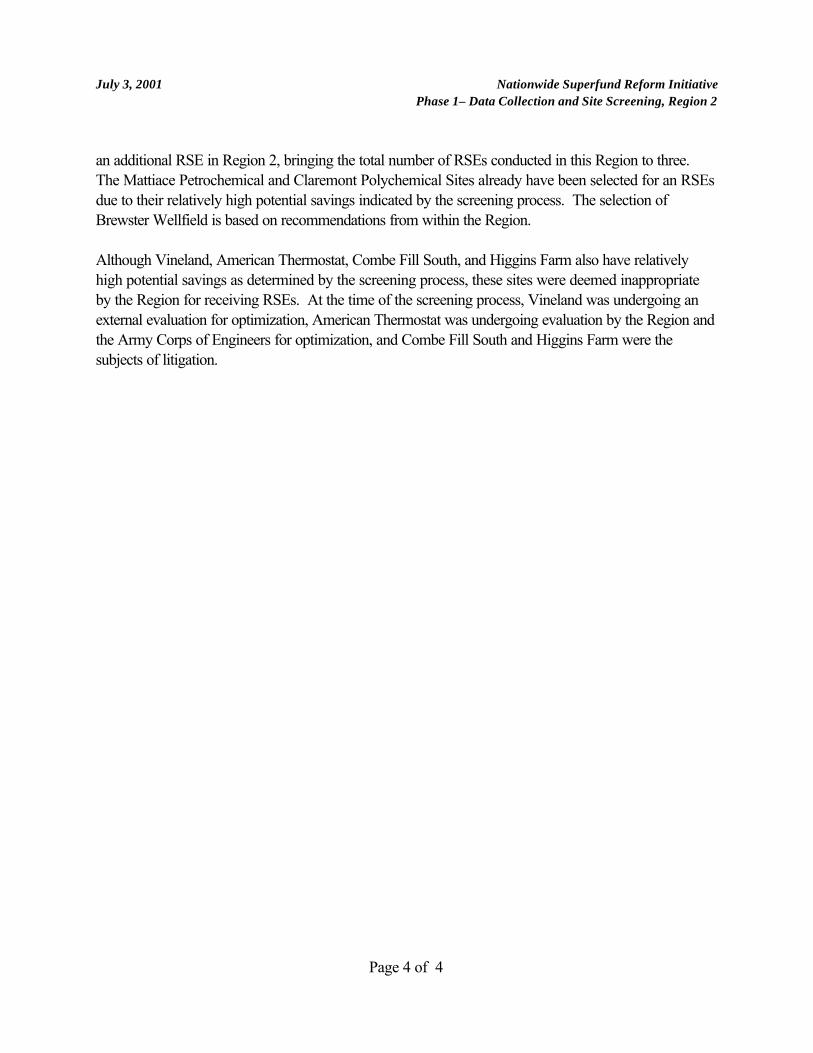
July 3, 2001 Nationwide Superfund Reform InitiativePhase 1– Data Collection and Site Screening, Region 2
Page 4 of 4
an additional RSE in Region 2, bringing the total number of RSEs conducted in this Region to three. The Mattiace Petrochemical and Claremont Polychemical Sites already have been selected for an RSEsdue to their relatively high potential savings indicated by the screening process. The selection ofBrewster Wellfield is based on recommendations from within the Region.
Although Vineland, American Thermostat, Combe Fill South, and Higgins Farm also have relativelyhigh potential savings as determined by the screening process, these sites were deemed inappropriateby the Region for receiving RSEs. At the time of the screening process, Vineland was undergoing anexternal evaluation for optimization, American Thermostat was undergoing evaluation by the Region andthe Army Corps of Engineers for optimization, and Combe Fill South and Higgins Farm were thesubjects of litigation.

Nationwide Superfund Reform Initiative
Phase 1 -- Data Collection and System Screening, Region 2
Number of systems 22Number that are EPA lead 18 of 22Number that are State lead 4 of 22
Number that are operational 18Number that are pre-operational 4Number where restoration is a goal 21 of 22Number where the plume is controlled* 15 of 18Number that are estimated to be more than 80% complete* 1 of 18Number previously evaluated and effectiveness found sufficient* 10 of 18Number previously evaluated and effectiveness found not sufficient* 2 of 18
Number where NAPLs are observed 4 of 22Number with more than 1 major contaminant identified 17 of 22Number with 3 or more treatment processes 13 of 22
Average estimated annual O&M cost (including monitoring) $828,947Average estimated annual monitoring cost $190,900Average number of years until turnover to the States 7.9Average number of years until completion 17.7
*Operational sites only
Data reflect estimates provided by site Remedial Project Managers between February and May 2001. These estimates may, in some cases, vary from actuality. Data-- including the number, status, cost, projections, and specifications of systems-- may change overtime.
Extent of Contamination
Average Costs and Time Frames
Region 2, Table 1 -- SummaryJuly 3, 2001
System Status
Operational and Pre-operational Fund-lead P&T Systems
Completed Fund-lead P&T Systems
Region 2 Fund-lead, P&T systems Data provided by the site RPMs
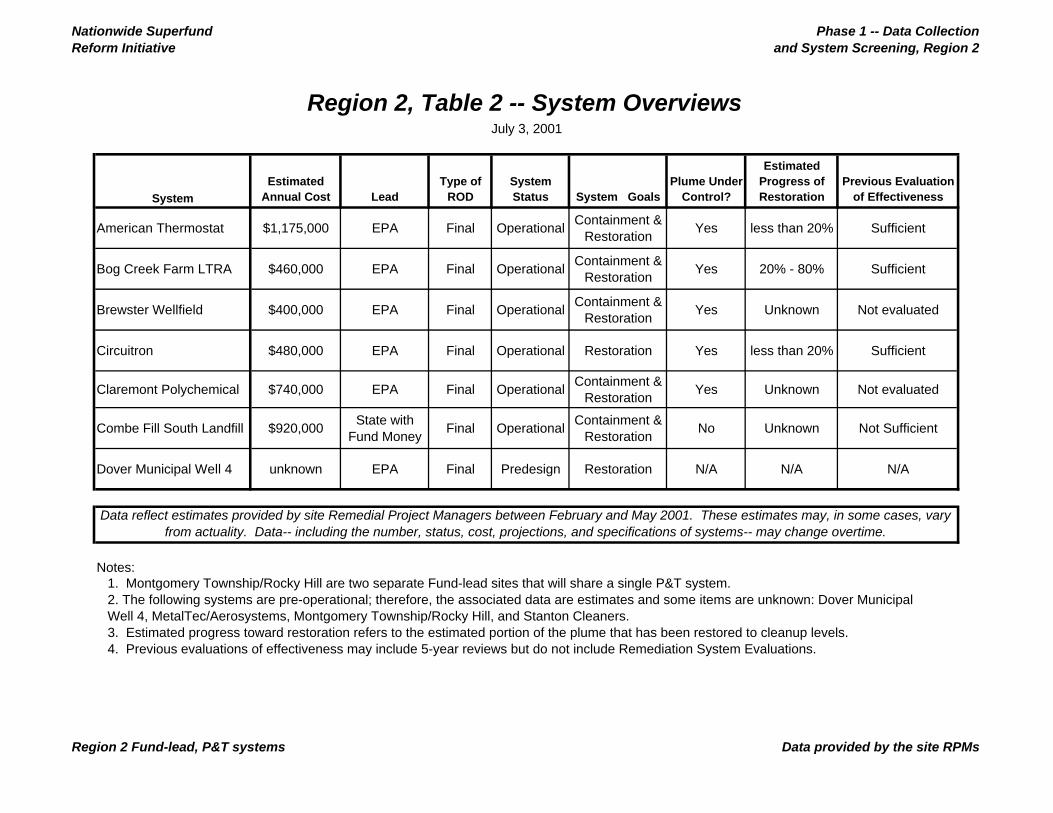
Nationwide Superfund Reform Initiative
Phase 1 -- Data Collection and System Screening, Region 2
SystemEstimated
Annual Cost LeadType of
RODSystem Status System Goals
Plume Under Control?
Estimated Progress of Restoration
Previous Evaluation of Effectiveness
American Thermostat $1,175,000 EPA Final OperationalContainment &
RestorationYes less than 20% Sufficient
Bog Creek Farm LTRA $460,000 EPA Final OperationalContainment &
RestorationYes 20% - 80% Sufficient
Brewster Wellfield $400,000 EPA Final OperationalContainment &
RestorationYes Unknown Not evaluated
Circuitron $480,000 EPA Final Operational Restoration Yes less than 20% Sufficient
Claremont Polychemical $740,000 EPA Final OperationalContainment &
RestorationYes Unknown Not evaluated
Combe Fill South Landfill $920,000 State with
Fund MoneyFinal Operational
Containment & Restoration
No Unknown Not Sufficient
Dover Municipal Well 4 unknown EPA Final Predesign Restoration N/A N/A N/A
Notes:
Region 2, Table 2 -- System OverviewsJuly 3, 2001
Data reflect estimates provided by site Remedial Project Managers between February and May 2001. These estimates may, in some cases, vary from actuality. Data-- including the number, status, cost, projections, and specifications of systems-- may change overtime.
1. Montgomery Township/Rocky Hill are two separate Fund-lead sites that will share a single P&T system.2. The following systems are pre-operational; therefore, the associated data are estimates and some items are unknown: Dover Municipal Well 4, MetalTec/Aerosystems, Montgomery Township/Rocky Hill, and Stanton Cleaners.3. Estimated progress toward restoration refers to the estimated portion of the plume that has been restored to cleanup levels.4. Previous evaluations of effectiveness may include 5-year reviews but do not include Remediation System Evaluations.
Region 2 Fund-lead, P&T systems Data provided by the site RPMs

Nationwide Superfund Reform Initiative
Phase 1 -- Data Collection and System Screening, Region 2
SystemEstimated
Annual Cost LeadType of
RODSystem Status System Goals
Plume Under Control?
Estimated Progress of Restoration
Previous Evaluation of Effectiveness
Region 2, Table 2 -- System OverviewsJuly 3, 2001
Garden State Cleaners/South Jersey Clothing Company
$500,000 EPA Final OperationalContainment &
RestorationNo Unknown
Currently being evaluated
Higgins Farm $1,000,000 EPA Final OperationalContainment &
RestorationYes less than 20% Not evaluated
Islip Municipal Landfill $225,000 State with
Fund MoneyFinal Operational
Containment & Restoration
Yes 20% - 80% Sufficient
Lang Property $700,000 EPA Final OperationalContainment &
RestorationYes 20% - 80% Sufficient
Lipari Landfill site $2,500,000 EPA Final OperationalContainment &
RestorationYes 20% - 80% Sufficient
Mattiace Petrochemical $700,000 EPA Final OperationalContainment &
RestorationYes less than 20% Sufficient
Metal TEC/Aerosystems unknown EPA Final Predesign N/A N/A N/A N/A
Notes:
Data reflect estimates provided by site Remedial Project Managers between February and May 2001. These estimates may, in some cases, vary from actuality. Data-- including the number, status, cost, projections, and specifications of systems-- may change overtime.
1. Montgomery Township/Rocky Hill are two separate Fund-lead sites that will share a single P&T system.2. The following systems are pre-operational; therefore, the associated data are estimates and some items are unknown: Dover Municipal Well 4, MetalTec/Aerosystems, Montgomery Township/Rocky Hill, and Stanton Cleaners.3. Estimated progress toward restoration refers to the estimated portion of the plume that has been restored to cleanup levels.4. Previous evaluations of effectiveness may include 5-year reviews but do not include Remediation System Evaluations.
Region 2 Fund-lead, P&T systems Data provided by the site RPMs

Nationwide Superfund Reform Initiative
Phase 1 -- Data Collection and System Screening, Region 2
SystemEstimated
Annual Cost LeadType of
RODSystem Status System Goals
Plume Under Control?
Estimated Progress of Restoration
Previous Evaluation of Effectiveness
Region 2, Table 2 -- System OverviewsJuly 3, 2001
Mohonk Road Industrial Plant
unknown EPA Final OperationalContainment &
RestorationUnknown Unknown
Currently being evaluated
Montgomery Township/Rocky Hill
$400,000 EPA Final Design Restoration N/A N/A N/A
SMS Instruments $400,000 EPA Final OperationalContainment &
RestorationYes 20% - 80% Sufficient
Stanton Cleaners Area Groundwater Contamination Site
$270,000 EPA FinalBeing
InstalledContainment &
RestorationN/A N/A N/A
Syncon Resins $350,000 State with
Fund MoneyFinal Operational
Containment & Restoration
Yes less than 20% Not Sufficient
Vestal Water Supply Well 1-1
$180,000 EPA Final OperationalContainment &
RestorationYes less than 20% Sufficient
Vineland Chemical Co. Groundwater Treatment
$4,000,000 EPA Final OperationalContainment &
RestorationYes Unknown
Currently being evaluated
Williams Property $350,000 State with
Fund MoneyFinal Operational Restoration Yes
more than 80%
Sufficient
Notes:
4. Previous evaluations of effectiveness may include 5-year reviews but do not include Remediation System Evaluations.
2. The following systems are pre-operational; therefore, the associated data are estimates and some items are unknown: Dover Municipal Well 4, MetalTec/Aerosystems, Montgomery Township/Rocky Hill, and Stanton Cleaners.3. Estimated progress toward restoration refers to the estimated portion of the plume that has been restored to cleanup levels.
Data reflect estimates provided by site Remedial Project Managers between February and May 2001. These estimates may, in some cases, vary from actuality. Data-- including the number, status, cost, projections, and specifications of systems-- may change overtime.
1. Montgomery Township/Rocky Hill are two separate Fund-lead sites that will share a single P&T system.
Region 2 Fund-lead, P&T systems Data provided by the site RPMs
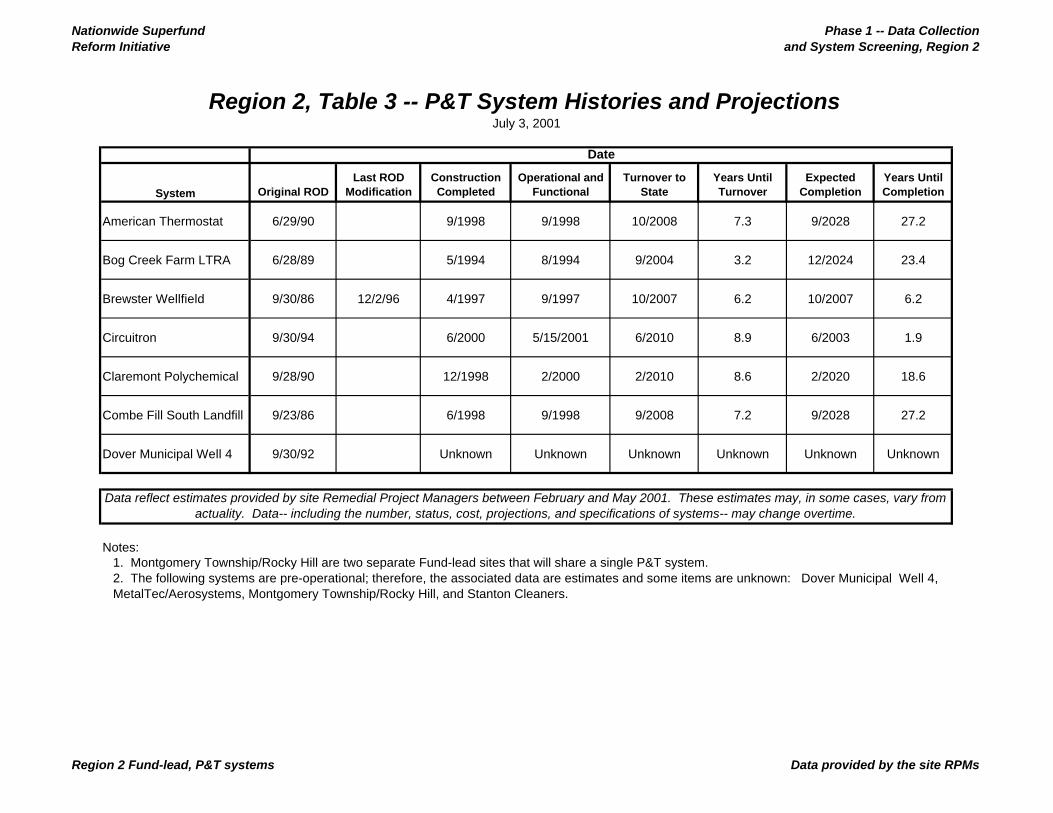
Nationwide Superfund Reform Initiative
Phase 1 -- Data Collection and System Screening, Region 2
System Original RODLast ROD
ModificationConstruction Completed
Operational and Functional
Turnover to State
Years Until Turnover
Expected Completion
Years Until Completion
American Thermostat 6/29/90 9/1998 9/1998 10/2008 7.3 9/2028 27.2
Bog Creek Farm LTRA 6/28/89 5/1994 8/1994 9/2004 3.2 12/2024 23.4
Brewster Wellfield 9/30/86 12/2/96 4/1997 9/1997 10/2007 6.2 10/2007 6.2
Circuitron 9/30/94 6/2000 5/15/2001 6/2010 8.9 6/2003 1.9
Claremont Polychemical 9/28/90 12/1998 2/2000 2/2010 8.6 2/2020 18.6
Combe Fill South Landfill 9/23/86 6/1998 9/1998 9/2008 7.2 9/2028 27.2
Dover Municipal Well 4 9/30/92 Unknown Unknown Unknown Unknown Unknown Unknown
Notes:
Region 2, Table 3 -- P&T System Histories and Projections
Date
July 3, 2001
Data reflect estimates provided by site Remedial Project Managers between February and May 2001. These estimates may, in some cases, vary from actuality. Data-- including the number, status, cost, projections, and specifications of systems-- may change overtime.
1. Montgomery Township/Rocky Hill are two separate Fund-lead sites that will share a single P&T system.2. The following systems are pre-operational; therefore, the associated data are estimates and some items are unknown: Dover Municipal Well 4, MetalTec/Aerosystems, Montgomery Township/Rocky Hill, and Stanton Cleaners.
Region 2 Fund-lead, P&T systems Data provided by the site RPMs

Nationwide Superfund Reform Initiative
Phase 1 -- Data Collection and System Screening, Region 2
System Original RODLast ROD
ModificationConstruction Completed
Operational and Functional
Turnover to State
Years Until Turnover
Expected Completion
Years Until Completion
Region 2, Table 3 -- P&T System Histories and Projections
Date
July 3, 2001
Garden State Cleaners/South Jersey Clothing Company
9/26/91 3/1999 9/2000 10/2009 8.3 9/2029 28.2
Higgins Farm 9/30/92 5/1998 1/1999 1/2009 7.5 9/2028 27.2
Islip Municipal Landfill 9/19/92 9/1996 9/1997 9/2006 5.2 1/2003 1.5
Lang Property 9/29/86 9/1995 10/1995 10/2005 4.2 1/2005 3.5
Lipari Landfill site 9/30/85 12/1992 6/1993 10/2019 18.3 12/2004 3.4
Mattiace Petrochemical 6/27/91 8/1998 9/1999 3/2009 7.7 8/2029 28.1
Metal TEC/Aerosystems 9/27/90 Unknown Unknown Unknown Unknown Unknown Unknown
Notes:
Data reflect estimates provided by site Remedial Project Managers between February and May 2001. These estimates may, in some cases, vary from actuality. Data-- including the number, status, cost, projections, and specifications of systems-- may change overtime.
1. Montgomery Township/Rocky Hill are two separate Fund-lead sites that will share a single P&T system.2. The following systems are pre-operational; therefore, the associated data are estimates and some items are unknown: Dover Municipal Well 4, MetalTec/Aerosystems, Montgomery Township/Rocky Hill, and Stanton Cleaners.
Region 2 Fund-lead, P&T systems Data provided by the site RPMs

Nationwide Superfund Reform Initiative
Phase 1 -- Data Collection and System Screening, Region 2
System Original RODLast ROD
ModificationConstruction Completed
Operational and Functional
Turnover to State
Years Until Turnover
Expected Completion
Years Until Completion
Region 2, Table 3 -- P&T System Histories and Projections
Date
July 3, 2001
Mohonk Road Industrial Plant
3/31/00 5/2000 7/2001 7/2011 10.0 7/2031 30.0
Montgomery Township/Rocky Hill
6/27/88 9/2003 9/2003 9/2013 12.2 9/2033 32.2
SMS Instruments 9/29/89 6/1994 6/1995 6/2005 3.9 3/2004 2.7
Stanton Cleaners Area Groundwater Contamination Site
3/31/99 6/2001 9/2001 9/2011 10.2 9/2021 20.2
Syncon Resins 9/29/86 9/27/00 4/1991 4/1991 4/2001 0.0 9/2028 27.2
Vestal Water Supply Well 1-1
6/27/86 12/1993 3/1995 3/2005 3.7 3/2015 13.7
Vineland Chemical Co. Groundwater Treatment
9/28/89 4/2000 6/2000 6/2011 9.9 6/2031 29.9
Williams Property 9/29/87 1/1995 1/1995 1/2001 0.0 12/2002 1.4
Notes:
Data reflect estimates provided by site Remedial Project Managers between February and May 2001. These estimates may, in some cases, vary from actuality. Data-- including the number, status, cost, projections, and specifications of systems-- may change overtime.
1. Montgomery Township/Rocky Hill are two separate Fund-lead sites that will share a single P&T system.2. The following systems are pre-operational; therefore, the associated data are estimates and some items are unknown: Dover Municipal Well 4, MetalTec/Aerosystems, Montgomery Township/Rocky Hill, and Stanton Cleaners.
Region 2 Fund-lead, P&T systems Data provided by the site RPMs

Nationwide Superfund Reform Initiative
Phase 1 -- Data Collection and System Screening, Region 2
RPM State Regulator Primary Contractor
1 Christos Tsiamis Joseph Yavonditte Feeney Richard
EPA Region 2New York State Department of Environmental Conservation
Foster Wheeler Environmental Corporation
290 Broadway 50 Wolf Road 1000 The American RoadNew York, NY 12233 Albany, NY 12233 Morris Plains, NJ 07950212-637-4257 518-457-9285 973-630-8092212-637-3966 (fax) 518-457-7743 (fax) 973-630-8111 (fax)[email protected] [email protected] [email protected]
2 Edward Finnerty Craig Wallace George PaprockiEPA Region 2 NJDEP USACE290 Broadway 401 E State St. Ft. MonmouthNew York, NY 10007 Trenton, NJ 08625 Eatontown, NJ 07703212 637 4367 609 984 2990 732 389 3040212-637-4393 (fax) 609 633 2360 (fax) 732 389 1564 (fax)[email protected] [email protected] [email protected]
3 Lisa Wong George Momberger Dawn Cermak
EPA Region 2New York State Department of Environmental Conservation
Sevenson Environmental Services, Inc
290 Broadway 50 Wolf Road Box 71A Route 518, Franklin TwspNew York, NY 10007 Albany, NY 12233 Princeton, NJ 08540212-637-4267 518-457-0927 732-297-0432212-637-3966 (fax) 518-457-8989 (fax) 732-297-0441 (fax)[email protected] [email protected] [email protected]
4 Sharon Trocher Jeffrey Trad Shewen Bian
EPA Region 2New York State Department of Environmental Conservation
USACE, New York District
290 Broadway 50 Wolf Road 1900 Hempstead Turnpike, Suite 16New York, NY 10007-1866 Albany, NY 12233-7010 East Meadow, NY 11554212-637-3965 518-457-9285 516-794-2913212-637-3966 (fax) 518-457-7743 (fax) 516-794-2975 (fax)[email protected] [email protected]
Region 2, Table 4 -- System Contact InformationJuly 3, 2001
System
American Thermostat
Bog Creek Farm LTRA
Brewster Wellfield
Circuitron
Region 2 Fund-lead, P&T Systems Information provided by site RPMs

Nationwide Superfund Reform Initiative
Phase 1 -- Data Collection and System Screening, Region 2
RPM State Regulator Primary Contractor
Region 2, Table 4 -- System Contact InformationJuly 3, 2001
System
5 Maria Jon Jeff Trad Mark Kucera
EPA Region 2New York State Department of Environmental Conservation
U.S. Army Corps of Engineers
290 Broadway, 20th Floor 50 Wolf Road 501 Winding RoadNew York, NY 10007 Albany, NY 12218 Old Bethpage, NY 11804212-637-3967 518-457-9285 516-249-8912212-637-4284 (fax) 518-457-7743 (fax) 516-249-8928 (fax)[email protected] [email protected]
6 Pamela J. Baxter Paula Walshe James NashEPA Region 2 NJDEP Chapman, Inc.290 Broadway 401 East State St. 25 West Highand AvenueNew York, NY 10007-1866 Trenton, NJ 08625 Atlantic Highlands, NJ 07716212-637-4416 609-633-1119 732-291-7773212-637-4393 (fax) 609-292-1975 (fax) 732-291-7776 (fax)[email protected] [email protected]
7 Diego Garcia Mary Lou Parra Kamala MorganEPA Region 2 NJDEP USACE, Kansas City District290 Broadway 401 East State St. 601 East 12th St.New York, NY 10007-1866 Trenton, NJ 08625 Kansas City,, MO 64106212-637-4947 609-633-3618 [email protected]
8 Brian Quinn Akshay Parikh Steven GillespieEPA Region 2 N.J.D.E.P. Sevenson Environmental Services, Inc.290 Broadway, 19th Floor 401 E. State Street, P.O. Box 413 2749 Lockport RoadNew York, NY 10007 Trenton, NJ 08625 Niagara Falls, NY 14305212-637-4381 609-777-0693 856-905-0782212-637-4393 (fax) 609-633-2360 (fax) 856-697-9187 (fax)[email protected] [email protected] [email protected]
Combe Fill South Landfill
Dover Municipal Well 4
Garden State Cleaners/South Jersey
Claremont Polychemical
Region 2 Fund-lead, P&T Systems Information provided by site RPMs

Nationwide Superfund Reform Initiative
Phase 1 -- Data Collection and System Screening, Region 2
RPM State Regulator Primary Contractor
Region 2, Table 4 -- System Contact InformationJuly 3, 2001
System
9 Pamela J. Baxter Unknown Dawn CermailEPA Region 2 NJDEP Sevenson Environmental Service, Inc.290 Broadway 401 East State St. 71A Route 518New York, NY 10007-1866 Trenton, NJ 08625 Princeton, NJ 08540212-637-4416 732-297-0432212-637-4393 (fax) 732-297-0441 (fax)[email protected] [email protected]
# Mark Dannenberg Carl Hoffman Paul DiMaria
EPA Region 2New York State Department of Environmental Conservation
Islip Resource Recovery Agency
290 Broadway 50 Wolf Road 401 Main StreetNew York, NY 10007 Albany, NY 12233 Islip, NY 11751212-637-4251 518-457-9538 631-224-5644212-637-3966 (fax) 518-457-4198 (fax) 631-224-5645 (fax)[email protected] [email protected] [email protected]
# Lawrence Granite Thomas Ferrara Thomas RocheEPA Region 2 NJDEP U.S. Army Corps of Engineers290 Broadway - 19th floor 401 East State Street 192 City Line RoadNew York, New York, NY 10007-1866 Trenton, NJ 08625 Browns Mills, NJ 08015212-637-4423 609-292-4095 609-893-0983212-637-4393 (fax) 609-633-2360 (fax) 609-893-5415 (fax)[email protected] [email protected]
# Ferdinand Cataneo Michael Burlingame Lee Anne SimmlerEPA Region 2 NJDEP URS/Radian International290 Broadway P.O. Box 413 743 Mullica Hill RoadNew York City, NY 10007-1866 Trenton, NJ 08625-0413 Glassboro, NJ 08028212-637-4428 609-292-1424 856-582-6000212-637-4393 (fax) 609-292-1975 (fax) 856-582-6946 (fax)[email protected] [email protected] [email protected]
Islip Municipal Landfill
Lang Property
Lipari Landfill site
Higgins Farm
Region 2 Fund-lead, P&T Systems Information provided by site RPMs

Nationwide Superfund Reform Initiative
Phase 1 -- Data Collection and System Screening, Region 2
RPM State Regulator Primary Contractor
Region 2, Table 4 -- System Contact InformationJuly 3, 2001
System
# Edward Als Michael Mason Karuppenan Subburamu
EPA Region 2NY State Department of Environmental Conservation
Foster Wheeler Environmental Corp.
290 Broadway 50 Wolf Road 1000 the American RoadNYC, NY 10007-1866 Albany, NY 12233 Morris Plains, NJ 07950212-637-4272 518-457-9285 973-630-8518212-637-3966 (fax) 518-457-7743 (fax) 973-630-8111 (fax)[email protected] [email protected] [email protected]
# Dan Weissman Anton Navaragah N/AEPA Region 2 NJDEP290 Broadway 401 East State St.New York, NY 10007-1866 Trenton, NJ 08625212-637-4384 [email protected]
# Patrick Hamblin Michael Komoroske Eric HamiltonEPA Region 2 NYSDEC EarthTech290 Broadway, 20th Floor 50 Wolf Road, Room 242 7870 Villa Park Drive, Suite 400New York, NY 10007-1866 Albany, NY 12233-7010 Richmond, VA 23228212-637-3314 518-457-3395 804-515-8300212-637-3966 (fax) 518-457-4198 (fax) 804-515-8414 (fax)[email protected] [email protected] [email protected]
# Monica Mahar Larry Quinn Geoffrey McKenzieEPA Region 2 NJDEP CDM290 Broadway 401 East State St. 107-F Corporate Blvd.New York, NY 10007-1866 Trenton, NJ 08625 South Plainsfield, NJ 07080212-637-3942 609-633-0766 [email protected] [email protected] [email protected]
Metal TEC/Aerosystems
Mohonk Road Industrial Plant
Montgomery Township/Rocky Hill
Mattiace Petrochemical
Region 2 Fund-lead, P&T Systems Information provided by site RPMs

Nationwide Superfund Reform Initiative
Phase 1 -- Data Collection and System Screening, Region 2
RPM State Regulator Primary Contractor
Region 2, Table 4 -- System Contact InformationJuly 3, 2001
System
# Mark Dannenberg Joseph Yavonditte Paul Hagerman
EPA Region 2New York State Department of Environmental Conservation
CDM Federal
290 Broadway 50 Wolf Road 125 Maiden LaneNew York, NY 10007 Albany, NY 12233 New York, NY 10038212-637-4251 518-457-9280 212-785-9123212-637-3966 (fax) 518-457-4198 (fax) 212-785-6114 (fax)[email protected] [email protected] [email protected]
# Damian Duda Thomas Gibbons Thomas Williams
EPA Region 2New York State Department of Environmental Conservation
Earth Tech
290 Broadway - 20th Floor 50 Wolf Road 7870 Villa Park Drive - Suite 400New York, NY 10007-1866 Albany, NY 12233 Richmond, VA 23228212-637-4269 518-457-3960 516-482-7162212-637-3966 (fax) 518-457-4158 (fax) 516-466-8396 (fax)[email protected] [email protected] [email protected]
# Pamela J. Baxter Jeanette Abels John SperberEPA Region 2 NJDEP LSR Levine and Fricke290 Broadway 401 East State St. P.O. Box 316New York, NY 10007-1866 Trenton, NJ 08625 Closter, NJ 07624212-637-4416 609-292-4873 201-750-6880212-637-4393 (fax) 609-633-2360 (fax) 201-750-6890 (fax)[email protected] [email protected] [email protected]
# Sharon Trocher Jeffrey Trad Heidemarie Adenau
EPA Region 2New York State Department of Environmental Conservation
Foster Wheeler Environmental Corporation
290 Broadway 50 Wolf Road 1000 The American RoadNew York, NY 10007-1866 Albany, NY 12233-7010 Morris Plains, NJ 07950212-637-3965 518-457-9285 973-630-7197212-637-3966 (fax) 518-457-7743 (fax) 973-630-8025 (fax)[email protected] [email protected] [email protected]
Stanton Cleaners Area Groundwater Contamination Site
Syncon Resins
Vestal Water Supply Well 1-1
SMS Instruments
Region 2 Fund-lead, P&T Systems Information provided by site RPMs

Nationwide Superfund Reform Initiative
Phase 1 -- Data Collection and System Screening, Region 2
RPM State Regulator Primary Contractor
Region 2, Table 4 -- System Contact InformationJuly 3, 2001
System
# Matthew Westgate Craig Wallace Gillespie SteveEPA Region 2 N.J. Dept. of Environmental Protection Sevenson Environmental Services290 Broadway 19th floor 401 East State Street CN413 1405A North Mill RoadNew York City, NY 10007-1866 Trenton, NJ 08625-0413 Vineland, NJ 08360212 637-4422 609 984-3727 856 690-1758212 637-4429 (fax) 609 633-2360 (fax) 856 690-1759 (fax)[email protected] [email protected] [email protected]
# Ferdinand Cataneo Steve Wohleb Richard TalbotEPA Region 2 NJDEP TurnKey Environmental Services, Inc290 Broadway P.O. Box 413 24 South Newton Street Road, Suite 1BNew York City, NY 10007-1866 Trenton, NJ 08625-0413 Newton Square, PA 19073212-637-4428 609-633-3970 610-356-3790212-637-4393 (fax) 609-292-1975 (fax) 610-356-4780 (fax)[email protected] [email protected] [email protected]
Williams Property
Vineland Chemical Co. Groundwater Treatment
Region 2 Fund-lead, P&T Systems Information provided by site RPMs

Nationwide Superfund Reform Initiative
Phase 1 -- Data Collection and System Screening, Region 2
NAPLS Present?
# of Identified Contam. Contaminants Treatment Processes
Suspected 3 1,2-Dichloropropane Metals Precipitation Trichlorobenzene Air Stripping Tetrachloroethylene (PCE) Carbon Adsorption
FiltrationObserved 9 1,1,1-Trichloroethane Metals Precipitation
1,2-Dichloroethylene (DCE) Air Stripping 2,4-Dimethylphenol Carbon Adsorption
Benzene Filtration Phenol Toluene copper
lead zinc
Suspected 2 1,2-Dichloroethylene (DCE) Air Stripping Trichlorethylene (TCE)/Tetrachloroelthylene (PCE)
Circuitron Not present 4 1,1,1-Trichloroethane Air Stripping 1,1-Dichloroethane Carbon Adsorption 1,1-Dichloroethylene (DCE) Filtration Trichloroethylene (TCE)
Don't know 4 1,1,1-Trichloroethane Metals Precipitation Toluene Air Stripping Xylene Carbon Adsorption PCE
Not present 8 1,4-Dichlorobenzene Metals Precipitation Benzene Biological Treatment
Carbon tetrachloride Carbon AdsorptionChlorobenzene FiltrationChloroform Ethylbenzene Methylene Chloride
Toluene Not present 2 TCE Not Determined
PCE Not present 2 Trans 1,2-Dichloroethylene Air Stripping
Trichlorethylene (TCE)/Tetrachloroelthylene (PCE) Carbon Adsorption
Notes:
Garden State Cleaners/South
2. The following systems are pre-operational; therefore, the associated data are estimates and some items are unknown: Dover Municipal Well 4, MetalTec/Aerosystems, Montgomery Township/Rocky Hill, and Stanton Cleaners.
Data reflect estimates provided by site Remedial Project Managers between February and May 2001. These estimates may, in some cases, vary from actuality. Data-- including the number, status, cost, projections, and specifications of
systems-- may change overtime.
1. Montgomery Township/Rocky Hill are two separate Fund-lead sites that will share a single P&T system.
Brewster Wellfield
Claremont Polychemical
Combe Fill South Landfill
Dover Municipal Well 4
Bog Creek Farm LTRA
Region 2 Table 5 -- Top Contaminants Identified by RPMsJuly 3, 2001
System
American Thermostat
Region 2 Fund-lead, P&T system Data provided by site RPMs

Nationwide Superfund Reform Initiative
Phase 1 -- Data Collection and System Screening, Region 2
NAPLS Present?
# of Identified Contam. Contaminants Treatment Processes
Region 2 Table 5 -- Top Contaminants Identified by RPMsJuly 3, 2001
System
American Not present 6 Acetone Metals Precipitation Arsenic Air Stripping
Chloride FiltrationChlorobenzene Ion ExchangeToluene Xylene
Not present 1 Volatile organic compounds (VOCs) Metals Precipitation Air Stripping
Suspected 5 tetrachlorethylene Carbon Adsorption 1,1-dichloroethene Filtration
1,1-dichloroethane Off-Gas Treatmenttrichloroethene chromium
Suspected 9 Benzene and Toluene Metals Precipitation Bis(2-chloroethyl) ether Carbon Adsorption
Xylene Off-Gas Treatment1,2-Dichloroethane Other/Not SureMethylene ChloridePhenolChromium Lead Zinc
Observed 12 Aromatic VOCs Metals Precipitation Chlorinated Aliphatics Air Stripping
Chlorinated Solvents Carbon AdsorptionEthylbenzene FiltrationTetrachloroethylene Off-Gas TreatmentTrichloroethylene Ethylbenzene Toluene Xylenes Methylene Chloride Dichlorobenzene Acetone
Notes:
Higgins Farm
Islip Municipal Landfill
Data reflect estimates provided by site Remedial Project Managers between February and May 2001. These estimates may, in some cases, vary from actuality. Data-- including the number, status, cost, projections, and specifications of
systems-- may change overtime.
Lipari Landfill site
Lang Property
Mattiace Petrochemical
1. Montgomery Township/Rocky Hill are two separate Fund-lead sites that will share a single P&T system.2. The following systems are pre-operational; therefore, the associated data are estimates and some items are unknown: Dover Municipal Well 4, MetalTec/Aerosystems, Montgomery Township/Rocky Hill, and Stanton Cleaners.
Region 2 Fund-lead, P&T system Data provided by site RPMs

Nationwide Superfund Reform Initiative
Phase 1 -- Data Collection and System Screening, Region 2
NAPLS Present?
# of Identified Contam. Contaminants Treatment Processes
Region 2 Table 5 -- Top Contaminants Identified by RPMsJuly 3, 2001
System
American Observed 2 TCE Not determined PCE
Not present 4 1,1,1-Trichloroethane Air Stripping 1,1-Dichloroethane Carbon Adsorption
1,1-Dichloroethylene (DCE) FiltrationTrichloroethylene (TCE) Off-Gas Treatment
Don't know 1 TCE Air Stripping Carbon Adsorption
Not present 1 Xylene Air Stripping Carbon Adsorption
Suspected 4 Trichlorethylene (TCE)/Tetrachloroelthylene (PCE) Metals Precipitation DCE Air Stripping
BTX Carbon AdsorptionMTBE Filtration
Off-Gas TreatmentObserved 6 Acetone Metals Precipitation
Benzene Air StrippingChlorobenzene Biological TreatmentEthylbenzene Carbon AdsorptionToluene FiltrationXylene Off-Gas Treatment
Not present 5 1,1,1-Trichloroethane Air Stripping 1,1-Dichloroethane
1,1-Dichloroethylene (DCE) 1,2-Dichloroethylene (DCE) Trichloroethylene (TCE)
Not present 1 Arsenic Metals Precipitation Filtration
Not present 7 Bis(2-chloroethyl) ether Biological Treatment Trichlorethylene (TCE)/Tetrachloroelthylene (PCE) UV oxidation
Acetone Carbon AdsorptionIsophorone Methyl ethyl ketone (MEK) Methyl isobutyl ketone (MIBK) Xylene
Notes:
Syncon Resins
Vestal Water Supply Well 1-1
Vineland Chemical Co.
Metal TEC/Aerosystems
2. The following systems are pre-operational; therefore, the associated data are estimates and some items are unknown: Dover Municipal Well 4, MetalTec/Aerosystems, Montgomery Township/Rocky Hill, and Stanton Cleaners.
Data reflect estimates provided by site Remedial Project Managers between February and May 2001. These estimates may, in some cases, vary from actuality. Data-- including the number, status, cost, projections, and specifications of
systems-- may change overtime.
1. Montgomery Township/Rocky Hill are two separate Fund-lead sites that will share a single P&T system.
Mohonk Road Industrial Plant
Montgomery Township/Rocky SMS Instruments
Williams Property
Stanton Cleaners Area Groundwater
Region 2 Fund-lead, P&T system Data provided by site RPMs

Nationwide Superfund Reform Initiative
Phase 1 -- Data Collection and System Screening, Region 2
System
Potential Reduction in
Life-Cycle Costs
Potential Life-Cycle
SavingsExpected Duration
Previous Evaluation of Effectiveness
Approximate Pumping
Rate (gpm)
Number of Extraction
Wells
Number of Treatment Processes
Groundwater Samples per
Year
Obstacles to making
(minor/major) changes
American Thermostat 29.5% $5,021,877 27.2 Sufficient 70 14 4 228Minor
SevereBog Creek Farm LTRA
30.0% $1,833,415 23.4 Sufficient 30 33 4 9Minor Minor
Brewster Wellfield 17.5% $317,513 6.2 Not evaluated 50 4 1 64Minor Minor
Circuitron 8.0% $26,187 1.9 Sufficient 80 3 3 76Minor
ModerateClaremont Polychemical
30.0% $2,578,700 18.6 Not evaluated 420 3 3 56Minor Minor
Combe Fill South Landfill
38.0% $5,065,193 27.2 Not Sufficient 121 19 4 72Minor
ModerateGarden State Cleaners/South
32.5% $2,383,103 28.2Currently being
evaluated300 15 2 54
Minor Minor
Notes:
4. "Groundwater Samples per Year" is calculated by multiplying the number of monitoring wells sampled by the number of monitoring events per year.
2. "Potential Reduction in Life-cycle Costs" result from a screening methodology that incorporates system-specific information. The reductions do not include the cost of an RSE.
Region 2 Table 6 -- Screening SummaryJuly 3, 2001
1. Montgomery Township/Rocky Hill are two separate Fund-lead sites that will share a single P&T system.
Data reflect estimates provided by site Remedial Project Managers between February and May 2001. These estimates may, in some cases, vary from actuality. Data-- including the number, status, cost, projections, and specifications of systems-- may change overtime.
3. "Potential Life-cycle Savings" were estimated using using system-specific information and incorporate the cost of the RSE. Values in parentheses denote costs (negative savings).
Operational
5. Previous evaluations of effectiveness may include 5-year reviews but do not include Remediation System Evaluations.
Region 2 Fund-lead, P&T system Data provided by site RPMs

Nationwide Superfund Reform Initiative
Phase 1 -- Data Collection and System Screening, Region 2
System
Potential Reduction in
Life-Cycle Costs
Potential Life-Cycle
SavingsExpected Duration
Previous Evaluation of Effectiveness
Approximate Pumping
Rate (gpm)
Number of Extraction
Wells
Number of Treatment Processes
Groundwater Samples per
Year
Obstacles to making
(minor/major) changes
Region 2 Table 6 -- Screening SummaryJuly 3, 2001
Higgins Farm 40.0% $5,799,020 27.2 Not evaluated 30 20 4 102Minor
Moderate
Islip Municipal Landfill 7.5% ($8,929) 1.5 Sufficient 300 6 2 96Minor Minor
Lang Property 5.0% $70,395 3.5 Sufficient 30 1 3 32Minor Minor
Lipari Landfill site 17.5% $1,136,049 3.4 Sufficient 125 25 4 39Minor Minor
Mattiace Petrochemical
23.0% $2,357,411 28.1 Sufficient 10 9 5 15Minor
ModerateMohonk Road Industrial Plant
unknown unknown 30.0Currently being
evaluated40 3 4 34
Minor Moderate
SMS Instruments 7.5% $35,130 2.7 Sufficient 100 2 2 72Minor Minor
Notes:
4. "Groundwater Samples per Year" is calculated by multiplying the number of monitoring wells sampled by the number of monitoring events per year.
2. "Potential Reduction in Life-cycle Costs" result from a screening methodology that incorporates system-specific information. The reductions do not include the cost of an RSE.
Operational
1. Montgomery Township/Rocky Hill are two separate Fund-lead sites that will share a single P&T system.
3. "Potential Life-cycle Savings" were estimated using using system-specific information and incorporate the cost of the RSE. Values in parentheses denote costs (negative savings).
Data reflect estimates provided by site Remedial Project Managers between February and May 2001. These estimates may, in some cases, vary from actuality. Data-- including the number, status, cost, projections, and specifications of systems-- may change overtime.
5. Previous evaluations of effectiveness may include 5-year reviews but do not include Remediation System Evaluations.
Region 2 Fund-lead, P&T system Data provided by site RPMs

Nationwide Superfund Reform Initiative
Phase 1 -- Data Collection and System Screening, Region 2
System
Potential Reduction in
Life-Cycle Costs
Potential Life-Cycle
SavingsExpected Duration
Previous Evaluation of Effectiveness
Approximate Pumping
Rate (gpm)
Number of Extraction
Wells
Number of Treatment Processes
Groundwater Samples per
Year
Obstacles to making
(minor/major) changes
Region 2 Table 6 -- Screening SummaryJuly 3, 2001
Syncon Resins 28.0% $1,401,885 27.2 Not Sufficient 20 3 6 0Minor
ModerateVestal Water Supply Well 1-1
10.0% $145,660 13.7 Sufficient 450 1 1 12Minor Minor
Vineland Chemical Co. Groundwater
30.0% $18,266,142 29.9Currently being
evaluated1400 13 2 2080
Moderate Severe
Williams Property 5.0% ($9,717) 1.4 Sufficient 80 2 3 36Minor Minor
Notes:
2. "Potential Reduction in Life-cycle Costs" result from a screening methodology that incorporates system-specific information. The reductions do not include the cost of an RSE.3. "Potential Life-cycle Savings" were estimated using using system-specific information and incorporate the cost of the RSE. Values in parentheses denote costs (negative savings).4. "Groundwater Samples per Year" is calculated by multiplying the number of monitoring wells sampled by the number of monitoring events per year.
Data reflect estimates provided by site Remedial Project Managers between February and May 2001. These estimates may, in some cases, vary from actuality. Data-- including the number, status, cost, projections, and specifications of systems-- may change overtime.
1. Montgomery Township/Rocky Hill are two separate Fund-lead sites that will share a single P&T system.
Operational
5. Previous evaluations of effectiveness may include 5-year reviews but do not include Remediation System Evaluations.
Region 2 Fund-lead, P&T system Data provided by site RPMs

Nationwide Superfund Reform Initiative
Phase 1 -- Data Collection and System Screening, Region 2
System
Potential Reduction in
Life-Cycle Costs
Potential Life-Cycle
SavingsExpected Duration
Previous Evaluation of Effectiveness
Approximate Pumping
Rate (gpm)
Number of Extraction
Wells
Number of Treatment Processes
Groundwater Samples per
Year
Obstacles to making
(minor/major) changes
Region 2 Table 6 -- Screening SummaryJuly 3, 2001
Dover Municipal Well 4
unknown unknown N/A N/A N/A N/A N/A N/A N/A
Metal TEC/Aerosystems
unknown unknown N/A N/A N/A N/A N/A N/A N/A
Montgomery Township/Rocky Hill
28.0% $1,696,715 32.2 N/A 250 3 2 80Minor
ModerateStanton Cleaners Area Groundwater
28.0% $908,161 20.2 N/A 90 3 5 120Minor
Moderate
Notes:
5. Previous evaluations of effectiveness may include 5-year reviews but do not include Remediation System Evaluations.
Data reflect estimates provided by site Remedial Project Managers between February and May 2001. These estimates may, in some cases, vary from actuality. Data-- including the number, status, cost, projections, and specifications of systems-- may change overtime.
4. "Groundwater Samples per Year" is calculated by multiplying the number of monitoring wells sampled by the number of monitoring events per
1. Montgomery Township/Rocky Hill are two separate Fund-lead sites that will share a single P&T system.2. "Potential Reduction in Life-cycle Costs" result from a screening methodology that incorporates system-specific information. The reductions do not include the cost of an RSE.3. "Potential Life-cycle Savings" were estimated using using system-specific information and incorporate the cost of the RSE. Values in parentheses denote costs (negative savings).
Pre-Operational
Region 2 Fund-lead, P&T system Data provided by site RPMs

Nationwide Superfund Reform Initiative
Phase 1 -- Data Collection and System Screening, Region 2
1 System is currently shutdown. These are estimated costs for O&M when system resumes operation.2 The system is preoperational with no cost estimates provided.
Notes:
2. The following systems are pre-operational; therefore, the associated data are estimates and some items are unknown: Dover Municipal Well 4, MetalTec/Aerosystems, Montgomery Township/Rocky Hill, and Stanton Cleaners.3. Cost data is not yet available for the Mohonk Road Industrial Plant Site
July 3, 2001
Region 2, Figure 1 -- Estimated Annual Costs of Systems
Data reflect estimates provided by site Remedial Project Managers between February and May 2001. These estimates may, in some cases, vary from actuality. Data-- including the number, status, cost, projections, and specifications of systems-- may change overtime.
1. Montgomery Township/Rocky Hill are two separate Fund-lead sites that will share a single P&T system.
$460
$400 $4
80
$740 $9
20
$500
$1,0
00
$225
$700
$700
$400
$400
$270 $3
50
$180 $3
50
$1,1
75
unkn
own
unkn
own
unkn
own
$4,000$2,500
$0
$500
$1,000
$1,500
$2,000
$2,500A
mer
ican
The
rmos
tat
Bog
Cre
ek F
arm
LTR
A
Bre
wst
er W
ellfi
eld
Circ
uitr
on
Cla
rem
ont
Pol
yche
mic
al
Com
be F
ill S
outh
Land
fill
Dov
er M
unic
ipal
Wel
l 4G
arde
n S
tate
Cle
aner
s/S
outh
Jers
ey C
loth
ing
Hig
gins
Far
m
Islip
Mun
icip
alLa
ndfil
l
Lang
Pro
pert
y
Lipa
ri La
ndfil
l site
Mat
tiace
Pet
roch
emic
al
Met
alT
EC
/Aer
osys
tem
s
Moh
onk
Roa
dIn
dust
rial P
lant
Mon
tgom
ery
Tow
nshi
p/R
ocky
Hill
SM
S In
stru
men
ts
Sta
nton
Cle
aner
sA
rea
Gro
undw
ater
Con
tam
inat
ion
Syn
con
Res
ins
Ves
tal W
ater
Sup
ply
Wel
l 1-1
Vin
elan
d C
hem
ical
Co.
Gro
undw
ater
Tre
atm
ent
Will
iam
s P
rope
rty
Ann
ual C
ost (
$1,0
00/y
r)
Operational Systems Pre-operational Systems
Region 2 Fund-lead, P&T systems Data provided by the site RPMs

Nationwide Superfund Reform Initiative
Phase 1 -- Data Collection and System Screening, Region 2
Notes:
July 3, 2001
Region 2, Figure 2 -- System Projections
Data reflect estimates provided by site Remedial Project Managers between February and May 2001. These estimates may, in some cases, vary from actuality. Data-- including the number, status, cost, projections, and specifications of systems-- may change overtime.
1. Montgomery Township/Rocky Hill are two separate Fund-lead sites that will share a single P&T system.2. The following systems are pre-operational; therefore, the associated data are estimates and some items are unknown: Dover Municipal Well 4, MetalTec/Aerosystems, Montgomery Township/Rocky Hill, and Stanton Cleaners.
0.0
5.0
10.0
15.0
20.0
25.0
30.0
35.0
40.0
Am
eric
anT
herm
osta
t
Bog
Cre
ek F
arm
LTR
A
Bre
wst
er W
ellfi
eld
Circ
uitr
on
Cla
rem
ont
Pol
yche
mic
al
Com
be F
ill S
outh
Land
fill
Dov
er M
unic
ipal
Wel
l 4G
arde
n S
tate
Cle
aner
s/S
outh
Jers
ey C
loth
ing
Hig
gins
Far
m
Islip
Mun
icip
alLa
ndfil
l
Lang
Pro
pert
y
Lipa
ri La
ndfil
l site
Mat
tiace
Pet
roch
emic
al
Met
alT
EC
/Aer
osys
tem
sM
ohon
k R
oad
Indu
stria
l Pla
ntS
iteM
ontg
omer
yT
owns
hip/
Roc
kyH
ill
SM
S In
stru
men
ts
Sta
nton
Cle
aner
sA
rea
Gro
undw
ater
Con
tam
inat
ion
Syn
con
Res
ins
Ves
tal W
ater
Sup
ply
Wel
l 1-1
Vin
elan
d C
hem
ical
Co.
Gro
undw
ater
Tre
atm
ent
Will
iam
s P
rope
rty
year
s
Years Until Turnover Years Until Completion
2021
2026
2031
2036
2041
2001
2006
2011
2016
unkn
own
unkn
own
Region 2 Fund-lead, P&T systems Data provided by the site RPMs

Nationwide Superfund Reform InitiativePhase 1– Data Collection and System Screening
Region 3July 3, 2001
In the OSWER Directive No. 9200.0-33, Transmittal of Final FY00 - FY01 Superfund ReformsStrategy, dated July 7,2000, the Office of Solid Waste and Emergency Response outlined acommitment to optimize our Fund-lead, pump-and-treat (P&T) systems. To fulfill this commitment,Headquarters is assisting Regions in evaluating their Fund-lead operating P&T systems. Phase 1 of thisinitiative involves identifying all Fund-lead P&T system, collecting baseline cost and performance dataon them, and selecting up to two sites in each Region for a Remediation System Evaluation (RSE).
This report summarizes the screening process for Region 3 which began in January 2001 and is anongoing process. The first section of this report presents the cost and performance data for the Regionwhile the second describes the screening process and system selection.
The data presented in this report reflect estimates provided by the site Remedial ProjectManagers between January and May 2001. These estimates may vary from actuality. Thedata– including the number, status, cost, specifications, and projections of systems– may
change over time.
Cost and Performance Data
Twelve Fund-lead P&T systems were identified in Region 3. Of this twelve, ten are operational andtwo are pre-operational (i.e., pre-design, design, being installed, or installed but not operating). Inaddition, two Fund-lead sites have been identified that will likely involve P&T technology.
Cost and performance data and other information pertaining to the identified Fund-lead P&T systems(estimates for the pre-operational systems) were collected with a web-based questionnaire accessedfrom http://www.cluin.org/optimization and stored in a database. This information is summarized inTable 1 and provided in detail in five additional tables:
• Table 2 provides overviews of the systems by providing items such as annual costs, lead,status, goals, and progress of each system.
• Table 3 includes the dates marking the signing of the ROD, construction completion,
system operation and function, turnover to the state, and expected close-out.
• Table 4 lists for each system the contact information for the site Remedial ProjectManager, the State Regulator, and the Contractor.
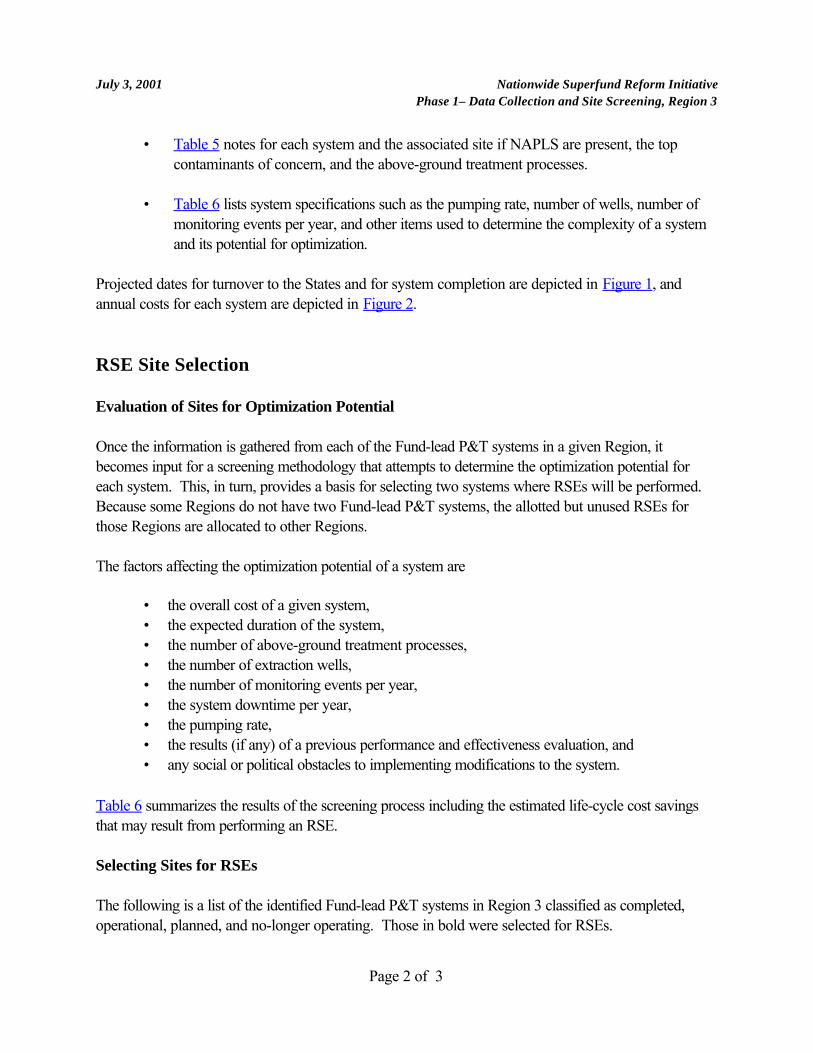
July 3, 2001 Nationwide Superfund Reform InitiativePhase 1– Data Collection and Site Screening, Region 3
Page 2 of 3
• Table 5 notes for each system and the associated site if NAPLS are present, the topcontaminants of concern, and the above-ground treatment processes.
• Table 6 lists system specifications such as the pumping rate, number of wells, number ofmonitoring events per year, and other items used to determine the complexity of a systemand its potential for optimization.
Projected dates for turnover to the States and for system completion are depicted in Figure 1, andannual costs for each system are depicted in Figure 2.
RSE Site Selection
Evaluation of Sites for Optimization Potential
Once the information is gathered from each of the Fund-lead P&T systems in a given Region, itbecomes input for a screening methodology that attempts to determine the optimization potential foreach system. This, in turn, provides a basis for selecting two systems where RSEs will be performed. Because some Regions do not have two Fund-lead P&T systems, the allotted but unused RSEs forthose Regions are allocated to other Regions.
The factors affecting the optimization potential of a system are
• the overall cost of a given system, • the expected duration of the system, • the number of above-ground treatment processes, • the number of extraction wells,• the number of monitoring events per year,• the system downtime per year,• the pumping rate,• the results (if any) of a previous performance and effectiveness evaluation, and• any social or political obstacles to implementing modifications to the system.
Table 6 summarizes the results of the screening process including the estimated life-cycle cost savingsthat may result from performing an RSE.
Selecting Sites for RSEs
The following is a list of the identified Fund-lead P&T systems in Region 3 classified as completed,operational, planned, and no-longer operating. Those in bold were selected for RSEs.

July 3, 2001 Nationwide Superfund Reform InitiativePhase 1– Data Collection and Site Screening, Region 3
Page 3 of 3
OperationalAIW FrankBerks Sand PitButz LandfillCroydon TCECryo-ChemGreenwood ChemicalHellertown ManufacturingNorth Penn Area 1RaymarkSaunders Supply
Pre-OperationalHavertown PCPNorth Penn Area 6
PotentialCrossley FramVienna PCE
Typically, only systems with operational histories are chosen to receive RSEs, and the status of P&Tsystems in Region 3 at the time of site screening complicates site selection. During the screening, manyof the P&T systems transitioned from pre-operational to operational systems. Specifically, at the timeof the screening, AIW Frank, Butz Landfill, and Greenwood Chemical were considered pre-operational.
After these transitioning systems, Croydon TCE, Hellertown Manufacturing, and Raymark representedthe next largest estimated life-cycle cost savings based on the screening methodology employed for theproject. Croydon TCE was eliminated from consideration as it represented a conflict of interest formany of the RSE team members. Hellertown Manufacturing, although scheduled for transition to theresponsible parties in late 2001, was still recommended for an RSE based on the support of Region 3. Finally, the selection of Raymark was encouraged by the Remedial Project Manager. Thus, HellertownManufacturing and Raymark are both selected for RSEs in Region 3.

Nationwide Superfund Reform Initiative
Phase 1 -- Data Collection and System Screening, Region 3
Number of systems 12Number that are EPA lead 12 of 12Number that are State lead 0 of 12
Number that are operational 10Number that are pre-operational 2Number where restoration is a goal 12 of 12Number where the plume is controlled* 5 of 10Number that are estimated to be more than 80% complete* 0 of 10Number previously evaluated and effectiveness found sufficient* 4 of 10Number previously evaluated and effectiveness found not sufficient* 1 of 10
Number where NAPLs are observed 1 of 12Number with more than 1 major contaminant identified 12 of 12Number with 3 or more treatment processes 5 of 12
Average estimated annual O&M cost (including monitoring) $298,634Average estimated annual monitoring cost $102,442Average number of years until turnover to the States 7.6Average number of years until completion 20.0
*Operational sites only
Data reflect estimates provided by site Remedial Project Managers between February and May 2001. These estimates may, in some cases, vary from actuality. Data-- including the number, status, cost, projections, and specifications of systems-- may change overtime.
Extent of Contamination
Average Costs and Time Frames
Region 3, Table 1 -- SummaryJuly 3, 2001
System Status
Operational and Pre-operational Fund-lead P&T Systems
Completed Fund-lead P&T Systems
Region 3 Fund-lead, P&T systems Data provided by the site RPMs

Nationwide Superfund Reform Initiative
Phase 1 -- Data Collection and System Screening, Region 3
SystemEstimated
Annual Cost LeadType of
RODSystem Status System Goals
Plume Under Control?
Estimated Progress of Restoration
Previous Evaluation of Effectiveness
AIW Frank/Mid-County Mustang Site, OU#1
$180,000 EPA Final Operational Restoration Unknown Unknown Sufficient
Berks Sand Pit $150,000 EPA Final Operational Restoration Yes 20% - 80% Sufficient
Butz Landfill $250,000 EPA Final Operational Restoration Unknown less than 20% Not evaluated
Croydon TCE $200,000 EPA Final OperationalContainment &
RestorationYes less than 20% Sufficient
CryoChem $125,000 EPA Final OperationalContainment &
RestorationYes Unknown Sufficient
Greenwood Chemical Site
$400,000 EPA Interim OperationalContainment &
RestorationControl is not a goal
Unknown Not evaluated
Havertown PCP OU2 $1,000,000 EPA InterimBeing
InstalledContainment &
RestorationN/A N/A Not evaluated
Hellertown Manufacturing $350,000 EPA Final OperationalContainment &
RestorationYes Unknown Not Sufficient
North Penn Area 1 $100,000 EPA Final OperationalContainment &
RestorationUnknown Unknown Not evaluated
Notes:
3. Previous evaluations of effectiveness may include 5-year reviews but do not include Remediation Systems Evaluations.
Region 3, Table 2 -- System OverviewsJuly 3, 2001
Data reflect estimates provided by site Remedial Project Managers between February and May 2001. These estimates may, in some cases, vary from actuality. Data-- including the number, status, cost, projections, and specifications of systems-- may change overtime.
1. Havertown PCP and North Penn Area 6 are pre-operational; therefore, the associated data are estimates and some items are unknown.2. "Estimated Progress of Restoration" refers to the estimated portion of the plume that has been restored to cleanup levels.
Region 3 Fund-lead, P&T systems Data provided by the site RPMs

Nationwide Superfund Reform Initiative
Phase 1 -- Data Collection and System Screening, Region 3
SystemEstimated
Annual Cost LeadType of
RODSystem Status System Goals
Plume Under Control?
Estimated Progress of Restoration
Previous Evaluation of Effectiveness
North Penn Area 6 $592,900 EPA Final DesignContainment &
RestorationN/A N/A Not evaluated
Raymark $155,711 EPA Final OperationalContainment &
RestorationUnknown Unknown Not evaluated
Saunders Supply Company
$80,000 EPA Final OperationalContainment &
RestorationYes Unknown Not evaluated
Notes:
3. Previous evaluations of effectiveness may include 5-year reviews but do not include Remediation Systems Evaluations.
Region 3, Table 2 -- System OverviewsJuly 3, 2001
2. "Estimated Progress of Restoration" refers to the estimated portion of the plume that has been restored to cleanup levels.
Data reflect estimates provided by site Remedial Project Managers between February and May 2001. These estimates may, in some cases, vary from actuality. Data-- including the number, status, cost, projections, and specifications of systems-- may change overtime.
1. Havertown PCP and North Penn Area 6 are pre-operational; therefore, the associated data are estimates and some items are unknown.
Region 3 Fund-lead, P&T systems Data provided by the site RPMs

Nationwide Superfund Reform Initiative
Phase 1 -- Data Collection and System Screening, Region 3
System Original RODLast ROD
ModificationConstruction Completed
Operational and Functional
Turnover to State
Years Until Turnover
Expected Completion
Years Until Completion
AIW Frank/Mid-County Mustang Site, OU#1
9/29/95 11/2000 9/2001 9/2011 10.2 9/2031 30.2
Berks Sand Pit 9/29/88 2/2/94 2/1995 2/1995 2/2005 3.6 2/2003 1.6
Butz Landfill 6/30/92 8/27/99 4/2001 4/2001 4/2011 9.8 4/2031 29.8
Croydon TCE 6/29/90 3/1995 3/1995 3/2005 3.7 3/2025 23.7
CryoChem 9/30/91 2/1998 6/1998 6/2008 6.9 6/2010 8.9
Greenwood Chemical Site
12/30/90 11/2000 11/2001 11/2011 10.3 11/2020 19.3
Havertown PCP OU2 9/30/91 5/2001 4/2002 4/2012 10.8 4/2033 31.8
Hellertown Manufacturing 9/3/91 9/1996 3/1996 9/2006 5.2 9/2026 25.2
North Penn Area 1 9/30/94 9/24/98 7/1998 9/1998 9/2008 7.2 9/2018 17.2
North Penn Area 6 8/10/00 9/2002 6/2003 6/2013 11.9 6/2033 31.9
Raymark 9/28/90 1/1994 6/1995 1/2004 2.5 1/2014 12.5
Saunders Supply Company
9/27/96 4/1998 5/1999 5/2009 7.8 4/2008 6.8
Region 3, Table 3 -- P&T System Histories and Projections
Date
July 3, 2001
Data reflect estimates provided by site Remedial Project Managers between February and May 2001. These estimates may, in some cases, vary from actuality. Data-- including the number, status, cost, projections, and specifications of systems-- may change overtime.
Region 3 Fund-lead, P&T systems Data provided by the site RPMs

Nationwide Superfund Reform Initiative
Phase 1 -- Data Collection and System Screening, Region 3
RPM State Regulator Primary Contractor
1 Charlie Root Ragesh Patel Neil Teamerson
EPA Region 3Pennsylvania Department of Environmental Protection
TetraTech NUS
1650 Arch Street (3HS21) Lee Park, Suite 6010 555 North Lane 600 Clark Avenue, Suite 3Philadelphia, PA 19103 Conshohocken, PA 19428 King of Prussia, PA 19406215-814-3193 610-832-6161 610-491-9688215-814-3002 (fax) 610-832-6260 (fax) 610-491-9645 (fax)[email protected] [email protected] [email protected]
2 Bruce Rundell Elise Juers Ed KashdanEPA Region 3 PADEP Gannett Fleming1650 Arch Street 909 Elmerton Av. PO Box 80794Philadephia, PA 19103-2087 Harrisburg, PA 17110-8200 Valley Forge, PA 19484215-814-3317 717-705-4852 610-650-8101215-814-3015 (fax) 717-705-4830 (fax) 610-650-8190 (fax)[email protected] [email protected] [email protected]
3 Rom Roman PADEP Paul Panek Charles HuvalEPA Region 3 PADEP Koester Environmental Services1650 Arch Street 4530 Bath Pike 14649 Highway 41 NPhiladelphia, PA 19103-2087 Bethlehem, PA 18017 Evansville, IN 47725215-814-3212 610-861-2070 812-483-4516215-814-3015 (fax) 610-861-2072 (fax)[email protected] [email protected]
4 Cesar Lee Ewald Dave Harish MitalEPA Region 3 PADEP Tetra Tech, Inc.1650 Arch St Lee Park, Suite 6010 Plaza 273, 56 West Main StreetPhiladelphia, PA 19103 Conshohocken, PA 19428 Christiana, DE 19702215-814-3205 610-832-6200 302-738-7551215-814-3205 (fax) 610-832-5950 (fax) 302-454-5988 (fax)[email protected] [email protected] [email protected]
Region 3, Table 4 -- System Contact InformationJuly 3, 2001
System
AIW Frank/Mid-County Mustang Site, OU#1
Berks Sand Pit
Butz Landfill
Croydon TCE
Region 3 Fund-lead, P&T Systems Information provided by site RPMs

Nationwide Superfund Reform Initiative
Phase 1 -- Data Collection and System Screening, Region 3
RPM State Regulator Primary Contractor
Region 3, Table 4 -- System Contact InformationJuly 3, 2001
System
5 Joseph McDowell Rich Morgan Don KochEPA Region 3 PADEP ETA1650 Arch Street 909 Elmerton Ave 9115 Guilford Road Suite 100Phila, PA 19103 Harrisburg, PA 17110 Columbia, MD 21046215-814-3192 610-916-0122 410-461-9920215-814-3002 (fax) 610-916-0100 (fax) 410-750-8565 (fax)[email protected] [email protected] [email protected]
6 Philip Rotstein Berry Wright Jeff WatersEPA Region 3 Department of Environmental Quality CH2M Hill1650 Arch Street 629 E. Main Street 1700 Market Street, Suite 1600Philadelphia, PA 19103 Richmond, VA 23219 Philadelphia, PA 19103215-814-3232 804-698-4012 215-563-4220215-814-3002 (fax) 804-698-4234 (fax) 215-563-3828 (fax)[email protected] [email protected] [email protected]
7 Gregory Ham April Flipse Lori Stoll
EPA Region 3Pennsylvania Dept. of Environmental Protection
URS Corporation
1650 Arch Street (3HS21) 555 North Lane, Suite 6010 200 Orchard Ridge Drive, Suite 101Philadelphia, PA 19103-2029 Conshohocken, PA 19428 Gaithersburg, MD 20878-1978215-814-3194 610-832-5937 301-258-9780215-814-3002 (fax) 610-832-6143 (fax) 301-869-2043 (fax)[email protected] [email protected] [email protected]
8 Cesar Lee Meg Mustard Jim RomigEPA Region 3 PADEP CDM Federal Corporation1650 Arch Street 4530 Bath Pike 993 Old Eagle School Road, Suite 408Philadelphia, PA 19103 Bethlehem, PA 18017 Wayne, PA 19087215-814-3205 610-861-2076 610-293-0450215-814-3205 (fax) 610-861-2072 (fax) 610-293-1920 (fax)[email protected] [email protected] [email protected]
Greenwood Chemical Site
Havertown PCP OU2
Hellertown Manufacturing
CryoChem
Region 3 Fund-lead, P&T Systems Information provided by site RPMs

Nationwide Superfund Reform Initiative
Phase 1 -- Data Collection and System Screening, Region 3
RPM State Regulator Primary Contractor
Region 3, Table 4 -- System Contact InformationJuly 3, 2001
System
9 Maria de los A. Garcia April Flipse Policarpio Mijares
EPA Region 3Pennsylvania Department of Environmental Protection
U.S. Army Corps of Engineers
1650 Arch Street Lee Park, Suite 6010 555 North Lane P.O. Box 1715Philadelphia, PA 19103 Conshohocken, PA 19428 Baltimore, PA 21203215-814-3199 610-832-5937 410-962-2782215-814-3002 (fax) 610-832-6143 (fax) 410-962-2318 (fax)[email protected]
# Gregory Ham Robert Zang Ray Lees
EPA Region 3Pennsylvania Dept. of Environmental Protection
It Corporation
1650 Arch Street (3HS21) 555 North Lane, Suite 6010 1220 Ward Avenue, Suite 300Philadelphia, PA 19103-2029 Conshohocken, PA 19428 West Chester, PA 19380-3409215-814-3194 610-832-6152 610-241-5000215-814-3002 (fax) 610-832-6259 (fax) 610-241-5050 (fax)[email protected] [email protected] [email protected]
# Deanna Moultrie David Minsker Andy HoptonEPA Region 3 PADEP CDM Federal Programs1650 Arch Street Lee Park Suite 6010 555 North Lane 993 Old Eagle School RoadPhiladelphia, PA 19103 Conshohocken, PA 19428 Wayne, PA 19083215-814-5125 610-832-6193 610-293-0450215-814-3002 (fax) 610-832-6143 (fax) 610-293-1920 (fax)[email protected] [email protected] [email protected]
# Andrew Palestini Thomas Modena Marc Gutterman
EPA Region 3Virginia Department of Environmental Quality
U.S. Army Corps of Engineers
1650 Arch Street 629 East Main Street 803 Front StreetPhiladelphia, PA 19103 Richmond, VA 23219 Norfolk, VA 23510215-814-3233 804-698-4183 757-441-7669215-814-3002 (fax) 804-698-4500 (fax) 757-441-7478 (fax)[email protected] [email protected] [email protected]
North Penn Area 6
Raymark
Saunders Supply Company
North Penn Area 1
Region 3 Fund-lead, P&T Systems Information provided by site RPMs

Nationwide Superfund Reform Initiative
Phase 1 -- Data Collection and System Screening, Region 3
NAPLS Present?
# of Identified Contam. Contaminants
Treatment Processes
Not present 2 1,1,2,2-Tetrachloroethane Air Stripping Trans 1,2-Dichloroethylene Carbon Adsorption Filtration Off-Gas Treatment
Not present 2 1,1,1-Trichloroethane Air Stripping 1,1-Dichloroethylene (DCE)
Not present 3 Diesel fuel Air Stripping Trichlorobenzene Off-Gas Treatment Vinyl Chloride
Croydon TCE Suspected 4 1,1,2-Trichloroethane Air Stripping 1,1-Dichloroethylene (DCE) Carbon Adsorption
Trichlorethylene (TCE)/Tetrachloroelthylene (PCE) Trichloroethylene (TCE)
CryoChem Don't know 3 1,1,1-Trichloroethane Air Stripping 1,1-Dichloroethane 1,1-Dichloroethylene (DCE)
Don't know 5 1,1-Dichloroethane Metals Precipitation Acetone UV oxidation Arsenic Carbon Adsorption Benzene and Toluene Filtration Naphthalene Acetic Acid, 1,2-Dichloroethane, SVOC
TICs, Dibutyl phthalate, 2,4,6,-TrichlorophenolOff-Gas Treatment
Observed 4 Benzene and Toluene Metals Precipitation
Dioxin (TCDD equivalents) UV oxidation Pentachlorophenol (PCP) Carbon Adsorption Trichloroethylene (TCE) Filtration
Not present 5 Benzene Air Stripping Cis-1,2-dichloroethene Carbon Adsorption TCE and Vinyl chloride Trans 1,2-Dichloroethylene Trichlorethylene (TCE)/Tetrachloroelthylene (PCE)
Berks Sand Pit
Butz Landfill
Region 3, Table 5 -- Top Contaminants Identified by RPMsJuly 3, 2001
System
AIW Frank/Mid-County Mustang Site, OU#1
Data reflect estimates provided by site Remedial Project Managers between February and May 2001. These estimates may, in some cases, vary from actuality. Data-- including the number, status, cost, projections, and specifications of
systems-- may change overtime.
Greenwood Chemical Site
Havertown PCP OU2
Hellertown Manufacturing
Region 3 Fund-lead, P&T system Data provided by site RPMs

Nationwide Superfund Reform Initiative
Phase 1 -- Data Collection and System Screening, Region 3
NAPLS Present?
# of Identified Contam. Contaminants
Treatment Processes
Region 3, Table 5 -- Top Contaminants Identified by RPMsJuly 3, 2001
System
AIW Frank/Mid- Not present 7 1,1,1-Trichloroethane Other/Not Sure 1,1-Dichloroethane 1,1-Dichloroethylene (DCE) Cis-1,2-dichloroethene Trans 1,2-Dichloroethylene Trichlorethylene (TCE)/Tetrachloroelthylene (PCE) Volatile organic compounds (VOCs)
Suspected 3 Carbon tetrachloride Metals Precipitation TCE and Vinyl chloride Air Stripping Trichlorethylene (TCE)/Tetrachloroelthylene (PCE) Off-Gas Treatment
Not present 2 Carbozol Carbon Adsorption Trichlorobenzene Off-Gas Treatment
Suspected 2 Arsenic Metals Precipitation Pentachlorophenol (PCP) Carbon Adsorption
Filtration
North Penn Area 1
North Penn Area 6
Data reflect estimates provided by site Remedial Project Managers between February and May 2001. These estimates may, in some cases, vary from actuality. Data-- including the number, status, cost, projections, and specifications of
systems-- may change overtime.
Raymark
Saunders Supply Company
Region 3 Fund-lead, P&T system Data provided by site RPMs
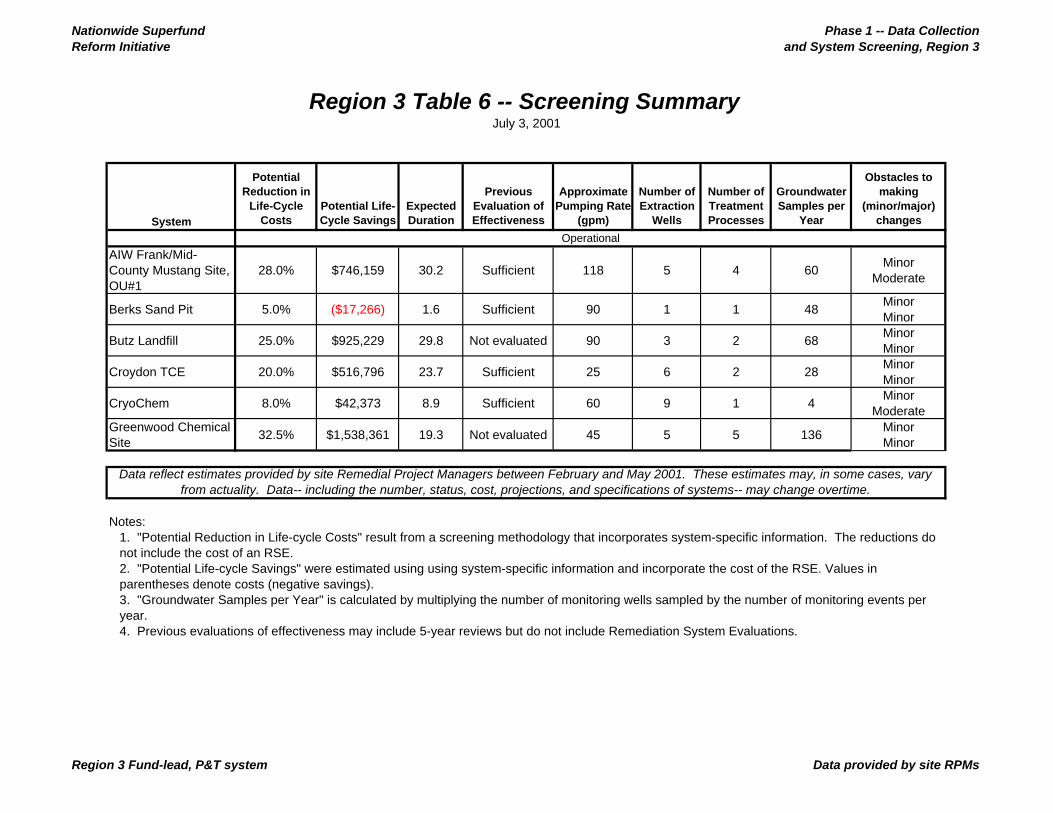
Nationwide Superfund Reform Initiative
Phase 1 -- Data Collection and System Screening, Region 3
System
Potential Reduction in
Life-Cycle Costs
Potential Life-Cycle Savings
Expected Duration
Previous Evaluation of Effectiveness
Approximate Pumping Rate
(gpm)
Number of Extraction
Wells
Number of Treatment Processes
Groundwater Samples per
Year
Obstacles to making
(minor/major) changes
AIW Frank/Mid-County Mustang Site, OU#1
28.0% $746,159 30.2 Sufficient 118 5 4 60Minor
Moderate
Berks Sand Pit 5.0% ($17,266) 1.6 Sufficient 90 1 1 48Minor Minor
Butz Landfill 25.0% $925,229 29.8 Not evaluated 90 3 2 68Minor Minor
Croydon TCE 20.0% $516,796 23.7 Sufficient 25 6 2 28Minor Minor
CryoChem 8.0% $42,373 8.9 Sufficient 60 9 1 4Minor
ModerateGreenwood Chemical Site
32.5% $1,538,361 19.3 Not evaluated 45 5 5 136Minor Minor
Data reflect estimates provided by site Remedial Project Managers between February and May 2001. These estimates may, in some cases, vary from actuality. Data-- including the number, status, cost, projections, and specifications of systems-- may change overtime.
Notes: 1. "Potential Reduction in Life-cycle Costs" result from a screening methodology that incorporates system-specific information. The reductions do not include the cost of an RSE.2. "Potential Life-cycle Savings" were estimated using using system-specific information and incorporate the cost of the RSE. Values in parentheses denote costs (negative savings).3. "Groundwater Samples per Year" is calculated by multiplying the number of monitoring wells sampled by the number of monitoring events per year.4. Previous evaluations of effectiveness may include 5-year reviews but do not include Remediation System Evaluations.
Operational
Region 3 Table 6 -- Screening SummaryJuly 3, 2001
Region 3 Fund-lead, P&T system Data provided by site RPMs

Nationwide Superfund Reform Initiative
Phase 1 -- Data Collection and System Screening, Region 3
System
Potential Reduction in
Life-Cycle Costs
Potential Life-Cycle Savings
Expected Duration
Previous Evaluation of Effectiveness
Approximate Pumping Rate
(gpm)
Number of Extraction
Wells
Number of Treatment Processes
Groundwater Samples per
Year
Obstacles to making
(minor/major) changes
Operational
Region 3 Table 6 -- Screening SummaryJuly 3, 2001
Hellertown Manufacturing
20.5% $979,619 25.2 Not Sufficient 50 1 2 48Minor
Moderate
North Penn Area 1 10.0% $86,353 17.2 Not evaluated 2 1 1 8Minor Minor
Raymark 17.5% $216,640 12.5 Not evaluated 62 2 2 0Minor Minor
Saunders Supply Company
17.0% $46,510 6.8 Not evaluated 2 4 3 40Minor
Severe
Havertown PCP OU2 25.5% $3,894,975 31.8 Not evaluated 45 4 4 30Minor
Moderate
North Penn Area 6 35.5% $3,210,586 31.9 Not evaluated 300 10 3 120Minor
Moderate
4. Previous evaluations of effectiveness may include 5-year reviews but do not include Remediation System Evaluations.
Notes: 1. "Potential Reduction in Life-cycle Costs" result from a screening methodology that incorporates system-specific information. The reductions do not include the cost of an RSE.2. "Potential Life-cycle Savings" were estimated using using system-specific information and incorporate the cost of the RSE. Values in parentheses denote costs (negative savings).3. "Groundwater Samples per Year" is calculated by multiplying the number of monitoring wells sampled by the number of monitoring events per year.
Pre-Operational
Data reflect estimates provided by site Remedial Project Managers between February and May 2001. These estimates may, in some cases, vary from actuality. Data-- including the number, status, cost, projections, and specifications of systems-- may change overtime.
Region 3 Fund-lead, P&T system Data provided by site RPMs
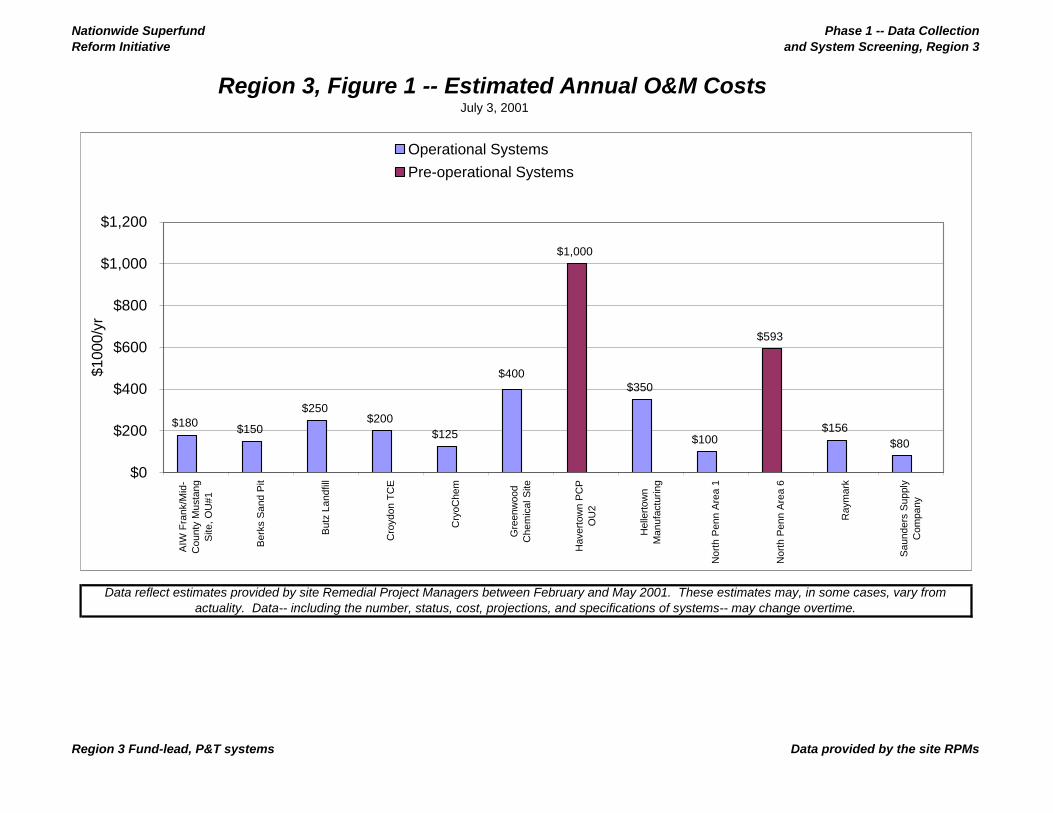
Nationwide Superfund Reform Initiative
Phase 1 -- Data Collection and System Screening, Region 3
Data reflect estimates provided by site Remedial Project Managers between February and May 2001. These estimates may, in some cases, vary from actuality. Data-- including the number, status, cost, projections, and specifications of systems-- may change overtime.
Region 3, Figure 1 -- Estimated Annual O&M CostsJuly 3, 2001
$180 $150
$250$200
$125
$1,000
$350
$100
$593
$156$80
$400
$0
$200
$400
$600
$800
$1,000
$1,200
AIW
Fra
nk/M
id-
Cou
nty
Mus
tang
Site
, OU
#1
Ber
ks S
and
Pit
But
z La
ndfil
l
Cro
ydon
TC
E
Cry
oChe
m
Gre
enw
ood
Che
mic
al S
ite
Hav
erto
wn
PC
PO
U2
Hel
lert
own
Man
ufac
turin
g
Nor
th P
enn
Are
a 1
Nor
th P
enn
Are
a 6
Ray
mar
k
Sau
nder
s S
uppl
yC
ompa
ny
$100
0/yr
Operational Systems
Pre-operational Systems
Region 3 Fund-lead, P&T systems Data provided by the site RPMs

Nationwide Superfund Reform Initiative
Phase 1 -- Data Collection and System Screening, Region 3
Data reflect estimates provided by site Remedial Project Managers between February and May 2001. These estimates may, in some cases, vary from actuality. Data-- including the number, status, cost, projections, and specifications of systems-- may change overtime.
July 3, 2001
Region 3, Figure 2 -- System Projections
0.0
5.0
10.0
15.0
20.0
25.0
30.0
35.0
40.0
AIW
Fra
nk/M
id-
Cou
nty
Mus
tang
Site
, OU
#1
Ber
ks S
and
Pit
But
z La
ndfil
l
Cro
ydon
TC
E
Cry
oChe
m
Gre
enw
ood
Che
mic
al S
ite
Hav
erto
wn
PC
PO
U2
Hel
lert
own
Man
ufac
turin
g
Nor
th P
enn
Are
a1
Nor
th P
enn
Are
a6 R
aym
ark
Sau
nder
s S
uppl
yC
ompa
ny
year
s
Years Until Turnover
Years Until Completion
2021
2026
2031
2036
2041
2001
2006
2011
2016
Region 3 Fund-lead, P&T systems Data provided by the site RPMs
Nationwide Superfund Reform InitiativePhase 1– Data Collection and System Screening
Region 4July 3, 2001
In the OSWER Directive No. 9200.0-33, Transmittal of Final FY00 - FY01 Superfund ReformsStrategy, dated July 7,2000, the Office of Solid Waste and Emergency Response outlined acommitment to optimize our Fund-lead, pump-and-treat (P&T) systems. To fulfill this commitment,Headquarters is assisting Regions in evaluating their Fund-lead operating P&T systems. Phase 1 of thisinitiative involves identifying all Fund-lead P&T system, collecting baseline cost and performance dataon them, and selecting up to two sites in each Region for a Remediation System Evaluation (RSE).
This report summarizes the screening process for Region 4 that began in July 2000 as part of ademonstration optimization project and was revisited in April and May 2001 as part of a nationwideoptimization project. The Fund-lead P&T systems in Region 4 were identified during the demonstrationproject and baseline information was collected on each system. Two of the identified P&T systemswere selected to receive RSEs and those two systems received their RSEs in 2000. This reportincludes information collected during the demonstration project as well as additional informationcollected during the nationwide project conducted in 2001. Where applicable, system informationcollected in 2000 has been updated by system information collected in 2001.
The data presented in this report reflect estimates updated by the site Remedial ProjectManagers between April and May 2001. These estimates may vary from actuality. The data–
including the number, status, cost, specifications, and projections of systems– may changeover time.
The first section of this report presents the cost and performance data for the Region while the seconddescribes the screening process and system selection.
Cost and Performance Data
Ten Fund-lead P&T systems were identified in Region 4. Of this ten, seven are operational and threeare pre-operational (i.e., pre-design, design, being installed, or installed but not operating). In addition,two Fund-lead P&T systems have been identified that have been transferred to the responsible partiesand an additional Fund-lead P&T system is no longer operating.
Data collection is incomplete for the following three systems in Region 4 for the following reasons:
• EPA is currently in litigation with the system contractor for ABC Cleaners and details of thesystem could not be discussed.

July 3, 2001 Nationwide Superfund Reform InitiativePhase 1– Data Collection and Site Screening, Region 4
Page 2 of 4
• There is no Remedial Project Manager for the Miami Drum site. EPA provides funding to thelocal government for water supply but does not provide oversight.
• P&T is specified in the Record of Decision for Coleman Evans but that technology will likelynot be used.
Cost and performance data and other information pertaining to the remaining identified Fund-lead P&Tsystems (estimates for the pre-operational systems) were collected with a web-based questionnaireaccessed from http://www.cluin.org/optimization or from phone interviews and were stored in adatabase. This information is summarized in Table 1 and provided in detail in five additional tables:
• Table 2 provides overviews of the systems by providing items such as annual costs, lead,status, goals, and progress of each system.
• Table 3 includes the dates marking the signing of the ROD, construction completion,
system operation and function, turnover to the state, and expected close-out.
• Table 4 lists for each system the contact information for the site Remedial ProjectManager, the State Regulator, and the Contractor.
• Table 5 notes for each system and the associated site if NAPLs are present, the topcontaminants of concern, and the above-ground treatment processes.
• Table 6 lists system specifications such as the pumping rate, number of wells, number ofmonitoring events per year, and other items used to determine the complexity of a systemand its potential for optimization.
Projected dates for turnover to the States and for system completion are depicted in Figure 1, andannual costs for each system are depicted in Figure 2.
RSE Site Selection
Evaluation of Sites for Optimization Potential
Once the information is gathered from each of the Fund-lead P&T systems in a given Region, itbecomes input for a screening methodology that attempts to determine the optimization potential foreach system. This, in turn, provides a basis for selecting two systems where RSEs will be performed. Because some Regions do not have two Fund-lead P&T systems, the allotted but unused RSEs forthose Regions are allocated to other Regions.
July 3, 2001 Nationwide Superfund Reform InitiativePhase 1– Data Collection and Site Screening, Region 4
Page 3 of 4
The factors affecting the optimization potential of a system are
• the overall cost of a given system, • the expected duration of the system, • the number of above-ground treatment processes, • the number of extraction wells,• the number of monitoring events per year,• the system downtime per year,• the pumping rate,• the results (if any) of a previous performance and effectiveness evaluation, and• any social or political obstacles to implementing modifications to the system.
Table 6 summarizes the results of the screening process including the estimated life-cycle cost savingsthat may result from performing an RSE.
Selecting Sites for RSEs
The following is a list of the identified Fund-lead P&T systems in Region 4 classified as operational,pre-operational, transferred to responsible parties, and no-longer operating. Those in bold wereselected for RSEs.
OperationalABC CleanersAmerican Creosote (current)BenfieldElmore Waste DisposalFCX StatesvilleMiami DrumPalmetto Wood
Pre-OperationalAmerican Creosote (future)Cape Fear Wood PreservingColeman Evans
Transferred to Responsible PartiesDistler’s BrickyardDistler’s Farm
No Longer OperatingHollingsworth Solderless Terminals

July 3, 2001 Nationwide Superfund Reform InitiativePhase 1– Data Collection and Site Screening, Region 4
Page 4 of 4
Elmore Waste Disposal and FCX Statesville were selected for RSEs during the demonstration projectbased on the interest of the Remedial Project Managers and estimated potential savings as determinedby screening calculations.

Nationwide Superfund Reform Initiative
Phase 1 -- Data Collection and System Screening, Region 4
Number of systems 10Number that are EPA lead 9 of 10Number that are State lead 1 of 10
Number that are operational 7Number that are pre-operational 3Number where restoration is a goal 9 of 10Number where the plume is controlled* 1 of 7Number that are estimated to be more than 80% complete* 0 of 7Number previously evaluated and effectiveness found sufficient* 3 of 7Number previously evaluated and effectiveness found not sufficient* 0 of 7
Number where NAPLs are observed 4 of 10Number with more than 1 major contaminant identified 7 of 10Number with 3 or more treatment processes 1 of 10
Average estimated annual O&M cost (including monitoring) $306,500Average estimated annual monitoring cost $12,300Average number of years until turnover to the States 7.2Average number of years until completion 10.0
*Operational sites only
Hollingsworth Solderless Terminals
Data reflect estimates provided by site Remedial Project Managers between February and May 2001. These estimates may, in some cases, vary from actuality. Data-- including the number, status, cost, projections, and specifications of systems-- may change overtime.
No-Longer-Operating Fund-lead P&T Systems
Extent of Contamination
Average Costs and Time Frames
Region 4, Table 1 -- SummaryJuly 3, 2001
System Status
Operational and Pre-operational Fund-lead P&T Systems
Completed Fund-lead P&T Systems
Region 4 Fund-lead, P&T systems Data provided by the site RPMs

Nationwide Superfund Reform Initiative
Phase 1 -- Data Collection and System Screening, Region 4
SystemEstimated
Annual Cost LeadType of
RODSystem Status System Goals
Plume Under Control?
Estimated Progress of Restoration
Previous Evaluation of Effectiveness
ABC Cleaners Unknown EPA Final Operational Restoration N/A N/A N/A
American Creosote Works (DNAPL)
$300,000 EPA Final Operational Restoration No less than 20% Not evaluated
American Creosote Works (solute)
$452,000 EPA Final PredesignContainment &
RestorationN/A N/A Not evaluated
Benfield Industries $30,000 EPA Final OperationalContainment &
RestorationUnknown less than 20% Not evaluated
Cape Fear Wood Preserving
$40,000 EPA FinalDesigned/
Not InstalledContainment &
RestorationN/A N/A Not evaluated
Coleman Evans Wood Preserving
Unknown EPA Interim Predesign Restoration N/A N/A Not evaluated
Elmore Waste Disposal $180,000 EPA Final OperationalContainment &
RestorationUnknown Unknown Sufficient
FCX Statesville $150,000 EPA Final OperationalContainment &
RestorationUnknown less than 20% Sufficient
Miami Drum $1,000,000 State with
Fund MoneyFinal Operational Water supply N/A N/A N/A
Palmetto Wood $300,000 EPA Final OperationalContainment &
RestorationYes 20% - 80% Sufficient
Notes:
3. Previous evaluations of effectiveness may include 5-year reviews but do not include Remediation Systems Evaluations.
Region 4, Table 2 -- System OverviewsJuly 3, 2001
Data reflect estimates provided by site Remedial Project Managers between February and May 2001. These estimates may, in some cases, vary from actuality. Data-- including the number, status, cost, projections, and specifications of systems-- may change overtime.
2. "Estimated Progress of Restoration" refers to the estimated portion of the plume that has been restored to cleanup levels.
1. American Creosote Works (solute), Cape Fear Wood Preserving, and Coleman Evans Wood Preserving are pre-operational systems; therefore, the reported data are estimates and some information is unknown.
Region 4 Fund-lead, P&T systems Data provided by the site RPMs

Nationwide Superfund Reform Initiative
Phase 1 -- Data Collection and System Screening, Region 4
System Original RODLast ROD
ModificationConstruction Completed
Operational and Functional
Turnover to State
Years Until Turnover
Expected Completion
Years Until Completion
ABC Cleaners 1/26/93
American Creosote Works (DNAPL)
2/3/94 9/1998 9/1998 5/2003 1.8 5/2003 1.8
American Creosote Works (solute)
2/3/94 9/2004 9/2004 9/2014 13.2 9/2009 8.2
Benfield Industries 7/31/92 4/2001 5/2001 5/2011 9.8 5/2021 19.8
Cape Fear Wood Preserving
6/30/89 3/23/01 9/2001 9/2002 10/2011 10.3 12/2009 8.4
Coleman Evans Wood Preserving
9/25/86 9/25/97
Elmore Waste Disposal 4/26/93 9/1998 9/1998 9/2008 7.2 9/2018 17.2
FCX Statesville 9/27/93 9/30/96 5/1998 5/2008 6.8 5/2008 6.8
Miami Drum 1/0/00 9/1992 9/1992 9/2002 1.2
Palmetto Wood 9/30/87 8/4/93 5/1997 1/1998 5/2008 6.8 5/2008 6.8
Region 4, Table 3 -- P&T System Histories and Projections
Date
July 3, 2001
Data reflect estimates provided by site Remedial Project Managers between February and May 2001. These estimates may, in some cases, vary from actuality. Data-- including the number, status, cost, projections, and specifications of systems-- may change overtime.
Region 4 Fund-lead, P&T systems Data provided by the site RPMs

Nationwide Superfund Reform Initiative
Phase 1 -- Data Collection and System Screening, Region 4
RPM State Regulator Primary Contractor
1 Luis Flores Nile TestermanEPA Region 4 NCDENR61 Forsyth Street, SW 401 Oberlin RoadAtlanta, GA 30303-8960 Raleigh, NC 27605404-562-8807 919-733-2801 (fax) 919-733-4811 (fax)[email protected] [email protected]
2 Mark Fite John Sykes Joe FindleyEPA Region 4 FDEP USACE, Mobile District61 Forsyth Street, SWAtlanta, GA 30303-8960 FL Mobile, AL 404-562-8927 850-488-019 334-694-4012 (fax) 850-488-0190 (fax)[email protected]
3 Mark Fite John Sykes Joe FindleyEPA Region 4 FDEP USACE, Mobile District61 Forsyth Street, SWAtlanta, GA 30303-8960 FL Mobile, AL 404-562-8927 850-488-0190 334-694-4012 (fax) 850-488-0190 (fax)[email protected]
4 Jon Bornholm Nile Testerman Chris LeggettEPA Region 4 NCDENR CMC61 Forsyth Street, SW 401 Oberlin RoadAtlanta, GA 30303-8960 Raleigh, NC 27605 Newport, TN 404-562-8820 919-733-2801 423-625-0557 (fax) 919-733-4811 (fax)[email protected] [email protected]
Region 4, Table 4 -- System Contact InformationJuly 3, 2001
System
ABC Cleaners
American Creosote Works (DNAPL)
American Creosote Works (solute)
Benfield Industries
Region 4 Fund-lead, P&T Systems Information provided by site RPMs

Nationwide Superfund Reform Initiative
Phase 1 -- Data Collection and System Screening, Region 4
RPM State Regulator Primary Contractor
Region 4, Table 4 -- System Contact InformationJuly 3, 2001
System
5 Jon Bornholm Nile Testerman Ed HicksEPA Region 4 NCDENR Black & Veatch61 Forsyth Street, SW 401 Oberlin Road 1145 Sanctuary Parkway, Suite 475Atlanta, GA 30303-3104 Raleigh, NC 27605 Alpharetta, GA 30004404-562-8820 919-733-2901 770-521-8141404-562-8788 (fax) 919-733-4811 (fax) 770-751-8322 (fax)[email protected] [email protected] [email protected]
6 Randall Chaffins John Sykes Todd TrulockEPA Region 4 FDEP USACE, Jacksonville District61 Forsyth Street, SWAtlanta, GA 30303-8960 FL Jacksonville, FL 404-562-8929 850-413-0066 904-232-1110
850-488-0190 (fax)[email protected]
7 Ralph Howard Lucas Berresford Ed HicksEPA Region 4 SCDHEC Black and Veatch61 Forsyth Street, SW 21 Bull StreetAtlanta, GA 30303-8960 Columbia, SC 29201 Atlanta, GA 404-562-8829 770-751-7517
8 Ken Mallory Nile Testerman Ralph McKeenEPA Region 4 NCDENR Roy F. Weston61 Forsyth Street, SW 401 Oberlin RoadAtlanta, GA 30303-8960 Raleigh, NC 27605 Atlanta, GA 404-562-8802 919-733-2801 770-263-5438
919-733-4811 (fax)[email protected] [email protected]
Coleman Evans Wood Preserving
Elmore Waste Disposal
FCX Statesville
Cape Fear Wood Preserving
Region 4 Fund-lead, P&T Systems Information provided by site RPMs

Nationwide Superfund Reform Initiative
Phase 1 -- Data Collection and System Screening, Region 4
RPM State Regulator Primary Contractor
Region 4, Table 4 -- System Contact InformationJuly 3, 2001
System
9 Jim McGuire EPA Region 461 Forsyth Street, SWAtlanta, GA 30303-8960404-562-8911
# Al Cherry Keisha Long Tim EggertEPA Region 4 SCDH CDM61 Forsyth Street, SW 21 Bull Street 2030 Powers Ferry Road, Suite 325Atlanta, GA 30303-8960 Columbia, SC 29201 Atlanta, GA 30339404-562-8807 803-896-4073 678-202-8912
770-951-8910 (fax)[email protected] [email protected]
Palmetto Wood
Miami Drum
Region 4 Fund-lead, P&T Systems Information provided by site RPMs

Nationwide Superfund Reform Initiative
Phase 1 -- Data Collection and System Screening, Region 4
NAPLS Present?
# of Identified Contam. Contaminants
Treatment Processes
ABC Cleaners Not present 3 1,1-Dichloroethylene (DCE) Air Stripping Trichlorethylene (TCE)/Tetrachloroelthylene (PCE) Filtration vinyl chloride
Observed 7 Acenaphthene Carbon Adsorption Benzene Filtration Dibenzofuran Other/Not Sure Fluoranthene Naphthalene Pentachlorophenol (PCP) carcinogenic PAHs
Observed 7 Acenaphthene Biological Benzene Carbon Adsorption Dibenzofuran Fluoranthene Naphthalene Pentachlorophenol (PCP) carcinogenic PAHs
Benfield Industries Not present 1 Creosote and petroleum hydrocarbons Other/Not Sure
Observed 5 Benzene Carbon Adsorption Benzo(a)anthracene Benzo(a)pyrene Benzo(b)fluoranthene Benzo(g,h,i)perylene
Observed 2 Dioxin Pentachlorophenol (PCP)
Don't know 2 Trichlorethylene (TCE)/Tetrachloroelthylene (PCE) Carbon Adsorption Volatile organic compounds (VOCs) Other/Not Sure
Don't know 3 Pesticides Carbon Adsorption Volatile organic compounds (VOCs) Filtration PCE
Miami Drum Not present 1 Trichloroethylene (TCE) Air StrippingPalmetto Wood Not present 1 Chromium Other/Not Sure
Data reflect estimates provided by site Remedial Project Managers between February and May 2001. These estimates may, in some cases, vary from actuality. Data-- including the number, status, cost, projections, and specifications of
systems-- may change overtime.
FCX Statesville
Region 4, Table 5 -- Top Contaminants Identified by RPMsJuly 3, 2001
System
American Creosote Works (DNAPL)
American Creosote Works (solute)
Cape Fear Wood Preserving
Coleman Evans Wood PreservingElmore Waste Disposal
Region 4 Fund-lead, P&T system Data provided by site RPMs

Nationwide Superfund Reform Initiative
Phase 1 -- Data Collection and System Screening, Region 4
System
Potential Reduction in
Life-Cycle Costs
Potential Life-Cycle Savings
Expected Duration
Previous Evaluation of Effectiveness
Approximate Pumping
Rate (gpm)
Number of Extraction
Wells
Number of Treatment Processes
Groundwater Samples per
Year
Obstacles to making
(minor/major) changes
ABC Cleaners unknown unknown N/A 2 N/A
American Creosote Works (DNAPL)
7.5% $3,248 1.8 Not evaluated 0.1 8 3 8Minor Minor
Benfield Industries 15.0% $29,974 19.8 Not evaluated 16 2 1 32Minor Minor
Elmore Waste Disposal
20.0% $375,872 17.2 Sufficient 30 9 2 68Minor Minor
FCX Statesville 20.0% $134,513 6.8 Sufficient 20 10 2 72Minor Minor
Miami Drum unknown unknown N/A 104000 40 1 N/A
Palmetto Wood 18.0% $262,124 6.8 Sufficient 130 10 1 16Minor
Moderate
American Creosote Works (solute)
17.5% $468,926 8.2 Not evaluated 105 3 2 20Minor Minor
Cape Fear Wood Preserving
22.5% $32,696 8.4 Not evaluated 43 7 1 100Minor
ModerateColeman Evans Wood Preserving
unknown unknown Not evaluated N/A
4. Previous evaluations of effectiveness may include 5-year reviews but do not include Remediation System Evaluations.
Notes: 1. "Potential Reduction in Life-cycle Costs" result from a screening methodology that incorporates system-specific information. The reductions do not include the cost of an RSE.2. "Potential Life-cycle Savings" were estimated using using system-specific information and incorporate the cost of the RSE. Values in parentheses denote costs (negative savings).3. "Groundwater Samples per Year" is calculated by multiplying the number of monitoring wells sampled by the number of monitoring events per year.
Data reflect estimates provided by site Remedial Project Managers between February and May 2001. These estimates may, in some cases, vary from actuality. Data-- including the number, status, cost, projections, and specifications of systems-- may change overtime.
Operational
Region 4, Table 6 -- Screening SummaryJuly 3, 2001
Pre-Operational
Region 4 Fund-lead, P&T system Data provided by site RPMs

Nationwide Superfund Reform Initiative
Phase 1 -- Data Collection and System Screening, Region 4
Data reflect estimates provided by site Remedial Project Managers between February and May 2001. These estimates may, in some cases, vary from actuality. Data-- including the number, status, cost, projections, and specifications of systems-- may change overtime.
July 3, 2001
Region 4, Figure 1 -- Estimated Annual Costs of Systems
$300
$452
$30 $40
$180$150
$1,000
$300
unknown unknown $0
$100
$200
$300
$400
$500
$600
$700
$800
$900
$1,000A
BC
Cle
aner
s
Am
eric
an C
reos
ote
Wor
ks (
DN
AP
L)
Am
eric
an C
reos
ote
Wor
ks (
solu
te)
Ben
field
Indu
strie
s
Cap
e F
ear
Woo
dP
rese
rvin
g
Col
eman
Eva
nsW
ood
Pre
serv
ing
Elm
ore
Was
teD
ispo
sal
FC
X S
tate
svill
e
Mia
mi D
rum
Pal
met
to W
ood
$100
0/yr
Operational Systems
Pre-operational Systems
Region 4 Fund-lead, P&T systems Data provided by the site RPMs

Nationwide Superfund Reform Initiative
Phase 1 -- Data Collection and System Screening, Region 4
Data reflect estimates provided by site Remedial Project Managers between February and May 2001. These estimates may, in some cases, vary from actuality. Data-- including the number, status, cost, projections, and specifications of systems-- may change overtime.
July 3, 2001
Region 4, Figure 2 -- System Projections
0.0
5.0
10.0
15.0
20.0
25.0
30.0
35.0
40.0
AB
C C
lean
ers
Am
eric
anC
reos
ote
Wor
ks(D
NA
PL)
Am
eric
anC
reos
ote
Wor
ks(s
olut
e)
Ben
field
Indu
strie
s
Cap
e F
ear
Woo
dP
rese
rvin
g
Col
eman
Eva
nsW
ood
Pre
serv
ing
Elm
ore
Was
teD
ispo
sal
FC
X S
tate
svill
e
Mia
mi D
rum
Pal
met
to W
ood
year
s
Years Until Turnover
Years Until Completion
2021
2026
2031
2036
2041
2001
2006
2011
2016
Region 4 Fund-lead, P&T systems Data provided by the site RPMs

Nationwide Superfund Reform InitiativePhase 1– Data Collection and System Screening
Region 5July 3, 2001
In the OSWER Directive No. 9200.0-33, Transmittal of Final FY00 - FY01 Superfund ReformsStrategy, dated July 7,2000, the Office of Solid Waste and Emergency Response outlined acommitment to optimize our Fund-lead, pump-and-treat (P&T) systems. To fulfill this commitment,Headquarters is assisting Regions in evaluating their Fund-lead operating P&T systems. Phase 1 of thisinitiative involves identifying all Fund-lead P&T system, collecting baseline cost and performance dataon them, and selecting up to two sites in each Region for a Remediation System Evaluation (RSE).
This report summarizes the screening process for Region 5 which began in April 2000 as part of ademonstration optimization project and was revisited in April and May 2001 as part of a nationwideoptimization project. The Fund-lead P&T systems in Region 5 were identified during the demonstrationproject and baseline information was collected on each system. Two of the identified P&T systemswere selected to receive RSEs and those two systems received their evaluations in 2000. This reportincludes information collected during the demonstration project as well as additional informationcollected during the nationwide project conducted in 2001. Where applicable, system informationcollected in 2000 has been updated by system information collected in 2001.
The first section of this report presents the cost and performance data for the Region while the seconddescribes the screening process and system selection.
The data presented in this report reflect estimates provided by the site Remedial ProjectManagers between January and May 2001. These estimates may vary from actuality. Thedata– including the number, status, cost, specifications, and projections of systems– may
change over time.
Cost and Performance Data
Fifteen Fund-lead P&T systems were identified in Region 5. Of this fifteen, twelve are operational andthree are pre-operational (i.e., pre-design, design, being installed, or installed but not operating). Inaddition, two previous Fund-lead P&T systems have been transferred to the relevant states and anotherhas been transferred to the responsible party.
Cost and performance data and other information pertaining to the identified Fund-lead P&T systems(estimates for the pre-operational systems) were collected during phone interviews with the RemedialProject Managers (RPMs) and were stored in a database. All RPMs were successfully contactedexcept for those associated with Eau Claire Well Field and Duell and Gardner. For these two systems,
July 3, 2001 Nationwide Superfund Reform InitiativePhase 1– Data Collection and Site Screening, Region 5
Page 2 of 4
information was obtained from the site Record of Decisions, fact sheets, and notes from previousinterviews during the demonstration project. The collected information for all Fund-lead P&T systemsin Region 5 is summarized in Table 1 and provided in detail in five additional tables:
• Table 2 provides overviews of the systems by providing items such as annual costs, lead,status, goals, and progress of each system.
• Table 3 includes the dates marking the signing of the ROD, construction completion,
system operation and function, turnover to the state, and expected close-out.
• Table 4 lists for each system the contact information for the site Remedial ProjectManager, the State Regulator, and the Contractor.
• Table 5 notes for each system and the associated site if NAPLs are present, the topcontaminants of concern, and the above-ground treatment processes.
• Table 6 lists system specifications such as the pumping rate, number of wells, number ofmonitoring events per year, and other items used to determine the complexity of a systemand its potential for optimization.
Projected dates for turnover to the States and for system completion are depicted in Figure 1, andannual costs for each system are depicted in Figure 2.
RSE Site Selection
Evaluation of Sites for Optimization Potential
Once the information is gathered from each of the Fund-lead P&T systems in a given Region, itbecomes input for a screening methodology that attempts to determine the optimization potential foreach system. This, in turn, provides a basis for selecting two systems where RSEs will be performed. Because some Regions do not have two Fund-lead P&T systems, the allotted but unused RSEs forthose Regions are allocated to other Regions.
The factors affecting the optimization potential of a system are
• the overall cost of a given system, • the expected duration of the system, • the number of above-ground treatment processes,

July 3, 2001 Nationwide Superfund Reform InitiativePhase 1– Data Collection and Site Screening, Region 5
Page 3 of 4
• the number of extraction wells,• the number of monitoring events per year,• the system downtime per year,• the pumping rate,• the results (if any) of a previous performance and effectiveness evaluation, and• any social or political obstacles to implementing modifications to the system.
Table 6 summarizes the results of the screening process including the estimated life-cycle cost savingsthat may result from performing an RSE.
Selecting Sites for RSEs
The following is a list of the identified Fund-lead P&T systems in Region 5 classified as operational,pre-operational, transferred to responsible parties, and no-longer operating. Those in bold wereselected for RSEs.
OperationalArrowheadBetter BriteEau ClaireLa SalleLong PrairieMacGillis and GibbsOconomowocOnalaskaOtt/Story/CordovaU.S. AviexVeronaWash King
Pre-OperationalDouglass RoadDuell and GardnerPeerless Plating
Transferred to StatesOld Mill
Perham ArsenicTransferred to Responsible Parties
Bofors Nobel

July 3, 2001 Nationwide Superfund Reform InitiativePhase 1– Data Collection and Site Screening, Region 5
Page 4 of 4
MacGillis and Gibbs and Oconomowoc Electroplating were selected for RSEs during thedemonstration project based on the interest of the Remedial Project Managers and estimated potentialsavings as determined by screening calculations. Ott/Story/Cordova was selected for an RSE as partof the nationwide project based on its high operational costs relative to other Fund-lead P&T systemsand the relatively high potential savings from optimization as indicated by the screening process.

Nationwide Superfund Reform Initiative
Phase 1 -- Data Collection and System Screening, Region 5
Number of systems 15Number that are EPA lead 7 of 15Number that are State lead 7 of 15
Number that are operational 12Number that are pre-operational 3Number where restoration is a goal 14 of 15Number where the plume is controlled* 6 of 12Number that are estimated to be more than 80% complete* 3 of 12Number previously evaluated and effectiveness found sufficient* 7 of 12Number previously evaluated and effectiveness found not sufficient* 0 of 12
Number where NAPLs are observed 3 of 15Number with more than 1 major contaminant identified 13 of 15Number with 3 or more treatment processes 4 of 15
Average estimated annual O&M cost (including monitoring) $378,714Average estimated annual monitoring cost $42,929Average number of years until turnover to the States 5.9Average number of years until completion 15.8
*Operational sites only
Region 5, Table 1 -- SummaryJuly 3, 2001
System Status
Operational and Pre-operational Fund-lead P&T Systems
Completed Fund-lead P&T Systems
Data reflect estimates provided by site Remedial Project Managers between February and May 2001. These estimates may, in some cases, vary from actuality. Data-- including the number, status, cost, projections, and specifications of systems-- may change overtime.
Extent of Contamination
Average Costs and Time Frames
Region 5 Fund-lead, P&T systems Data provided by the site RPMs

Nationwide Superfund Reform Initiative
Phase 1 -- Data Collection and System Screening, Region 5
SystemEstimated
Annual Cost LeadType of
RODSystem Status System Goals
Plume Under Control?
Estimated Progress of Restoration
Previous Evaluation of Effectiveness
Arrowhead Refinery $70,000 State with
Fund MoneyFinal Operational
Containment & Restoration
Yesmore than
80%Sufficient
Better Brite Plating Co. Chrome and Zinc Shops
$36,000 State with
Fund MoneyOperational
Containment & Restoration
Yes less than 20% Sufficient
Douglass Road $120,000 EPA Final InstalledContainment &
RestorationN/A N/A Not evaluated
Duell and Gardner Unknown EPA Interim Installed Restoration N/A N/A Not evaluated
Eau Claire Municipal Well Field
$175,000 State with
Fund MoneyOperational Unknown Unknown Unknown Sufficient
La Salle Electrical Utilities $230,000 State with
Fund MoneyFinal Operational
Containment & Restoration
Yes 20% - 80% Sufficient
Long Prairie $300,000 State with
Fund MoneyFinal Operational Restoration Yes 20% - 80% Not evaluated
MacGillis and Gibbs/Bell Lumber & Pole
$300,000 EPA Final Operational Restoration Unknown less than 20% Not evaluated
Notes:
3. Previous evaluations of effectiveness may include 5-year reviews but do not include Remediation Systems Evaluations.
Region 5, Table 2 -- System OverviewsJuly 3, 2001
Data reflect estimates provided by site Remedial Project Managers between February and May 2001. These estimates may, in some cases, vary from actuality. Data-- including the number, status, cost, projections, and specifications of systems-- may change overtime.
1. Douglass Road, Duell and Gardner, and Peerless Plating are pre-operational systems; therefore, the associated data are estimates and some items are unknown.2. "Estimated Progress of Restoration" refers to the estimated portion of the plume that has been restored to cleanup levels.
Region 5 Fund-lead, P&T systems Data provided by the site RPMs

Nationwide Superfund Reform Initiative
Phase 1 -- Data Collection and System Screening, Region 5
SystemEstimated
Annual Cost LeadType of
RODSystem Status System Goals
Plume Under Control?
Estimated Progress of Restoration
Previous Evaluation of Effectiveness
Region 5, Table 2 -- System OverviewsJuly 3, 2001
Oconomowoc Electroplating
$471,000 EPA Final OperationalContainment &
RestorationUnknown Unknown Sufficient
Onalaska Municipal Landfill
$200,000 EPA Final OperationalContainment &
RestorationYes
more than 80%
Sufficient
Ott/Story/Cordova Chem Co.
$2,400,000 EPA Final OperationalContainment &
RestorationUnknown 20% - 80% Not evaluated
Peerless Plating $400,000 Unknown Final Installed Restoration N/A N/A Sufficient
U.S. Aviex $300,000 State with
Fund MoneyFinal Operational Restoration No 20% - 80% Sufficient
Verona Well Field $225,000 EPA Final OperationalContainment &
RestorationYes
more than 80%
Not evaluated
Wash King Laundry $75,000 State with
Fund MoneyFinal Operational Restoration Unknown less than 20% Not evaluated
Notes:
3. Previous evaluations of effectiveness may include 5-year reviews but do not include Remediation Systems Evaluations.
Data reflect estimates provided by site Remedial Project Managers between February and May 2001. These estimates may, in some cases, vary from actuality. Data-- including the number, status, cost, projections, and specifications of systems-- may change overtime.
1. Douglass Road, Duell and Gardner, and Peerless Plating are pre-operational systems; therefore, the associated data are estimates and some items are unknown.2. "Estimated Progress of Restoration" refers to the estimated portion of the plume that has been restored to cleanup levels.
Region 5 Fund-lead, P&T systems Data provided by the site RPMs

Nationwide Superfund Reform Initiative
Phase 1 -- Data Collection and System Screening, Region 5
System Original RODLast ROD
ModificationConstruction Completed
Operational and Functional
Turnover to State
Years Until Turnover
Expected Completion
Years Until Completion
Arrowhead Refinery 9/30/86 2/9/94 6/1993 7/1993 7/2003 2.0 4/2004 2.7
Better Brite Plating Co. Chrome and Zinc Shops
9/24/96 8/2000 4/1993 6/2006 4.9 4/2030 28.8
Douglass Road 5/3/96 9/2000 7/2001 9/2010 9.2 10/2030 29.3
Duell and Gardner 9/30/93 5/31/01 7/2001 7/2001 7/2011 10.0 7/2007 6.0
Eau Claire Municipal Well Field
3/31/88 8/1/90 6/1987 3/1991 unknown unknown unknown unknown
La Salle Electrical Utilities 8/29/86 3/30/88 2/1998 3/1994 3/2004 2.7 3/2005 3.7
Long Prairie 6/14/88 11/1996 8/1996 10/2007 6.2 10/2015 14.3
MacGillis and Gibbs/Bell Lumber & Pole
9/30/91 9/22/94 10/1999 10/1999 10/2009 8.3 10/2029 28.3
Oconomowoc Electroplating
9/20/90 9/1996 9/1996 9/2006 5.2 9/2026 25.2
Onalaska Municipal Landfill
8/14/90 7/1994 8/1995 6/2004 2.9 7/2002 1.0
Notes: 1. Douglass Road, Duell and Gardner, and Peerless Plating are pre-operational systems; therefore, the associated data are estimates and some items are unknown.
Region 5, Table 3 -- P&T System Histories and Projections
Date
July 3, 2001
Data reflect estimates provided by site Remedial Project Managers between February and May 2001. These estimates may, in some cases, vary from actuality. Data-- including the number, status, cost, projections, and specifications of systems-- may change overtime.
Region 5 Fund-lead, P&T systems Data provided by the site RPMs

Nationwide Superfund Reform Initiative
Phase 1 -- Data Collection and System Screening, Region 5
System Original RODLast ROD
ModificationConstruction Completed
Operational and Functional
Turnover to State
Years Until Turnover
Expected Completion
Years Until Completion
Region 5, Table 3 -- P&T System Histories and Projections
Date
July 3, 2001
Ott/Story/Cordova Chem Co.
9/29/89 9/29/90 2/1996 2/1996 8/2010 9.1 8/2030 29.1
Peerless Plating 9/21/92 11/2000 unknown unknown unknown unknown unknown
U.S. Aviex 9/7/88 9/1993 9/1993 9/2003 2.2 9/2003 2.2
Verona Well Field 8/12/85 6/1996 6/1996 6/2006 4.9 Indefinite Indefinite
Wash King Laundry 3/31/93 7/31/96 4/2001 4/2001 4/2011 9.8 4/2021 19.8
Notes:
Data reflect estimates provided by site Remedial Project Managers between February and May 2001. These estimates may, in some cases, vary from actuality. Data-- including the number, status, cost, projections, and specifications of systems-- may change overtime.
1. Douglass Road, Duell and Gardner, and Peerless Plating are pre-operational systems; therefore, the associated data are estimates and some items are unknown.
Region 5 Fund-lead, P&T systems Data provided by the site RPMs

Nationwide Superfund Reform Initiative
Phase 1 -- Data Collection and System Screening, Region 5
RPM State Regulator Primary Contractor
1 Darryl Owens Maureen Johnson Gary SchroeherEPA Region 5 MPCA Delta Environmental77 West Jackson Boulevard 520 Lafayette Road 2770 Cleveland AveChicago, IL 60604-3507 St. Paul, MN 55155-4194 Roseville, MN 55113-1127312-886-7089 651-296-7353 651-639-9449
[email protected] [email protected]
2 John Peterson Keld Lauredsen EPA Region 5 WDNR77 West Jackson Boulevard 1125 Military Ave. Box 10448Chicago, IL 60604-3507 Green Bay, WI 54307312-353-1264 920-492-5921
920-492-5913 (fax)[email protected] [email protected]
3 Dion Novak Kevin Herron Dan PlombEPA Region 5 CH2MHILL77 West Jackson Blvd. 135 S. 84th Street Suite 325Chicago, IL 60604-3507 IN Milwaukee, WI 53214312-886-4737 317-234-0354 414-272-2426
4 Kyle Rogers Walelign Wagaw Tim GougerEPA Region 5 MDEQ USACE, Rapid Response77 West Jackson Boulevard P.O. Box 30426 12565 West Center RoadChicago, IL 60604-3507 Lansing, MI 48909 Omaha, NE 68144-3869312-886-1995 517-373-9896 402-293-2514
402-291-8177 (fax)[email protected] [email protected]
Region 5, Table 4 -- System Contact InformationJuly 3, 2001
System
Arrowhead Refinery
Better Brite Plating Co. Chrome and Zinc Shops
Douglass Road
Duell and Gardner
Region 5 Fund-lead, P&T Systems Information provided by site RPMs

Nationwide Superfund Reform Initiative
Phase 1 -- Data Collection and System Screening, Region 5
RPM State Regulator Primary Contractor
Region 5, Table 4 -- System Contact InformationJuly 3, 2001
System
5 Sheri BianchinEPA Region 577 West Jackson BoulevardChicago, IL 60604-3507312-886-4745
6 Steve Padovani Rich Lang Neil BrownEPA Region 5 IEPA Ecology and Environment77 West Jackson Boulevard P.O. Box 1515 33 N. Deerborne St.Chicago, IL 60604-3507 La Salle, IL 61301 Chicago, IL 60602312-353-6755 815-223-6836 312-578-9243
[email protected] [email protected]
7 Sheila Sullivan Mariam Horneff Bill BangsundEPA Region 5 MPCA Barr Engineering77 West Jackson Boulevard 520 Lafayette RoadChicago, IL 60604-3507 St. Paul, MN 55155-4194312-886-5251 651-296-7228 [email protected]
8 Darryl Owens Nile Fellows Larry CampbellEPA Region 5 MPCA Black and Veatch77 West Jackson Boulevard 520 Lafayette RoadChicago, IL 60604-3507 St. Paul, MN 55155-4194 Chicago, IL 312-886-7089 651-296-6300
La Salle Electrical Utilities
Long Prairie
MacGillis and Gibbs/Bell Lumber & Pole
Eau Claire Municipal Well Field
Region 5 Fund-lead, P&T Systems Information provided by site RPMs
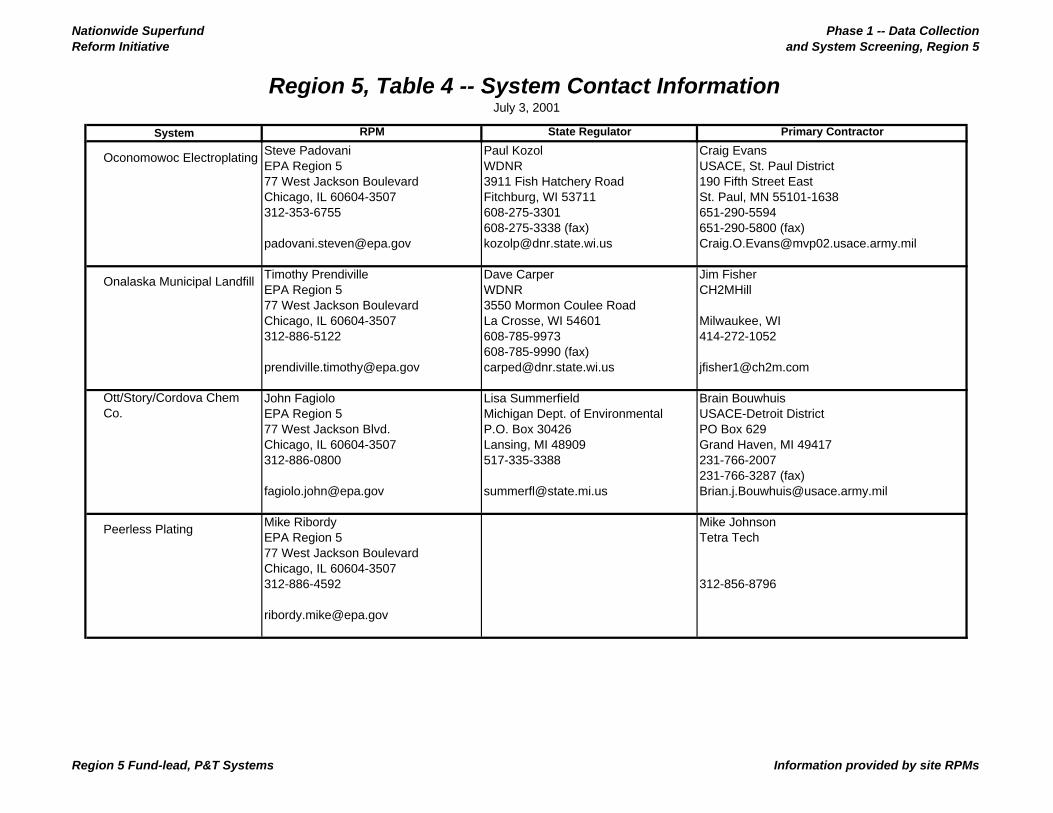
Nationwide Superfund Reform Initiative
Phase 1 -- Data Collection and System Screening, Region 5
RPM State Regulator Primary Contractor
Region 5, Table 4 -- System Contact InformationJuly 3, 2001
System
9 Steve Padovani Paul Kozol Craig EvansEPA Region 5 WDNR USACE, St. Paul District77 West Jackson Boulevard 3911 Fish Hatchery Road 190 Fifth Street EastChicago, IL 60604-3507 Fitchburg, WI 53711 St. Paul, MN 55101-1638312-353-6755 608-275-3301 651-290-5594
608-275-3338 (fax) 651-290-5800 (fax)[email protected] [email protected] [email protected]
# Timothy Prendiville Dave Carper Jim FisherEPA Region 5 WDNR CH2MHill77 West Jackson Boulevard 3550 Mormon Coulee RoadChicago, IL 60604-3507 La Crosse, WI 54601 Milwaukee, WI 312-886-5122 608-785-9973 414-272-1052
608-785-9990 (fax)[email protected] [email protected] [email protected]
# John Fagiolo Lisa Summerfield Brain BouwhuisEPA Region 5 Michigan Dept. of Environmental USACE-Detroit District77 West Jackson Blvd. P.O. Box 30426 PO Box 629Chicago, IL 60604-3507 Lansing, MI 48909 Grand Haven, MI 49417312-886-0800 517-335-3388 231-766-2007
231-766-3287 (fax)[email protected] [email protected] [email protected]
# Mike Ribordy Mike JohnsonEPA Region 5 Tetra Tech77 West Jackson BoulevardChicago, IL 60604-3507312-886-4592 312-856-8796
Onalaska Municipal Landfill
Ott/Story/Cordova Chem Co.
Peerless Plating
Oconomowoc Electroplating
Region 5 Fund-lead, P&T Systems Information provided by site RPMs

Nationwide Superfund Reform Initiative
Phase 1 -- Data Collection and System Screening, Region 5
RPM State Regulator Primary Contractor
Region 5, Table 4 -- System Contact InformationJuly 3, 2001
System
# Ken Glatz Judy Gapp Jack BrunnerEPA Region 5 MDEQ Tetra Tech77 West Jackson Boulevard P.O. Box 30426Chicago, IL 60604-3507 Lansing, MI 48909312-886-1434 517-335-3391 312-856-8788
517-335-4887 (fax)[email protected] [email protected]
# Richard Boice Beth O'BrienEPA Region 5 MDEQ77 West Jackson Boulevard P.O. Box 30426Chicago, IL 60604-3507 Lansing, MI 48909312-886-4740 517-335-3908
[email protected] [email protected]
# Russell Hart Sally Beebe EPA Region 5 MDEQ-ERD Malcolm Pirnie77 West Jackson Boulevard P.O. Box 30426Chicago, IL 60604-3507 Lansing, MI 48909312-886-4844 517-373-4110 517-337-0111
517-335-4887 (fax)[email protected] [email protected]
Verona Well Field
Wash King Laundry
U.S. Aviex
Region 5 Fund-lead, P&T Systems Information provided by site RPMs

Nationwide Superfund Reform Initiative
Phase 1 -- Data Collection and System Screening, Region 5
NAPLS Present?
# of Identified Contam. Contaminants Treatment Processes
Not present 4 Pentachlorophenol (PCP) Other/Not Sure VOCs PNAs VC
Better Brite Plating Co. Chrome and Zinc Shops
Not present 1 Chromium Metals Precipitation
Douglass Road Not present 4 Arsenic Other/Not Sure TCE and Vinyl chloride Tetrahydrofuran Trichlorethylene (TCE)/Tetrachloroelthylene (PCE)
Not present 5 Anthracene Carbon Adsorption Carbozol Chloromethane N-N dimethylanaline Gentin Violet
Don't know 2 Trans 1,2-Dichloroethylene Air Stripping Vernolate
Not present 3 Transuranic wastes Carbon Adsorption PCB Other/Not Sure TCA
Observed 3 Dichloroethylene Carbon Adsorption Trichlorethylene (TCE)/Tetrachloroelthylene (PCE) VC
Observed 3 Chromium Biological Treatment Pentachlorophenol (PCP) Carbon Adsorption carcinogenic PAHs Filtration Off-Gas Treatment
Not present 3 Cadmium Metals Precipitation Cyanide Air Stripping Volatile organic compounds (VOCs) Carbon Adsorption
Not present 3 Benzo(a)anthracene Metals Precipitation Trans 1,2-Dichloroethylene Air Stripping Volatile chlorinated organics
Duell and Gardner
Eau Claire Municipal Well Field
Long Prairie
Region 5, Table 5 -- Top Contaminants Identified by RPMsJuly 3, 2001
System
Arrowhead Refinery
Oconomowoc Electroplating
Onalaska Municipal Landfill
MacGillis and Gibbs/Bell Lumber & Pole
La Salle Electrical Utilities
Data reflect estimates provided by site Remedial Project Managers between February and May 2001. These estimates may, in some cases, vary from actuality. Data-- including the number, status, cost, projections, and specifications of
systems-- may change overtime.
Region 5 Fund-lead, P&T system Data provided by site RPMs

Nationwide Superfund Reform Initiative
Phase 1 -- Data Collection and System Screening, Region 5
NAPLS Present?
# of Identified Contam. Contaminants Treatment Processes
Region 5, Table 5 -- Top Contaminants Identified by RPMsJuly 3, 2001
System
Arrowhead Refinery Observed 5 1,2-Dichloroethane Biological Treatment 1,2-Dichloroethylene (DCE) Carbon Adsorption Organophosphorus pesticides (4,4'-DDT, lindane) Other/Not Sure Vapona vinyl chloride
Don't know 2 Cadmium Metals Precipitation Trichloroethylene (TCE) Air Stripping Off-Gas Treatment
Not present 4 1,1,1-Trichloroethane Air Stripping 1,1-Dichloroethane 1,2-Dichloroethane diethylether
Not present 4 1,2-Dichloropropane Air Stripping Tin Off-Gas Treatment Trans 1,2-Dichloroethylene Volatile chlorinated organics
Don't know 1 Trichlorethylene (TCE)/Tetrachloroelthylene (PCE) Air Stripping Off-Gas Treatment
Data reflect estimates provided by site Remedial Project Managers between February and May 2001. These estimates may, in some cases, vary from actuality. Data-- including the number, status, cost, projections, and specifications of
systems-- may change overtime.
Verona Well Field
Wash King Laundry
Peerless Plating
Ott/Story/Cordova Chem Co.
U.S. Aviex
Region 5 Fund-lead, P&T system Data provided by site RPMs

Nationwide Superfund Reform Initiative
Phase 1 -- Data Collection and System Screening, Region 5
System
Potential Reduction in
Life-Cycle Costs
Potential Life-Cycle Savings
Expected Duration
Previous Evaluation of Effectiveness
Approximate Pumping
Rate (gpm)
Number of Extraction
Wells
Number of Treatment Processes
Groundwater Samples per
Year
Obstacles to making
(minor/major) changes
Arrowhead Refinery 5.0% ($17,724) 2.7 Sufficient 25 0 1 36Minor
ModerateBetter Brite Plating Co. Chrome and Zinc Shops
12.0% $39,644 28.8 Sufficient 0 0 1 28Minor
Severe
Eau Claire Municipal Well Field
unknown unknown unknown Sufficient 4500 14 1 0Severe Severe
La Salle Electrical Utilities
12.5% $57,261 3.7 Sufficient 20 0 2 100Minor Minor
Long Prairie 15.5% $429,665 14.3 Not evaluated 227 9 1 22Minor
ModerateMacGillis and Gibbs/Bell Lumber & Pole
32.0% $1,399,624 28.3 Not evaluated 60 14 4 60Minor
Severe
Oconomowoc Electroplating
24.5% $1,590,721 25.2 Sufficient 30 5 3 40Minor
SevereOnalaska Municipal Landfill
5.0% ($20,219) 1.0 Sufficient 560 5 2 20Minor Minor
Operational
Region 5, Table 6 -- Screening SummaryJuly 3, 2001
Data reflect estimates provided by site Remedial Project Managers between February and May 2001. These estimates may, in some cases, vary from actuality. Data-- including the number, status, cost, projections, and specifications of systems-- may change overtime.
Notes: 1. "Potential Reduction in Life-cycle Costs" result from a screening methodology that incorporates system-specific information. The reductions do not include the cost of an RSE.2. "Potential Life-cycle Savings" were estimated using using system-specific information and incorporate the cost of the RSE. Values in parentheses denote costs (negative savings).3. "Groundwater Samples per Year" is calculated by multiplying the number of monitoring wells sampled by the number of monitoring events per year.4. Previous evaluations of effectiveness may include 5-year reviews but do not include Remediation System Evaluations.
Region 5 Fund-lead, P&T system Data provided by site RPMs

Nationwide Superfund Reform Initiative
Phase 1 -- Data Collection and System Screening, Region 5
System
Potential Reduction in
Life-Cycle Costs
Potential Life-Cycle Savings
Expected Duration
Previous Evaluation of Effectiveness
Approximate Pumping
Rate (gpm)
Number of Extraction
Wells
Number of Treatment Processes
Groundwater Samples per
Year
Obstacles to making
(minor/major) changes
Operational
Region 5, Table 6 -- Screening SummaryJuly 3, 2001
Ott/Story/Cordova Chem Co.
40.0% $14,418,502 29.1 Not evaluated 700 10 3 120Minor Minor
U.S. Aviex 5.0% ($1,583) 2.2 Sufficient 170 6 1 120Minor Minor
Verona Well Field 25.5% $856,994 Indefinite Not evaluated 250 6 2 10Minor
Moderate
Wash King Laundry 23.0% $185,195 19.8 Not evaluated 250 5 2 46Minor
Moderate
Douglass Road 32.5% $563,336 29.3 Not evaluated 1000 5 1 72Minor Minor
Duell and Gardner unknown unknown 6.0 Not evaluated 80 2 1 50Minor Minor
Peerless Plating unknown unknown unknown Sufficient 165 6 3 24Minor Minor
3. "Groundwater Samples per Year" is calculated by multiplying the number of monitoring wells sampled by the number of monitoring events per year.
Pre-Operational
Data reflect estimates provided by site Remedial Project Managers between February and May 2001. These estimates may, in some cases, vary from actuality. Data-- including the number, status, cost, projections, and specifications of systems-- may change overtime.
4. Previous evaluations of effectiveness may include 5-year reviews but do not include Remediation System Evaluations.
Notes: 1. "Potential Reduction in Life-cycle Costs" result from a screening methodology that incorporates system-specific information. The reductions do not include the cost of an RSE.2. "Potential Life-cycle Savings" were estimated using using system-specific information and incorporate the cost of the RSE. Values in parentheses denote costs (negative savings).
Region 5 Fund-lead, P&T system Data provided by site RPMs

Nationwide Superfund Reform Initiative
Phase 1 -- Data Collection and System Screening, Region 5
1 System is currently shutdown. These are estimated costs for O&M when system resumes operation.2 The system is preoperational with no cost estimates provided.
Notes:
July 3, 2001
Region 5, Figure 1 -- Estimated Annual Costs of Systems
Data reflect estimates provided by site Remedial Project Managers between February and May 2001. These estimates may, in some cases, vary from actuality. Data-- including the number, status, cost, projections, and specifications of systems-- may change overtime.
1. Douglass Road, Duell and Gardner, and Peerless Plating are pre-operational systems; therefore, the associated data are estimates and some items are unknown.
$70 $36$120
$200
$2,400
$400$300
unknown
$230$175 $300
$300
$75
$225
$0
$400
$800
$1,200
$1,600
$2,000
$2,400
Arr
owhe
adR
efin
ery
Bet
ter
Brit
eP
latin
g C
o.C
hrom
e an
d Z
inc
Dou
glas
s R
oad
Due
ll an
dG
ardn
er
Eau
Cla
ireM
unic
ipal
Wel
lF
ield
La S
alle
Ele
ctric
alU
tiliti
es
Long
Pra
irie
Mac
Gill
is a
ndG
ibbs
/Bel
lLu
mbe
r &
Pol
e
Ona
lask
aM
unic
ipal
Lan
dfill
Ott/
Sto
ry/C
ordo
vaC
hem
Co.
Pee
rless
Pla
ting
U.S
. Avi
ex
Ver
ona
Wel
l Fie
ld
Was
h K
ing
Laun
dry
Ann
ual C
ost (
$1,0
00/y
r)
Operational Systems Pre-operational Systems
Region 5 Fund-lead, P&T systems Data provided by the site RPMs

Nationwide Superfund Reform Initiative
Phase 1 -- Data Collection and System Screening, Region 5
Notes:
July 3, 2001
Region 5, Figure 2 -- System Projections
Data reflect estimates provided by site Remedial Project Managers between February and May 2001. These estimates may, in some cases, vary from actuality. Data-- including the number, status, cost, projections, and specifications of systems-- may change overtime.
1. Douglass Road, Duell and Gardner, and Peerless Plating are pre-operational systems; therefore, the associated data are estimates and some items are unknown.
0.0
5.0
10.0
15.0
20.0
25.0
30.0
35.0
40.0
Arr
owhe
adR
efin
ery
Bet
ter
Brit
eP
latin
g C
o.C
hrom
e an
d Z
inc
Dou
glas
s R
oad
Due
ll an
dG
ardn
er
Eau
Cla
ireM
unic
ipal
Wel
lF
ield
La S
alle
Ele
ctric
alU
tiliti
es
Long
Pra
irie
Mac
Gill
is a
ndG
ibbs
/Bel
lLu
mbe
r &
Pol
e
Oco
nom
owoc
Ele
ctro
plat
ing
Ona
lask
aM
unic
ipal
Lan
dfill
Ott/
Sto
ry/C
ordo
vaC
hem
Co.
Pee
rless
Pla
ting
U.S
. Avi
ex
Ver
ona
Wel
l Fie
ld
Was
h K
ing
Laun
dry
year
s
Years Until Turnover
Years Until Completion Indefinite
unkn
own
unkn
own
2021
2026
2031
2036
2041
2001
2006
2011
2016
Region 5 Fund-lead, P&T systems Data provided by the site RPMs

Nationwide Superfund Reform InitiativePhase 1– Data Collection and System Screening
Region 6July 3, 2001
In the OSWER Directive No. 9200.0-33, Transmittal of Final FY00 - FY01 Superfund ReformsStrategy, dated July 7,2000, the Office of Solid Waste and Emergency Response outlined acommitment to optimize our Fund-lead, pump-and-treat (P&T) systems. To fulfill this commitment,Headquarters is assisting Regions in evaluating their Fund-lead operating P&T systems. Phase 1 of thisinitiative involves identifying all Fund-lead P&T system, collecting baseline cost and performance dataon them, and selecting up to two sites in each Region for a Remediation System Evaluation (RSE).
This report summarizes the screening process for Region 6 which was conducted during January 2001. The first section of this report presents the cost and performance data for the Region while the seconddescribes the screening process and system selection.
The data presented in this report reflect estimates provided by the site Remedial ProjectManagers between January and May 2001. These estimates may vary from actuality. Thedata– including the number, status, cost, specifications, and projections of systems– may
change over time.
Cost and Performance Data
Eleven Fund-lead P&T systems were identified in Region 6. Of this eleven,
• six are operational, • three are pre-operational, • one is complete, and • one has returned to remedial-investigation status.
One of the operational P&T systems is a component of a more comprehensive strategy that primarilyrelies on in situ bioremediation. In addition, another one of the operational systems and the completedsystem utilize in situ chemical treatment to enhance the P&T remediation.
Cost and performance data and other information pertaining to the identified Fund-lead P&T systems(estimates for the pre-operational systems) were collected with a web-based questionnaire accessedfrom http://www.cluin.org/optimization and stored in a database. This information is summarized inTable 1 and provided in detail in five additional tables:

July 3, 2001 Nationwide Superfund Reform InitiativePhase 1– Data Collection and Site Screening, Region 6
Page 2 of 3
• Table 2 provides overviews of the systems by providing items such as annual costs, lead,status, goals, and progress of each system.
• Table 3 includes the dates marking the signing of the ROD, construction completion,
system operation and function, turnover to the state, and expected close-out.
• Table 4 lists for each system the contact information for the site Remedial ProjectManager, the State Regulator, and the Contractor.
• Table 5 notes for each system and the associated site if NAPLS are present, the topcontaminants of concern, and the above-ground treatment processes.
• Table 6 lists system specifications such as the pumping rate, number of wells, number ofmonitoring events per year, and other items used to determine the complexity of a systemand its potential for optimization.
Projected dates for turnover to the States and for system completion are depicted in Figure 1, andannual costs for each system are depicted in Figure 2.
RSE Site Selection
Evaluation of Sites for Optimization Potential
Once the information is gathered from each of the Fund-lead P&T systems in a given Region, itbecomes input for a screening methodology that attempts to determine the optimization potential foreach system. This, in turn, provides a basis for selecting two systems where RSEs will be performed.
The factors affecting the optimization potential of a system are
• the overall cost of a given system, • the expected duration of the system, • the number of above-ground treatment processes, • the number of extraction wells,• the number of monitoring events per year,• the system downtime per year,• the pumping rate,• the results (if any) of a previous performance and effectiveness evaluation, and• any social or political obstacles to implementing modifications to the system.

July 3, 2001 Nationwide Superfund Reform InitiativePhase 1– Data Collection and Site Screening, Region 6
Page 3 of 3
Table 6 summarizes the results of the screening process including the estimated life-cycle cost savingsthat may result from performing an RSE.
Selecting Two Sites for RSEs
The following is a list of the identified Fund-lead P&T systems in Region 6 classified as completed,operational, planned, and no-longer operating. Those in bold were selected for RSEs.
Completed*Odessa Chromium #2
Operational**American Creosote WorksBayou BonfoucaCimarron MiningGeneva IndustriesMidland Products*Odessa Chromium #1
PlannedCity of Perryton Well #2North Cavalcade Superfund SiteSprague Road Ground Water Plume
No longer operatingSol Lynn/Industrial Transformers
* Remediation was significantly enhanced through in situ treatment with ferrous sulfate.** In-situ bioremediation is the primary remedial action.
Only operational systems that are not temporarily shutdown (Geneva Industries) and not within a yearof completion (Odessa Chromium #1) were considered in selecting the two systems for RSEs. Because American Creosote Works had recently completed an intensive 5-year review with an outsideparty, its P&T system was removed from consideration as other systems would likely benefit more froman RSE. While Cimarron Mining exhibited high estimated potential savings, it is a relatively simplesystem with a pumping rate of 1 gpm, three wells, and direct discharge of the extracted water. Furthermore, for Cimarron Mining moderate social and political obstacles for minor systemmodifications and severe social and political obstacles for major system modifications discourage anRSE since suggested modifications likely would not be implemented.
Thus, the selection of the P&T systems at Bayou Bonfouca and Midland Products for RSEs arose notfrom a quantitative analysis of the potential cost savings but rather from feasibility and practicality ofconducting and RSE and implementing the suggested modifications.

Nationwide Superfund Reform Initiative
Phase 1 -- Data Collection and System Screening, Region 6
Odessa Chromium #2
Number of systems 9Number that are EPA lead 5 of 9Number that are State lead 4 of 9
Number that are operational 6Number that are pre-operational 3Number where cleanup is a goal 6 of 9Number where the plume is controlled* 4 of 6Number that are estimated to be more than 80% complete* 1 of 6Number previously evaluated and effectiveness found sufficient* 5 of 6Number previously evaluated and effectiveness found not sufficient* 1 of 6
Number where NAPLs are observed 3 of 9Number with more than 1 major contaminant identified 6 of 9Number with 3 or more treatment processes 4 of 9
Average estimated annual O&M cost (including monitoring) $489,875Average estimated annual monitoring cost $63,111Average number of years until turnover to the States 7.2Average number of years until completion 17.5
*Operational sites only
Sol Lynn/Industrial Transformers
Data reflect estimates provided by site Remedial Project Managers between February and May 2001. These estimates may, in some cases, vary from actuality. Data-- including the number, status, cost, projections, and specifications of systems-- may change overtime.
*** Note: Remediation for the completed system and 80%-complete system was significantly enhanced by in situ treatment.
No-Longer-Operating Fund-lead P&T Systems
Extent of Contamination
Average Costs and Time Frames
Region 6, Table 1 -- SummaryJuly 3, 2001
System Status
Operational and Pre-operational Fund-lead P&T Systems
Completed Fund-lead P&T Systems
Region 6 Fund-lead, P&T systems Data provided by the site RPMs

Nationwide Superfund Reform Initiative
Phase 1 -- Data Collection and System Screening, Region 6
SystemEstimated
Annual Cost LeadType of
RODSystem Status System Goals
Plume Under Control?
Estimated Progress of Restoration
Previous Evaluation of Effectiveness
American Creosote Works
$360,000 EPA Final Operational Containment YesRestoration is
not a goalSufficient
Bayou Bonfouca $402,000 EPA Final OperationalContainment &
RestorationUnknown Unknown Sufficient
Cimarron Mining $1,000,000 EPA Final OperationalContainment &
RestorationUnknown Unknown Not Sufficient
City of Perryton Well #2 $37,000 EPA Interim Design Containment N/A N/A Not evaluated
Geneva Industries $240,000 State with
Fund MoneyFinal
Operational (shutdown)
Containment & Restoration
Yes Unknown Sufficient
Midland Products $180,000 State with
Fund MoneyFinal Operational Restoration Yes less than 20% Sufficient
3. Previous evaluations of effectiveness may include 5-year reviews but do not include Remediation Systems Evaluations.4. In-situ bioremediation is the primary remedial strategy at the American Creosote Works site.5. The Geneva Industries system is shutdown due to issues with the contractor. Operation is expected to resume in 2004.6. The remediation has been significantly enhanced by in situ treatment with ferrous sulfate.
2. "Estimated Progress of Restoration" refers to the estimated portion of the plume that has been restored to cleanup levels.
Notes:
Region 6, Table 2 -- System OverviewsJuly 3, 2001
Data reflect estimates provided by site Remedial Project Managers between February and May 2001. These estimates may, in some cases, vary from actuality. Data-- including the number, status, cost, projections, and specifications of systems-- may change overtime.
1. The City of Perryton Well #2, North Cavalcade, and Sprague Road systems are pre-operational; therefore, the associated data are estimates
Region 6 Fund-lead, P&T systems Data provided by the site RPMs

Nationwide Superfund Reform Initiative
Phase 1 -- Data Collection and System Screening, Region 6
SystemEstimated
Annual Cost LeadType of
RODSystem Status System Goals
Plume Under Control?
Estimated Progress of Restoration
Previous Evaluation of Effectiveness
North Cavalcade Superfund Site
unknownState with
Fund MoneyFinal Installed Restoration N/A N/A Not evaluated
Odessa Chromium #1 $500,000 State with
Fund MoneyFinal Operational Restoration Yes
more than 80%
Sufficient
Sprague Road Ground Water Plume
$1,200,000 EPA Final Design Restoration N/A N/A Not evaluated
3. Previous evaluations of effectiveness may include 5-year reviews but do not include Remediation Systems Evaluations.4. In-situ bioremediation is the primary remedial strategy at the American Creosote Works site.5. The Geneva Industries system is shutdown due to issues with the contractor. Operation is expected to resume in 2004.6. The remediation has been significantly enhanced by in situ treatment with ferrous sulfate.
1. The City of Perryton Well #2, North Cavalcade, and Sprague Road systems are pre-operational; therefore, the associated data are estimates 2. "Estimated Progress of Restoration" refers to the estimated portion of the plume that has been restored to cleanup levels.
Notes:
Data reflect estimates provided by site Remedial Project Managers between February and May 2001. These estimates may, in some cases, vary from actuality. Data-- including the number, status, cost, projections, and specifications of systems-- may change overtime.
Region 6, Table 2 -- System OverviewsJuly 3, 2001
Region 6 Fund-lead, P&T systems Data provided by the site RPMs

Nationwide Superfund Reform Initiative
Phase 1 -- Data Collection and System Screening, Region 6
System Original RODLast ROD
ModificationConstruction Completed
Operational and Functional
Turnover to State
Years Until Turnover
Expected Completion
Years Until Completion
American Creosote Works
4/28/93 2/1997 2/1997 2/2027 25.6 2/2027 25.6
Bayou Bonfouca 3/31/87 7/20/95 7/2000 3/2001 7/2003 2.0 7/2021 20.0
Cimarron Mining 9/21/90 4/1991 12/1991 10/2004 3.2 Indefinite Indefinite
City of Perryton Well #2 9/29/99 8/2001 8/2003 8/2013 12.1 8/2023 22.1
Geneva Industries 9/18/86 4/1993 7/1993 1/2004 2.5 1/2004 2.5
Midland Products 3/24/88 11/1993 1/1994 1/2004 2.5 1/2034 32.5
North Cavalcade Superfund Site
6/28/88 3/2001 12/2005 12/2005 4.4 12/2010 9.4
Odessa Chromium #1 3/18/88 11/23/99 11/1993 11/1/93 12/2001 0.4 12/2001 0.4
Sprague Road Ground Water Plume
9/29/00 9/2002 9/2003 9/2013 12.2 9/2028 27.2
Notes:1. For Cimarron Mining an indefinite completion date was provided by the RPM. 2. The Geneva Industries system is currently shutdown due to issues with the contractor. Operation is expected to resume in 2004.
Region 6, Table 3 -- P&T System Histories and Projections
Date
July 3, 2001
Data reflect estimates provided by site Remedial Project Managers between February and May 2001. These estimates may, in some cases, vary from actuality. Data-- including the number, status, cost, projections, and specifications of systems-- may change overtime.
Region 6 Fund-lead, P&T systems Data provided by the site RPMs

Nationwide Superfund Reform Initiative
Phase 1 -- Data Collection and System Screening, Region 6
RPM State Regulator Primary Contractor
1 American Creosote Works Stacey Bennett Janaye Danage Bill FaughtEPA Region 6 Louisiana Dept. of Environmental Quality CH2MHill1445 Ross Avenue P.O. Box 82178 7600 W. Tidwell, Suite 400Dallas, TX 75202-2733 Baton Rouge, LA 70884-2178 Houston, TX 77040-5719214-665-6729 225-765-0475 713-462-0161214-665-6660 (fax) 225-765-0484 (fax) 713-462-0165 (fax)[email protected] (fax) [email protected] [email protected]
2 Bayou Bonfouca Katrina Coltrain Rich Johnson Lee GuilloryEPA Region 6 Louisiana Dept. of Environmental Quality USACE-New Orleans District1445 Ross Avenue P.O. Box 82282 P.O. Box 60267Dallas, TX 75202 Baton Rouge, LA 70884-2282 New Orleans, LA 70160-0267214-665-8143 225-765-0487 504-862-2934214-665-6660 (fax) 225-765-0435 (fax) 504-862-2896 (fax)[email protected] (fax) [email protected] [email protected]
3 Cimarron Mining Petra Sanchez David Henry Brian D. JordanEPA Region 6 New Mexico Environment Dept. USACE1445 Ross Ave. Suite 1200 PO Box 26110 1190 St. Francis Drive 4101 Jefferson Plaza NEDallas, TX 75202-2733 Santa Fe, NM 87505 Albuquerque, NM 87109214-665-6686 214-827-0037 505-342-3472214-665-6660 (fax) 214-827-2965 (fax) 505-342-3208 (fax)[email protected] [email protected] [email protected]
4 City of Perryton Well #2 Vincent Malott Diane Poteet Peter van NoortEPA Region 6 Texas Natural Resource Conserv. Comm. CH2M Hill1445 Ross Avenue P.O. Box 13087 5339 Alpha Road, Suite 300Dallas, TX 75202 Austin, TX 78711 Dallas, TX 75240214-665-8313 512-239-2502 972-980-2170214-665-6660 (fax) 512-239-2450 (fax) 972-385-0846 (fax)[email protected] [email protected] [email protected]
Region 6, Table 4 -- System Contact InformationJuly 3, 2001
System
Region 6 Fund-lead, P&T Systems Information provided by site RPMs

Nationwide Superfund Reform Initiative
Phase 1 -- Data Collection and System Screening, Region 6
RPM State Regulator Primary Contractor
Region 6, Table 4 -- System Contact InformationJuly 3, 2001
System
5 Geneva Industries Ruben Moya James Sher Sanjay RamabhadranEPA Region 6 Texas Natural Resource Conserv. Comm. Lockwood, Andrews & Newman Inc.1445 Ross Ave., Suite 1200 P.O.Box 13087 1500 CitywestDallas, TX 75202 Austin, TX 78711-3087 Houston, TX 77042214-665-2755 512-239-2444 713-266-6900214-665-6660 (fax) 512-239-2450 (fax) 713-266-8971 (fax)[email protected] [email protected] [email protected]
6 Midland Products Carlos Sanchez Clark McWilliams Russell PerryEPA Region 6 Arkansas Dept. of Environmental Quality IT Corp.1445 Ross Avenue P.O. Box 8913 13111 NW Highway, Suite 310Dallas, TX 75202 Little Rock, AR 72219 Houston, TX 77040-6392214-665-8507 501-682-0850 713-996-4400214-665-6660 (fax) 501-682-0565 (fax) 713-939-9546 (fax)[email protected] [email protected] [email protected]
7 North Cavalcade Superfund Camille Hueni Uche Ikemba Frank FreyEPA Region 6 Texas Natural Resource Conserv. Comm. Foster Wheeler Environmental CorporationU.S. EPA Region 6, 1445 P.O. Box 13087; Mail Code 143 1001 S. Dairy Ashford Street, Ste. 210Dallas, TX 75202-7233 Austin, TX 78711-3087 Houston, TX 77077214-665-2231 512-239-2595 281-597-4821214-665-6660 (fax) 512-239-2449 (fax) 281-596-0308 (fax)[email protected] [email protected] [email protected]
8 Odessa Chromium #1 Ernest Franke Uche Ikemba William BrownEPA Region 6 Texas Natural Resource Conserv. Comm. Pacific Western Technologies, Ltd.1445 Ross Avenue 12100 Park Circle Bldg. D , P.O. Box 575 Oak Ridge Turnpike,Suite B-4Dallas, TX 75202 Austin, TX 78711 Oak Ridge, TN 37830214-665-8521 512-239-2595 865-483-0554214-665-6660 (fax) 512-239-2449 (fax) 865-483-8838 (fax)franke,[email protected] [email protected]> [email protected]
Region 6 Fund-lead, P&T Systems Information provided by site RPMs

Nationwide Superfund Reform Initiative
Phase 1 -- Data Collection and System Screening, Region 6
RPM State Regulator Primary Contractor
Region 6, Table 4 -- System Contact InformationJuly 3, 2001
System
9 Sprague Road Ground Vincent Malott Diane Poteet Cristina RaduEPA Region 6 Texas Natural Resource Conserv. Comm. Tetra Tech EMI1445 Ross Avenue P.O. Box 13087 6121 Indian School Road NE, Suite 205Dallas, TX 75202 Austin, TX 78711 Albuquerque, TX 87110214-665-8313 512-239-2502 505-881-3188214-665-6660 (fax) 512-239-2450 (fax) 505-881-3283 (fax)[email protected] [email protected] [email protected]
Region 6 Fund-lead, P&T Systems Information provided by site RPMs
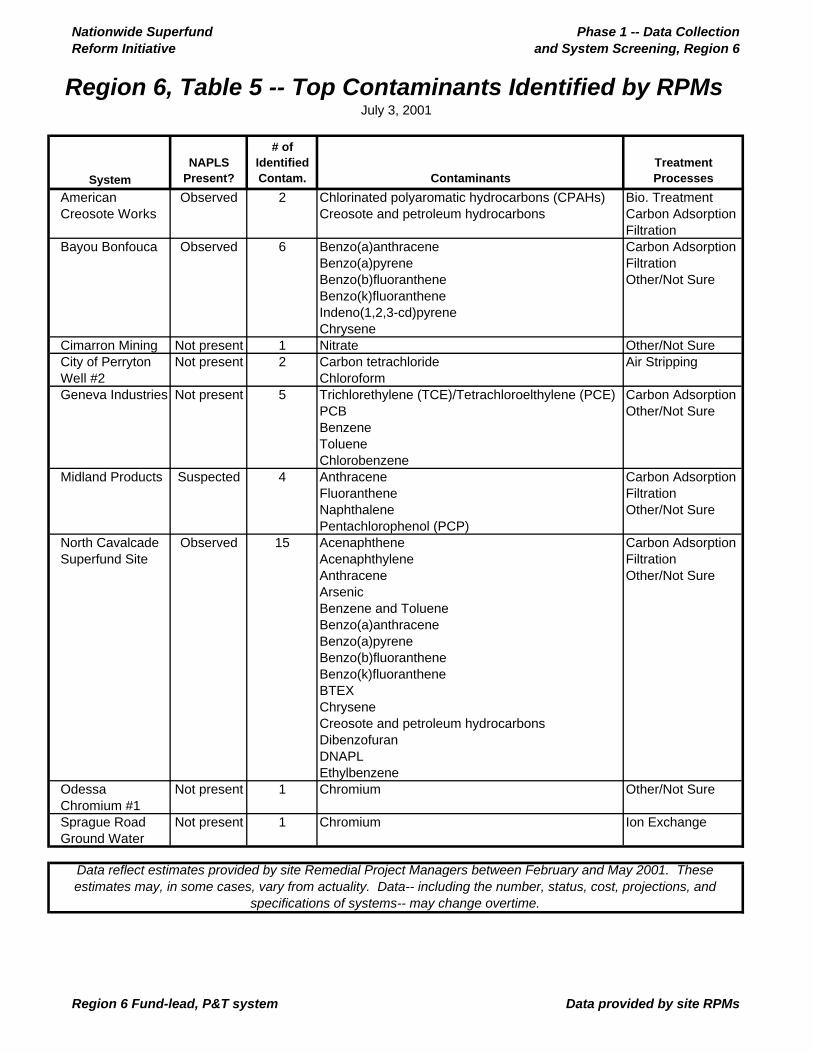
Nationwide Superfund Reform Initiative
Phase 1 -- Data Collection and System Screening, Region 6
NAPLS Present?
# of Identified Contam. Contaminants
Treatment Processes
Observed 2 Chlorinated polyaromatic hydrocarbons (CPAHs) Bio. Treatment Creosote and petroleum hydrocarbons Carbon Adsorption
FiltrationObserved 6 Benzo(a)anthracene Carbon Adsorption
Benzo(a)pyrene Filtration Benzo(b)fluoranthene Other/Not Sure Benzo(k)fluoranthene Indeno(1,2,3-cd)pyrene Chrysene Cimarron Mining Not present 1 Nitrate Other/Not Sure
Not present 2 Carbon tetrachloride Air StrippingChloroform
Geneva Industries Not present 5 Trichlorethylene (TCE)/Tetrachloroelthylene (PCE) Carbon Adsorption PCB Other/Not Sure Benzene Toluene Chlorobenzene
Midland Products Suspected 4 Anthracene Carbon Adsorption Fluoranthene Filtration Naphthalene Other/Not Sure Pentachlorophenol (PCP)
Observed 15 Acenaphthene Carbon Adsorption Acenaphthylene Filtration
Anthracene Other/Not Sure Arsenic
Benzene and Toluene Benzo(a)anthracene Benzo(a)pyrene Benzo(b)fluoranthene Benzo(k)fluoranthene BTEX Chrysene Creosote and petroleum hydrocarbons Dibenzofuran DNAPL Ethylbenzene
Odessa Chromium #1
Not present 1 Chromium Other/Not Sure
Sprague Road Ground Water
Not present 1 Chromium Ion Exchange
Data reflect estimates provided by site Remedial Project Managers between February and May 2001. These estimates may, in some cases, vary from actuality. Data-- including the number, status, cost, projections, and
specifications of systems-- may change overtime.
City of Perryton Well #2
North Cavalcade Superfund Site
Region 6, Table 5 -- Top Contaminants Identified by RPMsJuly 3, 2001
American Creosote Works
Bayou Bonfouca
System
Region 6 Fund-lead, P&T system Data provided by site RPMs

Nationwide Superfund Reform Initiative
Phase 1 -- Data Collection and System Screening, Region 6
System
Potential Reduction in
Life-Cycle Costs
Potential Life-Cycle Savings
Expected Duration
Previous Evaluation of Effectiveness
Approximate Pumping
Rate (gpm)Number of
Wells
Number of Treatment Processes
Groundwater Samples per
Year
Obstacles to making
(minor/major) changes
American Creosote Works
22.0% $1,093,548 25.6 Sufficient 5 18 3 or more 72Minor
Severe
Bayou Bonfouca 25.5% $1,233,790 20.0 Sufficient 22.5 44 3 or more 132Minor
Moderate
Cimarron Mining 15.0% $2,280,868 Indefinite Not Sufficient 1 3 1 12Moderate Severe
Geneva Industries 8.0% $10,701 2.5 Sufficient 5 13 2 26Minor
Moderate
Midland Products 20.0% $528,408 32.5 Sufficient 3 8 3 or more 40Minor Minor
Odessa Chromium #1 5.0% ($25,000) 0.4 Sufficient 60 6 1 14Minor Minor
City of Perryton Well #2
17.5% $59,346 22.1 Not evaluated 150 1 1 20Minor Minor
North Cavalcade Superfund Site
27.5% ($25,000) 9.4 Not evaluated 19 19 3 or more 0Minor Minor
Sprague Road Ground Water Plume
32.5% $5,653,419 27.2 Not evaluated 200 22 1 200Minor Minor
5. In situ bioremediation is the primary remedial strategy at the American Creosote Works site.6. The remediation at the Odessa Chromium #1 site has been signficantly enhanced by in situ treatment with ferrous sulfate.7. The North Cavalcade system is pre-operational, and no cost estimates for were provided.
4. Previous evaluations of effectiveness may include 5-year reviews but do not include Remediation System Evaluations.
Region 6, Table 6 -- Screening SummaryJuly 3, 2001
Pre
-ope
ratio
nal
Ope
ratio
nal
Notes:
Data reflect estimates provided by site Remedial Project Managers between February and May 2001. These estimates may, in some cases, vary from actuality. Data-- including the number, status, cost, projections, and specifications of systems-- may change overtime.
1. "Potential Reduction in Life-cycle Costs" result from a screening methodology that incorporates system-specific information. The reductions do not include the cost of an RSE. 2. "Potential Life-cycle Savings" were estimated using using system-specific information and incorporate the cost of the RSE. Values in parentheses denote costs (negative savings).3. "Groundwater Samples per Year" is calculated by multiplying the number of monitoring wells sampled by the number of monitoring events per year.
Region 6 Fund-lead, P&T system Data provided by site RPMs
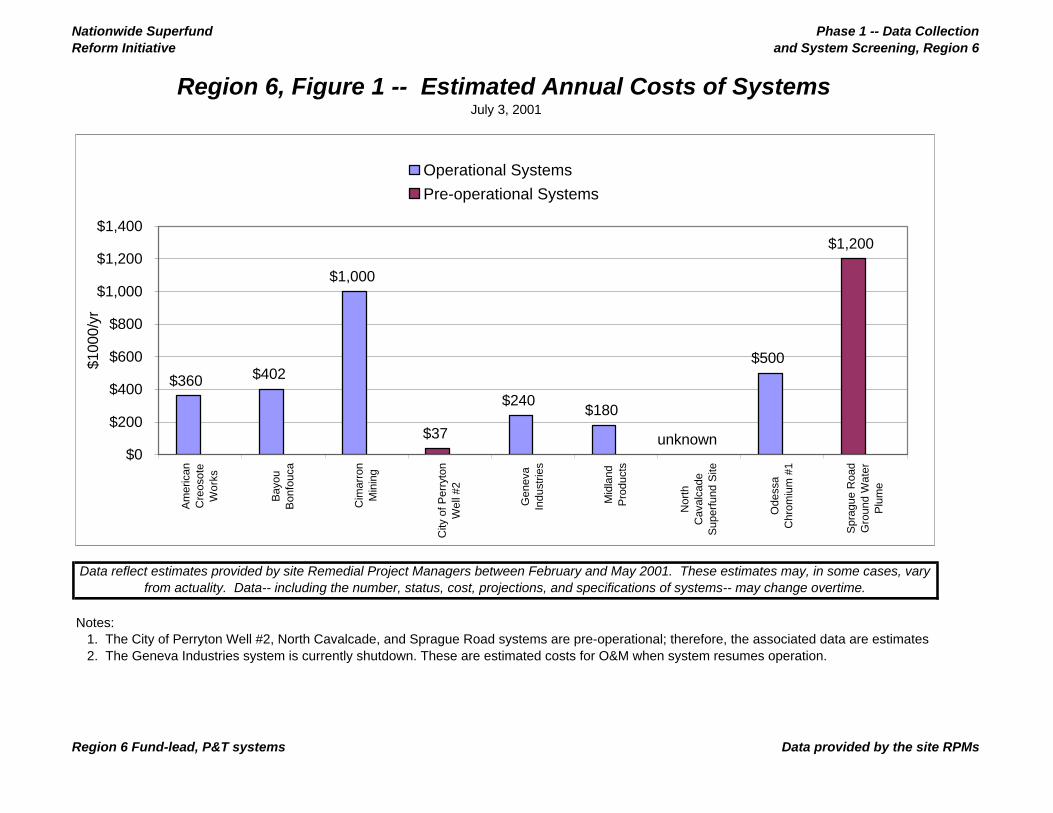
Nationwide Superfund Reform Initiative
Phase 1 -- Data Collection and System Screening, Region 6
2. The Geneva Industries system is currently shutdown. These are estimated costs for O&M when system resumes operation.
Data reflect estimates provided by site Remedial Project Managers between February and May 2001. These estimates may, in some cases, vary from actuality. Data-- including the number, status, cost, projections, and specifications of systems-- may change overtime.
Notes: 1. The City of Perryton Well #2, North Cavalcade, and Sprague Road systems are pre-operational; therefore, the associated data are estimates
Region 6, Figure 1 -- Estimated Annual Costs of SystemsJuly 3, 2001
$360 $402
$1,000
$37
$240$180
$500
$1,200
unknown $0
$200
$400
$600
$800
$1,000
$1,200
$1,400
Am
eric
anC
reos
ote
Wor
ks
Bay
ouB
onfo
uca
Cim
arro
nM
inin
g
City
of P
erry
ton
Wel
l #2
Gen
eva
Indu
strie
s
Mid
land
Pro
duct
s
Nor
thC
aval
cade
Sup
erfu
nd S
ite
Ode
ssa
Chr
omiu
m #
1
Spr
ague
Roa
dG
roun
d W
ater
Plu
me
$100
0/yr
Operational Systems
Pre-operational Systems
Region 6 Fund-lead, P&T systems Data provided by the site RPMs

Nationwide Superfund Reform Initiative
Phase 1 -- Data Collection and System Screening, Region 6
Notes:1. For Cimarron Mining an indefinite completion date was provided by the RPM. 2. The Geneva Industries system currently shutdown due to issues with the contractor.
Data reflect estimates provided by site Remedial Project Managers between February and May 2001. These estimates may, in some cases, vary from actuality. Data-- including the number, status, cost, projections, and specifications of systems-- may change overtime.
July 3, 2001
Region 6, Figure 2 -- System Projections
0.0
5.0
10.0
15.0
20.0
25.0
30.0
35.0
40.0
Am
eric
anC
reos
ote
Wor
ks
Bay
ouB
onfo
uca
Cim
arro
nM
inin
g
City
of P
erry
ton
Wel
l #2
Gen
eva
Indu
strie
s
Mid
land
Pro
duct
s
Nor
thC
aval
cade
Sup
erfu
nd S
ite
Ode
ssa
Chr
omiu
m #
1
Spr
ague
Roa
dG
roun
d W
ater
Plu
me
year
s
Years Until Turnover
Years Until Completion
2021
2026
2031
2036
2041
2001
2006
2011
2016
Indefinite
Region 6 Fund-lead, P&T systems Data provided by the site RPMs

Nationwide Superfund Reform InitiativePhase 1– Data Collection and System Screening
Region 7July 3, 2001
In the OSWER Directive No. 9200.0-33, Transmittal of Final FY00 - FY01 Superfund ReformsStrategy, dated July 7,2000, the Office of Solid Waste and Emergency Response outlined acommitment to optimize our Fund-lead, pump-and-treat (P&T) systems. To fulfill this commitment,Headquarters is assisting Regions in evaluating their Fund-lead operating P&T systems. Phase 1 of thisinitiative involves identifying all Fund-lead P&T system, collecting baseline cost and performance dataon them, and selecting up to two sites in each Region for a Remediation System Evaluation (RSE).
This report summarizes the screening process for Region 7 which was conducted during February2001. The first section of this report presents the cost and performance data for the Region while thesecond describes the screening process and system selection.
The data presented in this report reflect estimates provided by the site Remedial ProjectManagers between January and May 2001. These estimates may vary from actuality. Thedata– including the number, status, cost, specifications, and projections of systems– may
change over time.
Cost and Performance Data
Four Fund-lead P&T systems were identified in Region 7. Of this four,
• one is operational, • two are pre-operational, and• one is complete.
In addition, two sites are still in the investigation stage and have potential to be pump-and-treat.Because a remediation strategy has not yet been selected, these two sites are not discussed further inthis report.
The site that is undergoing completion, Hastings Groundwater Contamination, has reached the MCLafter approximately 10 years of operation.
Cost and performance data and other information pertaining to the identified Fund-lead P&T systems(estimates for the pre-operational systems) were collected with a web-based questionnaire accessedfrom http://www.cluin.org/optimization and stored in a database. This information is summarized inTable 1 and provided in detail in five additional tables:

July 3, 2001 Nationwide Superfund Reform InitiativePhase 1– Data Collection and Site Screening, Region 7
Page 2 of 3
• Table 2 provides overviews of the systems by providing items such as annual costs, lead,status, goals, and progress of each system.
• Table 3 includes the dates marking the signing of the ROD, construction completion,
system operation and function, turnover to the state, and expected close-out.
• Table 4 lists for each system the contact information for the site Remedial ProjectManager, the State Regulator, and the Contractor.
• Table 5 notes for each system and the associated site if NAPLS are present, the topcontaminants of concern, and the above-ground treatment processes.
• Table 6 lists system specifications such as the pumping rate, number of wells, number ofmonitoring events per year, and other items used to determine the complexity of a systemand its potential for optimization.
Projected dates for turnover to the States and for system completion are depicted in Figure 1, andannual costs for each system are depicted in Figure 2.
RSE Site Selection
Evaluation of Sites for Optimization Potential
Once the information is gathered from each of the Fund-lead P&T systems in a given Region, itbecomes input for a screening methodology that attempts to determine the optimization potential foreach system. This, in turn, provides a basis for selecting two systems where RSEs will be performed.
The factors affecting the optimization potential of a system are
• the overall cost of a given system, • the expected duration of the system, • the number of above-ground treatment processes, • the number of extraction wells,• the number of monitoring events per year,• the system downtime per year,• the pumping rate,• the results (if any) of a previous performance and effectiveness evaluation, and• any social or political obstacles to implementing modifications to the system.

July 3, 2001 Nationwide Superfund Reform InitiativePhase 1– Data Collection and Site Screening, Region 7
Page 3 of 3
Table 6 summarizes the results of the screening process including the estimated life-cycle cost savingsthat may result from performing an RSE.
Selecting Sites for RSEs
The following is a list of the identified planned and operating Fund-lead P&T systems and potentialFund-lead P&T systems in Region 7 classified as completed, operational, pre-operational, potential,and no longer operating. As indicated, only one system is operational. By default, it was selected foran RSE and is shown in bold.
CompletedHastings Groundwater Contamination
OperationalCleburn Street Well
Pre-operationalAce ServicesValley Park TCE
PotentialOgallala10th Street Site
Because it is the only operating Fund-lead P&T system in Region 7, Cleburn Street Well, will be thesole recipient of a RSE in this Region.
The Record of Decision (ROD) for the Ogallala site is scheduled for 2002 and may involve P&T. TheROD for the 10th Street site indicated monitoring with a contingency plan for P&T; however, during siteactivities an additional source was discovered and the site is has returned to the remedial-investigationstatus.

Nationwide Superfund Reform Initiative
Phase 1 -- Data Collection and System Screening, Region 7
Hastings Groundwater Contamination
Number of systems 3Number that are EPA lead 2 of 3Number that are State lead 1 of 3
Number that are operational 1Number that are pre-operational 2Number where restoration is a goal 3 of 3Number where the plume is controlled* 0 of 1Number that are estimated to be more than 80% complete* 0 of 1Number previously evaluated and effectiveness found sufficient* 0 of 1Number previously evaluated and effectiveness found not sufficient* 0 of 1
Number where NAPLs are observed 1 of 3Number with more than 1 major contaminant identified 1 of 3Number with 3 or more treatment processes 0 of 3
Average estimated annual O&M cost (including monitoring) $300,000Average estimated annual monitoring cost $25,000Average number of years until turnover to the States 8.4Average number of years until completion 15.7
*Operational sites only
10th Street Site (back in Remedial Investigation)
Region 7, Table 1 -- SummaryJuly 3, 2001
System Status
Operational and Pre-operational Fund-lead P&T Systems
Completed Fund-lead P&T Systems
Data reflect estimates provided by site Remedial Project Managers between February and May 2001. These estimates may, in some cases, vary from actuality. Data-- including the number, status, cost, projections, and specifications of systems-- may change overtime.
No-Longer-Operating Fund-lead P&T Systems
Extent of Contamination
Average Costs and Time Frames
Region 7 Fund-lead, P&T systems Data provided by the site RPMs

Nationwide Superfund Reform Initiative
Phase 1 -- Data Collection and System Screening, Region 7
SystemEstimated
Annual Cost LeadType of
RODSystem Status System Goals
Plume Under Control?
Estimated Progress of Restoration
Previous Evaluation of Effectiveness
Ace Services $500,000 EPA Final DesignContainment &
RestorationN/A N/A Not evaluated
Cleburn Street Well Site/OU2
$100,000 EPA Final OperationalContainment &
RestorationUnknown Unknown Not evaluated
Valley Park TCE Site - OU2
unknownState with
Fund MoneyFinal Predesign
Containment & Restoration
N/A N/A Not evaluated
Notes:
3. Previous evaluations of effectiveness may include 5-year reviews but do not include Remediation Systems Evaluations.
Region 7, Table 2 -- System OverviewsJuly 3, 2001
Data reflect estimates provided by site Remedial Project Managers between February and May 2001. These estimates may, in some cases, vary from actuality. Data-- including the number, status, cost, projections, and specifications of systems-- may change overtime.
1. Ace Services and Valley Park TCE are pre-operational systems; therefore, the associated data are estimates and some items are unknown.2. "Estimated Progress of Restoration" refers to the estimated portion of the plume that has been restored to cleanup levels.
Region 7 Fund-lead, P&T systems Data provided by the site RPMs

Nationwide Superfund Reform Initiative
Phase 1 -- Data Collection and System Screening, Region 7
System Original RODLast ROD
ModificationConstruction Completed
Operational and Functional
Turnover to State
Years Until Turnover
Expected Completion
Years Until Completion
Ace Services 5/5/99 9/2002 9/2003 9/2013 12.2 9/2015 14.2
Cleburn Street Well Site/OU2
6/7/96 9/1998 10/1999 12/2009 8.4 12/2019 18.4
Valley Park TCE Site - OU2
8/15/01 1/2005 1/2006 1/2006 4.5 1/2016 14.5
Region 7, Table 3 -- P&T System Histories and Projections
Date
July 3, 2001
Data reflect estimates provided by site Remedial Project Managers between February and May 2001. These estimates may, in some cases, vary from actuality. Data-- including the number, status, cost, projections, and specifications of systems-- may change overtime.
Region 7 Fund-lead, P&T systems Data provided by the site RPMs

Nationwide Superfund Reform Initiative
Phase 1 -- Data Collection and System Screening, Region 7
RPM State Regulator Primary Contractor
1 Bob Stewart Cynthia Randall Gary FelknerEPA Region 7 Kansas Dept of Health and Environment Black & Veatch Special Projects Corp901 N. 5th St Forbes Field, Bldg 20 8400 Ward ParkwayKansas City, KS 66101 Topeka, KS 66620 Kansas City, MO 64114913-551-7654 785-291-3245 913-458-6583913-551-9654 (fax) 785-296-4823 (fax) 913-458-9391 (fax)[email protected] [email protected] [email protected]
2 Mary Peterson Ralph Martin David SandersEPA Region 7 Nebraska Department of Environmental Black and Veatch Special Projects Corp.901 North 5th Street 1200 N Street, Suite 400 The Atrium 6601 College BoulevardKansas City, KS 66101 Lincoln, NE 68509-8922 Overland Park, KS 66211913-551-7882 402-471-3120 913-458-6605913-551-7063 (fax) 402-471-2909 (fax) 913-458-0000 (fax)[email protected] [email protected] [email protected]
3 Steve Auchterlonie Dave MosbyEPA Region 7 MDNR - Superfund Unit901 N. 5th St. P.O. Box 176Kansas City, KS 66101 Jefferson City, MO 65102-0176913-551-7778 573-751-1288913-551-7437 (fax) 573-751-7869 (fax)[email protected] [email protected]
Cleburn Street Well Site/OU2
Valley Park TCE Site - OU2
Region 7, Table 4 -- System Contact InformationJuly 3, 2001
System
Ace Services
Region 7 Fund-lead, P&T Systems Information provided by site RPMs

Nationwide Superfund Reform Initiative
Phase 1 -- Data Collection and System Screening, Region 7
NAPLS Present?
# of Identified Contam. Contaminants
Treatment Processes
Ace Services Observed 1 Chromium Ion Exchange
Cleburn Street Well Site/OU2
Don't know 1 Trichlorethylene (TCE)/Tetrachloroelthylene (PCE) Air Stripping
Not present 2 1,1,1-Trichloroethane Air Stripping Trichlorethylene (TCE)/Tetrachloroelthylene (PCE)
Data reflect estimates provided by site Remedial Project Managers between February and May 2001. These estimates may, in some cases, vary from actuality. Data-- including the number, status, cost, projections, and
specifications of systems-- may change overtime.
Region 7, Table 5 -- Top Contaminants Identified by RPMsJuly 3, 2001
System
Valley Park TCE Site - OU2
Region 7 Fund-lead, P&T system Data provided by site RPMs

Nationwide Superfund Reform Initiative
Phase 1 -- Data Collection and System Screening, Region 7
System
Potential Reduction in
Life-Cycle Costs
Potential Life-Cycle Savings
Expected Duration
Previous Evaluation of Effectiveness
Approximate Pumping
Rate (gpm)
Number of Extraction
Wells
Number of Treatment Processes
Groundwater Samples per
Year
Obstacles to making
(minor/major) changes
Cleburn Street Well Site/OU2
17.5% $179,042 18.4 Not evaluated 90 3 1 32Minor Minor
Ace Services 32.5% $1,557,210 14.2 Not evaluated 800 12 1 124Minor Minor
Valley Park TCE Site - OU2
unknown unknown 14.5 Not evaluated unknown unknown 1 unknownMinor Minor
Data reflect estimates provided by site Remedial Project Managers between February and May 2001. These estimates may, in some cases, vary from actuality. Data-- including the number, status, cost, projections, and specifications of systems-- may change overtime.
Region 7, Table 6 -- Screening SummaryJuly 3, 2001
Operational
Pre-Operational
4. Previous evaluations of effectiveness may include 5-year reviews but do not include Remediation System Evaluations.
Notes: 1. "Potential Reduction in Life-cycle Costs" result from a screening methodology that incorporates system-specific information. The reductions do not include the cost of an RSE. 2. "Potential Life-cycle Savings" were estimated using using system-specific information and incorporate the cost of the RSE. Values in parentheses denote costs (negative savings).3. "Groundwater Samples per Year" is calculated by multiplying the number of monitoring wells sampled by the number of monitoring events per year.
Region 7 Fund-lead, P&T system Data provided by site RPMs

Nationwide Superfund Reform Initiative
Phase 1 -- Data Collection and System Screening, Region 7
Notes:
Data reflect estimates provided by site Remedial Project Managers between February and May 2001. These estimates may, in some cases, vary from actuality. Data-- including the number, status, cost, projections, and specifications of systems-- may change overtime.
1. Ace Services and Valley Park TCE are pre-operational systems; therefore, the associated data are estimates and some items are unknown.
Region 7, Figure 1 -- Estimated Annual Costs of SystemsJuly 3, 2001
$100
$500
unknown $0
$200
$400
$600
$800
$1,000
$1,200
$1,400
Ace
Ser
vice
s
Cle
burn
Str
eet
Wel
l Site
/OU
2
Val
ley
Par
kT
CE
Site
- O
U2
$100
0/yr
Operational Systems
Pre-operational Systems
Region 7 Fund-lead, P&T systems Data provided by the site RPMs

Nationwide Superfund Reform Initiative
Phase 1 -- Data Collection and System Screening, Region 7
Data reflect estimates provided by site Remedial Project Managers between February and May 2001. These estimates may, in some cases, vary from actuality. Data-- including the number, status, cost, projections, and specifications of systems-- may change overtime.
July 3, 2001
Region 7, Figure 2 -- System Projections
0.0
5.0
10.0
15.0
20.0
25.0
30.0
35.0
40.0
Ace
Ser
vice
s
Cle
burn
Str
eet W
ell
Site
/OU
2
Val
ley
Par
k T
CE
Site
- O
U2
year
s
Years Until Turnover
Years Until Completion
2021
2026
2031
2036
2041
2001
2006
2011
2016
Region 7 Fund-lead, P&T systems Data provided by the site RPMs

Nationwide Superfund Reform InitiativePhase 1– Data Collection and System Screening
Region 9July 3, 2001
In the OSWER Directive No. 9200.0-33, Transmittal of Final FY00 - FY01 Superfund ReformsStrategy, dated July 7,2000, the Office of Solid Waste and Emergency Response outlined acommitment to optimize our Fund-lead, pump-and-treat (P&T) systems. To fulfill this commitment,Headquarters is assisting Regions in evaluating their Fund-lead operating P&T systems. Phase 1 of thisinitiative involves identifying all Fund-lead P&T system, collecting baseline cost and performance dataon them, and selecting up to two sites in each Region for a Remediation System Evaluation (RSE).
This report summarizes the screening process for Region 9 which was conducted from January throughApril 2001. The first section of this report presents the cost and performance data for the Region whilethe second describes the screening process and system selection.
The data presented in this report reflect estimates provided by the site Remedial ProjectManagers between January and May 2001. These estimates may vary from actuality. Thedata– including the number, status, cost, specifications, and projections of systems– may
change over time.
Cost and Performance Data
Four Fund-lead P&T systems were identified in Region 9. Of this four, two are classified asoperational and two are classified as pre-operational (i.e., pre-design, design, being installed, orinstalled but not operating). Region 9 has a number of other Fund-lead sites; however, these sites areclassified as well-head treatment projects rather than P&T systems and are not considered in thisproject.
Cost and performance data and other information pertaining to the identified Fund-lead P&T systems(estimates for the pre-operational system) were collected with a web-based questionnaire accessedfrom http://www.cluin.org/optimization and stored in a database. This information is summarized inTable 1 and provided in detail in five additional tables:
• Table 2 provides overviews of the systems by providing items such as annual costs, lead,status, goals, and progress of each system.
• Table 3 includes the dates marking the signing of the ROD, construction completion,
system operation and function, turnover to the state, and expected close-out.

July 3, 2001 Nationwide Superfund Reform InitiativePhase 1– Data Collection and Site Screening, Region 9
Page 2 of 3
• Table 4 lists for each system the contact information for the site Remedial ProjectManager, the State Regulator, and the Contractor.
• Table 5 notes for each system and the associated site if NAPLS are present, the topcontaminants of concern, and the above-ground treatment processes.
• Table 6 lists system specifications such as the pumping rate, number of wells, number ofmonitoring events per year, and other items used to determine the complexity of a systemand its potential for optimization.
Projected dates for turnover to the States and for system completion are depicted in Figure 1, andannual costs for each system are depicted in Figure 2.
RSE Site Selection
Evaluation of Sites for Optimization Potential
Once the information is gathered from each of the Fund-lead P&T systems in a given Region, itbecomes input for a screening methodology that attempts to determine the optimization potential foreach system. This, in turn, provides a basis for selecting two systems where RSEs will be performed.
The factors affecting the optimization potential of a system are
• the overall cost of a given system, • the expected duration of the system, • the number of above-ground treatment processes, • the number of extraction wells,• the number of monitoring events per year,• the system downtime per year,• the pumping rate,• the results (if any) of a previous performance and effectiveness evaluation, and• any social or political obstacles to implementing modifications to the system.
Table 6 summarizes the results of the screening process including the estimated life-cycle cost savingsthat may result from performing an RSE.

July 3, 2001 Nationwide Superfund Reform InitiativePhase 1– Data Collection and Site Screening, Region 9
Page 3 of 3
Selecting Two Sites for RSEs
The following is a list of the identified Fund-lead P&T systems in Region 9 classified as operational andpre-operational. Those in bold were selected for RSEs.
OperationalNewmarkSelma Pressure Treating
Pre-operationalModestoMuscoy
Selma Pressure Treating and Modesto were selected for RSEs. Despite its operational status and highoperating costs, Newmark was not selected for an RSE due to political complications. Modesto,although classified as pre-operational, is scheduled to be operational and funcational in May 2001,which is approximately two months before an RSE would be conducted. Due to the lack of otheroperating Fund-lead P&T systems in the Region, and the existing (although minimal) operational history,Modesto was selected as the second site in Region 9 to receive an RSE.

Nationwide Superfund Reform Initiative
Phase 1 -- Data Collection and System Screening, Region 9
Number of systems 4Number that are EPA lead 4 of 4Number that are State lead 0 of 4
Number that are operational 2Number that are pre-operational 2Number where restoration is a goal 1 of 4Number where the plume is controlled* 2 of 2Number that are estimated to be more than 80% complete* 0 of 2Number previously evaluated and effectiveness found sufficient* 1 of 2Number previously evaluated and effectiveness found not sufficient* 0 of 2
Number where NAPLs are observed 1 of 4Number with more than 1 major contaminant identified 3 of 4Number with 3 or more treatment processes 0 of 4
Average estimated annual O&M cost (including monitoring) $650,000Average estimated annual monitoring cost $65,000Average number of years until turnover to the States 9.6Average number of years until completion 19.7
*Operational sites only
Data reflect estimates provided by site Remedial Project Managers between February and May 2001. These estimates may, in some cases, vary from actuality. Data-- including the number, status, cost, projections, and specifications of systems-- may change overtime.
Extent of Contamination
Average Costs and Time Frames
Region 9, Table 1 -- SummaryJuly 3, 2001
System Status
Operational and Pre-operational Fund-lead P&T Systems
Completed Fund-lead P&T Systems
Region 9 Fund-lead, P&T systems Data provided by the site RPMs

Nationwide SuperfundReform Initiative
Phase 1 -- Data Collection and System Screening, Region 9
SystemEstimated
Annual Cost LeadType of
RODSystem Status System Goals
Plume Under Control?
Estimated Progress of Restoration
Previous Evaluation of Effectiveness
Modesto Superfund Site $300,000 EPA Interim Installed Containment N/A N/A Not evaluated
Muscoy $1,100,000 EPA Interim Installed Containment N/A N/A Not evaluated
Newmark $900,000 EPA Interim Operational Containment Yes Unknown Not evaluated
Selma Treating Co. $300,000 EPA Final OperationalContainment &
RestorationYes less than 20% Sufficient
Notes:
3. Previous evaluations of effectiveness may include 5-year reviews but do not include Remediation Systems Evaluations.
Region 9, Table 2 -- System OverviewsJuly 3, 2001
Data reflect estimates provided by site Remedial Project Managers between February and May 2001. These estimates may, in some cases, vary from actuality. Data-- including the number, status, cost, projections, and specifications of systems-- may change overtime.
1. Modesto and Muscoy are pre-operational systems; therefore, the associated data are estimates and some items are unknown.2. "Estimated Progress of Restoration" refers to the estimated portion of the plume that has been restored to cleanup levels.
Region 9 Fund-lead, P&T systems Data provided by the site RPMs

Nationwide Superfund Reform Initiative
Phase 1 -- Data Collection and System Screening, Region 9
System Original RODLast ROD
ModificationConstruction Completed
Operational and Functional
Turnover to State
Years Until Turnover
Expected Completion
Years Until Completion
Modesto Superfund Site 9/26/97 7/2000 5/2002 5/2012 10.8 5/2022 20.8
Muscoy 3/24/95 10/2003 10/2004 10/2014 13.3 10/2024 23.3
Newmark 8/4/93 10/1998 10/1998 10/2008 7.3 10/2028 27.3
Selma Treating Co. 9/24/88 6/30/01 9/1998 10/1998 10/2008 7.3 10/2008 7.3
Region 9, Table 3 -- P&T System Histories and Projections
Date
July 3, 2001
Data reflect estimates provided by site Remedial Project Managers between February and May 2001. These estimates may, in some cases, vary from actuality. Data-- including the number, status, cost, projections, and specifications of systems-- may change overtime.
Region 9 Fund-lead, P&T systems Data provided by the site RPMs

Nationwide Superfund Reform Initiative
Phase 1 -- Data Collection and System Screening, Region 9
RPM State Regulator Primary Contractor
1 David Seter Emanuel Mensah Chris LichensEPA Region 9 State of California, DTSC Ecology and Environment75 Hawthorne Street 5796 Corporate Avenue 415-981-2811San Francisco, CA 94105 Cypress, CA 90630415-744-2212 [email protected]
2 Kim Hoang Yasser Aref Dwayne DuetcherEPA Region 9 CalEPA Department of Toxic Substances URS75 Hawthorne Street 5796 Corporate AvenueSan Francisco, CA 94105 Cypress, CA 90630415-744-2370 [email protected]
3 Kim Hoang Yasser Aref Dwayne DuetcherEPA Region 9 CalEPA Dept Toxic Substances Control URS75 Hawthorne Street 5796 Corporate Ave.San Francisco, CA 94105 Cypress, CA 90630415-744-2370 [email protected]
4 Michelle Lau Chris Sherman John KirschbaumEPA Region 9 DPES Army Corps of Engineers, Omaha District75 Hawthorne Street 10151 Croyden Way, Suite 3 12565 West Center RoadSan Francisco, CA 94105 Sacramento, CA 95827 Omaha, NE 68144-3869415-744-2227 916-255-3706 402-293-2525415-744-2180 (fax) 916-255-3697 (fax) 402-221-7838 (fax)[email protected]
Muscoy
Newmark
Selma Treating Co.
Region 9, Table 4 -- System Contact InformationJuly 3, 2001
System
Modesto Superfund Site
Region 9 Fund-lead, P&T Systems Information provided by site RPMs

Nationwide Superfund Reform Initiative
Phase 1 -- Data Collection and System Screening, Region 9
NAPLS Present?
# of Identified Contam. Contaminants Treatment Processes
Don't know 2 perchloroethylene Air Stripping Carbon Adsorption
Muscoy Don't know 1 Trichlorethylene (TCE)/Tetrachloroelthylene (PCE) Carbon AdsorptionNewmark Don't know 1 Trichlorethylene (TCE)/Tetrachloroelthylene (PCE) Carbon AdsorptionSelma Treating Co.
Not present1
Chromium Filtration
Data reflect estimates provided by site Remedial Project Managers between February and May 2001. These estimates may, in some cases, vary from actuality. Data-- including the number, status, cost, projections, and
specifications of systems-- may change overtime.
Region 9, Table 5 -- Top Contaminants Identified by RPMsJuly 3, 2001
Modesto Superfund Site
System
Region 9 Fund-lead, P&T system Data provided by site RPMs

Nationwide Superfund Reform Initiative
Phase 1 -- Data Collection and System Screening, Region 9
System
Potential Reduction in
Life-Cycle Costs
Potential Life-Cycle Savings
Expected Duration
Previous Evaluation of Effectiveness
Approximate Pumping
Rate (gpm)
Number of Extraction
Wells
Number of Treatment Processes
Groundwater Samples per
Year
Obstacles to making
(minor/major) changes
Newmark 25.5% $3,321,528 27.3 Not evaluated 12000 8 1 30Minor
Moderate
Selma Treating Co. 17.0% $261,332 7.3 Sufficient 150 6 1 80Minor
Severe
Modesto Superfund Site
20.0% $730,227 20.8 Not evaluated 50 1 2 40Minor Minor
Muscoy 27.0% $3,958,747 23.3 Not evaluated 9000 5 1 60Minor
Severe
4. Previous evaluations of effectiveness may include 5-year reviews but do not include Remediation System Evaluations.
Notes: 1. "Potential Reduction in Life-cycle Costs" result from a screening methodology that incorporates system-specific information. The reductions do not include the cost of an RSE. 2. "Potential Life-cycle Savings" were estimated using using system-specific information and incorporate the cost of the RSE. Values in parentheses denote costs (negative savings).3. "Groundwater Samples per Year" is calculated by multiplying the number of monitoring wells sampled by the number of monitoring events per year.
Data reflect estimates provided by site Remedial Project Managers between February and May 2001. These estimates may, in some cases, vary from actuality. Data-- including the number, status, cost, projections, and specifications of systems-- may change overtime.
Region 9, Table 6 -- Screening SummaryJuly 3, 2001
Operational
Pre-Operational
Region 9 Fund-lead, P&T system Data provided by site RPMs

Nationwide SuperfundReform Initiative
Phase 1 -- Data Collection and System Screening, Region 9
Data reflect estimates provided by site Remedial Project Managers between February and May 2001. These estimates may, in some cases, vary from actuality. Data-- including the number, status, cost, projections, and specifications of systems-- may change overtime.
Region 9, Figure 1 -- Estimated Annual Costs of SystemsJuly 3, 2001
$900
$300$300
$1,100
$0
$200
$400
$600
$800
$1,000
$1,200
$1,400
Mod
esto
Sup
erfu
nd S
ite
Mus
coy
New
mar
k
Sel
ma
Tre
atin
gC
o.
$100
0/yr
Operational Systems
Pre-operational Systems
Region 9 Fund-lead, P&T systems Data provided by the site RPMs
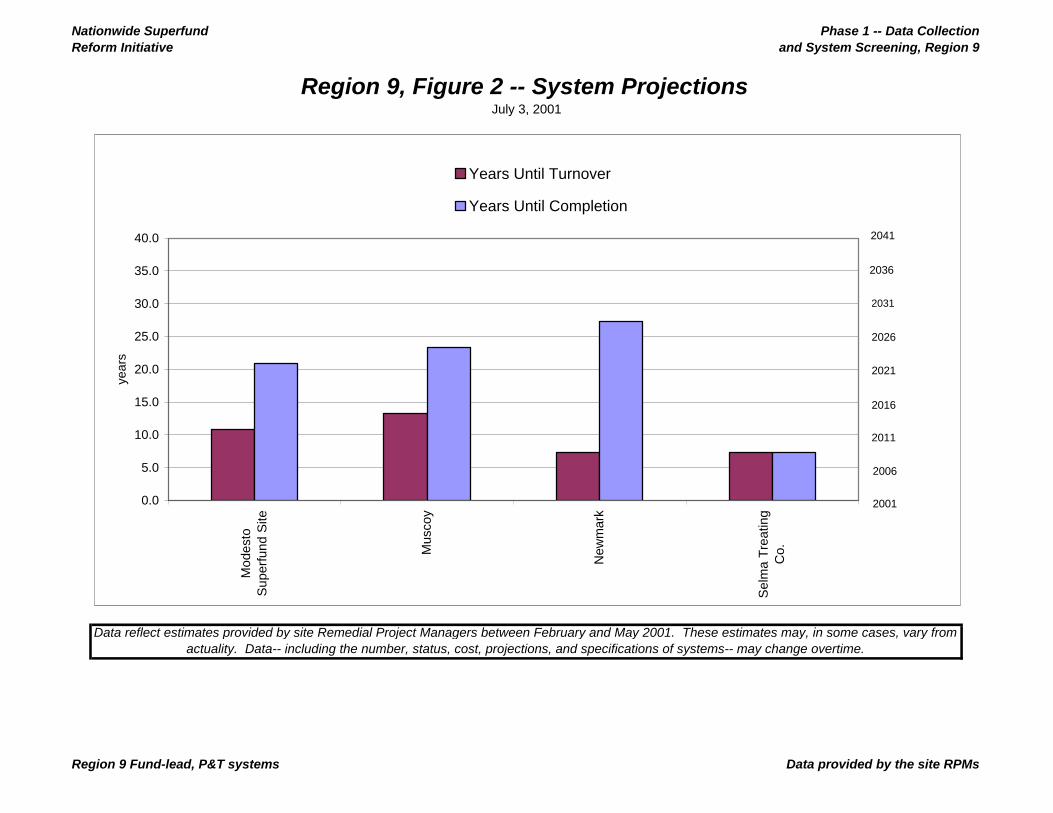
Nationwide Superfund Reform Initiative
Phase 1 -- Data Collection and System Screening, Region 9
Data reflect estimates provided by site Remedial Project Managers between February and May 2001. These estimates may, in some cases, vary from actuality. Data-- including the number, status, cost, projections, and specifications of systems-- may change overtime.
July 3, 2001
Region 9, Figure 2 -- System Projections
0.0
5.0
10.0
15.0
20.0
25.0
30.0
35.0
40.0M
odes
toS
uper
fund
Site
Mus
coy
New
mar
k
Sel
ma
Tre
atin
gC
o.
year
s
Years Until Turnover
Years Until Completion
2021
2026
2031
2036
2041
2001
2006
2011
2016
Region 9 Fund-lead, P&T systems Data provided by the site RPMs

Nationwide Superfund Reform InitiativePhase 1– Data Collection and System Screening
Region 10July 3, 2001
In the OSWER Directive No. 9200.0-33, Transmittal of Final FY00 - FY01 Superfund ReformsStrategy, dated July 7,2000, the Office of Solid Waste and Emergency Response outlined acommitment to optimize our Fund-lead, pump-and-treat (P&T) systems. To fulfill this commitment,Headquarters is assisting Regions in evaluating their Fund-lead operating P&T systems. Phase 1 of thisinitiative involves identifying all Fund-lead P&T system, collecting baseline cost and performance dataon them, and selecting up to two sites in each Region for a Remediation System Evaluation (RSE).
This report summarizes the screening process for Region 10 which was conducted during Januarythrough March 2001. The first section of this report presents the cost and performance data for theRegion while the second describes the screening process and system selection.
The data presented in this report reflect estimates provided by the site Remedial ProjectManagers between January and May 2001. These estimates may vary from actuality. Thedata– including the number, status, cost, specifications, and projections of systems– may
change over time.
Cost and Performance Data
Five Fund-lead P&T systems were identified in Region 10. Of this five, four are operational and one ispre-operational (i.e., pre-design, design, being installed, or installed but not operating).
Cost and performance data and other information pertaining to the identified Fund-lead P&T systems(estimates for the pre-operational systems) were collected with a web-based questionnaire accessedfrom http://www.cluin.org/optimization and stored in a database. This information is summarized inTable 1 and provided in detail in five additional tables:
• Table 2 provides overviews of the systems by providing items such as annual costs, lead,status, goals, and progress of each system.
• Table 3 includes the dates marking the signing of the ROD, construction completion,
system operation and function, turnover to the state, and expected close-out.
• Table 4 lists for each system the contact information for the site Remedial ProjectManager, the State Regulator, and the Contractor.

July 3, 2001 Nationwide Superfund Reform InitiativePhase 1– Data Collection and Site Screening, Region 10
Page 2 of 3
• Table 5 notes for each system and the associated site if NAPLS are present, the topcontaminants of concern, and the above-ground treatment processes.
• Table 6 lists system specifications such as the pumping rate, number of wells, number ofmonitoring events per year, and other items used to determine the complexity of a systemand its potential for optimization.
Projected dates for turnover to the States and for system completion are depicted in Figure 1, andannual costs for each system are depicted in Figure 2.
RSE Site Selection
Evaluation of Sites for Optimization Potential
Once the information is gathered from each of the Fund-lead P&T systems in a given Region, itbecomes input for a screening methodology that attempts to determine the optimization potential foreach system. This, in turn, provides a basis for selecting two systems where RSEs will be performed.
The factors affecting the optimization potential of a system are
• the overall cost of a given system, • the expected duration of the system, • the number of above-ground treatment processes, • the number of extraction wells,• the number of monitoring events per year,• the system downtime per year,• the pumping rate,• the results (if any) of a previous performance and effectiveness evaluation, and• any social or political obstacles to implementing modifications to the system.
To estimate potential life-cycle savings from optimization, a default reduction in life-cycle costs of 20%is assumed and is adjusted based on the above factors. For example, according to the screeningmethodology, a system with many above-ground treatment processes and a high pumping rate mayexhibit greater than a 20% reduction in life-cycle costs whereas a system with few extraction wells andone treatment process may exhibit less than a 20% reduction in life-cycle costs.
Table 6 summarizes the results of the screening process including the estimated life-cycle cost savingsthat may result from performing an RSE.

July 3, 2001 Nationwide Superfund Reform InitiativePhase 1– Data Collection and Site Screening, Region 10
Page 3 of 3
Selecting Two Sites for RSEs
The following is a list of the identified Fund-lead P&T systems in Region 10 classified as operationaland pre-operational. Those in bold were selected for RSEs.
OperationalMcCormick and Baxter CreosotingBoomsnub/AircoCommencement Bay/South Tacoma Channel 12AWyckoff Co./Eagle Harbor
Pre-operationalBunker Hill
Only operational systems were considered for RSEs in this Region. Because Boomsnub/Airco isanticipating transition to the responsible party, substantial cost savings to the Superfund program wouldnot be realized by optimizing this site. Because a pilot study to determine the effectiveness of steaminjection at Wyckoff Co./Eagle Harbor is planned for the summer of 2001 and the site managers arealready investigating alternative technologies, this site was not selected for an RSE. Thus,Commencement Bay/South Tacoma Channel 12A and McCormick and Baxter are the two sitesselected to receive RSEs in Region 10.

Nationwide Superfund Reform Initiative
Phase 1 -- Data Collection and System Screening, Region 10
Number of systems 5Number that are EPA lead 4 of 5Number that are State lead 1 of 5
Number that are operational 4Number that are pre-operational 1Number where restoration is a goal 3 of 5Number where the plume is controlled* 3 of 4Number that are estimated to be more than 80% complete* 0 of 4Number previously evaluated and effectiveness found sufficient* 2 of 4Number previously evaluated and effectiveness found not sufficient* 2 of 4
Number where NAPLs are observed 3 of 5Number with more than 1 major contaminant identified 5 of 5Number with 3 or more treatment processes 3 of 5
Average estimated annual O&M cost (including monitoring) $512,500Average estimated annual monitoring cost $57,800Average number of years until turnover to the States 13.9Average number of years until completion 29.4
*Operational sites only
Data reflect estimates provided by site Remedial Project Managers between February and May 2001. These estimates may, in some cases, vary from actuality. Data-- including the number, status, cost, projections, and specifications of systems-- may change overtime.
Extent of Contamination
Average Costs and Time Frames
Region 10, Table 1 -- SummaryJuly 3, 2001
System Status
Operational and Pre-operational Fund-lead P&T Systems
Completed Fund-lead P&T Systems
Region 10 Fund-lead, P&T systems Data provided by the site RPMs

Nationwide Superfund Reform Initiative
Phase 1 -- Data Collection and System Screening, Region 10
SystemEstimated
Annual Cost LeadType of
RODSystem Status System Goals
Plume Under Control?
Estimated Progress of Restoration
Previous Evaluation of Effectiveness
Boomsnub/Airco / Site-Wide Ground Water OU
$1,000,000 EPA Final OperationalContainment &
RestorationYes Unknown Sufficient
Bunker Hill Superfund Site
unknown EPA Final Predesign Restoration N/A N/A Not evaluated
Commencement Bay, South Tacoma Channel, Well 12A
$300,000 EPA Final OperationalContainment &
RestorationYes less than 20% Not Sufficient
McCormick & Baxter Creosoting Co.
$250,000 State with
Fund MoneyFinal Operational Containment No
Restoration is not a goal
Sufficient
Wyckoff/Eagle Harbor Superfund Site
$500,000 EPA Interim Operational Containment YesRestoration is
not a goalNot Sufficient
Notes:
3. Previous evaluations of effectiveness may include 5-year reviews but do not include Remediation System Evaluations.
Region 10, Table 2 -- System OverviewsJuly 3, 2001
Data reflect estimates provided by site Remedial Project Managers between February and May 2001. These estimates may, in some cases, vary from actuality. Data-- including the number, status, cost, projections, and specifications of systems-- may change overtime.
1. Bunker Hill Superfund Site is pre-operational; therefore, the associated data are estimates and some items are unknown.2. "Estimated Progress of Restoration" refers to the estimated portion of the plume that has been restored to cleanup levels.
Region 10 Fund-lead, P&T systems Data provided by the site RPMs

Nationwide Superfund Reform Initiative
Phase 1 -- Data Collection and System Screening, Region 10
System Original RODLast ROD
ModificationConstruction Completed
Operational and Functional
Turnover to State
Years Until Turnover
Expected Completion
Years Until Completion
Boomsnub/Airco / Site-Wide Ground Water OU
2/3/00 10/2000 12/2001 12/2011 10.4 10/2030 29.3
Bunker Hill Superfund Site
9/1/92 12/2010 12/2020 12/2030 29.4 12/2050 49.4
Commencement Bay, South Tacoma Channel, Well 12A
1/1/85 1/1/87 6/1988 5/1988 1/2004 2.5 1/2011 9.5
McCormick & Baxter Creosoting Co.
3/1/96 3/1/98 3/1996 3/1996 3/2006 4.7 Indefinite Indefinite
Wyckoff/Eagle Harbor Superfund Site
9/29/94 2/1990 2/1990 1/2024 22.5 Indefinite Indefinite
Region 10, Table 3 -- P&T System Histories and Projections
Date
July 3, 2001
Data reflect estimates provided by site Remedial Project Managers between February and May 2001. These estimates may, in some cases, vary from actuality. Data-- including the number, status, cost, projections, and specifications of systems-- may change overtime.
Region 10 Fund-lead, P&T systems Data provided by the site RPMs
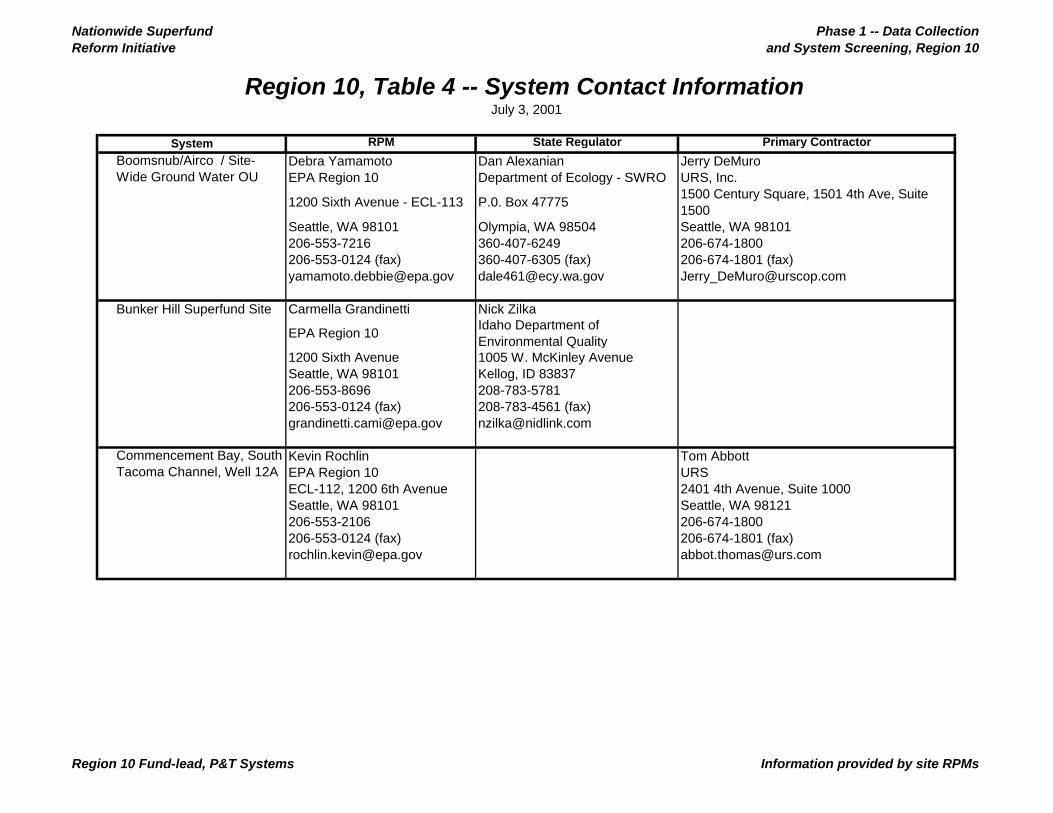
Nationwide Superfund Reform Initiative
Phase 1 -- Data Collection and System Screening, Region 10
RPM State Regulator Primary Contractor
1 Debra Yamamoto Dan Alexanian Jerry DeMuroEPA Region 10 Department of Ecology - SWRO URS, Inc.
1200 Sixth Avenue - ECL-113 P.0. Box 477751500 Century Square, 1501 4th Ave, Suite 1500
Seattle, WA 98101 Olympia, WA 98504 Seattle, WA 98101206-553-7216 360-407-6249 206-674-1800206-553-0124 (fax) 360-407-6305 (fax) 206-674-1801 (fax)[email protected] [email protected] [email protected]
2 Bunker Hill Superfund Site Carmella Grandinetti Nick Zilka
EPA Region 10Idaho Department of Environmental Quality
1200 Sixth Avenue 1005 W. McKinley AvenueSeattle, WA 98101 Kellog, ID 83837206-553-8696 208-783-5781206-553-0124 (fax) 208-783-4561 (fax)[email protected] [email protected]
3 Kevin Rochlin Tom AbbottEPA Region 10 URSECL-112, 1200 6th Avenue 2401 4th Avenue, Suite 1000Seattle, WA 98101 Seattle, WA 98121206-553-2106 206-674-1800206-553-0124 (fax) 206-674-1801 (fax)[email protected] [email protected]
Region 10, Table 4 -- System Contact InformationJuly 3, 2001
SystemBoomsnub/Airco / Site-Wide Ground Water OU
Commencement Bay, South Tacoma Channel, Well 12A
Region 10 Fund-lead, P&T Systems Information provided by site RPMs

Nationwide Superfund Reform Initiative
Phase 1 -- Data Collection and System Screening, Region 10
RPM State Regulator Primary Contractor
Region 10, Table 4 -- System Contact InformationJuly 3, 2001
SystemBoomsnub/Airco / Site-4 Alan Goodman William Dana John Montgomery
EPA Region 10 Oregon Dept. Env. Quality Ecology and Environment811 SW 6th Avenue, 3rd Floor 811 SW 6th Avenue 333 SW FifthPortland, OR 97204 Portland, OR 97204 Portland, OR 97204503-326-3685 503-229-6530 503-248-5600503-326-3399 (fax) 503-229-5830 (fax) 503-248-5577 (fax)[email protected] [email protected]. [email protected]
5 Hanh Gold Guy Barrett Ken Scheffler
EPA Region 10State of Washington Department of Ecology
CH2M HILL
1200 Sixth Avenue, ECL-115 P.O. Box 47600 P.O. Box 91500Seattle, WA 98101 Olympia, WA 98504-7600 Bellevue, WA 98009-2050206-553-0171 360-407-7244 425-453-5000206-553-0124 (fax) 360-407-7154 (fax) 425-462-5957 (fax)[email protected] [email protected] [email protected]
Wyckoff/Eagle Harbor Superfund Site
McCormick & Baxter Creosoting Co.
Region 10 Fund-lead, P&T Systems Information provided by site RPMs

Nationwide Superfund Reform Initiative
Phase 1 -- Data Collection and System Screening, Region 10
NAPLS Present?
# of Identified Contam. Contaminants
Treatment Processes
Suspected 6 1,1,1-Trichloroethane Air Stripping 1,1-Dichloroethylene (DCE) Carbon Adsorption
1,2-Dichloroethane Ion ExchangeTrichlorethylene (TCE)/Tetrachloroelthylene (PCE)
Hexavalent Chromium Total Chromium
Not present 7 Asbestos Other/Not Sure Creosote Lindane Merphos RDX (cyclonite) Selenium
Volatile organic compounds (VOCs) Observed 5 1,1,2,2-Tetrachloroethane Carbon Adsorption
1,2-Dichloroethene Cis-1,2-dichloroethene TCE and Vinyl chloride Trans 1,2-Dichloroethylene
Observed 4 Arsenic Carbon Adsorption Chlorinated polyaromatic hydrocarbons (CPAHs) Filtration Creosote/Pentachlorophenol (PCP) Ion Exchange Pentachlorophenol (PCP) Other/Not Sure
Observed 6 Benzo(a)anthracene Biological Benzo(a)pyrene Carbon Adsorption
Benzo(b)fluoranthene Filtration Benzo(g,h,i)perylene Pentachlorophenol (PCP) Polynuclear Aromatic Hydrocarbons
2. Other treatment processes at the McCormick and Baxter Creosoting Co. include dissolved air flotation (DAF) and NAPL separation.
Data reflect estimates provided by site Remedial Project Managers between February and May 2001. These estimates may, in some cases, vary from actuality. Data-- including the number, status, cost, projections, and
specifications of systems-- may change overtime.
Notes: 1. Bunker Hill Superfund Site is pre-operational, and treatment processes are not yet determined.
Commencement Bay, South Tacoma Channel, Well 12A
McCormick & Baxter Creosoting Co.
Wyckoff/Eagle Harbor Superfund Site
Region 10, Table 5 -- Top Contaminants Identified by RPMsJuly 3, 2001
System
Boomsnub/Airco / Site-Wide Ground Water OU
Bunker Hill Superfund Site
Region 10 Fund-lead, P&T system Data provided by site RPMs

Nationwide Superfund Reform Initiative
Phase 1 -- Data Collection and System Screening, Region 10
System
Potential Reduction in
Life-Cycle Costs
Potential Life-Cycle Savings
Expected Duration
Previous Evaluation of Effectiveness
Approximate Pumping Rate
(gpm)
Number of Extraction
Wells
Number of Treatment Processes
Groundwater Samples per
Year
Obstacles to making
(minor/major) changes
Boomsnub/Airco / Site-Wide Ground Water OU
27.5% $4,123,527 29.3 Sufficient 135 22 3 160Moderate Severe
Commencement Bay, South Tacoma Channel, Well 12A
23.0% $465,677 9.5 Not Sufficient 150 5 1 40Minor
Moderate
McCormick & Baxter Creosoting Co.
30.0% $1,127,934 Indefinite Sufficient 3 6 4 50Minor Minor
Wyckoff/Eagle Harbor Superfund Site
25.5% $1,934,988 Indefinite Not Sufficient 80 8 3 20Minor
Moderate
Pre
-ope
ratio
nal
Bunker Hill Superfund Site
unknown unknown 49.4 Not evaluated 0 0 Unknown 232Minor Minor
Region 10, Table 6 -- Screening SummaryJuly 3, 2001
Ope
ratio
nal
4. "Groundwater Samples per Year" is calculated by multiplying the number of monitoring wells sampled by the number of monitoring events per year.
Notes:
5. Previous evaluations of effectiveness may include 5-year reviews but do not include Remediation System Evaluations.
Data reflect estimates provided by site Remedial Project Managers between February and May 2001. These estimates may, in some cases, vary from actuality. Data-- including the number, status, cost, projections, and specifications of systems-- may change overtime.
1. Annual O&M costs and system specifications have not been determined for the Bunker Hill Superfund Site.2. "Potential Reduction in Life-cycle Costs" result from a screening methodology that incorporates system-specific information. The reductions do not include the cost of an RSE.3. "Potential Life-cycle Savings" were estimated using using system-specific information and incorporate the cost of the RSE. Values in parentheses denote costs (negative savings).
Region 10 Fund-lead, P&T system Data provided by site RPMs

Nationwide Superfund Reform Initiative
Phase 1 -- Data Collection and System Screening, Region 10
Notes:
Data reflect estimates provided by site Remedial Project Managers between February and May 2001. These estimates may, in some cases, vary from actuality. Data-- including the number, status, cost, projections, and specifications of systems-- may change overtime.
1. Bunker Hill Superfund Site is pre-operational, and O&M costs have not been estimated.
July 3, 2001
Region 10, Figure 1 -- Estimated Annual Costs of Systems
$1,000
$300
$500
$250
unknown $0
$100
$200
$300
$400
$500
$600
$700
$800
$900
$1,000B
oom
snub
/Airc
o/ S
ite-W
ide
Gro
und
Wat
erO
U
Bun
ker
Hill
Sup
erfu
nd S
ite
Com
men
cem
ent
Bay
, Sou
thT
acom
aC
hann
el, W
ell
12A
McC
orm
ick
&B
axte
rC
reos
otin
g C
o.
Wyc
koff/
Eag
leH
arbo
rS
uper
fund
Site
$100
0/yr
Operational Systems
Pre-operational Systems
Region 10 Fund-lead, P&T systems Data provided by the site RPMs

Nationwide Superfund Reform Initiative
Phase 1 -- Data Collection and System Screening, Region 10
Data reflect estimates provided by site Remedial Project Managers between February and May 2001. These estimates may, in some cases, vary from actuality. Data-- including the number, status, cost, projections, and specifications of systems-- may change overtime.
July 3, 2001
Region 10, Figure 2 -- System Projections
0.0
5.0
10.0
15.0
20.0
25.0
30.0
35.0
40.0
Boo
msn
ub/A
irco
/ Site
-Wid
eG
roun
d W
ater
OU
Bun
ker
Hill
Sup
erfu
nd S
ite
Com
men
cem
ent
Bay
, Sou
thT
acom
a C
hann
el,
Wel
l 12A
McC
orm
ick
&B
axte
rC
reos
otin
g C
o.
Wyc
koff/
Eag
leH
arbo
rS
uper
fund
Site
year
s
Years Until Turnover
Years Until Completion
2021
2026
2031
2036
2041
2001
2006
2011
2016
50 years Indefinite Indefinite
Region 10 Fund-lead, P&T systems Data provided by the site RPMs

APPENDIX C
REGION 1 SCREENING CALCULATIONS

1RPM First Name: Melissa Date of implementation:RPM Last Name: TaylorRPM phone: 617-918-1310RPM fax: 617-918-1291RPM email: [email protected]
Name of Site: Baird & McGuire Superfund SiteSite City: HolbrookSite State: MASite Region: 1
Units Value
$/yr $3,500,000yrs 21.3 <-max of 30 yrs% 5.00%
$ $45,191,087
Units AnswerPotential
Savings (%) Range in Lookup Table
% 20.0%
Performance evaluation? A-C C -2.5% Performance evaluated and found sufficient# 7 0.0% 5 to 9 wells
gpm 150 0.0% 100 to 500 gpmwks 2 2.5% 2.00 - 3.99 wks
# 4 5.0% 4 or more processes# 80 5.0% 75 or more
yrs 21.3 0.0% 20 yrs or moreA-F E -2.5% moderate difficulty for minor changes, severe for major changes
27.5%
27.5% (must be between 5% and 40%)
Summary$45,191,087
Estimated potential savings (%): - 27.5%Subtotal $12,427,549
Estimated RSE cost (Tier 3): - $25,000$12,402,549
**Note:Estimated potential savings do not include costs associated with implementing actual system modifications
January 1, 2002
# of above-ground water treatment processesGW monitoring (number wells * events-per-yr)
Down time per year
Optimization Factor
Number of pumping wellsPumping rate
<------ Estimated potential savings ($)
Summation (%) ->
Estimated potential savings (%) ->
Annual O&M costExpected durationDiscount rate
Baseline present value:
Expected system durationPolitical/Social factors (minor changes)
Potential savings (initial estimate)
Cost Item
Baseline present value ->

2RPM First Name: Elaine Date of implementation:RPM Last Name: StanleyRPM phone: 617-918-1332RPM fax: 617-918-1291RPM email: [email protected]
Name of Site: Charles George Landfill Superfund SiteSite City: TyngsboroSite State: MASite Region: 1
Units Value
$/yr $450,000yrs 26.7 <-max of 30 yrs% 5.00%
$ $6,552,022
Units AnswerPotential
Savings (%) Range in Lookup Table
% 20.0%
Performance evaluation? A-C A 2.5% Performance not evaluated# 9 0.0% 5 to 9 wells
gpm 30 -2.5% 10 to 99.99 gpmwks 2 2.5% 2.00 - 3.99 wks
# 1 -2.5% 0 or 1 processes# 40 0.0% 25.00 to 49.99
yrs 26.7 0.0% 20 yrs or moreA-F E -2.5% moderate difficulty for minor changes, severe for major changes
17.5%
17.5% (must be between 5% and 40%)
Summary$6,552,022
Estimated potential savings (%): - 17.5%Subtotal $1,146,604
Estimated RSE cost (Tier 3): - $25,000$1,121,604
**Note:Estimated potential savings do not include costs associated with implementing actual system modifications
Potential savings (initial estimate)
Cost Item
Baseline present value ->
<------ Estimated potential savings ($)
Summation (%) ->
Estimated potential savings (%) ->
Annual O&M costExpected durationDiscount rate
Baseline present value:
Expected system durationPolitical/Social factors (minor changes)
January 1, 2002
# of above-ground water treatment processesGW monitoring (number wells * events-per-yr)
Down time per year
Optimization Factor
Number of pumping wellsPumping rate

3RPM First Name: Edward Date of implementation:RPM Last Name: HathawayRPM phone: 617-918-1372RPM fax: 617-918-1291RPM email: [email protected]
Name of Site: Eastern Surplus Company Superfund SiteSite City: MeddybempsSite State: MESite Region: 1
Units Value
$/yr $200,000yrs 5.7 <-max of 30 yrs% 5.00%
$ $966,468
Units AnswerPotential
Savings (%) Range in Lookup Table
% 20.0%
Performance evaluation? A-C A 2.5% Performance not evaluated# 12 2.5% 10 or more wells
gpm 20 -2.5% 10 to 99.99 gpmwks 2 2.5% 2.00 - 3.99 wks
# 3 2.5% 3 processes# 60 2.5% 50.00 to 74.99
yrs 5.7 -5.0% 5.00 - 9.99 yrsA-F B 3.0% little difficulty for minor changes, moderate for major changes
28.0%
28.0% (must be between 5% and 40%)
Summary$966,468
Estimated potential savings (%): - 28.0%Subtotal $270,611
Estimated RSE cost (Tier 3): - $25,000$245,611
**Note:Estimated potential savings do not include costs associated with implementing actual system modifications
January 1, 2002
# of above-ground water treatment processesGW monitoring (number wells * events-per-yr)
Down time per year
Optimization Factor
Number of pumping wellsPumping rate
<------ Estimated potential savings ($)
Summation (%) ->
Estimated potential savings (%) ->
Annual O&M costExpected durationDiscount rate
Baseline present value:
Expected system durationPolitical/Social factors (minor changes)
Potential savings (initial estimate)
Cost Item
Baseline present value ->

4RPM First Name: Derrick Date of implementation:RPM Last Name: GoldenRPM phone: 617-918-1448RPM fax: 617-918-1291RPM email: [email protected]
Name of Site: Groveland Wells Superfund SiteSite City: GrovelandSite State: MASite Region: 1
Units Value
$/yr $500,000yrs 29.3 <-max of 30 yrs% 5.00%
$ $7,601,834
Units AnswerPotential
Savings (%) Range in Lookup Table
% 20.0%
Performance evaluation? A-C C -2.5% Performance evaluated and found sufficient# 10 2.5% 10 or more wells
gpm 140 0.0% 100 to 500 gpmwks 1 0.0% <2 wks
# 4 5.0% 4 or more processes# 21 -2.5% <25
yrs 29.3 0.0% 20 yrs or moreA-F A 5.0% little difficulty for minor changes or major changes
27.5%
27.5% (must be between 5% and 40%)
Summary$7,601,834
Estimated potential savings (%): - 27.5%Subtotal $2,090,504
Estimated RSE cost (Tier 3): - $25,000$2,065,504
**Note:Estimated potential savings do not include costs associated with implementing actual system modifications
Potential savings (initial estimate)
Cost Item
Baseline present value ->
<------ Estimated potential savings ($)
Summation (%) ->
Estimated potential savings (%) ->
Annual O&M costExpected durationDiscount rate
Baseline present value:
Expected system durationPolitical/Social factors (minor changes)
January 1, 2002
# of above-ground water treatment processesGW monitoring (number wells * events-per-yr)
Down time per year
Optimization Factor
Number of pumping wellsPumping rate

5RPM First Name: Dick Date of implementation:RPM Last Name: GoehlertRPM phone: 617-918-1335RPM fax: 617-918-1291RPM email: [email protected]
Name of Site: Kearsarge Metallurgical Corp.Site City: ConwaySite State: NHSite Region: 1
Units Value
$/yr $250,000yrs 3.7 <-max of 30 yrs% 5.00%
$ $819,414
Units AnswerPotential
Savings (%) Range in Lookup Table
% 20.0%
Performance evaluation? A-C C -2.5% Performance evaluated and found sufficient# 14 2.5% 10 or more wells
gpm 42 -2.5% 10 to 99.99 gpmwks 4 5.0% 4 wks or more
# 2 0.0% 2 processes# 60 2.5% 50.00 to 74.99
yrs 3.7 -15.0% 2.00 - 4.99yrsA-F D 0.0% moderate difficulty for minor changes or major changes
10.0%
10.0% (must be between 5% and 40%)
Summary$819,414
Estimated potential savings (%): - 10.0%Subtotal $81,941
Estimated RSE cost (Tier 3): - $25,000$56,941
**Note:Estimated potential savings do not include costs associated with implementing actual system modifications
January 1, 2002
# of above-ground water treatment processesGW monitoring (number wells * events-per-yr)
Down time per year
Optimization Factor
Number of pumping wellsPumping rate
<------ Estimated potential savings ($)
Summation (%) ->
Estimated potential savings (%) ->
Annual O&M costExpected durationDiscount rate
Baseline present value:
Expected system durationPolitical/Social factors (minor changes)
Potential savings (initial estimate)
Cost Item
Baseline present value ->

6RPM First Name: Cheryl Date of implementation:RPM Last Name: SpragueRPM phone: 617 918-1244RPM fax: 617 918-1291RPM email: [email protected]
Name of Site: Keefe Environmental SystemsSite City: EppingSite State: NHSite Region: 1
Units Value
$/yr $200,000yrs 1.7 <-max of 30 yrs% 5.00%
$ $312,230
Units AnswerPotential
Savings (%) Range in Lookup Table
% 20.0%
Performance evaluation? A-C C -2.5% Performance evaluated and found sufficient# 4 -2.5% 3 to 4 wells
gpm 20 -2.5% 10 to 99.99 gpmwks 2 2.5% 2.00 - 3.99 wks
# 3 2.5% 3 processes# 82 5.0% 75 or more
yrs 1.7 -20.0% <2 yrsA-F A 5.0% little difficulty for minor changes or major changes
7.5%
7.5% (must be between 5% and 40%)
Summary$312,230
Estimated potential savings (%): - 7.5%Subtotal $23,417
Estimated RSE cost (Tier 3): - $25,000-$1,583
**Note:Estimated potential savings do not include costs associated with implementing actual system modifications
Potential savings (initial estimate)
Cost Item
Baseline present value ->
<------ Estimated potential savings ($)
Summation (%) ->
Estimated potential savings (%) ->
Annual O&M costExpected durationDiscount rate
Baseline present value:
Expected system durationPolitical/Social factors (minor changes)
January 1, 2002
# of above-ground water treatment processesGW monitoring (number wells * events-per-yr)
Down time per year
Optimization Factor
Number of pumping wellsPumping rate

7RPM First Name: RICHARD Date of implementation:RPM Last Name: GOEHLERTRPM phone: 617-918-1335RPM fax: 617-918-1291RPM email: [email protected]
Name of Site: Savage Well Municipal Water SystemSite City: MilfordSite State: NHSite Region: 1
Units Value
$/yr $500,000yrs 7.2 <-max of 30 yrs% 5.00%
$ $2,950,900
Units AnswerPotential
Savings (%) Range in Lookup Table
% 20.0%
Performance evaluation? A-C A 2.5% Performance not evaluated# 4 -2.5% 3 to 4 wells
gpm 100 0.0% 100 to 500 gpmwks 4 5.0% 4 wks or more
# 3 2.5% 3 processes# 114 5.0% 75 or more
yrs 7.2 -5.0% 5.00 - 9.99 yrsA-F A 5.0% little difficulty for minor changes or major changes
32.5%
32.5% (must be between 5% and 40%)
Summary$2,950,900
Estimated potential savings (%): - 32.5%Subtotal $959,042
Estimated RSE cost (Tier 3): - $25,000$934,042
**Note:Estimated potential savings do not include costs associated with implementing actual system modifications
January 1, 2002
# of above-ground water treatment processesGW monitoring (number wells * events-per-yr)
Down time per year
Optimization Factor
Number of pumping wellsPumping rate
<------ Estimated potential savings ($)
Summation (%) ->
Estimated potential savings (%) ->
Annual O&M costExpected durationDiscount rate
Baseline present value:
Expected system durationPolitical/Social factors (minor changes)
Potential savings (initial estimate)
Cost Item
Baseline present value ->

8RPM First Name: Chester Date of implementation:RPM Last Name: JanowskiRPM phone: 617-918-1324RPM fax: 617-918-1291RPM email: [email protected]
Name of Site: Silresim Chemical Corp.Site City: LowellSite State: MASite Region: 1
Units Value
$/yr $1,400,000yrs 15.9 <-max of 30 yrs% 5.00%
$ $15,126,499
Units AnswerPotential
Savings (%) Range in Lookup Table
% 20.0%
Performance evaluation? A-C B 5.0% Performance evaluated and found insufficient# 31 2.5% 10 or more wells
gpm 25 -2.5% 10 to 99.99 gpmwks 2 2.5% 2.00 - 3.99 wks
# 4 5.0% 4 or more processes# 94 5.0% 75 or more
yrs 15.9 -2.5% 10.00 - 19.99 yrsA-F A 5.0% little difficulty for minor changes or major changes
40.0%
40.0% (must be between 5% and 40%)
Summary$15,126,499
Estimated potential savings (%): - 40.0%Subtotal $6,050,600
Estimated RSE cost (Tier 3): - $25,000$6,025,600
**Note:Estimated potential savings do not include costs associated with implementing actual system modifications
Potential savings (initial estimate)
Cost Item
Baseline present value ->
<------ Estimated potential savings ($)
Summation (%) ->
Estimated potential savings (%) ->
Annual O&M costExpected durationDiscount rate
Baseline present value:
Expected system durationPolitical/Social factors (minor changes)
January 1, 2002
# of above-ground water treatment processesGW monitoring (number wells * events-per-yr)
Down time per year
Optimization Factor
Number of pumping wellsPumping rate

REGION 2 SCREENING CALCULATIONS

1RPM First Name: Christos Date of implementation:RPM Last Name: TsiamisRPM phone: 212-637-4257RPM fax: 212-637-3966RPM email: [email protected]
Name of Site: American ThermostatSite City: South CairoSite State: NYSite Region: 2
Units Value
$/yr $1,175,000yrs 26.7 <-max of 30 yrs% 5.00%
$ $17,108,057
Units AnswerPotential
Savings (%) Range in Lookup Table
% 20.0%
Performance evaluation? A-C C -2.5% Performance evaluated and found sufficient# 14 2.5% 10 or more wells
gpm 70 -2.5% 10 to 99.99 gpmwks 0 0.0% <2 wks
# 4 5.0% 4 or more processes# 228 5.0% 75 or more
yrs 26.7 0.0% 20 yrs or moreA-F C 2.0% little difficulty for minor changes, severe for major changes
29.5%
29.5% (must be between 5% and 40%)
Summary 0
$17,108,057Estimated potential savings (%): - 29.5%
Subtotal $5,046,877Estimated RSE cost (Tier 3): - $25,000
$5,021,877
**Note:Estimated potential savings do not include costs associated with implementing actual system modifications
January 1, 2002
# of above-ground water treatment processesGW monitoring (number wells * events-per-yr)
Down time per year
Optimization Factor
Number of pumping wellsPumping rate
<------ Estimated potential savings ($)
Summation (%) ->
Estimated potential savings (%) ->
Annual O&M costExpected durationDiscount rate
Baseline present value:
Expected system durationPolitical/Social factors (minor changes)
Potential savings (initial estimate)
Cost Item
Baseline present value ->

2RPM First Name: Edward Date of implementation:RPM Last Name: FinnertyRPM phone: 212 637 4367RPM fax: 212-637-4393RPM email: [email protected]
Name of Site: Bog Creek Farm LTRASite City: HowellSite State: NJSite Region: 2
Units Value
$/yr $460,000yrs 22.9 <-max of 30 yrs% 5.00%
$ $6,194,718
Units AnswerPotential
Savings (%) Range in Lookup Table
% 20.0%
Performance evaluation? A-C C -2.5% Performance evaluated and found sufficient# 33 2.5% 10 or more wells
gpm 30 -2.5% 10 to 99.99 gpmwks 4 5.0% 4 wks or more
# 4 5.0% 4 or more processes# 9 -2.5% <25
yrs 22.9 0.0% 20 yrs or moreA-F A 5.0% little difficulty for minor changes or major changes
30.0%
30.0% (must be between 5% and 40%)
Summary 0
$6,194,718Estimated potential savings (%): - 30.0%
Subtotal $1,858,415Estimated RSE cost (Tier 3): - $25,000
$1,833,415
**Note:Estimated potential savings do not include costs associated with implementing actual system modifications
Potential savings (initial estimate)
Cost Item
Baseline present value ->
<------ Estimated potential savings ($)
Summation (%) ->
Estimated potential savings (%) ->
Annual O&M costExpected durationDiscount rate
Baseline present value:
Expected system durationPolitical/Social factors (minor changes)
January 1, 2002
# of above-ground water treatment processesGW monitoring (number wells * events-per-yr)
Down time per year
Optimization Factor
Number of pumping wellsPumping rate

3RPM First Name: Lisa Date of implementation:RPM Last Name: WongRPM phone: 212-637-4267RPM fax: 212-637-3966RPM email: [email protected]
Name of Site: Brewster WellfieldSite City: BrewsterSite State: NYSite Region: 2
Units Value
$/yr $400,000yrs 5.8 <-max of 30 yrs% 5.00%
$ $1,957,217
Units AnswerPotential
Savings (%) Range in Lookup Table
% 20.0%
Performance evaluation? A-C A 2.5% Performance not evaluated# 4 -2.5% 3 to 4 wells
gpm 50 -2.5% 10 to 99.99 gpmwks 0 0.0% <2 wks
# 1 -2.5% 0 or 1 processes# 64 2.5% 50.00 to 74.99
yrs 5.8 -5.0% 5.00 - 9.99 yrsA-F A 5.0% little difficulty for minor changes or major changes
17.5%
17.5% (must be between 5% and 40%)
Summary 0
$1,957,217Estimated potential savings (%): - 17.5%
Subtotal $342,513Estimated RSE cost (Tier 3): - $25,000
$317,513
**Note:Estimated potential savings do not include costs associated with implementing actual system modifications
January 1, 2002
# of above-ground water treatment processesGW monitoring (number wells * events-per-yr)
Down time per year
Optimization Factor
Number of pumping wellsPumping rate
<------ Estimated potential savings ($)
Summation (%) ->
Estimated potential savings (%) ->
Annual O&M costExpected durationDiscount rate
Baseline present value:
Expected system durationPolitical/Social factors (minor changes)
Potential savings (initial estimate)
Cost Item
Baseline present value ->

4RPM First Name: Sharon Date of implementation:RPM Last Name: TrocherRPM phone: 212-637-3965RPM fax: 212-637-3966RPM email: [email protected]
Name of Site: CircuitronSite City: East FarmingdaleSite State: NYSite Region: 2
Units Value
$/yr $480,000yrs 1.4 <-max of 30 yrs% 5.00%
$ $639,836
Units AnswerPotential
Savings (%) Range in Lookup Table
% 20.0%
Performance evaluation? A-C C -2.5% Performance evaluated and found sufficient# 3 -2.5% 3 to 4 wells
gpm 80 -2.5% 10 to 99.99 gpmwks 6 5.0% 4 wks or more
# 3 2.5% 3 processes# 76 5.0% 75 or more
yrs 1.4 -20.0% <2 yrsA-F B 3.0% little difficulty for minor changes, moderate for major changes
8.0%
8.0% (must be between 5% and 40%)
Summary 0
$639,836Estimated potential savings (%): - 8.0%
Subtotal $51,187Estimated RSE cost (Tier 3): - $25,000
$26,187
**Note:Estimated potential savings do not include costs associated with implementing actual system modifications
Potential savings (initial estimate)
Cost Item
Baseline present value ->
<------ Estimated potential savings ($)
Summation (%) ->
Estimated potential savings (%) ->
Annual O&M costExpected durationDiscount rate
Baseline present value:
Expected system durationPolitical/Social factors (minor changes)
January 1, 2002
# of above-ground water treatment processesGW monitoring (number wells * events-per-yr)
Down time per year
Optimization Factor
Number of pumping wellsPumping rate

5RPM First Name: Maria Date of implementation:RPM Last Name: JonRPM phone: 212-637-3967RPM fax: 212-637-4284RPM email: [email protected]
Name of Site: Claremont PolychemicalSite City: Town of Oyster BaySite State: NYSite Region: 2
Units Value
$/yr $740,000yrs 18.1 <-max of 30 yrs% 5.00%
$ $8,678,999
Units AnswerPotential
Savings (%) Range in Lookup Table
% 20.0%
Performance evaluation? A-C A 2.5% Performance not evaluated# 3 -2.5% 3 to 4 wells
gpm 420 0.0% 100 to 500 gpmwks 2 2.5% 2.00 - 3.99 wks
# 3 2.5% 3 processes# 56 2.5% 50.00 to 74.99
yrs 18.1 -2.5% 10.00 - 19.99 yrsA-F A 5.0% little difficulty for minor changes or major changes
30.0%
30.0% (must be between 5% and 40%)
Summary 0
$8,678,999Estimated potential savings (%): - 30.0%
Subtotal $2,603,700Estimated RSE cost (Tier 3): - $25,000
$2,578,700
**Note:Estimated potential savings do not include costs associated with implementing actual system modifications
January 1, 2002
# of above-ground water treatment processesGW monitoring (number wells * events-per-yr)
Down time per year
Optimization Factor
Number of pumping wellsPumping rate
<------ Estimated potential savings ($)
Summation (%) ->
Estimated potential savings (%) ->
Annual O&M costExpected durationDiscount rate
Baseline present value:
Expected system durationPolitical/Social factors (minor changes)
Potential savings (initial estimate)
Cost Item
Baseline present value ->

6RPM First Name: Pamela J. Date of implementation:RPM Last Name: BaxterRPM phone: 212-637-4416RPM fax: 212-637-4393RPM email: [email protected]
Name of Site: Combe Fill South LandfillSite City: Chester TownshipSite State: NJSite Region: 2
Units Value
$/yr $920,000yrs 26.7 <-max of 30 yrs% 5.00%
$ $13,395,245
Units AnswerPotential
Savings (%) Range in Lookup Table
% 20.0%
Performance evaluation? A-C B 5.0% Performance evaluated and found insufficient# 19 2.5% 10 or more wells
gpm 121 0.0% 100 to 500 gpmwks 1 0.0% <2 wks
# 4 5.0% 4 or more processes# 72 2.5% 50.00 to 74.99
yrs 26.7 0.0% 20 yrs or moreA-F B 3.0% little difficulty for minor changes, moderate for major changes
38.0%
38.0% (must be between 5% and 40%)
Summary 0
$13,395,245Estimated potential savings (%): - 38.0%
Subtotal $5,090,193Estimated RSE cost (Tier 3): - $25,000
$5,065,193
**Note:Estimated potential savings do not include costs associated with implementing actual system modifications
Potential savings (initial estimate)
Cost Item
Baseline present value ->
<------ Estimated potential savings ($)
Summation (%) ->
Estimated potential savings (%) ->
Annual O&M costExpected durationDiscount rate
Baseline present value:
Expected system durationPolitical/Social factors (minor changes)
January 1, 2002
# of above-ground water treatment processesGW monitoring (number wells * events-per-yr)
Down time per year
Optimization Factor
Number of pumping wellsPumping rate

7RPM First Name: Diego Date of implementation:RPM Last Name: GarciaRPM phone: 212-637-4947RPM fax: RPM email: [email protected]
Name of Site: Dover Municipal Well 4Site City: DoverSite State: NJSite Region: 2
Units Value
$/yr $0yrs 0.0 <-max of 30 yrs% 5.00%
$ $0
Units AnswerPotential
Savings (%) Range in Lookup Table
% 20.0%
Performance evaluation? A-C 0.0 #N/A #N/A# 0 0.0% no wells (e.g., drains, etc.)
gpm 0 -5.0% <10 gpmwks 0 0.0% <2 wks
# 0 -2.5% 0 or 1 processes# 0 -2.5% <25
yrs 0.0 -20.0% <2 yrsA-F A 5.0% little difficulty for minor changes or major changes
#N/A
#N/A (must be between 5% and 40%)
Summary 0
$0Estimated potential savings (%): - #N/A
Subtotal #N/AEstimated RSE cost (Tier 3): - $25,000
#N/A
**Note:Estimated potential savings do not include costs associated with implementing actual system modifications
January 1, 2002
# of above-ground water treatment processesGW monitoring (number wells * events-per-yr)
Down time per year
Optimization Factor
Number of pumping wellsPumping rate
<------ Estimated potential savings ($)
Summation (%) ->
Estimated potential savings (%) ->
Annual O&M costExpected durationDiscount rate
Baseline present value:
Expected system durationPolitical/Social factors (minor changes)
Potential savings (initial estimate)
Cost Item
Baseline present value ->

8RPM First Name: Brian Date of implementation:RPM Last Name: QuinnRPM phone: 212-637-4381RPM fax: 212-637-4393RPM email: [email protected]
Name of Site: Garden State Cleaners/South Jersey Clothing CompanySite City: MinotolaSite State: NJSite Region: 2
Units Value
$/yr $500,000yrs 27.7 <-max of 30 yrs% 5.00%
$ $7,409,547
Units AnswerPotential
Savings (%) Range in Lookup Table
% 20.0%
Performance evaluation? A-C A 2.5% Performance not evaluated# 15 2.5% 10 or more wells
gpm 300 0.0% 100 to 500 gpmwks 0 0.0% <2 wks
# 2 0.0% 2 processes# 54 2.5% 50.00 to 74.99
yrs 27.7 0.0% 20 yrs or moreA-F A 5.0% little difficulty for minor changes or major changes
32.5%
32.5% (must be between 5% and 40%)
Summary 0
$7,409,547Estimated potential savings (%): - 32.5%
Subtotal $2,408,103Estimated RSE cost (Tier 3): - $25,000
$2,383,103
**Note:Estimated potential savings do not include costs associated with implementing actual system modifications
Potential savings (initial estimate)
Cost Item
Baseline present value ->
<------ Estimated potential savings ($)
Summation (%) ->
Estimated potential savings (%) ->
Annual O&M costExpected durationDiscount rate
Baseline present value:
Expected system durationPolitical/Social factors (minor changes)
January 1, 2002
# of above-ground water treatment processesGW monitoring (number wells * events-per-yr)
Down time per year
Optimization Factor
Number of pumping wellsPumping rate

9RPM First Name: Pamela J. Date of implementation:RPM Last Name: BaxterRPM phone: 212-637-4416RPM fax: 212-637-4393RPM email: [email protected]
Name of Site: Higgins FarmSite City: Franklin TownshipSite State: NJSite Region: 2
Units Value
$/yr $1,000,000yrs 26.7 <-max of 30 yrs% 5.00%
$ $14,560,049
Units AnswerPotential
Savings (%) Range in Lookup Table
% 20.0%
Performance evaluation? A-C A 2.5% Performance not evaluated# 20 2.5% 10 or more wells
gpm 30 -2.5% 10 to 99.99 gpmwks 4 5.0% 4 wks or more
# 4 5.0% 4 or more processes# 102 5.0% 75 or more
yrs 26.7 0.0% 20 yrs or moreA-F B 3.0% little difficulty for minor changes, moderate for major changes
40.5%
40.0% (must be between 5% and 40%)
Summary 0
$14,560,049Estimated potential savings (%): - 40.0%
Subtotal $5,824,020Estimated RSE cost (Tier 3): - $25,000
$5,799,020
**Note:Estimated potential savings do not include costs associated with implementing actual system modifications
January 1, 2002
# of above-ground water treatment processesGW monitoring (number wells * events-per-yr)
Down time per year
Optimization Factor
Number of pumping wellsPumping rate
<------ Estimated potential savings ($)
Summation (%) ->
Estimated potential savings (%) ->
Annual O&M costExpected durationDiscount rate
Baseline present value:
Expected system durationPolitical/Social factors (minor changes)
Potential savings (initial estimate)
Cost Item
Baseline present value ->

10RPM First Name: Mark Date of implementation:RPM Last Name: DannenbergRPM phone: 212-637-4251RPM fax: 212-637-3966RPM email: [email protected]
Name of Site: Islip Municipal LandfillSite City: IslipSite State: NYSite Region: 2
Units Value
$/yr $225,000yrs 1.0 <-max of 30 yrs% 5.00%
$ $214,286
Units AnswerPotential
Savings (%) Range in Lookup Table
% 20.0%
Performance evaluation? A-C C -2.5% Performance evaluated and found sufficient# 6 0.0% 5 to 9 wells
gpm 300 0.0% 100 to 500 gpmwks 1 0.0% <2 wks
# 2 0.0% 2 processes# 96 5.0% 75 or more
yrs 1.0 -20.0% <2 yrsA-F A 5.0% little difficulty for minor changes or major changes
7.5%
7.5% (must be between 5% and 40%)
Summary 0
$214,286Estimated potential savings (%): - 7.5%
Subtotal $16,071Estimated RSE cost (Tier 3): - $25,000
-$8,929
**Note:Estimated potential savings do not include costs associated with implementing actual system modifications
Potential savings (initial estimate)
Cost Item
Baseline present value ->
<------ Estimated potential savings ($)
Summation (%) ->
Estimated potential savings (%) ->
Annual O&M costExpected durationDiscount rate
Baseline present value:
Expected system durationPolitical/Social factors (minor changes)
January 1, 2002
# of above-ground water treatment processesGW monitoring (number wells * events-per-yr)
Down time per year
Optimization Factor
Number of pumping wellsPumping rate

11RPM First Name: Lawrence Date of implementation:RPM Last Name: GraniteRPM phone: 212-637-4423RPM fax: 212-637-4393RPM email: [email protected]
Name of Site: Lang PropertySite City: Pemberton Township, NJSite State: NJSite Region: 2
Units Value
$/yr $700,000yrs 3.0 <-max of 30 yrs% 5.00%
$ $1,907,890
Units AnswerPotential
Savings (%) Range in Lookup Table
% 20.0%
Performance evaluation? A-C C -2.5% Performance evaluated and found sufficient# 1 -5.0% 1 to 2 wells
gpm 30 -2.5% 10 to 99.99 gpmwks 0 0.0% <2 wks
# 3 2.5% 3 processes# 32 0.0% 25.00 to 49.99
yrs 3.0 -15.0% 2.00 - 4.99yrsA-F A 5.0% little difficulty for minor changes or major changes
2.5%
5.0% (must be between 5% and 40%)
Summary 0
$1,907,890Estimated potential savings (%): - 5.0%
Subtotal $95,395Estimated RSE cost (Tier 3): - $25,000
$70,395
**Note:Estimated potential savings do not include costs associated with implementing actual system modifications
January 1, 2002
# of above-ground water treatment processesGW monitoring (number wells * events-per-yr)
Down time per year
Optimization Factor
Number of pumping wellsPumping rate
<------ Estimated potential savings ($)
Summation (%) ->
Estimated potential savings (%) ->
Annual O&M costExpected durationDiscount rate
Baseline present value:
Expected system durationPolitical/Social factors (minor changes)
Potential savings (initial estimate)
Cost Item
Baseline present value ->

12RPM First Name: Ferdinand Date of implementation:RPM Last Name: CataneoRPM phone: 212-637-4428RPM fax: 212-637-4393RPM email: [email protected]
Name of Site: Lipari Landfill siteSite City: Mantua TownshipSite State: NJSite Region: 2
Units Value
$/yr $2,500,000yrs 2.9 <-max of 30 yrs% 5.00%
$ $6,634,566
Units AnswerPotential
Savings (%) Range in Lookup Table
% 20.0%
Performance evaluation? A-C C -2.5% Performance evaluated and found sufficient# 25 2.5% 10 or more wells
gpm 125 0.0% 100 to 500 gpmwks 2 2.5% 2.00 - 3.99 wks
# 4 5.0% 4 or more processes# 39 0.0% 25.00 to 49.99
yrs 2.9 -15.0% 2.00 - 4.99yrsA-F A 5.0% little difficulty for minor changes or major changes
17.5%
17.5% (must be between 5% and 40%)
Summary 0
$6,634,566Estimated potential savings (%): - 17.5%
Subtotal $1,161,049Estimated RSE cost (Tier 3): - $25,000
$1,136,049
**Note:Estimated potential savings do not include costs associated with implementing actual system modifications
Potential savings (initial estimate)
Cost Item
Baseline present value ->
<------ Estimated potential savings ($)
Summation (%) ->
Estimated potential savings (%) ->
Annual O&M costExpected durationDiscount rate
Baseline present value:
Expected system durationPolitical/Social factors (minor changes)
January 1, 2002
# of above-ground water treatment processesGW monitoring (number wells * events-per-yr)
Down time per year
Optimization Factor
Number of pumping wellsPumping rate

13RPM First Name: Edward Date of implementation:RPM Last Name: AlsRPM phone: 212-637-4272RPM fax: 212-637-3966RPM email: [email protected]
Name of Site: Mattiace PetrochemicalSite City: Glen Cove, Nassau CountySite State: NYSite Region: 2
Units Value
$/yr $700,000yrs 27.6 <-max of 30 yrs% 5.00%
$ $10,358,307
Units AnswerPotential
Savings (%) Range in Lookup Table
% 20.0%
Performance evaluation? A-C C -2.5% Performance evaluated and found sufficient# 9 0.0% 5 to 9 wells
gpm 10 -2.5% 10 to 99.99 gpmwks 2 2.5% 2.00 - 3.99 wks
# 5 5.0% 4 or more processes# 15 -2.5% <25
yrs 27.6 0.0% 20 yrs or moreA-F B 3.0% little difficulty for minor changes, moderate for major changes
23.0%
23.0% (must be between 5% and 40%)
Summary 0
$10,358,307Estimated potential savings (%): - 23.0%
Subtotal $2,382,411Estimated RSE cost (Tier 3): - $25,000
$2,357,411
**Note:Estimated potential savings do not include costs associated with implementing actual system modifications
January 1, 2002
# of above-ground water treatment processesGW monitoring (number wells * events-per-yr)
Down time per year
Optimization Factor
Number of pumping wellsPumping rate
<------ Estimated potential savings ($)
Summation (%) ->
Estimated potential savings (%) ->
Annual O&M costExpected durationDiscount rate
Baseline present value:
Expected system durationPolitical/Social factors (minor changes)
Potential savings (initial estimate)
Cost Item
Baseline present value ->
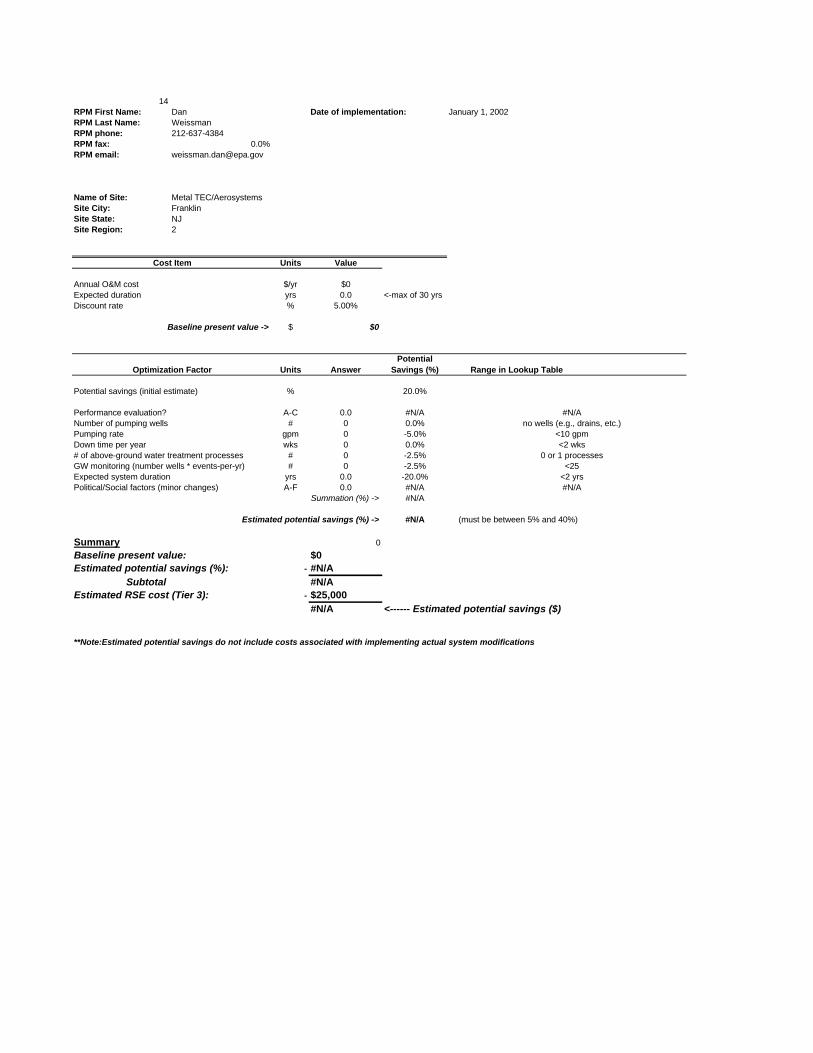
14RPM First Name: Dan Date of implementation:RPM Last Name: WeissmanRPM phone: 212-637-4384RPM fax: 0.0%RPM email: [email protected]
Name of Site: Metal TEC/AerosystemsSite City: FranklinSite State: NJSite Region: 2
Units Value
$/yr $0yrs 0.0 <-max of 30 yrs% 5.00%
$ $0
Units AnswerPotential
Savings (%) Range in Lookup Table
% 20.0%
Performance evaluation? A-C 0.0 #N/A #N/A# 0 0.0% no wells (e.g., drains, etc.)
gpm 0 -5.0% <10 gpmwks 0 0.0% <2 wks
# 0 -2.5% 0 or 1 processes# 0 -2.5% <25
yrs 0.0 -20.0% <2 yrsA-F 0.0 #N/A #N/A
#N/A
#N/A (must be between 5% and 40%)
Summary 0
$0Estimated potential savings (%): - #N/A
Subtotal #N/AEstimated RSE cost (Tier 3): - $25,000
#N/A
**Note:Estimated potential savings do not include costs associated with implementing actual system modifications
Potential savings (initial estimate)
Cost Item
Baseline present value ->
<------ Estimated potential savings ($)
Summation (%) ->
Estimated potential savings (%) ->
Annual O&M costExpected durationDiscount rate
Baseline present value:
Expected system durationPolitical/Social factors (minor changes)
January 1, 2002
# of above-ground water treatment processesGW monitoring (number wells * events-per-yr)
Down time per year
Optimization Factor
Number of pumping wellsPumping rate
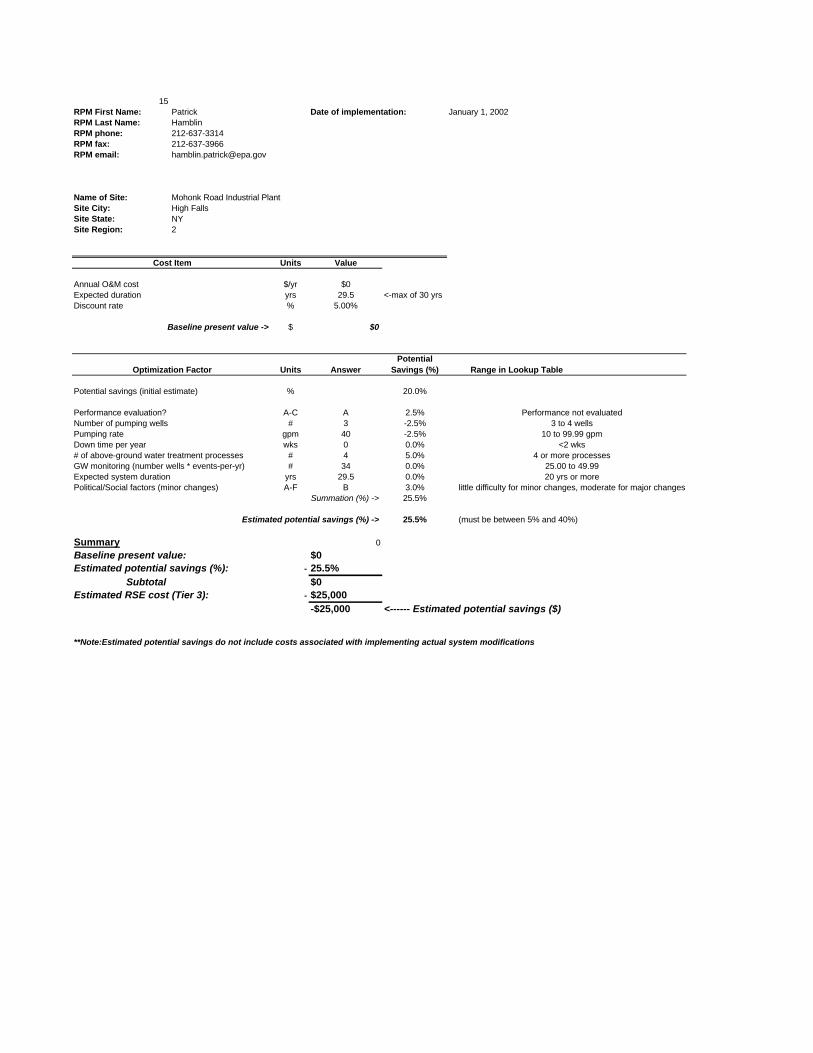
15RPM First Name: Patrick Date of implementation:RPM Last Name: HamblinRPM phone: 212-637-3314RPM fax: 212-637-3966RPM email: [email protected]
Name of Site: Mohonk Road Industrial PlantSite City: High FallsSite State: NYSite Region: 2
Units Value
$/yr $0yrs 29.5 <-max of 30 yrs% 5.00%
$ $0
Units AnswerPotential
Savings (%) Range in Lookup Table
% 20.0%
Performance evaluation? A-C A 2.5% Performance not evaluated# 3 -2.5% 3 to 4 wells
gpm 40 -2.5% 10 to 99.99 gpmwks 0 0.0% <2 wks
# 4 5.0% 4 or more processes# 34 0.0% 25.00 to 49.99
yrs 29.5 0.0% 20 yrs or moreA-F B 3.0% little difficulty for minor changes, moderate for major changes
25.5%
25.5% (must be between 5% and 40%)
Summary 0
$0Estimated potential savings (%): - 25.5%
Subtotal $0Estimated RSE cost (Tier 3): - $25,000
-$25,000
**Note:Estimated potential savings do not include costs associated with implementing actual system modifications
January 1, 2002
# of above-ground water treatment processesGW monitoring (number wells * events-per-yr)
Down time per year
Optimization Factor
Number of pumping wellsPumping rate
<------ Estimated potential savings ($)
Summation (%) ->
Estimated potential savings (%) ->
Annual O&M costExpected durationDiscount rate
Baseline present value:
Expected system durationPolitical/Social factors (minor changes)
Potential savings (initial estimate)
Cost Item
Baseline present value ->

16RPM First Name: Monica Date of implementation:RPM Last Name: MaharRPM phone: 212-637-3942RPM fax: RPM email: [email protected]
Name of Site: Montgomery Township/Rocky HillSite City: Montgomery TownshipSite State: NJSite Region: 2
Units Value
$/yr $400,000yrs 30.0 <-max of 30 yrs% 5.00%
$ $6,148,980
Units AnswerPotential
Savings (%) Range in Lookup Table
% 20.0%
Performance evaluation? A-C A 2.5% Performance not evaluated# 3 -2.5% 3 to 4 wells
gpm 250 0.0% 100 to 500 gpmwks 0 0.0% <2 wks
# 2 0.0% 2 processes# 80 5.0% 75 or more
yrs 30.0 0.0% 20 yrs or moreA-F B 3.0% little difficulty for minor changes, moderate for major changes
28.0%
28.0% (must be between 5% and 40%)
Summary 0
$6,148,980Estimated potential savings (%): - 28.0%
Subtotal $1,721,715Estimated RSE cost (Tier 3): - $25,000
$1,696,715
**Note:Estimated potential savings do not include costs associated with implementing actual system modifications
Potential savings (initial estimate)
Cost Item
Baseline present value ->
<------ Estimated potential savings ($)
Summation (%) ->
Estimated potential savings (%) ->
Annual O&M costExpected durationDiscount rate
Baseline present value:
Expected system durationPolitical/Social factors (minor changes)
January 1, 2002
# of above-ground water treatment processesGW monitoring (number wells * events-per-yr)
Down time per year
Optimization Factor
Number of pumping wellsPumping rate

17RPM First Name: Mark Date of implementation:RPM Last Name: DannenbergRPM phone: 212-637-4251RPM fax: 212-637-3966RPM email: [email protected]
Name of Site: SMS InstrumentsSite City: Deer ParkSite State: NYSite Region: 2
Units Value
$/yr $400,000yrs 2.2 <-max of 30 yrs% 5.00%
$ $801,729
Units AnswerPotential
Savings (%) Range in Lookup Table
% 20.0%
Performance evaluation? A-C C -2.5% Performance evaluated and found sufficient# 2 -5.0% 1 to 2 wells
gpm 100 0.0% 100 to 500 gpmwks 2 2.5% 2.00 - 3.99 wks
# 2 0.0% 2 processes# 72 2.5% 50.00 to 74.99
yrs 2.2 -15.0% 2.00 - 4.99yrsA-F A 5.0% little difficulty for minor changes or major changes
7.5%
7.5% (must be between 5% and 40%)
Summary 0
$801,729Estimated potential savings (%): - 7.5%
Subtotal $60,130Estimated RSE cost (Tier 3): - $25,000
$35,130
**Note:Estimated potential savings do not include costs associated with implementing actual system modifications
January 1, 2002
# of above-ground water treatment processesGW monitoring (number wells * events-per-yr)
Down time per year
Optimization Factor
Number of pumping wellsPumping rate
<------ Estimated potential savings ($)
Summation (%) ->
Estimated potential savings (%) ->
Annual O&M costExpected durationDiscount rate
Baseline present value:
Expected system durationPolitical/Social factors (minor changes)
Potential savings (initial estimate)
Cost Item
Baseline present value ->

18RPM First Name: Damian Date of implementation:RPM Last Name: DudaRPM phone: 212-637-4269RPM fax: 212-637-3966RPM email: [email protected]
Name of Site: Stanton Cleaners Area Groundwater Contamination SiteSite City: Great NeckSite State: NYSite Region: 2
Units Value
$/yr $270,000yrs 19.7 <-max of 30 yrs% 5.00%
$ $3,332,717
Units AnswerPotential
Savings (%) Range in Lookup Table
% 20.0%
Performance evaluation? A-C A 2.5% Performance not evaluated# 3 -2.5% 3 to 4 wells
gpm 90 -2.5% 10 to 99.99 gpmwks 1 0.0% <2 wks
# 5 5.0% 4 or more processes# 120 5.0% 75 or more
yrs 19.7 -2.5% 10.00 - 19.99 yrsA-F B 3.0% little difficulty for minor changes, moderate for major changes
28.0%
28.0% (must be between 5% and 40%)
Summary 0
$3,332,717Estimated potential savings (%): - 28.0%
Subtotal $933,161Estimated RSE cost (Tier 3): - $25,000
$908,161
**Note:Estimated potential savings do not include costs associated with implementing actual system modifications
Potential savings (initial estimate)
Cost Item
Baseline present value ->
<------ Estimated potential savings ($)
Summation (%) ->
Estimated potential savings (%) ->
Annual O&M costExpected durationDiscount rate
Baseline present value:
Expected system durationPolitical/Social factors (minor changes)
January 1, 2002
# of above-ground water treatment processesGW monitoring (number wells * events-per-yr)
Down time per year
Optimization Factor
Number of pumping wellsPumping rate

19RPM First Name: Pamela J. Date of implementation:RPM Last Name: BaxterRPM phone: 212-637-4416RPM fax: 212-637-4393RPM email: [email protected]
Name of Site: Syncon ResinsSite City: KearnySite State: NJSite Region: 2
Units Value
$/yr $350,000yrs 26.7 <-max of 30 yrs% 5.00%
$ $5,096,017
Units AnswerPotential
Savings (%) Range in Lookup Table
% 20.0%
Performance evaluation? A-C B 5.0% Performance evaluated and found insufficient# 3 -2.5% 3 to 4 wells
gpm 20 -2.5% 10 to 99.99 gpmwks 3 2.5% 2.00 - 3.99 wks
# 6 5.0% 4 or more processes# 0 -2.5% <25
yrs 26.7 0.0% 20 yrs or moreA-F B 3.0% little difficulty for minor changes, moderate for major changes
28.0%
28.0% (must be between 5% and 40%)
Summary 0
$5,096,017Estimated potential savings (%): - 28.0%
Subtotal $1,426,885Estimated RSE cost (Tier 3): - $25,000
$1,401,885
**Note:Estimated potential savings do not include costs associated with implementing actual system modifications
January 1, 2002
# of above-ground water treatment processesGW monitoring (number wells * events-per-yr)
Down time per year
Optimization Factor
Number of pumping wellsPumping rate
<------ Estimated potential savings ($)
Summation (%) ->
Estimated potential savings (%) ->
Annual O&M costExpected durationDiscount rate
Baseline present value:
Expected system durationPolitical/Social factors (minor changes)
Potential savings (initial estimate)
Cost Item
Baseline present value ->

20RPM First Name: Sharon Date of implementation:RPM Last Name: TrocherRPM phone: 212-637-3965RPM fax: 212-637-3966RPM email: [email protected]
Name of Site: Vestal Water Supply Well 1-1Site City: VestalSite State: NYSite Region: 2
Units Value
$/yr $180,000yrs 13.2 <-max of 30 yrs% 5.00%
$ $1,706,600
Units AnswerPotential
Savings (%) Range in Lookup Table
% 20.0%
Performance evaluation? A-C C -2.5% Performance evaluated and found sufficient# 1 -5.0% 1 to 2 wells
gpm 450 0.0% 100 to 500 gpmwks 1 0.0% <2 wks
# 1 -2.5% 0 or 1 processes# 12 -2.5% <25
yrs 13.2 -2.5% 10.00 - 19.99 yrsA-F A 5.0% little difficulty for minor changes or major changes
10.0%
10.0% (must be between 5% and 40%)
Summary 0
$1,706,600Estimated potential savings (%): - 10.0%
Subtotal $170,660Estimated RSE cost (Tier 3): - $25,000
$145,660
**Note:Estimated potential savings do not include costs associated with implementing actual system modifications
Potential savings (initial estimate)
Cost Item
Baseline present value ->
<------ Estimated potential savings ($)
Summation (%) ->
Estimated potential savings (%) ->
Annual O&M costExpected durationDiscount rate
Baseline present value:
Expected system durationPolitical/Social factors (minor changes)
January 1, 2002
# of above-ground water treatment processesGW monitoring (number wells * events-per-yr)
Down time per year
Optimization Factor
Number of pumping wellsPumping rate

21RPM First Name: Matthew Date of implementation:RPM Last Name: WestgateRPM phone: 212 637-4422RPM fax: 212 637-4429RPM email: [email protected]
Name of Site: Vineland Chemical Co. Groundwater TreatmentSite City: VinelandSite State: NJSite Region: 2
Units Value
$/yr $4,000,000yrs 29.4 <-max of 30 yrs% 5.00%
$ $60,970,474
Units AnswerPotential
Savings (%) Range in Lookup Table
% 20.0%
Performance evaluation? A-C A 2.5% Performance not evaluated# 13 2.5% 10 or more wells
gpm 1400 2.5% >500 gpmwks 0 0.0% <2 wks
# 2 0.0% 2 processes# 2080 5.0% 75 or more
yrs 29.4 0.0% 20 yrs or moreA-F E -2.5% moderate difficulty for minor changes, severe for major changes
30.0%
30.0% (must be between 5% and 40%)
Summary 0
$60,970,474Estimated potential savings (%): - 30.0%
Subtotal $18,291,142Estimated RSE cost (Tier 3): - $25,000
$18,266,142
**Note:Estimated potential savings do not include costs associated with implementing actual system modifications
January 1, 2002
# of above-ground water treatment processesGW monitoring (number wells * events-per-yr)
Down time per year
Optimization Factor
Number of pumping wellsPumping rate
<------ Estimated potential savings ($)
Summation (%) ->
Estimated potential savings (%) ->
Annual O&M costExpected durationDiscount rate
Baseline present value:
Expected system durationPolitical/Social factors (minor changes)
Potential savings (initial estimate)
Cost Item
Baseline present value ->

22RPM First Name: Ferdinand Date of implementation:RPM Last Name: CataneoRPM phone: 212-637-4428RPM fax: 212-637-4393RPM email: [email protected]
Name of Site: Williams PropertySite City: Swainton, Middle TownshipSite State: NJSite Region: 2
Units Value
$/yr $350,000yrs 0.0 <-max of 30 yrs% 5.00%
$ $0
Units AnswerPotential
Savings (%) Range in Lookup Table
% 20.0%
Performance evaluation? A-C C -2.5% Performance evaluated and found sufficient# 2 -5.0% 1 to 2 wells
gpm 80 -2.5% 10 to 99.99 gpmwks 0 0.0% <2 wks
# 4 5.0% 4 or more processes# 36 0.0% 25.00 to 49.99
yrs 0.0 -20.0% <2 yrsA-F A 5.0% little difficulty for minor changes or major changes
0.0%
5.0% (must be between 5% and 40%)
Summary 0
$0Estimated potential savings (%): - 5.0%
Subtotal $0Estimated RSE cost (Tier 3): - $25,000
-$25,000
**Note:Estimated potential savings do not include costs associated with implementing actual system modifications
Potential savings (initial estimate)
Cost Item
Baseline present value ->
<------ Estimated potential savings ($)
Summation (%) ->
Estimated potential savings (%) ->
Annual O&M costExpected durationDiscount rate
Baseline present value:
Expected system durationPolitical/Social factors (minor changes)
January 1, 2002
# of above-ground water treatment processesGW monitoring (number wells * events-per-yr)
Down time per year
Optimization Factor
Number of pumping wellsPumping rate

REGION 3 SCREENING CALCULATIONS

1RPM First Name: Charlie Date of implementation:RPM Last Name: RootRPM phone: 215-814-3193RPM fax: 215-814-3002RPM email: [email protected]
Name of Site: AIW Frank/Mid-County Mustang Site, OU#1Site City: ExtonSite State: PASite Region: 3
Units Value
$/yr $180,000yrs 29.7 <-max of 30 yrs% 5.00%
$ $2,754,138
Units AnswerPotential
Savings (%) Range in Lookup Table
% 20.0%
Performance evaluation? A-C C -2.5% Performance evaluated and found sufficient# 5 0.0% 5 to 9 wells
gpm 118 0.0% 100 to 500 gpmwks 1 0.0% <2 wks
# 4 5.0% 4 or more processes# 60 2.5% 50.00 to 74.99
yrs 29.7 0.0% 20 yrs or moreA-F B 3.0% little difficulty for minor changes, moderate for major changes
28.0%
28.0% (must be between 5% and 40%)
Summary$2,754,138
Estimated potential savings (%): - 28.0%Subtotal $771,159
Estimated RSE cost (Tier 3): - $25,000$746,159
**Note:Estimated potential savings do not include costs associated with implementing actual system modifications
Potential savings (initial estimate)
Cost Item
Baseline present value ->
<------ Estimated potential savings ($)
Summation (%) ->
Estimated potential savings (%) ->
Annual O&M costExpected durationDiscount rate
Baseline present value:
Expected system durationPolitical/Social factors (minor changes)
January 1, 2002
# of above-ground water treatment processesGW monitoring (number wells * events-per-yr)
Down time per year
Optimization Factor
Number of pumping wellsPumping rate

2RPM First Name: Bruce Date of implementation:RPM Last Name: RundellRPM phone: 215-814-3317RPM fax: 215-814-3015RPM email: [email protected]
Name of Site: Berks Sand PitSite City: Huffs ChurchSite State: PASite Region: 3
Units Value
$/yr $150,000yrs 1.1 <-max of 30 yrs% 5.00%
$ $154,672
Units AnswerPotential
Savings (%) Range in Lookup Table
% 20.0%
Performance evaluation? A-C C -2.5% Performance evaluated and found sufficient# 1 -5.0% 1 to 2 wells
gpm 90 -2.5% 10 to 99.99 gpmwks 0 0.0% <2 wks
# 1 -2.5% 0 or 1 processes# 48 0.0% 25.00 to 49.99
yrs 1.1 -20.0% <2 yrsA-F A 5.0% little difficulty for minor changes or major changes
-7.5%
5.0% (must be between 5% and 40%)
Summary$154,672
Estimated potential savings (%): - 5.0%Subtotal $7,734
Estimated RSE cost (Tier 3): - $25,000-$17,266
**Note:Estimated potential savings do not include costs associated with implementing actual system modifications
January 1, 2002
# of above-ground water treatment processesGW monitoring (number wells * events-per-yr)
Down time per year
Optimization Factor
Number of pumping wellsPumping rate
<------ Estimated potential savings ($)
Summation (%) ->
Estimated potential savings (%) ->
Annual O&M costExpected durationDiscount rate
Baseline present value:
Expected system durationPolitical/Social factors (minor changes)
Potential savings (initial estimate)
Cost Item
Baseline present value ->

3RPM First Name: Rom Date of implementation:RPM Last Name: RomanRPM phone: 215-814-3212RPM fax: 215-814-3015RPM email: [email protected]
Name of Site: Butz LandfillSite City: Monroe TownshipSite State: PASite Region: 3
Units Value
$/yr $250,000yrs 29.3 <-max of 30 yrs% 5.00%
$ $3,800,917
Units AnswerPotential
Savings (%) Range in Lookup Table
% 20.0%
Performance evaluation? A-C A 2.5% Performance not evaluated# 3 -2.5% 3 to 4 wells
gpm 90 -2.5% 10 to 99.99 gpmwks 0 0.0% <2 wks
# 2 0.0% 2 processes# 68 2.5% 50.00 to 74.99
yrs 29.3 0.0% 20 yrs or moreA-F A 5.0% little difficulty for minor changes or major changes
25.0%
25.0% (must be between 5% and 40%)
Summary$3,800,917
Estimated potential savings (%): - 25.0%Subtotal $950,229
Estimated RSE cost (Tier 3): - $25,000$925,229
**Note:Estimated potential savings do not include costs associated with implementing actual system modifications
Potential savings (initial estimate)
Cost Item
Baseline present value ->
<------ Estimated potential savings ($)
Summation (%) ->
Estimated potential savings (%) ->
Annual O&M costExpected durationDiscount rate
Baseline present value:
Expected system durationPolitical/Social factors (minor changes)
January 1, 2002
# of above-ground water treatment processesGW monitoring (number wells * events-per-yr)
Down time per year
Optimization Factor
Number of pumping wellsPumping rate

4RPM First Name: Cesar Date of implementation:RPM Last Name: LeeRPM phone: 215-814-3205RPM fax: 215-814-3205RPM email: [email protected]
Name of Site: Croydon TCESite City: Bristol TownshipSite State: PASite Region: 3
Units Value
$/yr $200,000yrs 23.2 <-max of 30 yrs% 5.00%
$ $2,708,981
Units AnswerPotential
Savings (%) Range in Lookup Table
% 20.0%
Performance evaluation? A-C C -2.5% Performance evaluated and found sufficient# 6 0.0% 5 to 9 wells
gpm 25 -2.5% 10 to 99.99 gpmwks 0 0.0% <2 wks
# 2 0.0% 2 processes# 28 0.0% 25.00 to 49.99
yrs 23.2 0.0% 20 yrs or moreA-F A 5.0% little difficulty for minor changes or major changes
20.0%
20.0% (must be between 5% and 40%)
Summary$2,708,981
Estimated potential savings (%): - 20.0%Subtotal $541,796
Estimated RSE cost (Tier 3): - $25,000$516,796
**Note:Estimated potential savings do not include costs associated with implementing actual system modifications
January 1, 2002
# of above-ground water treatment processesGW monitoring (number wells * events-per-yr)
Down time per year
Optimization Factor
Number of pumping wellsPumping rate
<------ Estimated potential savings ($)
Summation (%) ->
Estimated potential savings (%) ->
Annual O&M costExpected durationDiscount rate
Baseline present value:
Expected system durationPolitical/Social factors (minor changes)
Potential savings (initial estimate)
Cost Item
Baseline present value ->

5RPM First Name: Joseph Date of implementation:RPM Last Name: McDowellRPM phone: 215-814-3192RPM fax: 215-814-3002RPM email: [email protected]
Name of Site: CryoChemSite City: Earl TownshipSite State: PASite Region: 3
Units Value
$/yr $125,000yrs 8.4 <-max of 30 yrs% 5.00%
$ $842,157
Units AnswerPotential
Savings (%) Range in Lookup Table
% 20.0%
Performance evaluation? A-C C -2.5% Performance evaluated and found sufficient# 9 0.0% 5 to 9 wells
gpm 60 -2.5% 10 to 99.99 gpmwks 1 0.0% <2 wks
# 1 -2.5% 0 or 1 processes# 4 -2.5% <25
yrs 8.4 -5.0% 5.00 - 9.99 yrsA-F B 3.0% little difficulty for minor changes, moderate for major changes
8.0%
8.0% (must be between 5% and 40%)
Summary$842,157
Estimated potential savings (%): - 8.0%Subtotal $67,373
Estimated RSE cost (Tier 3): - $25,000$42,373
**Note:Estimated potential savings do not include costs associated with implementing actual system modifications
Potential savings (initial estimate)
Cost Item
Baseline present value ->
<------ Estimated potential savings ($)
Summation (%) ->
Estimated potential savings (%) ->
Annual O&M costExpected durationDiscount rate
Baseline present value:
Expected system durationPolitical/Social factors (minor changes)
January 1, 2002
# of above-ground water treatment processesGW monitoring (number wells * events-per-yr)
Down time per year
Optimization Factor
Number of pumping wellsPumping rate

6RPM First Name: Philip Date of implementation:RPM Last Name: RotsteinRPM phone: 215-814-3232RPM fax: 215-814-3002RPM email: [email protected]
Name of Site: Greenwood Chemical SiteSite City: GreenwoodSite State: VASite Region: 3
Units Value
$/yr $400,000yrs 18.8 <-max of 30 yrs% 5.00%
$ $4,810,341
Units AnswerPotential
Savings (%) Range in Lookup Table
% 20.0%
Performance evaluation? A-C A 2.5% Performance not evaluated# 5 0.0% 5 to 9 wells
gpm 45 -2.5% 10 to 99.99 gpmwks 0 0.0% <2 wks
# 5 5.0% 4 or more processes# 136 5.0% 75 or more
yrs 18.8 -2.5% 10.00 - 19.99 yrsA-F A 5.0% little difficulty for minor changes or major changes
32.5%
32.5% (must be between 5% and 40%)
Summary$4,810,341
Estimated potential savings (%): - 32.5%Subtotal $1,563,361
Estimated RSE cost (Tier 3): - $25,000$1,538,361
**Note:Estimated potential savings do not include costs associated with implementing actual system modifications
January 1, 2002
# of above-ground water treatment processesGW monitoring (number wells * events-per-yr)
Down time per year
Optimization Factor
Number of pumping wellsPumping rate
<------ Estimated potential savings ($)
Summation (%) ->
Estimated potential savings (%) ->
Annual O&M costExpected durationDiscount rate
Baseline present value:
Expected system durationPolitical/Social factors (minor changes)
Potential savings (initial estimate)
Cost Item
Baseline present value ->

7RPM First Name: Gregory Date of implementation:RPM Last Name: HamRPM phone: 215-814-3194RPM fax: 215-814-3002RPM email: [email protected]
Name of Site: Havertown PCP OU2Site City: HavertownSite State: PASite Region: 3
Units Value
$/yr $1,000,000yrs 30.0 <-max of 30 yrs% 5.00%
$ $15,372,451
Units AnswerPotential
Savings (%) Range in Lookup Table
% 20.0%
Performance evaluation? A-C A 2.5% Performance not evaluated# 4 -2.5% 3 to 4 wells
gpm 45 -2.5% 10 to 99.99 gpmwks 0 0.0% <2 wks
# 4 5.0% 4 or more processes# 30 0.0% 25.00 to 49.99
yrs 30.0 0.0% 20 yrs or moreA-F B 3.0% little difficulty for minor changes, moderate for major changes
25.5%
25.5% (must be between 5% and 40%)
Summary$15,372,451
Estimated potential savings (%): - 25.5%Subtotal $3,919,975
Estimated RSE cost (Tier 3): - $25,000$3,894,975
**Note:Estimated potential savings do not include costs associated with implementing actual system modifications
Potential savings (initial estimate)
Cost Item
Baseline present value ->
<------ Estimated potential savings ($)
Summation (%) ->
Estimated potential savings (%) ->
Annual O&M costExpected durationDiscount rate
Baseline present value:
Expected system durationPolitical/Social factors (minor changes)
January 1, 2002
# of above-ground water treatment processesGW monitoring (number wells * events-per-yr)
Down time per year
Optimization Factor
Number of pumping wellsPumping rate

8RPM First Name: Cesar Date of implementation:RPM Last Name: LeeRPM phone: 215-814-3205RPM fax: 215-814-3205RPM email: [email protected]
Name of Site: Hellertown ManufacturingSite City: BethlehemSite State: PASite Region: 3
Units Value
$/yr $350,000yrs 24.7 <-max of 30 yrs% 5.00%
$ $4,900,578
Units AnswerPotential
Savings (%) Range in Lookup Table
% 20.0%
Performance evaluation? A-C B 5.0% Performance evaluated and found insufficient# 1 -5.0% 1 to 2 wells
gpm 50 -2.5% 10 to 99.99 gpmwks 0 0.0% <2 wks
# 2 0.0% 2 processes# 48 0.0% 25.00 to 49.99
yrs 24.7 0.0% 20 yrs or moreA-F B 3.0% little difficulty for minor changes, moderate for major changes
20.5%
20.5% (must be between 5% and 40%)
Summary$4,900,578
Estimated potential savings (%): - 20.5%Subtotal $1,004,619
Estimated RSE cost (Tier 3): - $25,000$979,619
**Note:Estimated potential savings do not include costs associated with implementing actual system modifications
January 1, 2002
# of above-ground water treatment processesGW monitoring (number wells * events-per-yr)
Down time per year
Optimization Factor
Number of pumping wellsPumping rate
<------ Estimated potential savings ($)
Summation (%) ->
Estimated potential savings (%) ->
Annual O&M costExpected durationDiscount rate
Baseline present value:
Expected system durationPolitical/Social factors (minor changes)
Potential savings (initial estimate)
Cost Item
Baseline present value ->

9RPM First Name: Maria de los A. Date of implementation:RPM Last Name: GarciaRPM phone: 215-814-3199RPM fax: 215-814-3002RPM email: [email protected]
Name of Site: North Penn Area 1Site City: Souderton, Montgomery CountySite State: PASite Region: 3
Units Value
$/yr $100,000yrs 16.7 <-max of 30 yrs% 5.00%
$ $1,113,534
Units AnswerPotential
Savings (%) Range in Lookup Table
% 20.0%
Performance evaluation? A-C A 2.5% Performance not evaluated# 1 -5.0% 1 to 2 wells
gpm 2 -5.0% <10 gpmwks 0 0.0% <2 wks
# 1 -2.5% 0 or 1 processes# 8 -2.5% <25
yrs 16.7 -2.5% 10.00 - 19.99 yrsA-F A 5.0% little difficulty for minor changes or major changes
10.0%
10.0% (must be between 5% and 40%)
Summary$1,113,534
Estimated potential savings (%): - 10.0%Subtotal $111,353
Estimated RSE cost (Tier 3): - $25,000$86,353
**Note:Estimated potential savings do not include costs associated with implementing actual system modifications
Potential savings (initial estimate)
Cost Item
Baseline present value ->
<------ Estimated potential savings ($)
Summation (%) ->
Estimated potential savings (%) ->
Annual O&M costExpected durationDiscount rate
Baseline present value:
Expected system durationPolitical/Social factors (minor changes)
January 1, 2002
# of above-ground water treatment processesGW monitoring (number wells * events-per-yr)
Down time per year
Optimization Factor
Number of pumping wellsPumping rate

10RPM First Name: Gregory Date of implementation:RPM Last Name: HamRPM phone: 215-814-3194RPM fax: 215-814-3002RPM email: [email protected]
Name of Site: North Penn Area 6Site City: LansdaleSite State: PASite Region: 3
Units Value
$/yr $592,900yrs 30.0 <-max of 30 yrs% 5.00%
$ $9,114,326
Units AnswerPotential
Savings (%) Range in Lookup Table
% 20.0%
Performance evaluation? A-C A 2.5% Performance not evaluated# 10 2.5% 10 or more wells
gpm 300 0.0% 100 to 500 gpmwks 0 0.0% <2 wks
# 3 2.5% 3 processes# 120 5.0% 75 or more
yrs 30.0 0.0% 20 yrs or moreA-F B 3.0% little difficulty for minor changes, moderate for major changes
35.5%
35.5% (must be between 5% and 40%)
Summary$9,114,326
Estimated potential savings (%): - 35.5%Subtotal $3,235,586
Estimated RSE cost (Tier 3): - $25,000$3,210,586
**Note:Estimated potential savings do not include costs associated with implementing actual system modifications
January 1, 2002
# of above-ground water treatment processesGW monitoring (number wells * events-per-yr)
Down time per year
Optimization Factor
Number of pumping wellsPumping rate
<------ Estimated potential savings ($)
Summation (%) ->
Estimated potential savings (%) ->
Annual O&M costExpected durationDiscount rate
Baseline present value:
Expected system durationPolitical/Social factors (minor changes)
Potential savings (initial estimate)
Cost Item
Baseline present value ->

11RPM First Name: Deanna Date of implementation:RPM Last Name: MoultrieRPM phone: 215-814-5125RPM fax: 215-814-3002RPM email: [email protected]
Name of Site: RaymarkSite City: HatboroSite State: PASite Region: 3
Units Value
$/yr $155,711yrs 12.0 <-max of 30 yrs% 5.00%
$ $1,380,802
Units AnswerPotential
Savings (%) Range in Lookup Table
% 20.0%
Performance evaluation? A-C A 2.5% Performance not evaluated# 2 -5.0% 1 to 2 wells
gpm 62 -2.5% 10 to 99.99 gpmwks 2 2.5% 2.00 - 3.99 wks
# 2 0.0% 2 processes# 0 -2.5% <25
yrs 12.0 -2.5% 10.00 - 19.99 yrsA-F A 5.0% little difficulty for minor changes or major changes
17.5%
17.5% (must be between 5% and 40%)
Summary$1,380,802
Estimated potential savings (%): - 17.5%Subtotal $241,640
Estimated RSE cost (Tier 3): - $25,000$216,640
**Note:Estimated potential savings do not include costs associated with implementing actual system modifications
Potential savings (initial estimate)
Cost Item
Baseline present value ->
<------ Estimated potential savings ($)
Summation (%) ->
Estimated potential savings (%) ->
Annual O&M costExpected durationDiscount rate
Baseline present value:
Expected system durationPolitical/Social factors (minor changes)
January 1, 2002
# of above-ground water treatment processesGW monitoring (number wells * events-per-yr)
Down time per year
Optimization Factor
Number of pumping wellsPumping rate

12RPM First Name: Andrew Date of implementation:RPM Last Name: PalestiniRPM phone: 215-814-3233RPM fax: 215-814-3002RPM email: [email protected]
Name of Site: Saunders Supply CompanySite City: ChuckatuckSite State: VASite Region: 3
Units Value
$/yr $80,000yrs 6.3 <-max of 30 yrs% 5.00%
$ $420,648
Units AnswerPotential
Savings (%) Range in Lookup Table
% 20.0%
Performance evaluation? A-C A 2.5% Performance not evaluated# 4 -2.5% 3 to 4 wells
gpm 2 -5.0% <10 gpmwks 2 2.5% 2.00 - 3.99 wks
# 3 2.5% 3 processes# 40 0.0% 25.00 to 49.99
yrs 6.3 -5.0% 5.00 - 9.99 yrsA-F C 2.0% little difficulty for minor changes, severe for major changes
17.0%
17.0% (must be between 5% and 40%)
Summary$420,648
Estimated potential savings (%): - 17.0%Subtotal $71,510
Estimated RSE cost (Tier 3): - $25,000$46,510
**Note:Estimated potential savings do not include costs associated with implementing actual system modifications
January 1, 2002
# of above-ground water treatment processesGW monitoring (number wells * events-per-yr)
Down time per year
Optimization Factor
Number of pumping wellsPumping rate
<------ Estimated potential savings ($)
Summation (%) ->
Estimated potential savings (%) ->
Annual O&M costExpected durationDiscount rate
Baseline present value:
Expected system durationPolitical/Social factors (minor changes)
Potential savings (initial estimate)
Cost Item
Baseline present value ->

REGION 4 SCREENING CALCULATIONS

1RPM First Name: Luis Date of implementation:RPM Last Name: FloresRPM phone: 404-562-8807RPM fax:RPM email: [email protected]
Name of Site: ABC CleanersSite City: JacksonvilleSite State: NCSite Region: 4
Units Value
$/yr $0yrs 0.0 <-max of 30 yrs% 5.00%
$ $0
Units AnswerPotential
Savings (%) Range in Lookup Table
% 20.0%
Performance evaluation? A-C 0.0 #N/A #N/A# 0 0.0% no wells (e.g., drains, etc.)
gpm 0 -5.0% <10 gpmwks 0 0.0% <2 wks
# 2 0.0% 2 processes# 0 -2.5% <25
yrs 0.0 -20.0% <2 yrsA-F 0.0 #N/A #N/A
#N/A
#N/A (must be between 5% and 40%)
Summary$0
Estimated potential savings (%): - #N/ASubtotal #N/A
Estimated RSE cost (Tier 3): - $25,000#N/A
**Note:Estimated potential savings do not include costs associated with implementing actual system modifications
January 1, 2002
# of above-ground water treatment processesGW monitoring (number wells * events-per-yr)
Down time per year
Optimization Factor
Number of pumping wellsPumping rate
<------ Estimated potential savings ($)
Summation (%) ->
Estimated potential savings (%) ->
Annual O&M costExpected durationDiscount rate
Baseline present value:
Expected system durationPolitical/Social factors (minor changes)
Potential savings (initial estimate)
Cost Item
Baseline present value ->

2RPM First Name: Mark Date of implementation:RPM Last Name: FiteRPM phone: 404-562-8927RPM fax:RPM email: [email protected]
Name of Site: American Creosote Works (DNAPL)Site City: PensacolaSite State: FLSite Region: 4
Units Value
$/yr $300,000yrs 1.3 <-max of 30 yrs% 5.00%
$ $376,644
Units AnswerPotential
Savings (%) Range in Lookup Table
% 20.0%
Performance evaluation? A-C A 2.5% Performance not evaluated# 8 0.0% 5 to 9 wells
gpm 0 -5.0% <10 gpmwks 4 5.0% 4 wks or more
# 3 2.5% 3 processes# 8 -2.5% <25
yrs 1.3 -20.0% <2 yrsA-F A 5.0% little difficulty for minor changes or major changes
7.5%
7.5% (must be between 5% and 40%)
Summary$376,644
Estimated potential savings (%): - 7.5%Subtotal $28,248
Estimated RSE cost (Tier 3): - $25,000$3,248
**Note:Estimated potential savings do not include costs associated with implementing actual system modifications
Potential savings (initial estimate)
Cost Item
Baseline present value ->
<------ Estimated potential savings ($)
Summation (%) ->
Estimated potential savings (%) ->
Annual O&M costExpected durationDiscount rate
Baseline present value:
Expected system durationPolitical/Social factors (minor changes)
January 1, 2002
# of above-ground water treatment processesGW monitoring (number wells * events-per-yr)
Down time per year
Optimization Factor
Number of pumping wellsPumping rate

3RPM First Name: Mark Date of implementation:RPM Last Name: FiteRPM phone: 404-562-8927RPM fax: 0.0%RPM email: [email protected]
Name of Site: American Creosote Works (solute)Site City: PensacolaSite State: FLSite Region: 4
Units Value
$/yr $452,000yrs 7.7 <-max of 30 yrs% 5.00%
$ $2,822,434
Units AnswerPotential
Savings (%) Range in Lookup Table
% 20.0%
Performance evaluation? A-C A 2.5% Performance not evaluated# 3 -2.5% 3 to 4 wells
gpm 105 0.0% 100 to 500 gpmwks 0 0.0% <2 wks
# 2 0.0% 2 processes# 20 -2.5% <25
yrs 7.7 -5.0% 5.00 - 9.99 yrsA-F A 5.0% little difficulty for minor changes or major changes
17.5%
17.5% (must be between 5% and 40%)
Summary$2,822,434
Estimated potential savings (%): - 17.5%Subtotal $493,926
Estimated RSE cost (Tier 3): - $25,000$468,926
**Note:Estimated potential savings do not include costs associated with implementing actual system modifications
January 1, 2002
# of above-ground water treatment processesGW monitoring (number wells * events-per-yr)
Down time per year
Optimization Factor
Number of pumping wellsPumping rate
<------ Estimated potential savings ($)
Summation (%) ->
Estimated potential savings (%) ->
Annual O&M costExpected durationDiscount rate
Baseline present value:
Expected system durationPolitical/Social factors (minor changes)
Potential savings (initial estimate)
Cost Item
Baseline present value ->

4RPM First Name: Jon Date of implementation:RPM Last Name: BornholmRPM phone: 404-562-8820RPM fax: 0.0%RPM email: [email protected]
Name of Site: Benfield IndustriesSite City: HazelwoodSite State: NCSite Region: 4
Units Value
$/yr $30,000yrs 19.3 <-max of 30 yrs% 5.00%
$ $366,494
Units AnswerPotential
Savings (%) Range in Lookup Table
% 20.0%
Performance evaluation? A-C A 2.5% Performance not evaluated# 2 -5.0% 1 to 2 wells
gpm 16 -2.5% 10 to 99.99 gpmwks 0 0.0% <2 wks
# 1 -2.5% 0 or 1 processes# 32 0.0% 25.00 to 49.99
yrs 19.3 -2.5% 10.00 - 19.99 yrsA-F A 5.0% little difficulty for minor changes or major changes
15.0%
15.0% (must be between 5% and 40%)
Summary$366,494
Estimated potential savings (%): - 15.0%Subtotal $54,974
Estimated RSE cost (Tier 3): - $25,000$29,974
**Note:Estimated potential savings do not include costs associated with implementing actual system modifications
Potential savings (initial estimate)
Cost Item
Baseline present value ->
<------ Estimated potential savings ($)
Summation (%) ->
Estimated potential savings (%) ->
Annual O&M costExpected durationDiscount rate
Baseline present value:
Expected system durationPolitical/Social factors (minor changes)
January 1, 2002
# of above-ground water treatment processesGW monitoring (number wells * events-per-yr)
Down time per year
Optimization Factor
Number of pumping wellsPumping rate

5RPM First Name: Jon Date of implementation:RPM Last Name: BornholmRPM phone: 404-562-8820RPM fax: 404-562-8788RPM email: [email protected]
Name of Site: Cape Fear Wood PreservingSite City: FayettevilleSite State: NCSite Region: 4
Units Value
$/yr $40,000yrs 7.9 <-max of 30 yrs% 5.00%
$ $256,425
Units AnswerPotential
Savings (%) Range in Lookup Table
% 20.0%
Performance evaluation? A-C A 2.5% Performance not evaluated# 7 0.0% 5 to 9 wells
gpm 43 -2.5% 10 to 99.99 gpmwks 0 0.0% <2 wks
# 1 -2.5% 0 or 1 processes# 100 5.0% 75 or more
yrs 7.9 -5.0% 5.00 - 9.99 yrsA-F A 5.0% little difficulty for minor changes or major changes
22.5%
22.5% (must be between 5% and 40%)
Summary$256,425
Estimated potential savings (%): - 22.5%Subtotal $57,696
Estimated RSE cost (Tier 3): - $25,000$32,696
**Note:Estimated potential savings do not include costs associated with implementing actual system modifications
January 1, 2002
# of above-ground water treatment processesGW monitoring (number wells * events-per-yr)
Down time per year
Optimization Factor
Number of pumping wellsPumping rate
<------ Estimated potential savings ($)
Summation (%) ->
Estimated potential savings (%) ->
Annual O&M costExpected durationDiscount rate
Baseline present value:
Expected system durationPolitical/Social factors (minor changes)
Potential savings (initial estimate)
Cost Item
Baseline present value ->

6RPM First Name: Randall Date of implementation:RPM Last Name: ChaffinsRPM phone: 404-562-8929RPM fax: 0.0%RPM email: [email protected]
Name of Site: Coleman Evans Wood PreservingSite City: WhitehouseSite State: FLSite Region: 4
Units Value
$/yr $0yrs 0.0 <-max of 30 yrs% 5.00%
$ $0
Units AnswerPotential
Savings (%) Range in Lookup Table
% 20.0%
Performance evaluation? A-C 0.0 #N/A #N/A# 0 0.0% no wells (e.g., drains, etc.)
gpm 0 -5.0% <10 gpmwks 0 0.0% <2 wks
# 0 -2.5% 0 or 1 processes# 0 -2.5% <25
yrs 0.0 -20.0% <2 yrsA-F 0.0 #N/A #N/A
#N/A
#N/A (must be between 5% and 40%)
Summary$0
Estimated potential savings (%): - #N/ASubtotal #N/A
Estimated RSE cost (Tier 3): - $25,000#N/A
**Note:Estimated potential savings do not include costs associated with implementing actual system modifications
Potential savings (initial estimate)
Cost Item
Baseline present value ->
<------ Estimated potential savings ($)
Summation (%) ->
Estimated potential savings (%) ->
Annual O&M costExpected durationDiscount rate
Baseline present value:
Expected system durationPolitical/Social factors (minor changes)
January 1, 2002
# of above-ground water treatment processesGW monitoring (number wells * events-per-yr)
Down time per year
Optimization Factor
Number of pumping wellsPumping rate

7RPM First Name: Ralph Date of implementation:RPM Last Name: HowardRPM phone: 404-562-8829RPM fax: 0.0%RPM email: [email protected]
Name of Site: Elmore Waste DisposalSite City: GreerSite State: SCSite Region: 4
Units Value
$/yr $180,000yrs 16.7 <-max of 30 yrs% 5.00%
$ $2,004,361
Units AnswerPotential
Savings (%) Range in Lookup Table
% 20.0%
Performance evaluation? A-C C -2.5% Performance evaluated and found sufficient# 9 0.0% 5 to 9 wells
gpm 30 -2.5% 10 to 99.99 gpmwks 0 0.0% <2 wks
# 2 0.0% 2 processes# 68 2.5% 50.00 to 74.99
yrs 16.7 -2.5% 10.00 - 19.99 yrsA-F A 5.0% little difficulty for minor changes or major changes
20.0%
20.0% (must be between 5% and 40%)
Summary$2,004,361
Estimated potential savings (%): - 20.0%Subtotal $400,872
Estimated RSE cost (Tier 3): - $25,000$375,872
**Note:Estimated potential savings do not include costs associated with implementing actual system modifications
January 1, 2002
# of above-ground water treatment processesGW monitoring (number wells * events-per-yr)
Down time per year
Optimization Factor
Number of pumping wellsPumping rate
<------ Estimated potential savings ($)
Summation (%) ->
Estimated potential savings (%) ->
Annual O&M costExpected durationDiscount rate
Baseline present value:
Expected system durationPolitical/Social factors (minor changes)
Potential savings (initial estimate)
Cost Item
Baseline present value ->
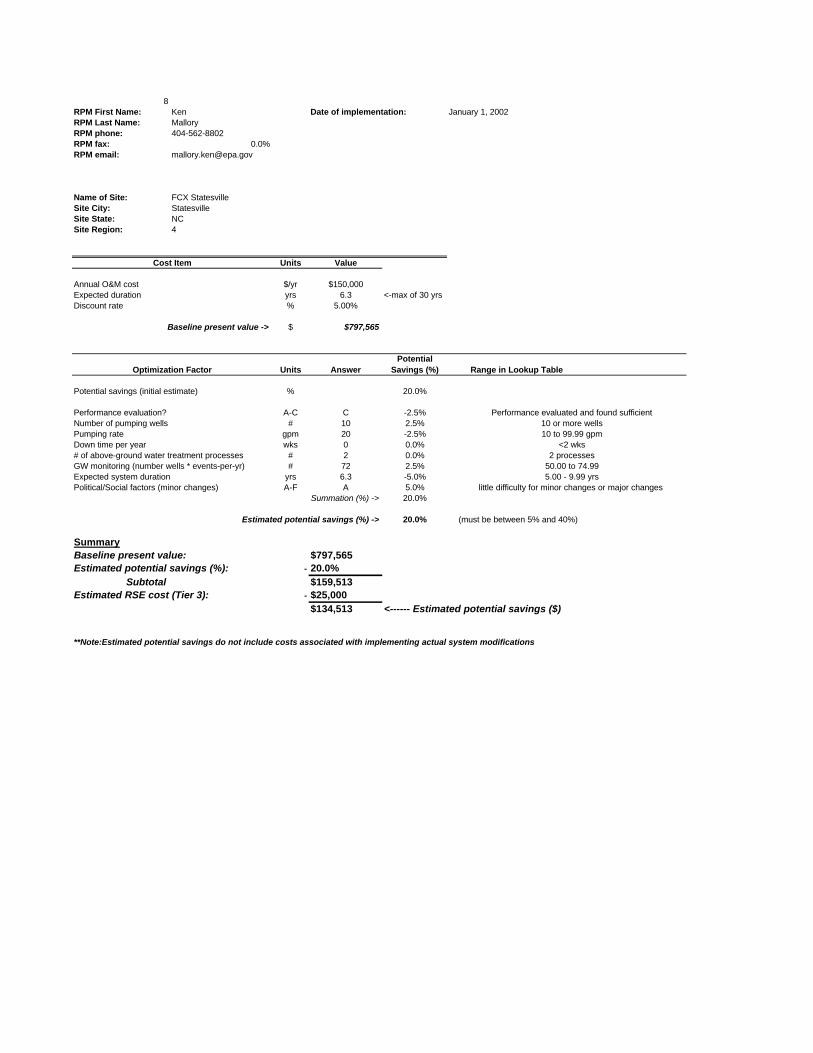
8RPM First Name: Ken Date of implementation:RPM Last Name: MalloryRPM phone: 404-562-8802RPM fax: 0.0%RPM email: [email protected]
Name of Site: FCX StatesvilleSite City: StatesvilleSite State: NCSite Region: 4
Units Value
$/yr $150,000yrs 6.3 <-max of 30 yrs% 5.00%
$ $797,565
Units AnswerPotential
Savings (%) Range in Lookup Table
% 20.0%
Performance evaluation? A-C C -2.5% Performance evaluated and found sufficient# 10 2.5% 10 or more wells
gpm 20 -2.5% 10 to 99.99 gpmwks 0 0.0% <2 wks
# 2 0.0% 2 processes# 72 2.5% 50.00 to 74.99
yrs 6.3 -5.0% 5.00 - 9.99 yrsA-F A 5.0% little difficulty for minor changes or major changes
20.0%
20.0% (must be between 5% and 40%)
Summary$797,565
Estimated potential savings (%): - 20.0%Subtotal $159,513
Estimated RSE cost (Tier 3): - $25,000$134,513
**Note:Estimated potential savings do not include costs associated with implementing actual system modifications
Potential savings (initial estimate)
Cost Item
Baseline present value ->
<------ Estimated potential savings ($)
Summation (%) ->
Estimated potential savings (%) ->
Annual O&M costExpected durationDiscount rate
Baseline present value:
Expected system durationPolitical/Social factors (minor changes)
January 1, 2002
# of above-ground water treatment processesGW monitoring (number wells * events-per-yr)
Down time per year
Optimization Factor
Number of pumping wellsPumping rate

9RPM First Name: Jim Date of implementation:RPM Last Name: McGuireRPM phone: 404-562-8911RPM fax: 0.0%RPM email: [email protected]
Name of Site: Miami DrumSite City: HialeahSite State: FLSite Region: 4
Units Value
$/yr $1,000,000yrs 0.0 <-max of 30 yrs% 5.00%
$ $0
Units AnswerPotential
Savings (%) Range in Lookup Table
% 20.0%
Performance evaluation? A-C 0.0 #N/A #N/A# 40 2.5% 10 or more wells
gpm 104000 2.5% >500 gpmwks 0 0.0% <2 wks
# 1 -2.5% 0 or 1 processes# 0 -2.5% <25
yrs 0.0 -20.0% <2 yrsA-F 0.0 #N/A #N/A
#N/A
#N/A (must be between 5% and 40%)
Summary$0
Estimated potential savings (%): - #N/ASubtotal #N/A
Estimated RSE cost (Tier 3): - $25,000#N/A
**Note:Estimated potential savings do not include costs associated with implementing actual system modifications
January 1, 2002
# of above-ground water treatment processesGW monitoring (number wells * events-per-yr)
Down time per year
Optimization Factor
Number of pumping wellsPumping rate
<------ Estimated potential savings ($)
Summation (%) ->
Estimated potential savings (%) ->
Annual O&M costExpected durationDiscount rate
Baseline present value:
Expected system durationPolitical/Social factors (minor changes)
Potential savings (initial estimate)
Cost Item
Baseline present value ->

10RPM First Name: Al Date of implementation:RPM Last Name: CherryRPM phone: 404-562-8807RPM fax: 0.0%RPM email: [email protected]
Name of Site: Palmetto WoodSite City: LexingtonSite State: SCSite Region: 4
Units Value
$/yr $300,000yrs 6.3 <-max of 30 yrs% 5.00%
$ $1,595,131
Units AnswerPotential
Savings (%) Range in Lookup Table
% 20.0%
Performance evaluation? A-C C -2.5% Performance evaluated and found sufficient# 10 2.5% 10 or more wells
gpm 130 0.0% 100 to 500 gpmwks 4 5.0% 4 wks or more
# 1 -2.5% 0 or 1 processes# 16 -2.5% <25
yrs 6.3 -5.0% 5.00 - 9.99 yrsA-F B 3.0% little difficulty for minor changes, moderate for major changes
18.0%
18.0% (must be between 5% and 40%)
Summary$1,595,131
Estimated potential savings (%): - 18.0%Subtotal $287,124
Estimated RSE cost (Tier 3): - $25,000$262,124
**Note:Estimated potential savings do not include costs associated with implementing actual system modifications
Potential savings (initial estimate)
Cost Item
Baseline present value ->
<------ Estimated potential savings ($)
Summation (%) ->
Estimated potential savings (%) ->
Annual O&M costExpected durationDiscount rate
Baseline present value:
Expected system durationPolitical/Social factors (minor changes)
January 1, 2002
# of above-ground water treatment processesGW monitoring (number wells * events-per-yr)
Down time per year
Optimization Factor
Number of pumping wellsPumping rate

REGION 5 SCREENING CALCULATIONS

1RPM First Name: Darryl Date of implementation:RPM Last Name: OwensRPM phone: 312-886-7089RPM fax: 0.0%RPM email: [email protected]
Name of Site: Arrowhead RefinerySite City: HermantownSite State: MNSite Region: 5
Units Value
$/yr $70,000yrs 2.2 <-max of 30 yrs% 5.00%
$ $145,512
Units AnswerPotential
Savings (%) Range in Lookup Table
% 20.0%
Performance evaluation? A-C C -2.5% Performance evaluated and found sufficient# 0 0.0% no wells (e.g., drains, etc.)
gpm 25 -2.5% 10 to 99.99 gpmwks 0 0.0% <2 wks
# 1 -2.5% 0 or 1 processes# 36 0.0% 25.00 to 49.99
yrs 2.2 -15.0% 2.00 - 4.99yrsA-F B 3.0% little difficulty for minor changes, moderate for major changes
0.5%
5.0% (must be between 5% and 40%)
Summary 0
$145,512Estimated potential savings (%): - 5.0%
Subtotal $7,276Estimated RSE cost (Tier 3): - $25,000
-$17,724
**Note:Estimated potential savings do not include costs associated with implementing actual system modifications
Potential savings (initial estimate)
Cost Item
Baseline present value ->
<------ Estimated potential savings ($)
Summation (%) ->
Estimated potential savings (%) ->
Annual O&M costExpected durationDiscount rate
Baseline present value:
Expected system durationPolitical/Social factors (minor changes)
January 1, 2002
# of above-ground water treatment processesGW monitoring (number wells * events-per-yr)
Down time per year
Optimization Factor
Number of pumping wellsPumping rate

2RPM First Name: John Date of implementation:RPM Last Name: PetersonRPM phone: 312-353-1264RPM fax: 0.0%RPM email: [email protected]
Name of Site: Better Brite Plating Co. Chrome and Zinc ShopsSite City: DepereSite State: WISite Region: 5
Units Value
$/yr $36,000yrs 28.3 <-max of 30 yrs% 5.00%
$ $538,699
Units AnswerPotential
Savings (%) Range in Lookup Table
% 20.0%
Performance evaluation? A-C C -2.5% Performance evaluated and found sufficient# 0 0.0% no wells (e.g., drains, etc.)
gpm 0 -5.0% <10 gpmwks 0 0.0% <2 wks
# 1 -2.5% 0 or 1 processes# 28 0.0% 25.00 to 49.99
yrs 28.3 0.0% 20 yrs or moreA-F C 2.0% little difficulty for minor changes, severe for major changes
12.0%
12.0% (must be between 5% and 40%)
Summary 0
$538,699Estimated potential savings (%): - 12.0%
Subtotal $64,644Estimated RSE cost (Tier 3): - $25,000
$39,644
**Note:Estimated potential savings do not include costs associated with implementing actual system modifications
January 1, 2002
# of above-ground water treatment processesGW monitoring (number wells * events-per-yr)
Down time per year
Optimization Factor
Number of pumping wellsPumping rate
<------ Estimated potential savings ($)
Summation (%) ->
Estimated potential savings (%) ->
Annual O&M costExpected durationDiscount rate
Baseline present value:
Expected system durationPolitical/Social factors (minor changes)
Potential savings (initial estimate)
Cost Item
Baseline present value ->

3RPM First Name: Dion Date of implementation:RPM Last Name: NovakRPM phone: 312-886-4737RPM fax: 0.0%RPM email: [email protected]
Name of Site: Douglass RoadSite City: MishawakaSite State: INSite Region: 5
Units Value
$/yr $120,000yrs 28.8 <-max of 30 yrs% 5.00%
$ $1,810,266
Units AnswerPotential
Savings (%) Range in Lookup Table
% 20.0%
Performance evaluation? A-C A 2.5% Performance not evaluated# 5 0.0% 5 to 9 wells
gpm 1000 2.5% >500 gpmwks 2 2.5% 2.00 - 3.99 wks
# 1 -2.5% 0 or 1 processes# 72 2.5% 50.00 to 74.99
yrs 28.8 0.0% 20 yrs or moreA-F A 5.0% little difficulty for minor changes or major changes
32.5%
32.5% (must be between 5% and 40%)
Summary 0
$1,810,266Estimated potential savings (%): - 32.5%
Subtotal $588,336Estimated RSE cost (Tier 3): - $25,000
$563,336
**Note:Estimated potential savings do not include costs associated with implementing actual system modifications
Potential savings (initial estimate)
Cost Item
Baseline present value ->
<------ Estimated potential savings ($)
Summation (%) ->
Estimated potential savings (%) ->
Annual O&M costExpected durationDiscount rate
Baseline present value:
Expected system durationPolitical/Social factors (minor changes)
January 1, 2002
# of above-ground water treatment processesGW monitoring (number wells * events-per-yr)
Down time per year
Optimization Factor
Number of pumping wellsPumping rate

4RPM First Name: Kyle Date of implementation:RPM Last Name: RogersRPM phone: 312-886-1995RPM fax: 0.0%RPM email: [email protected]
Name of Site: Duell and GardnerSite City: Dalton TownshipSite State: MISite Region: 5
Units Value
$/yr $0yrs 5.5 <-max of 30 yrs% 5.00%
$ $0
Units AnswerPotential
Savings (%) Range in Lookup Table
% 20.0%
Performance evaluation? A-C A 2.5% Performance not evaluated# 2 -5.0% 1 to 2 wells
gpm 80 -2.5% 10 to 99.99 gpmwks 0 0.0% <2 wks
# 1 -2.5% 0 or 1 processes# 50 2.5% 50.00 to 74.99
yrs 5.5 -5.0% 5.00 - 9.99 yrsA-F A 5.0% little difficulty for minor changes or major changes
15.0%
15.0% (must be between 5% and 40%)
Summary 0
$0Estimated potential savings (%): - 15.0%
Subtotal $0Estimated RSE cost (Tier 3): - $25,000
-$25,000
**Note:Estimated potential savings do not include costs associated with implementing actual system modifications
January 1, 2002
# of above-ground water treatment processesGW monitoring (number wells * events-per-yr)
Down time per year
Optimization Factor
Number of pumping wellsPumping rate
<------ Estimated potential savings ($)
Summation (%) ->
Estimated potential savings (%) ->
Annual O&M costExpected durationDiscount rate
Baseline present value:
Expected system durationPolitical/Social factors (minor changes)
Potential savings (initial estimate)
Cost Item
Baseline present value ->

5RPM First Name: Sheri Date of implementation:RPM Last Name: BianchinRPM phone: 312-886-4745RPM fax: 0.0%RPM email: [email protected]
Name of Site: Eau Claire Municipal Well FieldSite City: Eau ClaireSite State: WISite Region: 5
Units Value
$/yr $175,000yrs 0.0 <-max of 30 yrs% 5.00%
$ $0
Units AnswerPotential
Savings (%) Range in Lookup Table
% 20.0%
Performance evaluation? A-C C -2.5% Performance evaluated and found sufficient# 14 2.5% 10 or more wells
gpm 4500 2.5% >500 gpmwks 0 0.0% <2 wks
# 1 -2.5% 0 or 1 processes# 0 -2.5% <25
yrs 0.0 -20.0% <2 yrsA-F F -5.0% severe difficulty for minor changes or major changes
-7.5%
5.0% (must be between 5% and 40%)
Summary 0
$0Estimated potential savings (%): - 5.0%
Subtotal $0Estimated RSE cost (Tier 3): - $25,000
-$25,000
**Note:Estimated potential savings do not include costs associated with implementing actual system modifications
Potential savings (initial estimate)
Cost Item
Baseline present value ->
<------ Estimated potential savings ($)
Summation (%) ->
Estimated potential savings (%) ->
Annual O&M costExpected durationDiscount rate
Baseline present value:
Expected system durationPolitical/Social factors (minor changes)
January 1, 2002
# of above-ground water treatment processesGW monitoring (number wells * events-per-yr)
Down time per year
Optimization Factor
Number of pumping wellsPumping rate

6RPM First Name: Steve Date of implementation:RPM Last Name: PadovaniRPM phone: 312-353-6755RPM fax: 0.0%RPM email: [email protected]
Name of Site: La Salle Electrical UtilitiesSite City: La SalleSite State: ILSite Region: 5
Units Value
$/yr $230,000yrs 3.2 <-max of 30 yrs% 5.00%
$ $658,089
Units AnswerPotential
Savings (%) Range in Lookup Table
% 20.0%
Performance evaluation? A-C C -2.5% Performance evaluated and found sufficient# 0 0.0% no wells (e.g., drains, etc.)
gpm 20 -2.5% 10 to 99.99 gpmwks 2 2.5% 2.00 - 3.99 wks
# 2 0.0% 2 processes# 100 5.0% 75 or more
yrs 3.2 -15.0% 2.00 - 4.99yrsA-F A 5.0% little difficulty for minor changes or major changes
12.5%
12.5% (must be between 5% and 40%)
Summary 0
$658,089Estimated potential savings (%): - 12.5%
Subtotal $82,261Estimated RSE cost (Tier 3): - $25,000
$57,261
**Note:Estimated potential savings do not include costs associated with implementing actual system modifications
January 1, 2002
# of above-ground water treatment processesGW monitoring (number wells * events-per-yr)
Down time per year
Optimization Factor
Number of pumping wellsPumping rate
<------ Estimated potential savings ($)
Summation (%) ->
Estimated potential savings (%) ->
Annual O&M costExpected durationDiscount rate
Baseline present value:
Expected system durationPolitical/Social factors (minor changes)
Potential savings (initial estimate)
Cost Item
Baseline present value ->

7RPM First Name: Sheila Date of implementation:RPM Last Name: SullivanRPM phone: 312-886-5251RPM fax: 0.0%RPM email: [email protected]
Name of Site: Long PrairieSite City: Long PrairieSite State: MNSite Region: 5
Units Value
$/yr $300,000yrs 13.8 <-max of 30 yrs% 5.00%
$ $2,933,325
Units AnswerPotential
Savings (%) Range in Lookup Table
% 20.0%
Performance evaluation? A-C C -2.5% Performance evaluated and found sufficient# 9 0.0% 5 to 9 wells
gpm 227 0.0% 100 to 500 gpmwks 2 2.5% 2.00 - 3.99 wks
# 1 -2.5% 0 or 1 processes# 22 -2.5% <25
yrs 13.8 -2.5% 10.00 - 19.99 yrsA-F B 3.0% little difficulty for minor changes, moderate for major changes
15.5%
15.5% (must be between 5% and 40%)
Summary 0
$2,933,325Estimated potential savings (%): - 15.5%
Subtotal $454,665Estimated RSE cost (Tier 3): - $25,000
$429,665
**Note:Estimated potential savings do not include costs associated with implementing actual system modifications
Potential savings (initial estimate)
Cost Item
Baseline present value ->
<------ Estimated potential savings ($)
Summation (%) ->
Estimated potential savings (%) ->
Annual O&M costExpected durationDiscount rate
Baseline present value:
Expected system durationPolitical/Social factors (minor changes)
January 1, 2002
# of above-ground water treatment processesGW monitoring (number wells * events-per-yr)
Down time per year
Optimization Factor
Number of pumping wellsPumping rate

8RPM First Name: Darryl Date of implementation:RPM Last Name: OwensRPM phone: 312-886-7089RPM fax: 0.0%RPM email: [email protected]
Name of Site: MacGillis and Gibbs/Bell Lumber & PoleSite City: New BrightonSite State: MNSite Region: 5
Units Value
$/yr $300,000yrs 27.8 <-max of 30 yrs% 5.00%
$ $4,451,949
Units AnswerPotential
Savings (%) Range in Lookup Table
% 20.0%
Performance evaluation? A-C A 2.5% Performance not evaluated# 14 2.5% 10 or more wells
gpm 60 -2.5% 10 to 99.99 gpmwks 0 0.0% <2 wks
# 4 5.0% 4 or more processes# 60 2.5% 50.00 to 74.99
yrs 27.8 0.0% 20 yrs or moreA-F C 2.0% little difficulty for minor changes, severe for major changes
32.0%
32.0% (must be between 5% and 40%)
Summary 0
$4,451,949Estimated potential savings (%): - 32.0%
Subtotal $1,424,624Estimated RSE cost (Tier 3): - $25,000
$1,399,624
**Note:Estimated potential savings do not include costs associated with implementing actual system modifications
January 1, 2002
# of above-ground water treatment processesGW monitoring (number wells * events-per-yr)
Down time per year
Optimization Factor
Number of pumping wellsPumping rate
<------ Estimated potential savings ($)
Summation (%) ->
Estimated potential savings (%) ->
Annual O&M costExpected durationDiscount rate
Baseline present value:
Expected system durationPolitical/Social factors (minor changes)
Potential savings (initial estimate)
Cost Item
Baseline present value ->

9RPM First Name: Steve Date of implementation:RPM Last Name: PadovaniRPM phone: 312-353-6755RPM fax: 0.0%RPM email: [email protected]
Name of Site: Oconomowoc ElectroplatingSite City: AshippunSite State: WISite Region: 5
Units Value
$/yr $471,000yrs 24.7 <-max of 30 yrs% 5.00%
$ $6,594,778
Units AnswerPotential
Savings (%) Range in Lookup Table
% 20.0%
Performance evaluation? A-C C -2.5% Performance evaluated and found sufficient# 5 0.0% 5 to 9 wells
gpm 30 -2.5% 10 to 99.99 gpmwks 4 5.0% 4 wks or more
# 3 2.5% 3 processes# 40 0.0% 25.00 to 49.99
yrs 24.7 0.0% 20 yrs or moreA-F C 2.0% little difficulty for minor changes, severe for major changes
24.5%
24.5% (must be between 5% and 40%)
Summary 0
$6,594,778Estimated potential savings (%): - 24.5%
Subtotal $1,615,721Estimated RSE cost (Tier 3): - $25,000
$1,590,721
**Note:Estimated potential savings do not include costs associated with implementing actual system modifications
Potential savings (initial estimate)
Cost Item
Baseline present value ->
<------ Estimated potential savings ($)
Summation (%) ->
Estimated potential savings (%) ->
Annual O&M costExpected durationDiscount rate
Baseline present value:
Expected system durationPolitical/Social factors (minor changes)
January 1, 2002
# of above-ground water treatment processesGW monitoring (number wells * events-per-yr)
Down time per year
Optimization Factor
Number of pumping wellsPumping rate

10RPM First Name: Timothy Date of implementation:RPM Last Name: PrendivilleRPM phone: 312-886-5122RPM fax: 0.0%RPM email: [email protected]
Name of Site: Onalaska Municipal LandfillSite City: OnalaskaSite State: WISite Region: 5
Units Value
$/yr $200,000yrs 0.5 <-max of 30 yrs% 5.00%
$ $95,617
Units AnswerPotential
Savings (%) Range in Lookup Table
% 20.0%
Performance evaluation? A-C C -2.5% Performance evaluated and found sufficient# 5 0.0% 5 to 9 wells
gpm 560 2.5% >500 gpmwks 1 0.0% <2 wks
# 2 0.0% 2 processes# 20 -2.5% <25
yrs 0.5 -20.0% <2 yrsA-F A 5.0% little difficulty for minor changes or major changes
2.5%
5.0% (must be between 5% and 40%)
Summary 0
$95,617Estimated potential savings (%): - 5.0%
Subtotal $4,781Estimated RSE cost (Tier 3): - $25,000
-$20,219
**Note:Estimated potential savings do not include costs associated with implementing actual system modifications
January 1, 2002
# of above-ground water treatment processesGW monitoring (number wells * events-per-yr)
Down time per year
Optimization Factor
Number of pumping wellsPumping rate
<------ Estimated potential savings ($)
Summation (%) ->
Estimated potential savings (%) ->
Annual O&M costExpected durationDiscount rate
Baseline present value:
Expected system durationPolitical/Social factors (minor changes)
Potential savings (initial estimate)
Cost Item
Baseline present value ->

11RPM First Name: John Date of implementation:RPM Last Name: FagioloRPM phone: 312-886-0800RPM fax: 0.0%RPM email: [email protected]
Name of Site: Ott/Story/Cordova Chem Co.Site City: Dalton TownshipSite State: MISite Region: 5
Units Value
$/yr $2,400,000yrs 28.6 <-max of 30 yrs% 5.00%
$ $36,108,756
Units AnswerPotential
Savings (%) Range in Lookup Table
% 20.0%
Performance evaluation? A-C A 2.5% Performance not evaluated# 10 2.5% 10 or more wells
gpm 700 2.5% >500 gpmwks 4 5.0% 4 wks or more
# 3 2.5% 3 processes# 120 5.0% 75 or more
yrs 28.6 0.0% 20 yrs or moreA-F A 5.0% little difficulty for minor changes or major changes
45.0%
40.0% (must be between 5% and 40%)
Summary 0
$36,108,756Estimated potential savings (%): - 40.0%
Subtotal $14,443,502Estimated RSE cost (Tier 3): - $25,000
$14,418,502
**Note:Estimated potential savings do not include costs associated with implementing actual system modifications
Potential savings (initial estimate)
Cost Item
Baseline present value ->
<------ Estimated potential savings ($)
Summation (%) ->
Estimated potential savings (%) ->
Annual O&M costExpected durationDiscount rate
Baseline present value:
Expected system durationPolitical/Social factors (minor changes)
January 1, 2002
# of above-ground water treatment processesGW monitoring (number wells * events-per-yr)
Down time per year
Optimization Factor
Number of pumping wellsPumping rate

12RPM First Name: Mike Date of implementation:RPM Last Name: RibordyRPM phone: 312-886-4592RPM fax: 0.0%RPM email: [email protected]
Name of Site: Peerless PlatingSite City: Muskegon TownshipSite State: MISite Region: 5
Units Value
$/yr $400,000yrs 0.0 <-max of 30 yrs% 5.00%
$ $0
Units AnswerPotential
Savings (%) Range in Lookup Table
% 20.0%
Performance evaluation? A-C C -2.5% Performance evaluated and found sufficient# 6 0.0% 5 to 9 wells
gpm 165 0.0% 100 to 500 gpmwks 0 0.0% <2 wks
# 3 2.5% 3 processes# 24 -2.5% <25
yrs 0.0 -20.0% <2 yrsA-F A 5.0% little difficulty for minor changes or major changes
2.5%
5.0% (must be between 5% and 40%)
Summary 0
$0Estimated potential savings (%): - 5.0%
Subtotal $0Estimated RSE cost (Tier 3): - $25,000
-$25,000
**Note:Estimated potential savings do not include costs associated with implementing actual system modifications
January 1, 2002
# of above-ground water treatment processesGW monitoring (number wells * events-per-yr)
Down time per year
Optimization Factor
Number of pumping wellsPumping rate
<------ Estimated potential savings ($)
Summation (%) ->
Estimated potential savings (%) ->
Annual O&M costExpected durationDiscount rate
Baseline present value:
Expected system durationPolitical/Social factors (minor changes)
Potential savings (initial estimate)
Cost Item
Baseline present value ->

13RPM First Name: Ken Date of implementation:RPM Last Name: GlatzRPM phone: 312-886-1434RPM fax: 0.0%RPM email: [email protected]
Name of Site: U.S. AviexSite City: Howard TownshipSite State: MISite Region: 5
Units Value
$/yr $300,000yrs 1.7 <-max of 30 yrs% 5.00%
$ $468,345
Units AnswerPotential
Savings (%) Range in Lookup Table
% 20.0%
Performance evaluation? A-C C -2.5% Performance evaluated and found sufficient# 6 0.0% 5 to 9 wells
gpm 170 0.0% 100 to 500 gpmwks 1 0.0% <2 wks
# 1 -2.5% 0 or 1 processes# 120 5.0% 75 or more
yrs 1.7 -20.0% <2 yrsA-F A 5.0% little difficulty for minor changes or major changes
5.0%
5.0% (must be between 5% and 40%)
Summary 0
$468,345Estimated potential savings (%): - 5.0%
Subtotal $23,417Estimated RSE cost (Tier 3): - $25,000
-$1,583
**Note:Estimated potential savings do not include costs associated with implementing actual system modifications
Potential savings (initial estimate)
Cost Item
Baseline present value ->
<------ Estimated potential savings ($)
Summation (%) ->
Estimated potential savings (%) ->
Annual O&M costExpected durationDiscount rate
Baseline present value:
Expected system durationPolitical/Social factors (minor changes)
January 1, 2002
# of above-ground water treatment processesGW monitoring (number wells * events-per-yr)
Down time per year
Optimization Factor
Number of pumping wellsPumping rate

14RPM First Name: Richard Date of implementation:RPM Last Name: BoiceRPM phone: 312-886-4740RPM fax: 0.0%RPM email: [email protected]
Name of Site: Verona Well FieldSite City: Battle CreekSite State: MISite Region: 5
Units Value
$/yr $225,000yrs 30.0 <-max of 30 yrs% 5.00%
$ $3,458,801
Units AnswerPotential
Savings (%) Range in Lookup Table
% 20.0%
Performance evaluation? A-C A 2.5% Performance not evaluated# 6 0.0% 5 to 9 wells
gpm 250 0.0% 100 to 500 gpmwks 2 2.5% 2.00 - 3.99 wks
# 2 0.0% 2 processes# 10 -2.5% <25
yrs 30.0 0.0% 20 yrs or moreA-F B 3.0% little difficulty for minor changes, moderate for major changes
25.5%
25.5% (must be between 5% and 40%)
Summary 0
$3,458,801Estimated potential savings (%): - 25.5%
Subtotal $881,994Estimated RSE cost (Tier 3): - $25,000
$856,994
**Note:Estimated potential savings do not include costs associated with implementing actual system modifications
January 1, 2002
# of above-ground water treatment processesGW monitoring (number wells * events-per-yr)
Down time per year
Optimization Factor
Number of pumping wellsPumping rate
<------ Estimated potential savings ($)
Summation (%) ->
Estimated potential savings (%) ->
Annual O&M costExpected durationDiscount rate
Baseline present value:
Expected system durationPolitical/Social factors (minor changes)
Potential savings (initial estimate)
Cost Item
Baseline present value ->

15RPM First Name: Russell Date of implementation:RPM Last Name: HartRPM phone: 312-886-4844RPM fax: 0.0%RPM email: [email protected]
Name of Site: Wash King LaundrySite City: Pleasant Plains TownshipSite State: MISite Region: 5
Units Value
$/yr $75,000yrs 19.3 <-max of 30 yrs% 5.00%
$ $913,889
Units AnswerPotential
Savings (%) Range in Lookup Table
% 20.0%
Performance evaluation? A-C A 2.5% Performance not evaluated# 5 0.0% 5 to 9 wells
gpm 250 0.0% 100 to 500 gpmwks 0 0.0% <2 wks
# 2 0.0% 2 processes# 46 0.0% 25.00 to 49.99
yrs 19.3 -2.5% 10.00 - 19.99 yrsA-F B 3.0% little difficulty for minor changes, moderate for major changes
23.0%
23.0% (must be between 5% and 40%)
Summary 0
$913,889Estimated potential savings (%): - 23.0%
Subtotal $210,195Estimated RSE cost (Tier 3): - $25,000
$185,195
**Note:Estimated potential savings do not include costs associated with implementing actual system modifications
Potential savings (initial estimate)
Cost Item
Baseline present value ->
<------ Estimated potential savings ($)
Summation (%) ->
Estimated potential savings (%) ->
Annual O&M costExpected durationDiscount rate
Baseline present value:
Expected system durationPolitical/Social factors (minor changes)
January 1, 2002
# of above-ground water treatment processesGW monitoring (number wells * events-per-yr)
Down time per year
Optimization Factor
Number of pumping wellsPumping rate

REGION 6 SCREENING CALCULATIONS

1RPM First Name: Stacey Date of implementation:RPM Last Name: BennettRPM phone: 214-665-6729RPM fax: 214-665-6660RPM email: [email protected]
Name of Site: American Creosote WorksSite City: WinnfieldSite State: LASite Region: 6
Units Value
$/yr $360,000yrs 25.1 <-max of 30 yrs% 5.00%
$ $5,084,310
Units AnswerPotential
Savings (%) Range in Lookup Table
% 20.0%
Performance evaluation? A-C C -2.5% Performance evaluated and found sufficient# 18 2.5% 10 or more wells
gpm 5.0 -5.0% <10 gpmwks 1 0.0% <2 wks
# 3 2.5% 3 processes# 72 2.5% 50.00 to 74.99
yrs 25.1 0.0% 20 yrs or moreA-F C 2.0% little difficulty for minor changes, severe for major changes
22.0%
22.0% (must be between 5% and 40%)
Summary$5,084,310
Estimated potential savings (%): - 22.0%Subtotal $1,118,548
Estimated RSE cost (Tier 3): - $25,000$1,093,548
**Note:Estimated potential savings do not include costs associated with implementing actual system modifications
January 1, 2002
# of above-ground water treatment processesGW monitoring (number wells * events-per-yr)
Down time per year
Optimization Factor
Number of pumping wellsPumping rate
<------ Estimated potential savings ($)
Summation (%) ->
Estimated potential savings (%) ->
Annual O&M costExpected durationDiscount rate
Baseline present value:
Expected system durationPolitical/Social factors (minor changes)
Potential savings (initial estimate)
Cost Item
Baseline present value ->

2RPM First Name: Katrina Date of implementation:RPM Last Name: ColtrainRPM phone: 214-665-8143RPM fax: 214-665-6660RPM email: [email protected]
Name of Site: Bayou BonfoucaSite City: SlidellSite State: LASite Region: 6
Units Value
$/yr $402,000yrs 19.5 <-max of 30 yrs% 5.00%
$ $4,936,430
Units AnswerPotential
Savings (%) Range in Lookup Table
% 20.0%
Performance evaluation? A-C C -2.5% Performance evaluated and found sufficient# 44 2.5% 10 or more wells
gpm 22.5 -2.5% 10 to 99.99 gpmwks 0 0.0% <2 wks
# 3 2.5% 3 processes# 132 5.0% 75 or more
yrs 19.5 -2.5% 10.00 - 19.99 yrsA-F B 3.0% little difficulty for minor changes, moderate for major changes
25.5%
25.5% (must be between 5% and 40%)
Summary$4,936,430
Estimated potential savings (%): - 25.5%Subtotal $1,258,790
Estimated RSE cost (Tier 3): - $25,000$1,233,790
**Note:Estimated potential savings do not include costs associated with implementing actual system modifications
January 1, 2002
Potential savings (initial estimate)
Cost Item
Baseline present value ->
<------ Estimated potential savings ($)
Summation (%) ->
Estimated potential savings (%) ->
Baseline present value:
Expected system durationPolitical/Social factors (minor changes)
# of above-ground water treatment processesGW monitoring (number wells * events-per-yr)
Annual O&M costExpected durationDiscount rate
Down time per year
Optimization Factor
Number of pumping wellsPumping rate

3RPM First Name: Petra Date of implementation:RPM Last Name: SanchezRPM phone: 214-665-6686RPM fax: 214-665-6660RPM email: [email protected]
Name of Site: Cimarron MiningSite City: CarizozoSite State: NMSite Region: 6
Units Value
$/yr $1,000,000yrs 30.0 <-max of 30 yrs% 5.00%
$ $15,372,451
Units AnswerPotential
Savings (%) Range in Lookup Table
% 20.0%
Performance evaluation? A-C B 5.0% Performance evaluated and found insufficient# 3 -2.5% 3 to 4 wells
gpm 1.0 -5.0% <10 gpmwks 4 5.0% 4 wks or more
# 1 -2.5% 0 or 1 processes# 12 -2.5% <25
yrs 30.0 0.0% 20 yrs or moreA-F E -2.5% moderate difficulty for minor changes, severe for major changes
15.0%
15.0% (must be between 5% and 40%)
Summary$15,372,451
Estimated potential savings (%): - 15.0%Subtotal $2,305,868
Estimated RSE cost (Tier 3): - $25,000$2,280,868
**Note:Estimated potential savings do not include costs associated with implementing actual system modifications
January 1, 2002
# of above-ground water treatment processesGW monitoring (number wells * events-per-yr)
Down time per year
Optimization Factor
Number of pumping wellsPumping rate
<------ Estimated potential savings ($)
Summation (%) ->
Estimated potential savings (%) ->
Annual O&M costExpected durationDiscount rate
Baseline present value:
Expected system durationPolitical/Social factors (minor changes)
Potential savings (initial estimate)
Cost Item
Baseline present value ->

4RPM First Name: Vincent Date of implementation:RPM Last Name: MalottRPM phone: 214-665-8313RPM fax: 214-665-6660RPM email: [email protected]
Name of Site: City of Perryton Well #2Site City: PerrytonSite State: TXSite Region: 6
Units Value
$/yr $37,000yrs 21.6 <-max of 30 yrs% 5.00%
$ $481,977
Units AnswerPotential
Savings (%) Range in Lookup Table
% 20.0%
Performance evaluation? A-C A 2.5% Performance not evaluated# 1 -5.0% 1 to 2 wells
gpm 150.0 0.0% 100 to 500 gpmwks 0 0.0% <2 wks
# 1 -2.5% 0 or 1 processes# 20 -2.5% <25
yrs 21.6 0.0% 20 yrs or moreA-F A 5.0% little difficulty for minor changes or major changes
17.5%
17.5% (must be between 5% and 40%)
Summary$481,977
Estimated potential savings (%): - 17.5%Subtotal $84,346
Estimated RSE cost (Tier 3): - $25,000$59,346
**Note:Estimated potential savings do not include costs associated with implementing actual system modifications
January 1, 2002
Potential savings (initial estimate)
Cost Item
Baseline present value ->
<------ Estimated potential savings ($)
Summation (%) ->
Estimated potential savings (%) ->
Baseline present value:
Expected system durationPolitical/Social factors (minor changes)
# of above-ground water treatment processesGW monitoring (number wells * events-per-yr)
Annual O&M costExpected durationDiscount rate
Down time per year
Optimization Factor
Number of pumping wellsPumping rate

5RPM First Name: Ruben Date of implementation:RPM Last Name: MoyaRPM phone: 214-665-2755RPM fax: 214-665-6660RPM email: [email protected]
Name of Site: Geneva IndustriesSite City: HoustonSite State: TXSite Region: 6
Units Value
$/yr $240,000yrs 2.0 <-max of 30 yrs% 5.00%
$ $446,259
Units AnswerPotential
Savings (%) Range in Lookup Table
% 20.0%
Performance evaluation? A-C C -2.5% Performance evaluated and found sufficient# 13 2.5% 10 or more wells
gpm 5.0 -5.0% <10 gpmwks 52 5.0% 4 wks or more
# 2 0.0% 2 processes# 26 0.0% 25.00 to 49.99
yrs 2.0 -15.0% 2.00 - 4.99yrsA-F B 3.0% little difficulty for minor changes, moderate for major changes
8.0%
8.0% (must be between 5% and 40%)
Summary$446,259
Estimated potential savings (%): - 8.0%Subtotal $35,701
Estimated RSE cost (Tier 3): - $25,000$10,701
**Note:Estimated potential savings do not include costs associated with implementing actual system modifications
January 1, 2002
# of above-ground water treatment processesGW monitoring (number wells * events-per-yr)
Down time per year
Optimization Factor
Number of pumping wellsPumping rate
<------ Estimated potential savings ($)
Summation (%) ->
Estimated potential savings (%) ->
Annual O&M costExpected durationDiscount rate
Baseline present value:
Expected system durationPolitical/Social factors (minor changes)
Potential savings (initial estimate)
Cost Item
Baseline present value ->

6RPM First Name: Carlos Date of implementation:RPM Last Name: SanchezRPM phone: 214-665-8507RPM fax: 214-665-6660RPM email: [email protected]
Name of Site: Midland ProductsSite City: OlaSite State: ARSite Region: 6
Units Value
$/yr $180,000yrs 30.0 <-max of 30 yrs% 5.00%
$ $2,767,041
Units AnswerPotential
Savings (%) Range in Lookup Table
% 20.0%
Performance evaluation? A-C C -2.5% Performance evaluated and found sufficient# 8 0.0% 5 to 9 wells
gpm 3.0 -5.0% <10 gpmwks 1 0.0% <2 wks
# 3 2.5% 3 processes# 40 0.0% 25.00 to 49.99
yrs 30.0 0.0% 20 yrs or moreA-F A 5.0% little difficulty for minor changes or major changes
20.0%
20.0% (must be between 5% and 40%)
Summary$2,767,041
Estimated potential savings (%): - 20.0%Subtotal $553,408
Estimated RSE cost (Tier 3): - $25,000$528,408
**Note:Estimated potential savings do not include costs associated with implementing actual system modifications
January 1, 2002
Potential savings (initial estimate)
Cost Item
Baseline present value ->
<------ Estimated potential savings ($)
Summation (%) ->
Estimated potential savings (%) ->
Baseline present value:
Expected system durationPolitical/Social factors (minor changes)
# of above-ground water treatment processesGW monitoring (number wells * events-per-yr)
Annual O&M costExpected durationDiscount rate
Down time per year
Optimization Factor
Number of pumping wellsPumping rate

7RPM First Name: Camille Date of implementation:RPM Last Name: HueniRPM phone: 214-665-2231RPM fax: 214-665-6660RPM email: [email protected]
Name of Site: North Cavalcade Superfund SiteSite City: HoustonSite State: TXSite Region: 6
Units Value
$/yr $0yrs 8.9 <-max of 30 yrs% 5.00%
$ $0
Units AnswerPotential
Savings (%) Range in Lookup Table
% 20.0%
Performance evaluation? A-C A 2.5% Performance not evaluated# 19 2.5% 10 or more wells
gpm 19.0 -2.5% 10 to 99.99 gpmwks 52 5.0% 4 wks or more
# 3 2.5% 3 processes# 0 -2.5% <25
yrs 8.9 -5.0% 5.00 - 9.99 yrsA-F A 5.0% little difficulty for minor changes or major changes
27.5%
27.5% (must be between 5% and 40%)
Summary$0
Estimated potential savings (%): - 27.5%Subtotal $0
Estimated RSE cost (Tier 3): - $25,000-$25,000
**Note:Estimated potential savings do not include costs associated with implementing actual system modifications
January 1, 2002
# of above-ground water treatment processesGW monitoring (number wells * events-per-yr)
Down time per year
Optimization Factor
Number of pumping wellsPumping rate
<------ Estimated potential savings ($)
Summation (%) ->
Estimated potential savings (%) ->
Annual O&M costExpected durationDiscount rate
Baseline present value:
Expected system durationPolitical/Social factors (minor changes)
Potential savings (initial estimate)
Cost Item
Baseline present value ->

8RPM First Name: Ernest Date of implementation:RPM Last Name: FrankeRPM phone: 214-665-8521RPM fax: 214-665-6660RPM email: franke,[email protected]
Name of Site: Odessa Chromium #1Site City: OdessaSite State: TXSite Region: 6
Units Value
$/yr $500,000yrs 0.0 <-max of 30 yrs% 5.00%
$ $0
Units AnswerPotential
Savings (%) Range in Lookup Table
% 20.0%
Performance evaluation? A-C C -2.5% Performance evaluated and found sufficient# 6 0.0% 5 to 9 wells
gpm 60.0 -2.5% 10 to 99.99 gpmwks 15 5.0% 4 wks or more
# 1 -2.5% 0 or 1 processes# 14 -2.5% <25
yrs 0.0 -20.0% <2 yrsA-F A 5.0% little difficulty for minor changes or major changes
0.0%
5.0% (must be between 5% and 40%)
Summary$0
Estimated potential savings (%): - 5.0%Subtotal $0
Estimated RSE cost (Tier 3): - $25,000-$25,000
**Note:Estimated potential savings do not include costs associated with implementing actual system modifications
January 1, 2002
Potential savings (initial estimate)
Cost Item
Baseline present value ->
<------ Estimated potential savings ($)
Summation (%) ->
Estimated potential savings (%) ->
Baseline present value:
Expected system durationPolitical/Social factors (minor changes)
# of above-ground water treatment processesGW monitoring (number wells * events-per-yr)
Annual O&M costExpected durationDiscount rate
Down time per year
Optimization Factor
Number of pumping wellsPumping rate

9RPM First Name: Vincent Date of implementation:RPM Last Name: MalottRPM phone: 214-665-8313RPM fax: 214-665-6660RPM email: [email protected]
Name of Site: Sprague Road Ground Water PlumeSite City: OdessaSite State: TXSite Region: 6
Units Value
$/yr $1,200,000yrs 26.7 <-max of 30 yrs% 5.00%
$ $17,472,059
Units AnswerPotential
Savings (%) Range in Lookup Table
% 20.0%
Performance evaluation? A-C A 2.5% Performance not evaluated# 22 2.5% 10 or more wells
gpm 200.0 0.0% 100 to 500 gpmwks 0 0.0% <2 wks
# 1 -2.5% 0 or 1 processes# 200 5.0% 75 or more
yrs 26.7 0.0% 20 yrs or moreA-F A 5.0% little difficulty for minor changes or major changes
32.5%
32.5% (must be between 5% and 40%)
Summary$17,472,059
Estimated potential savings (%): - 32.5%Subtotal $5,678,419
Estimated RSE cost (Tier 3): - $25,000$5,653,419
**Note:Estimated potential savings do not include costs associated with implementing actual system modifications
January 1, 2002
# of above-ground water treatment processesGW monitoring (number wells * events-per-yr)
Down time per year
Optimization Factor
Number of pumping wellsPumping rate
<------ Estimated potential savings ($)
Summation (%) ->
Estimated potential savings (%) ->
Annual O&M costExpected durationDiscount rate
Baseline present value:
Expected system durationPolitical/Social factors (minor changes)
Potential savings (initial estimate)
Cost Item
Baseline present value ->

REGION 7 SCREENING CALCULATIONS

1RPM First Name: Bob Date of implementation:RPM Last Name: StewartRPM phone: 913-551-7654RPM fax: 913-551-9654RPM email: [email protected]
Name of Site: Ace ServicesSite City: ColbySite State: KSSite Region: 7
Units Value
$/yr $500,000yrs 13.7 <-max of 30 yrs% 5.00%
$ $4,868,337
Units AnswerPotential
Savings (%) Range in Lookup Table
% 20.0%
Performance evaluation? A-C A 2.5% Performance not evaluated# 12 2.5% 10 or more wells
gpm 800 2.5% >500 gpmwks 0 0.0% <2 wks
# 1 -2.5% 0 or 1 processes# 124 5.0% 75 or more
yrs 13.7 -2.5% 10.00 - 19.99 yrsA-F A 5.0% little difficulty for minor changes or major changes
32.5%
32.5% (must be between 5% and 40%)
Summary$4,868,337
Estimated potential savings (%): - 32.5%Subtotal $1,582,210
Estimated RSE cost (Tier 3): - $25,000$1,557,210
**Note:Estimated potential savings do not include costs associated with implementing actual system modifications
Potential savings (initial estimate)
Cost Item
Baseline present value ->
<------ Estimated potential savings ($)
Summation (%) ->
Estimated potential savings (%) ->
Annual O&M costExpected durationDiscount rate
Baseline present value:
Expected system durationPolitical/Social factors (minor changes)
January 1, 2002
# of above-ground water treatment processesGW monitoring (number wells * events-per-yr)
Down time per year
Optimization Factor
Number of pumping wellsPumping rate

2RPM First Name: Mary Date of implementation:RPM Last Name: PetersonRPM phone: 913-551-7882RPM fax: 913-551-7063RPM email: [email protected]
Name of Site: Cleburn Street Well Site/OU2Site City: Grand IslandSite State: NESite Region: 7
Units Value
$/yr $100,000yrs 17.9 <-max of 30 yrs% 5.00%
$ $1,165,954
Units AnswerPotential
Savings (%) Range in Lookup Table
% 20.0%
Performance evaluation? A-C A 2.5% Performance not evaluated# 3 -2.5% 3 to 4 wells
gpm 90 -2.5% 10 to 99.99 gpmwks 1 0.0% <2 wks
# 1 -2.5% 0 or 1 processes# 32 0.0% 25.00 to 49.99
yrs 17.9 -2.5% 10.00 - 19.99 yrsA-F A 5.0% little difficulty for minor changes or major changes
17.5%
17.5% (must be between 5% and 40%)
Summary$1,165,954
Estimated potential savings (%): - 17.5%Subtotal $204,042
Estimated RSE cost (Tier 3): - $25,000$179,042
**Note:Estimated potential savings do not include costs associated with implementing actual system modifications
January 1, 2002
# of above-ground water treatment processesGW monitoring (number wells * events-per-yr)
Down time per year
Optimization Factor
Number of pumping wellsPumping rate
<------ Estimated potential savings ($)
Summation (%) ->
Estimated potential savings (%) ->
Annual O&M costExpected durationDiscount rate
Baseline present value:
Expected system durationPolitical/Social factors (minor changes)
Potential savings (initial estimate)
Cost Item
Baseline present value ->

3RPM First Name: Steve Date of implementation:RPM Last Name: AuchterlonieRPM phone: 913-551-7778RPM fax: 913-551-7437RPM email: [email protected]
Name of Site: Valley Park TCE Site - OU2Site City: Valley ParkSite State: MOSite Region: 7
Units Value
$/yr $0yrs 14.0 <-max of 30 yrs% 5.00%
$ $0
Units AnswerPotential
Savings (%) Range in Lookup Table
% 20.0%
Performance evaluation? A-C A 2.5% Performance not evaluated# 0 0.0% no wells (e.g., drains, etc.)
gpm 0 -5.0% <10 gpmwks 0 0.0% <2 wks
# 1 -2.5% 0 or 1 processes# 0 -2.5% <25
yrs 14.0 -2.5% 10.00 - 19.99 yrsA-F A 5.0% little difficulty for minor changes or major changes
15.0%
15.0% (must be between 5% and 40%)
Summary$0
Estimated potential savings (%): - 15.0%Subtotal $0
Estimated RSE cost (Tier 3): - $25,000-$25,000
**Note:Estimated potential savings do not include costs associated with implementing actual system modifications
Potential savings (initial estimate)
Cost Item
Baseline present value ->
<------ Estimated potential savings ($)
Summation (%) ->
Estimated potential savings (%) ->
Annual O&M costExpected durationDiscount rate
Baseline present value:
Expected system durationPolitical/Social factors (minor changes)
January 1, 2002
# of above-ground water treatment processesGW monitoring (number wells * events-per-yr)
Down time per year
Optimization Factor
Number of pumping wellsPumping rate

REGION 9 SCREENING CALCULATIONS

1RPM First Name: David Date of implementation:RPM Last Name: SeterRPM phone: 415-744-2212RPM fax: 111-111-1111RPM email: [email protected]
Name of Site: Modesto Superfund SiteSite City: ModestoSite State: CASite Region: 9
Units Value
$/yr $300,000yrs 20.3 <-max of 30 yrs% 5.00%
$ $3,776,134
Units AnswerPotential
Savings (%) Range in Lookup Table
% 20.0%
Performance evaluation? A-C A 2.5% Performance not evaluated# 1 -5.0% 1 to 2 wells
gpm 50 -2.5% 10 to 99.99 gpmwks 0 0.0% <2 wks
# 2 0.0% 2 processes# 40 0.0% 25.00 to 49.99
yrs 20.3 0.0% 20 yrs or moreA-F A 5.0% little difficulty for minor changes or major changes
20.0%
20.0% (must be between 5% and 40%)
Summary$3,776,134
Estimated potential savings (%): - 20.0%Subtotal $755,227
Estimated RSE cost (Tier 3): - $25,000$730,227
**Note:Estimated potential savings do not include costs associated with implementing actual system modifications
January 1, 2002
# of above-ground water treatment processesGW monitoring (number wells * events-per-yr)
Down time per year
Optimization Factor
Number of pumping wellsPumping rate
<------ Estimated potential savings ($)
Summation (%) ->
Estimated potential savings (%) ->
Annual O&M costExpected durationDiscount rate
Baseline present value:
Expected system durationPolitical/Social factors (minor changes)
Potential savings (initial estimate)
Cost Item
Baseline present value ->

2RPM First Name: Kim Date of implementation:RPM Last Name: HoangRPM phone: 415-744-2370RPM fax: 999-999-9999RPM email: [email protected]
Name of Site: MuscoySite City: San BernadinoSite State: CASite Region: 9
Units Value
$/yr $1,100,000yrs 22.8 <-max of 30 yrs% 5.00%
$ $14,754,617
Units AnswerPotential
Savings (%) Range in Lookup Table
% 20.0%
Performance evaluation? A-C A 2.5% Performance not evaluated# 5 0.0% 5 to 9 wells
gpm 9000 2.5% >500 gpmwks 0 0.0% <2 wks
# 1 -2.5% 0 or 1 processes# 60 2.5% 50.00 to 74.99
yrs 22.8 0.0% 20 yrs or moreA-F C 2.0% little difficulty for minor changes, severe for major changes
27.0%
27.0% (must be between 5% and 40%)
Summary$14,754,617
Estimated potential savings (%): - 27.0%Subtotal $3,983,747
Estimated RSE cost (Tier 3): - $25,000$3,958,747
**Note:Estimated potential savings do not include costs associated with implementing actual system modifications
Potential savings (initial estimate)
Cost Item
Baseline present value ->
<------ Estimated potential savings ($)
Summation (%) ->
Estimated potential savings (%) ->
Annual O&M costExpected durationDiscount rate
Baseline present value:
Expected system durationPolitical/Social factors (minor changes)
January 1, 2002
# of above-ground water treatment processesGW monitoring (number wells * events-per-yr)
Down time per year
Optimization Factor
Number of pumping wellsPumping rate
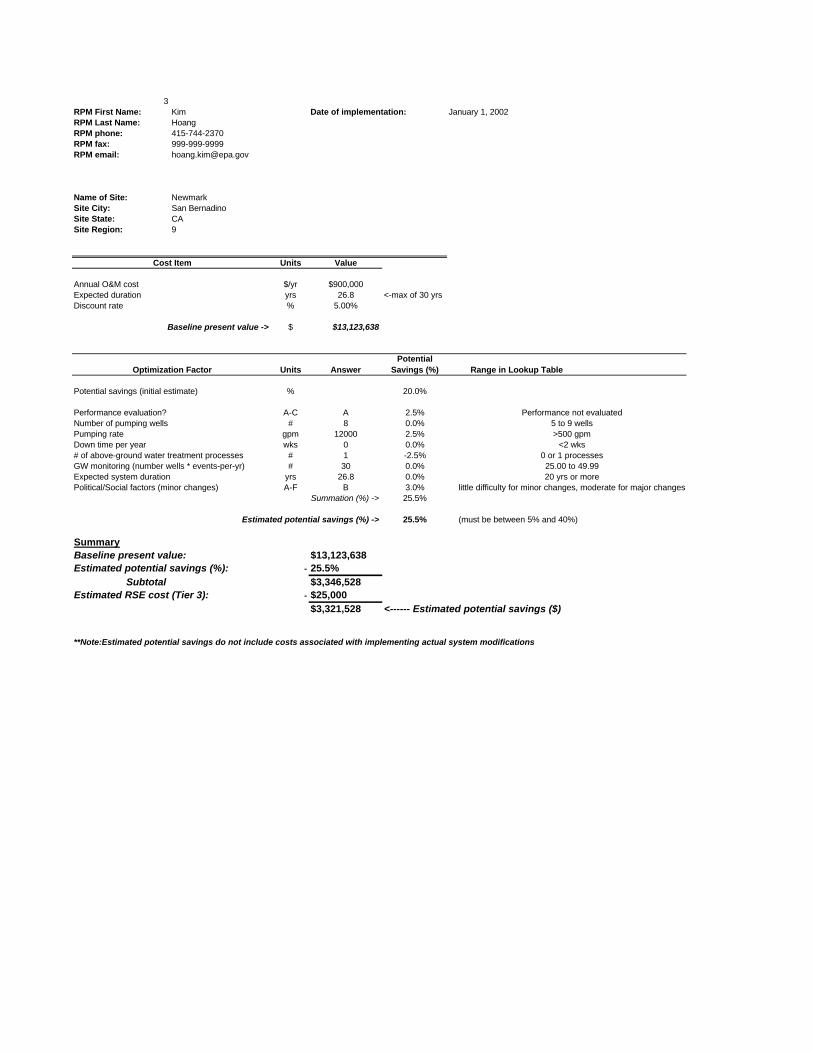
3RPM First Name: Kim Date of implementation:RPM Last Name: HoangRPM phone: 415-744-2370RPM fax: 999-999-9999RPM email: [email protected]
Name of Site: NewmarkSite City: San BernadinoSite State: CASite Region: 9
Units Value
$/yr $900,000yrs 26.8 <-max of 30 yrs% 5.00%
$ $13,123,638
Units AnswerPotential
Savings (%) Range in Lookup Table
% 20.0%
Performance evaluation? A-C A 2.5% Performance not evaluated# 8 0.0% 5 to 9 wells
gpm 12000 2.5% >500 gpmwks 0 0.0% <2 wks
# 1 -2.5% 0 or 1 processes# 30 0.0% 25.00 to 49.99
yrs 26.8 0.0% 20 yrs or moreA-F B 3.0% little difficulty for minor changes, moderate for major changes
25.5%
25.5% (must be between 5% and 40%)
Summary$13,123,638
Estimated potential savings (%): - 25.5%Subtotal $3,346,528
Estimated RSE cost (Tier 3): - $25,000$3,321,528
**Note:Estimated potential savings do not include costs associated with implementing actual system modifications
January 1, 2002
# of above-ground water treatment processesGW monitoring (number wells * events-per-yr)
Down time per year
Optimization Factor
Number of pumping wellsPumping rate
<------ Estimated potential savings ($)
Summation (%) ->
Estimated potential savings (%) ->
Annual O&M costExpected durationDiscount rate
Baseline present value:
Expected system durationPolitical/Social factors (minor changes)
Potential savings (initial estimate)
Cost Item
Baseline present value ->

4RPM First Name: Michelle Date of implementation:RPM Last Name: LauRPM phone: 415-744-2227RPM fax: 415-744-2180RPM email: [email protected]
Name of Site: Selma Treating Co.Site City: SelmaSite State: CASite Region: 9
Units Value
$/yr $300,000yrs 6.8 <-max of 30 yrs% 5.00%
$ $1,684,303
Units AnswerPotential
Savings (%) Range in Lookup Table
% 20.0%
Performance evaluation? A-C C -2.5% Performance evaluated and found sufficient# 6 0.0% 5 to 9 wells
gpm 150 0.0% 100 to 500 gpmwks 0 0.0% <2 wks
# 1 -2.5% 0 or 1 processes# 80 5.0% 75 or more
yrs 6.8 -5.0% 5.00 - 9.99 yrsA-F C 2.0% little difficulty for minor changes, severe for major changes
17.0%
17.0% (must be between 5% and 40%)
Summary$1,684,303
Estimated potential savings (%): - 17.0%Subtotal $286,332
Estimated RSE cost (Tier 3): - $25,000$261,332
**Note:Estimated potential savings do not include costs associated with implementing actual system modifications
Potential savings (initial estimate)
Cost Item
Baseline present value ->
<------ Estimated potential savings ($)
Summation (%) ->
Estimated potential savings (%) ->
Annual O&M costExpected durationDiscount rate
Baseline present value:
Expected system durationPolitical/Social factors (minor changes)
January 1, 2002
# of above-ground water treatment processesGW monitoring (number wells * events-per-yr)
Down time per year
Optimization Factor
Number of pumping wellsPumping rate

REGION 10 SCREENING CALCULATIONS

1RPM First Name: Debra Date of implementation:RPM Last Name: YamamotoRPM phone: 206-553-7216RPM fax: 206-553-0124RPM email: [email protected]
Name of Site: Boomsnub/Airco / Site-Wide Ground Water OUSite City: Hazel DellSite State: WASite Region: 10
Units Value
$/yr $1,000,000yrs 28.8 <-max of 30 yrs% 5.00%
$ $15,085,551
Units AnswerPotential
Savings (%) Range in Lookup Table
% 20.0%
Performance evaluation? A-C C -2.5% Performance evaluated and found sufficient# 22 2.5% 10 or more wells
gpm 135 0.0% 100 to 500 gpmwks 3 2.5% 2.00 - 3.99 wks
# 3 2.5% 3 processes# 160 5.0% 75 or more
yrs 28.8 0.0% 20 yrs or moreA-F E -2.5% moderate difficulty for minor changes, severe for major changes
27.5%
27.5% (must be between 5% and 40%)
Summary$15,085,551
Estimated potential savings (%): - 27.5%Subtotal $4,148,527
Estimated RSE cost (Tier 3): - $25,000$4,123,527
**Note:Estimated potential savings do not include costs associated with implementing actual system modifications
January 1, 2002
# of above-ground water treatment processesGW monitoring (number wells * events-per-yr)
Down time per year
Optimization Factor
Number of pumping wellsPumping rate
<------ Estimated potential savings ($)
Summation (%) ->
Estimated potential savings (%) ->
Annual O&M costExpected durationDiscount rate
Baseline present value:
Expected system durationPolitical/Social factors (minor changes)
Potential savings (initial estimate)
Cost Item
Baseline present value ->

2RPM First Name: Carmella Date of implementation:RPM Last Name: GrandinettiRPM phone: 206-553-8696RPM fax: 206-553-0124RPM email: [email protected]
Name of Site: Bunker Hill Superfund SiteSite City: KelloggSite State: IDSite Region: 10
Units Value
$/yr $0yrs 30.0 <-max of 30 yrs% 5.00%
$ $0
Units AnswerPotential
Savings (%) Range in Lookup Table
% 20.0%
Performance evaluation? A-C A 2.5% Performance not evaluated# 0 0.0% no wells (e.g., drains, etc.)
gpm 0 -5.0% <10 gpmwks 0 0.0% <2 wks
# 1 -2.5% 0 or 1 processes# 232 5.0% 75 or more
yrs 30.0 0.0% 20 yrs or moreA-F A 5.0% little difficulty for minor changes or major changes
25.0%
25.0% (must be between 5% and 40%)
Summary$0
Estimated potential savings (%): - 25.0%Subtotal $0
Estimated RSE cost (Tier 3): - $25,000-$25,000
**Note:Estimated potential savings do not include costs associated with implementing actual system modifications
Potential savings (initial estimate)
Cost Item
Baseline present value ->
<------ Estimated potential savings ($)
Summation (%) ->
Estimated potential savings (%) ->
Annual O&M costExpected durationDiscount rate
Baseline present value:
Expected system durationPolitical/Social factors (minor changes)
January 1, 2002
# of above-ground water treatment processesGW monitoring (number wells * events-per-yr)
Down time per year
Optimization Factor
Number of pumping wellsPumping rate

3RPM First Name: Kevin Date of implementation:RPM Last Name: RochlinRPM phone: 206-553-2106RPM fax: 206-553-0124RPM email: [email protected]
Name of Site: Commencement Bay, South Tacoma Channel, Well 12ASite City: TacomaSite State: WASite Region: 10
Units Value
$/yr $300,000yrs 9.0 <-max of 30 yrs% 5.00%
$ $2,133,380
Units AnswerPotential
Savings (%) Range in Lookup Table
% 20.0%
Performance evaluation? A-C B 5.0% Performance evaluated and found insufficient# 5 0.0% 5 to 9 wells
gpm 150 0.0% 100 to 500 gpmwks 3 2.5% 2.00 - 3.99 wks
# 1 -2.5% 0 or 1 processes# 40 0.0% 25.00 to 49.99
yrs 9.0 -5.0% 5.00 - 9.99 yrsA-F B 3.0% little difficulty for minor changes, moderate for major changes
23.0%
23.0% (must be between 5% and 40%)
Summary$2,133,380
Estimated potential savings (%): - 23.0%Subtotal $490,677
Estimated RSE cost (Tier 3): - $25,000$465,677
**Note:Estimated potential savings do not include costs associated with implementing actual system modifications
January 1, 2002
# of above-ground water treatment processesGW monitoring (number wells * events-per-yr)
Down time per year
Optimization Factor
Number of pumping wellsPumping rate
<------ Estimated potential savings ($)
Summation (%) ->
Estimated potential savings (%) ->
Annual O&M costExpected durationDiscount rate
Baseline present value:
Expected system durationPolitical/Social factors (minor changes)
Potential savings (initial estimate)
Cost Item
Baseline present value ->

4RPM First Name: Alan Date of implementation:RPM Last Name: GoodmanRPM phone: 503-326-3685RPM fax: 503-326-3399RPM email: [email protected]
Name of Site: McCormick & Baxter Creosoting Co.Site City: PortlandSite State: ORSite Region: 10
Units Value
$/yr $250,000yrs 30.0 <-max of 30 yrs% 5.00%
$ $3,843,113
Units AnswerPotential
Savings (%) Range in Lookup Table
% 20.0%
Performance evaluation? A-C C -2.5% Performance evaluated and found sufficient# 6 0.0% 5 to 9 wells
gpm 3 -5.0% <10 gpmwks 5 5.0% 4 wks or more
# 4 5.0% 4 or more processes# 50 2.5% 50.00 to 74.99
yrs 30.0 0.0% 20 yrs or moreA-F A 5.0% little difficulty for minor changes or major changes
30.0%
30.0% (must be between 5% and 40%)
Summary$3,843,113
Estimated potential savings (%): - 30.0%Subtotal $1,152,934
Estimated RSE cost (Tier 3): - $25,000$1,127,934
**Note:Estimated potential savings do not include costs associated with implementing actual system modifications
Potential savings (initial estimate)
Cost Item
Baseline present value ->
<------ Estimated potential savings ($)
Summation (%) ->
Estimated potential savings (%) ->
Annual O&M costExpected durationDiscount rate
Baseline present value:
Expected system durationPolitical/Social factors (minor changes)
January 1, 2002
# of above-ground water treatment processesGW monitoring (number wells * events-per-yr)
Down time per year
Optimization Factor
Number of pumping wellsPumping rate

5RPM First Name: Hanh Date of implementation:RPM Last Name: GoldRPM phone: 206-553-0171RPM fax: 206-553-0124RPM email: [email protected]
Name of Site: Wyckoff/Eagle Harbor Superfund SiteSite City: Bainbridge IslandSite State: WASite Region: 10
Units Value
$/yr $500,000yrs 30.0 <-max of 30 yrs% 5.00%
$ $7,686,226
Units AnswerPotential
Savings (%) Range in Lookup Table
% 20.0%
Performance evaluation? A-C B 5.0% Performance evaluated and found insufficient# 8 0.0% 5 to 9 wells
gpm 80 -2.5% 10 to 99.99 gpmwks 0 0.0% <2 wks
# 3 2.5% 3 processes# 20 -2.5% <25
yrs 30.0 0.0% 20 yrs or moreA-F B 3.0% little difficulty for minor changes, moderate for major changes
25.5%
25.5% (must be between 5% and 40%)
Summary$7,686,226
Estimated potential savings (%): - 25.5%Subtotal $1,959,988
Estimated RSE cost (Tier 3): - $25,000$1,934,988
**Note:Estimated potential savings do not include costs associated with implementing actual system modifications
January 1, 2002
# of above-ground water treatment processesGW monitoring (number wells * events-per-yr)
Down time per year
Optimization Factor
Number of pumping wellsPumping rate
<------ Estimated potential savings ($)
Summation (%) ->
Estimated potential savings (%) ->
Annual O&M costExpected durationDiscount rate
Baseline present value:
Expected system durationPolitical/Social factors (minor changes)
Potential savings (initial estimate)
Cost Item
Baseline present value ->
Recommended