usfunds.com 1.800.US.FUNDS May 9, 2013 • 13-181
GROW Q3 2013 Earnings Webcast Frank Holmes, CEO and Chief Investment Officer
Susan McGee, President and General Counsel
Catherine Rademacher, Chief Financial Officer
Susan Filyk, Investor Relations

www.usfunds.com May 2013 13-181 2
Today’s Presenters
Frank Holmes Susan McGee Catherine Rademacher Susan Filyk
www.usfunds.com May 2013 13-181
Forward-Looking Statements
3
During this webcast we may make forward-looking statements about our relative business outlook. Any forward-looking statements and all other statements made during this webcast that don’t pertain to historical facts are subject to risks and uncertainties that may materially affect actual results. Please refer to our press release and the corresponding Form 10-Q filing for more detail on factors that could cause actual results to differ materially from any described today in forward-looking statements. Any such statements are made as of today, and U.S. Global Investors accepts no obligation to update them in the future.
www.usfunds.com May 2013 13-181
About U.S. Global Investors (GROW)
A boutique publicly listed investment adviser specializing in gold, natural resources and emerging markets opportunities around the world.
4
www.usfunds.com May 2013 13-181
GROW Strengths
Go-to stock for exposure to emerging markets and resources
Debt-free, strong balance sheet with a reflexive cost structure Monthly dividend and return on equity discipline
5

www.usfunds.com May 2013 13-181
Top Institutional Holders of GROW
6
1. Royce and Associates 15%
2. Financial and Investment 14% Management Group
3. Perritt Capital Management 4%
4. Fidelity Management 4% & Research Co.
5. Team Financial Managers, Inc 4% Percentage of shares outstanding as of 3/28/2013 Source: NASDAQ

www.usfunds.com May 2013 13-181
Company Snapshot
7
10-Year Annualized
GROW 15.96% Russell
2000 Index 11.53%
NASDAQ: GROW Price on 3/28/13: $3.67
Market Cap: $56.7 million 52-wk Range: $3.58 - $7.34

www.usfunds.com May 2013 13-181
GROW Performance — Past Three Months Rationale to Buy Stock
8
Past performance does not guarantee future results.
www.usfunds.com May 2013 13-181
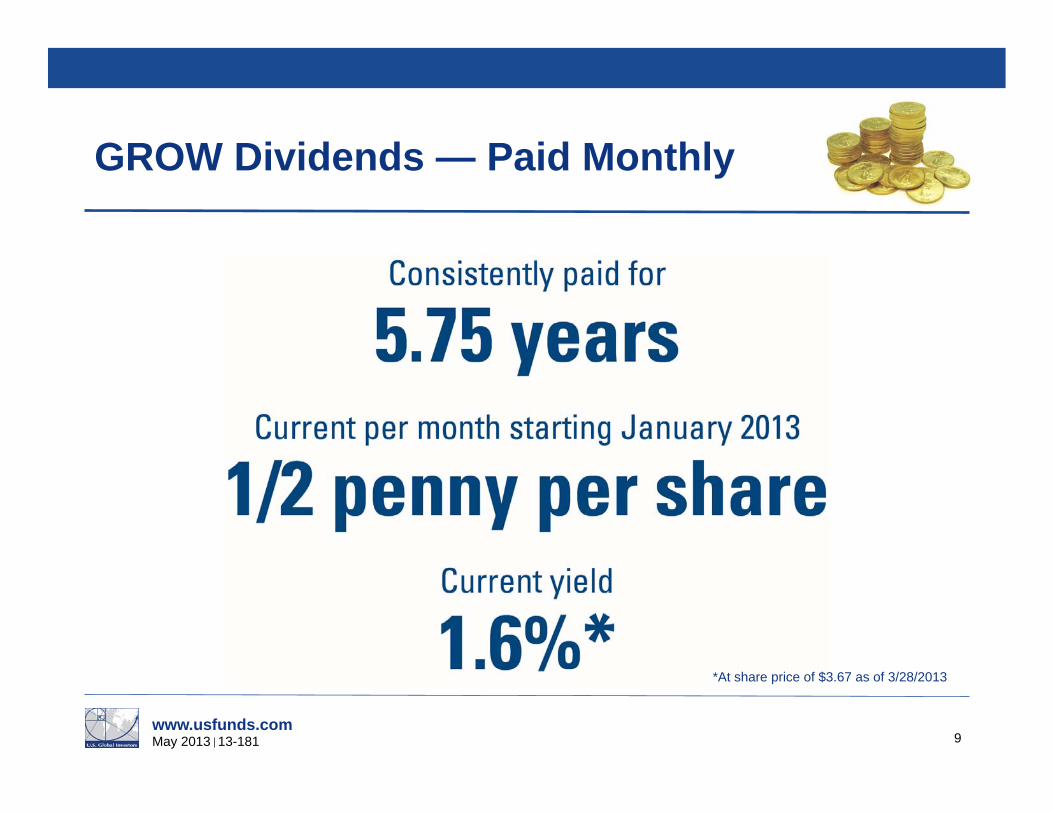
GROW Dividends — Paid Monthly
9
*At share price of $3.67 as of 3/28/2013
www.usfunds.com May 2013 13-181
Buy Back Plan in Motion
The board approved a repurchase of up to $2.75 million of its outstanding common stock on the open market through calendar year 2013
As of March 31, 2013, the company had repurchased 22,203 class A shares using cash of $84,983
Algorithm is used to buy back shares on down days, in accordance with all applicable rules and regulations that restrict amounts and times of repurchases
May be suspended or discontinued at any time
10
www.usfunds.com May 2013 13-181
Strategic Partnership with Galileo
11
GROW has completed its investment in Galileo Global Equity Advisors by purchasing 50% of issued and outstanding shares*
Toronto-based company, 320 million Canadian dollars in AUM + growing Accretive to GROW 5-Star fund 2013 Lipper fund award for best small/mid cap over 5 years
*Effective 3/31/13 The Galileo Funds are not offered for sale in the United States.

www.usfunds.com May 2013 13-181
Quarterly Average Assets Under Management
12
www.usfunds.com May 2013 13-181
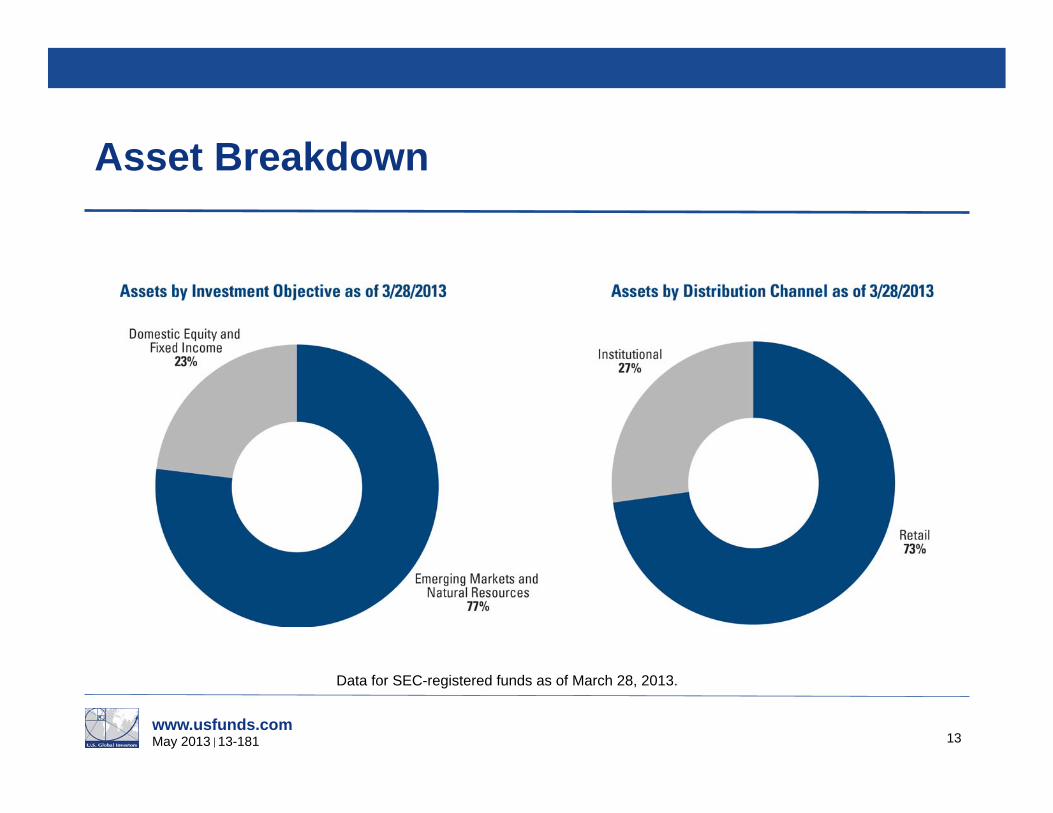
Asset Breakdown
13
Data for SEC-registered funds as of March 28, 2013.
www.usfunds.com May 2013 13-181
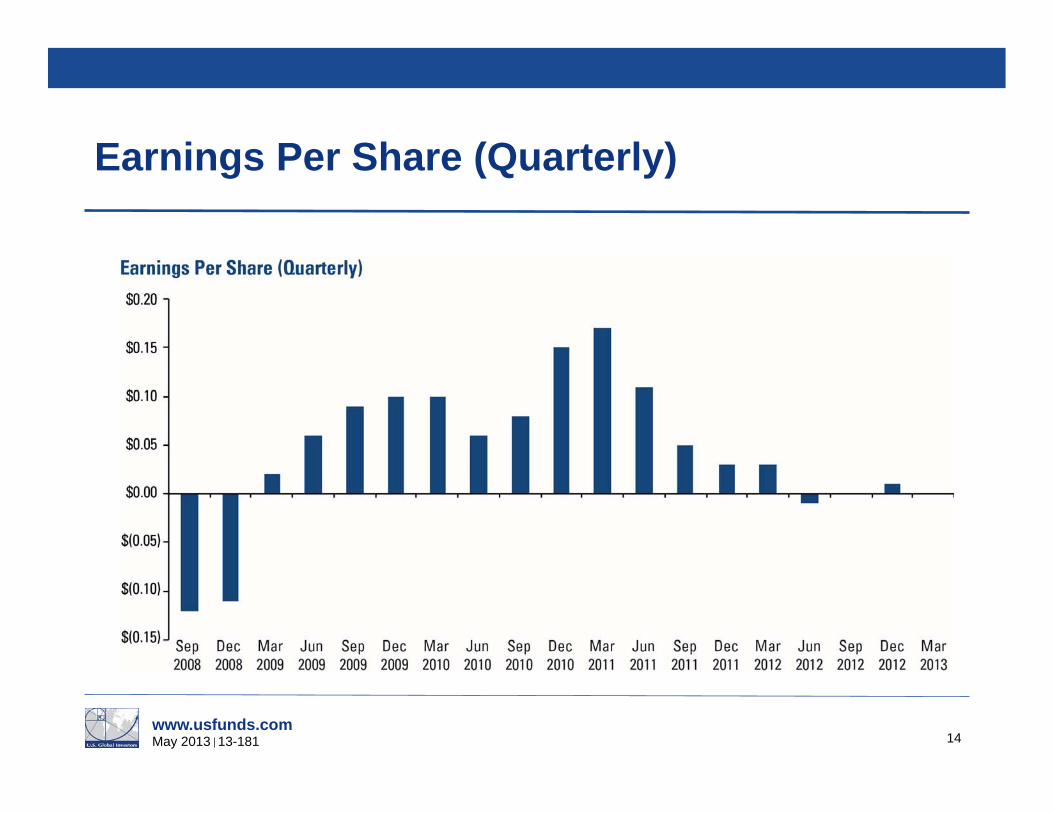
Earnings Per Share (Quarterly)
14

www.usfunds.com May 2013 13-181
Pre-Tax Profit Margin (Quarterly)
15

www.usfunds.com May 2013 13-181
Balance Sheet Strength – No Debt
16

www.usfunds.com May 2013 13-181 17
Growth 3 Year Average
EPS Growth
Value 3 Year Average
Return on Equity
Income Dividend
Yield
GROW -100.0% 8.8% 2.1%
Peers* 4.8% 21.3% 2.5%
GROW Peer Comparison
Dividend yields calculated as of 5/6/2013. Earnings per share and return on equity based on the quarter ended 3/31/2013. * Median calculations based from quarterly results ended 3/31/2013 by Affiliated Managers Group Inc.,Blackrock Inc., Cohen & Steers Inc., Federated Investors Inc., Franklin Resources Inc., INVESCO Ltd., Janus Capital Group Inc., Legg Mason Inc., Pzena Investment Management Inc., T. Rowe Price Group Inc., Virtus Investment Partners Inc., Waddell & Reed Financial Inc. and Westwood Holdings Group Inc.
Source: FactSet
www.usfunds.com May 2013 13-181
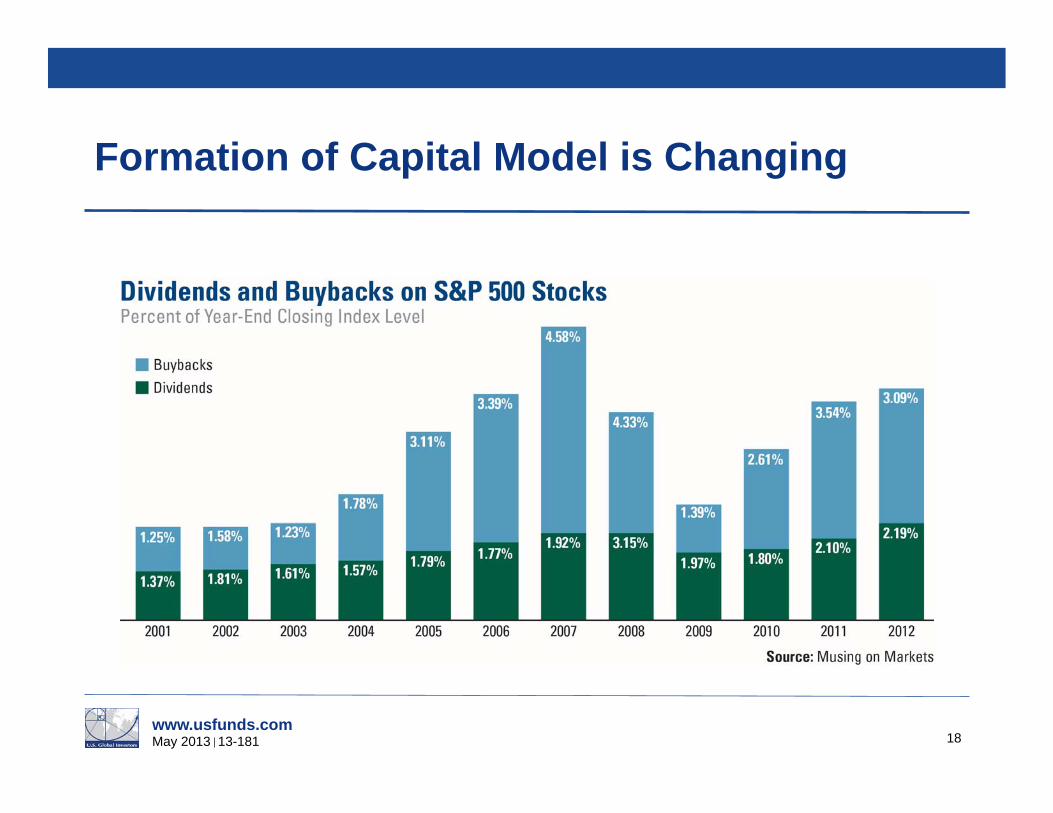
Formation of Capital Model is Changing
18

www.usfunds.com May 2013 13-181
Formation of Capital Model is Changing
19
www.usfunds.com May 2013 13-181
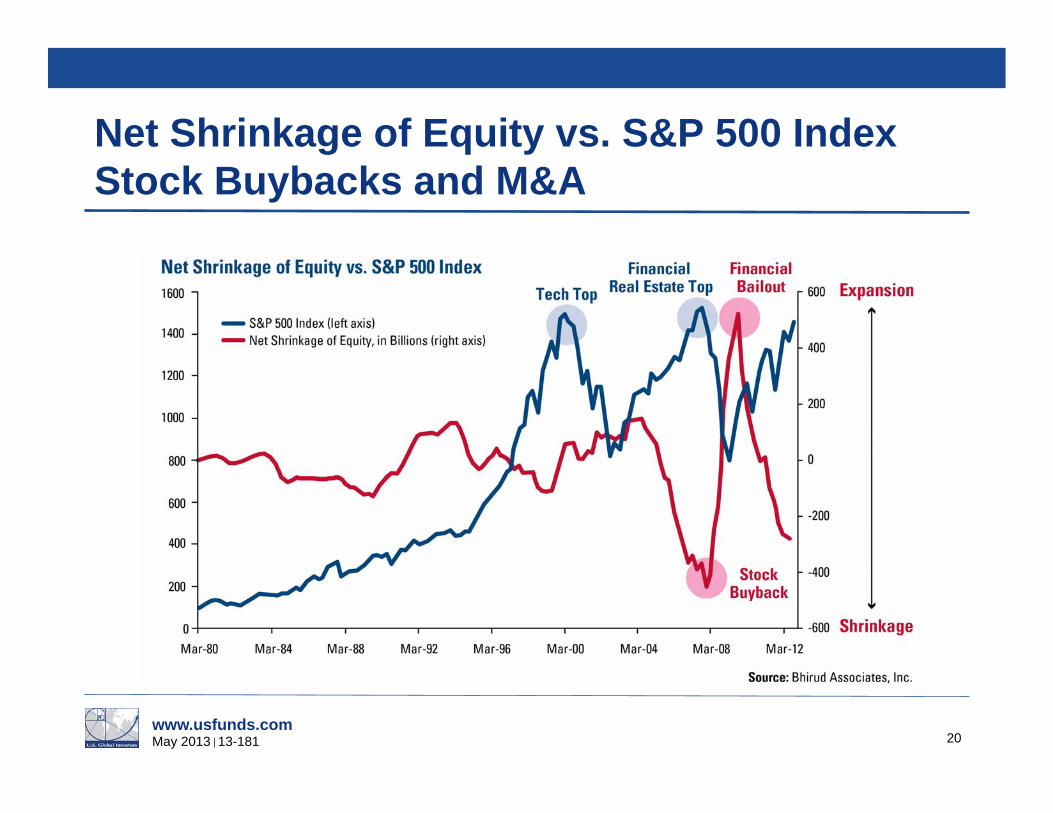
Net Shrinkage of Equity vs. S&P 500 Index Stock Buybacks and M&A
20

www.usfunds.com May 2013 13-181
Formation of Capital Model is Changing Fund Flows and Growth in Assets 2008-2012
21
Source: Investment Company Institute
www.usfunds.com May 2013 13-181
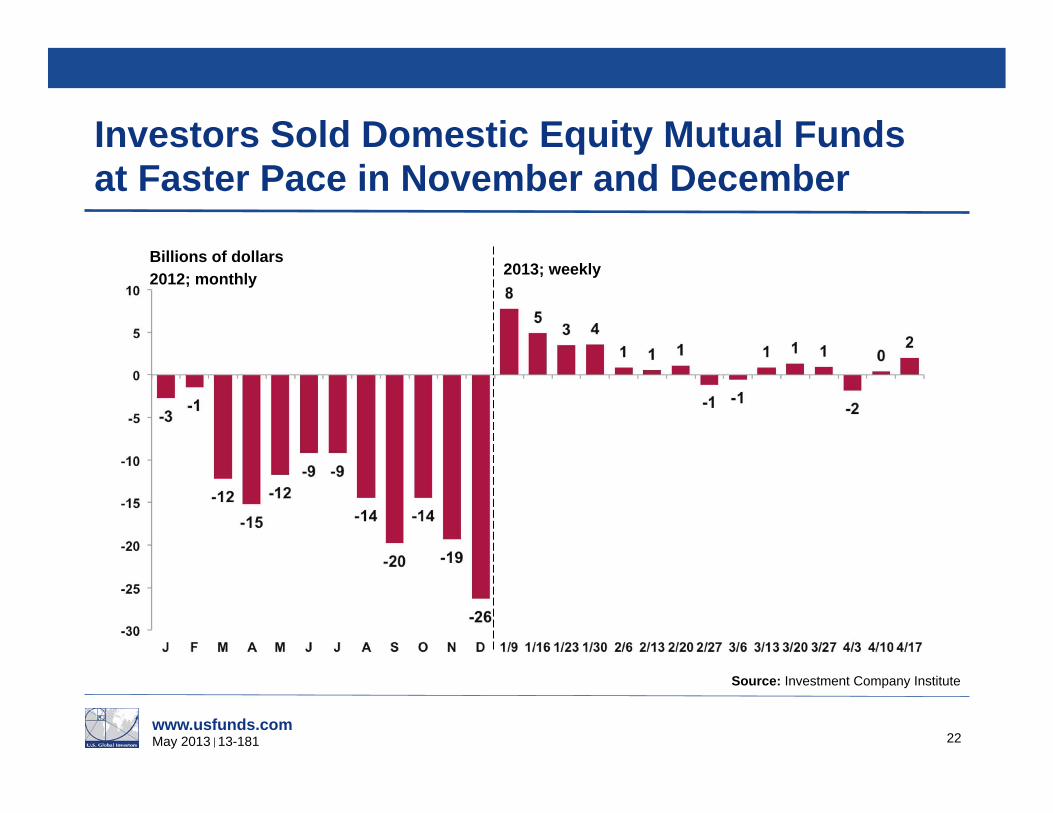
Billions of dollars 2012; monthly 2013; weekly
Source: Investment Company Institute
Investors Sold Domestic Equity Mutual Funds at Faster Pace in November and December
22
www.usfunds.com May 2013 13-181
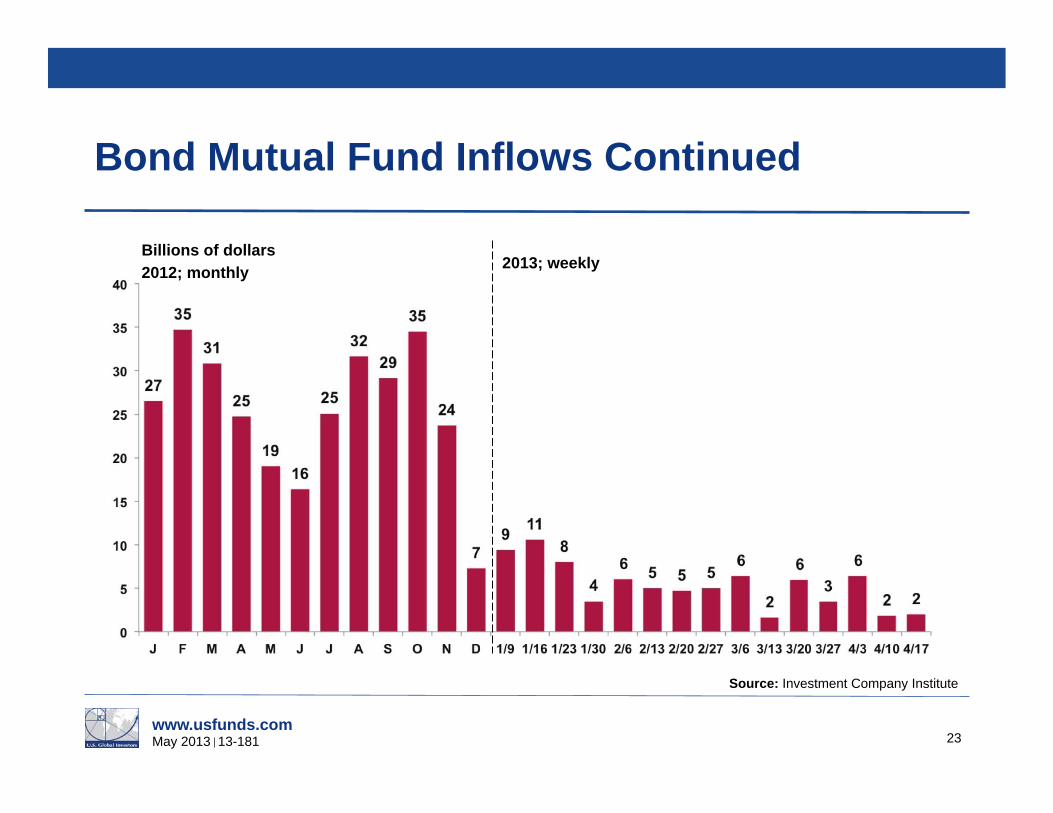
Billions of dollars 2012; monthly 2013; weekly
Source: Investment Company Institute
Bond Mutual Fund Inflows Continued
23
www.usfunds.com May 2013 13-181
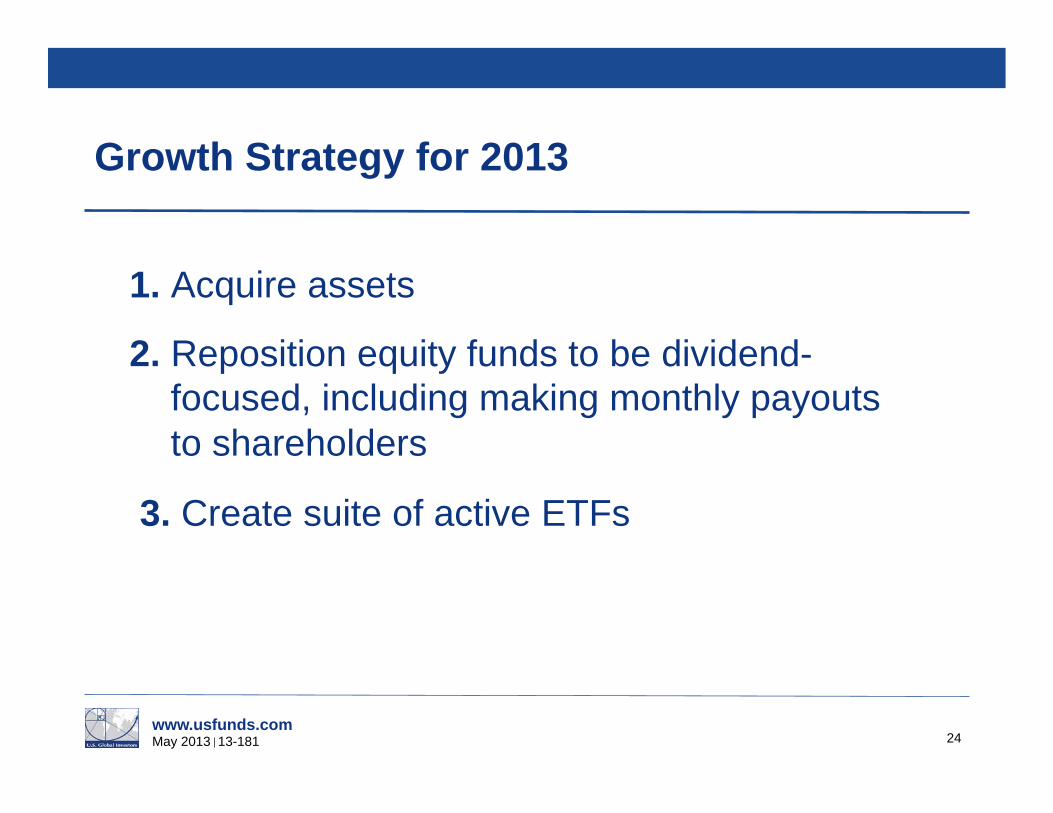
Growth Strategy for 2013
1. Acquire assets
2. Reposition equity funds to be dividend-focused, including making monthly payouts to shareholders
3. Create suite of active ETFs
24
www.usfunds.com May 2013 13-181
Income Statement – Financial Analysis
25
Catherine Rademacher CFO
www.usfunds.com May 2013 13-181 26
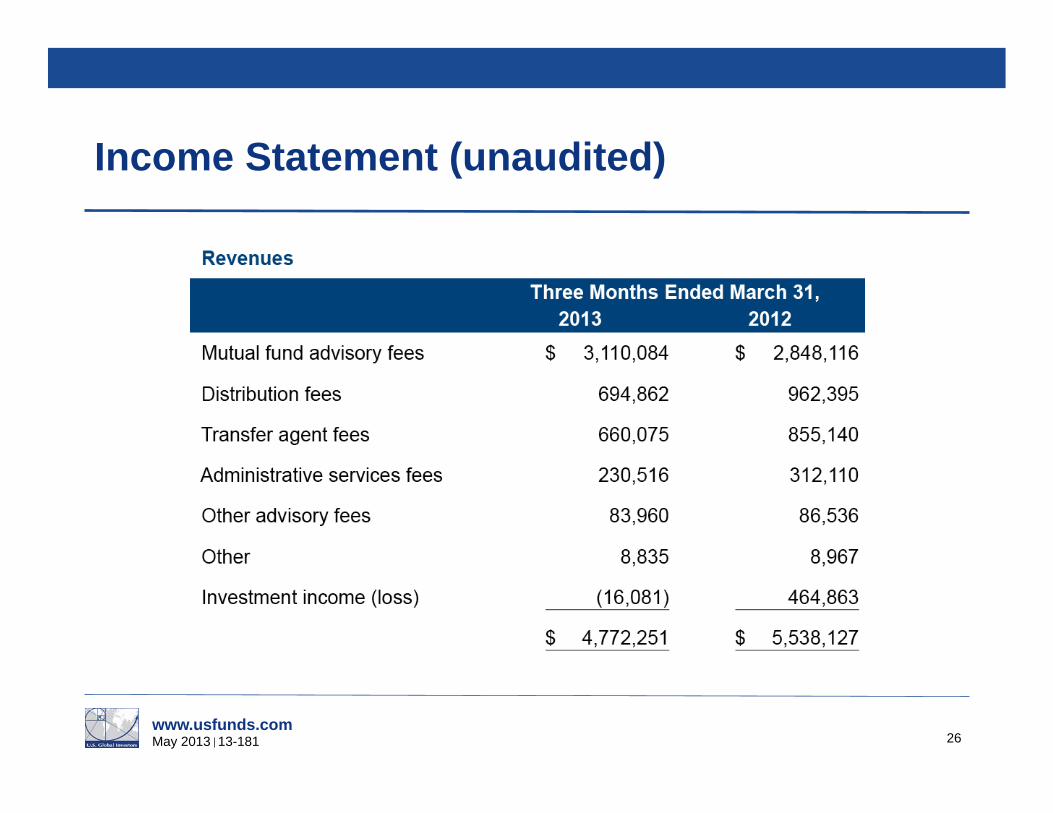
Income Statement (unaudited)
www.usfunds.com May 2013 13-181 27
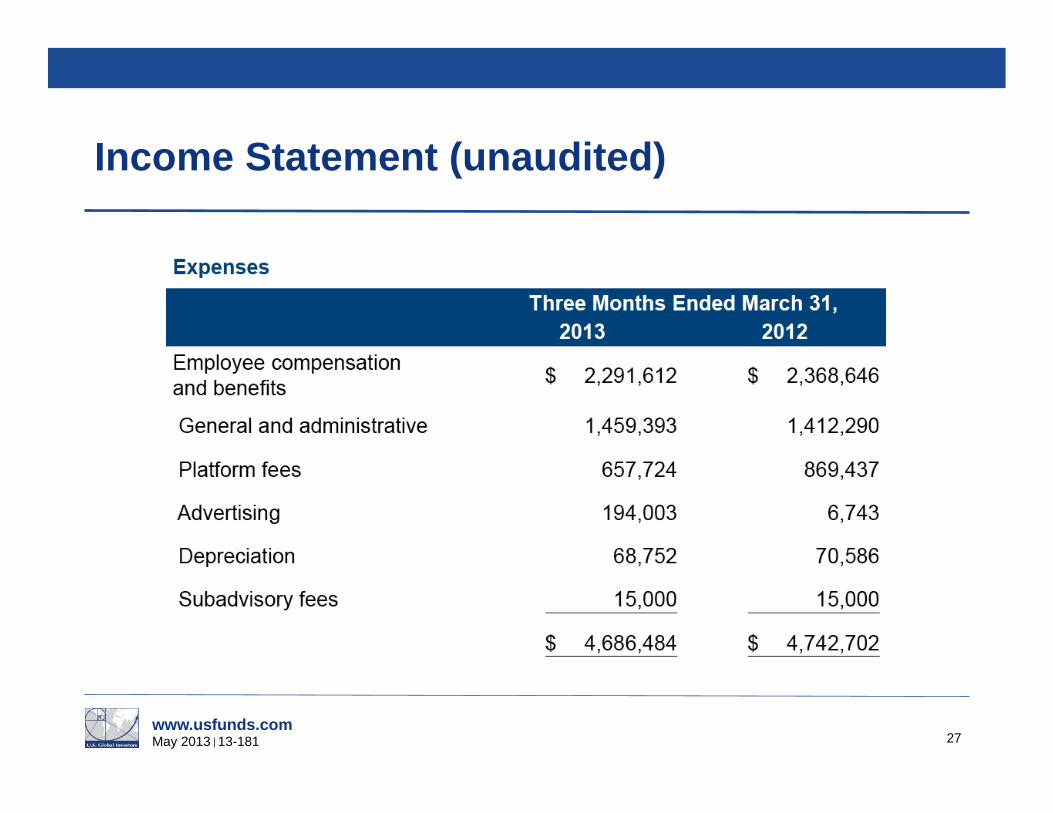
Income Statement (unaudited)

www.usfunds.com May 2013 13-181
Income Statement (unaudited)
28
www.usfunds.com May 2013 13-181 29
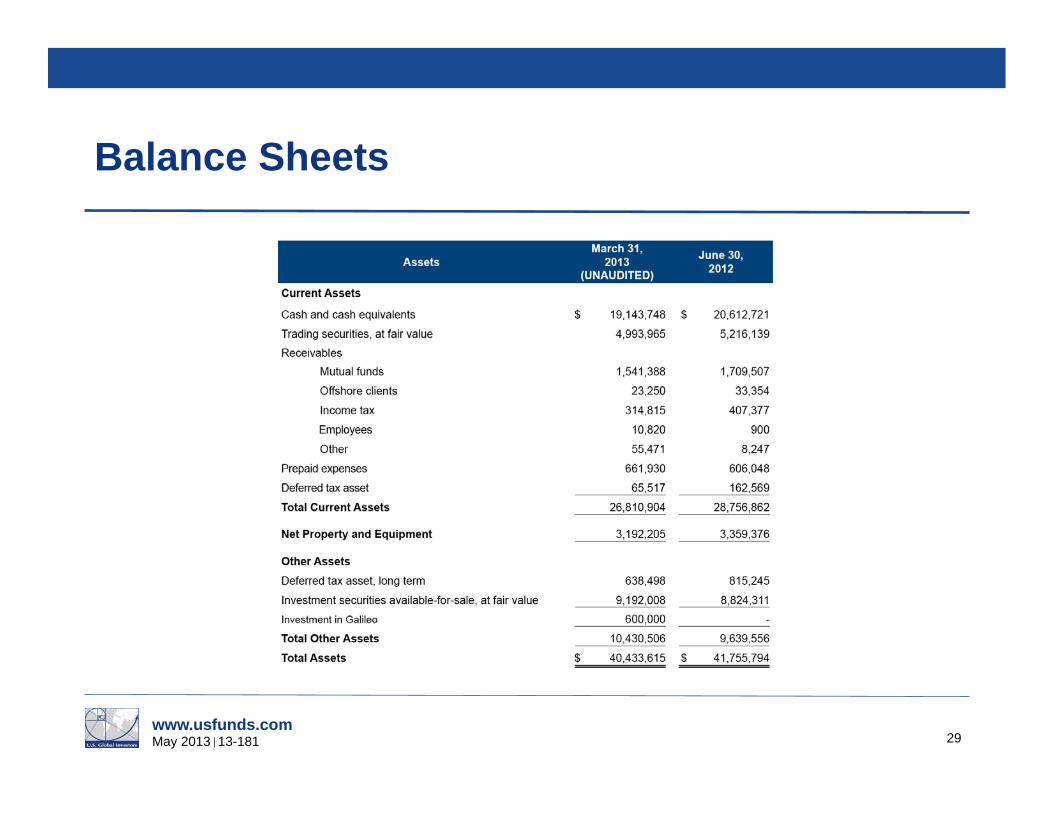
Balance Sheets
www.usfunds.com May 2013 13-181 30
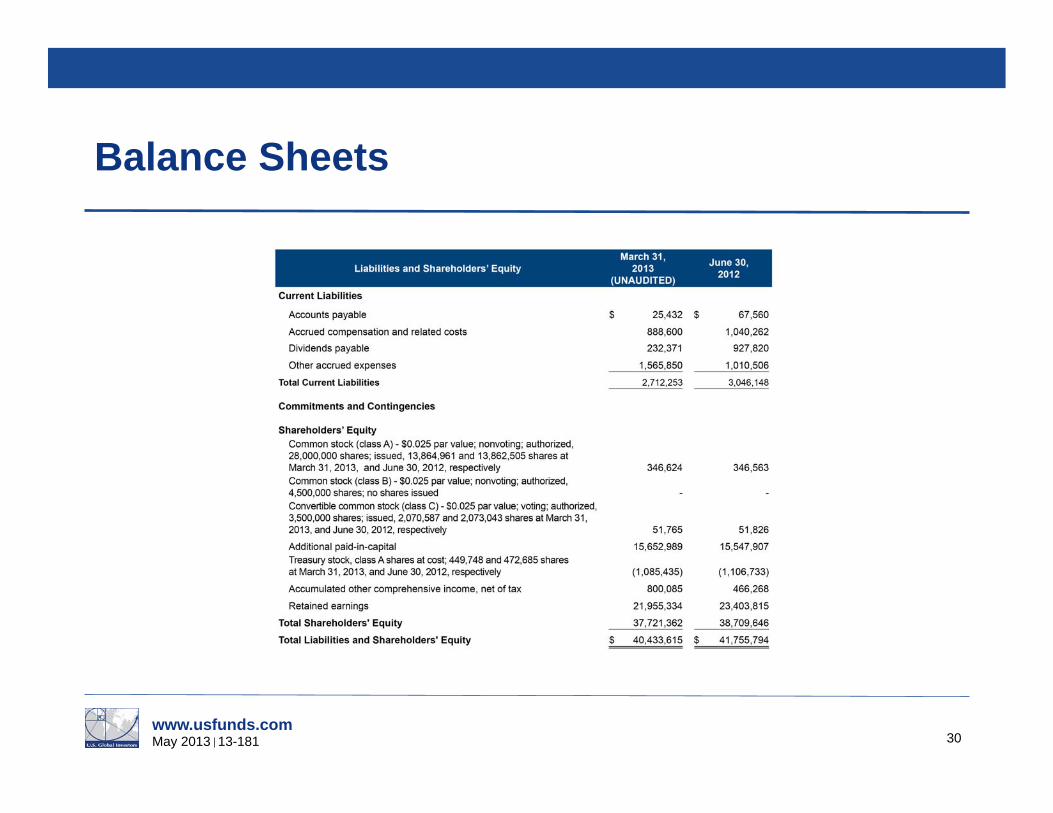
Balance Sheets

www.usfunds.com May 2013 13-181
Significant Events
31
Susan McGee President and General Counsel
www.usfunds.com May 2013 13-181 32
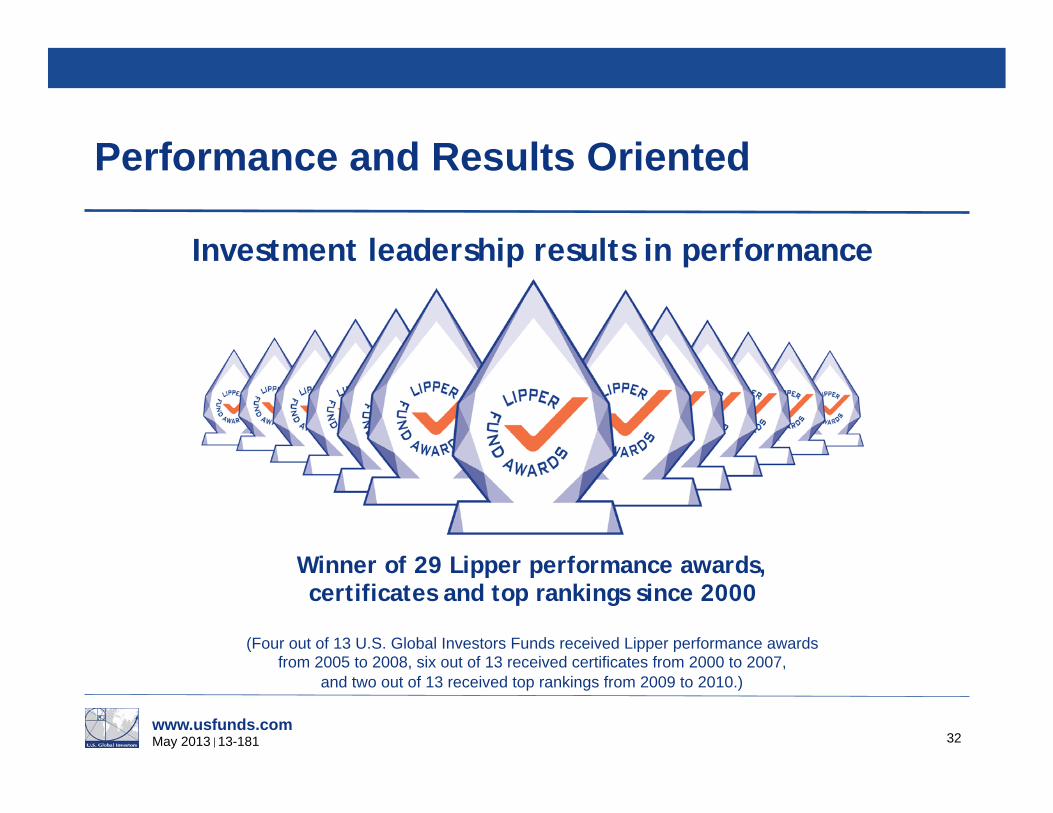
Performance and Results Oriented
Winner of 29 Lipper performance awards, certificates and top rankings since 2000
(Four out of 13 U.S. Global Investors Funds received Lipper performance awards from 2005 to 2008, six out of 13 received certificates from 2000 to 2007,
and two out of 13 received top rankings from 2009 to 2010.)
Investment leadership results in performance

www.usfunds.com May 2013 13-181
Fund Recognition: 4 Funds in the Top 10 Percent for 10-Year Period
33
www.usfunds.com May 2013 13-181 34

www.usfunds.com May 2013 13-181
Focus on Education
35
43 MFEA STAR Awards for Excellence in Education
www.usfunds.com May 2013 13-181
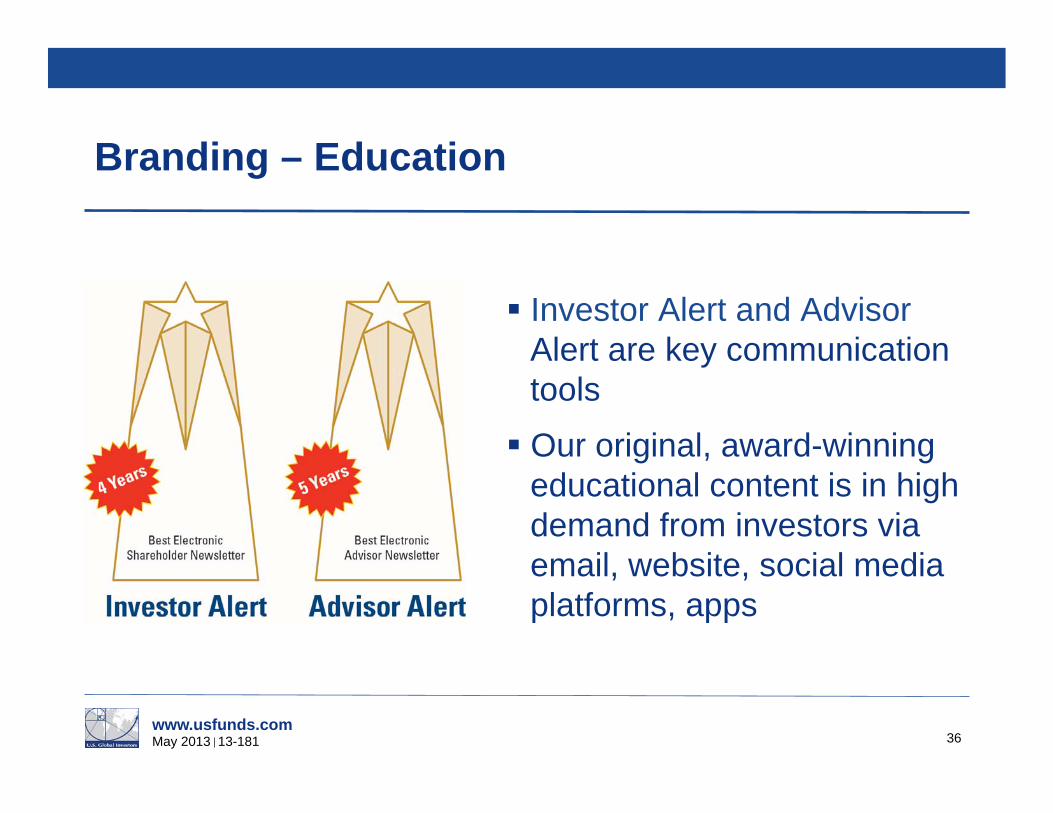
Branding – Education
36
Investor Alert and Advisor Alert are key communication tools
Our original, award-winning educational content is in high demand from investors via email, website, social media platforms, apps
www.usfunds.com May 2013 13-181 37
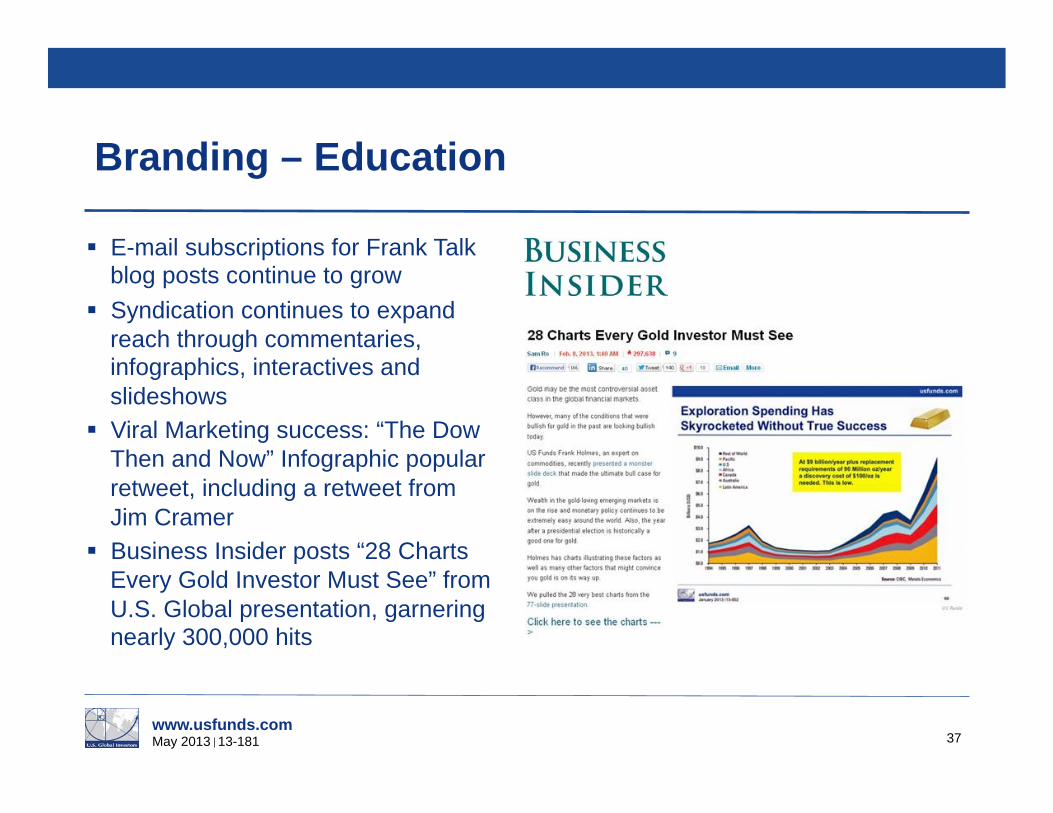
Branding – Education
E-mail subscriptions for Frank Talk blog posts continue to grow Syndication continues to expand reach through commentaries, infographics, interactives and slideshows Viral Marketing success: “The Dow Then and Now” Infographic popular retweet, including a retweet from Jim Cramer Business Insider posts “28 Charts Every Gold Investor Must See” from U.S. Global presentation, garnering nearly 300,000 hits
www.usfunds.com May 2013 13-181
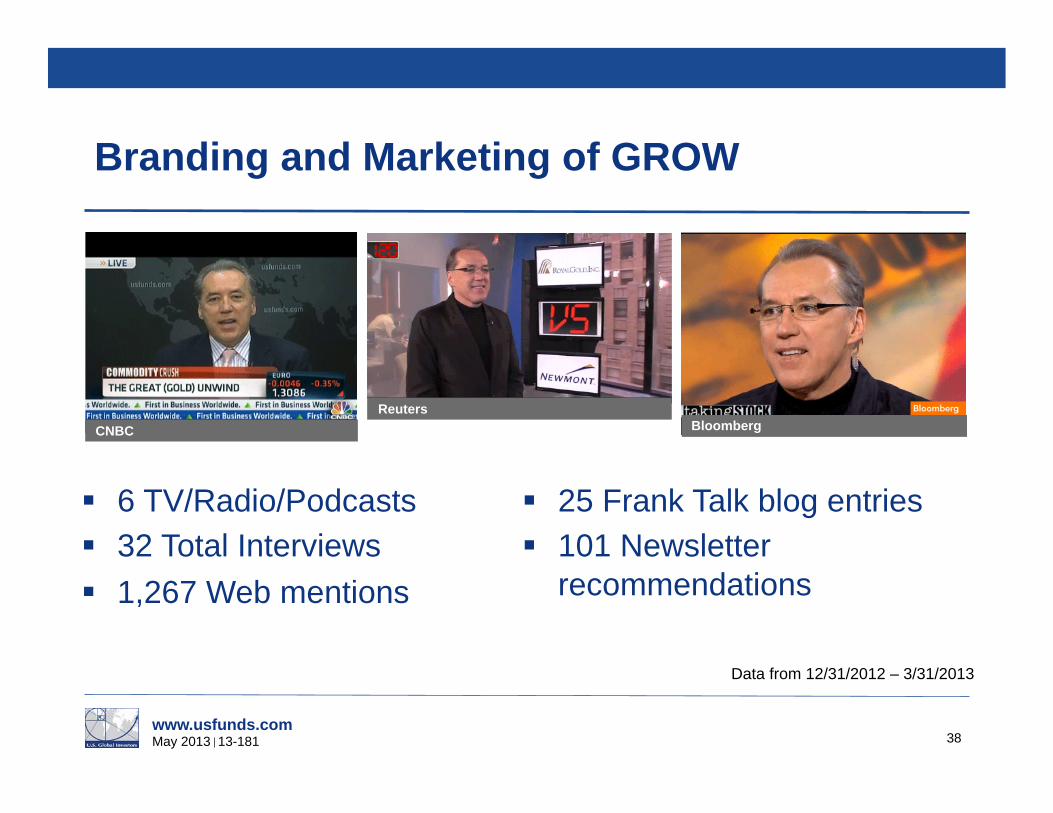
Branding and Marketing of GROW
38
6 TV/Radio/Podcasts 32 Total Interviews 1,267 Web mentions
25 Frank Talk blog entries 101 Newsletter
recommendations
Data from 12/31/2012 – 3/31/2013
CNBC Reuters
Bloomberg
www.usfunds.com May 2013 13-181
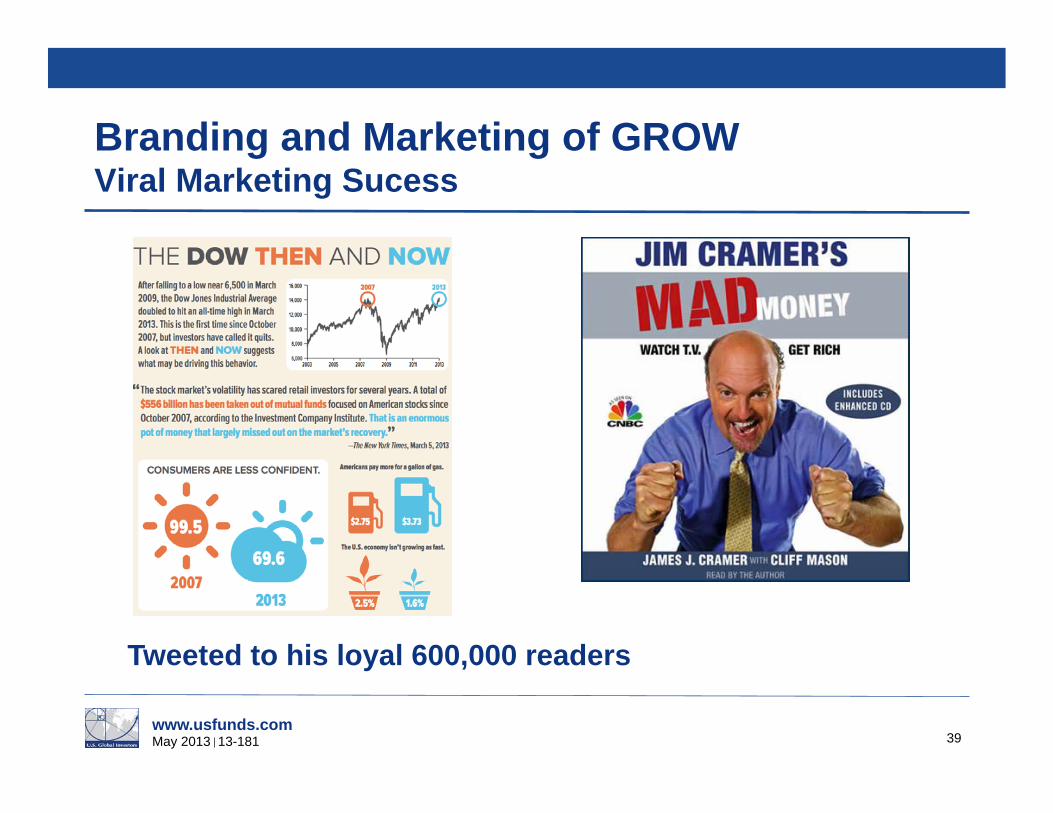
Branding and Marketing of GROW Viral Marketing Sucess
39
Tweeted to his loyal 600,000 readers
www.usfunds.com May 2013 13-181 40
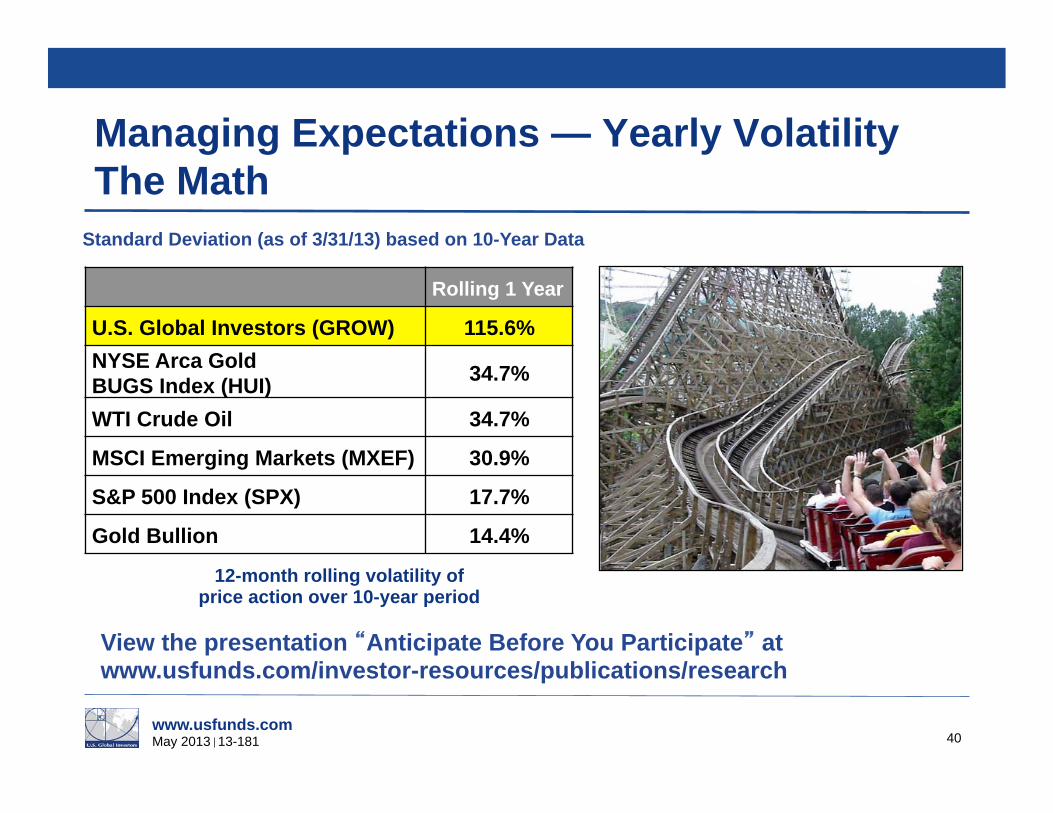
Managing Expectations — Yearly Volatility The Math
View the presentation Anticipate Before You Participate at www.usfunds.com/investor-resources/publications/research
Rolling 1 Year
U.S. Global Investors (GROW) 115.6% NYSE Arca Gold BUGS Index (HUI) 34.7%
WTI Crude Oil 34.7%
MSCI Emerging Markets (MXEF) 30.9%
S&P 500 Index (SPX) 17.7%
Gold Bullion 14.4%
12-month rolling volatility of price action over 10-year period
Standard Deviation (as of 3/31/13) based on 10-Year Data
www.usfunds.com May 2013 13-181 41
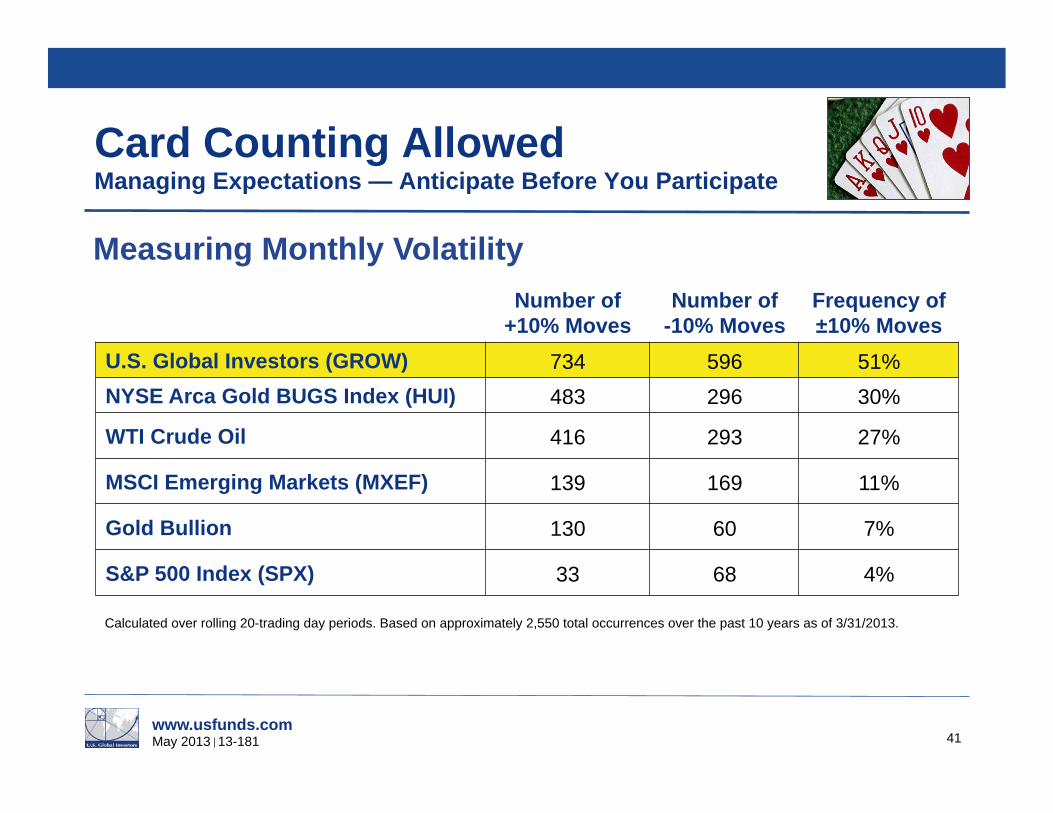
Card Counting Allowed Managing Expectations — Anticipate Before You Participate
Measuring Monthly Volatility Number of
+10% Moves Number of
-10% Moves Frequency of ±10% Moves
U.S. Global Investors (GROW) 734 596 51% NYSE Arca Gold BUGS Index (HUI) 483 296 30%
WTI Crude Oil 416 293 27%
MSCI Emerging Markets (MXEF) 139 169 11%
Gold Bullion 130 60 7%
S&P 500 Index (SPX) 33 68 4%
Calculated over rolling 20-trading day periods. Based on approximately 2,550 total occurrences over the past 10 years as of 3/31/2013.
www.usfunds.com May 2013 13-181
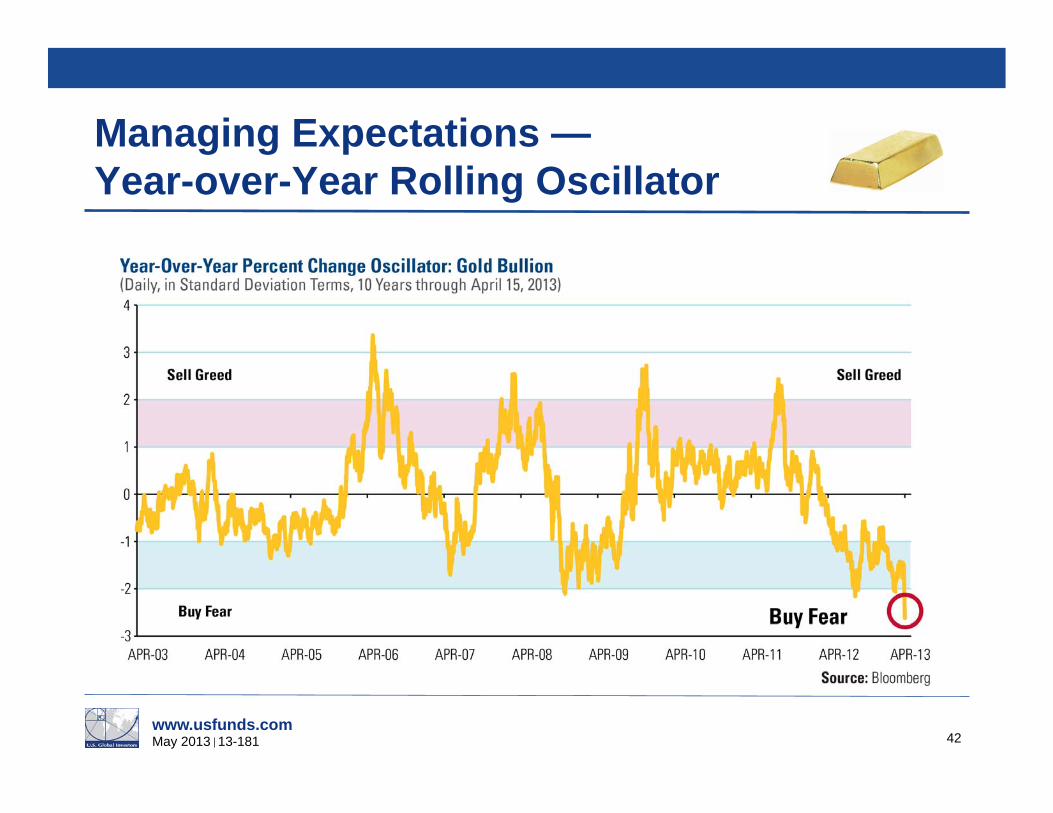
Managing Expectations — Year-over-Year Rolling Oscillator
42
www.usfunds.com May 2013 13-181
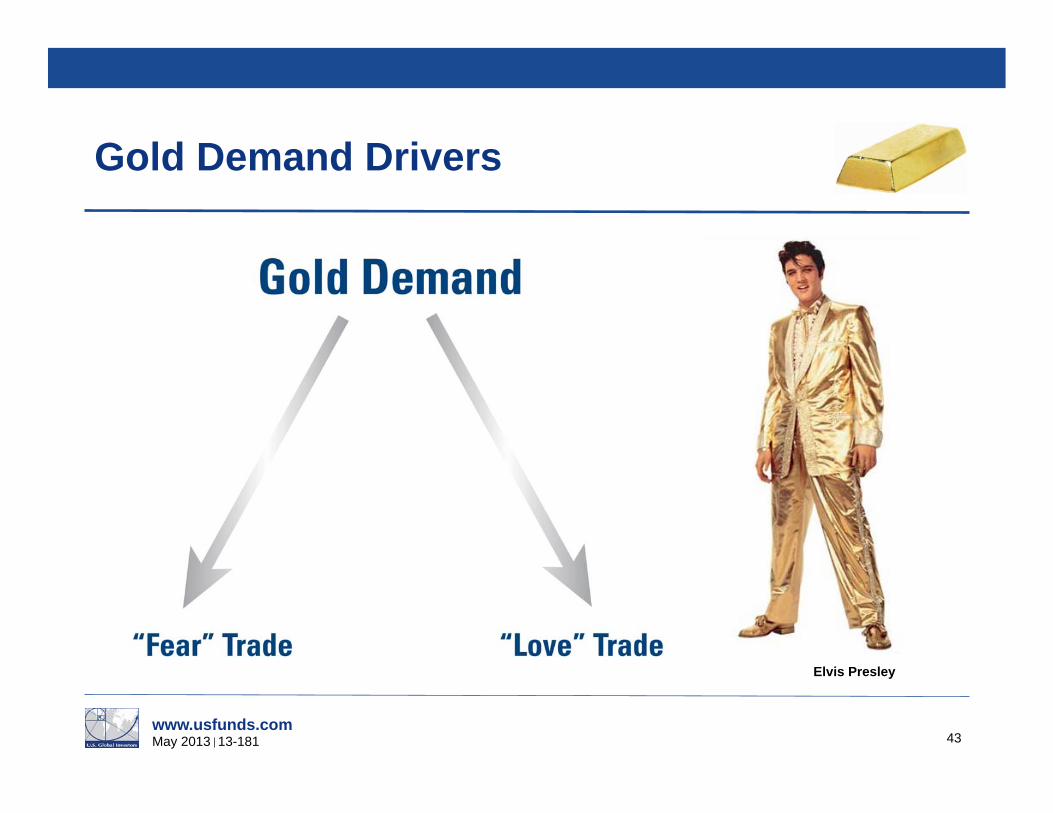
Gold Demand Drivers
43
Elvis Presley
www.usfunds.com May 2013 13-181
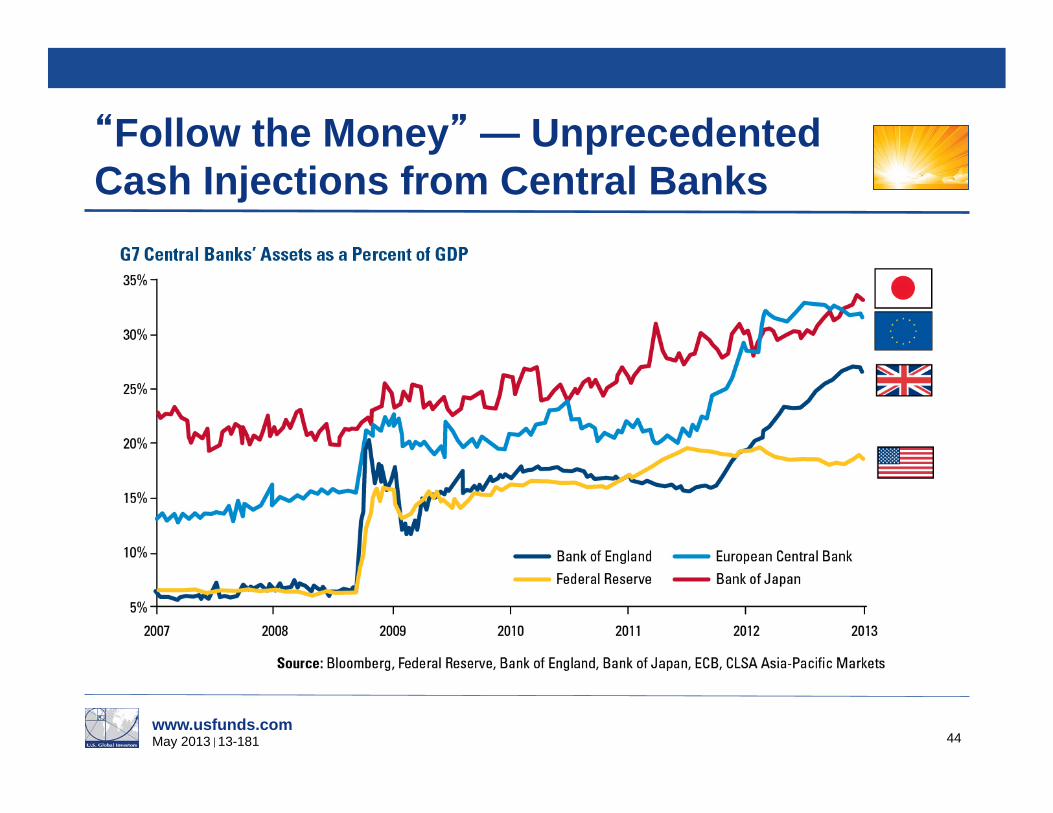
Follow the Money — Unprecedented Cash Injections from Central Banks
44

www.usfunds.com May 2013 13-181
Great Roll Over or Rip Off Creates Opportunity
45
www.usfunds.com May 2013 13-181
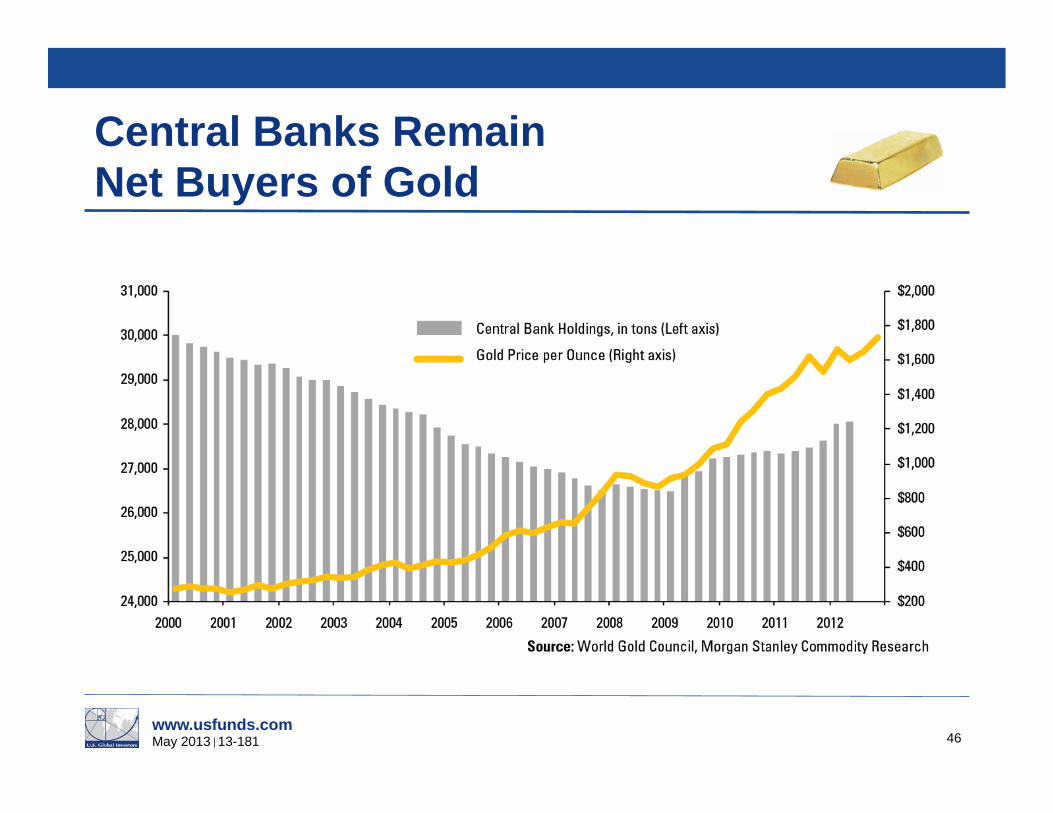
Central Banks Remain Net Buyers of Gold
46
www.usfunds.com May 2013 13-181
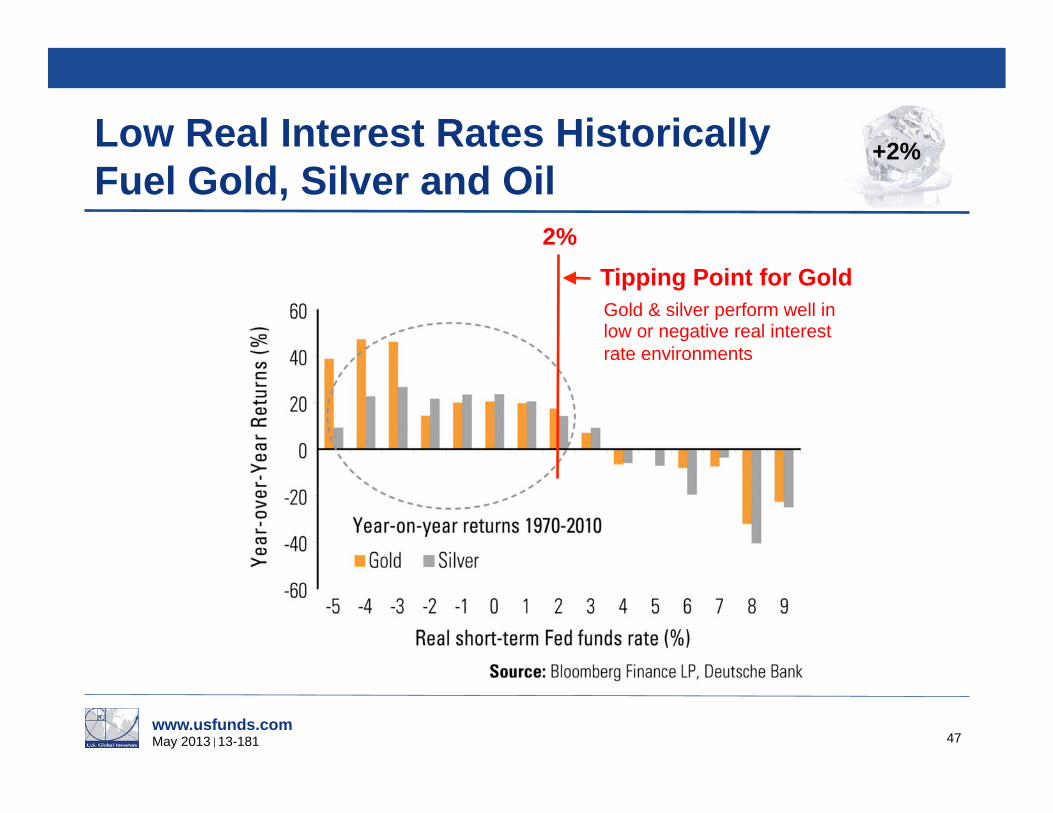
Low Real Interest Rates Historically Fuel Gold, Silver and Oil
47
Tipping Point for Gold 2%
Gold & silver perform well in low or negative real interest rate environments
+2%
www.usfunds.com May 2013 13-181
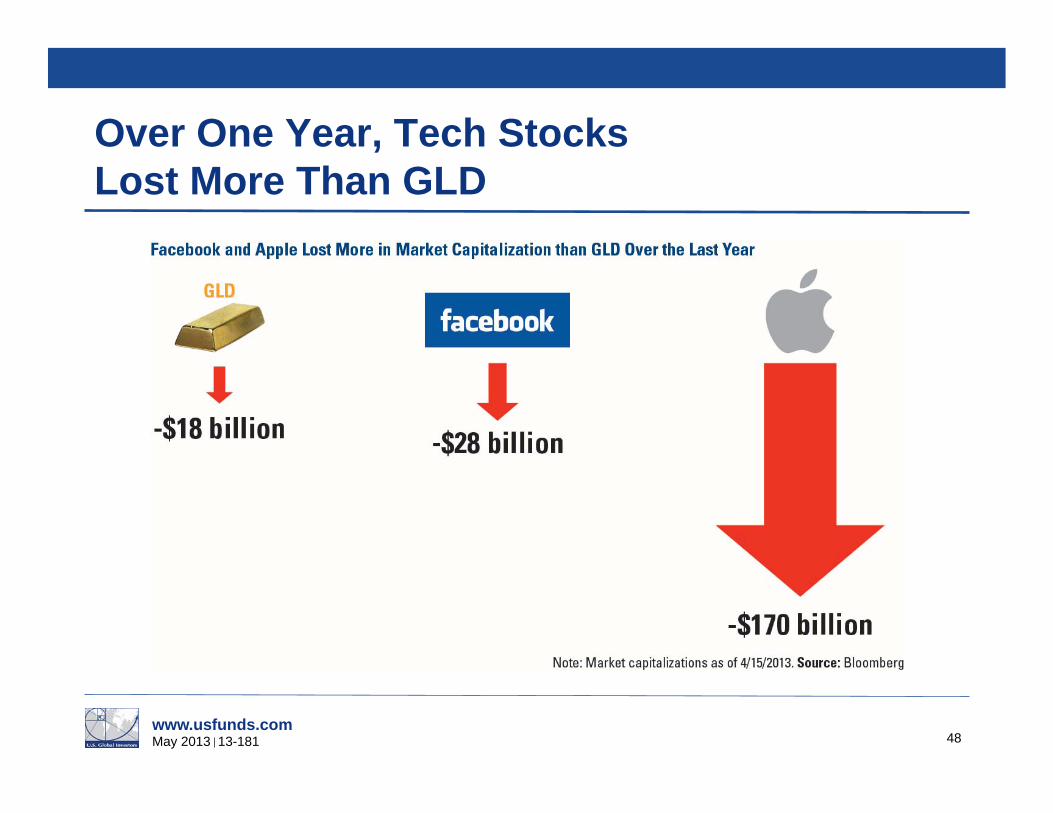
Over One Year, Tech Stocks Lost More Than GLD
48
www.usfunds.com May 2013 13-181
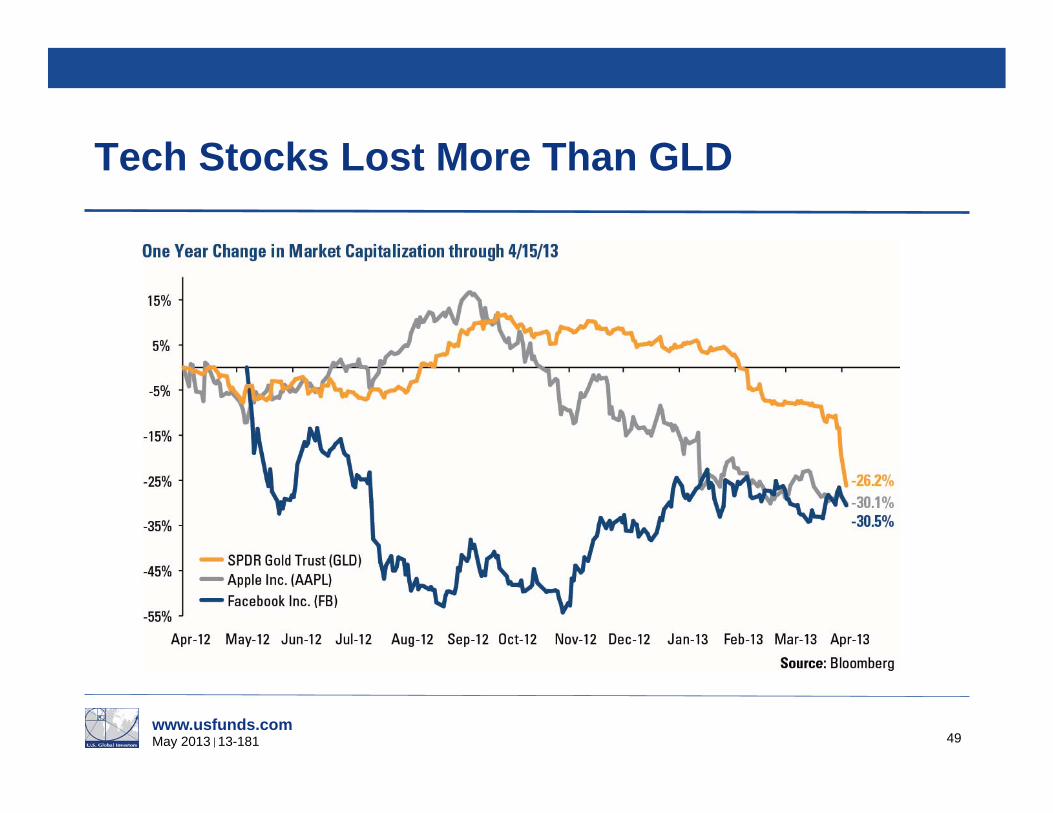
Tech Stocks Lost More Than GLD
49
www.usfunds.com May 2013 13-181
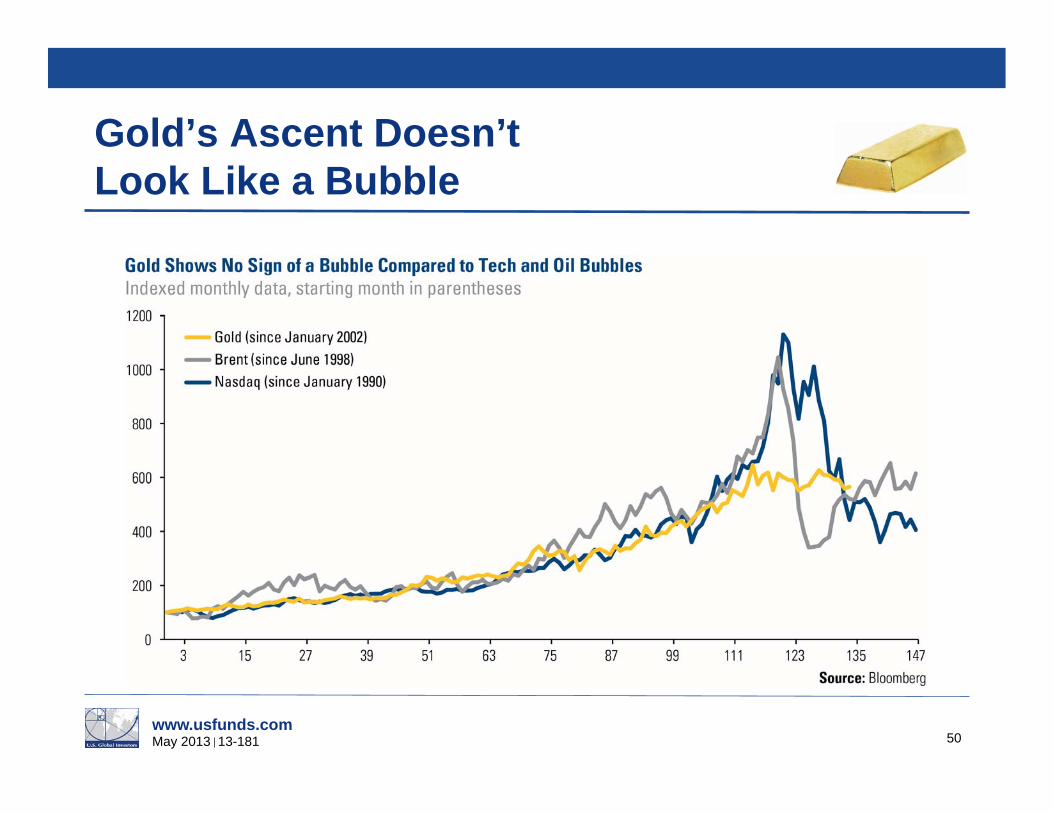
Gold’s Ascent Doesn’t Look Like a Bubble
50
www.usfunds.com May 2013 13-181
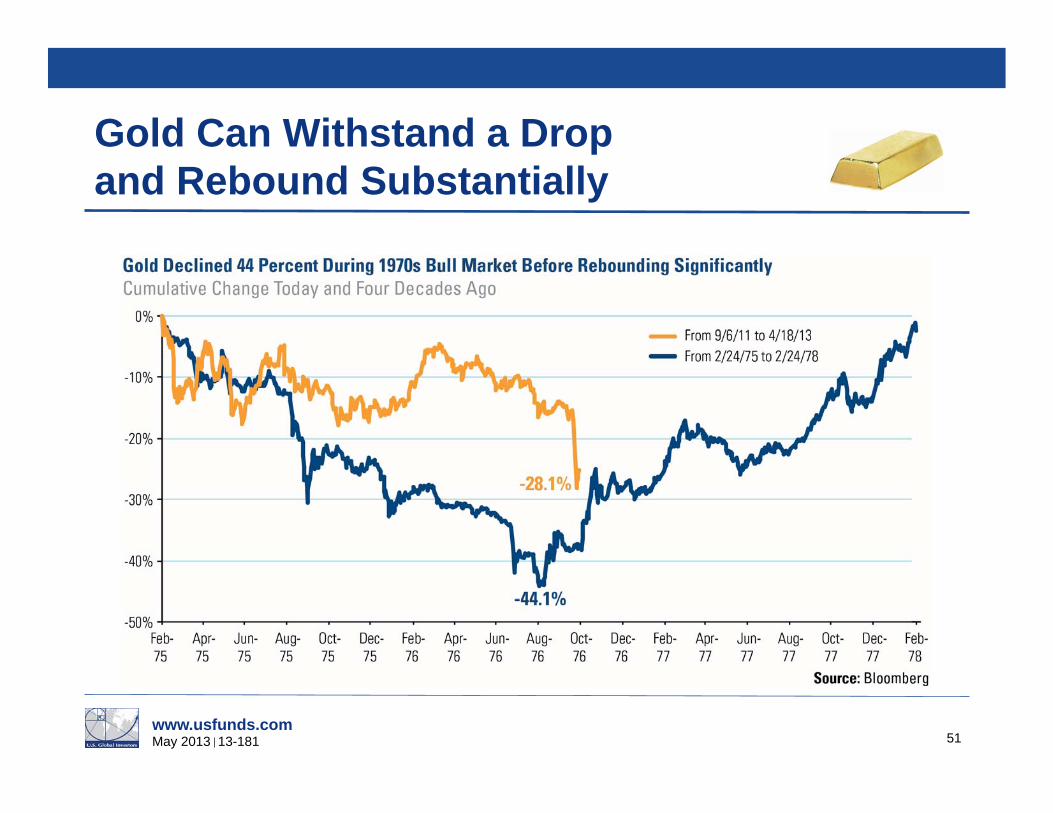
Gold Can Withstand a Drop and Rebound Substantially
51

www.usfunds.com May 2013 13-181
Gold Would Need to Be Much Higher to Cover U.S. Money Supply
52
www.usfunds.com May 2013 13-181
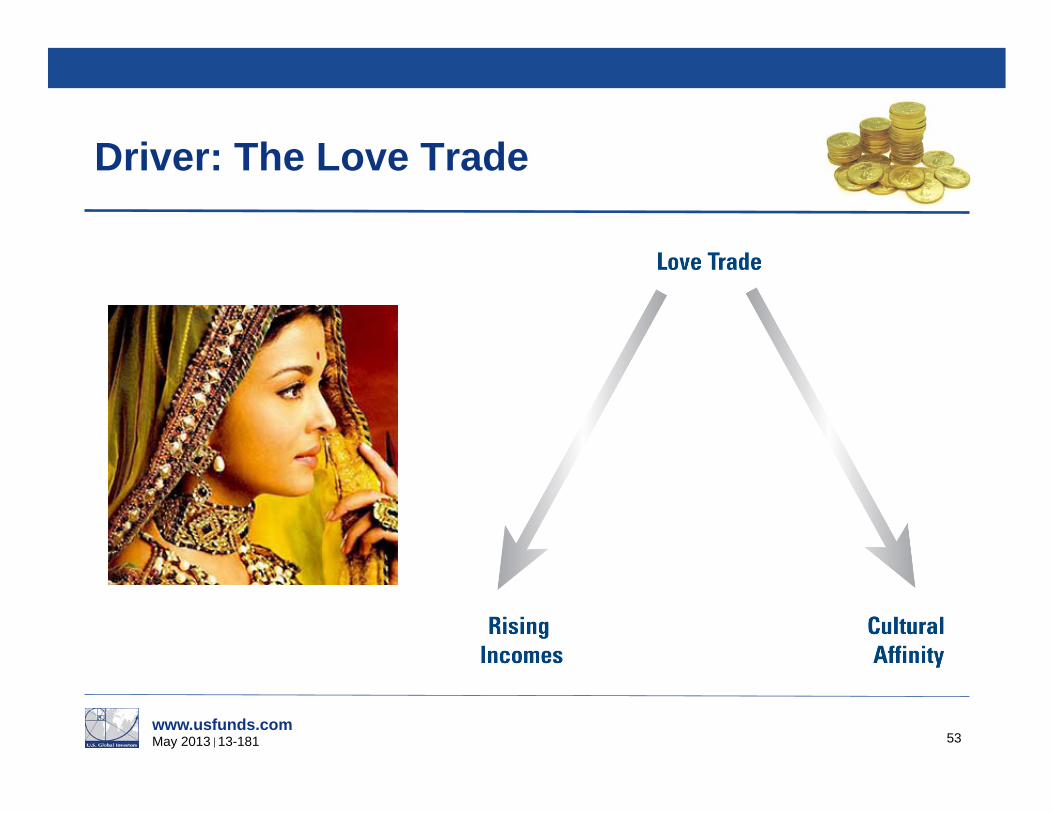
Driver: The Love Trade
53

www.usfunds.com May 2013 13-181
Holidays Drive Gold Demand
54
www.usfunds.com May 2013 13-181
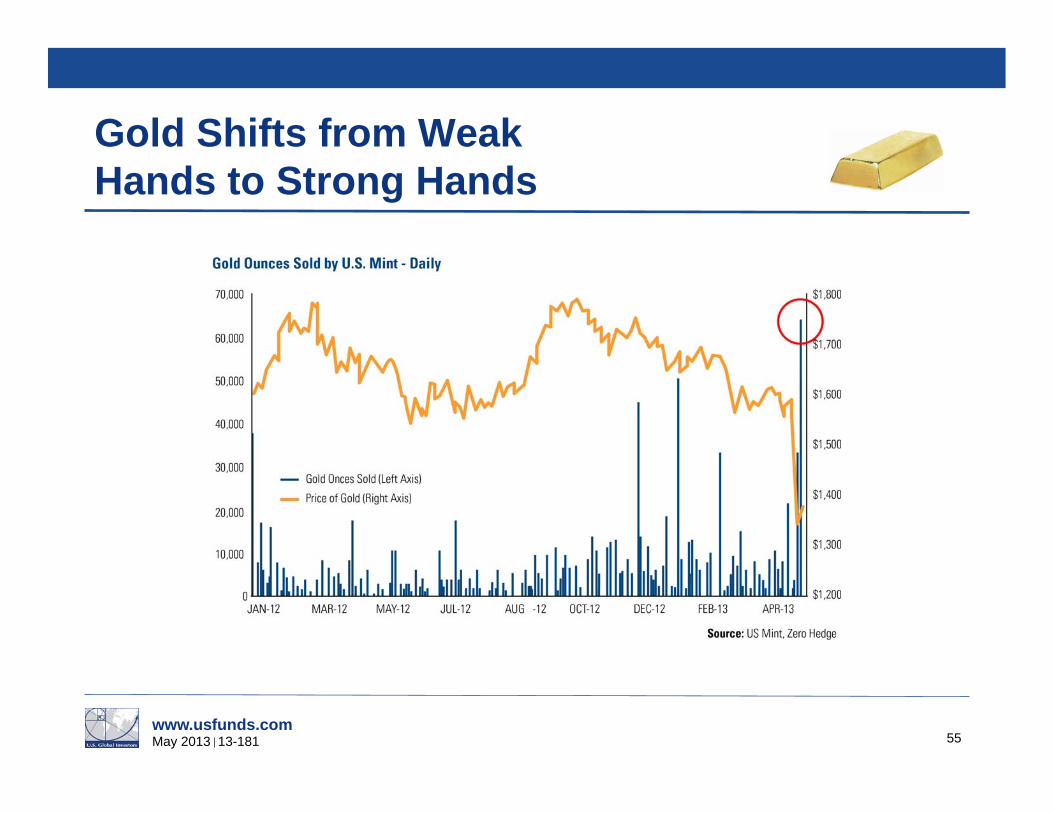
Gold Shifts from Weak Hands to Strong Hands
55
www.usfunds.com May 2013 13-181
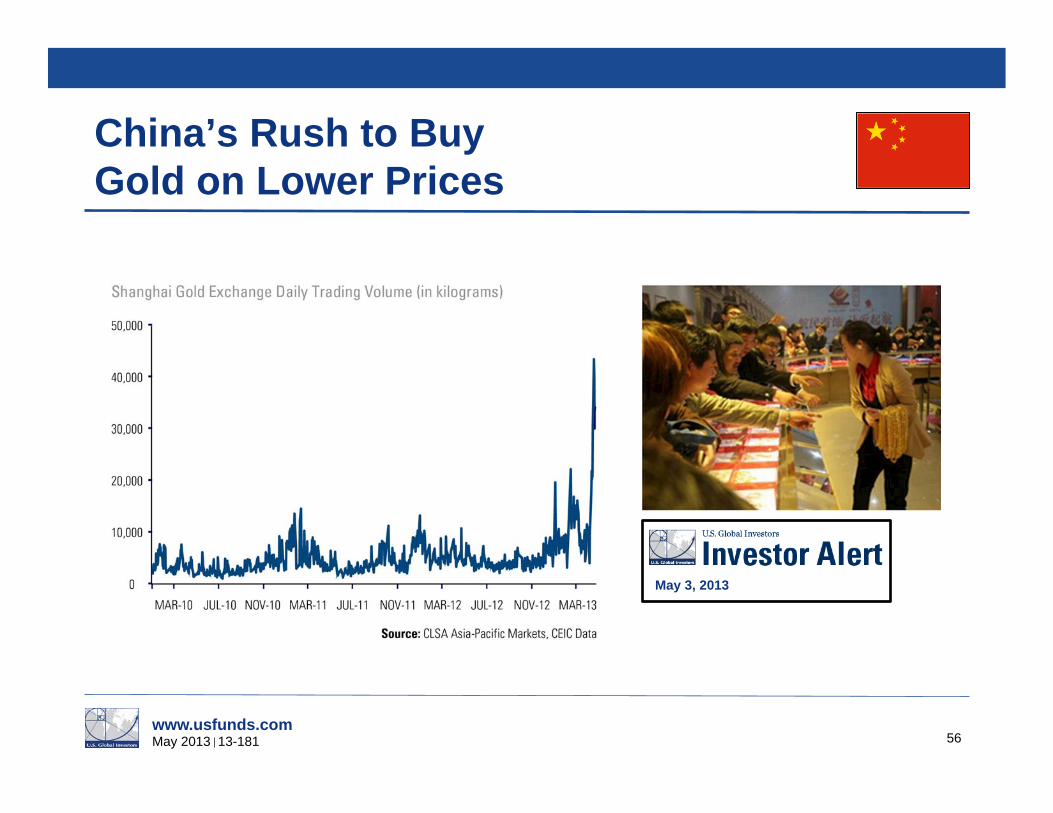
China’s Rush to Buy Gold on Lower Prices
56
May 3, 2013
www.usfunds.com May 2013 13-181
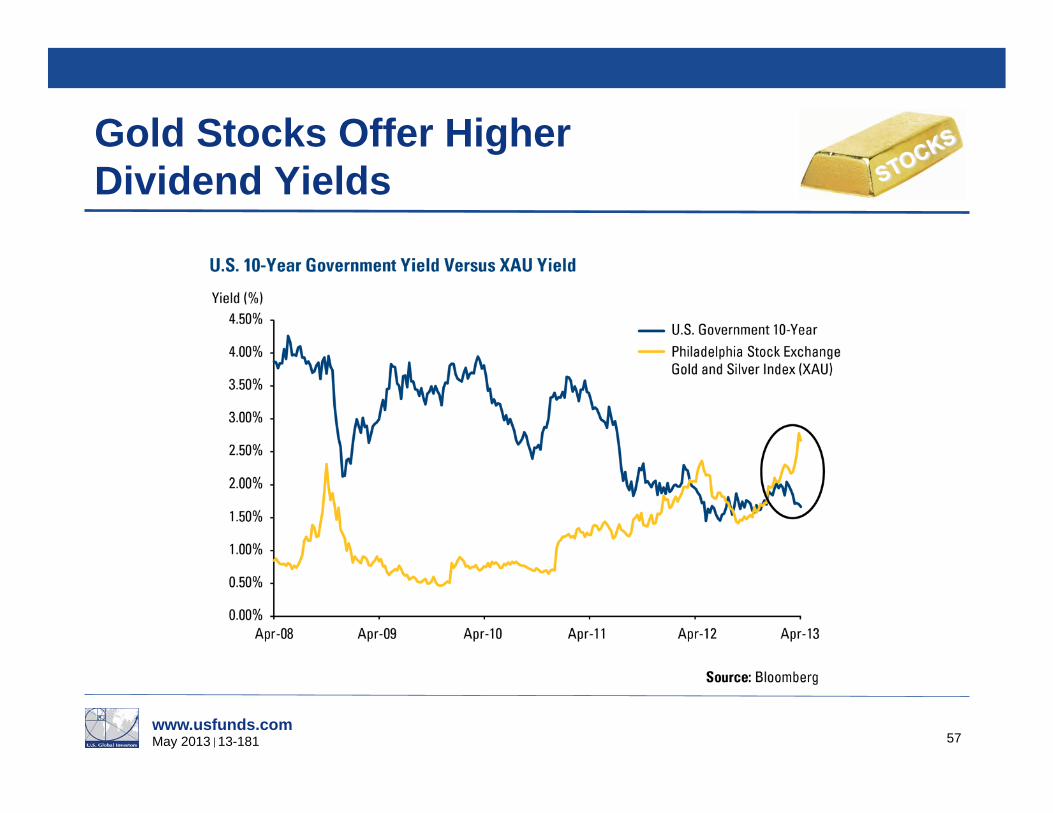
Gold Stocks Offer Higher Dividend Yields
57
www.usfunds.com May 2013 13-181
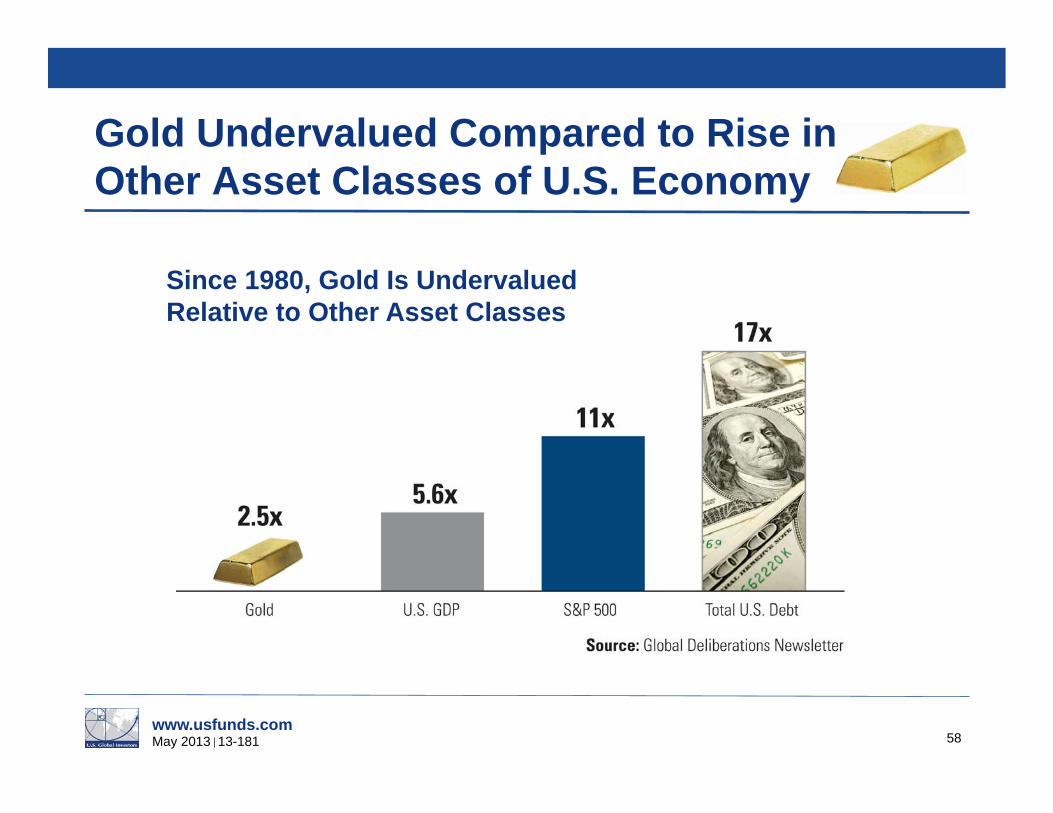
Gold Undervalued Compared to Rise in Other Asset Classes of U.S. Economy
58
Since 1980, Gold Is Undervalued Relative to Other Asset Classes
www.usfunds.com May 2013 13-181
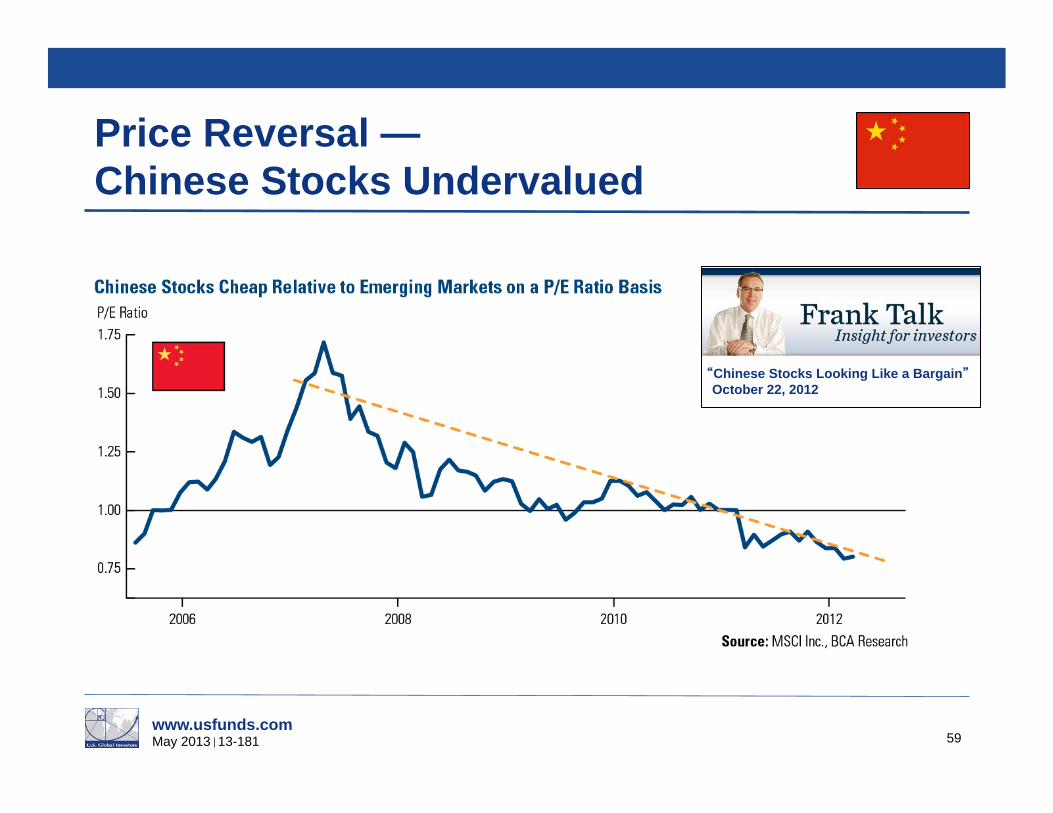
Price Reversal — Chinese Stocks Undervalued
59
Chinese Stocks Looking Like a Bargain October 22, 2012

www.usfunds.com May 2013 13-181
The New Camelot
60
Xi Jinping and Peng Liyuan
www.usfunds.com May 2013 13-181
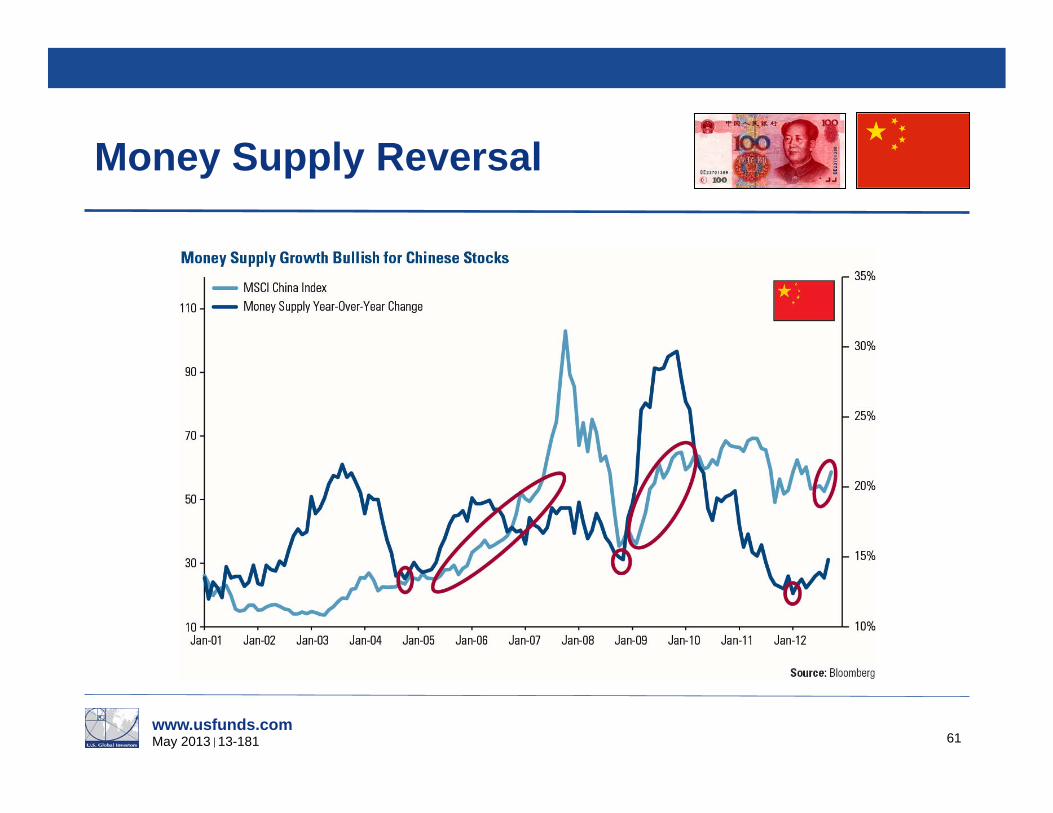
Money Supply Reversal
61

www.usfunds.com May 2013 13-181
China’s Changing Urban Consumption
62
How they spend it in China February 13, 2013
www.usfunds.com May 2013 13-181
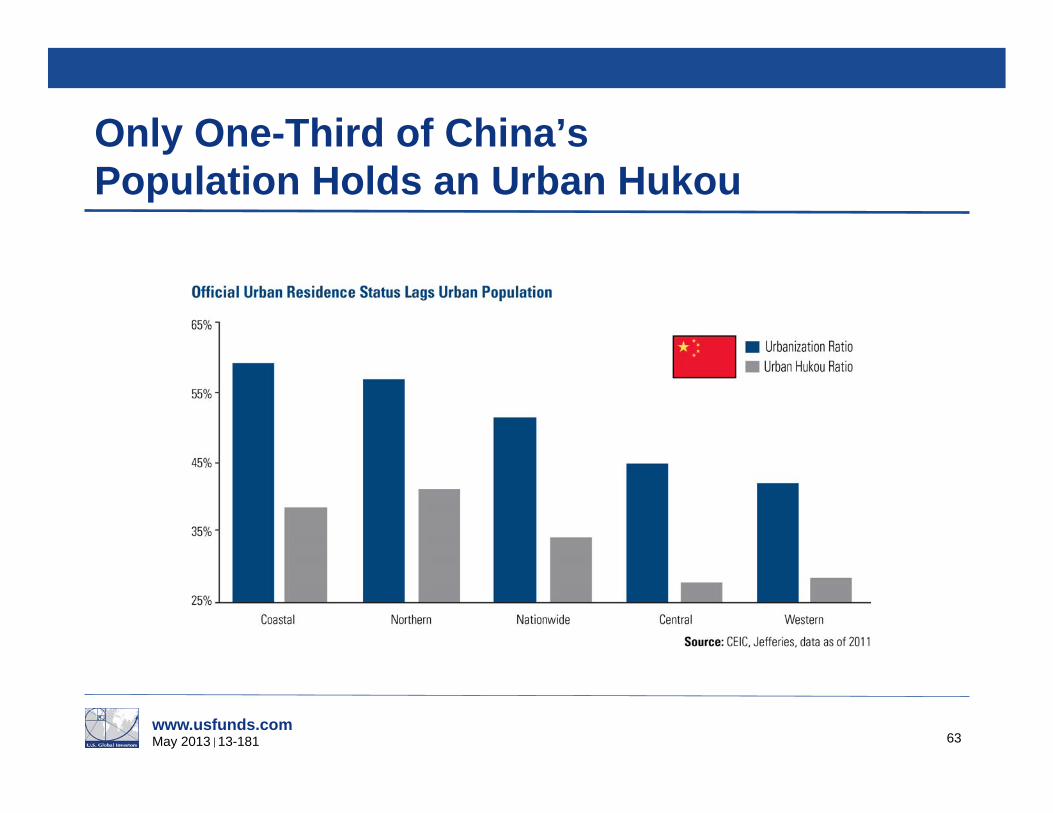
Only One-Third of China’s Population Holds an Urban Hukou
63

www.usfunds.com May 2013 13-181
Time to Own the Most Underowned Areas of the Market?
64

www.usfunds.com May 2013 13-181 65
Come Visit Us at
Facebook: www.facebook.com/usfunds Linkedin: www.linkedin.com/company/u.s.-global-investors
Twitter: www.twitter.com/usfunds
Frank Talk: www.usfunds.com/franktalk
Investor Alert: www.usfunds.com/alert
www.usfunds.com May 2013 13-181
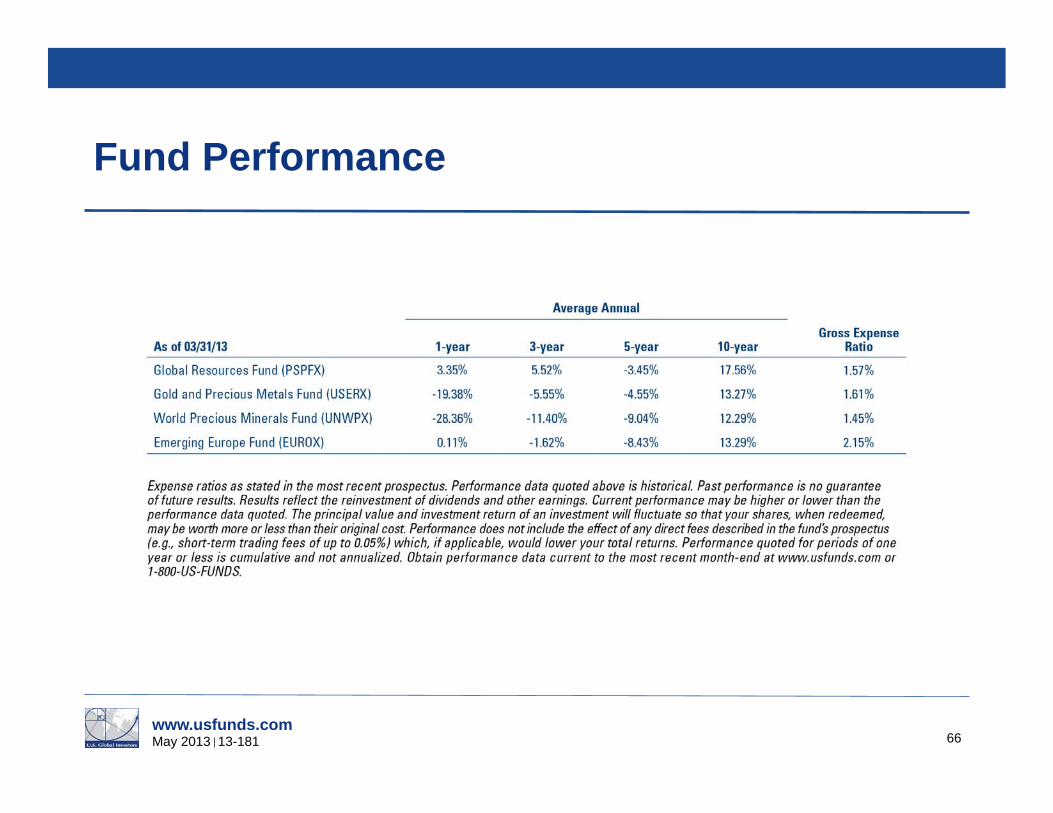
Fund Performance
66
www.usfunds.com May 2013 13-181
Disclosures
67
Please consider carefully a fund’s investment objectives, risks, charges and expenses. For this and other important information, obtain a fund prospectus by visiting www.usfunds.com or by calling 1-800-US-FUNDS (1-800-873-8637). Read it carefully before investing. Distributed by U.S. Global Brokerage, Inc. All opinions expressed and data provided are subject to change without notice. Some of these opinions may not be appropriate to every investor. Foreign and emerging market investing involves special risks such as currency fluctuation and less public disclosure, as well as economic and political risk. Because the Global Resources Fund concentrates its investments in a specific industry, the fund may be subject to greater risks and fluctuations than a portfolio representing a broader range of industries. The Emerging Europe Fund invests more than 25% of its investments in companies principally engaged in the oil & gas or banking industries. The risk of concentrating investments in this group of industries will make the fund more susceptible to risk in these industries than funds which do not concentrate their investments in an industry and may make the fund s performance more volatile. By investing in a specific geographic region, a regional fund s returns and share price may be more volatile than those of a less concentrated portfolio. Gold, precious metals, and precious minerals funds may be susceptible to adverse economic, political or regulatory developments due to concentrating in a single theme. The prices of gold, precious metals, and precious minerals are subject to substantial price fluctuations over short periods of time and may be affected by unpredicted international monetary and political policies. We suggest investing no more than 5% to 10% of your portfolio in these sectors. Tax-exempt income is federal income tax free. A portion of this income may be subject to state and local income taxes, and if applicable, may subject certain investors to the Alternative Minimum Tax as well. Each tax free fund may invest up to 20% of its assets in securities that pay taxable interest. Income or fund distributions attributable to capital gains are usually subject to both state and federal income taxes. Bond funds are subject to interest-rate risk; their value declines as interest rates rise. The tax free funds may be exposed to risks related to a concentration of investments in a particular state or geographic area. These investments present risks resulting from changes in economic conditions of the region or issuer.
www.usfunds.com May 2013 13-181
Disclosures
68
Although Lipper makes reasonable efforts to ensure the accuracy and reliability of the data contained herein, the accuracy is not guaranteed by Lipper. Users acknowledge that they have not relied upon any warranty, condition, guarantee, or representation made by Lipper. Any use of the data for analyzing, managing, or trading financial instruments is at the user's own risk. This is not an offer to buy or sell securities. Morningstar Ratings are based on risk-adjusted return. The Morningstar Rating for a fund is derived from a weighted-average of the performance figures associated with its three-, five- and ten-year (if applicable) Morningstar Rating metrics. Past performance does not guarantee future results. For each fund with at least a three-year history, Morningstar calculates a Morningstar Rating™ based on a Morningstar Risk-Adjusted Return measure that accounts for variation in a fund s monthly performance (including the effects of sales charges, loads, and redemption fees), placing more emphasis on downward variations and rewarding consistent performance. The top 10% of funds in each category receive 5 stars, the next 22.5% receive 4 stars, the next 35% receive 3 stars, the next 22.5% receive 2 stars and the bottom 10% receive 1 star. (Each share class is counted as a fraction of one fund within this scale and rated separately, which may cause slight variations in the distribution percentages.) The S&P 500 Stock Index is a widely recognized capitalization-weighted index of 500 common stock prices in U.S. companies. The MSCI Emerging Markets Index is a free float-adjusted market capitalization index that is designed to measure equity market performance in the global emerging markets. The NYSE Arca Gold BUGS (Basket of Unhedged Gold Stocks) Index (HUI) is a modified equal dollar weighted index of companies involved in gold mining. The HUI Index was designed to provide significant exposure to near term movements in gold prices by including companies that do not hedge their gold production beyond 1.5 years. The Morgan Stanley Commodity Related Index (CRX) is an equal-dollar weighted index of 20 stocks involved in commodity related industries such as energy, non-ferrous metals, agriculture, and forest products. The index was developed with a base value of 200 as of March 15, 1996. The S&P/TSX Venture Composite Index is a broad market indicator for the Canadian venture capital market. The index is market capitalization weighted and, at its inception, included 531 companies. A quarterly revision process is used to remove companies that comprise less than 0.05% of the weight of the index, and add companies whose weight, when included, will be greater than 0.05% of the index. The Philadelphia Stock Exchange Gold and Silver Index (XAU) is a capitalization-weighted index that includes the leading companies involved in the mining of gold and silver. The Nasdaq Composite Index is a capitalization-weighted index of all Nasdaq National Market and SmallCap stocks. The MSCI China Free Index is a capitalization weighted index that monitors the performance of stocks from the country of China. The Russell 2000 Growth Index is constructed to provide a comprehensive and unbiased barometer of the small-cap growth market.
www.usfunds.com May 2013 13-181
Disclosures
69
Alpha is a measure of performance on a risk-adjusted basis. Alpha takes the volatility (price risk) of a mutual fund and compares its risk-adjusted performance to a benchmark index. The excess return of the fund relative to the return of the benchmark index is a fund's alpha. Standard deviation is a measure of the dispersion of a set of data from its mean. The more spread apart the data, the higher the deviation. Standard deviation is also known as historical volatility. M1 Money Supply includes funds that are readily accessible for spending. M2 Money Supply is a broad measure of money supply that includes M1 in addition to all time-related deposits, savings deposits, and non-institutional money-market funds. M3 money supply is the broadest monetary aggregate, including physical currency, demand accounts, savings and money market accounts, certificates of deposit, deposits of eurodollars and repurchase agreements. Holdings in the Global Resources Fund, World Precious Minerals Fund, Gold and Precious Metals Fund, Emerging Europe Fund and Global Emerging Markets Fund as a percentage of net assets as of 03/31/2013: Facebook 0.00%; SPDR Gold Shares (World Precious Minerals Fund 1.72%, Gold and Precious Metals Fund 3.20%); Apple 0.00%; SPDR S&P Global Natural Resources ETF 0.00%; Market Vectors Gold Miners ETF (Gold and Precious Metals Fund 0.17%, World Precious Minerals Fund 0.17%); Market Vectors Junior Gold Miners ETF (Gold and Precious Metals Fund 0.07%, World Precious Minerals Fund 0.08%); Berkhire Hathaway 0.00%; Microsoft 0.00%; Iamgold (Global Resources Fund 1.10%, Gold and Precious Metals Fund 0.05%, World Precious Minerals Fund 0.05%); Goldcorp (Gold and Precious Metals Fund 0.96%, World Precious Minerals Fund 0.49%); BMW 0.00%; Rennault 0.00%; General Motors 0.00%. There is no guarantee that the issuers of any securities will declare dividends in the future or that, if declared, will remain at current levels or increase over time. Note that stocks and Treasury bonds differ in investment objectives, costs and expenses, liquidity, safety, guarantees or insurance, fluctuation of principal or return, and tax features.
Recommended