Growth Markets in the US - IDC
Analysis
Growth Markets in the US - IDC
AnalysisPrepared by Pipsa Ylä-Monoen, Country Manager
IDC Oy, Email [email protected] Prepared by Pipsa Ylä-Monoen, Country Manager
IDC Oy, Email [email protected]
Agenda
• IDC shortly• Industry after September 11 th• Security market• Wireless trends• CRM
••
••
•••
•
• •
••
•
•
•
••
•
•
••••
•
• ••••
• • ••
•
••••
••••
•
•
•
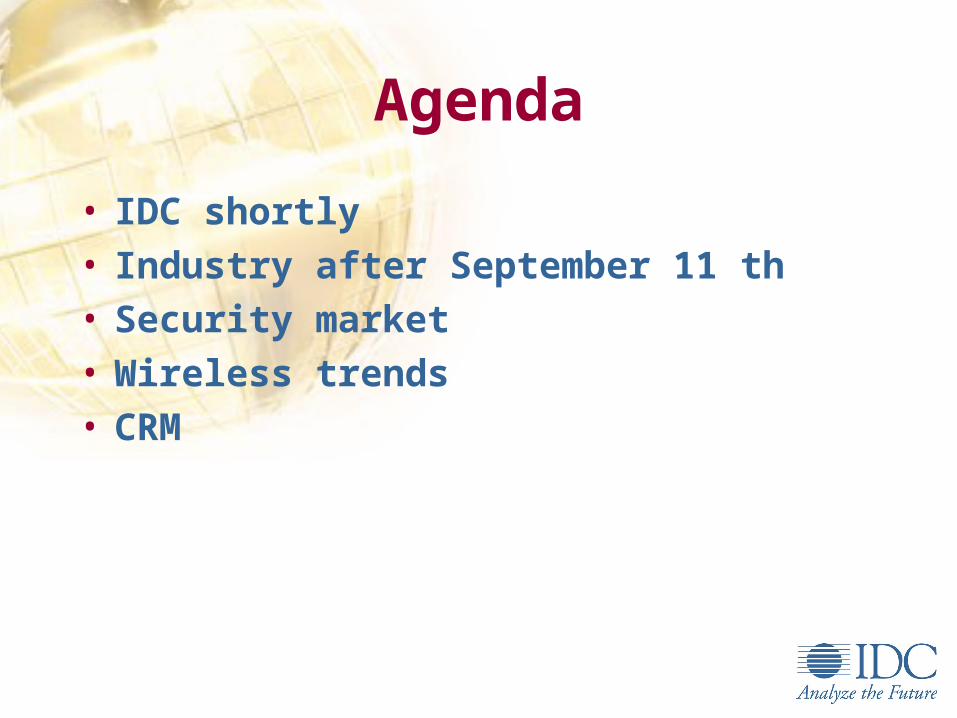
United StatesArgentinaBrazilCanadaChileColombiaMexicoVenezuela
AustriaBeneluxCzech RepublicDenmarkFinlandFranceGermanyGreeceHungaryItaly
PolandRussiaSpainSwedenSwitzerlandTurkeyU.K.
AustraliaChinaEgyptHong Kong (AsianResearch Center) IndiaIndonesiaIsraelJapanKorea
MalaysiaNew ZealandNigeriaPhilippinesSingaporeSouth AfricaTaiwanThailand
IDCfounded 1964, 51 offices in 43 countries, 800
analysts worldwide
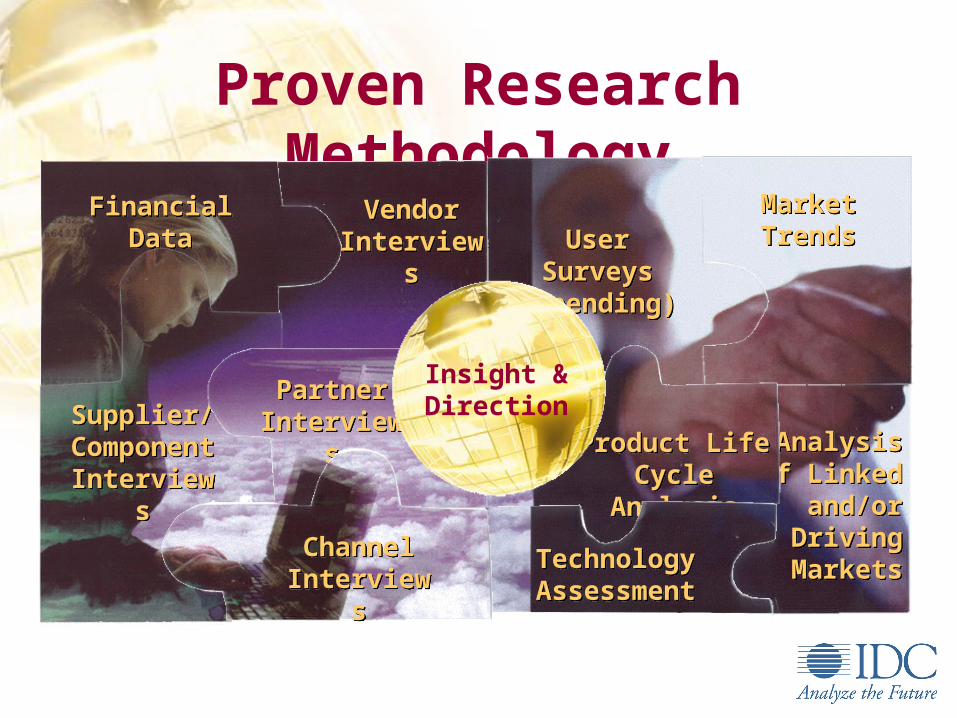
Proven Research Methodology
Analysisof Linked
and/orDriving
Markets
Analysisof Linked
and/orDriving
Markets
Market TrendsMarket TrendsUser Surveys
(spending)User Surveys
(spending)
Vendor Interviews
Vendor Interviews
FinancialData
FinancialData
Supplier/ComponentInterviews
Supplier/ComponentInterviews
PartnerInterviews
PartnerInterviews
Product LifeCycle Analysis
Product LifeCycle Analysis
TechnologyAssessmentTechnologyAssessment
ChannelInterviewsChannel
Interviews
Insight &Direction
Accessing IDC• Subscription services (yearly based)e.g ASP, CRM, European Internet economy, Security, eBusiness etc.
• A la carte document purchasessingle reports and bulletins
• Conferencese.g IT Forum in September in Monaco, Outsourcing
• Custom tailored research and consulting servicesMarket studies, competitor analysis and follow ups, deliverychannels surveys etc

Industry after
September 11
Industry after
September 11
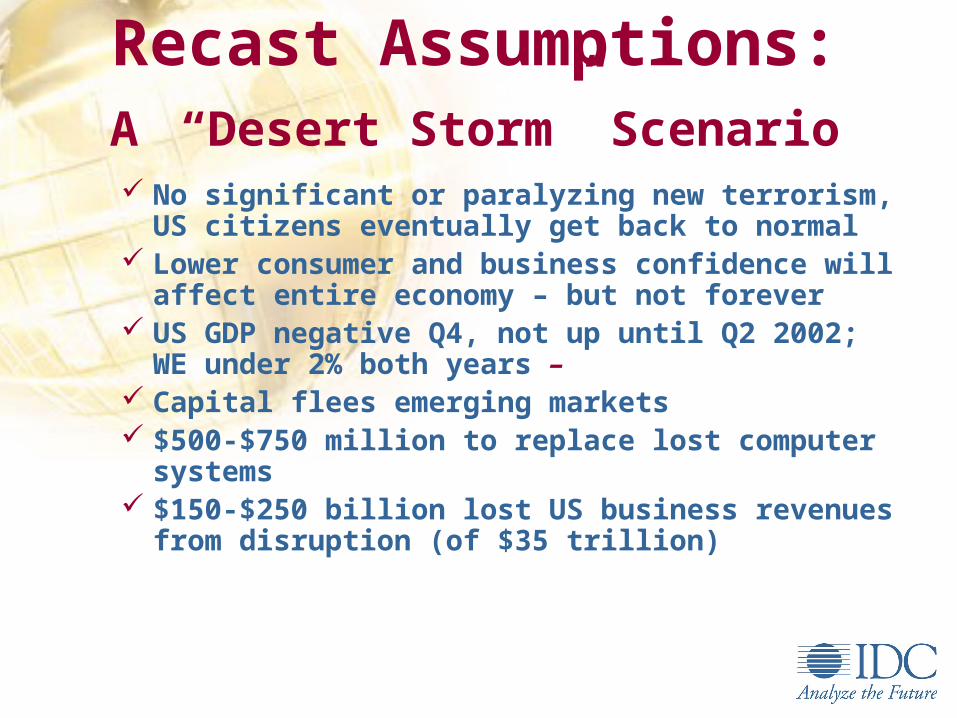
Recast Assumptions:A “Desert Storm” Scenario
No significant or paralyzing new terrorism, US citizens eventually get back to normal
Lower consumer and business confidence will affect entire economy – but not forever
US GDP negative Q4, not up until Q2 2002; WE under 2% both years –
Capital flees emerging markets $500-$750 million to replace lost computer
systems $150-$250 billion lost US business revenues from
disruption (of $35 trillion)
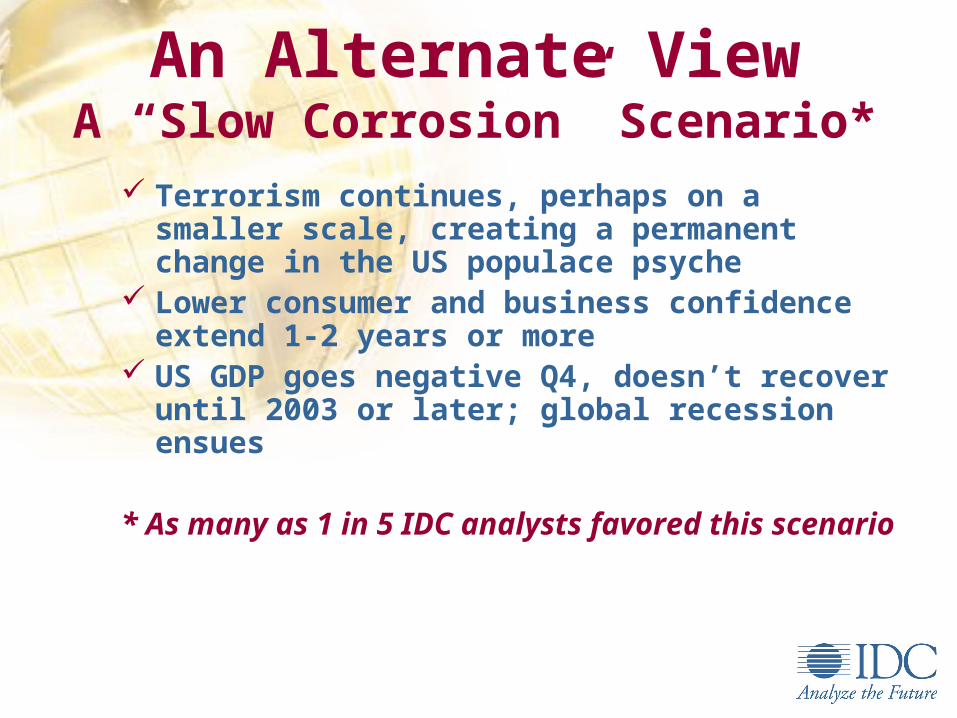
An Alternate ViewA “Slow Corrosion” Scenario*
Terrorism continues, perhaps on a smaller scale, creating a permanent change in the US populace psyche
Lower consumer and business confidence extend 1-2 years or more
US GDP goes negative Q4, doesn’t recover until 2003 or later; global recession ensues
* As many as 1 in 5 IDC analysts favored this scenario
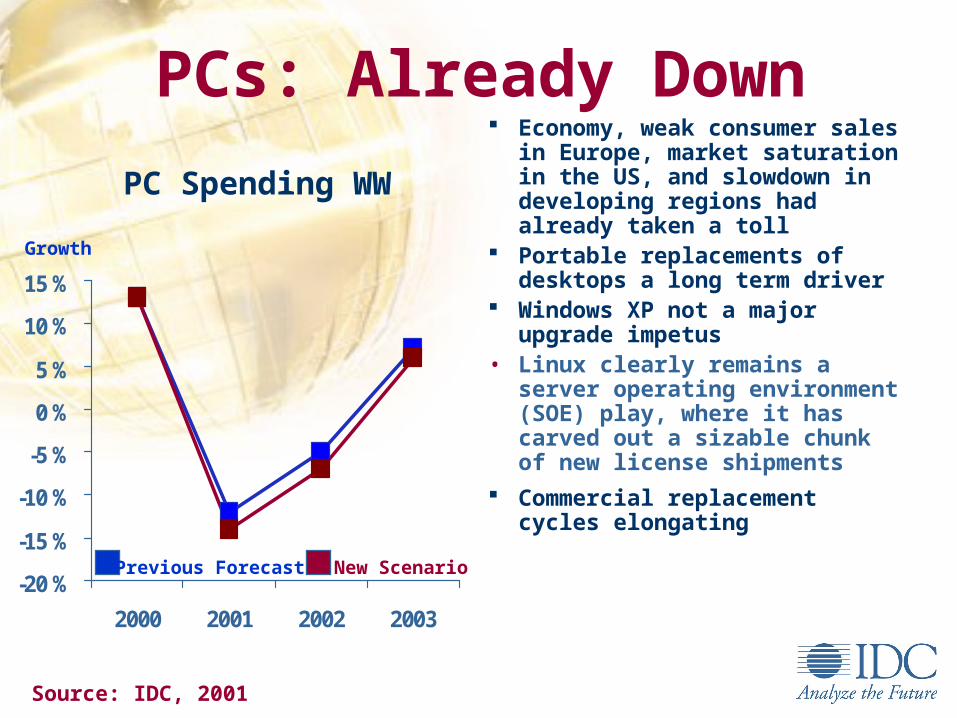
PC Spending WW
-20 %
-15 %
-10 %
-5 %
0 %
5 %
10 %
15 %
2000 2001 2002 2003
PCs: Already Down
Source: IDC, 2001
Economy, weak consumer sales in Europe, market saturation in the US, and slowdown in developing regions had already taken a toll
Portable replacements of desktops a long term driver
Windows XP not a major upgrade impetus
• Linux clearly remains a server operating environment (SOE) play, where it has carved out a sizable chunk of new license shipments
Commercial replacement cycles elongatingPrevious Forecast New Scenario
Growth
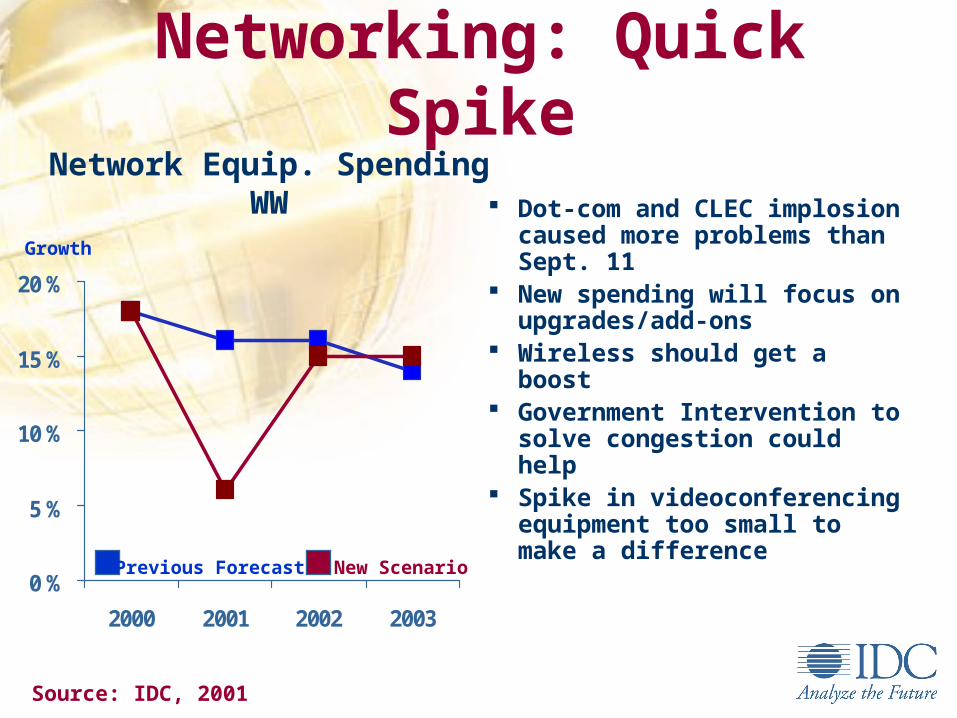
Network Equip. Spending WW
0 %
5 %
10 %
15 %
20 %
2000 2001 2002 2003
Networking: Quick Spike
Source: IDC, 2001
Dot-com and CLEC implosion caused more problems than Sept. 11
New spending will focus on upgrades/add-ons
Wireless should get a boost Government Intervention to
solve congestion could help Spike in videoconferencing
equipment too small to make a difference
Previous Forecast New Scenario
Growth
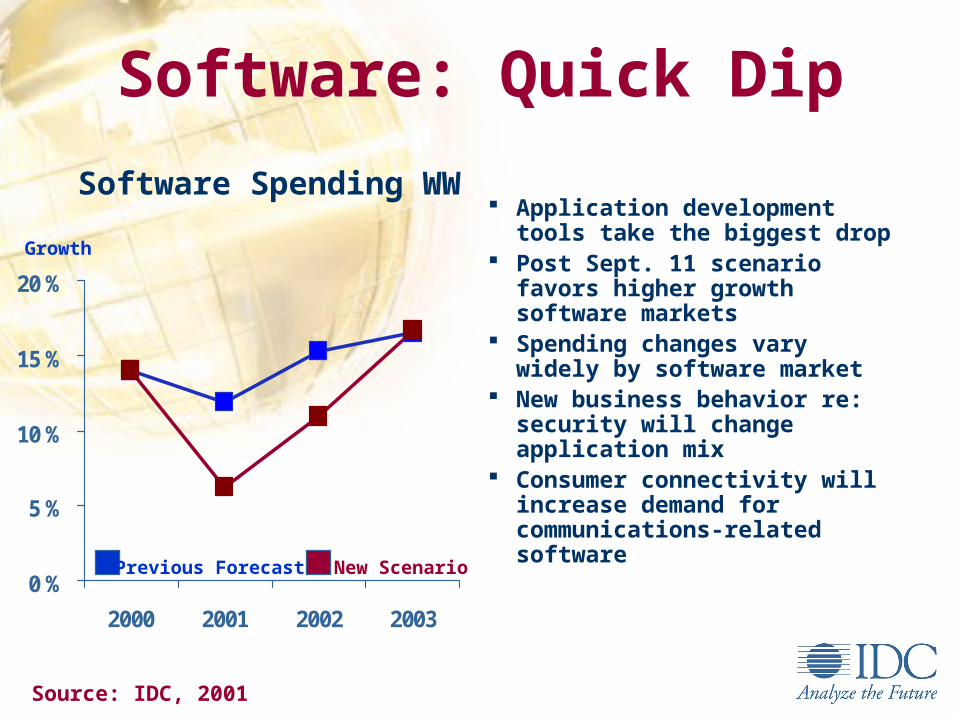
Software Spending WW
0 %
5 %
10 %
15 %
20 %
2000 2001 2002 2003
Software: Quick Dip
Source: IDC, 2001
Application development tools take the biggest drop
Post Sept. 11 scenario favors higher growth software markets
Spending changes vary widely by software market
New business behavior re: security will change application mix
Consumer connectivity will increase demand for communications-related softwarePrevious Forecast New Scenario
Growth
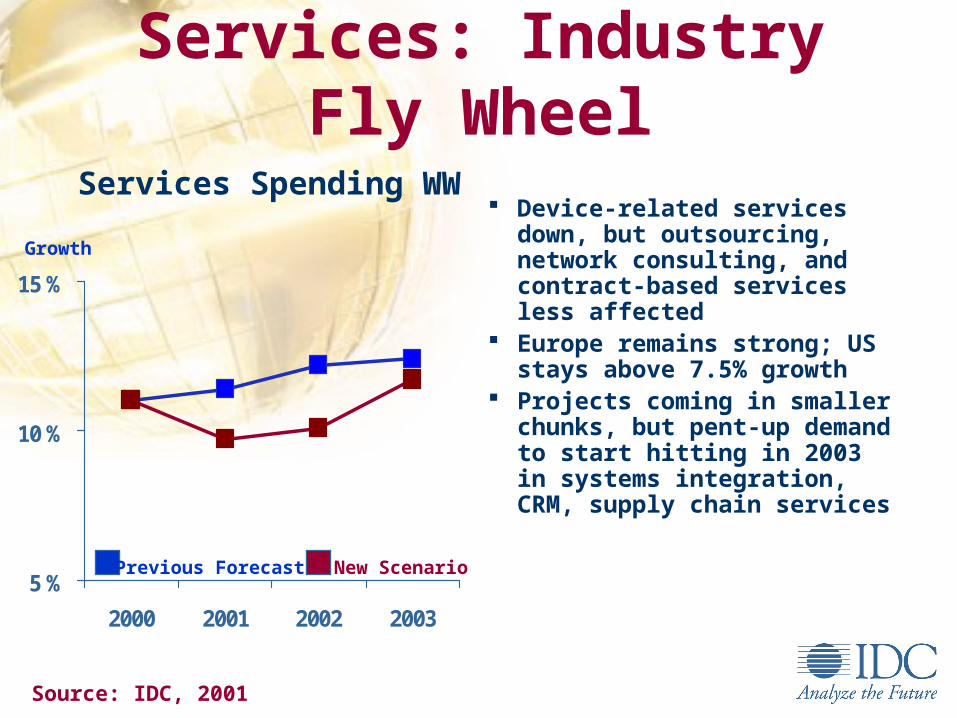
Services Spending WW
5 %
10 %
15 %
2000 2001 2002 2003
Services: Industry Fly Wheel
Source: IDC, 2001
Device-related services down, but outsourcing, network consulting, and contract-based services less affected
Europe remains strong; US stays above 7.5% growth
Projects coming in smaller chunks, but pent-up demand to start hitting in 2003 in systems integration, CRM, supply chain servicesPrevious Forecast New Scenario
Growth
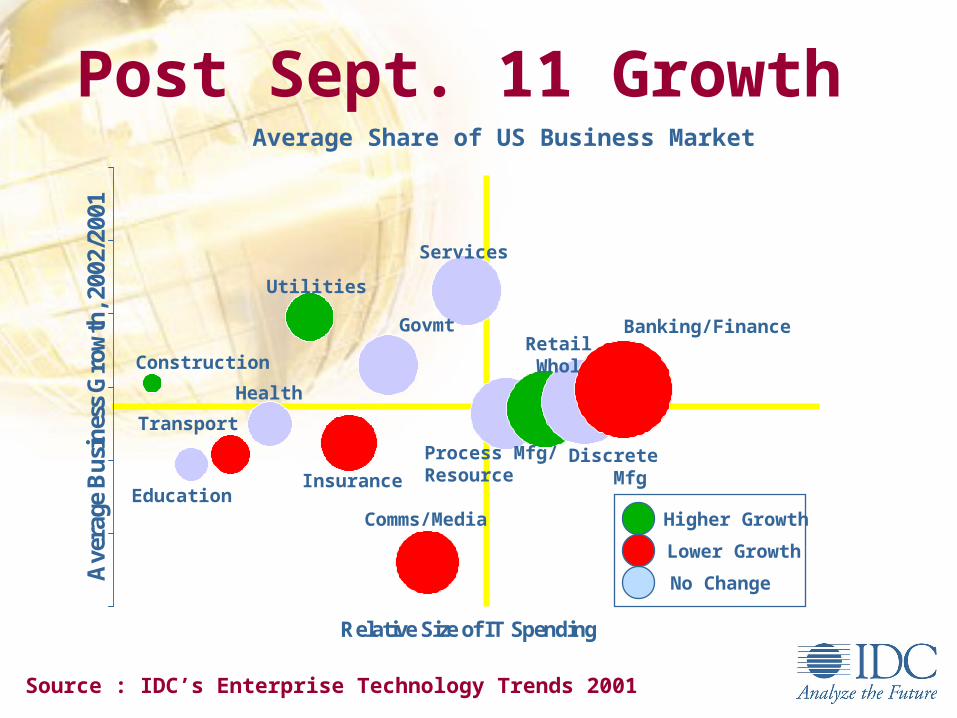
Relative Size of IT Spending
Ave
rage
Bu
sin
ess
Gro
wth
, 200
2/20
01
Construction
Education
Transport
Health
Utilities
Insurance
Govmt
Comms/Media
Services
Process Mfg/Resource
Retail Whol
Discrete Mfg
Banking/Finance
Post Sept. 11 Growth Average Share of US Business Market
Lower Growth
No Change
Higher Growth
Source : IDC’s Enterprise Technology Trends 2001
Security market
Security market
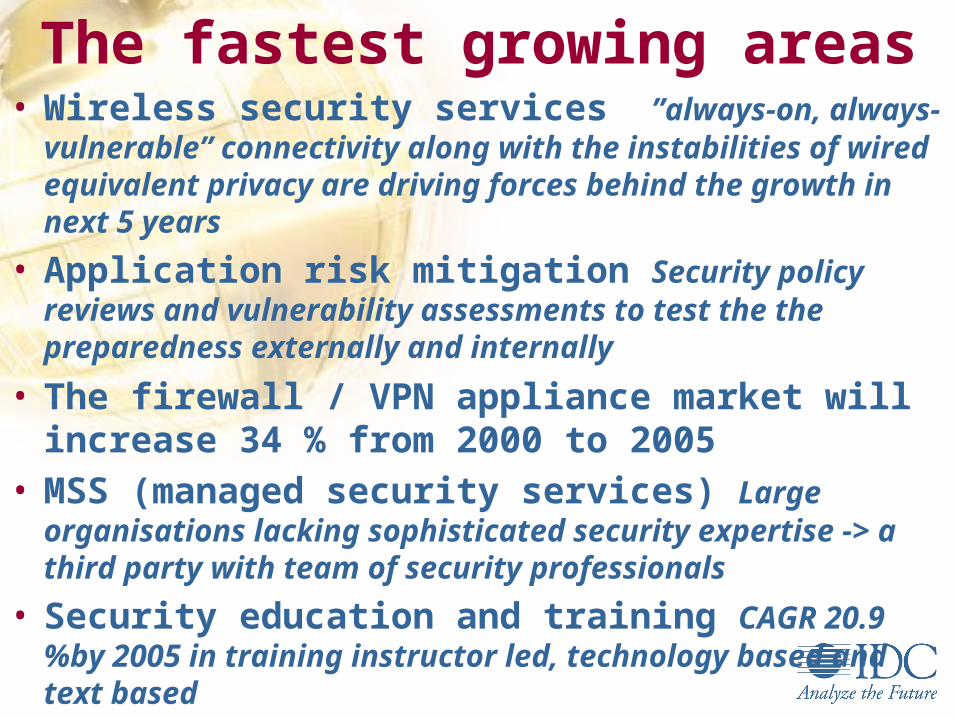
The fastest growing areas• Wireless security services ”always-on, always-
vulnerable” connectivity along with the instabilities of wired equivalent privacy are driving forces behind the growth in next 5 years
• Application risk mitigation Security policy reviews and vulnerability assessments to test the the preparedness externally and internally
• The firewall / VPN appliance market will increase 34 % from 2000 to 2005
• MSS (managed security services) Large organisations lacking sophisticated security expertise -> a third party with team of security professionals
• Security education and training CAGR 20.9 %by 2005 in training instructor led, technology based and text based
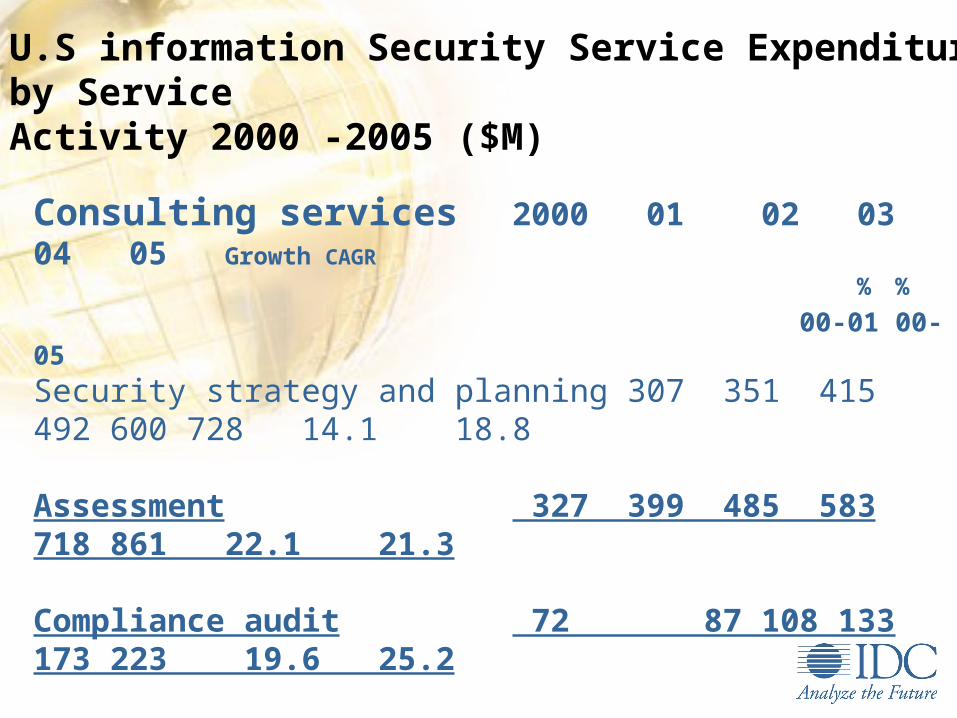
Consulting services 2000 01 02 03 04 05 Growth CAGR
% %
00-01 00-05Security strategy and planning 307 351 415 492 600 728 14.1 18.8
Assessment 327 399 485 583 718 861 22.1 21.3
Compliance audit 72 87 108 133 173 223 19.6 25.2
Architecture analysis and review 171 195 228 269 327 395 13.9 18.2
Subtotal 878 1,03 1,24 1,48 1,82 2,21 17.5 20.
U.S information Security Service Expenditures by Service Activity 2000 -2005 ($M)
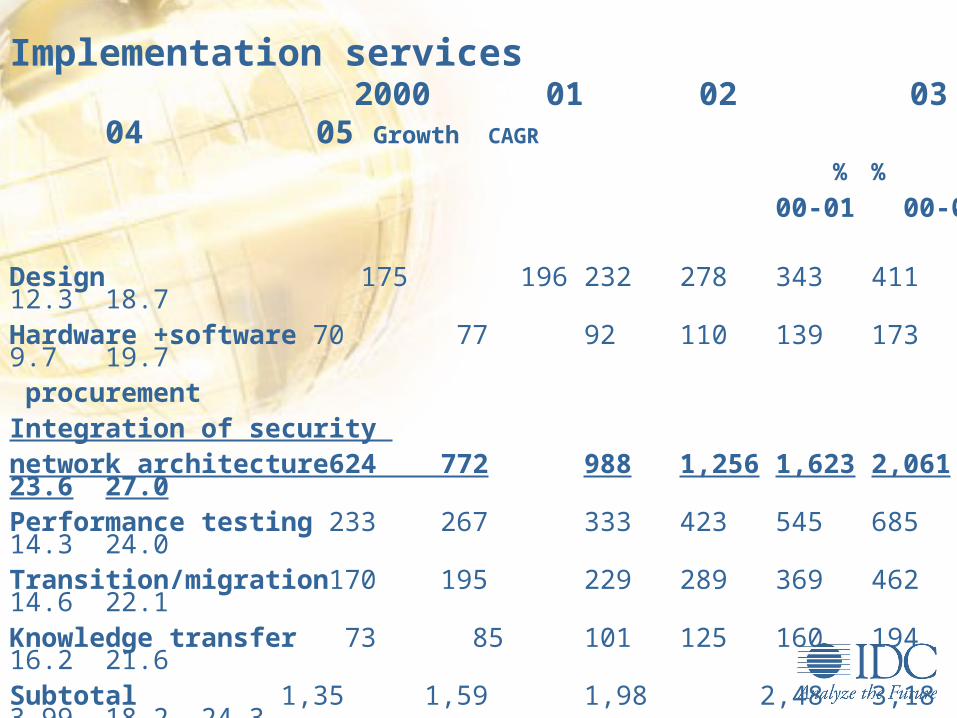
Implementation services 2000 01 02 03 04 05
Growth CAGR
% %
00-01 00-05
Design 175 196 232 278 343 411 12.3 18.7Hardware +software 70 77 92 110 139 173 9.7 19.7 procurementIntegration of security network architecture624 772 988 1,256 1,623 2,061 23.6 27.0Performance testing 233 267 333 423 545 685 14.3 24.0Transition/migration170 195 229 289 369 462 14.6 22.1Knowledge transfer 73 85 101 125 160 194 16.2 21.6Subtotal 1,35 1,59 1,98 2,48 3,18 3,99 18.2 24.3
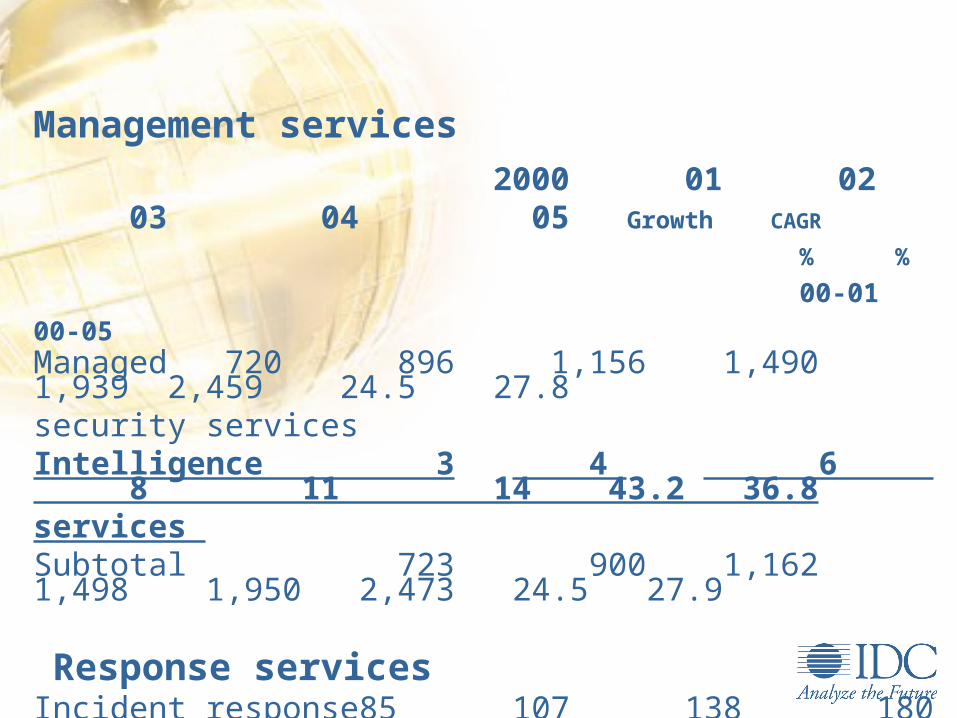
Management services
2000 01 02 03 04 05 Growth CAGR
% %
00-01 00-05 Managed 720 896 1,156 1,490 1,939 2,459 24.5 27.8 security servicesIntelligence 3 4 6 8 11 14 43.2 36.8services Subtotal 723 900 1,162 1,498 1,950 2,473 24.5 27.9
Response services Incident response85 107 138 180 237 301 25.4 28.7 services Cyber forensics 21 30 41 57 78 107 41.5 38.2 Subtotal 106 137 180 236 314 409 28.6 30.9
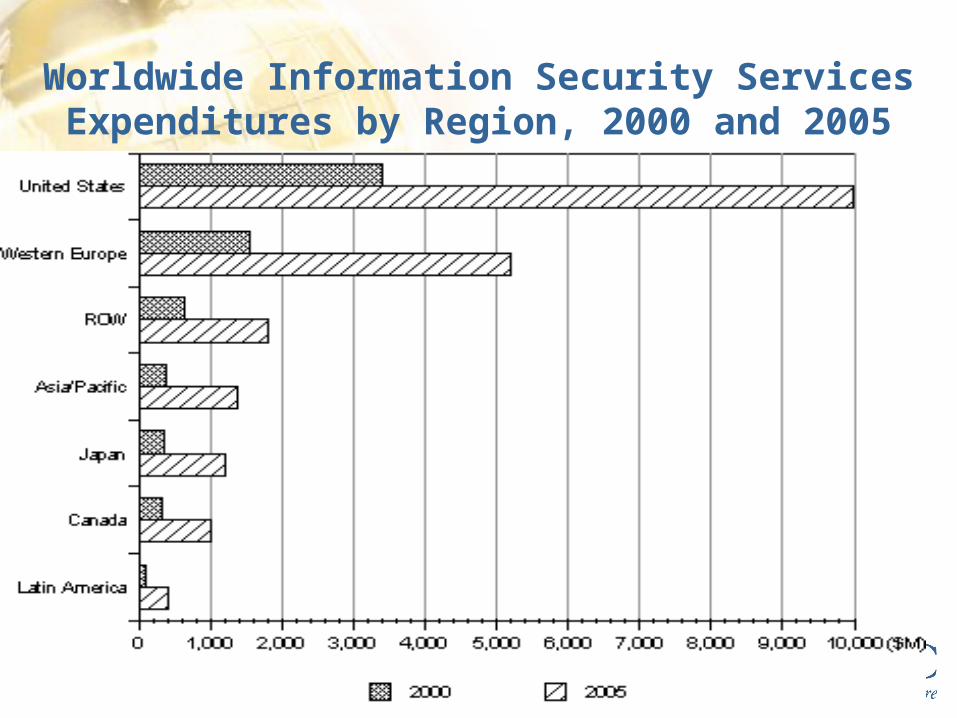
Worldwide Information Security Services Expenditures by Region, 2000 and 2005
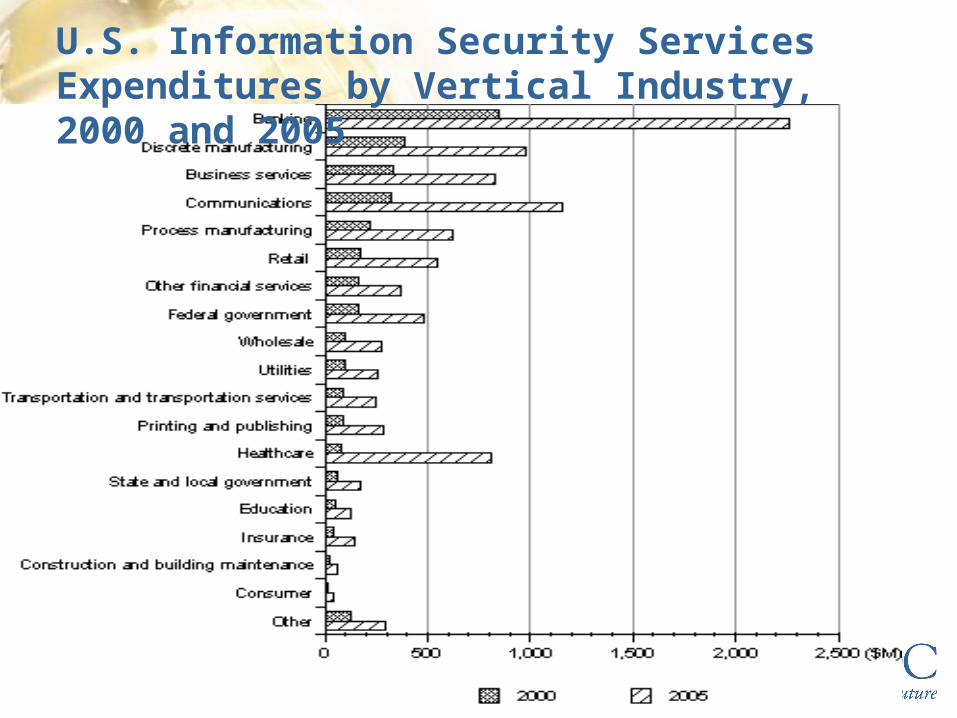
U.S. Information Security Services Expenditures by Vertical Industry, 2000 and 2005
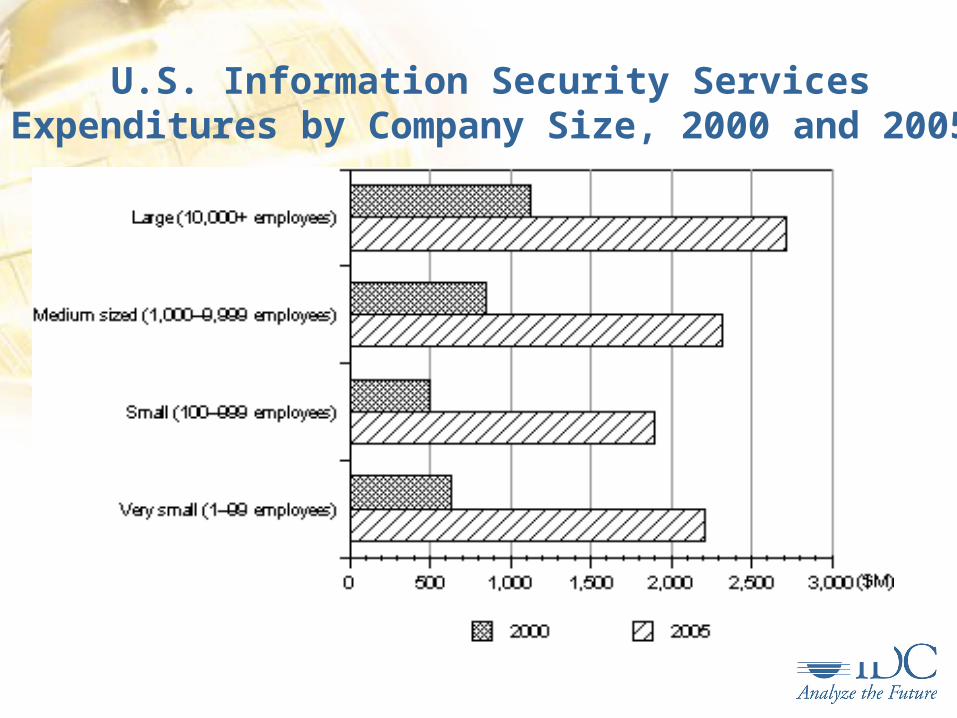
U.S. Information Security Services Expenditures by Company Size, 2000 and 2005
Market direction The banking sector will be the single largest user of
information security services The healthcare sector will be the fastest-growing source
of demand (privacy legislation) Customer demands for services to develop and improve
security postures will continue to drive growth in this sector through 2005.
Services surrounding managed security services, cyber forensics, and technology-based training will experience high growth rates in the early part of the next decade.
Trends• Growing corporate appetite for remote LAN, Internet,
Intranet and Wireless access services drive the need for advanced information security services as technologies for for circumventing network security systems continue to keep pace with technologies designed to defend against them
• Partnering with complementary firms has been and will be a popular form of service delivery as the industry continues to become more specialized
• To be a successful security service provider It is important to be able to articulate the major diffences between own solution and those of competitors
Capture the Mobile Opportunity
Capture the Mobile Opportunity
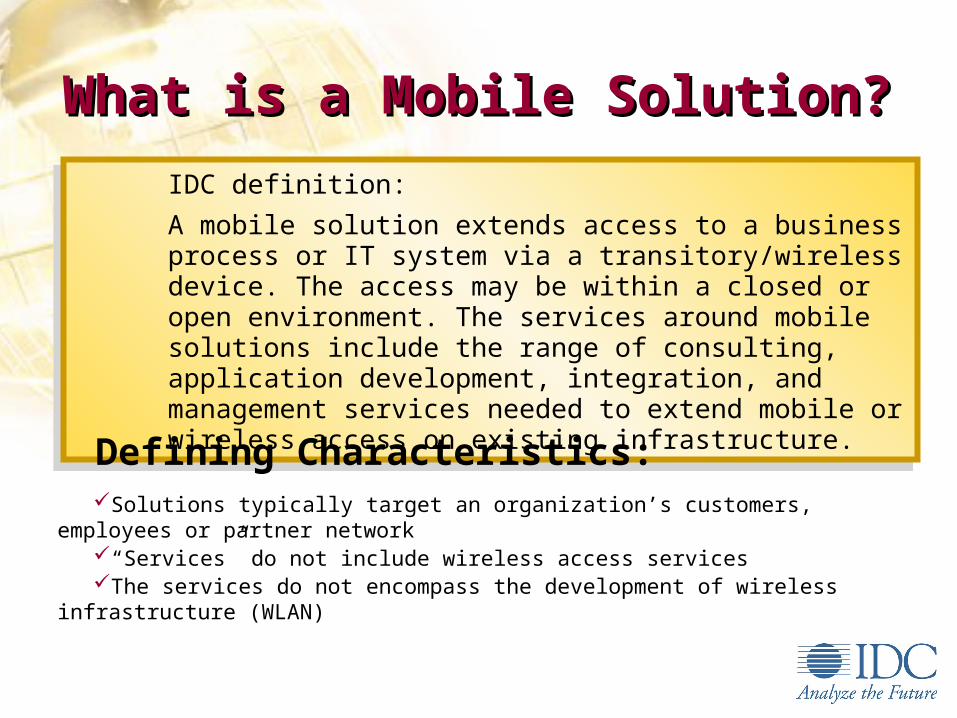
IDC definition:
A mobile solution extends access to a business process or IT system via a transitory/wireless device. The access may be within a closed or open environment. The services around mobile solutions include the range of consulting, application development, integration, and management services needed to extend mobile or wireless access on existing infrastructure.
What is a Mobile Solution?What is a Mobile Solution?
Solutions typically target an organization’s customers, employees or partner network“Services” do not include wireless access servicesThe services do not encompass the development of wireless infrastructure (WLAN)
Defining Characteristics:
0
5000
10000
15000
20000
25000
30000
2000 2004
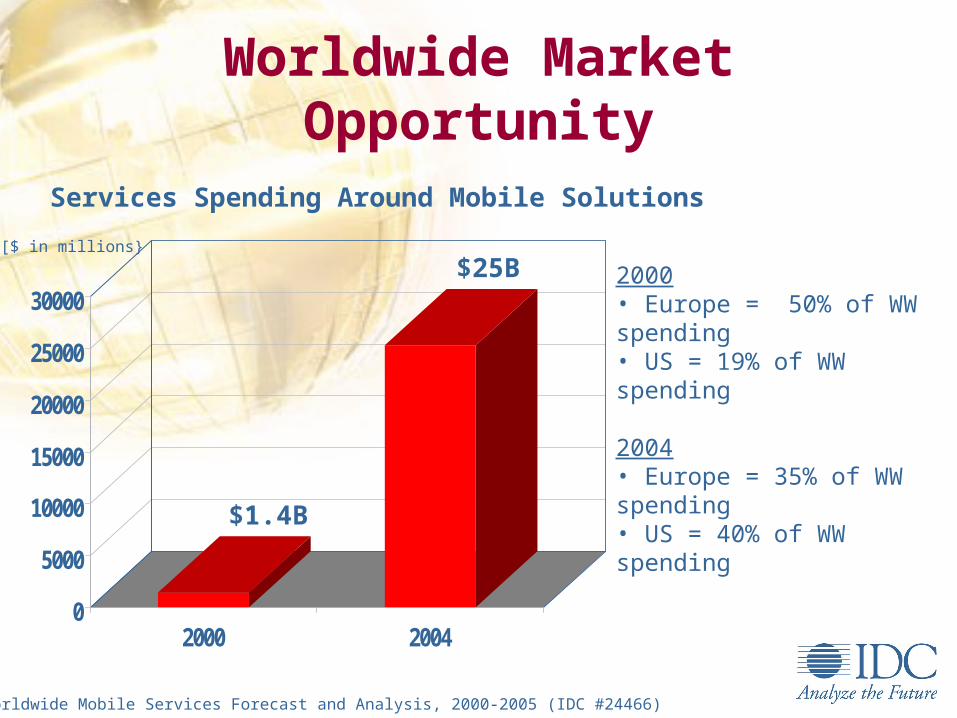
Worldwide Market Opportunity
2000• Europe = 50% of WW spending• US = 19% of WW spending
2004• Europe = 35% of WW spending• US = 40% of WW spending
$25B
Services Spending Around Mobile Solutions
$1.4B
Source: Worldwide Mobile Services Forecast and Analysis, 2000-2005 (IDC #24466)
[$ in millions}
• Large corporations will lead the way into the mobile world– 39% in US are developing– 44% in Europe are doing the same
• The main driver into the mobile world: The creation of efficiencies
• Corporations will target employees first– 69% of companies across US and Europe are targeting
or will target their employees first
Mobile Market Overview
Source:IDC
Corporations:• Are looking to engage external providers to
deploy mobile projects• Have a clear idea of winning attributes for an
external provider– Technical Expertise– Track Record– Price Competitiveness– Industry Expertise
• Will want services in a life cycle similar to eBusiness life cycle but… with lessons learned
Mobile Market Overview
Source:IDC
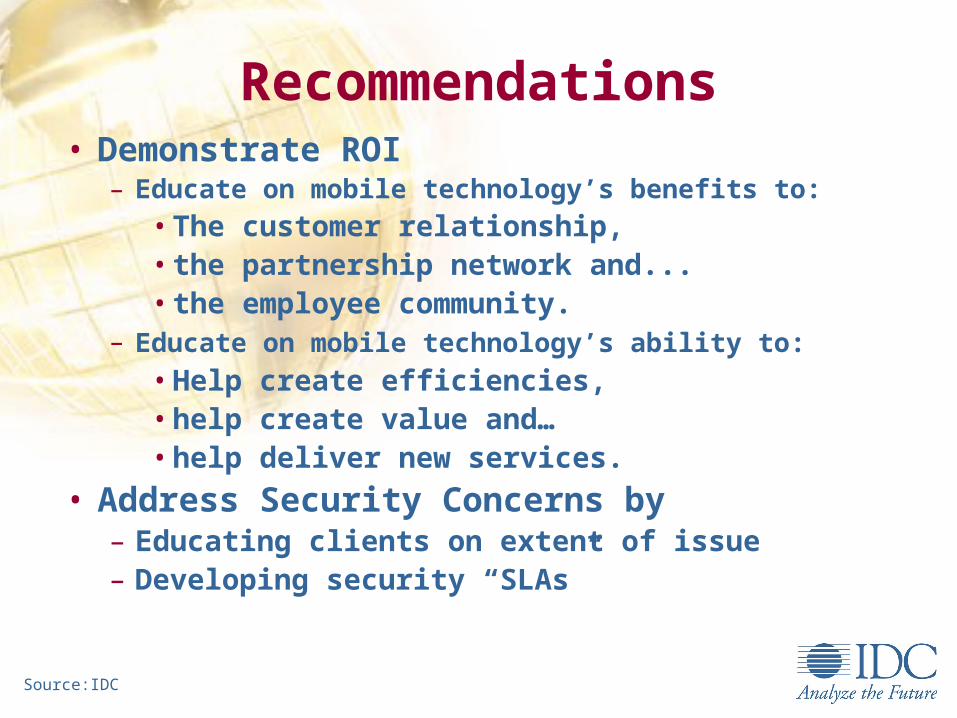
• Demonstrate ROI– Educate on mobile technology’s benefits to:
• The customer relationship,• the partnership network and...• the employee community.
– Educate on mobile technology’s ability to: • Help create efficiencies,• help create value and…• help deliver new services.
• Address Security Concerns by– Educating clients on extent of issue– Developing security “SLAs”
Recommendations
Source:IDC
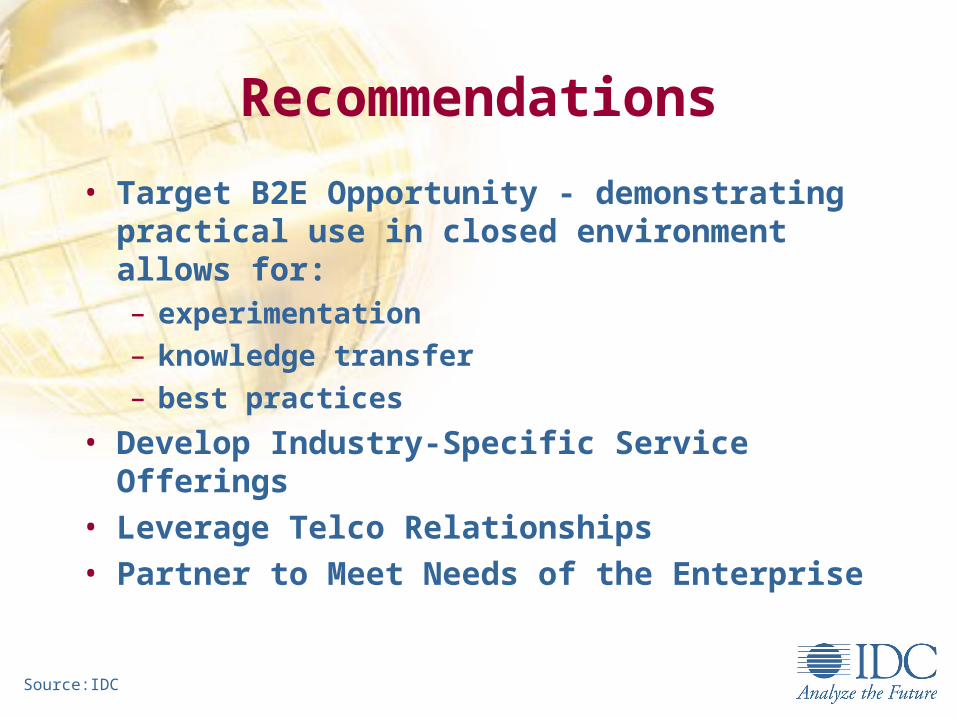
• Target B2E Opportunity - demonstrating practical use in closed environment allows for:– experimentation
– knowledge transfer
– best practices
• Develop Industry-Specific Service Offerings• Leverage Telco Relationships• Partner to Meet Needs of the Enterprise
Recommendations
Source:IDC
CRM marketCRM market
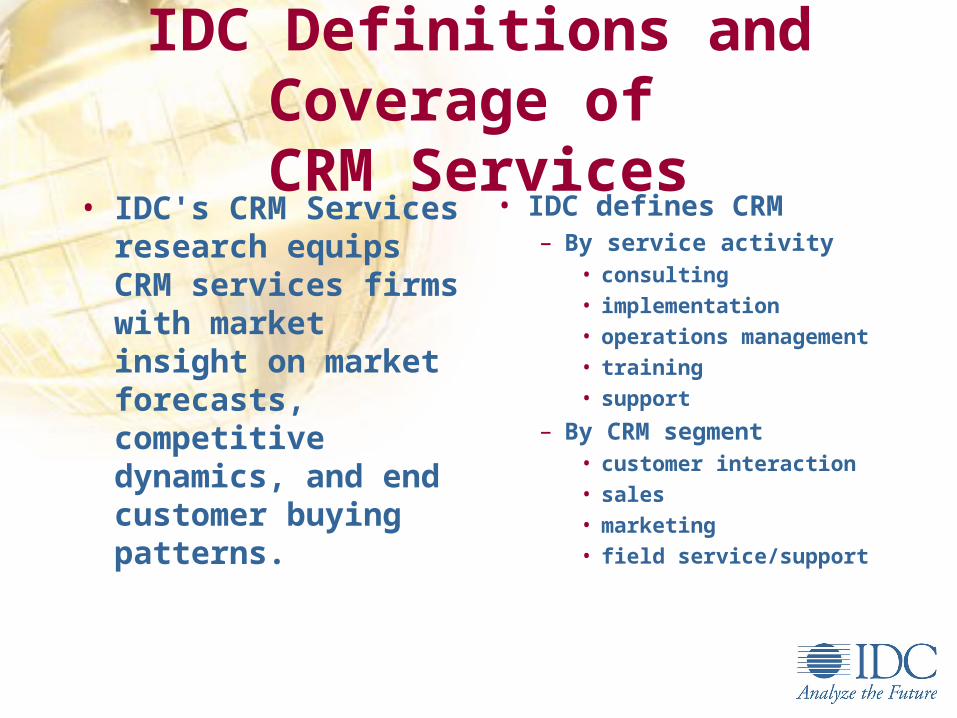
IDC Definitions and Coverage of CRM Services
• IDC's CRM Services research equips CRM services firms with market insight on market forecasts, competitive dynamics, and end customer buying patterns.
• IDC defines CRM– By service activity
• consulting
• implementation
• operations management
• training
• support
– By CRM segment• customer interaction
• sales
• marketing
• field service/support
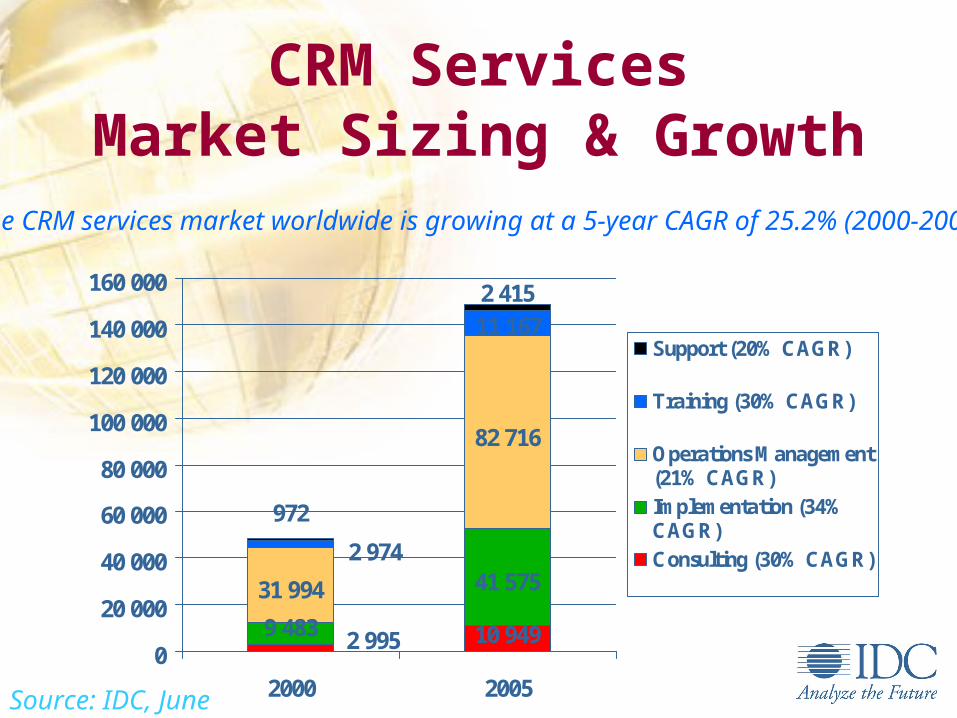
CRM ServicesMarket Sizing & Growth
10 9499 483
41 57531 994
82 716
2 415
2 995
11 167
2 974
972
0
20 000
40 000
60 000
80 000
100 000
120 000
140 000
160 000
2000 2005
Support (20% CAGR)
Training (30% CAGR)
Operations Management(21% CAGR)Implementation (34%CAGR)Consulting (30% CAGR)
The CRM services market worldwide is growing at a 5-year CAGR of 25.2% (2000-2005)
Source: IDC, June 2001
CRM ServicesKey Market Trends
• CRM is not just technology anymore - Clients increasingly look to services providers to comprehensively address the technology, process, & people issues associated with CRM implementations.
• The value proposition of CRM now reaches to any customer-impacting function, such as fulfillment & billing. Definition of “customer” has broadened.
• Increasing momentum to optimize (as opposed to just “collect”) customer data for business benefit.
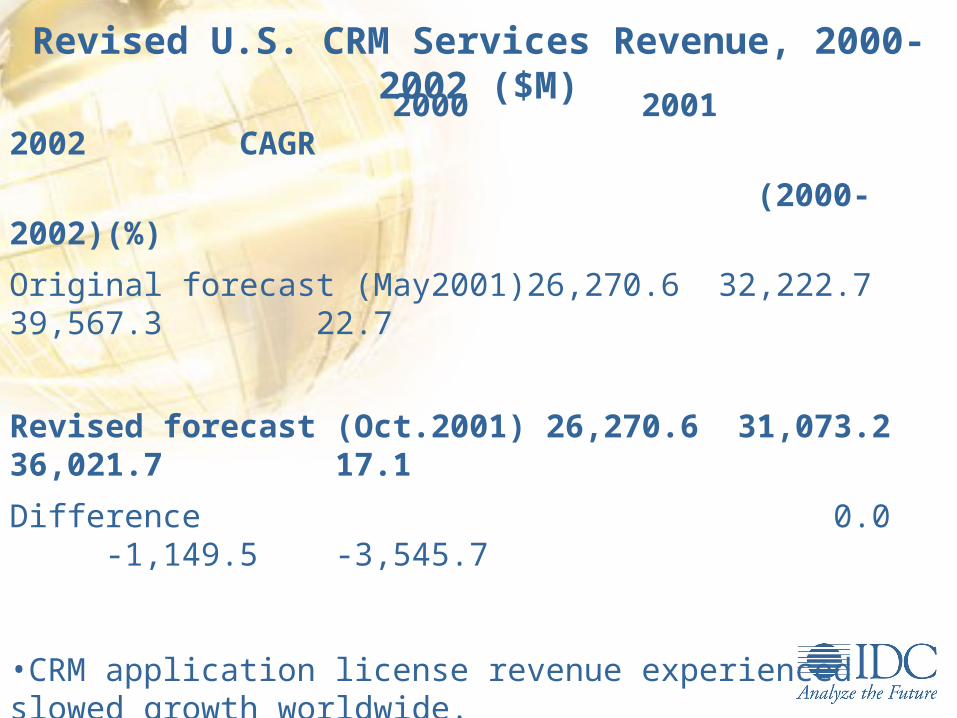
Revised U.S. CRM Services Revenue, 2000-2002 ($M)2000 2001 2002 CAGR
(2000-2002)(%)
Original forecast (May2001)26,270.6 32,222.7 39,567.3 22.7
Revised forecast (Oct.2001) 26,270.6 31,073.2 36,021.7 17.1
Difference 0.0 -1,149.5 -3,545.7
•CRM application license revenue experienced slowed growth worldwide.
Market direction
Beginning in late 2000 and continuing into 2001, caution demonstrated by clients about CRM IT investments has been exacerbated by increased economic and political uncertainty.
CRM projects will continue to be phased into smaller chunks, but pent-up demand will begin to impact the market more significantly from 2003.
Consulting and planning will play an increasingly important role in helping clients demonstrate and validate investments in CRM.
Slowing growth in CRM application license revenue will begin to impact services such as implementation, training, and support in 2002.
Security Regulation• The GLB Financial Modernization Act went into effect on July
1, was the deadline for financial institutions to implement information security measures or be subject to substantial monetary and legal penalties. Only finance companies that entered MSS contracts by March 2 are eligible for a two-year "grandfather period" from the information security provisions. The GLB Act requires financial institutions to address six key information security areas: assessing IT environments and understanding security risks; establishing information security policies; maintaining regular independent assessments; providing user training and security awareness programs; scrutinizing business relationships; and reviewing and updating procedures.
Security Regualation…..
• Government Information Security Reform Act. (GISRA), October 2000, is part of the FY01 Defense Authorization Act. This act requires each agency to develop and implement an agencywide information security plan for its assets and operations. It also requires to be reviewed annually by agency program officials and inspector general audits of information security programs and practices.
• Under the GISRA, agencies must use these assessments to improve their security programs and practices. Reports on the assessments must be delivered to the Office of Management and Budget (OMB), which will provide a summary report for Congress.
Security Regulation ….
• HIPAA. The HIPAA of 1996 privacy standards went into effect on April 14. HIPAA was designed to improve the efficiency and effectiveness of the healthcare system by standardizing the interchange of electronic data for specified administrative and financial transactions; it was designed to protect the security and confidentiality of health information exchanged electronically. Most large organizations have until April 14, 2003, to comply with the patient privacy rule; small health plans have an additional year to comply. Significant financial penalties will be levied for noncompliance within the specified time frames.
Security Regulation..• The Safe Harbor Privacy Principles agreement is legislation that bridges the
gap between the U.S. and European Union (EU) privacy protection standards. Into effect on July 1. It provides predictability and continuity for U.S. and EU companies that are sending and receiving personal information to and from Europe. The agreement ensures that information is not interrupted during transmission and is delivered to countries whose privacy practices are deemed "adequate" by the European Commission Directive on Data Protection. A list of U.S. companies that participate and are self-certified to the Safe Harbor Privacy Principles is at the Department of Commerce's Web site (www.ita.doc.gov/ecom ). Presently, only a few companies, including Microsoft, have signed up for Safe Harbor. Bill C-6. The Personal Information Protection and Electronic Documents Act (the "PIPED Act"), otherwise known as Bill C-6, went into effect on January. The PIPED Act supports and promotes electronic commerce by protecting personal information that is collected, used, or disclosed in certain circumstances by providing for the use of electronic means to communicate or record information or transactions and by amending the Canada Evidence Act, the Statutory Instruments Act, and the Statute Revision Act
Recommended