Guyana National Household
Drug Prevalence Survey
Report
2016
Ministry of Public Security
Sponsored by
Organization of American States/
Inter-American Drug Abuse Control Commission (OAS/CICAD)
1
Acknowledgement
The successful completion of this project would not have been possible without the contributions
of the following Organizations, Ministries, and Individuals.
The Organization of American States/
Inter-American Drug Abuse Control
Commission (OAS/CICAD)
Mr Pernell Clarke, Specialist, Inter-American
Observatory on Drugs
Ms Tiffany Barry, Project Assistant, Inter-
American Observatory on Drugs
OAS Guyana Office
Ambassador Jean Ricot Dormeus & Ms Jennifer
Munroe-Henry
Ministry of Public Security
Hon. Khemraj Ramjattan, Vice President &
Minister of Public Security
Major General (R’td) Michael Atherly, Head
Inter Agency Task Force on Narcotics and Illicit
Weapons
Mr Horace Cummings, Head of the Crime
Observatory
Guyana Bureau of Statistics
Mr Lennox Benjamin, Chief Statistician
Mr Ian Manifold, Head Surveys Department
Ms Jacqueline Tull, Senior Statistician
Ms Ofaye Cromwell and Devon December, Research Assistants, Supervisors, and Interviewers
thank you all for your hard work, long hours, and dedicated services as we travelled throughout
the regions of Guyana gathering the data for this survey. Finally a special thank you to those who
supported us in the field and most importantly the citizens who participated in this survey,
without your corporation this report would not have been possible.
Clement Henry, Ph. D Candidate
Lead Researcher
2
3
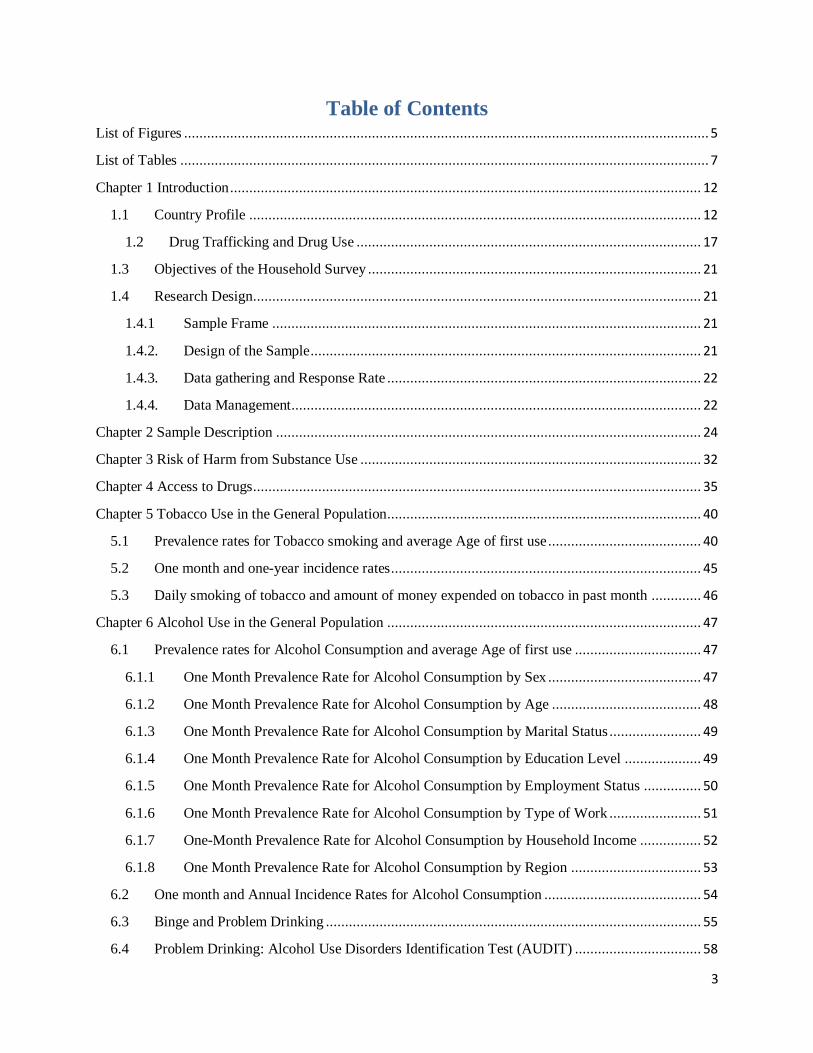
Table of Contents List of Figures ......................................................................................................................................... 5
List of Tables .......................................................................................................................................... 7
Chapter 1 Introduction ........................................................................................................................... 12
1.1 Country Profile ...................................................................................................................... 12
1.2 Drug Trafficking and Drug Use .......................................................................................... 17
1.3 Objectives of the Household Survey ....................................................................................... 21
1.4 Research Design..................................................................................................................... 21
1.4.1 Sample Frame ................................................................................................................ 21
1.4.2. Design of the Sample ...................................................................................................... 21
1.4.3. Data gathering and Response Rate .................................................................................. 22
1.4.4. Data Management........................................................................................................... 22
Chapter 2 Sample Description ............................................................................................................... 24
Chapter 3 Risk of Harm from Substance Use ......................................................................................... 32
Chapter 4 Access to Drugs ..................................................................................................................... 35
Chapter 5 Tobacco Use in the General Population.................................................................................. 40
5.1 Prevalence rates for Tobacco smoking and average Age of first use ........................................ 40
5.2 One month and one-year incidence rates ................................................................................. 45
5.3 Daily smoking of tobacco and amount of money expended on tobacco in past month ............. 46
Chapter 6 Alcohol Use in the General Population .................................................................................. 47
6.1 Prevalence rates for Alcohol Consumption and average Age of first use ................................. 47
6.1.1 One Month Prevalence Rate for Alcohol Consumption by Sex ........................................ 47
6.1.2 One Month Prevalence Rate for Alcohol Consumption by Age ....................................... 48
6.1.3 One Month Prevalence Rate for Alcohol Consumption by Marital Status ........................ 49
6.1.4 One Month Prevalence Rate for Alcohol Consumption by Education Level .................... 49
6.1.5 One Month Prevalence Rate for Alcohol Consumption by Employment Status ............... 50
6.1.6 One Month Prevalence Rate for Alcohol Consumption by Type of Work ........................ 51
6.1.7 One-Month Prevalence Rate for Alcohol Consumption by Household Income ................ 52
6.1.8 One Month Prevalence Rate for Alcohol Consumption by Region .................................. 53
6.2 One month and Annual Incidence Rates for Alcohol Consumption ......................................... 54
6.3 Binge and Problem Drinking .................................................................................................. 55
6.4 Problem Drinking: Alcohol Use Disorders Identification Test (AUDIT) ................................. 58
4
6.5 Prevalence Rates for Alcohol Consumption by Having Friends or Family Members who get
Drunk ………………………………………………………………………………………………………………………………………………60
Chapter 7 Illegal Drugs and Other Substance Use in the General Population .......................................... 61
7.1 Age of first use for Illegal Drugs ............................................................................................ 61
7.2 Prevalence Rates for Illegal Drugs .......................................................................................... 61
7.2.1 Marijuana Use .............................................................................................................. 61
7.2.2 Marijuana Market ........................................................................................................... 63
7.2.3 Incidence Rates for Marijuana use .................................................................................. 68
7.2.4 Problem Use of Marijuana .............................................................................................. 68
7.2.5 The Cannabis Abuse Screening Test (CAST) .................................................................. 70
7.3 Lifetime Prevalence for Cocaine and Crack Use ..................................................................... 71
7.4 Life Time Prevalence for Other Substance Use ....................................................................... 71
7.5 Negative Experiences associated with Drugs and Alcohol Use ................................................ 72
7.6 Operating Vehicle under the Influence of Drug or Drink ......................................................... 73
Chapter 8 Treatment for Alcohol and Drugs........................................................................................... 74
Chapter 9 Policy Perceptions ................................................................................................................. 78
Chapter 10 Conclusion & Recommendations ......................................................................................... 85
Appendix 1: Kish Grid for Random Selection of Household Member .................................................... 88
Appendix 2: Questionnaire .................................................................................................................... 91
Appendix 3: Age of First Use; Lifetime, past year, and past month Prevalence Rates; Past year and past
month Incidence Rates for Major Substances Used .............................................................................. 145
Appendix 4: The Alcohol Use Disorders Identification Test (AUDIT) ................................................. 147
References........................................................................................................................................... 149
5
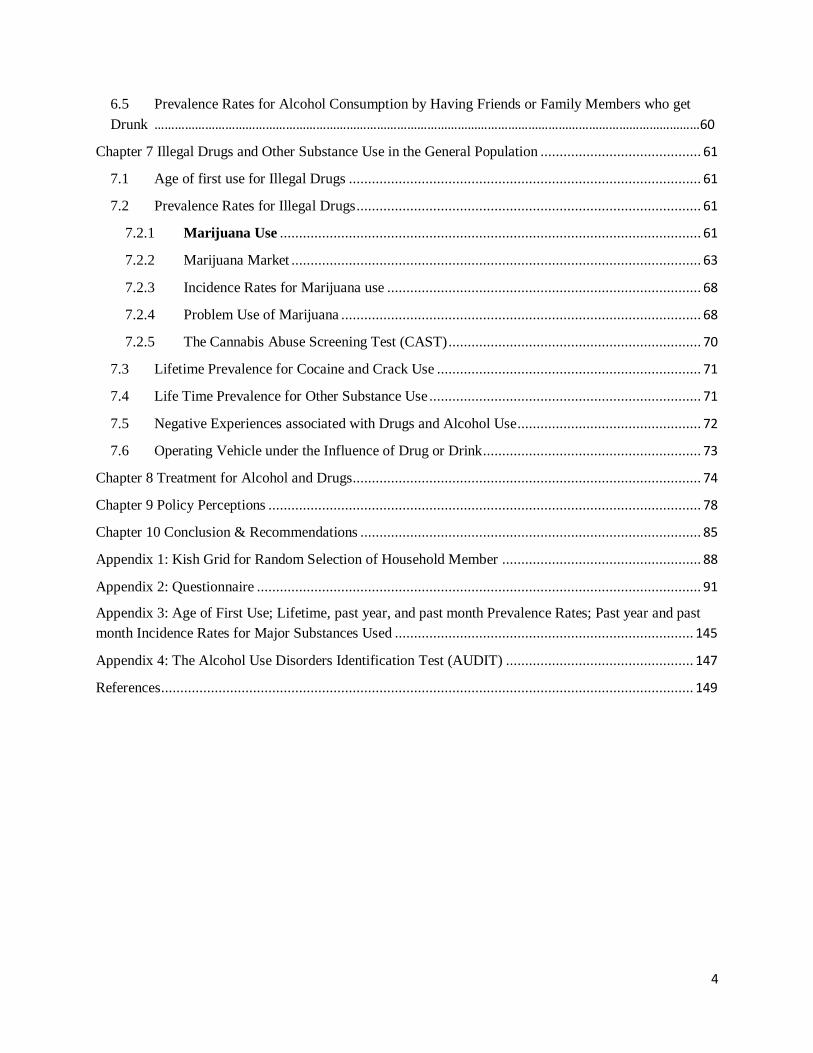
List of Figures
Figure 1-1: Population Pyramid for Guyana. Data Source- Bureau of Statistics ....................................... 14
Figure 1-2: Population Distribution by Ethnicity, 2012 Census .............................................................. 15
Figure 1-3: Population Distribution by Region, 2012 Census Data .......................................................... 15
Figure 1-4: Population Density by Region, 2012 Census ......................................................................... 16
Figure 2-1: Sample Distribution by Gender ............................................................................................ 25
Figure 2-2: Age Distribution of Sample ................................................................................................... 25
Figure 2-3: Gender and Age Distribution of the Sample ......................................................................... 26
Figure 2-4: Marital Status of Respondents ............................................................................................. 28
Figure 2-5: Reported Gender of the Heads of Household ....................................................................... 28
Figure 2-6: Current Work Status of Survey Respondents ........................................................................ 29
Figure 2-7: Employed Respondents by Type of Employment Activity (N=1,245) ..................................... 30
Figure 2-8: Distribution of the Sample by Household Income ................................................................. 31
Figure 4-1: Percentage of Respondents who felt it was easy to get certain illegal drugs ......................... 36
Figure 5-1: Life Time, One year, and One Month Prevalence Rates for Tobacco Use .............................. 40
Figure 5-2: One Month Prevalence for Tobacco Smoking by Sex ............................................................ 41
Figure 5-3: One Month Prevalence for Tobacco Smoking by Age ............................................................ 41
Figure 5-4: One-month prevalence rate for tobacco use by marital status ............................................. 42
Figure 5-5: One-month prevalence for tobacco use by employment status ............................................ 42
Figure 5-6: One-month prevalence for tobacco use by highest level education attained ........................ 43
Figure 5-7: One-month prevalence rate for tobacco by Type of work ..................................................... 44
Figure 5-8: One-month prevalence rate tobacco use by monthly household income.............................. 44
Figure 5-9: One-month prevalence rate for tobacco use by Region ........................................................ 45
Figure 5-10: One Year and One Month Incidence Rate for Tobacco Use ................................................. 45
Figure 5-11: Amount of money spent on cigarettes in the past month ................................................... 46
Figure 6-1: Prevalence rates for alcohol consumption ............................................................................ 47
Figure 6-2: One prevalence rate for alcohol consumption by sex ........................................................... 48
Figure 6-3: One-month prevalence rate for alcohol consumption by age ............................................... 48
Figure 6-4: One-month prevalence rate for alcohol consumption by marital status................................ 49
Figure 6-5: One-month prevalence rate for alcohol consumption by highest level of education attained50
Figure 6-6: One-month prevalence rate for alcohol consumption by employment status ....................... 51
Figure 6-7: One-month prevalence rate for alcohol consumption by type of work ................................. 52
Figure 6-8: One-month prevalence rate for alcohol consumption by total monthly household income .. 53
Figure 6-9: One-month prevalence rate for alcohol consumption by region ........................................... 54
Figure 6-10: Incidence rates for alcohol consumption ............................................................................ 54
Figure 6-11: Current Users by Type of Alcoholic Beverage ..................................................................... 58
Figure 7-1: Prevalence rates for marijuana use ...................................................................................... 62
Figure 7-2: Frequency of Marijuana Use in the Population ..................................................................... 62
Figure 7-3: Frequency of Marijuana Use 30 days prior to the Survey ...................................................... 63
Figure 7-4: Number of Marijuana Joints Smoked ................................................................................... 63
6
Figure 7-5: Incidence rates for marijuana use ........................................................................................ 68
Figure 7-6: Life Time Prevalence Cocaine and Crack ............................................................................... 71
Figure 8-1: Type of Drug Respondents received Treatment for in the past 12 months (N=11) ................ 75
Figure 8-2: Treatment Settings (N=11) ................................................................................................... 75
Figure 8-3: Respondents who felt the need for Treatment for alcohol/drug use by Region (N=52) ......... 77
Figure 9-1: Respondents' Perception on whether Drug Taking had increased, remained the same, or
declined in the past few years ............................................................................................................... 80
Figure 9-2: Respondents' Perception on whether Drug Taking was going to get worse, remain the same,
or decline in the coming years ............................................................................................................... 80
Figure 9-3: Respondents' Perception on whether the drug issue is among the core concerns of the
Government .......................................................................................................................................... 81
Figure 9-4: Respondents’ Knowledge/Awareness of Drug Prevention Programme(s) implemented in their
Neighbourhood/Community.................................................................................................................. 82
Figure 9-5: Respondents’ Knowledge/Awareness of the Name of the Country's Drug Control/Prevention
Agency .................................................................................................................................................. 82
7
List of Tables
Table 1-1: Guyana Population Figures 1991, 2002 & 2012 Census Reports ............................................. 13
Table 2-1: Regional Distribution of the Sample ...................................................................................... 24
Table 2-2: Education Levels of Respondents .......................................................................................... 27
Table 2-3: Sample Distribution by Ethnicity ............................................................................................ 27
Table 3-1: Perception of Risk of Harm Associated with Substance Use ................................................... 34
Table 4-1: Perception of Ease of access to drug ..................................................................................... 35
Table 4-2: Respondents Reporting Having a Chance to Use an Illegal Drug ............................................. 36
Table 4-3: Number of times Respondents had a chance to try an illegal drug, (N=607) .......................... 37
Table 4-4: Respondents with family and friends who use illegal drugs ................................................... 37
Table 4-5: Number of family and friends respondents have that use illegal drugs, (N=607) .................... 37
Table 4-6: Percentage of respondents who were offered an illegal drug by Respondents with family or
friends who use illegal drugs ................................................................................................................. 38
Table 4-7: The last time Respondents were offered an illegal drug ........................................................ 39
Table 5-1: Daily Smoking of Tobacco ...................................................................................................... 46
Table 6-1: Number of Binge Drinking Episodes in the Past 14 Days (Male current Users) ....................... 56
Table 6-2: Number of Binge Drinking Episodes in the Past 14 Days (Female current Users) .................... 56
Table 6-3: Number of days Current Users got drunk in the past 30 days by Sex ...................................... 57
Table 6-4: Frequency of Alcohol Use by Type of Alcoholic Beverage and Sex of Respondent .................. 58
Table 7-1: Average Age at First Use for Illegal Drugs .............................................................................. 61
Table 7-2: The ways in which Respondents Accessed Marijuana (the last time they got the drug) ......... 64
Table 7-3: Area where Marijuana is bought ........................................................................................... 64
Table 7-4: Who provided the Marijuana that Respondents bought ........................................................ 66
Table 7-5: Area where Respondents got Marijuana for free ................................................................... 66
Table 7-6: Who Provided Marijuana for Respondents Free .................................................................... 67
Table 7-7: Other Types of Drugs sold at the Place where Marijuana is bought........................................ 67
Table 7-8: Problem Use of Marijuana ..................................................................................................... 69
Table 7-9: CAST Scores for Respondents who smoked Marijuana in the last 12 months ......................... 70
Table 7-10: Life Time Prevalence Other Substances ............................................................................... 72
Table 7-11: Negative Experiences from Drug and Alcohol Use................................................................ 73
Table 7-12: Percentage of Sample driving under the influence of drug or drink...................................... 73
Table 8-1: Percentage of Respondents who used Alcohol and/or Drugs who received Treatment or felt
the need for treatment (N=1,615) ......................................................................................................... 74
Table 8-2: Reason why Respondents did not access help or treatment (N=52; Multiple Response Set) .. 76
Table 9-1: Respondents’ Perception on the extent of Drug Dealing in their Neighbourhood .................. 79
Table 9-2: Respondents Views on Policy Relevant Issues........................................................................ 84
Table 0-1: Consumption Scores for Respondents Consuming Alcohol during the past 12 months ......... 148
Table 0-2: Dependency Scores of Respondents Consuming Alcohol during the past 12 months ........... 148
8
Executive Summary
This research aims at learning about the magnitude and characteristics of licit and illicit drug use
in Guyana. It was conducted in the framework of a regional programme of periodic surveys in
collaboration with the Organization of American States (OAS) Inter-American Drug Abuse
Control Commission (CICAD). The specific objectives of the research include, inter alia: to
determine the prevalence of psychoactive substance use of respondents: at least once in their
lifetime, over the past 12 months, and over the past 30 days to determine the prevalence of
psychoactive substance use on the basis of socio-demographic characteristics: gender, age,
occupation, schooling, socioeconomic level and place of residence and to detect patterns of use
of the various substances.
For the current survey, the universe of the study consists of the national population between 12
and 65 years of age, male and female, and currently residing in the country. The ultimate
sampling unit was the persons themselves in a household, where one of them was selected to be
included in the sample. The sampling was multi-stage. It involved selecting the EDs at the first
stage, and the selection of households and individuals at the second and third stages,
respectively. At every stage the selection was done randomly. Data was collected through
personal or face-to-face interviews, where a pre-coded questionnaire designed by CICAD was
administered to a nationwide representative sample of the target population. A total of 2,367
interviews were completed out of a targeted sample size of 2,480. The response rate for the
survey was 95.4 per cent.
Risk of Harm from substance Use
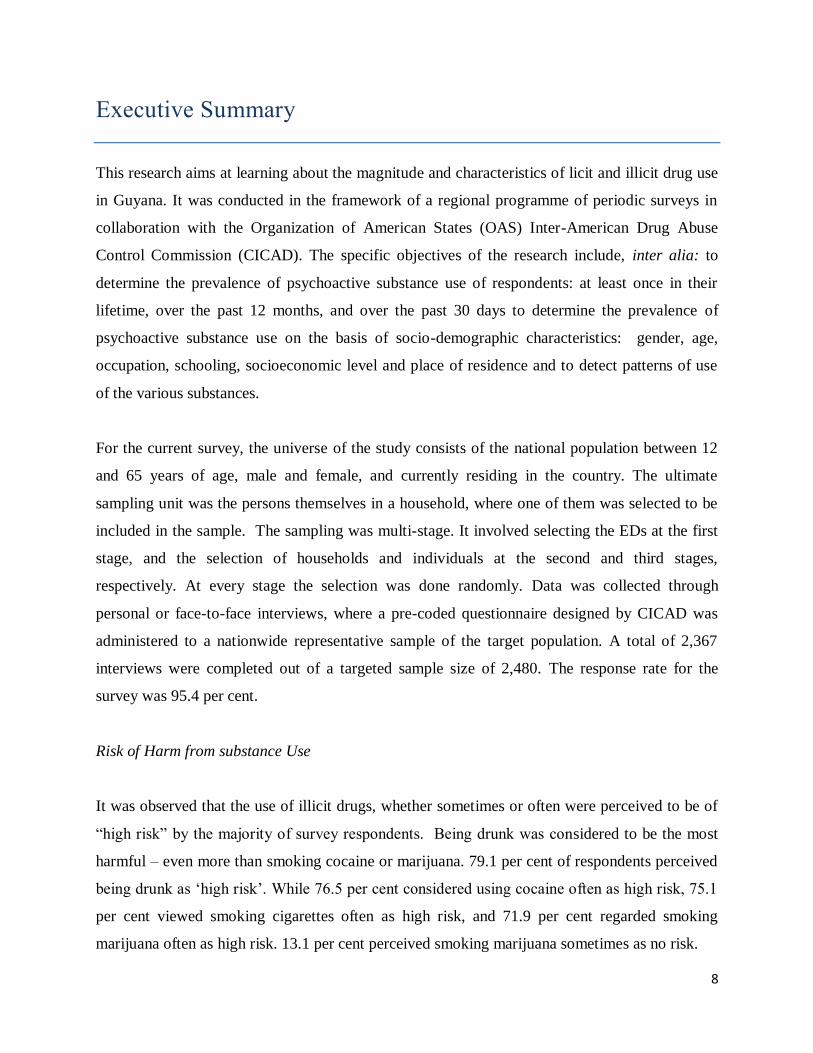
It was observed that the use of illicit drugs, whether sometimes or often were perceived to be of
“high risk” by the majority of survey respondents. Being drunk was considered to be the most
harmful – even more than smoking cocaine or marijuana. 79.1 per cent of respondents perceived
being drunk as ‘high risk’. While 76.5 per cent considered using cocaine often as high risk, 75.1
per cent viewed smoking cigarettes often as high risk, and 71.9 per cent regarded smoking
marijuana often as high risk. 13.1 per cent perceived smoking marijuana sometimes as no risk.
9
Access to Illegal Drugs
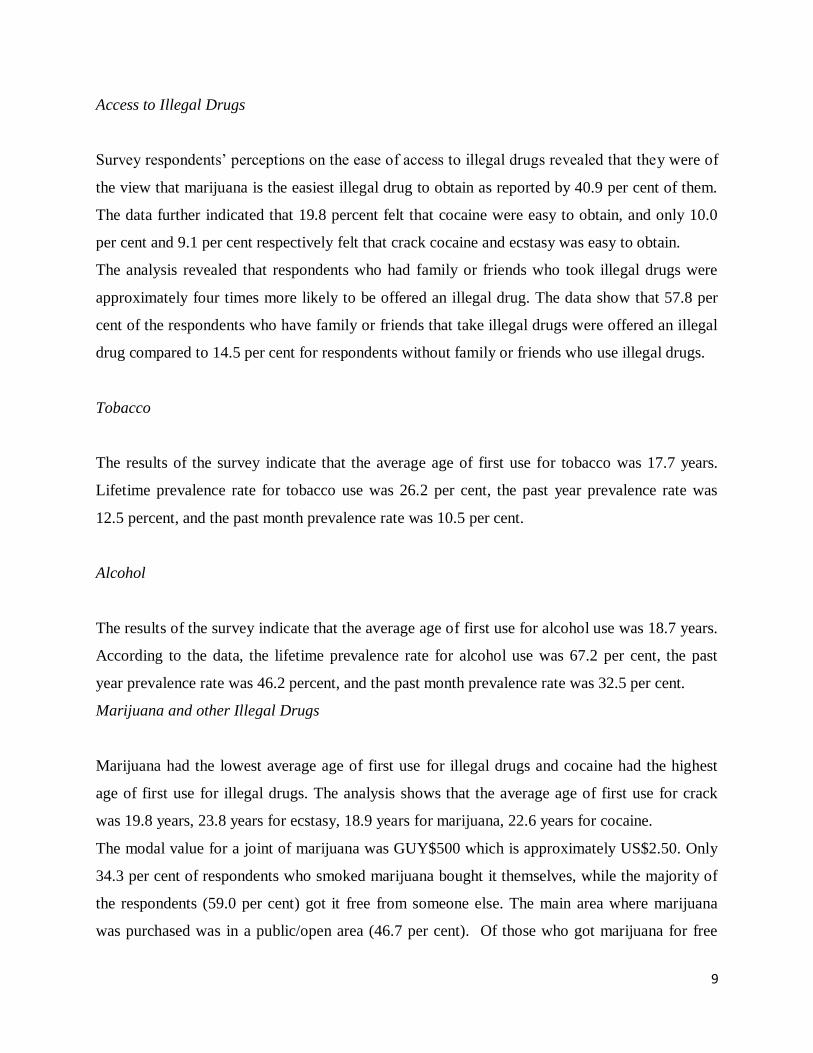
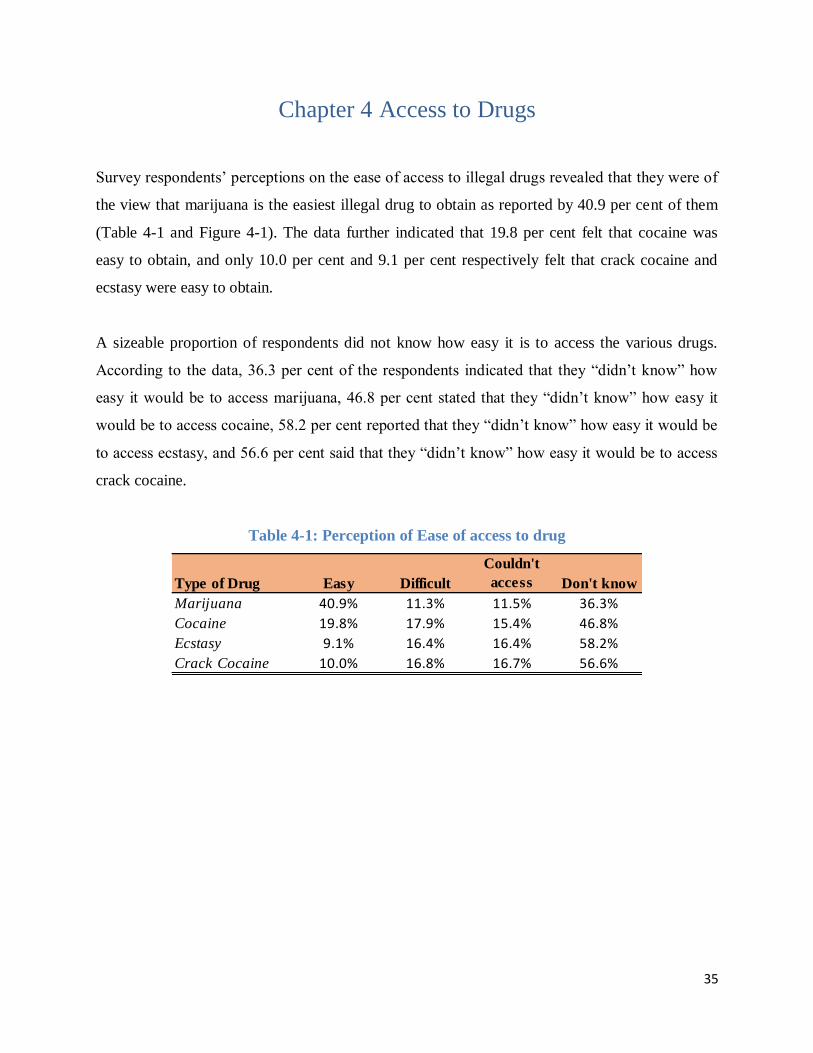
Survey respondents’ perceptions on the ease of access to illegal drugs revealed that they were of
the view that marijuana is the easiest illegal drug to obtain as reported by 40.9 per cent of them.
The data further indicated that 19.8 percent felt that cocaine were easy to obtain, and only 10.0
per cent and 9.1 per cent respectively felt that crack cocaine and ecstasy was easy to obtain.
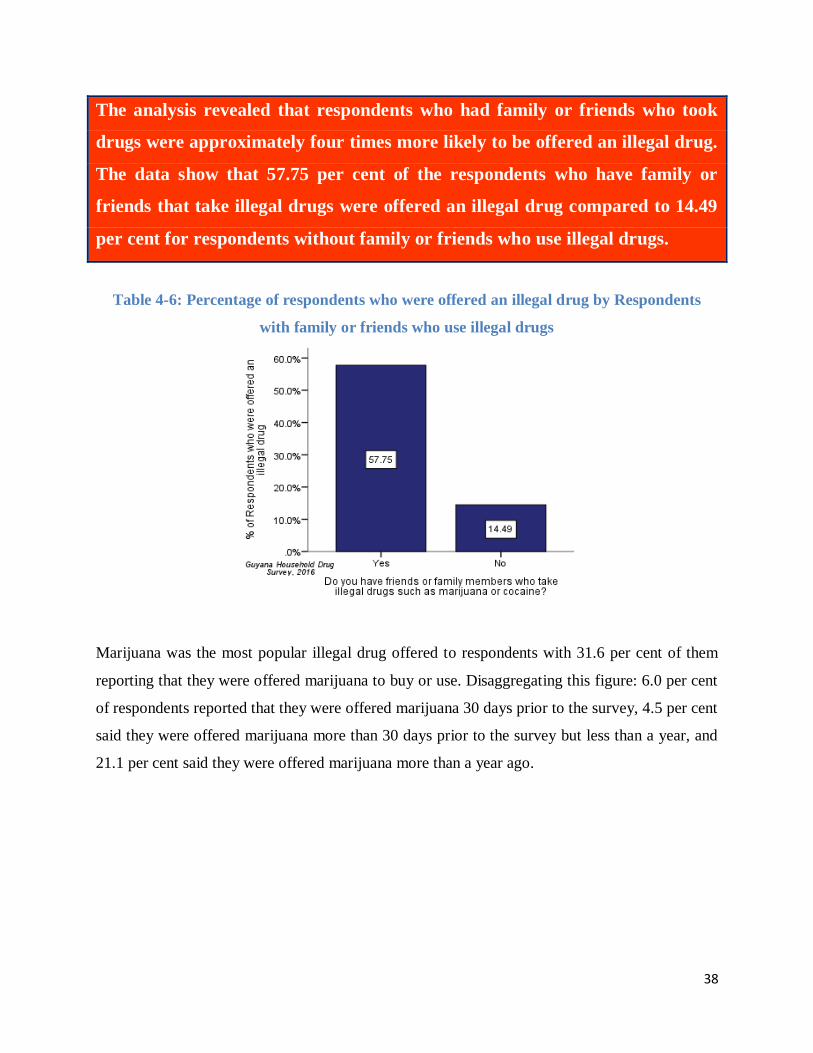
The analysis revealed that respondents who had family or friends who took illegal drugs were
approximately four times more likely to be offered an illegal drug. The data show that 57.8 per
cent of the respondents who have family or friends that take illegal drugs were offered an illegal
drug compared to 14.5 per cent for respondents without family or friends who use illegal drugs.
Tobacco
The results of the survey indicate that the average age of first use for tobacco was 17.7 years.
Lifetime prevalence rate for tobacco use was 26.2 per cent, the past year prevalence rate was
12.5 percent, and the past month prevalence rate was 10.5 per cent.
Alcohol
The results of the survey indicate that the average age of first use for alcohol use was 18.7 years.
According to the data, the lifetime prevalence rate for alcohol use was 67.2 per cent, the past
year prevalence rate was 46.2 percent, and the past month prevalence rate was 32.5 per cent.
Marijuana and other Illegal Drugs
Marijuana had the lowest average age of first use for illegal drugs and cocaine had the highest
age of first use for illegal drugs. The analysis shows that the average age of first use for crack
was 19.8 years, 23.8 years for ecstasy, 18.9 years for marijuana, 22.6 years for cocaine.
The modal value for a joint of marijuana was GUY$500 which is approximately US$2.50. Only
34.3 per cent of respondents who smoked marijuana bought it themselves, while the majority of
the respondents (59.0 per cent) got it free from someone else. The main area where marijuana
was purchased was in a public/open area (46.7 per cent). Of those who got marijuana for free
10
33.4 per cent got it in a public area and 30.9 per cent said they got it in a home/apartment/dorm.
57.1 per cent of respondents who bought marijuana said they purchased it from the same the
dealer. 76.5 per cent of the respondents who received marijuana free said that they got it from a
friend.
Further, 2.9 per cent of respondents said they used marijuana for a medical condition.
Respondents reported that they used marijuana for a range of conditions including asthma,
pneumonia, cold, pain, malaria, glaucoma, and diabetes. The majority of respondents who used
marijuana for medical purposes reported that they used it for asthma (51.5 per cent); 13.2 per
cent of respondents indicated that they used marijuana to bring relief to sufferings from a cold;
and 7.4 per cent said they used marijuana to relieve pain.
The data also show that 3.6 per cent of respondents used marijuana in drinks and 1.9 per cent
respondents used marijuana in edibles.
The data revealed that the life time prevalence rates for cocaine and crack were very low at 0.7
per cent and 0.3 per cent, respectively.
The results of this survey suggest that:
1. Prevention efforts need to be targeted and evidence based and should be conducted in
multiple settings including schools, worksite, and in communities. Prevention efforts
should seek to build resilience among adults and youths against the social influences that
drive licit and illicit drug use.
2. Leadership is pivotal to prevention efforts. An agency/department must be identified to
lead on drug education, awareness, and prevention programmes. This will contribute to
sustained efforts, targeted programmes, and efficient use of resources. Good leadership
will also contribute to acquiring technical expertise, securing the right partnerships, and
mobilising financial resources for programme implementation.
11
3. Epidemiology and surveillance provide a robust foundation for prevention services. Thus,
the need for ongoing, systematic collection, analysis, and interpretation of drug use and
treatment data cannot be overemphasised. Drug use and treatment surveillance data
should be the basis for the development and implementation of any drug use prevention
programme. Research on social and environmental factors contributing to increases in the
use of licit and illicit drugs must be an ongoing feature.
12
Chapter 1 Introduction
The following is a compilation of the main findings of the 2016 National Household Survey on
Drug Use. The Guyana Household Survey on Drug Use was commissioned by the Ministry of
Public Security’s Drug Information Network and the Inter Agency Task Force on Narcotics and
Illicit Weapons with support from the Inter-American Drug Abuse Control Commission
(CICAD), Organisation of American States (OAS). The purpose of this survey is to monitor the
use of licit and illicit substances and evaluate public opinions on health risk and policy. The
survey was conducted during the period January 27, 2016 to March 15, 2016 in all 10
Administrative Regions using a proportional probability sampling design. This information is
intended to be used by the relevant stakeholders in the Drug Information Network to improve
and design substance abuse prevention, intervention, and treatment programmes.
1.1 Country Profile
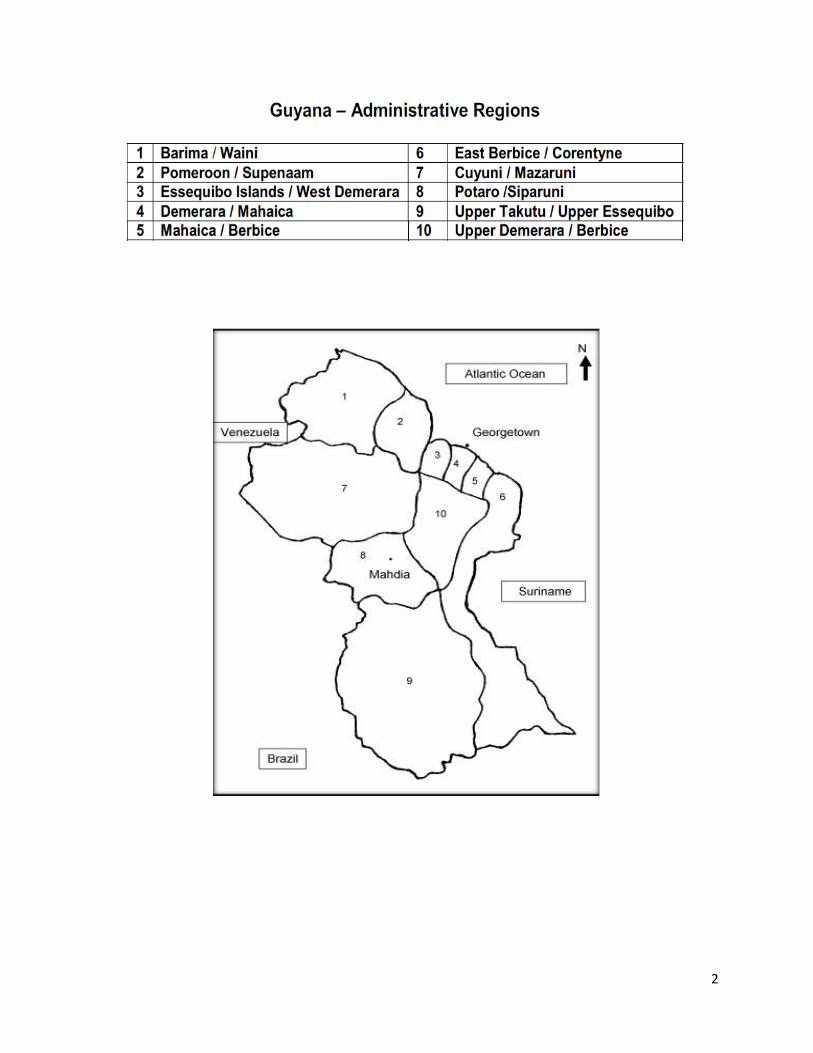
The Cooperative Republic of Guyana is located on the north-eastern coast of the continent of
South America. It is the only English-speaking country on the South American continent.
Guyana has strong historical and cultural ties to the English speaking Caribbean and is a member
of the Caribbean Community (CARICOM). This country is bordered by the Atlantic Ocean to
the north, by Suriname to the east, Venezuela to the west, and Brazil to the south. Guyana
occupies a total landmass of approximately 215,000 square kilometres.
There are mainly six races living in Guyana. The Amerindians were the first inhabitants of the
country and the word Guiana is an Amerindian word meaning land of many waters. In addition
to the Amerindians, Guyanese are descendants of Europeans, Africans, Chinese, Portuguese and
East Indians. The main religions are Christianity, Hinduism, and Islam.
13
Guyana was first colonized by the Dutch in the 1700’s, then by the British from 1815 to 1966
when the country gained Independence. During the British colonial period Guyana was referred
to as British Guiana. On May 26, 1966, Guyana gained its independence and four years later, on
February 23, 1970, became the Cooperative Republic of Guyana.
The President is the Head of State, Head of Government, and Commander in Chief of the Armed
Forces. The constitution mandates that general elections be held every five (5) years and that the
president is only allowed to serve two consecutive terms in office. The Cabinet is the nation’s
highest executive decision making body; its function is to make decisions on the implementation
of government policies and programmes and to advise the President. Cabinet comprises: the
President, the Prime Minister, other ministers, and advisors appointed by the President.
Parliament is the legislative arm and comprises sixty-five (65) elected members that make up the
national Assembly. In addition to the National Government, there are ten (10) Regional
Democratic Councils. These councils were established to oversee the operations of their regions.
Each council consists of twelve (12) to thirty-six (36) members depending on the size of the
region and are elected during General elections.
Guyana’s population according to the Guyana Population and Housing Census 2012 Preliminary
Report is 746,995 persons. According to the data females comprise 50.2 per cent of the
population and males 49.8 per cent. The average household size is 3.6 persons per household
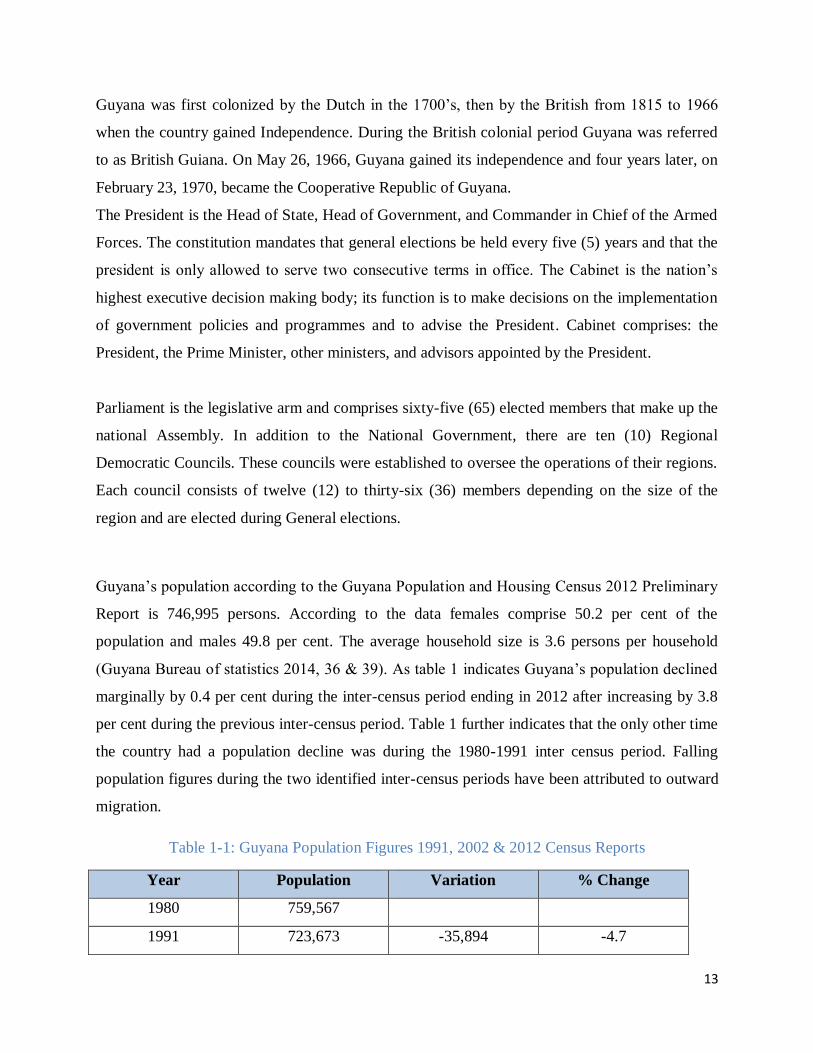
(Guyana Bureau of statistics 2014, 36 & 39). As table 1 indicates Guyana’s population declined
marginally by 0.4 per cent during the inter-census period ending in 2012 after increasing by 3.8
per cent during the previous inter-census period. Table 1 further indicates that the only other time
the country had a population decline was during the 1980-1991 inter census period. Falling
population figures during the two identified inter-census periods have been attributed to outward
migration.
Table 1-1: Guyana Population Figures 1991, 2002 & 2012 Census Reports
Year Population Variation % Change
1980 759,567
1991 723,673 -35,894 -4.7
14
2002 751,223 27,550 3.8
2012 746,995 -4,228 -0.56
Data Source: Guyana Bureau of Statistics, Online: http://www.statisticsguyana.gov.gy/
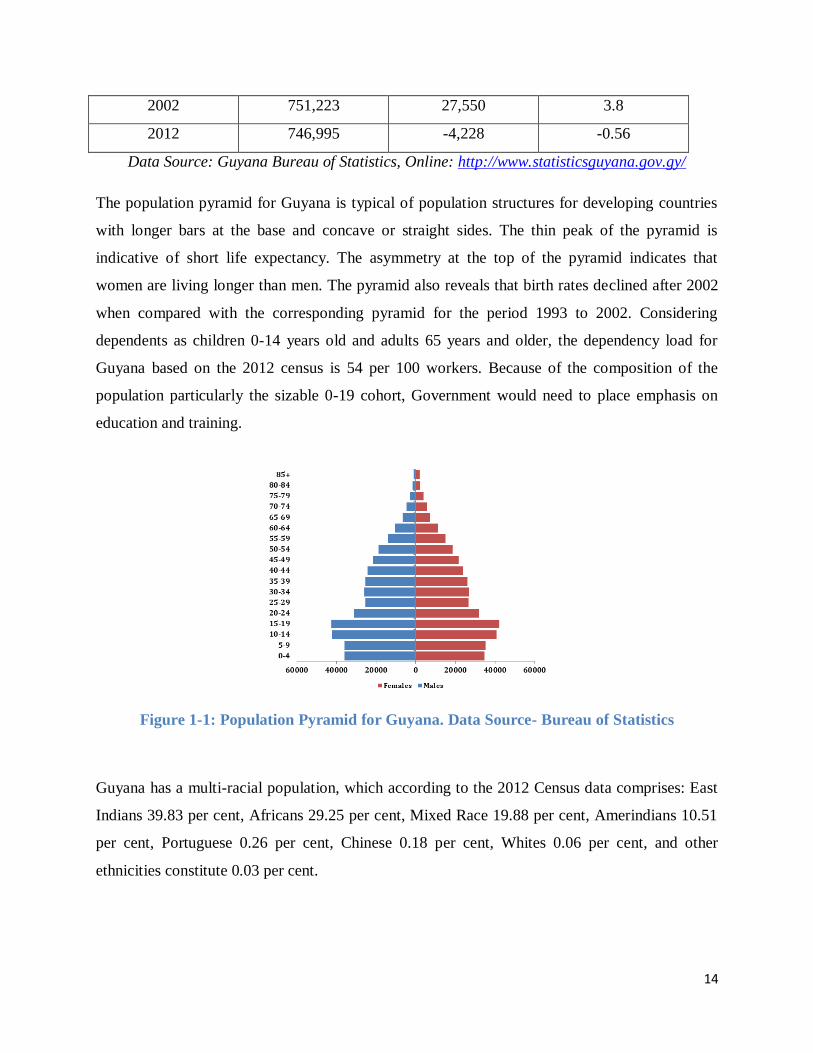
The population pyramid for Guyana is typical of population structures for developing countries
with longer bars at the base and concave or straight sides. The thin peak of the pyramid is
indicative of short life expectancy. The asymmetry at the top of the pyramid indicates that
women are living longer than men. The pyramid also reveals that birth rates declined after 2002
when compared with the corresponding pyramid for the period 1993 to 2002. Considering
dependents as children 0-14 years old and adults 65 years and older, the dependency load for
Guyana based on the 2012 census is 54 per 100 workers. Because of the composition of the
population particularly the sizable 0-19 cohort, Government would need to place emphasis on
education and training.
Figure 1-1: Population Pyramid for Guyana. Data Source- Bureau of Statistics
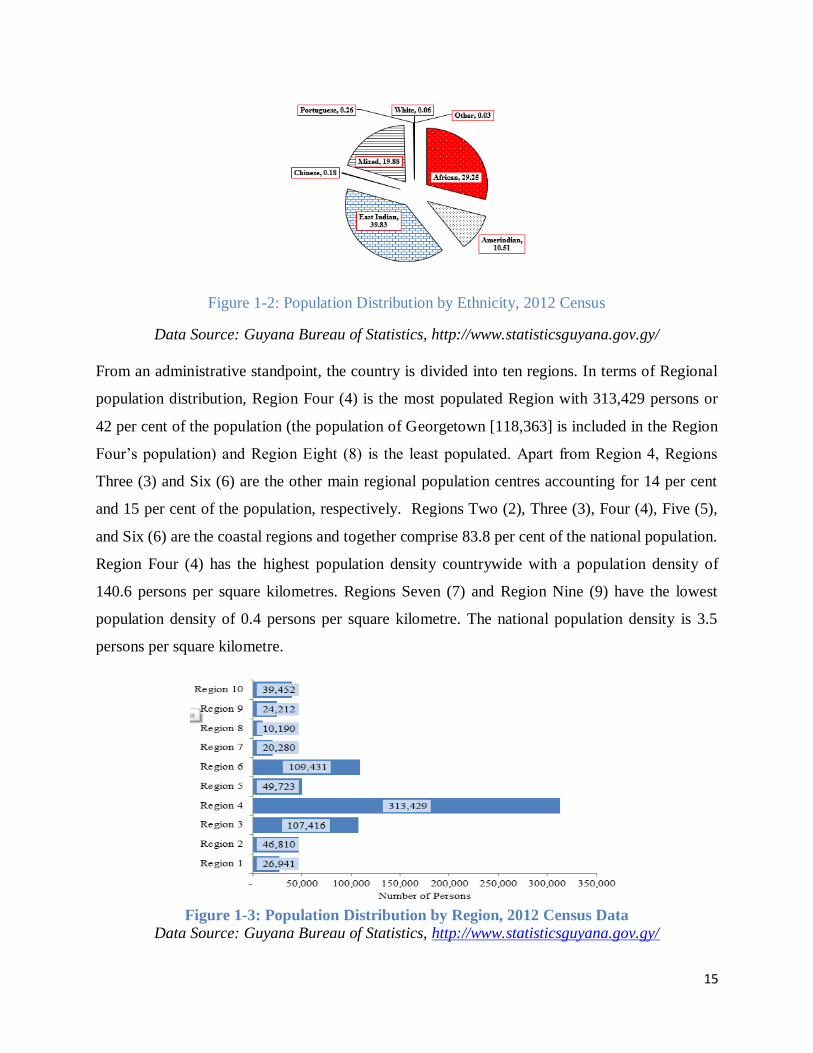
Guyana has a multi-racial population, which according to the 2012 Census data comprises: East
Indians 39.83 per cent, Africans 29.25 per cent, Mixed Race 19.88 per cent, Amerindians 10.51
per cent, Portuguese 0.26 per cent, Chinese 0.18 per cent, Whites 0.06 per cent, and other
ethnicities constitute 0.03 per cent.
15
Figure 1-2: Population Distribution by Ethnicity, 2012 Census
Data Source: Guyana Bureau of Statistics, http://www.statisticsguyana.gov.gy/
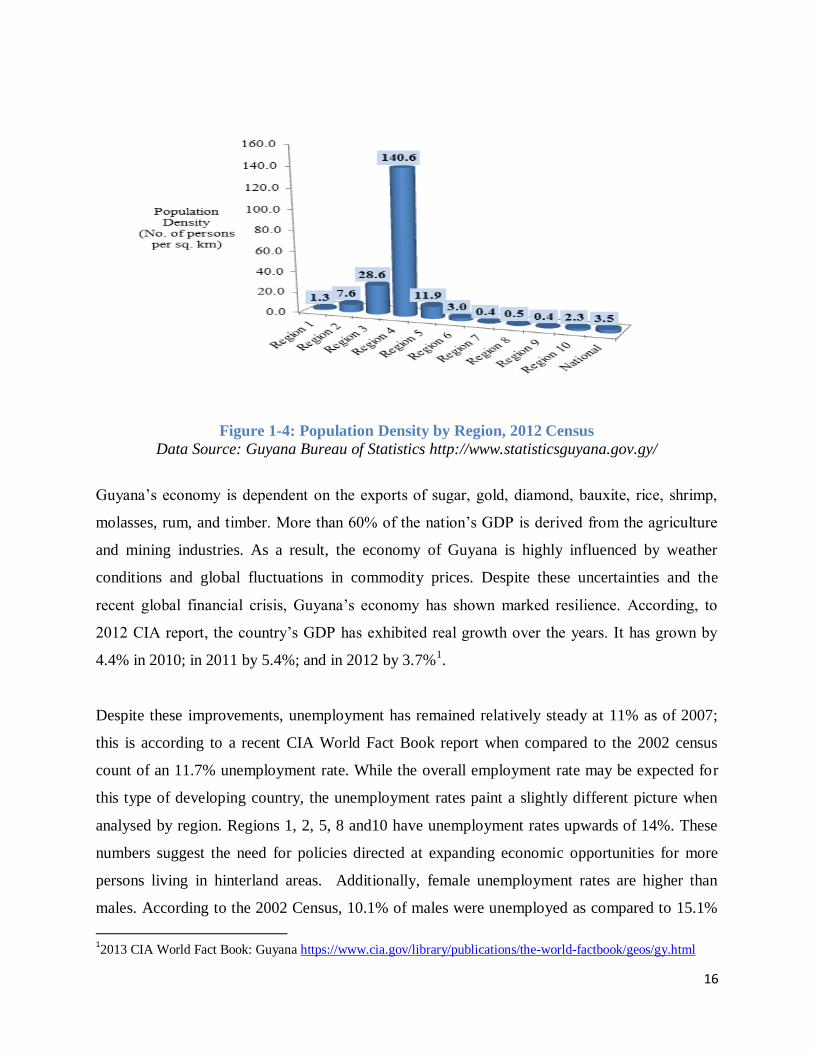
From an administrative standpoint, the country is divided into ten regions. In terms of Regional
population distribution, Region Four (4) is the most populated Region with 313,429 persons or
42 per cent of the population (the population of Georgetown [118,363] is included in the Region
Four’s population) and Region Eight (8) is the least populated. Apart from Region 4, Regions
Three (3) and Six (6) are the other main regional population centres accounting for 14 per cent
and 15 per cent of the population, respectively. Regions Two (2), Three (3), Four (4), Five (5),
and Six (6) are the coastal regions and together comprise 83.8 per cent of the national population.
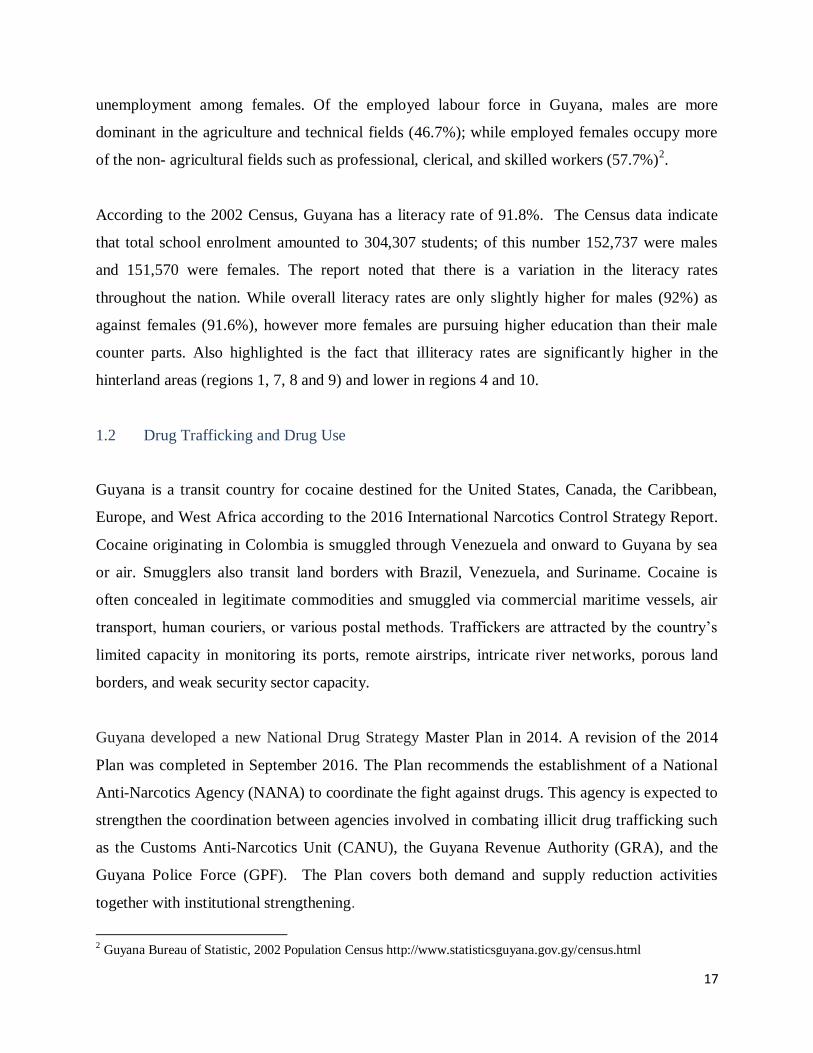
Region Four (4) has the highest population density countrywide with a population density of
140.6 persons per square kilometres. Regions Seven (7) and Region Nine (9) have the lowest
population density of 0.4 persons per square kilometre. The national population density is 3.5
persons per square kilometre.
Figure 1-3: Population Distribution by Region, 2012 Census Data
Data Source: Guyana Bureau of Statistics, http://www.statisticsguyana.gov.gy/
16
Figure 1-4: Population Density by Region, 2012 Census
Data Source: Guyana Bureau of Statistics http://www.statisticsguyana.gov.gy/
Guyana’s economy is dependent on the exports of sugar, gold, diamond, bauxite, rice, shrimp,
molasses, rum, and timber. More than 60% of the nation’s GDP is derived from the agriculture
and mining industries. As a result, the economy of Guyana is highly influenced by weather
conditions and global fluctuations in commodity prices. Despite these uncertainties and the
recent global financial crisis, Guyana’s economy has shown marked resilience. According, to
2012 CIA report, the country’s GDP has exhibited real growth over the years. It has grown by
4.4% in 2010; in 2011 by 5.4%; and in 2012 by 3.7%1.
Despite these improvements, unemployment has remained relatively steady at 11% as of 2007;
this is according to a recent CIA World Fact Book report when compared to the 2002 census
count of an 11.7% unemployment rate. While the overall employment rate may be expected for
this type of developing country, the unemployment rates paint a slightly different picture when
analysed by region. Regions 1, 2, 5, 8 and10 have unemployment rates upwards of 14%. These
numbers suggest the need for policies directed at expanding economic opportunities for more
persons living in hinterland areas. Additionally, female unemployment rates are higher than
males. According to the 2002 Census, 10.1% of males were unemployed as compared to 15.1%
12013 CIA World Fact Book: Guyana https://www.cia.gov/library/publications/the-world-factbook/geos/gy.html
17
unemployment among females. Of the employed labour force in Guyana, males are more
dominant in the agriculture and technical fields (46.7%); while employed females occupy more
of the non- agricultural fields such as professional, clerical, and skilled workers (57.7%)2.
According to the 2002 Census, Guyana has a literacy rate of 91.8%. The Census data indicate
that total school enrolment amounted to 304,307 students; of this number 152,737 were males
and 151,570 were females. The report noted that there is a variation in the literacy rates
throughout the nation. While overall literacy rates are only slightly higher for males (92%) as
against females (91.6%), however more females are pursuing higher education than their male
counter parts. Also highlighted is the fact that illiteracy rates are significantly higher in the
hinterland areas (regions 1, 7, 8 and 9) and lower in regions 4 and 10.
1.2 Drug Trafficking and Drug Use
Guyana is a transit country for cocaine destined for the United States, Canada, the Caribbean,
Europe, and West Africa according to the 2016 International Narcotics Control Strategy Report.
Cocaine originating in Colombia is smuggled through Venezuela and onward to Guyana by sea
or air. Smugglers also transit land borders with Brazil, Venezuela, and Suriname. Cocaine is
often concealed in legitimate commodities and smuggled via commercial maritime vessels, air
transport, human couriers, or various postal methods. Traffickers are attracted by the country’s
limited capacity in monitoring its ports, remote airstrips, intricate river networks, porous land
borders, and weak security sector capacity.
Guyana developed a new National Drug Strategy Master Plan in 2014. A revision of the 2014
Plan was completed in September 2016. The Plan recommends the establishment of a National
Anti-Narcotics Agency (NANA) to coordinate the fight against drugs. This agency is expected to
strengthen the coordination between agencies involved in combating illicit drug trafficking such
as the Customs Anti-Narcotics Unit (CANU), the Guyana Revenue Authority (GRA), and the
Guyana Police Force (GPF). The Plan covers both demand and supply reduction activities
together with institutional strengthening.
2 Guyana Bureau of Statistic, 2002 Population Census http://www.statisticsguyana.gov.gy/census.html
18
Guyana has been collecting data about drug use and prevalence from several sources over the
years. Currently, the main Body for collecting information on licit and illicit drug use in Guyana
is the Guyana Drug Information Network (GUYDIN) located in the Crime Observatory of the
Ministry of Public Security.
The formation of GUYDIN was as a result of a recommendation from the 2006 Report of the
Multilateral Evaluation Mechanism, where it was suggested that the Ministry of Home Affairs
(now Ministry of Public Security) should develop and implement an integrated system to collect,
analyse, maintain and disseminate drug related statistics.
In order to facilitate the development of a Drug Information Network in Guyana, a Drug
Information Needs and Resources Analysis (INRA) for Guyana was completed with the intention
of establishing Guyana’s capacity for collecting information on drug abuse. The INRA was used
as a mechanism to create an inventory of potential data sources for the Drug Information
Network.
The Inter-American Observatory on Drugs (OID), Inter-American Drug Abuse Control
Commission (CICAD) / Organization of American States (OAS) commissioned the development
of a Drug Information Network (DIN) in Guyana through the Ministry of Home Affairs, now
Ministry of Public Security. The overarching goal of the DIN is to develop national drug
information systems and foster systematic research on the drug problem for the purpose of
monitoring trends, developing policy, and implementing appropriate programmes and responses.
In 2011, a decision was taken at a meeting of the Task Force on Narcotics and Illicit weapons to
locate the Drug Information Network in the Crime Observatory. The Crime Observatory was
established in 2007 as part of the Citizen Security Programme. The purpose of the Crime
Observatory is to enhance the collection, compilation, and analysis of key public safety
indicators.
The Network comprises treatment facilities, psychiatric facilities, agencies responsible for youth
and education, and law enforcement agencies. The following list of agencies comprise the Drug
Information Network.
19
Treatment Facilities
i. Drug Demand Reduction Programme, Ministry of Public Health
ii. Phoenix Recovery Project
iii. Salvation Army Men’s Social Service
Psychiatric Facilities
i. Georgetown Public Hospital Corporation
Youth and Education
i. Ministry of Education
ii. Department of Culture, Youth and Sport
Law Enforcement Agencies
i. Ministry of Public Security (Oversight)
ii. Guyana Police Force
iii. Customs Anti-Narcotic Unit (CANU)
iv. Guyana Prison Service
v. Guyana Defence Force
vi. Guyana Revenue Authority, Drug Enforcement Unit
vii. Food and Drug Department, Ministry of Public Health
According to data on illicit drug seizures in the 2015 Annual Report of GUYDIN, marijuana was
the most popular illicit drug. The data revealed that there were 610 seizures of cannabis leaves
compared to 114 seizures of crack and 69 seizures involving cocaine.
The Report also indicated that 363 persons were charged for drug possession. An overwhelming
majority were charged with marijuana possession (97%).
The Report also stated that a total of two hundred and five (205) persons were treated for
substance abuse. One hundred and seventy-one (171) or 83 per cent of the persons treated for
substance abuse addictions were males and thirty-four (34) or seventeen (17) per cent were
females. It was also gleaned from the Report that 16 per cent of all persons treated for substance
abuse were below 18 years old, 17 per cent were in the 18 to 25 age category, and 67 per cent
20
were over 25 years old. Further, 40 per cent of those treated were in relation to alcohol abuse, 25
per cent for marijuana, 17 per cent for tobacco, and 17 per cent for crack/cocaine.
Another source of data on the use of licit and illicit drugs is the CICAD/OAS Secondary School
Surveys administered in 2002, 2007, and 2013 to students between the ages of 13 to 17 years old.
From the most recent of these surveys it was observed that lifetime prevalence rate for tobacco
smoking declined from 17.8 per cent in 2007 to 16.8 per cent in 2013; one-year prevalence
dropped from 6.3 per cent in 2007 to 4.6 per cent in 2013; and one-month prevalence fell from
4.2 per cent in 2007 to 2.2 per cent in 2013.
With regards to alcohol consumption, lifetime prevalence rate dipped from 62.0 per cent in 2007
to 52.2 per cent in 2013; one-year prevalence dropped from 48.7 per cent in 2007 to 31.2 per
cent in 2013; and one-month prevalence plummeted from 38.2 per cent in 2007 to 16.0 per cent
in 2013.
For marijuana smoking, lifetime prevalence was 6.6 per cent in 2013 compared to 11.2 per cent
in the 2007 survey; one-year prevalence rate was 3.8 per cent and the one-month prevalence rate
was 2.2 per cent, compared to 2007 when the one-year prevalence rate for marijuana use was 6.5
per cent and the one-month prevalence rate was 3.8.
Lifetime prevalence rates for crack and cocaine in 2015 were 1.9 per cent and 1.4 per cent
respectively. The lifetime prevalence rate for solvents and inhalants in the 2013 students’ survey
was 10.8 per cent; it was 3.2 per cent for tranquilizers, 2.9 per cent for stimulants, 1.6 per cent
for ecstasy, 1.0 per cent for heroin, 0.7 per cent each for morphine and hallucinogens, and 0.6 per
cent each for opium and hashish.
With regards to access to illicit drugs in the 2013 survey 16.3 per cent of students said it was
easy to access marijuana, 5.9 per cent reported that it was easy to access cocaine, 5.4 per cent of
students said it was easy to access crack, and 5.8 per cent claimed that it was easy to ecstasy.
21
1.3 Objectives of the Household Survey
This research was conducted in the framework of a regional programme of periodic surveys in
collaboration with the Organization of American States (OAS) Inter-American Drug Abuse
Control Commission (CICAD). The research aims at learning about the magnitude and
characteristics of licit and illicit drug use in Guyana.
The specific objectives are indicated below:
1. Determine the prevalence of psychoactive substance use: at least once in lifetime,
over the past 12 months and over the past 30 days.
2. Determine the prevalence of psychoactive substance use on the basis of socio-
demographic characteristics: gender, age, occupation, schooling, socioeconomic
level and place of residence.
3. Detect patterns of use of the various substances.
4. Describe aspects related to the use of substances: exposure to supply and use, risk
perception, exposure to talks or courses on prevention, among others of interest.
5. Determine attitudes towards marijuana legislation and its impact on the society.
1.4 Research Design
1.4.1 Sample Frame
For the current survey, the universe of the study consisted of the national population between 12
and 65 years of age, male and female, and currently residing in the country.
1.4.2. Design of the Sample
The sample was designed and calculated by a specialized statistician from the Guyana Bureau of
Statistics. The sample was selected on the basis of the study’s universe, the expected results, the
assumed margin of error, the reliability of the sample, and existing sampling frames. The survey
targeted a representative sample of 2,480 persons from age 12 to 65 years residing in Guyana.
22
The sample size of 2,480 was believed to be large enough to produce sufficiently reliable
estimates.
The ultimate sampling unit was the persons themselves in a household, where one of them was
randomly selected to be included in the sample. Therefore, the ultimate sampling unit is a person
and his/her selection shall be made from a sample of houses or households. The person
interviewed was chosen by a random procedure generated by the software on a tablet computer
after key information on household members from age 12 to 65 years is entered or through the
Kish selection procedure (see Appendix 1).
Maps of the households were obtained from the Bureau of Statistics. The Maps were based on
the 2012 Census. Prior to the commencement of the actual survey, a ‘listing exercise’ of
households was done in the enumeration districts (EDs) randomly selected for the survey. The
sampling was multi-stage. It involved first selecting the EDs at the first stage selection of
households and individuals at the second and third stages, respectively. At every stage the
selection was done randomly.
1.4.3. Data gathering and Response Rate
Data was collected through personal or face-to-face interview, where a pre-coded questionnaire
designed by CICAD was administered to a nationwide representative sample of the target
population. Arrangements were made for the use of pre-programmed tablets with appropriate
software and controls to facilitate data collection. In the event that there were software or
hardware failures, paper-based questionnaires were always on hand as a backup solution. The
questions for gathering data and its corresponding instructions were designed by the research
team, bearing in mind the need to achieve comparability of results. A total of 2,367 interviews
were completed. The response rate for the survey was 95.4 per cent.
1.4.4. Data Management
Because tablets were used for data collection, there was no requirement for manual data entry for
this survey, except for cases where there were technological malfunction and interviews had to
be conducted using a paper-based questionnaire.

23
Data was uploaded by interviewers at the end of each data collection day. Data uploading
occurred once interviewers entered a Wi-Fi environment and the device was connected. The
device automatically synced to the main database. Robust data checks and cleaning was
conducted prior to analysis as part of a system of quality control.
24
Chapter 2 Sample Description
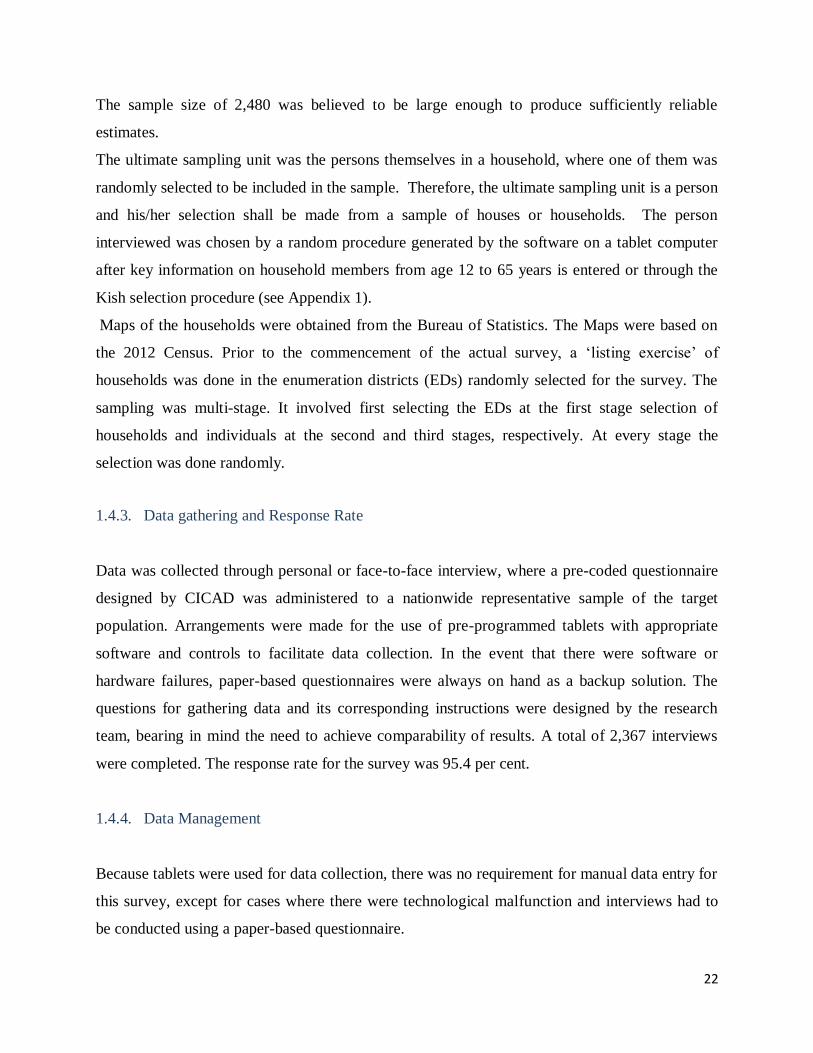
Table 2.1 presents the Regional Distribution of the sample. Based on the sampling methodology
Regions 4, 6 and 3 were expected to comprise the larger proportions of the sample. According to
the data Region 4 comprised 42.9 per cent of the sample. This Region is the most populated
region in the country with a population Density of 140.6 persons per square kilometre. Sample
proportions for the other coastal regions are as follows: respondents from Region 2 comprised
5.4 per cent of the sample; those from Region 3 were 12.0 per cent of the sample; respondents
from region 5 accounted for 7.0 per cent of the sample; and respondents from Region 6 were
15.5 per cent of the sample. For the hinterland regions: respondents from Region 1 comprised
4.2 per cent of the sample; Region 7 respondents accounted for 2.1 per cent of the sample; those
from region 8 accounted for 2.0 per cent of the sample; those from Region 9 comprised 3.3 per
cent of the sample; and respondents from region 10 were 5.5 per cent of the sample.
Table 2-1: Regional Distribution of the Sample
Region # of Respondents per cent
Region 1 - Barima Waini 99 4.2
Region 2 - Pomeroon-Supenaam 129 5.4
Region 3 - Essequibo Islands-West Demerara 285 12.0
Region 4 - Demerara- Mahaica 1015 42.9
Region 5 - Mahaica-Berbice 165 7.0
Region 6 - East Berbice – Corentyne 367 15.5
Region 7 - Cuyuni-Mazaruni 50 2.1
Region 8 - Potaro-Siparuni 48 2.0
Region 9 - Upper Takutu- Upper Essequibo 79 3.3
Region 10 - Upper Demerara-Upper Berbice 130 5.5
Total 2367 100.0
Guyana Household Drug Survey, 2016
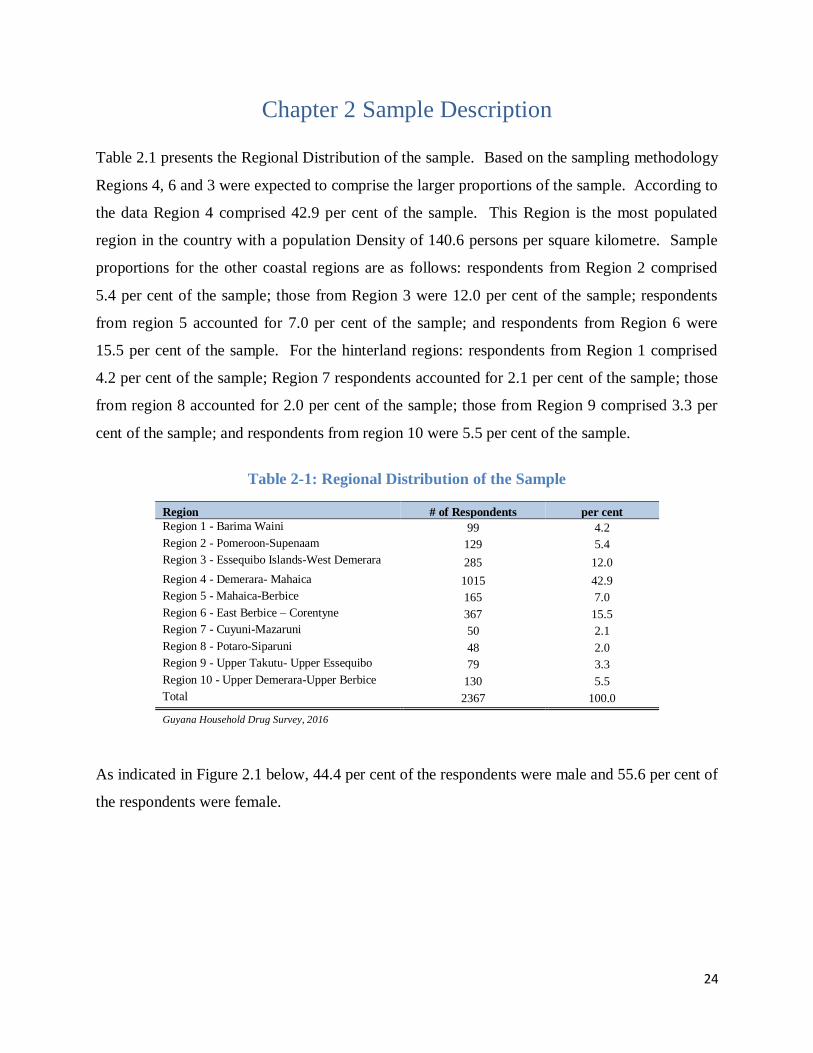
As indicated in Figure 2.1 below, 44.4 per cent of the respondents were male and 55.6 per cent of
the respondents were female.
25
Figure 2-1: Sample Distribution by Gender
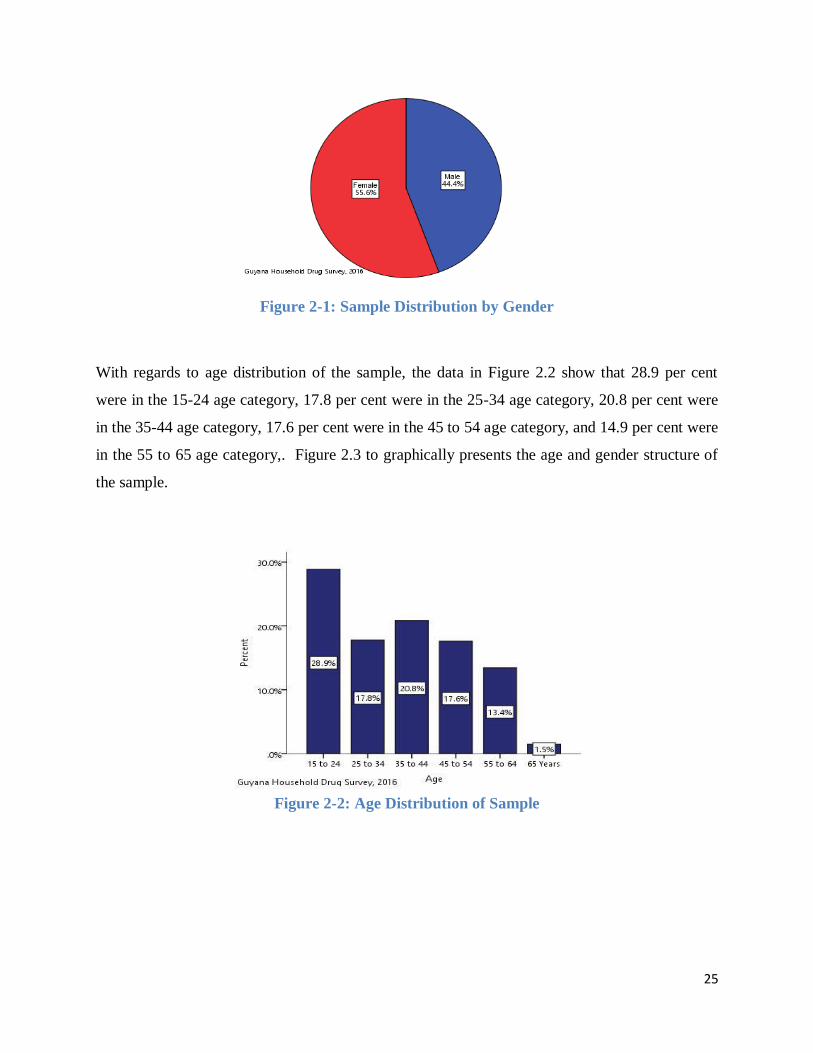
With regards to age distribution of the sample, the data in Figure 2.2 show that 28.9 per cent
were in the 15-24 age category, 17.8 per cent were in the 25-34 age category, 20.8 per cent were
in the 35-44 age category, 17.6 per cent were in the 45 to 54 age category, and 14.9 per cent were
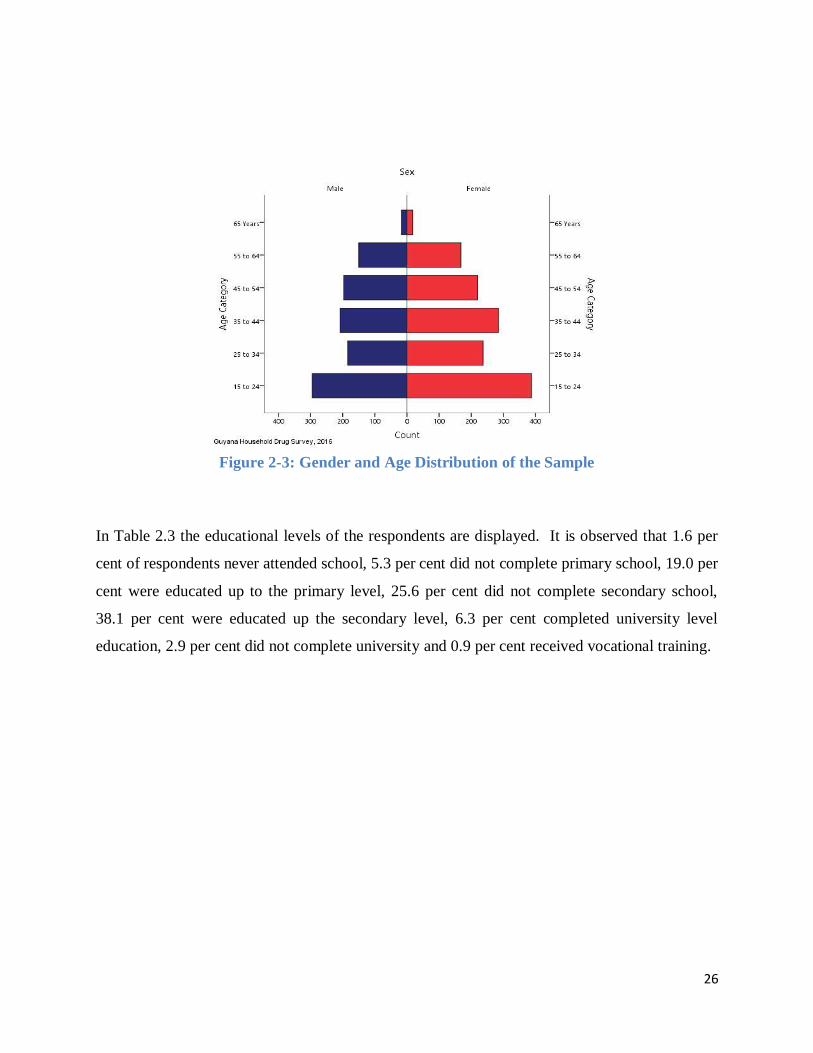
in the 55 to 65 age category,. Figure 2.3 to graphically presents the age and gender structure of
the sample.
Figure 2-2: Age Distribution of Sample
26
Figure 2-3: Gender and Age Distribution of the Sample
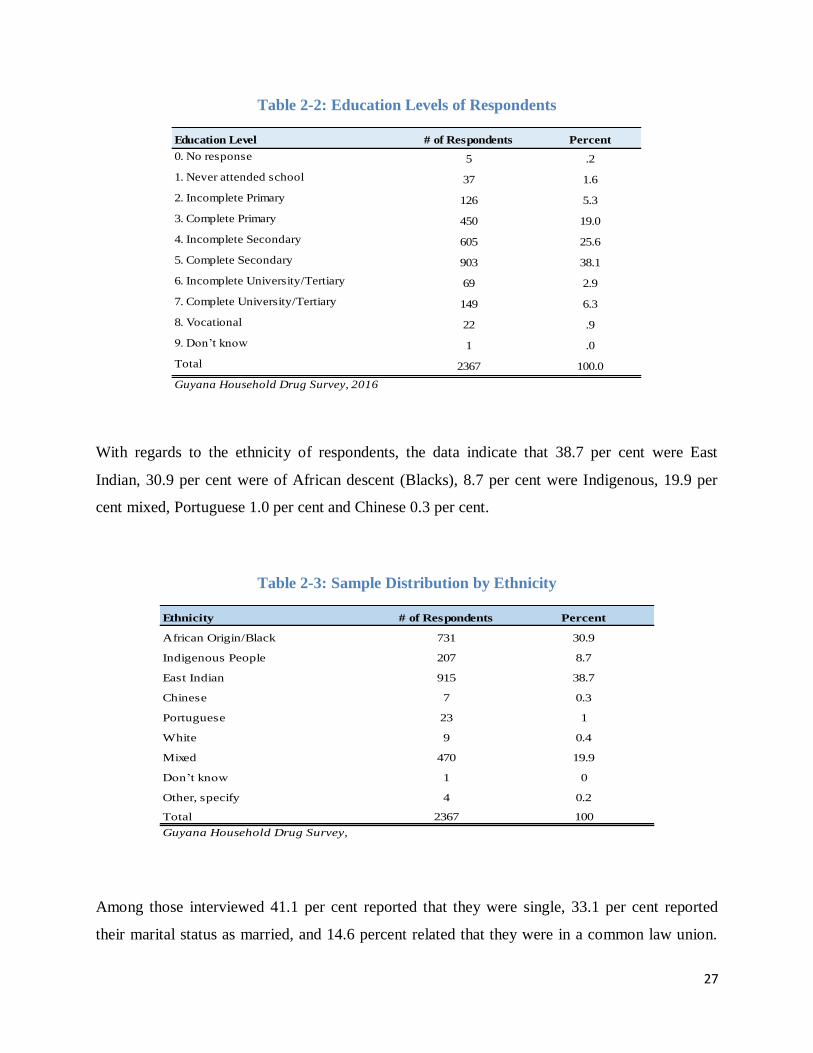
In Table 2.3 the educational levels of the respondents are displayed. It is observed that 1.6 per
cent of respondents never attended school, 5.3 per cent did not complete primary school, 19.0 per
cent were educated up to the primary level, 25.6 per cent did not complete secondary school,
38.1 per cent were educated up the secondary level, 6.3 per cent completed university level
education, 2.9 per cent did not complete university and 0.9 per cent received vocational training.
27
Table 2-2: Education Levels of Respondents
With regards to the ethnicity of respondents, the data indicate that 38.7 per cent were East
Indian, 30.9 per cent were of African descent (Blacks), 8.7 per cent were Indigenous, 19.9 per
cent mixed, Portuguese 1.0 per cent and Chinese 0.3 per cent.
Table 2-3: Sample Distribution by Ethnicity
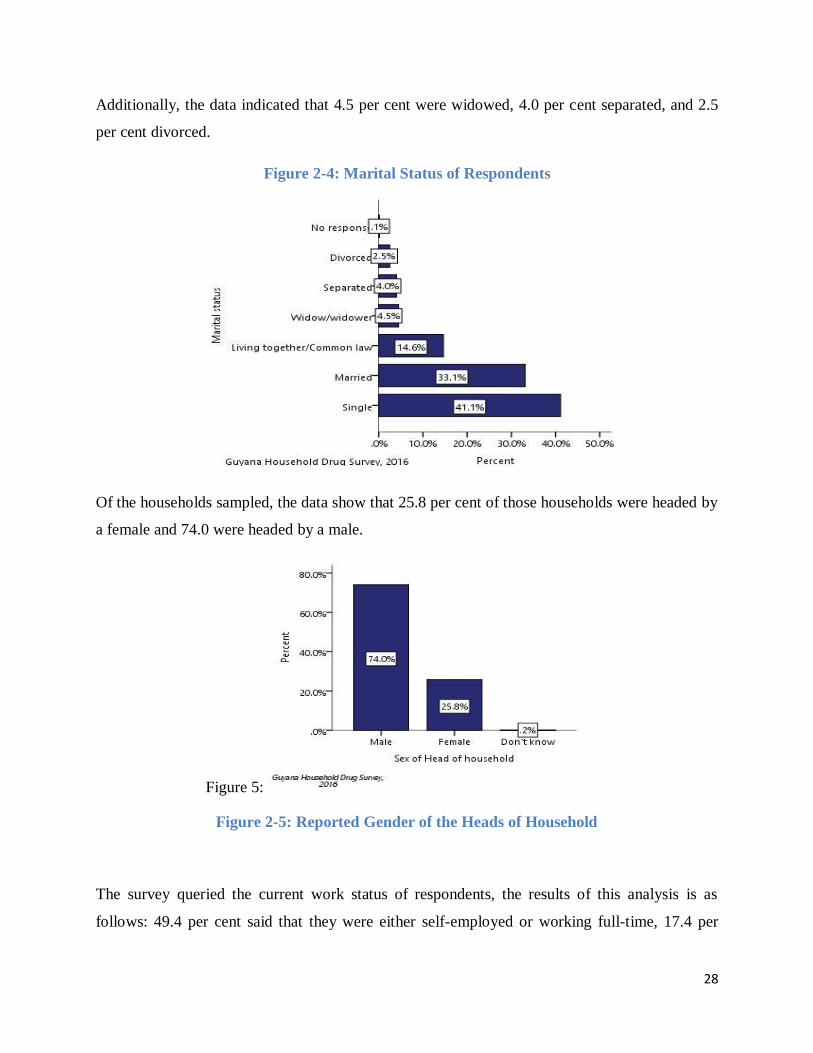
Among those interviewed 41.1 per cent reported that they were single, 33.1 per cent reported
their marital status as married, and 14.6 percent related that they were in a common law union.
Education Level # of Respondents Percent
0. No response 5 .2
1. Never attended school 37 1.6
2. Incomplete Primary 126 5.3
3. Complete Primary 450 19.0
4. Incomplete Secondary 605 25.6
5. Complete Secondary 903 38.1
6. Incomplete University/Tertiary 69 2.9
7. Complete University/Tertiary 149 6.3
8. Vocational 22 .9
9. Don’t know 1 .0
Total 2367 100.0
Guyana Household Drug Survey, 2016
Ethnicity # of Respondents Percent
African Origin/Black 731 30.9
Indigenous People 207 8.7
East Indian 915 38.7
Chinese 7 0.3
Portuguese 23 1
White 9 0.4
Mixed 470 19.9
Don’t know 1 0
Other, specify 4 0.2
Total 2367 100
Guyana Household Drug Survey,
2016
28
Additionally, the data indicated that 4.5 per cent were widowed, 4.0 per cent separated, and 2.5
per cent divorced.
Figure 2-4: Marital Status of Respondents
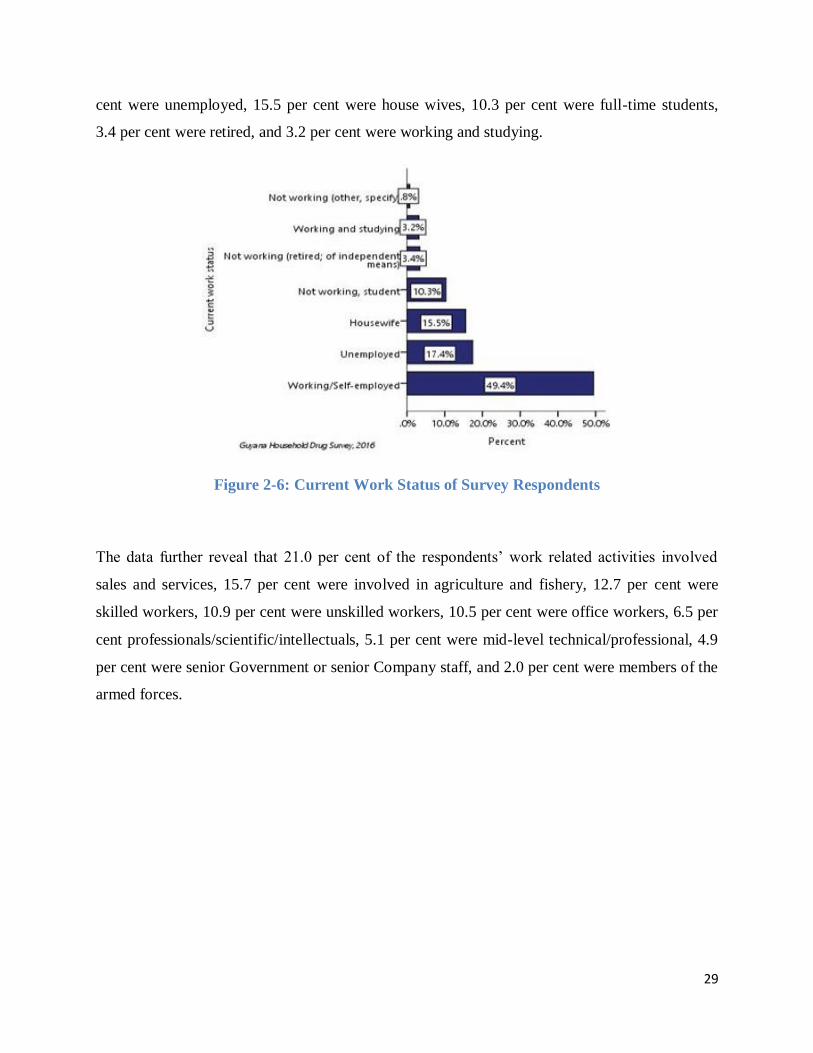
Of the households sampled, the data show that 25.8 per cent of those households were headed by
a female and 74.0 were headed by a male.
Figure 5:
Figure 2-5: Reported Gender of the Heads of Household
The survey queried the current work status of respondents, the results of this analysis is as
follows: 49.4 per cent said that they were either self-employed or working full-time, 17.4 per
29
cent were unemployed, 15.5 per cent were house wives, 10.3 per cent were full-time students,
3.4 per cent were retired, and 3.2 per cent were working and studying.
Figure 2-6: Current Work Status of Survey Respondents
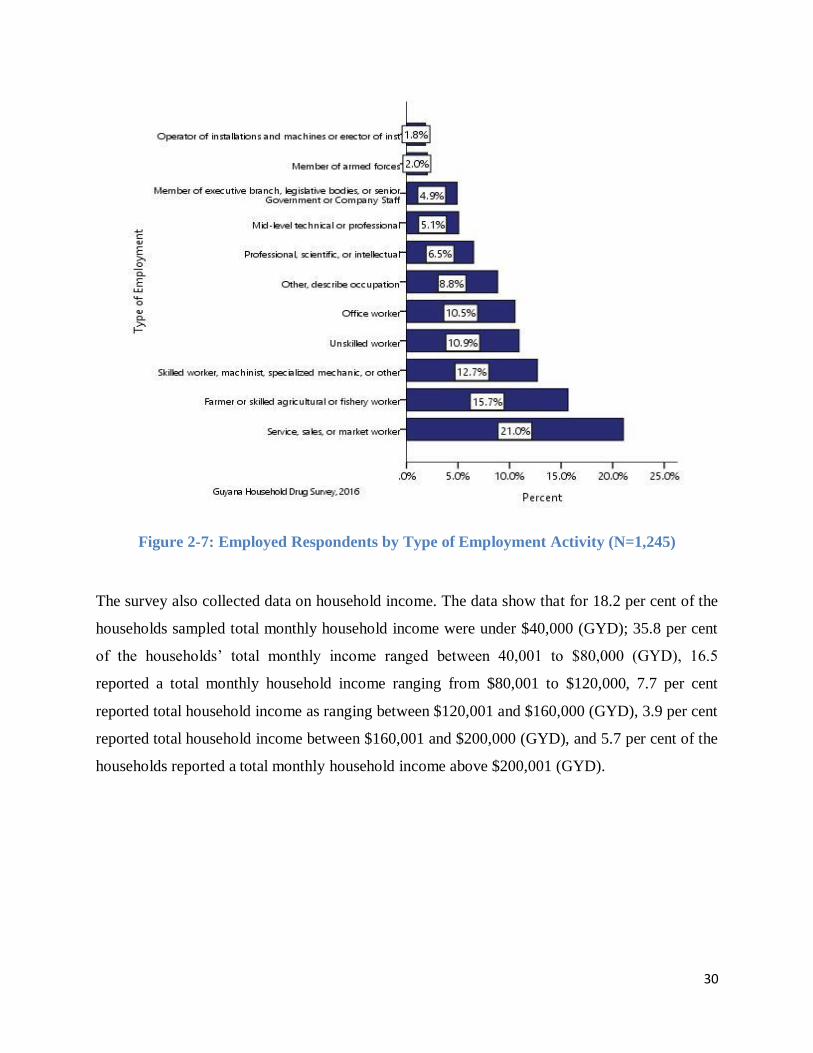
The data further reveal that 21.0 per cent of the respondents’ work related activities involved
sales and services, 15.7 per cent were involved in agriculture and fishery, 12.7 per cent were
skilled workers, 10.9 per cent were unskilled workers, 10.5 per cent were office workers, 6.5 per
cent professionals/scientific/intellectuals, 5.1 per cent were mid-level technical/professional, 4.9
per cent were senior Government or senior Company staff, and 2.0 per cent were members of the
armed forces.
30
Figure 2-7: Employed Respondents by Type of Employment Activity (N=1,245)
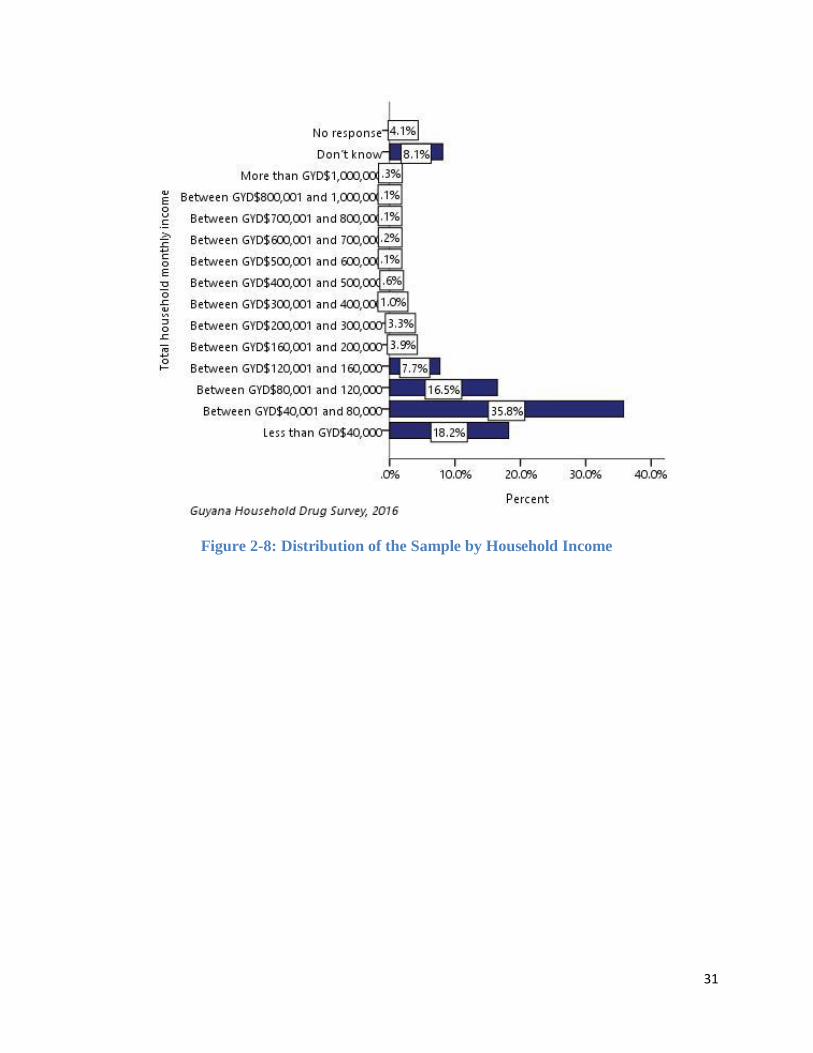
The survey also collected data on household income. The data show that for 18.2 per cent of the
households sampled total monthly household income were under $40,000 (GYD); 35.8 per cent
of the households’ total monthly income ranged between 40,001 to $80,000 (GYD), 16.5
reported a total monthly household income ranging from $80,001 to $120,000, 7.7 per cent
reported total household income as ranging between $120,001 and $160,000 (GYD), 3.9 per cent
reported total household income between $160,001 and $200,000 (GYD), and 5.7 per cent of the
households reported a total monthly household income above $200,001 (GYD).
31
Figure 2-8: Distribution of the Sample by Household Income
32
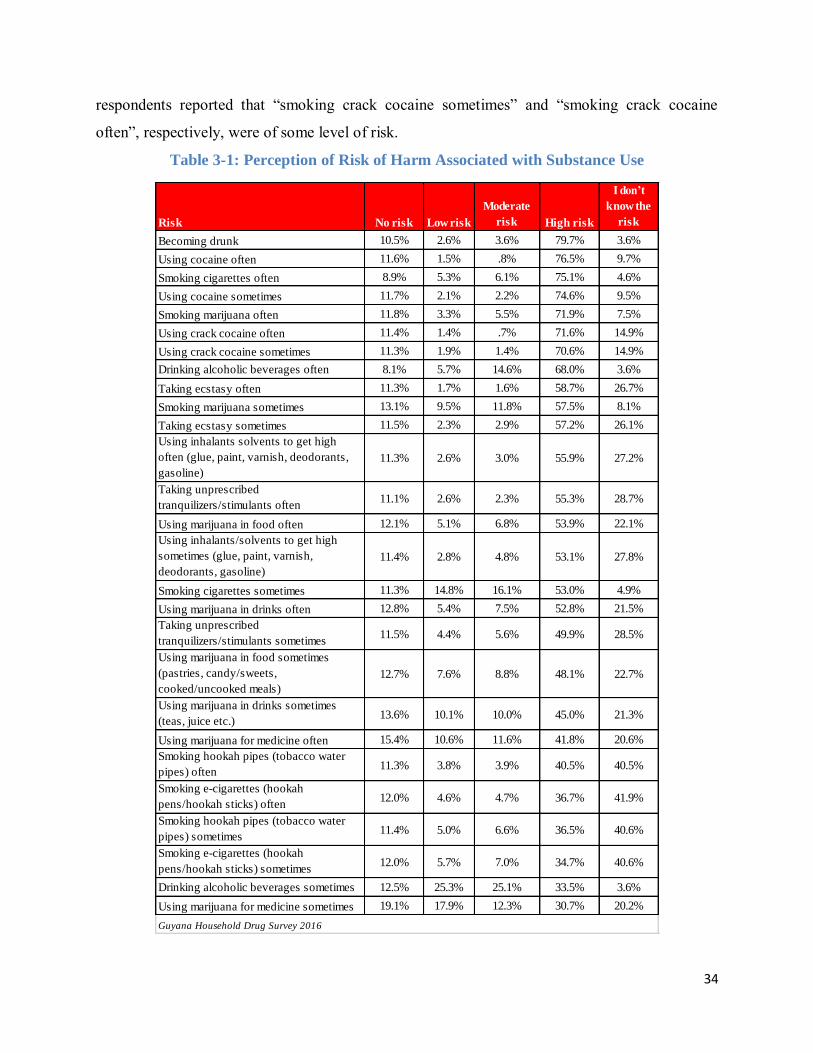
Chapter 3 Risk of Harm from Substance Use3
The survey examined perception of harm associated with the use of various substances by asking
respondents their opinion on how harmful they perceived certain behaviours relating to substance
use would be. For example, respondents were asked about the risk associated with the use of a
particular substance sometimes or often times (Table 3-1). The level of risk was categorized as
no risk, low risk, moderate risk, high risk, or did not know the risk. Respondents were advised
that the response they would provide was in terms of how they perceived each behaviour.
It was observed that the use of illicit drugs, whether sometimes or often were
perceived to be of “high risk” by the majority of survey respondents.
Being drunk was considered to be the most harmful – even more than smoking
cocaine or marijuana. 79.1 per cent of respondents perceived being drunk as
‘high risk’. While 76.5 per cent considered using cocaine often as high risk, 75.1
per cent viewed smoking cigarettes often as high risk, and 71.9 per cent regarded
smoking marijuana often as high risk. 13.1 per cent perceived smoking
marijuana sometimes as no risk.
A significant proportion of respondents indicated that since they do not partake in many of the
behaviours, they did not view them as being of any risk to them. Hence, the responses “no risk”
category may seem high on account of this reason.
The three behaviours related to alcohol use and two behaviours related to cigarette smoking were
notably perceived as having low to high levels of risk. Perception of some level of risk being
associated with alcohol consumption and cigarette smoking were higher than those for illicit
drugs such as marijuana, cocaine, and crack.
The data show that:
83.9 per cent and 86.5 of the respondents reported that “smoking cigarettes sometimes”
and “smoking cigarette often”, respectively, had some level of risk.
3 Data is weighted to correct for Gender based on the 2012 Population and housing Census
33
o 53.0 per cent of respondents felt that there was high risk to harm oneself by smoking
cigarettes sometimes
o 16.1 per cent of respondents felt that there was moderate risk to harm oneself by
smoking cigarettes sometimes
o 14.8 per cent of respondents felt that there was low risk to harm oneself by smoking
cigarettes sometimes
o 75.1 per cent of respondents felt that there was high risk to harm oneself by smoking
cigarettes often
o 6.1 per cent of respondents felt that there was moderate risk to harm oneself by
smoking cigarettes often
o 5.3 per cent of respondents felt that there was low risk to harm oneself by smoking
cigarettes often
83.9 per cent and 88.3 per cent of the respondents reported that “drinking alcohol
sometimes” and “drinking often”, respectively, had some level of some level of risk.
o 33.5 per cent of respondents felt that there was high risk to harm oneself by drinking
alcohol sometimes.
o 25.1 per cent of respondents felt that there was a moderate risk to harm oneself by
drinking alcohol sometimes
o 25.3 per cent of respondents felt that there was a low risk to harm oneself by drinking
alcohol sometimes
o 68.0 per cent of respondents felt that there was a high risk to harm oneself by
drinking alcohol often
o 14.6 per cent of respondents felt that there was a moderate risk to harm oneself by
drinking alcohol often
o 5.7 per cent of respondents felt that there was low risk to harm oneself by drinking
alcohol often
Further, 78.8 per cent and 80.7 per cent of the respondents reported that “smoking marijuana
sometimes” and “smoking marijuana often”, respectively, posed some level of risk. 78.8 per cent
and 78.7 per cent of the respondents reported that “smoking cocaine sometimes” and “smoking
cocaine often”, respectively, were of some level of risk. 73.8 per cent and 73.7 per cent of the
34
respondents reported that “smoking crack cocaine sometimes” and “smoking crack cocaine
often”, respectively, were of some level of risk.
Table 3-1: Perception of Risk of Harm Associated with Substance Use
Risk No risk Low risk
Moderate
risk High risk
I don’t
know the
risk
Becoming drunk 10.5% 2.6% 3.6% 79.7% 3.6%
Using cocaine often 11.6% 1.5% .8% 76.5% 9.7%
Smoking cigarettes often 8.9% 5.3% 6.1% 75.1% 4.6%
Using cocaine sometimes 11.7% 2.1% 2.2% 74.6% 9.5%
Smoking marijuana often 11.8% 3.3% 5.5% 71.9% 7.5%
Using crack cocaine often 11.4% 1.4% .7% 71.6% 14.9%
Using crack cocaine sometimes 11.3% 1.9% 1.4% 70.6% 14.9%
Drinking alcoholic beverages often 8.1% 5.7% 14.6% 68.0% 3.6%
Taking ecstasy often 11.3% 1.7% 1.6% 58.7% 26.7%
Smoking marijuana sometimes 13.1% 9.5% 11.8% 57.5% 8.1%
Taking ecstasy sometimes 11.5% 2.3% 2.9% 57.2% 26.1%
Using inhalants solvents to get high
often (glue, paint, varnish, deodorants,
gasoline)
11.3% 2.6% 3.0% 55.9% 27.2%
Taking unprescribed
tranquilizers/stimulants often11.1% 2.6% 2.3% 55.3% 28.7%
Using marijuana in food often 12.1% 5.1% 6.8% 53.9% 22.1%
Using inhalants/solvents to get high
sometimes (glue, paint, varnish,
deodorants, gasoline)
11.4% 2.8% 4.8% 53.1% 27.8%
Smoking cigarettes sometimes 11.3% 14.8% 16.1% 53.0% 4.9%
Using marijuana in drinks often 12.8% 5.4% 7.5% 52.8% 21.5%
Taking unprescribed
tranquilizers/stimulants sometimes11.5% 4.4% 5.6% 49.9% 28.5%
Using marijuana in food sometimes
(pastries, candy/sweets,
cooked/uncooked meals)
12.7% 7.6% 8.8% 48.1% 22.7%
Using marijuana in drinks sometimes
(teas, juice etc.)13.6% 10.1% 10.0% 45.0% 21.3%
Using marijuana for medicine often 15.4% 10.6% 11.6% 41.8% 20.6%
Smoking hookah pipes (tobacco water
pipes) often11.3% 3.8% 3.9% 40.5% 40.5%
Smoking e-cigarettes (hookah
pens/hookah sticks) often12.0% 4.6% 4.7% 36.7% 41.9%
Smoking hookah pipes (tobacco water
pipes) sometimes11.4% 5.0% 6.6% 36.5% 40.6%
Smoking e-cigarettes (hookah
pens/hookah sticks) sometimes12.0% 5.7% 7.0% 34.7% 40.6%
Drinking alcoholic beverages sometimes 12.5% 25.3% 25.1% 33.5% 3.6%
Using marijuana for medicine sometimes 19.1% 17.9% 12.3% 30.7% 20.2%
Guyana Household Drug Survey 2016
35
Chapter 4 Access to Drugs
Survey respondents’ perceptions on the ease of access to illegal drugs revealed that they were of
the view that marijuana is the easiest illegal drug to obtain as reported by 40.9 per cent of them
(Table 4-1 and Figure 4-1). The data further indicated that 19.8 per cent felt that cocaine was
easy to obtain, and only 10.0 per cent and 9.1 per cent respectively felt that crack cocaine and
ecstasy were easy to obtain.
A sizeable proportion of respondents did not know how easy it is to access the various drugs.
According to the data, 36.3 per cent of the respondents indicated that they “didn’t know” how
easy it would be to access marijuana, 46.8 per cent stated that they “didn’t know” how easy it
would be to access cocaine, 58.2 per cent reported that they “didn’t know” how easy it would be
to access ecstasy, and 56.6 per cent said that they “didn’t know” how easy it would be to access
crack cocaine.
Table 4-1: Perception of Ease of access to drug
Type of Drug Easy Difficult
Couldn't
access Don't know
Marijuana 40.9% 11.3% 11.5% 36.3%
Cocaine 19.8% 17.9% 15.4% 46.8%
Ecstasy 9.1% 16.4% 16.4% 58.2%
Crack Cocaine 10.0% 16.8% 16.7% 56.6%
36
Figure 4-1: Percentage of Respondents who felt it was easy to get certain illegal drugs
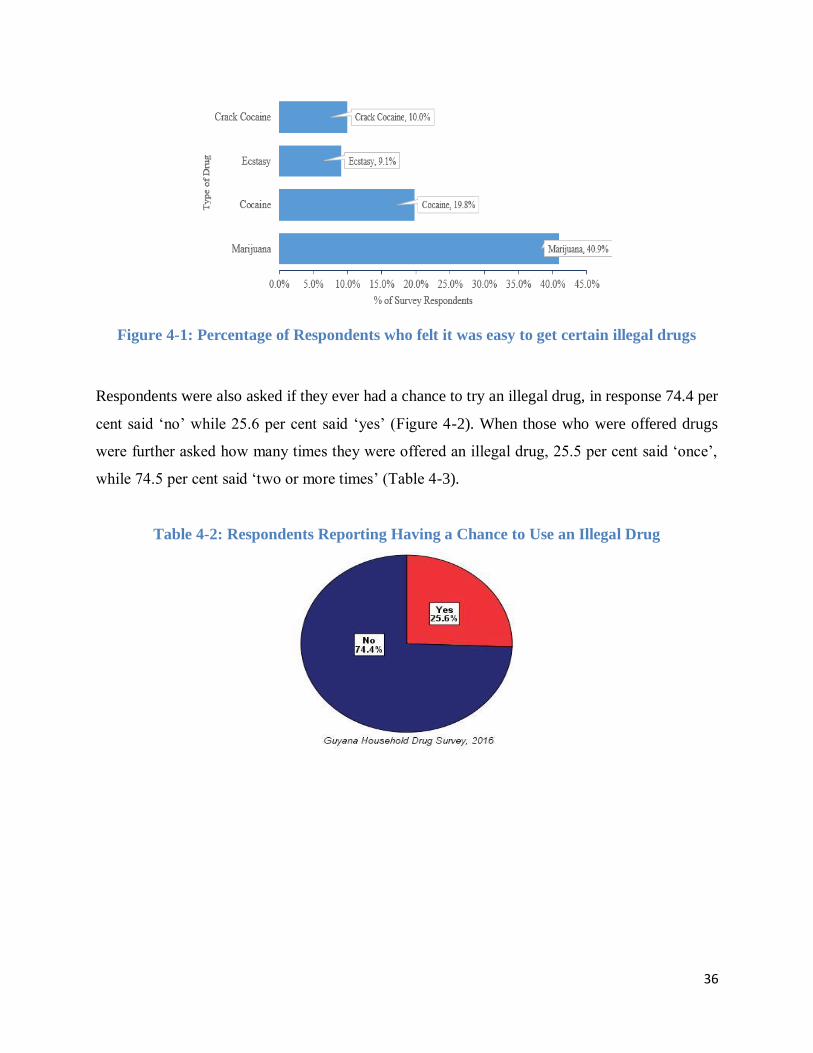
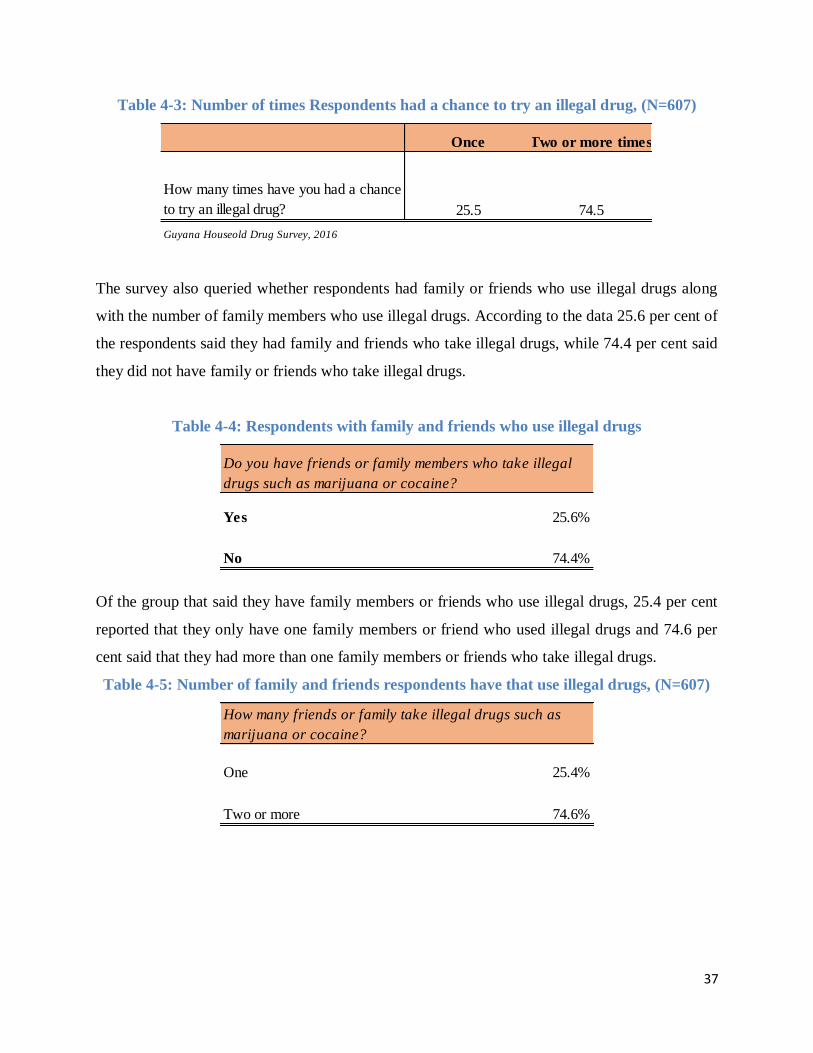
Respondents were also asked if they ever had a chance to try an illegal drug, in response 74.4 per
cent said ‘no’ while 25.6 per cent said ‘yes’ (Figure 4-2). When those who were offered drugs
were further asked how many times they were offered an illegal drug, 25.5 per cent said ‘once’,
while 74.5 per cent said ‘two or more times’ (Table 4-3).
Table 4-2: Respondents Reporting Having a Chance to Use an Illegal Drug
37
Table 4-3: Number of times Respondents had a chance to try an illegal drug, (N=607)
The survey also queried whether respondents had family or friends who use illegal drugs along
with the number of family members who use illegal drugs. According to the data 25.6 per cent of
the respondents said they had family and friends who take illegal drugs, while 74.4 per cent said
they did not have family or friends who take illegal drugs.
Table 4-4: Respondents with family and friends who use illegal drugs
Of the group that said they have family members or friends who use illegal drugs, 25.4 per cent
reported that they only have one family members or friend who used illegal drugs and 74.6 per
cent said that they had more than one family members or friends who take illegal drugs.
Table 4-5: Number of family and friends respondents have that use illegal drugs, (N=607)
Once Two or more times
How many times have you had a chance
to try an illegal drug? 25.5 74.5
Guyana Houseold Drug Survey, 2016
Yes 25.6%
No 74.4%
Do you have friends or family members who take illegal
drugs such as marijuana or cocaine?
One 25.4%
Two or more 74.6%
How many friends or family take illegal drugs such as
marijuana or cocaine?
38
The analysis revealed that respondents who had family or friends who took
drugs were approximately four times more likely to be offered an illegal drug.
The data show that 57.75 per cent of the respondents who have family or
friends that take illegal drugs were offered an illegal drug compared to 14.49
per cent for respondents without family or friends who use illegal drugs.
Table 4-6: Percentage of respondents who were offered an illegal drug by Respondents
with family or friends who use illegal drugs
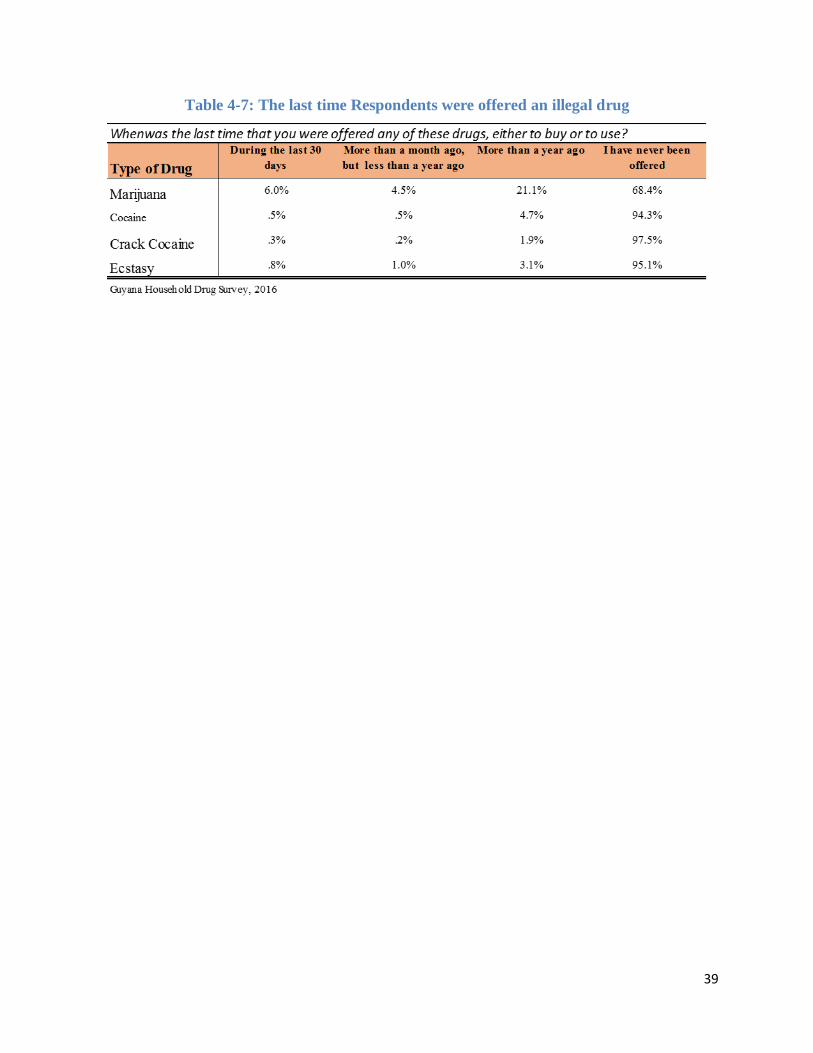
Marijuana was the most popular illegal drug offered to respondents with 31.6 per cent of them
reporting that they were offered marijuana to buy or use. Disaggregating this figure: 6.0 per cent
of respondents reported that they were offered marijuana 30 days prior to the survey, 4.5 per cent
said they were offered marijuana more than 30 days prior to the survey but less than a year, and
21.1 per cent said they were offered marijuana more than a year ago.
39
Table 4-7: The last time Respondents were offered an illegal drug
40
Chapter 5 Tobacco Use in the General Population
In this section we analyse data on the average age of first use of tobacco and the prevalence and
incidence rates for tobacco use among the general population. In the current analysis on
prevalence rates we focus the discussion on one-month prevalence.
5.1 Prevalence rates for Tobacco smoking and average Age of first use
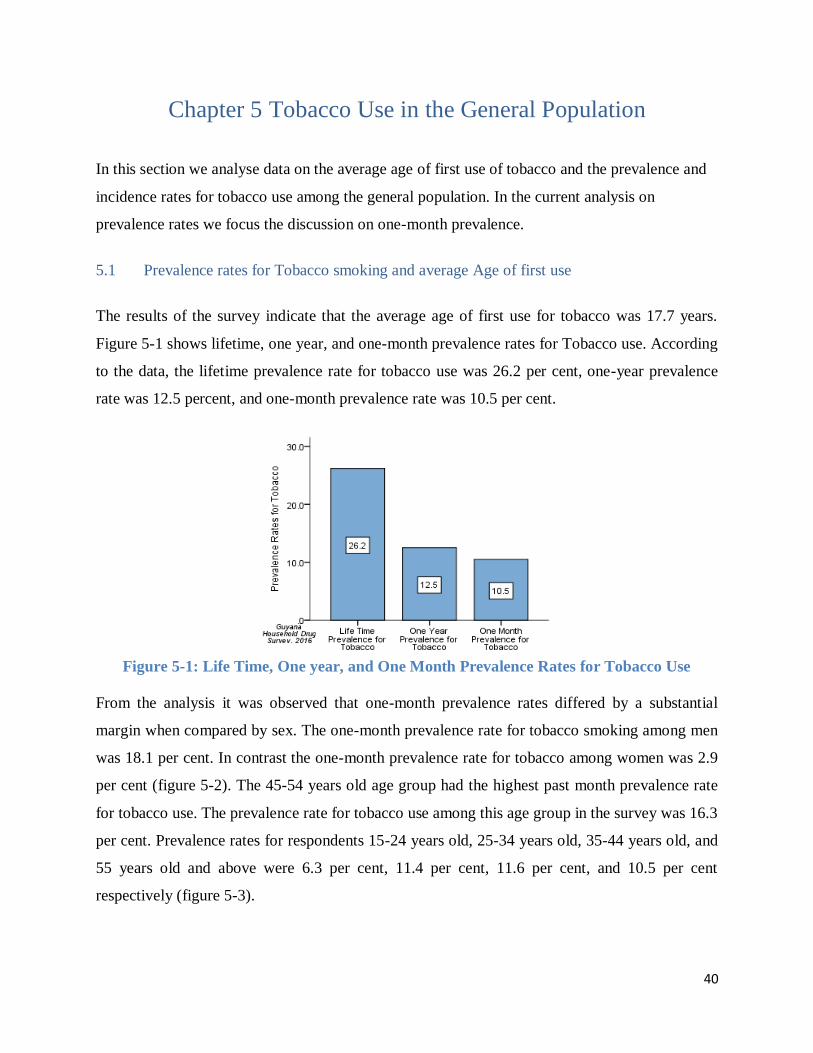
The results of the survey indicate that the average age of first use for tobacco was 17.7 years.
Figure 5-1 shows lifetime, one year, and one-month prevalence rates for Tobacco use. According
to the data, the lifetime prevalence rate for tobacco use was 26.2 per cent, one-year prevalence
rate was 12.5 percent, and one-month prevalence rate was 10.5 per cent.
Figure 5-1: Life Time, One year, and One Month Prevalence Rates for Tobacco Use
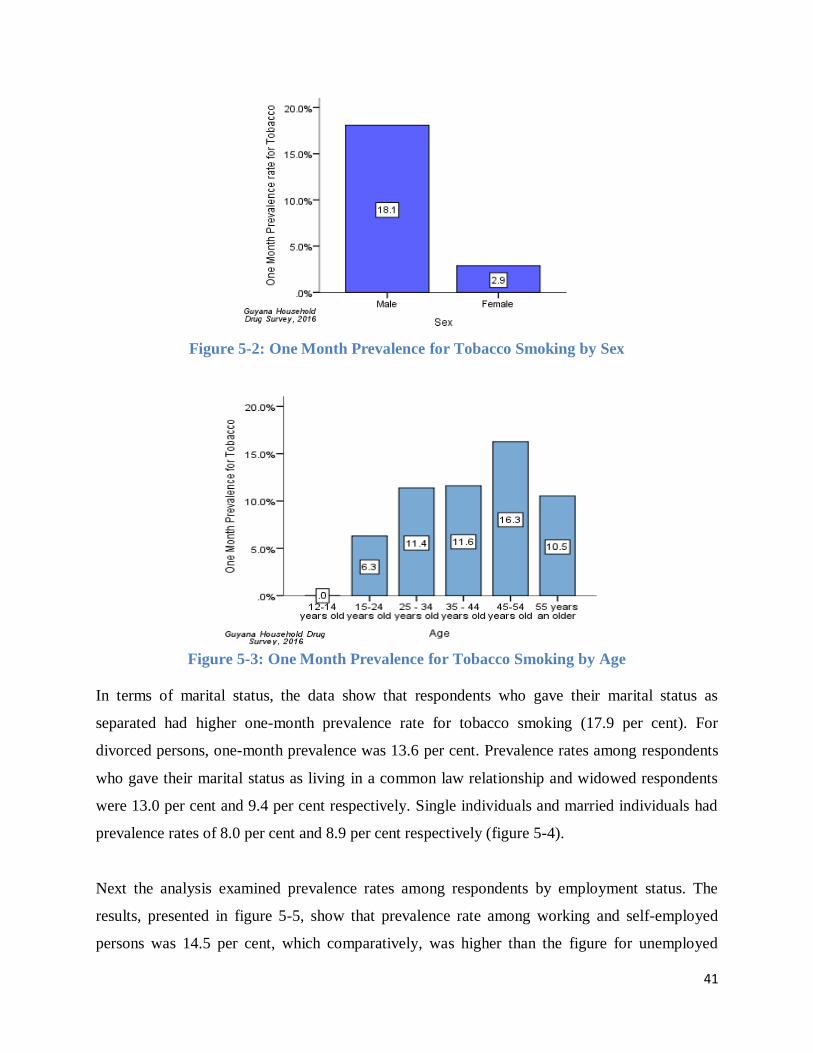
From the analysis it was observed that one-month prevalence rates differed by a substantial
margin when compared by sex. The one-month prevalence rate for tobacco smoking among men
was 18.1 per cent. In contrast the one-month prevalence rate for tobacco among women was 2.9
per cent (figure 5-2). The 45-54 years old age group had the highest past month prevalence rate
for tobacco use. The prevalence rate for tobacco use among this age group in the survey was 16.3
per cent. Prevalence rates for respondents 15-24 years old, 25-34 years old, 35-44 years old, and
55 years old and above were 6.3 per cent, 11.4 per cent, 11.6 per cent, and 10.5 per cent
respectively (figure 5-3).
41
Figure 5-2: One Month Prevalence for Tobacco Smoking by Sex
Figure 5-3: One Month Prevalence for Tobacco Smoking by Age
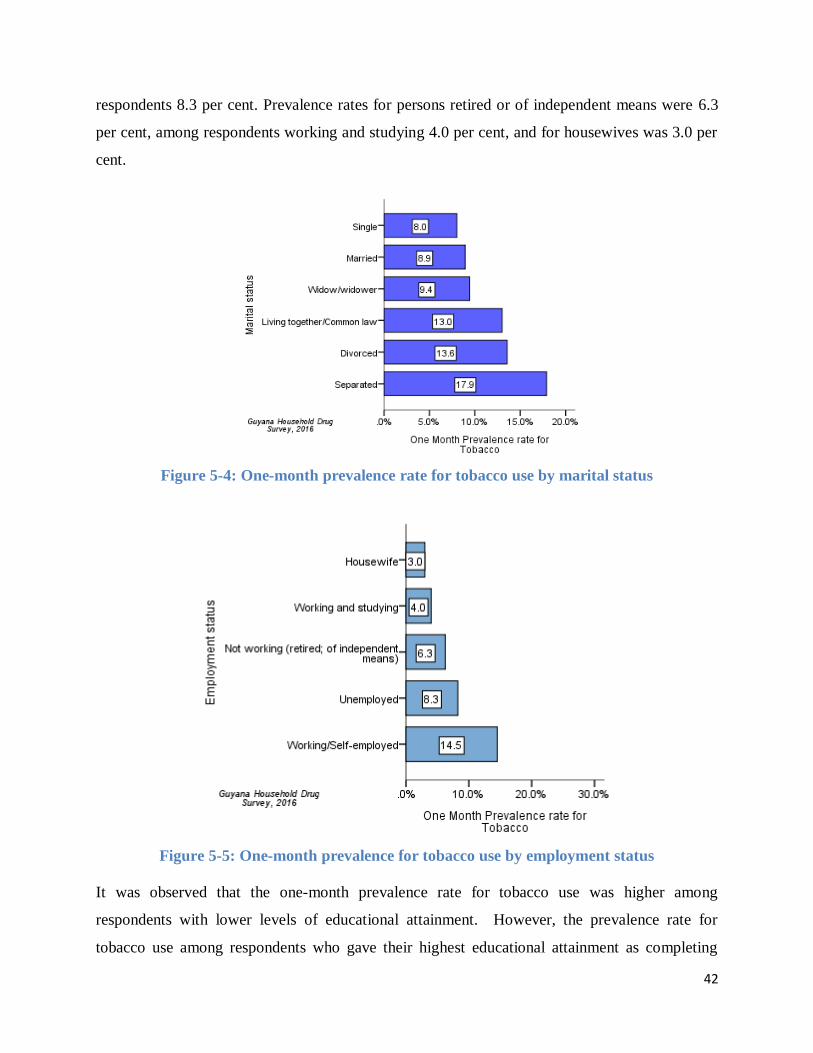
In terms of marital status, the data show that respondents who gave their marital status as
separated had higher one-month prevalence rate for tobacco smoking (17.9 per cent). For
divorced persons, one-month prevalence was 13.6 per cent. Prevalence rates among respondents
who gave their marital status as living in a common law relationship and widowed respondents
were 13.0 per cent and 9.4 per cent respectively. Single individuals and married individuals had
prevalence rates of 8.0 per cent and 8.9 per cent respectively (figure 5-4).
Next the analysis examined prevalence rates among respondents by employment status. The
results, presented in figure 5-5, show that prevalence rate among working and self-employed
persons was 14.5 per cent, which comparatively, was higher than the figure for unemployed
42
respondents 8.3 per cent. Prevalence rates for persons retired or of independent means were 6.3
per cent, among respondents working and studying 4.0 per cent, and for housewives was 3.0 per
cent.
Figure 5-4: One-month prevalence rate for tobacco use by marital status
Figure 5-5: One-month prevalence for tobacco use by employment status
It was observed that the one-month prevalence rate for tobacco use was higher among
respondents with lower levels of educational attainment. However, the prevalence rate for
tobacco use among respondents who gave their highest educational attainment as completing
43
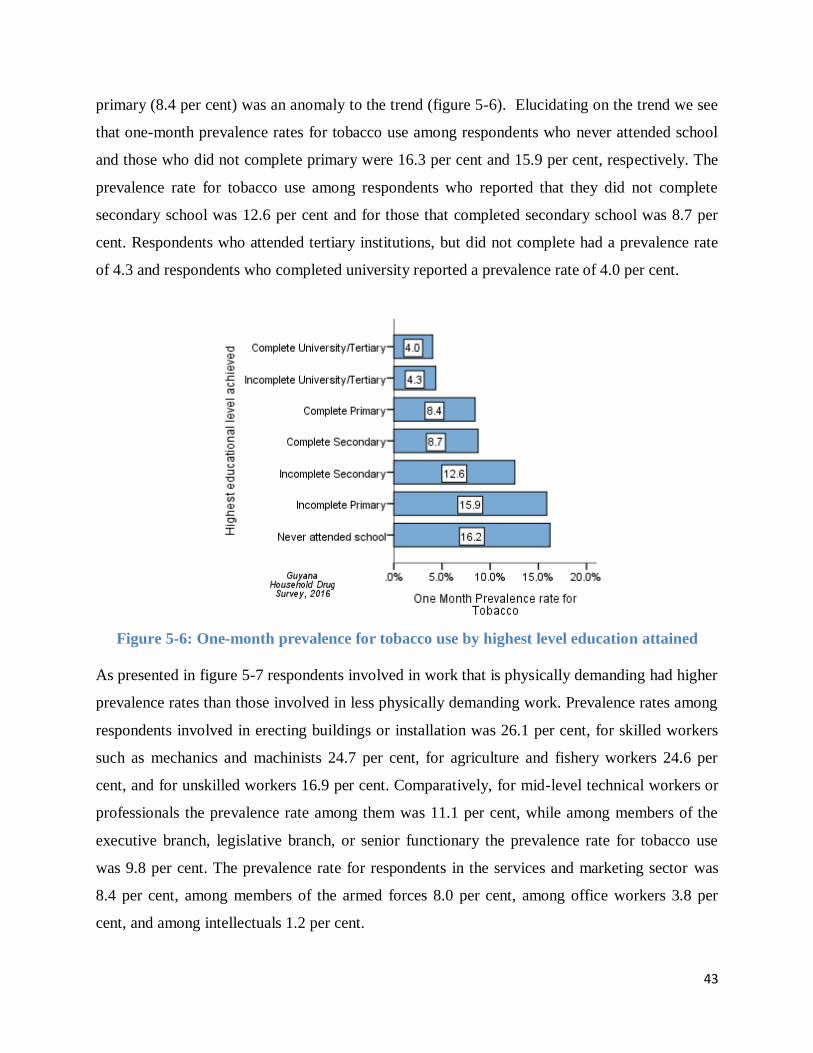
primary (8.4 per cent) was an anomaly to the trend (figure 5-6). Elucidating on the trend we see
that one-month prevalence rates for tobacco use among respondents who never attended school
and those who did not complete primary were 16.3 per cent and 15.9 per cent, respectively. The
prevalence rate for tobacco use among respondents who reported that they did not complete
secondary school was 12.6 per cent and for those that completed secondary school was 8.7 per
cent. Respondents who attended tertiary institutions, but did not complete had a prevalence rate
of 4.3 and respondents who completed university reported a prevalence rate of 4.0 per cent.
Figure 5-6: One-month prevalence for tobacco use by highest level education attained
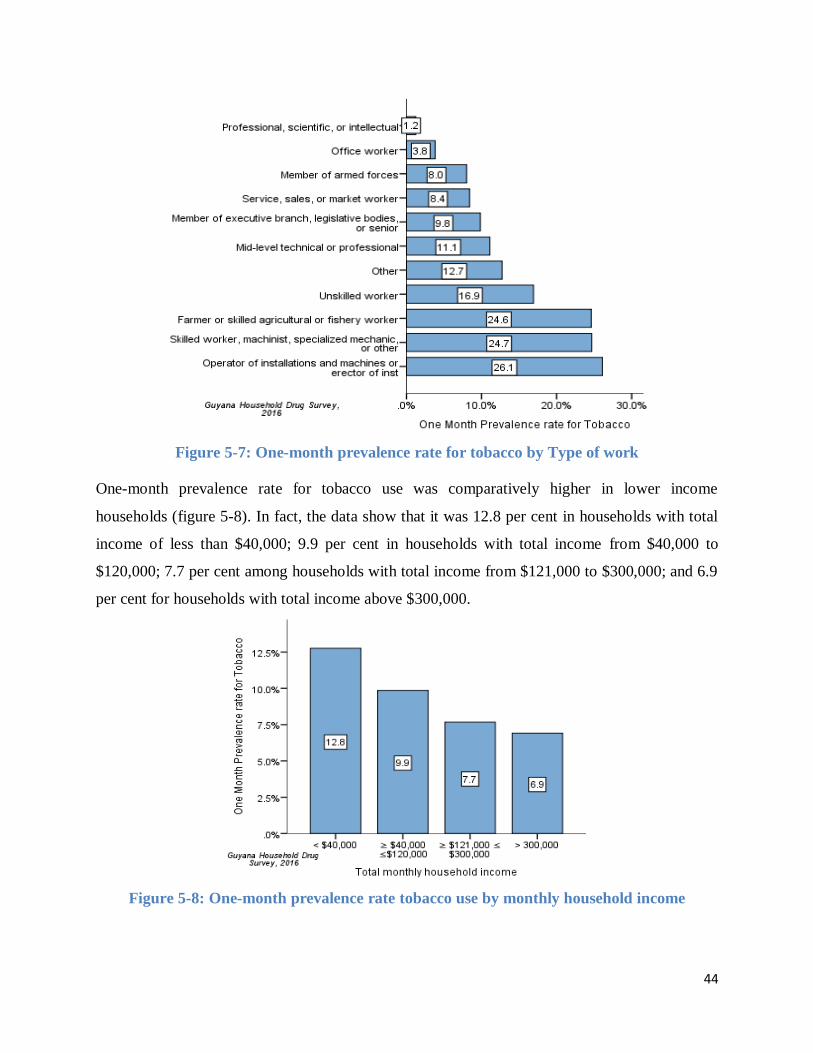
As presented in figure 5-7 respondents involved in work that is physically demanding had higher
prevalence rates than those involved in less physically demanding work. Prevalence rates among
respondents involved in erecting buildings or installation was 26.1 per cent, for skilled workers
such as mechanics and machinists 24.7 per cent, for agriculture and fishery workers 24.6 per
cent, and for unskilled workers 16.9 per cent. Comparatively, for mid-level technical workers or
professionals the prevalence rate among them was 11.1 per cent, while among members of the
executive branch, legislative branch, or senior functionary the prevalence rate for tobacco use
was 9.8 per cent. The prevalence rate for respondents in the services and marketing sector was
8.4 per cent, among members of the armed forces 8.0 per cent, among office workers 3.8 per
cent, and among intellectuals 1.2 per cent.
44
Figure 5-7: One-month prevalence rate for tobacco by Type of work
One-month prevalence rate for tobacco use was comparatively higher in lower income
households (figure 5-8). In fact, the data show that it was 12.8 per cent in households with total
income of less than $40,000; 9.9 per cent in households with total income from $40,000 to
$120,000; 7.7 per cent among households with total income from $121,000 to $300,000; and 6.9
per cent for households with total income above $300,000.
Figure 5-8: One-month prevalence rate tobacco use by monthly household income
45
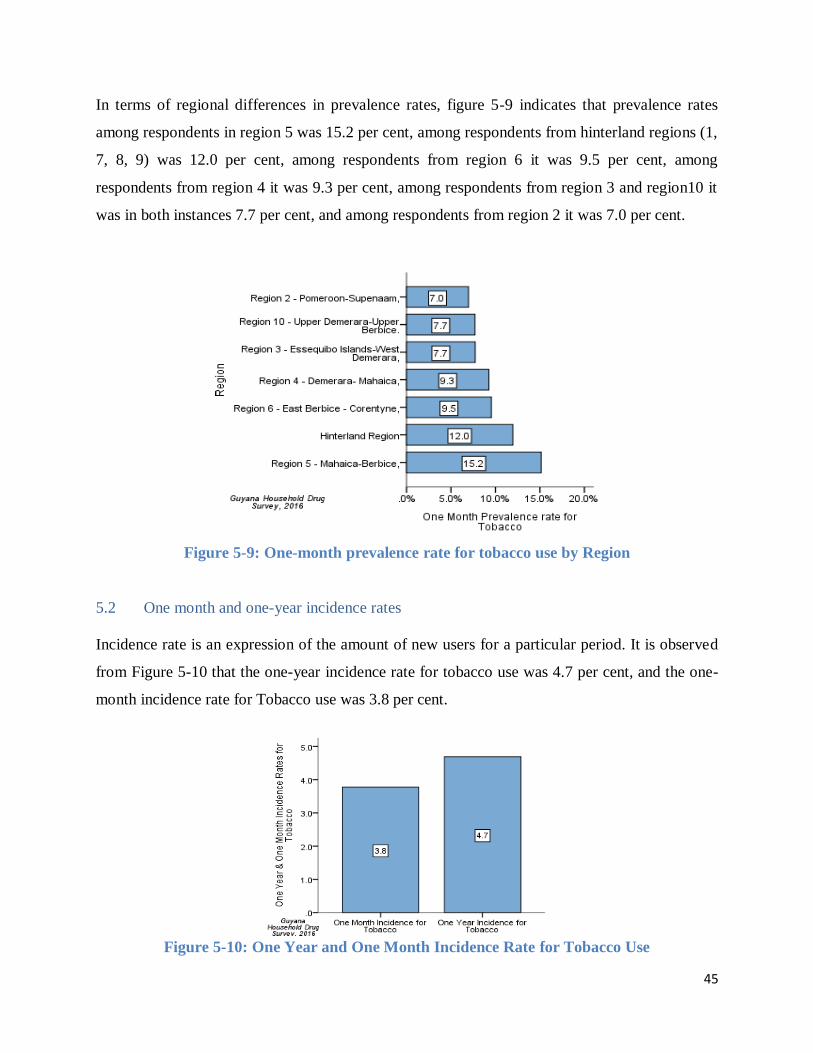
In terms of regional differences in prevalence rates, figure 5-9 indicates that prevalence rates
among respondents in region 5 was 15.2 per cent, among respondents from hinterland regions (1,
7, 8, 9) was 12.0 per cent, among respondents from region 6 it was 9.5 per cent, among
respondents from region 4 it was 9.3 per cent, among respondents from region 3 and region10 it
was in both instances 7.7 per cent, and among respondents from region 2 it was 7.0 per cent.
Figure 5-9: One-month prevalence rate for tobacco use by Region
5.2 One month and one-year incidence rates
Incidence rate is an expression of the amount of new users for a particular period. It is observed
from Figure 5-10 that the one-year incidence rate for tobacco use was 4.7 per cent, and the one-
month incidence rate for Tobacco use was 3.8 per cent.
Figure 5-10: One Year and One Month Incidence Rate for Tobacco Use
46
5.3 Daily smoking of tobacco and amount of money expended on tobacco in past month
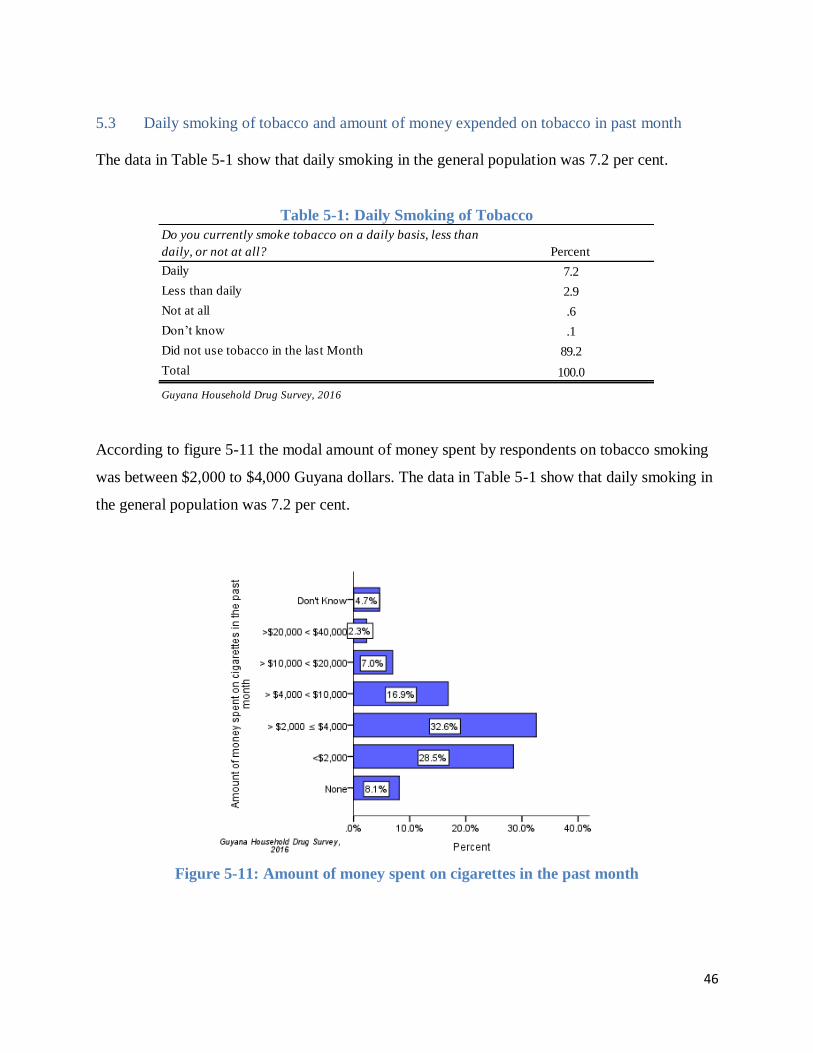
The data in Table 5-1 show that daily smoking in the general population was 7.2 per cent.
Table 5-1: Daily Smoking of Tobacco
According to figure 5-11 the modal amount of money spent by respondents on tobacco smoking
was between $2,000 to $4,000 Guyana dollars. The data in Table 5-1 show that daily smoking in
the general population was 7.2 per cent.
Figure 5-11: Amount of money spent on cigarettes in the past month
Do you currently smoke tobacco on a daily basis, less than
daily, or not at all? Percent
Daily 7.2
Less than daily 2.9
Not at all .6
Don’t know .1
Did not use tobacco in the last Month 89.2
Total 100.0
Guyana Household Drug Survey, 2016
47
Chapter 6 Alcohol Use in the General Population
In this section we analyse data on the average age of first use of alcohol, the prevalence and
incidence rates for alcohol use among the general population, and other significant findings
related to alcohol use.
6.1 Prevalence rates for Alcohol Consumption and average Age of first use
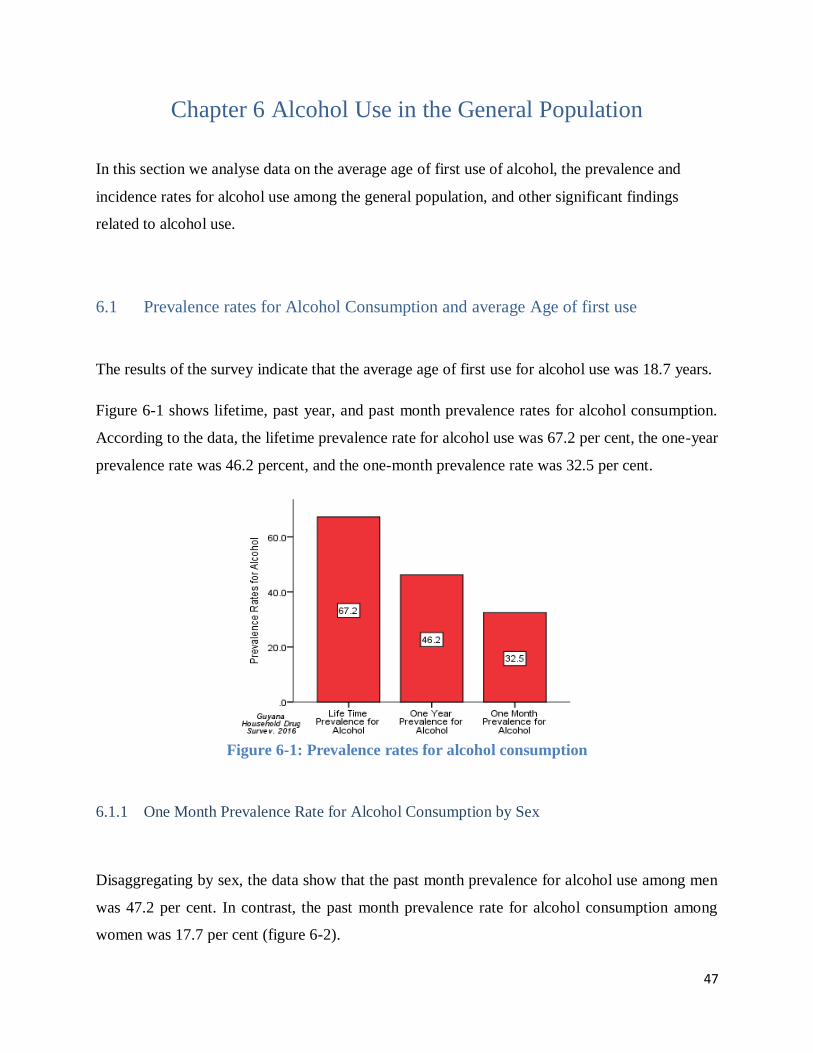
The results of the survey indicate that the average age of first use for alcohol use was 18.7 years.
Figure 6-1 shows lifetime, past year, and past month prevalence rates for alcohol consumption.
According to the data, the lifetime prevalence rate for alcohol use was 67.2 per cent, the one-year
prevalence rate was 46.2 percent, and the one-month prevalence rate was 32.5 per cent.
Figure 6-1: Prevalence rates for alcohol consumption
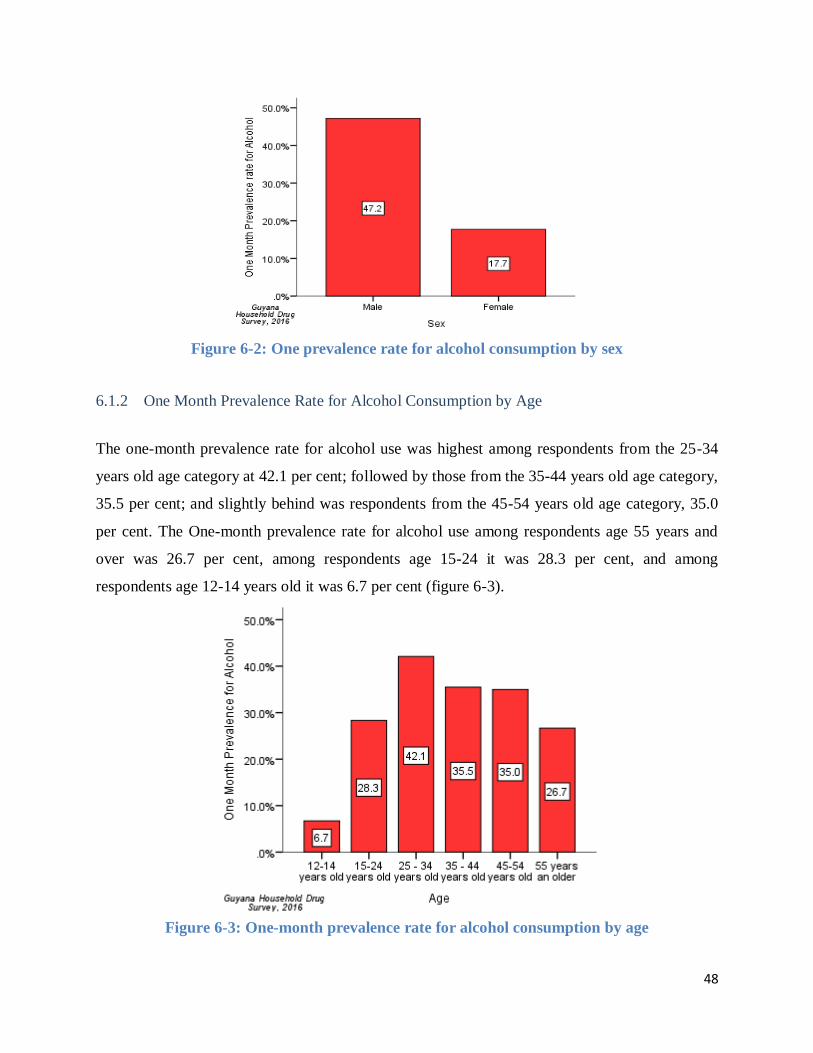
6.1.1 One Month Prevalence Rate for Alcohol Consumption by Sex
Disaggregating by sex, the data show that the past month prevalence for alcohol use among men
was 47.2 per cent. In contrast, the past month prevalence rate for alcohol consumption among
women was 17.7 per cent (figure 6-2).
48
Figure 6-2: One prevalence rate for alcohol consumption by sex
6.1.2 One Month Prevalence Rate for Alcohol Consumption by Age
The one-month prevalence rate for alcohol use was highest among respondents from the 25-34
years old age category at 42.1 per cent; followed by those from the 35-44 years old age category,
35.5 per cent; and slightly behind was respondents from the 45-54 years old age category, 35.0
per cent. The One-month prevalence rate for alcohol use among respondents age 55 years and
over was 26.7 per cent, among respondents age 15-24 it was 28.3 per cent, and among
respondents age 12-14 years old it was 6.7 per cent (figure 6-3).
Figure 6-3: One-month prevalence rate for alcohol consumption by age
49
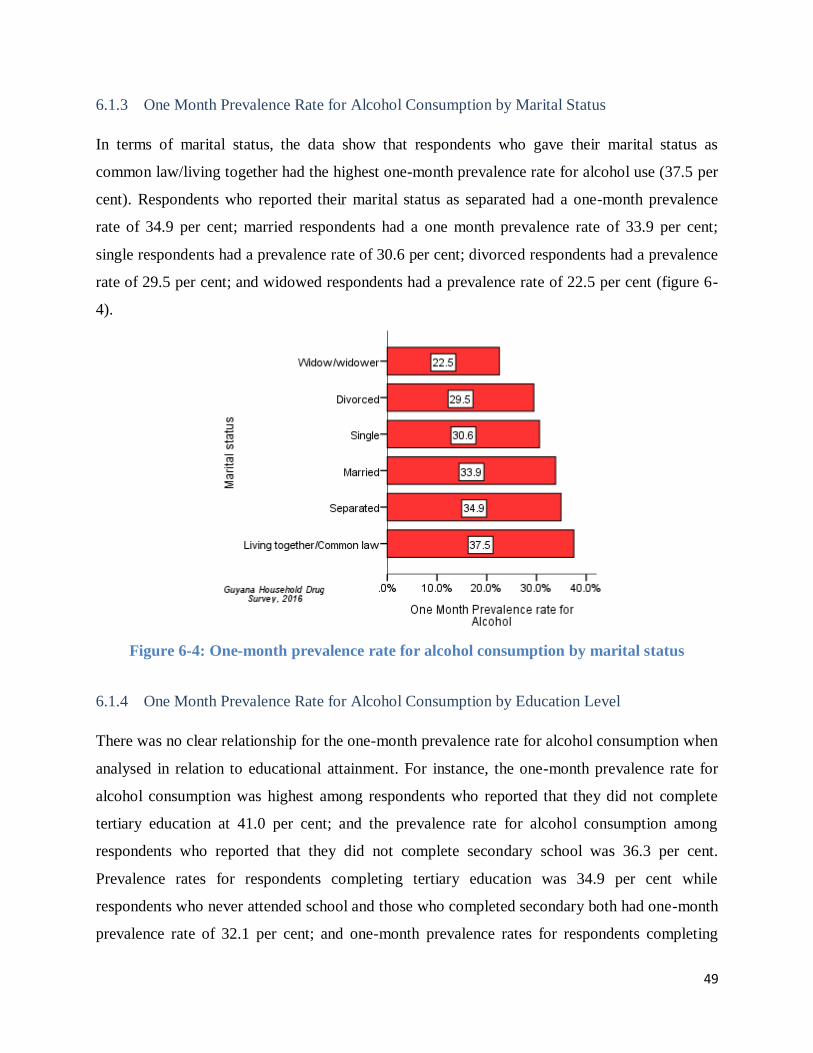
6.1.3 One Month Prevalence Rate for Alcohol Consumption by Marital Status
In terms of marital status, the data show that respondents who gave their marital status as
common law/living together had the highest one-month prevalence rate for alcohol use (37.5 per
cent). Respondents who reported their marital status as separated had a one-month prevalence
rate of 34.9 per cent; married respondents had a one month prevalence rate of 33.9 per cent;
single respondents had a prevalence rate of 30.6 per cent; divorced respondents had a prevalence
rate of 29.5 per cent; and widowed respondents had a prevalence rate of 22.5 per cent (figure 6-
4).
Figure 6-4: One-month prevalence rate for alcohol consumption by marital status
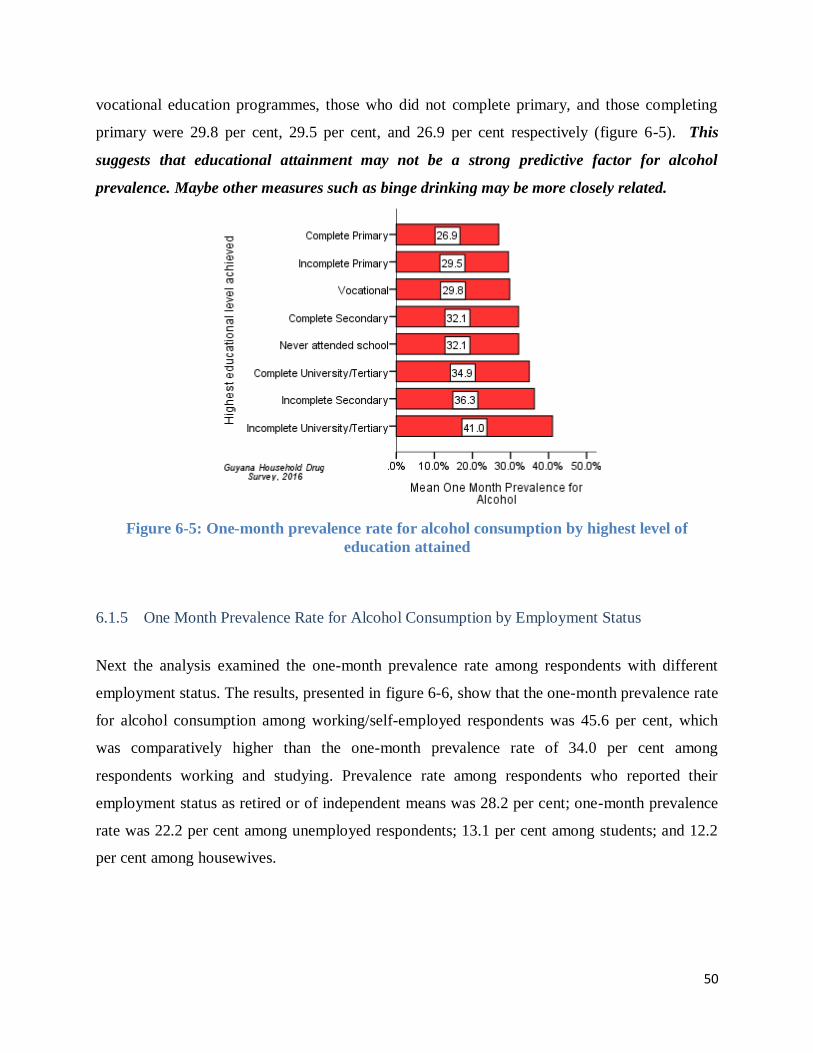
6.1.4 One Month Prevalence Rate for Alcohol Consumption by Education Level
There was no clear relationship for the one-month prevalence rate for alcohol consumption when
analysed in relation to educational attainment. For instance, the one-month prevalence rate for
alcohol consumption was highest among respondents who reported that they did not complete
tertiary education at 41.0 per cent; and the prevalence rate for alcohol consumption among
respondents who reported that they did not complete secondary school was 36.3 per cent.
Prevalence rates for respondents completing tertiary education was 34.9 per cent while
respondents who never attended school and those who completed secondary both had one-month
prevalence rate of 32.1 per cent; and one-month prevalence rates for respondents completing
50
vocational education programmes, those who did not complete primary, and those completing
primary were 29.8 per cent, 29.5 per cent, and 26.9 per cent respectively (figure 6-5). This
suggests that educational attainment may not be a strong predictive factor for alcohol
prevalence. Maybe other measures such as binge drinking may be more closely related.
Figure 6-5: One-month prevalence rate for alcohol consumption by highest level of
education attained
6.1.5 One Month Prevalence Rate for Alcohol Consumption by Employment Status
Next the analysis examined the one-month prevalence rate among respondents with different
employment status. The results, presented in figure 6-6, show that the one-month prevalence rate
for alcohol consumption among working/self-employed respondents was 45.6 per cent, which
was comparatively higher than the one-month prevalence rate of 34.0 per cent among
respondents working and studying. Prevalence rate among respondents who reported their
employment status as retired or of independent means was 28.2 per cent; one-month prevalence
rate was 22.2 per cent among unemployed respondents; 13.1 per cent among students; and 12.2
per cent among housewives.
51
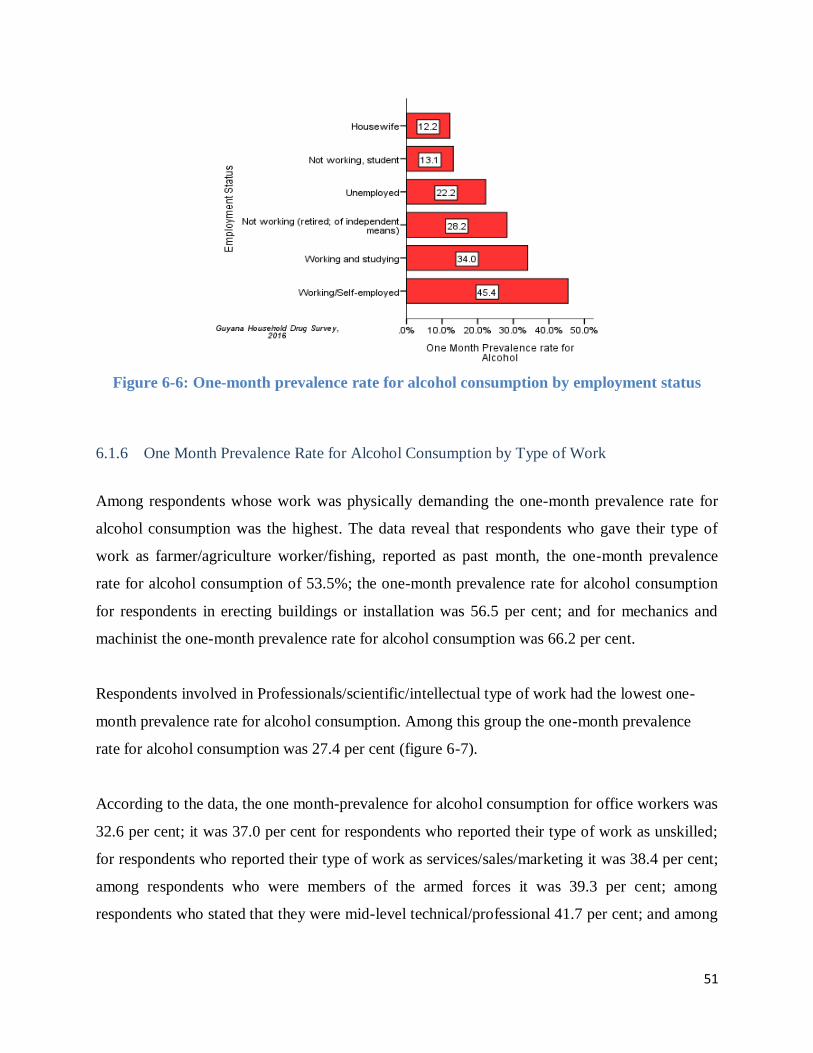
Figure 6-6: One-month prevalence rate for alcohol consumption by employment status
6.1.6 One Month Prevalence Rate for Alcohol Consumption by Type of Work
Among respondents whose work was physically demanding the one-month prevalence rate for
alcohol consumption was the highest. The data reveal that respondents who gave their type of
work as farmer/agriculture worker/fishing, reported as past month, the one-month prevalence
rate for alcohol consumption of 53.5%; the one-month prevalence rate for alcohol consumption
for respondents in erecting buildings or installation was 56.5 per cent; and for mechanics and
machinist the one-month prevalence rate for alcohol consumption was 66.2 per cent.
Respondents involved in Professionals/scientific/intellectual type of work had the lowest one-
month prevalence rate for alcohol consumption. Among this group the one-month prevalence
rate for alcohol consumption was 27.4 per cent (figure 6-7).
According to the data, the one month-prevalence for alcohol consumption for office workers was
32.6 per cent; it was 37.0 per cent for respondents who reported their type of work as unskilled;
for respondents who reported their type of work as services/sales/marketing it was 38.4 per cent;
among respondents who were members of the armed forces it was 39.3 per cent; among
respondents who stated that they were mid-level technical/professional 41.7 per cent; and among
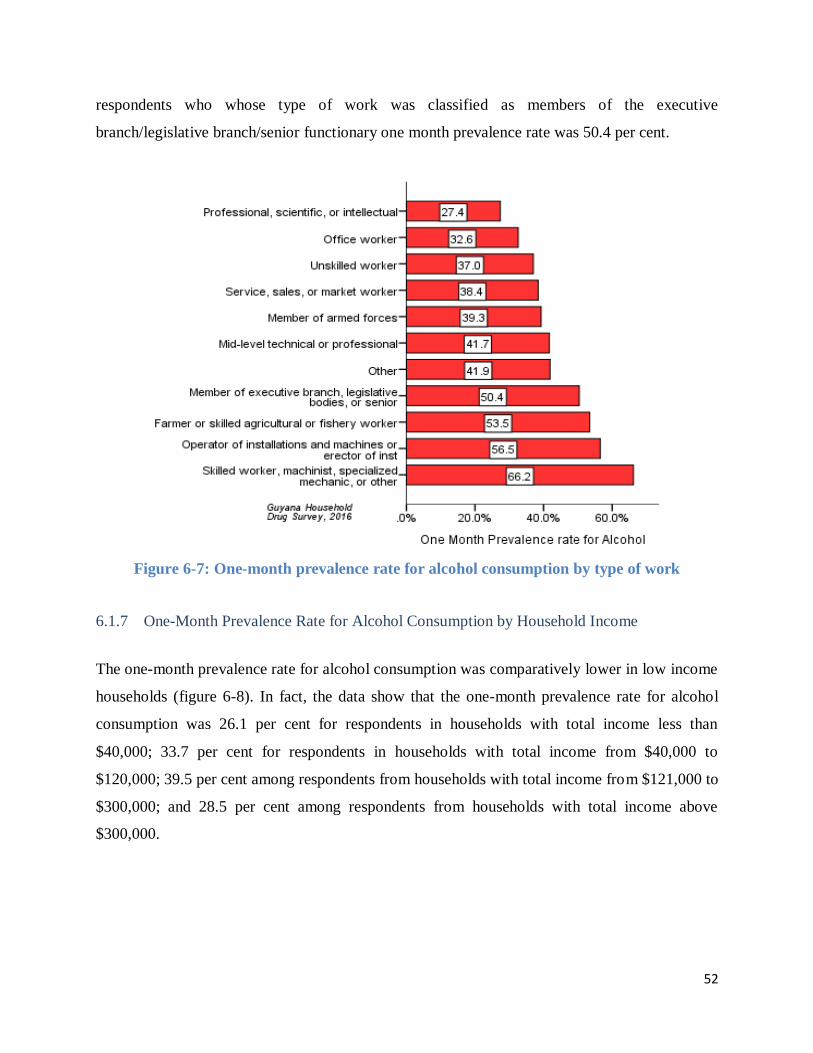
52
respondents who whose type of work was classified as members of the executive
branch/legislative branch/senior functionary one month prevalence rate was 50.4 per cent.
Figure 6-7: One-month prevalence rate for alcohol consumption by type of work
6.1.7 One-Month Prevalence Rate for Alcohol Consumption by Household Income
The one-month prevalence rate for alcohol consumption was comparatively lower in low income
households (figure 6-8). In fact, the data show that the one-month prevalence rate for alcohol
consumption was 26.1 per cent for respondents in households with total income less than
$40,000; 33.7 per cent for respondents in households with total income from $40,000 to
$120,000; 39.5 per cent among respondents from households with total income from $121,000 to
$300,000; and 28.5 per cent among respondents from households with total income above
$300,000.
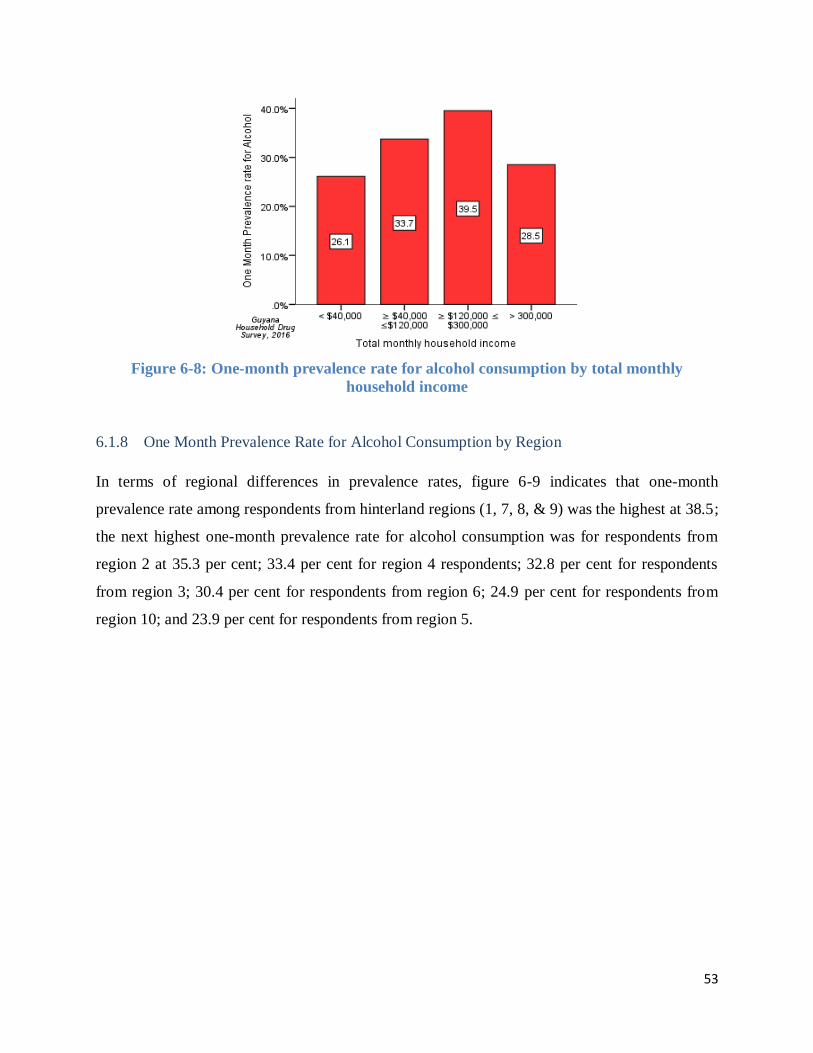
53
Figure 6-8: One-month prevalence rate for alcohol consumption by total monthly
household income
6.1.8 One Month Prevalence Rate for Alcohol Consumption by Region
In terms of regional differences in prevalence rates, figure 6-9 indicates that one-month
prevalence rate among respondents from hinterland regions (1, 7, 8, & 9) was the highest at 38.5;
the next highest one-month prevalence rate for alcohol consumption was for respondents from
region 2 at 35.3 per cent; 33.4 per cent for region 4 respondents; 32.8 per cent for respondents
from region 3; 30.4 per cent for respondents from region 6; 24.9 per cent for respondents from
region 10; and 23.9 per cent for respondents from region 5.
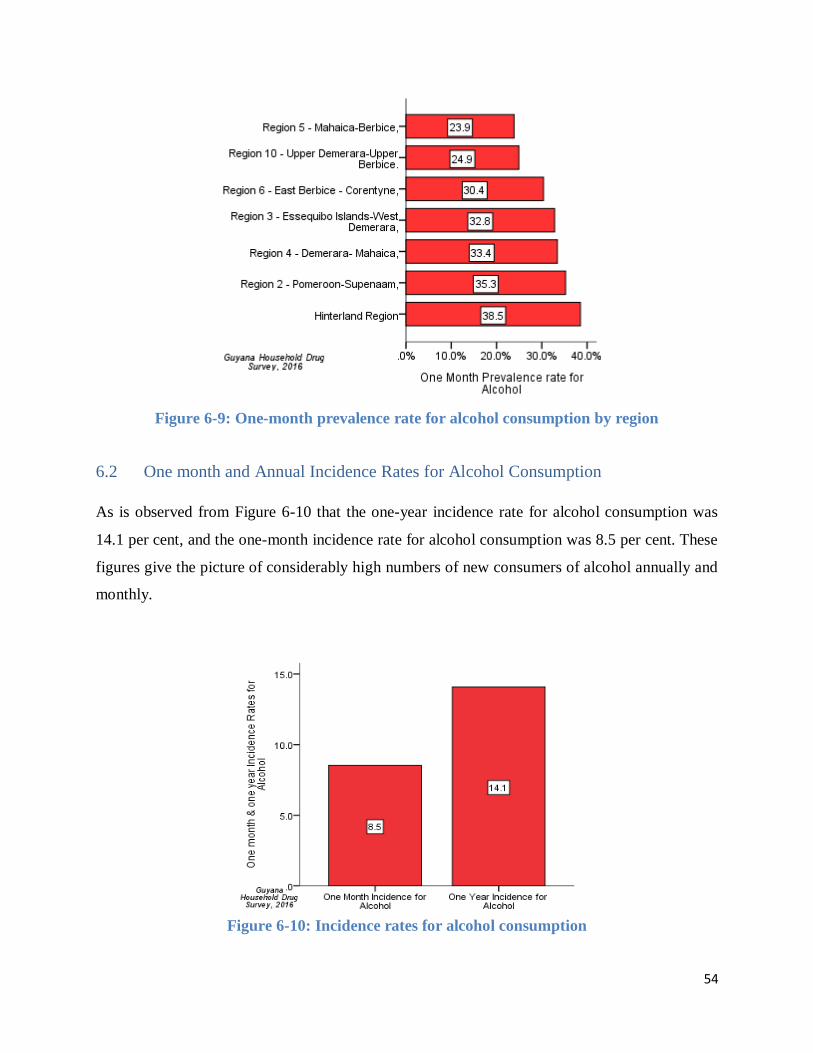
54
Figure 6-9: One-month prevalence rate for alcohol consumption by region
6.2 One month and Annual Incidence Rates for Alcohol Consumption
As is observed from Figure 6-10 that the one-year incidence rate for alcohol consumption was
14.1 per cent, and the one-month incidence rate for alcohol consumption was 8.5 per cent. These
figures give the picture of considerably high numbers of new consumers of alcohol annually and
monthly.
Figure 6-10: Incidence rates for alcohol consumption
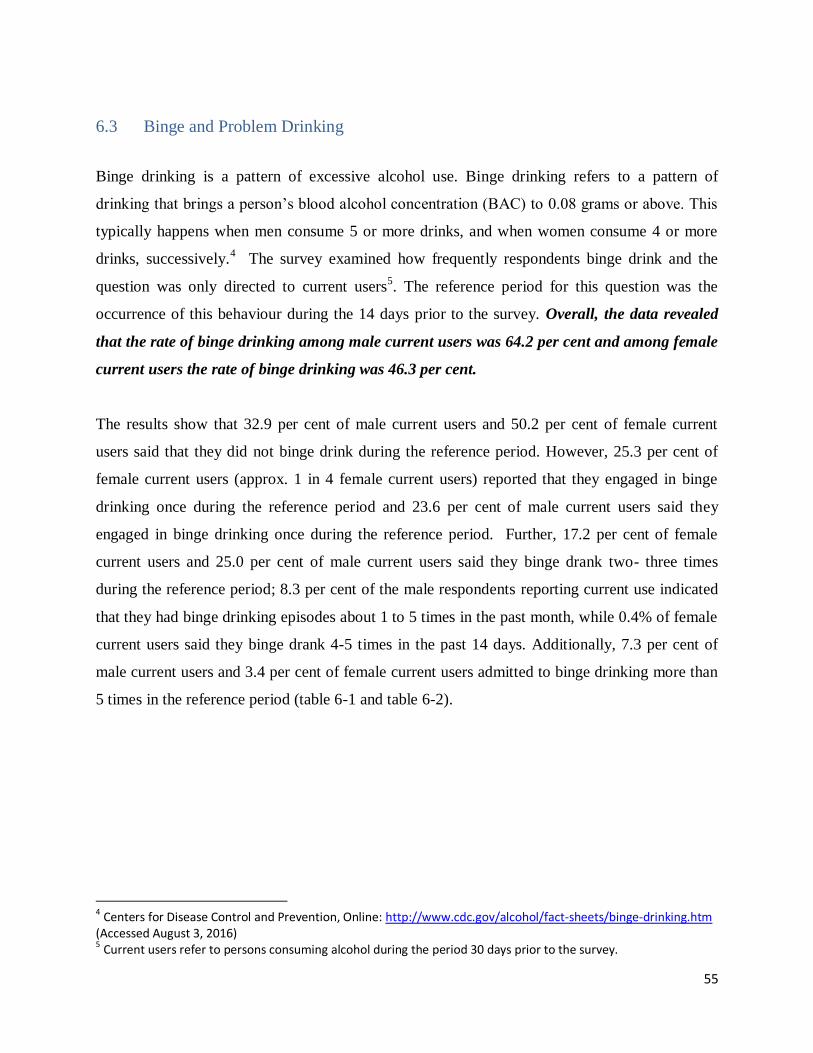
55
6.3 Binge and Problem Drinking
Binge drinking is a pattern of excessive alcohol use. Binge drinking refers to a pattern of
drinking that brings a person’s blood alcohol concentration (BAC) to 0.08 grams or above. This
typically happens when men consume 5 or more drinks, and when women consume 4 or more
drinks, successively.4 The survey examined how frequently respondents binge drink and the
question was only directed to current users5. The reference period for this question was the
occurrence of this behaviour during the 14 days prior to the survey. Overall, the data revealed
that the rate of binge drinking among male current users was 64.2 per cent and among female
current users the rate of binge drinking was 46.3 per cent.
The results show that 32.9 per cent of male current users and 50.2 per cent of female current
users said that they did not binge drink during the reference period. However, 25.3 per cent of
female current users (approx. 1 in 4 female current users) reported that they engaged in binge
drinking once during the reference period and 23.6 per cent of male current users said they
engaged in binge drinking once during the reference period. Further, 17.2 per cent of female
current users and 25.0 per cent of male current users said they binge drank two- three times
during the reference period; 8.3 per cent of the male respondents reporting current use indicated
that they had binge drinking episodes about 1 to 5 times in the past month, while 0.4% of female
current users said they binge drank 4-5 times in the past 14 days. Additionally, 7.3 per cent of
male current users and 3.4 per cent of female current users admitted to binge drinking more than
5 times in the reference period (table 6-1 and table 6-2).
4 Centers for Disease Control and Prevention, Online: http://www.cdc.gov/alcohol/fact-sheets/binge-drinking.htm (Accessed August 3, 2016) 5 Current users refer to persons consuming alcohol during the period 30 days prior to the survey.
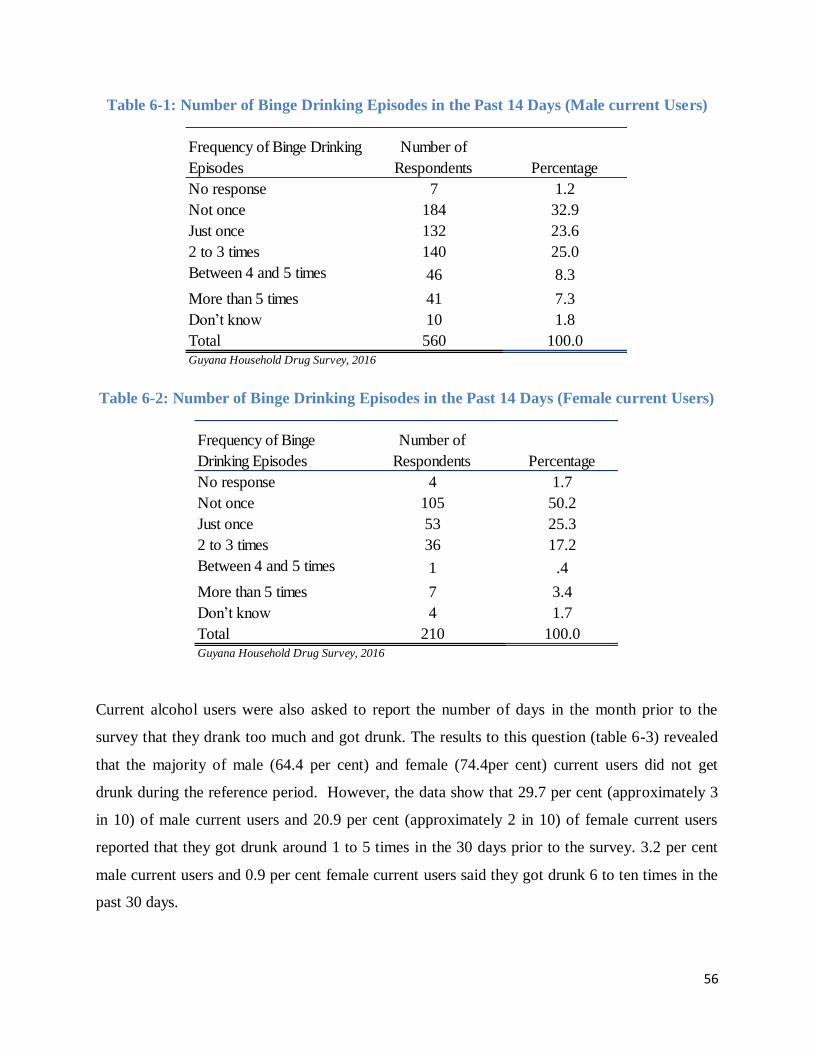
56
Table 6-1: Number of Binge Drinking Episodes in the Past 14 Days (Male current Users)
Table 6-2: Number of Binge Drinking Episodes in the Past 14 Days (Female current Users)
Current alcohol users were also asked to report the number of days in the month prior to the
survey that they drank too much and got drunk. The results to this question (table 6-3) revealed
that the majority of male (64.4 per cent) and female (74.4per cent) current users did not get
drunk during the reference period. However, the data show that 29.7 per cent (approximately 3
in 10) of male current users and 20.9 per cent (approximately 2 in 10) of female current users
reported that they got drunk around 1 to 5 times in the 30 days prior to the survey. 3.2 per cent
male current users and 0.9 per cent female current users said they got drunk 6 to ten times in the
past 30 days.
Frequency of Binge Drinking
Episodes
Number of
Respondents Percentage
No response 7 1.2
Not once 184 32.9
Just once 132 23.6
2 to 3 times 140 25.0
Between 4 and 5 times 46 8.3
More than 5 times 41 7.3
Don’t know 10 1.8
Total 560 100.0Guyana Household Drug Survey, 2016
Frequency of Binge
Drinking Episodes
Number of
Respondents Percentage
No response 4 1.7
Not once 105 50.2
Just once 53 25.3
2 to 3 times 36 17.2
Between 4 and 5 times 1 .4
More than 5 times 7 3.4
Don’t know 4 1.7
Total 210 100.0Guyana Household Drug Survey, 2016
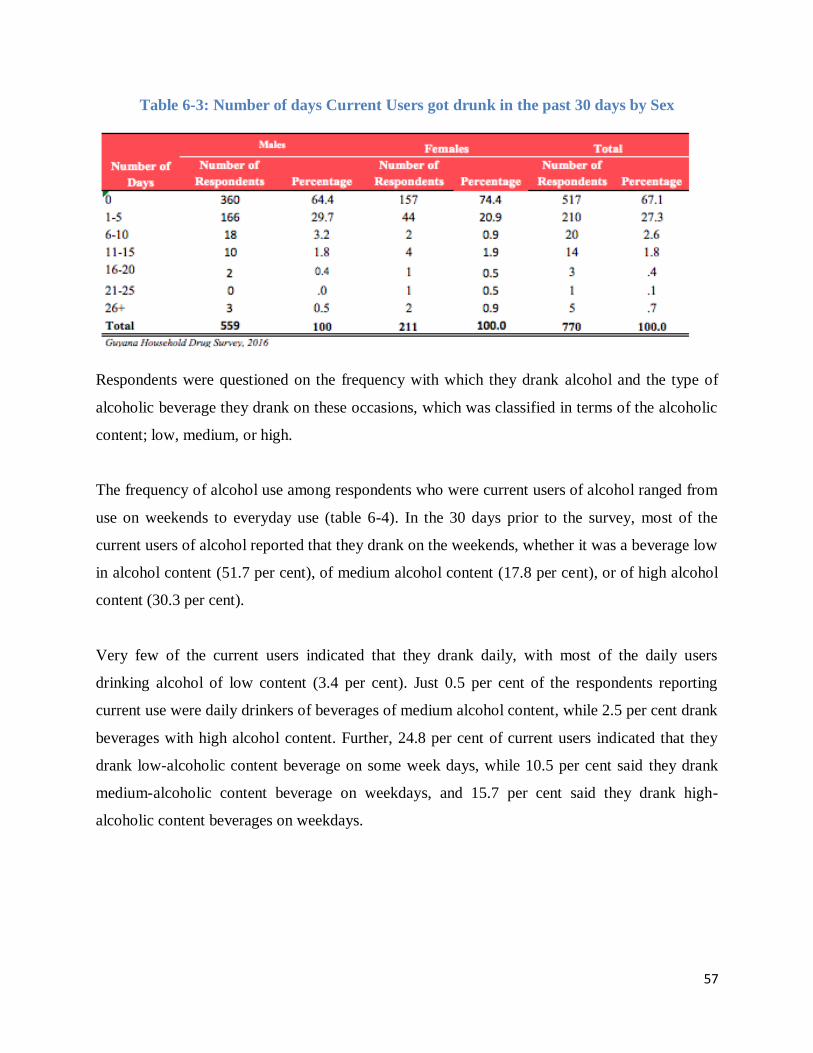
57
Table 6-3: Number of days Current Users got drunk in the past 30 days by Sex
Respondents were questioned on the frequency with which they drank alcohol and the type of
alcoholic beverage they drank on these occasions, which was classified in terms of the alcoholic
content; low, medium, or high.
The frequency of alcohol use among respondents who were current users of alcohol ranged from
use on weekends to everyday use (table 6-4). In the 30 days prior to the survey, most of the
current users of alcohol reported that they drank on the weekends, whether it was a beverage low
in alcohol content (51.7 per cent), of medium alcohol content (17.8 per cent), or of high alcohol
content (30.3 per cent).
Very few of the current users indicated that they drank daily, with most of the daily users
drinking alcohol of low content (3.4 per cent). Just 0.5 per cent of the respondents reporting
current use were daily drinkers of beverages of medium alcohol content, while 2.5 per cent drank
beverages with high alcohol content. Further, 24.8 per cent of current users indicated that they
drank low-alcoholic content beverage on some week days, while 10.5 per cent said they drank
medium-alcoholic content beverage on weekdays, and 15.7 per cent said they drank high-
alcoholic content beverages on weekdays.
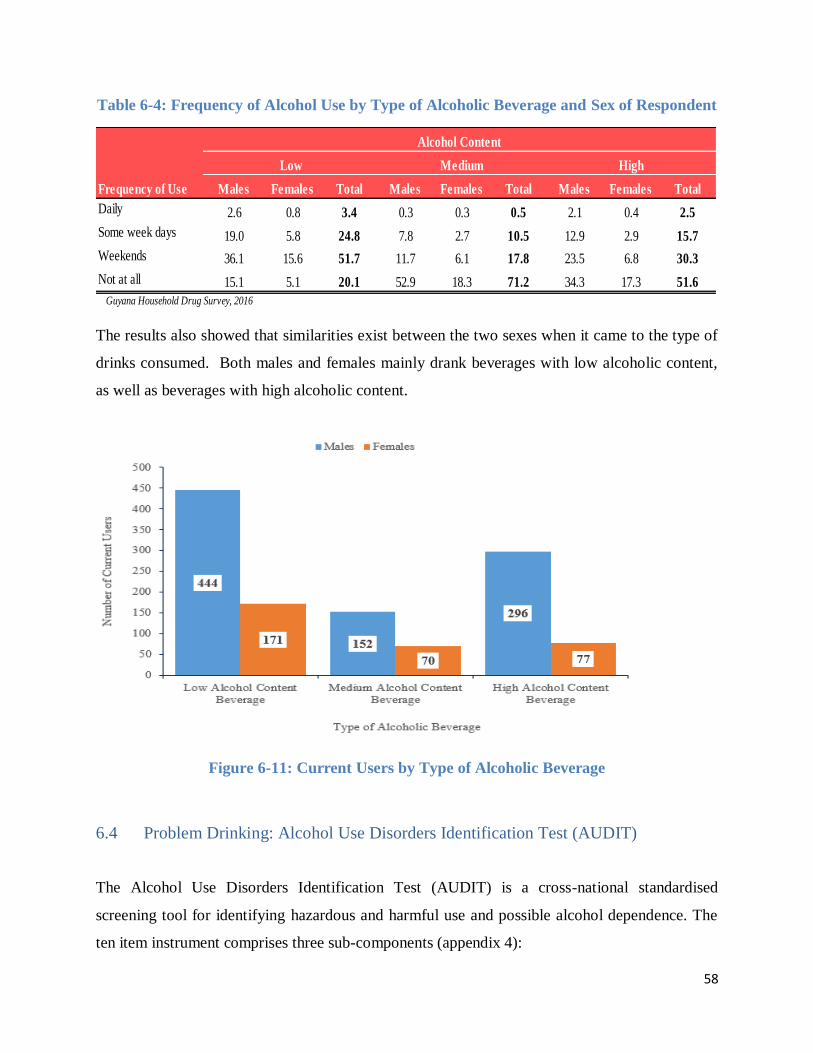
58
Table 6-4: Frequency of Alcohol Use by Type of Alcoholic Beverage and Sex of Respondent
The results also showed that similarities exist between the two sexes when it came to the type of
drinks consumed. Both males and females mainly drank beverages with low alcoholic content,
as well as beverages with high alcoholic content.
Figure 6-11: Current Users by Type of Alcoholic Beverage
6.4 Problem Drinking: Alcohol Use Disorders Identification Test (AUDIT)
The Alcohol Use Disorders Identification Test (AUDIT) is a cross-national standardised
screening tool for identifying hazardous and harmful use and possible alcohol dependence. The
ten item instrument comprises three sub-components (appendix 4):
Males Females Total Males Females Total Males Females Total
Daily 2.6 0.8 3.4 0.3 0.3 0.5 2.1 0.4 2.5
Some week days 19.0 5.8 24.8 7.8 2.7 10.5 12.9 2.9 15.7
Weekends 36.1 15.6 51.7 11.7 6.1 17.8 23.5 6.8 30.3
Not at all 15.1 5.1 20.1 52.9 18.3 71.2 34.3 17.3 51.6
Low Medium High
Alcohol Content
Frequency of Use
Guyana Household Drug Survey, 2016
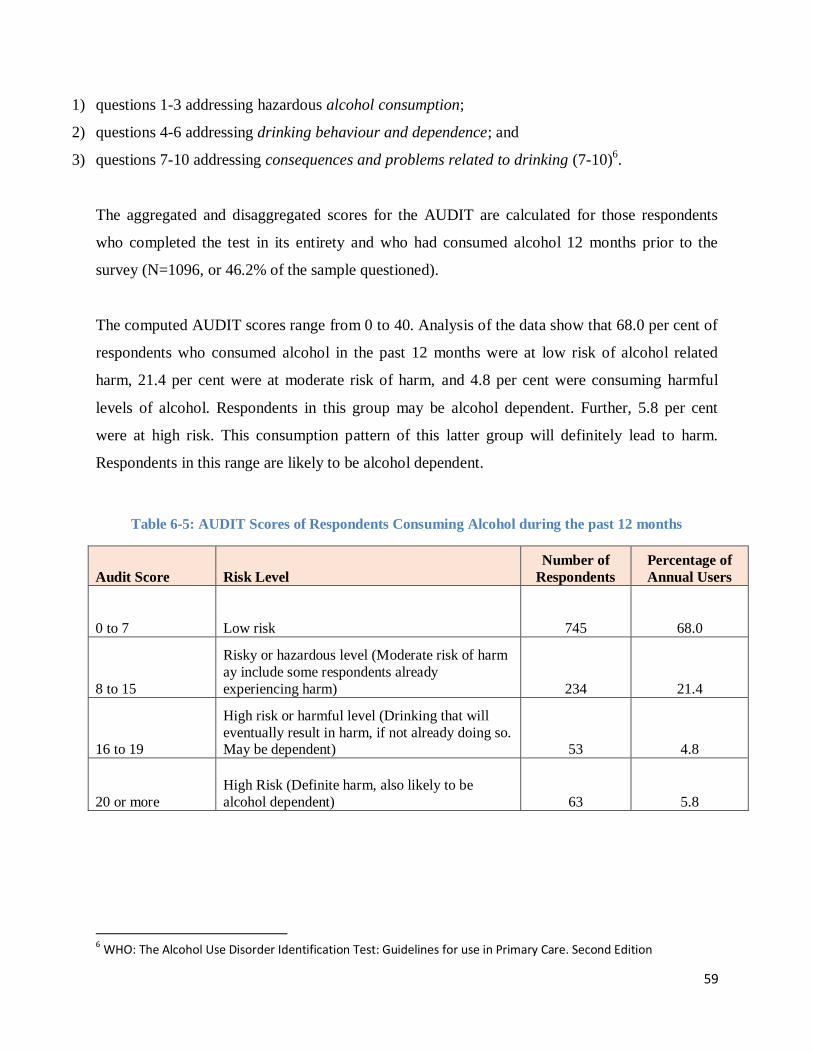
59
1) questions 1-3 addressing hazardous alcohol consumption;
2) questions 4-6 addressing drinking behaviour and dependence; and
3) questions 7-10 addressing consequences and problems related to drinking (7-10)6.
The aggregated and disaggregated scores for the AUDIT are calculated for those respondents
who completed the test in its entirety and who had consumed alcohol 12 months prior to the
survey (N=1096, or 46.2% of the sample questioned).
The computed AUDIT scores range from 0 to 40. Analysis of the data show that 68.0 per cent of
respondents who consumed alcohol in the past 12 months were at low risk of alcohol related
harm, 21.4 per cent were at moderate risk of harm, and 4.8 per cent were consuming harmful
levels of alcohol. Respondents in this group may be alcohol dependent. Further, 5.8 per cent
were at high risk. This consumption pattern of this latter group will definitely lead to harm.
Respondents in this range are likely to be alcohol dependent.
Table 6-5: AUDIT Scores of Respondents Consuming Alcohol during the past 12 months
Audit Score Risk Level
Number of
Respondents
Percentage of
Annual Users
0 to 7 Low risk 745 68.0
8 to 15
Risky or hazardous level (Moderate risk of harm
ay include some respondents already
experiencing harm) 234 21.4
16 to 19
High risk or harmful level (Drinking that will
eventually result in harm, if not already doing so. May be dependent) 53 4.8
20 or more
High Risk (Definite harm, also likely to be
alcohol dependent) 63 5.8
6 WHO: The Alcohol Use Disorder Identification Test: Guidelines for use in Primary Care. Second Edition
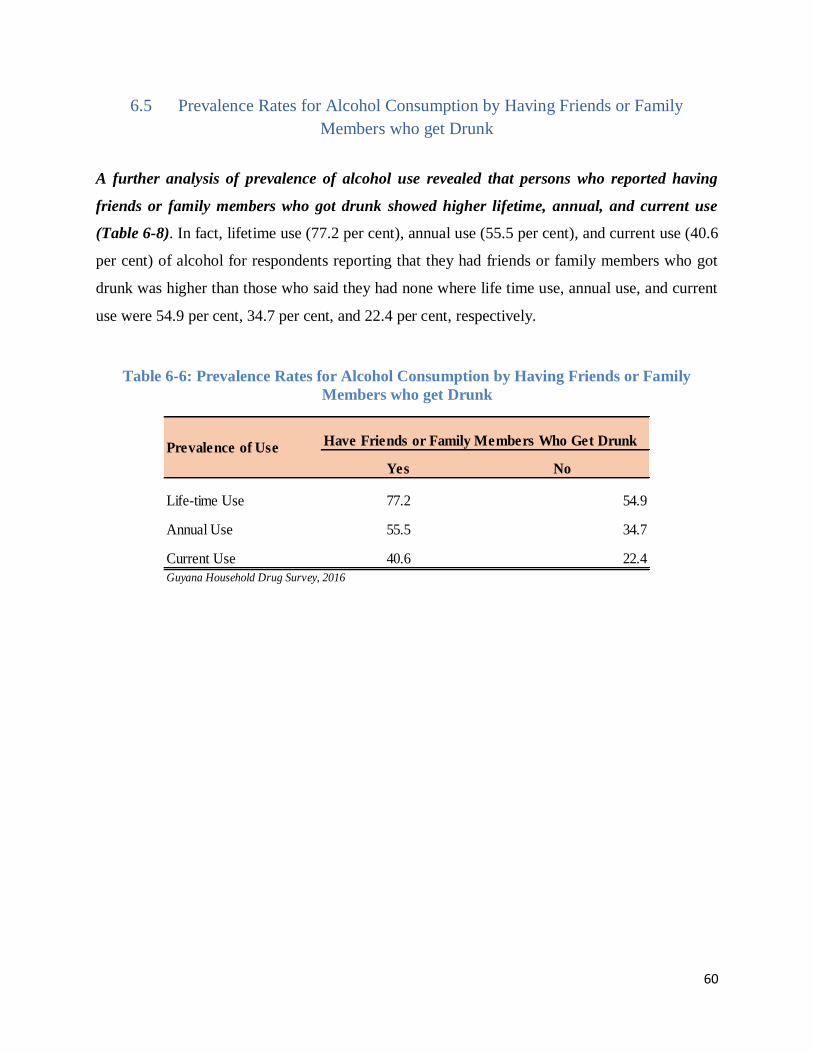
60
6.5 Prevalence Rates for Alcohol Consumption by Having Friends or Family
Members who get Drunk
A further analysis of prevalence of alcohol use revealed that persons who reported having
friends or family members who got drunk showed higher lifetime, annual, and current use
(Table 6-8). In fact, lifetime use (77.2 per cent), annual use (55.5 per cent), and current use (40.6
per cent) of alcohol for respondents reporting that they had friends or family members who got
drunk was higher than those who said they had none where life time use, annual use, and current
use were 54.9 per cent, 34.7 per cent, and 22.4 per cent, respectively.
Table 6-6: Prevalence Rates for Alcohol Consumption by Having Friends or Family
Members who get Drunk
Yes No
Life-time Use 77.2 54.9
Annual Use 55.5 34.7
Current Use 40.6 22.4
Have Friends or Family Members Who Get DrunkPrevalence of Use
Guyana Household Drug Survey, 2016
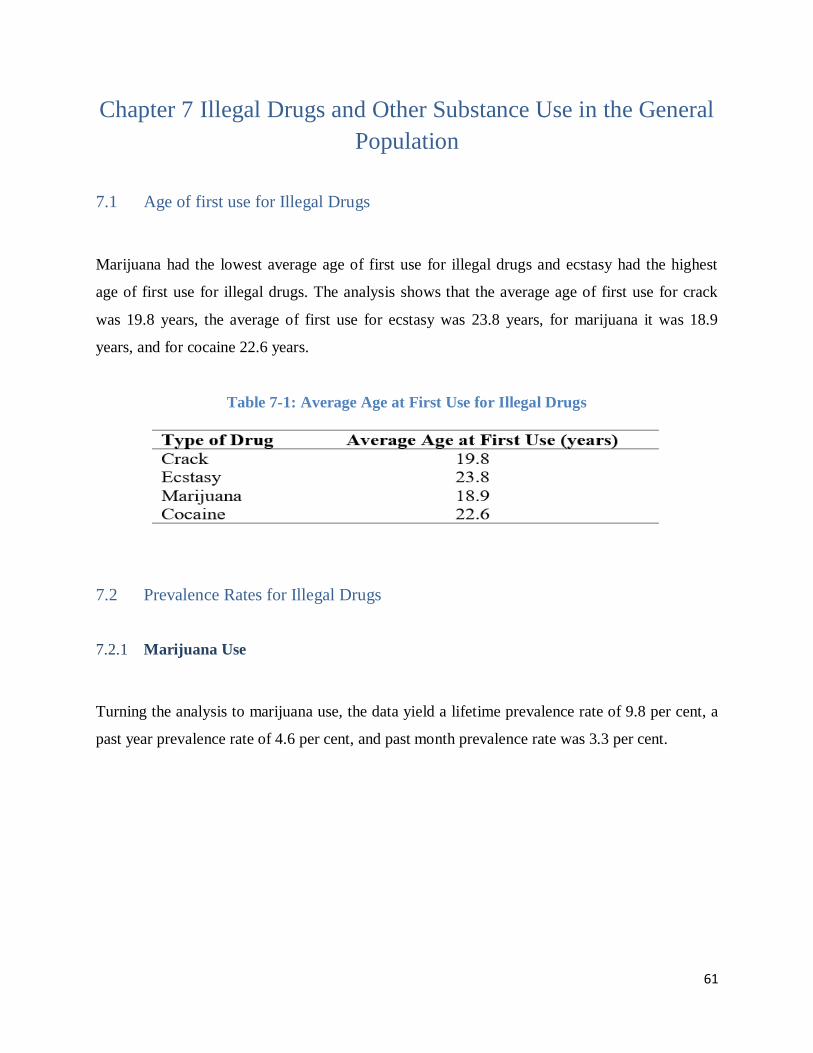
61
Chapter 7 Illegal Drugs and Other Substance Use in the General
Population
7.1 Age of first use for Illegal Drugs
Marijuana had the lowest average age of first use for illegal drugs and ecstasy had the highest
age of first use for illegal drugs. The analysis shows that the average age of first use for crack
was 19.8 years, the average of first use for ecstasy was 23.8 years, for marijuana it was 18.9
years, and for cocaine 22.6 years.
Table 7-1: Average Age at First Use for Illegal Drugs
7.2 Prevalence Rates for Illegal Drugs
7.2.1 Marijuana Use
Turning the analysis to marijuana use, the data yield a lifetime prevalence rate of 9.8 per cent, a
past year prevalence rate of 4.6 per cent, and past month prevalence rate was 3.3 per cent.
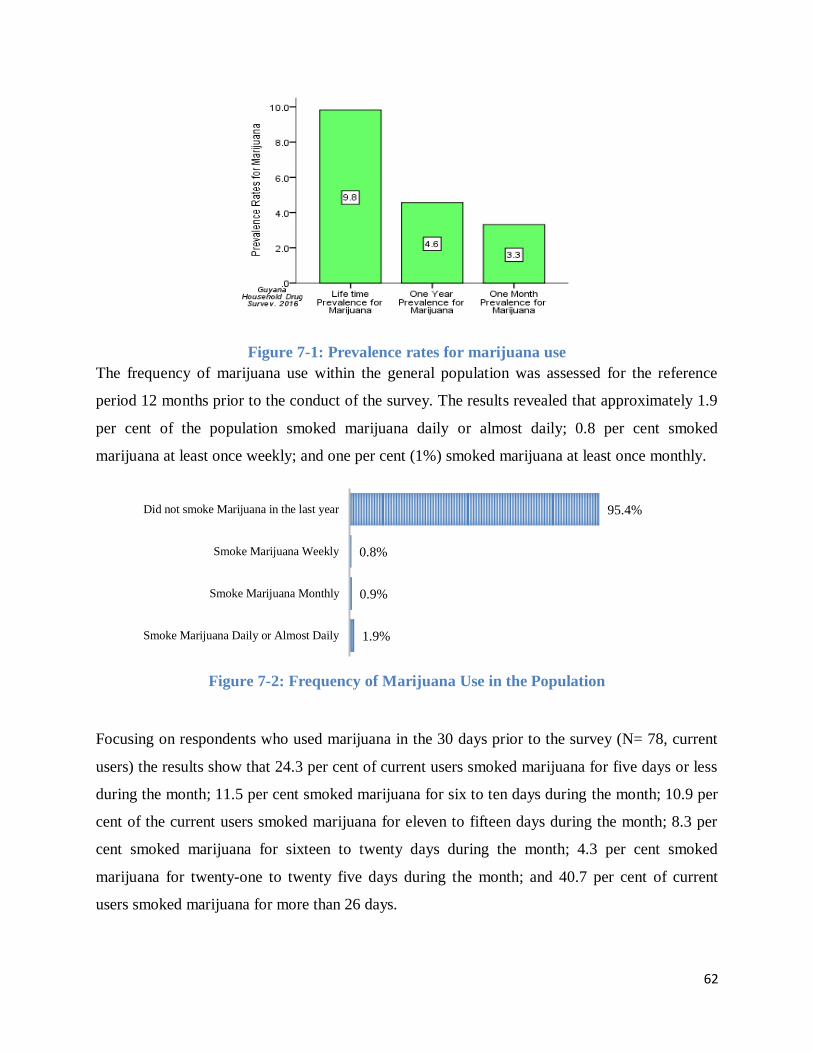
62
Figure 7-1: Prevalence rates for marijuana use
The frequency of marijuana use within the general population was assessed for the reference
period 12 months prior to the conduct of the survey. The results revealed that approximately 1.9
per cent of the population smoked marijuana daily or almost daily; 0.8 per cent smoked
marijuana at least once weekly; and one per cent (1%) smoked marijuana at least once monthly.
Figure 7-2: Frequency of Marijuana Use in the Population
Focusing on respondents who used marijuana in the 30 days prior to the survey (N= 78, current
users) the results show that 24.3 per cent of current users smoked marijuana for five days or less
during the month; 11.5 per cent smoked marijuana for six to ten days during the month; 10.9 per
cent of the current users smoked marijuana for eleven to fifteen days during the month; 8.3 per
cent smoked marijuana for sixteen to twenty days during the month; 4.3 per cent smoked
marijuana for twenty-one to twenty five days during the month; and 40.7 per cent of current
users smoked marijuana for more than 26 days.
1.9%
0.9%
0.8%
95.4%
Smoke Marijuana Daily or Almost Daily
Smoke Marijuana Monthly
Smoke Marijuana Weekly
Did not smoke Marijuana in the last year
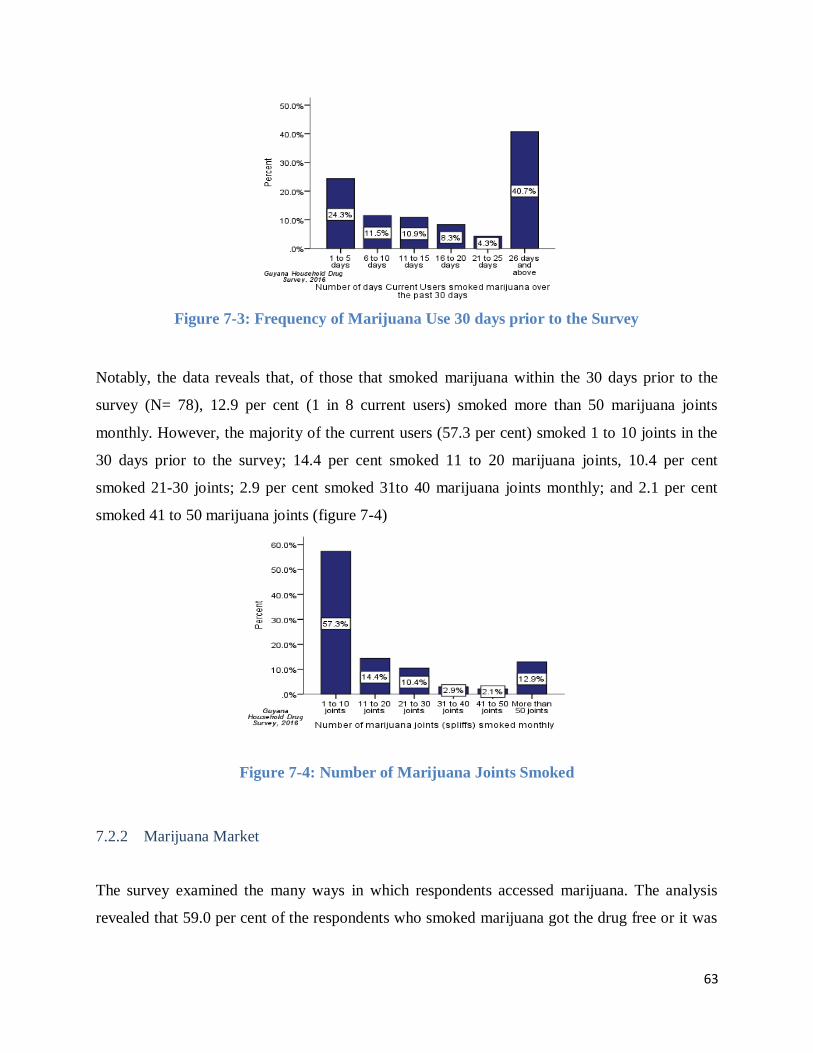
63
Figure 7-3: Frequency of Marijuana Use 30 days prior to the Survey
Notably, the data reveals that, of those that smoked marijuana within the 30 days prior to the
survey (N= 78), 12.9 per cent (1 in 8 current users) smoked more than 50 marijuana joints
monthly. However, the majority of the current users (57.3 per cent) smoked 1 to 10 joints in the
30 days prior to the survey; 14.4 per cent smoked 11 to 20 marijuana joints, 10.4 per cent
smoked 21-30 joints; 2.9 per cent smoked 31to 40 marijuana joints monthly; and 2.1 per cent
smoked 41 to 50 marijuana joints (figure 7-4)
Figure 7-4: Number of Marijuana Joints Smoked
7.2.2 Marijuana Market
The survey examined the many ways in which respondents accessed marijuana. The analysis
revealed that 59.0 per cent of the respondents who smoked marijuana got the drug free or it was
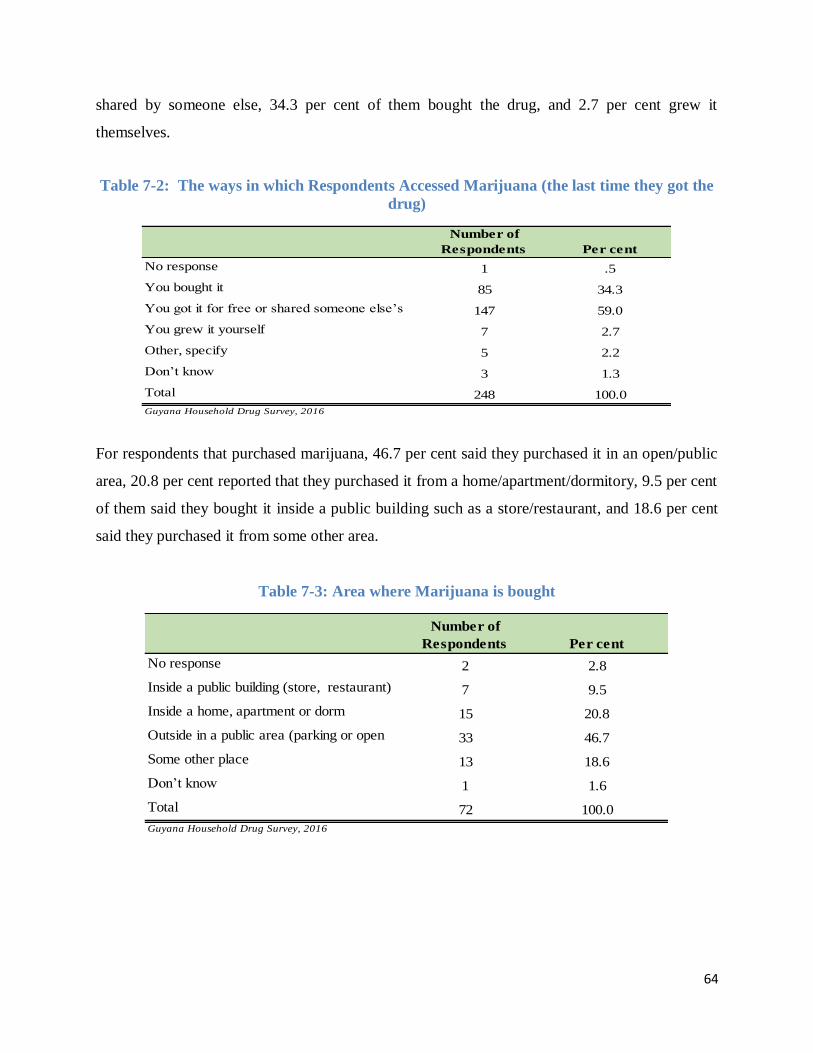
64
shared by someone else, 34.3 per cent of them bought the drug, and 2.7 per cent grew it
themselves.
Table 7-2: The ways in which Respondents Accessed Marijuana (the last time they got the
drug)
For respondents that purchased marijuana, 46.7 per cent said they purchased it in an open/public
area, 20.8 per cent reported that they purchased it from a home/apartment/dormitory, 9.5 per cent
of them said they bought it inside a public building such as a store/restaurant, and 18.6 per cent
said they purchased it from some other area.
Table 7-3: Area where Marijuana is bought
Number of
Respondents Per cent
No response 1 .5
You bought it 85 34.3
You got it for free or shared someone else’s 147 59.0
You grew it yourself 7 2.7
Other, specify 5 2.2
Don’t know 3 1.3
Total 248 100.0
Guyana Household Drug Survey, 2016
Number of
Respondents Per cent
No response 2 2.8
Inside a public building (store, restaurant) 7 9.5
Inside a home, apartment or dorm 15 20.8
Outside in a public area (parking or open
lot)33 46.7
Some other place 13 18.6
Don’t know 1 1.6
Total 72 100.0
Guyana Household Drug Survey, 2016
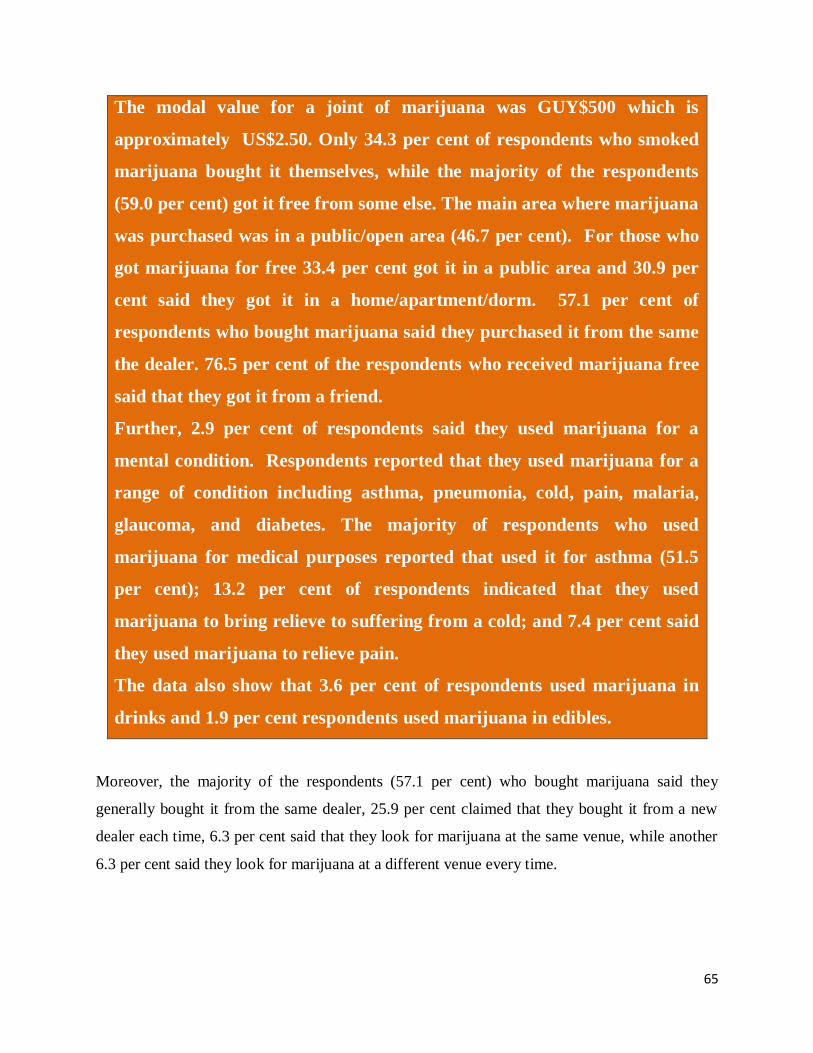
65
The modal value for a joint of marijuana was GUY$500 which is
approximately US$2.50. Only 34.3 per cent of respondents who smoked
marijuana bought it themselves, while the majority of the respondents
(59.0 per cent) got it free from some else. The main area where marijuana
was purchased was in a public/open area (46.7 per cent). For those who
got marijuana for free 33.4 per cent got it in a public area and 30.9 per
cent said they got it in a home/apartment/dorm. 57.1 per cent of
respondents who bought marijuana said they purchased it from the same
the dealer. 76.5 per cent of the respondents who received marijuana free
said that they got it from a friend.
Further, 2.9 per cent of respondents said they used marijuana for a
mental condition. Respondents reported that they used marijuana for a
range of condition including asthma, pneumonia, cold, pain, malaria,
glaucoma, and diabetes. The majority of respondents who used
marijuana for medical purposes reported that used it for asthma (51.5
per cent); 13.2 per cent of respondents indicated that they used
marijuana to bring relieve to suffering from a cold; and 7.4 per cent said
they used marijuana to relieve pain.
The data also show that 3.6 per cent of respondents used marijuana in
drinks and 1.9 per cent respondents used marijuana in edibles.
Moreover, the majority of the respondents (57.1 per cent) who bought marijuana said they
generally bought it from the same dealer, 25.9 per cent claimed that they bought it from a new
dealer each time, 6.3 per cent said that they look for marijuana at the same venue, while another
6.3 per cent said they look for marijuana at a different venue every time.
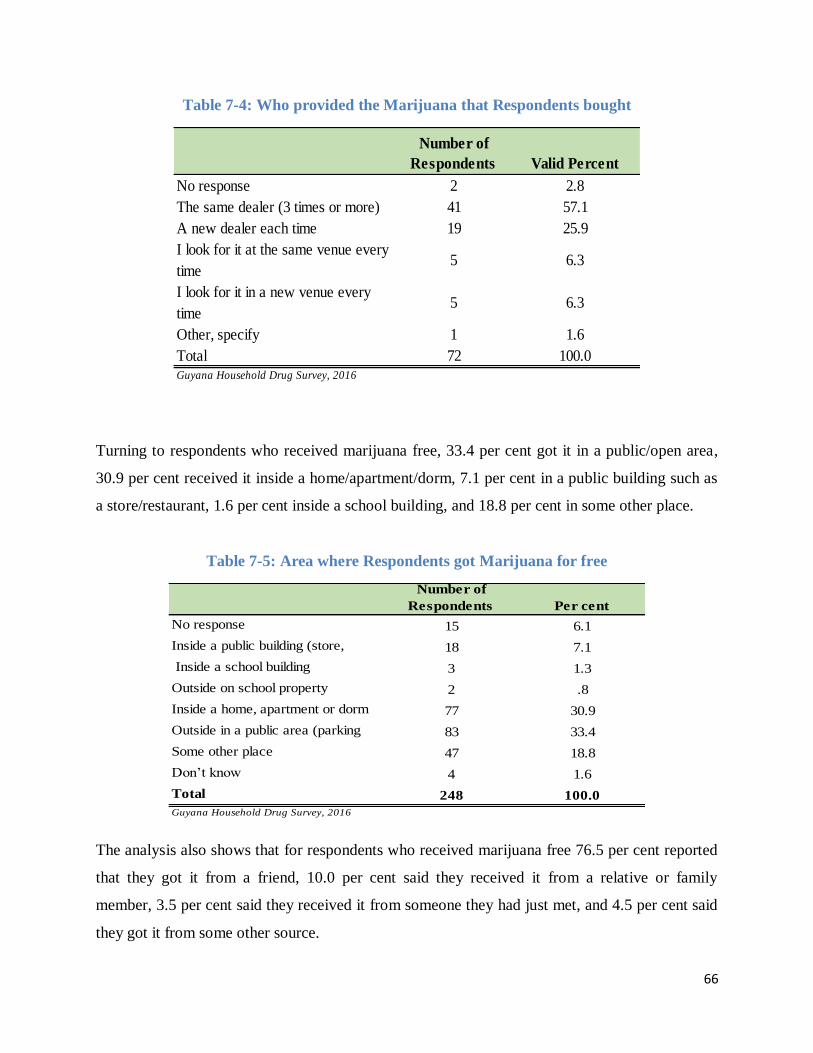
66
Table 7-4: Who provided the Marijuana that Respondents bought
Turning to respondents who received marijuana free, 33.4 per cent got it in a public/open area,
30.9 per cent received it inside a home/apartment/dorm, 7.1 per cent in a public building such as
a store/restaurant, 1.6 per cent inside a school building, and 18.8 per cent in some other place.
Table 7-5: Area where Respondents got Marijuana for free
The analysis also shows that for respondents who received marijuana free 76.5 per cent reported
that they got it from a friend, 10.0 per cent said they received it from a relative or family
member, 3.5 per cent said they received it from someone they had just met, and 4.5 per cent said
they got it from some other source.
Number of
Respondents Valid Percent
No response 2 2.8
The same dealer (3 times or more) 41 57.1
A new dealer each time 19 25.9
I look for it at the same venue every
time5 6.3
I look for it in a new venue every
time5 6.3
Other, specify 1 1.6
Total 72 100.0Guyana Household Drug Survey, 2016
Number of
Respondents Per cent
No response 15 6.1
Inside a public building (store,
restaurant)
18 7.1
Inside a school building 3 1.3
Outside on school property 2 .8
Inside a home, apartment or dorm 77 30.9
Outside in a public area (parking
lot)
83 33.4
Some other place 47 18.8
Don’t know 4 1.6
Total 248 100.0
Guyana Household Drug Survey, 2016
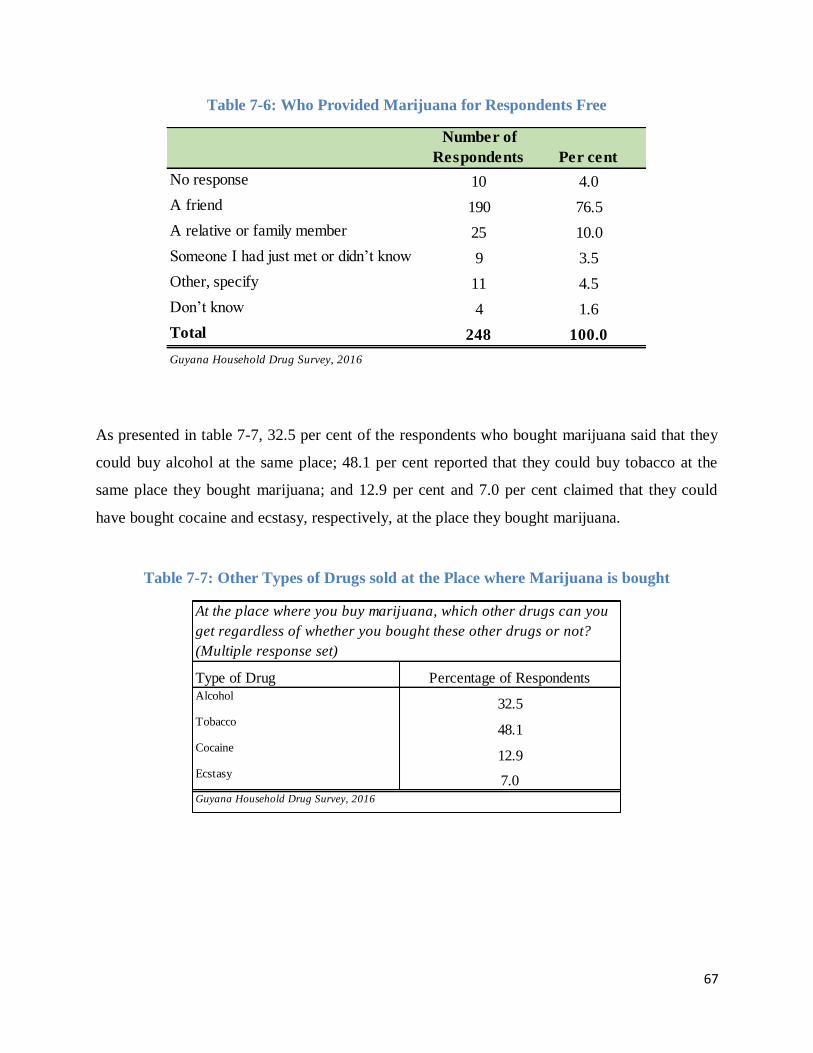
67
Table 7-6: Who Provided Marijuana for Respondents Free
As presented in table 7-7, 32.5 per cent of the respondents who bought marijuana said that they
could buy alcohol at the same place; 48.1 per cent reported that they could buy tobacco at the
same place they bought marijuana; and 12.9 per cent and 7.0 per cent claimed that they could
have bought cocaine and ecstasy, respectively, at the place they bought marijuana.
Table 7-7: Other Types of Drugs sold at the Place where Marijuana is bought
Number of
Respondents Per cent
No response 10 4.0
A friend 190 76.5
A relative or family member 25 10.0
Someone I had just met or didn’t know
well
9 3.5
Other, specify 11 4.5
Don’t know 4 1.6
Total 248 100.0
Guyana Household Drug Survey, 2016
Type of Drug Percentage of RespondentsAlcohol
32.5Tobacco
48.1Cocaine
12.9Ecstasy
7.0Guyana Household Drug Survey, 2016
At the place where you buy marijuana, which other drugs can you
get regardless of whether you bought these other drugs or not?
(Multiple response set)
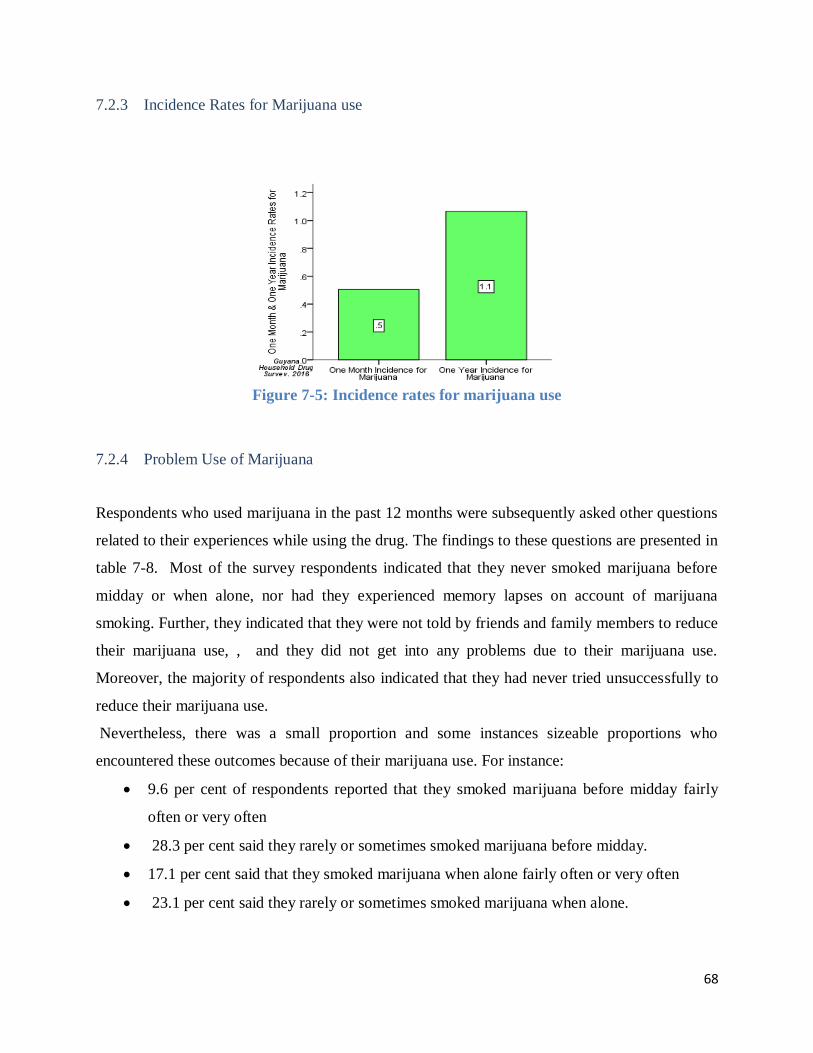
68
7.2.3 Incidence Rates for Marijuana use
Figure 7-5: Incidence rates for marijuana use
7.2.4 Problem Use of Marijuana
Respondents who used marijuana in the past 12 months were subsequently asked other questions
related to their experiences while using the drug. The findings to these questions are presented in
table 7-8. Most of the survey respondents indicated that they never smoked marijuana before
midday or when alone, nor had they experienced memory lapses on account of marijuana
smoking. Further, they indicated that they were not told by friends and family members to reduce
their marijuana use, , and they did not get into any problems due to their marijuana use.
Moreover, the majority of respondents also indicated that they had never tried unsuccessfully to
reduce their marijuana use.
Nevertheless, there was a small proportion and some instances sizeable proportions who
encountered these outcomes because of their marijuana use. For instance:
9.6 per cent of respondents reported that they smoked marijuana before midday fairly
often or very often
28.3 per cent said they rarely or sometimes smoked marijuana before midday.
17.1 per cent said that they smoked marijuana when alone fairly often or very often
23.1 per cent said they rarely or sometimes smoked marijuana when alone.
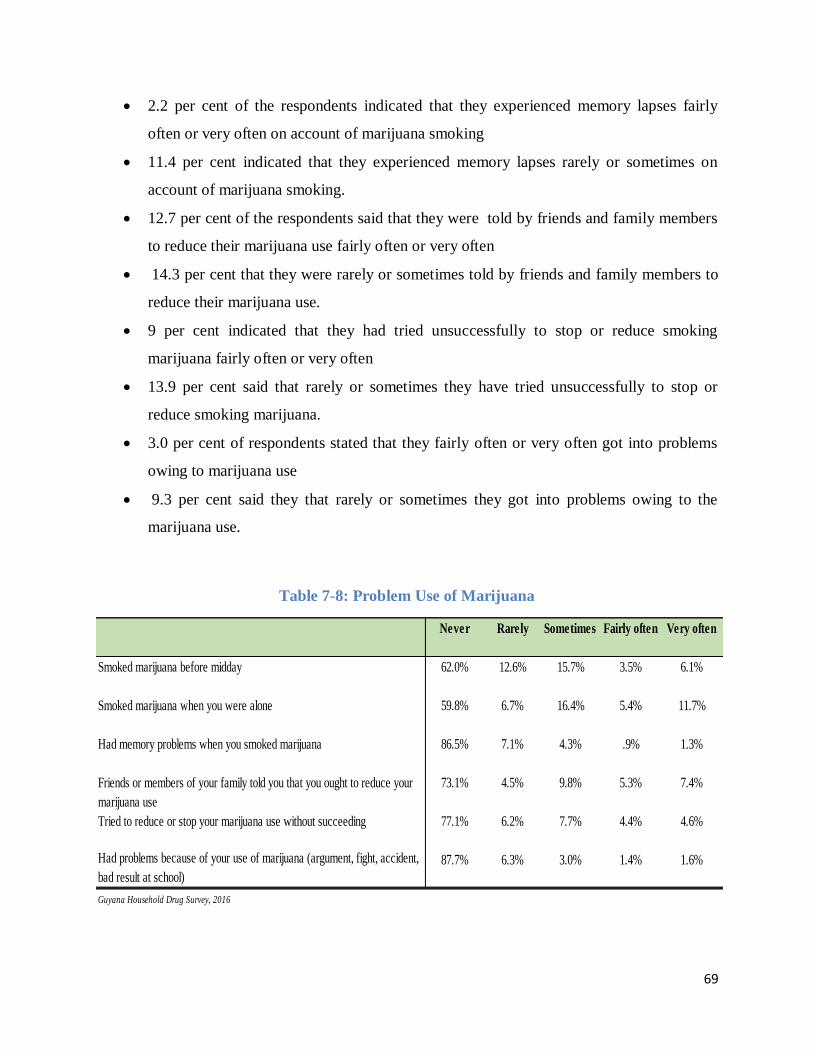
69
2.2 per cent of the respondents indicated that they experienced memory lapses fairly
often or very often on account of marijuana smoking
11.4 per cent indicated that they experienced memory lapses rarely or sometimes on
account of marijuana smoking.
12.7 per cent of the respondents said that they were told by friends and family members
to reduce their marijuana use fairly often or very often
14.3 per cent that they were rarely or sometimes told by friends and family members to
reduce their marijuana use.
9 per cent indicated that they had tried unsuccessfully to stop or reduce smoking
marijuana fairly often or very often
13.9 per cent said that rarely or sometimes they have tried unsuccessfully to stop or
reduce smoking marijuana.
3.0 per cent of respondents stated that they fairly often or very often got into problems
owing to marijuana use
9.3 per cent said they that rarely or sometimes they got into problems owing to the
marijuana use.
Table 7-8: Problem Use of Marijuana
Never Rarely Sometimes Fairly often Very often
Smoked marijuana before midday 62.0% 12.6% 15.7% 3.5% 6.1%
Smoked marijuana when you were alone 59.8% 6.7% 16.4% 5.4% 11.7%
Had memory problems when you smoked marijuana 86.5% 7.1% 4.3% .9% 1.3%
Friends or members of your family told you that you ought to reduce your
marijuana use
73.1% 4.5% 9.8% 5.3% 7.4%
Tried to reduce or stop your marijuana use without succeeding 77.1% 6.2% 7.7% 4.4% 4.6%
Had problems because of your use of marijuana (argument, fight, accident,
bad result at school)
87.7% 6.3% 3.0% 1.4% 1.6%
Guyana Household Drug Survey, 2016
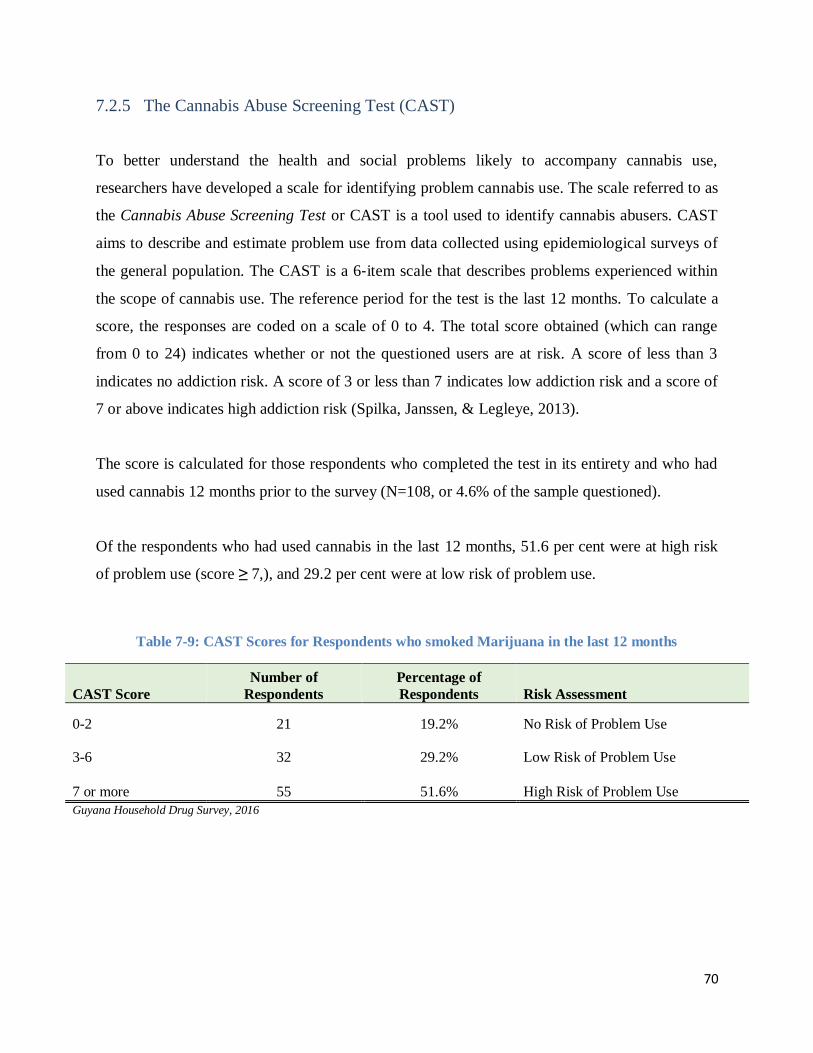
70
7.2.5 The Cannabis Abuse Screening Test (CAST)
To better understand the health and social problems likely to accompany cannabis use,
researchers have developed a scale for identifying problem cannabis use. The scale referred to as
the Cannabis Abuse Screening Test or CAST is a tool used to identify cannabis abusers. CAST
aims to describe and estimate problem use from data collected using epidemiological surveys of
the general population. The CAST is a 6‐item scale that describes problems experienced within
the scope of cannabis use. The reference period for the test is the last 12 months. To calculate a
score, the responses are coded on a scale of 0 to 4. The total score obtained (which can range
from 0 to 24) indicates whether or not the questioned users are at risk. A score of less than 3
indicates no addiction risk. A score of 3 or less than 7 indicates low addiction risk and a score of
7 or above indicates high addiction risk (Spilka, Janssen, & Legleye, 2013).
The score is calculated for those respondents who completed the test in its entirety and who had
used cannabis 12 months prior to the survey (N=108, or 4.6% of the sample questioned).
Of the respondents who had used cannabis in the last 12 months, 51.6 per cent were at high risk
of problem use (score ≥ 7,), and 29.2 per cent were at low risk of problem use.
Table 7-9: CAST Scores for Respondents who smoked Marijuana in the last 12 months
CAST Score
Number of
Respondents
Percentage of
Respondents Risk Assessment
0-2 21 19.2% No Risk of Problem Use
3-6 32 29.2% Low Risk of Problem Use
7 or more 55 51.6% High Risk of Problem Use
Guyana Household Drug Survey, 2016
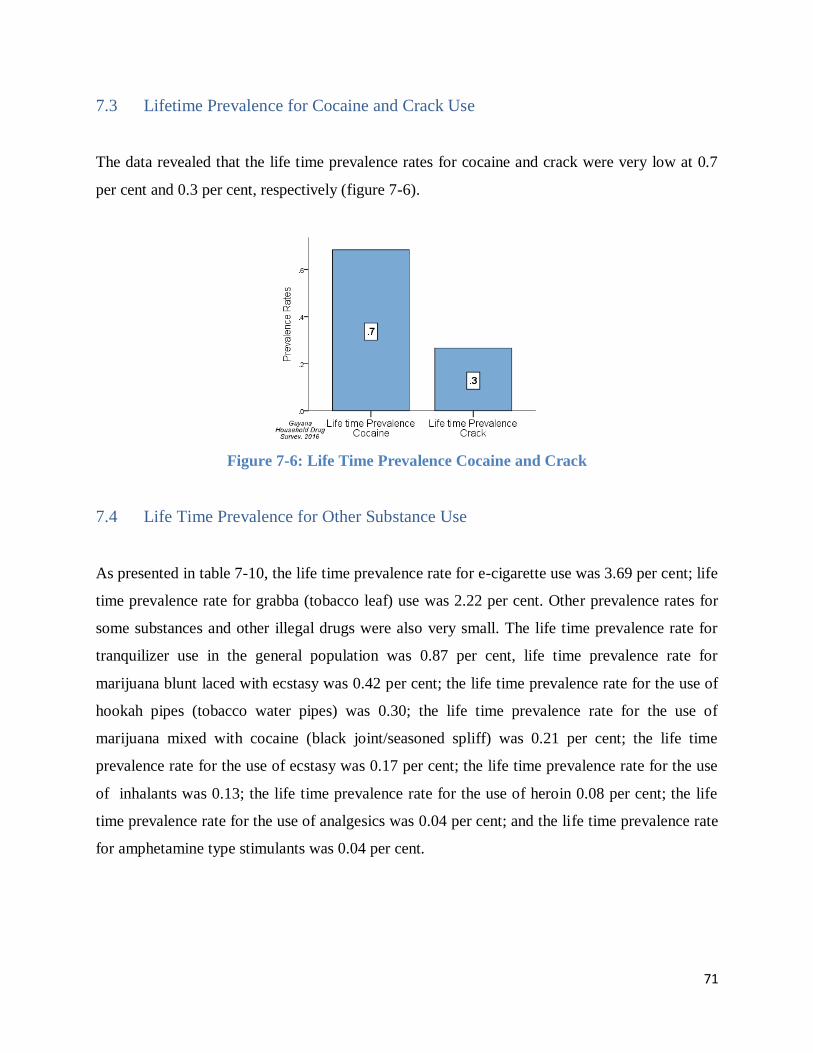
71
7.3 Lifetime Prevalence for Cocaine and Crack Use
The data revealed that the life time prevalence rates for cocaine and crack were very low at 0.7
per cent and 0.3 per cent, respectively (figure 7-6).
Figure 7-6: Life Time Prevalence Cocaine and Crack
7.4 Life Time Prevalence for Other Substance Use
As presented in table 7-10, the life time prevalence rate for e-cigarette use was 3.69 per cent; life
time prevalence rate for grabba (tobacco leaf) use was 2.22 per cent. Other prevalence rates for
some substances and other illegal drugs were also very small. The life time prevalence rate for
tranquilizer use in the general population was 0.87 per cent, life time prevalence rate for
marijuana blunt laced with ecstasy was 0.42 per cent; the life time prevalence rate for the use of
hookah pipes (tobacco water pipes) was 0.30; the life time prevalence rate for the use of
marijuana mixed with cocaine (black joint/seasoned spliff) was 0.21 per cent; the life time
prevalence rate for the use of ecstasy was 0.17 per cent; the life time prevalence rate for the use
of inhalants was 0.13; the life time prevalence rate for the use of heroin 0.08 per cent; the life
time prevalence rate for the use of analgesics was 0.04 per cent; and the life time prevalence rate
for amphetamine type stimulants was 0.04 per cent.
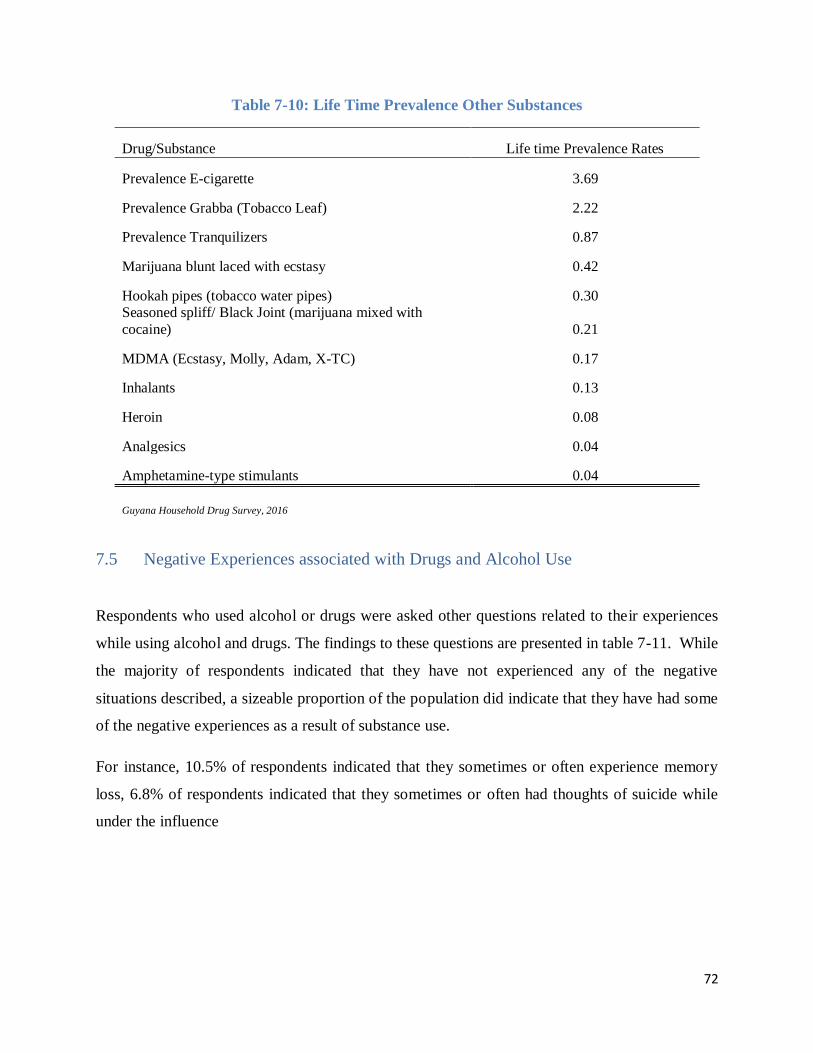
72
Table 7-10: Life Time Prevalence Other Substances
Drug/Substance Life time Prevalence Rates
Prevalence E-cigarette 3.69
Prevalence Grabba (Tobacco Leaf) 2.22
Prevalence Tranquilizers 0.87
Marijuana blunt laced with ecstasy 0.42
Hookah pipes (tobacco water pipes) 0.30 Seasoned spliff/ Black Joint (marijuana mixed with
cocaine) 0.21
MDMA (Ecstasy, Molly, Adam, X-TC) 0.17
Inhalants 0.13
Heroin 0.08
Analgesics 0.04
Amphetamine-type stimulants 0.04
Guyana Household Drug Survey, 2016
7.5 Negative Experiences associated with Drugs and Alcohol Use
Respondents who used alcohol or drugs were asked other questions related to their experiences
while using alcohol and drugs. The findings to these questions are presented in table 7-11. While
the majority of respondents indicated that they have not experienced any of the negative
situations described, a sizeable proportion of the population did indicate that they have had some
of the negative experiences as a result of substance use.
For instance, 10.5% of respondents indicated that they sometimes or often experience memory
loss, 6.8% of respondents indicated that they sometimes or often had thoughts of suicide while
under the influence
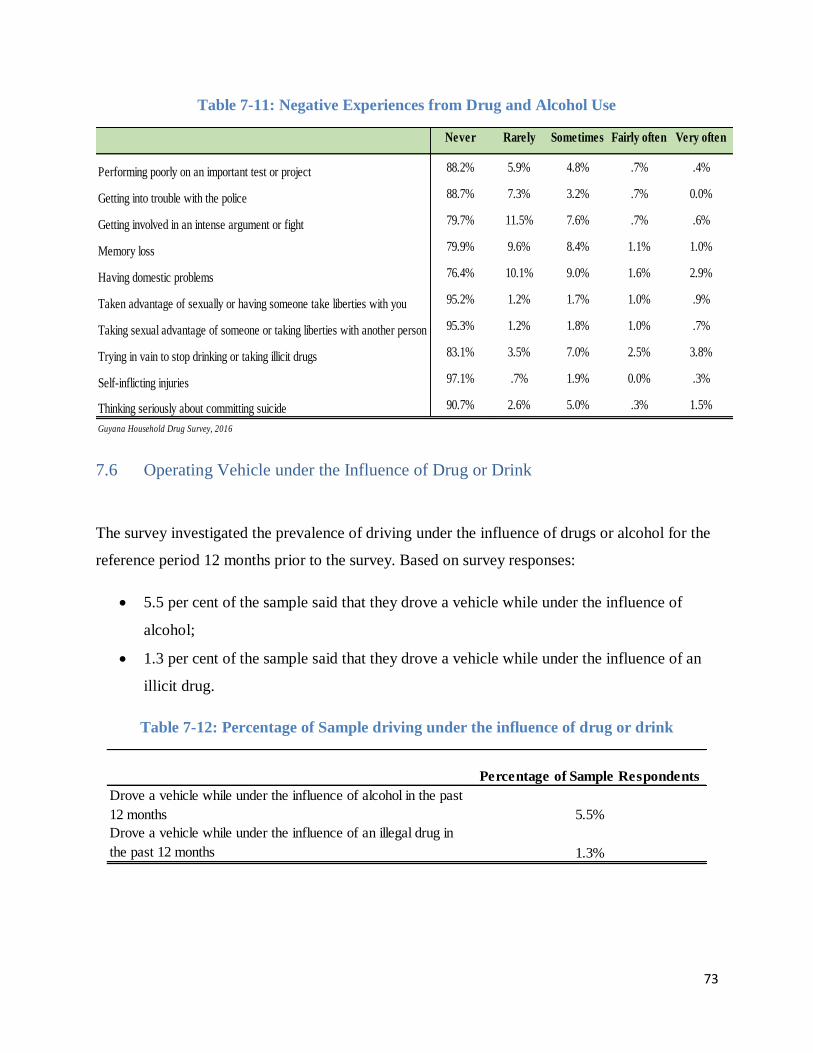
73
Table 7-11: Negative Experiences from Drug and Alcohol Use
7.6 Operating Vehicle under the Influence of Drug or Drink
The survey investigated the prevalence of driving under the influence of drugs or alcohol for the
reference period 12 months prior to the survey. Based on survey responses:
5.5 per cent of the sample said that they drove a vehicle while under the influence of
alcohol;
1.3 per cent of the sample said that they drove a vehicle while under the influence of an
illicit drug.
Table 7-12: Percentage of Sample driving under the influence of drug or drink
Never Rarely Sometimes Fairly often Very often
Performing poorly on an important test or project 88.2% 5.9% 4.8% .7% .4%
Getting into trouble with the police 88.7% 7.3% 3.2% .7% 0.0%
Getting involved in an intense argument or fight 79.7% 11.5% 7.6% .7% .6%
Memory loss 79.9% 9.6% 8.4% 1.1% 1.0%
Having domestic problems 76.4% 10.1% 9.0% 1.6% 2.9%
Taken advantage of sexually or having someone take liberties with you 95.2% 1.2% 1.7% 1.0% .9%
Taking sexual advantage of someone or taking liberties with another person 95.3% 1.2% 1.8% 1.0% .7%
Trying in vain to stop drinking or taking illicit drugs 83.1% 3.5% 7.0% 2.5% 3.8%
Self-inflicting injuries 97.1% .7% 1.9% 0.0% .3%
Thinking seriously about committing suicide 90.7% 2.6% 5.0% .3% 1.5%
Guyana Household Drug Survey, 2016
Percentage of Sample Respondents
Drove a vehicle while under the influence of alcohol in the past
12 months 5.5%
Drove a vehicle while under the influence of an illegal drug in
the past 12 months 1.3%
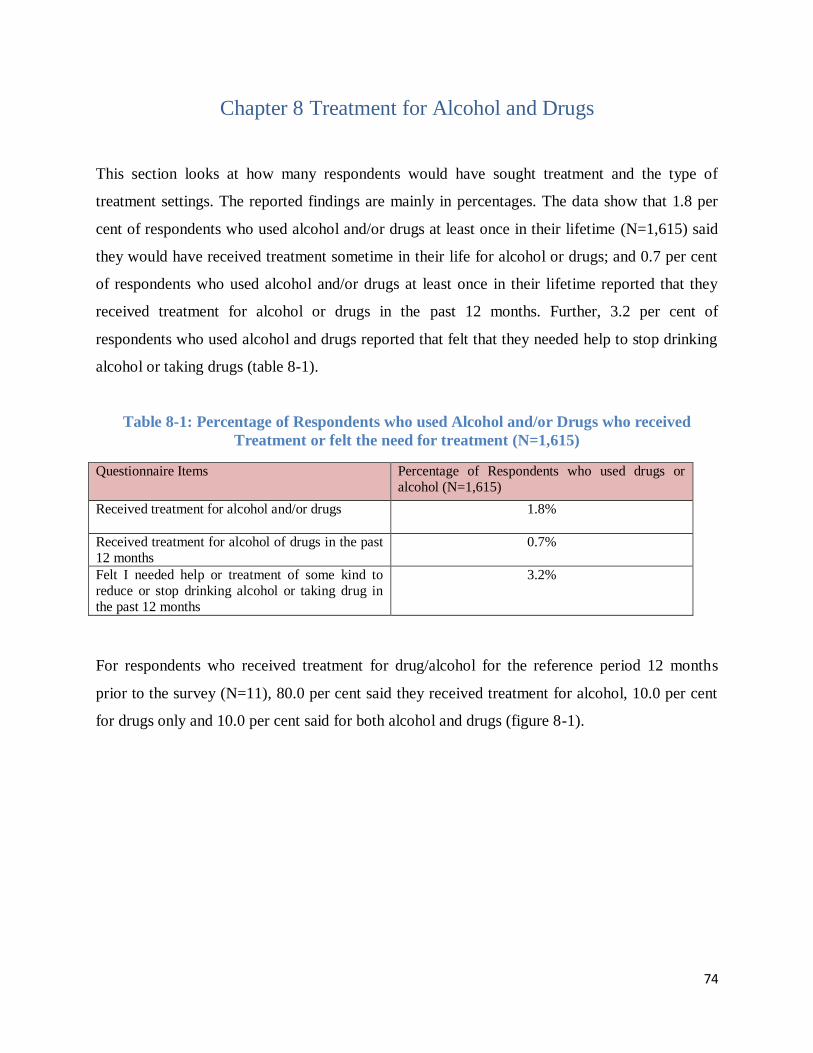
74
Chapter 8 Treatment for Alcohol and Drugs
This section looks at how many respondents would have sought treatment and the type of
treatment settings. The reported findings are mainly in percentages. The data show that 1.8 per
cent of respondents who used alcohol and/or drugs at least once in their lifetime (N=1,615) said
they would have received treatment sometime in their life for alcohol or drugs; and 0.7 per cent
of respondents who used alcohol and/or drugs at least once in their lifetime reported that they
received treatment for alcohol or drugs in the past 12 months. Further, 3.2 per cent of
respondents who used alcohol and drugs reported that felt that they needed help to stop drinking
alcohol or taking drugs (table 8-1).
Table 8-1: Percentage of Respondents who used Alcohol and/or Drugs who received
Treatment or felt the need for treatment (N=1,615)
Questionnaire Items Percentage of Respondents who used drugs or
alcohol (N=1,615)
Received treatment for alcohol and/or drugs 1.8%
Received treatment for alcohol of drugs in the past
12 months
0.7%
Felt I needed help or treatment of some kind to
reduce or stop drinking alcohol or taking drug in
the past 12 months
3.2%
For respondents who received treatment for drug/alcohol for the reference period 12 months
prior to the survey (N=11), 80.0 per cent said they received treatment for alcohol, 10.0 per cent
for drugs only and 10.0 per cent said for both alcohol and drugs (figure 8-1).
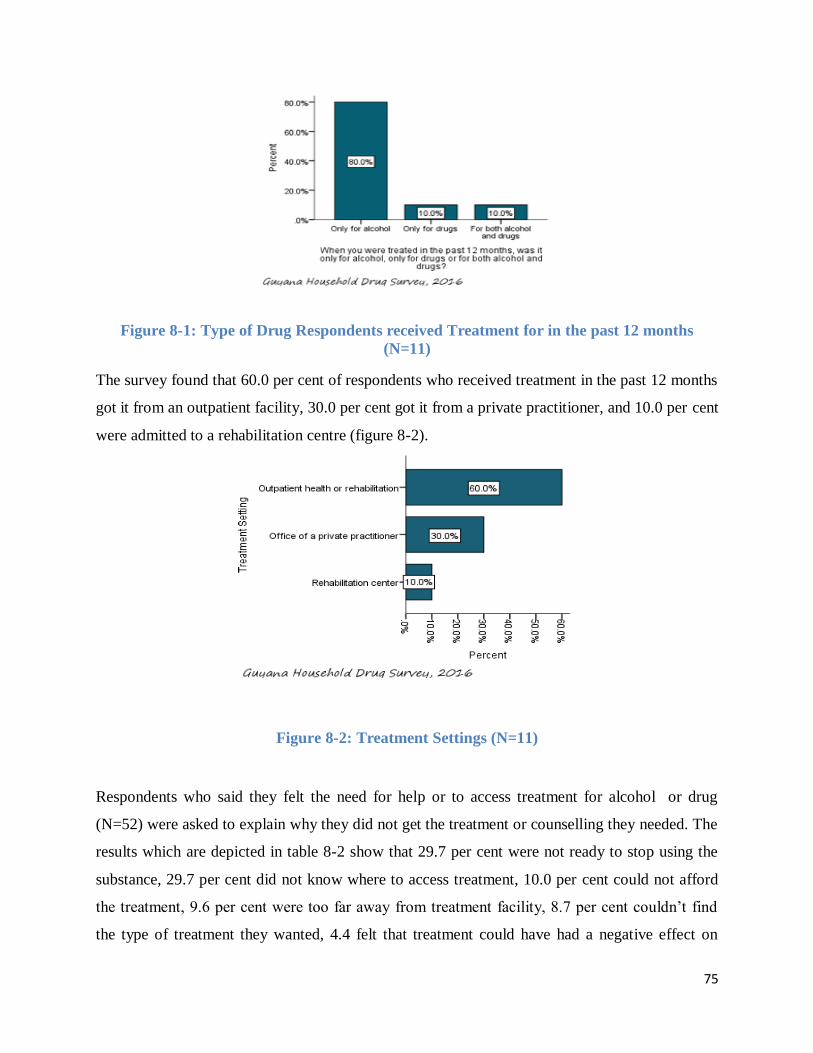
75
Figure 8-1: Type of Drug Respondents received Treatment for in the past 12 months
(N=11)
The survey found that 60.0 per cent of respondents who received treatment in the past 12 months
got it from an outpatient facility, 30.0 per cent got it from a private practitioner, and 10.0 per cent
were admitted to a rehabilitation centre (figure 8-2).
Figure 8-2: Treatment Settings (N=11)
Respondents who said they felt the need for help or to access treatment for alcohol or drug
(N=52) were asked to explain why they did not get the treatment or counselling they needed. The
results which are depicted in table 8-2 show that 29.7 per cent were not ready to stop using the
substance, 29.7 per cent did not know where to access treatment, 10.0 per cent could not afford
the treatment, 9.6 per cent were too far away from treatment facility, 8.7 per cent couldn’t find
the type of treatment they wanted, 4.4 felt that treatment could have had a negative effect on
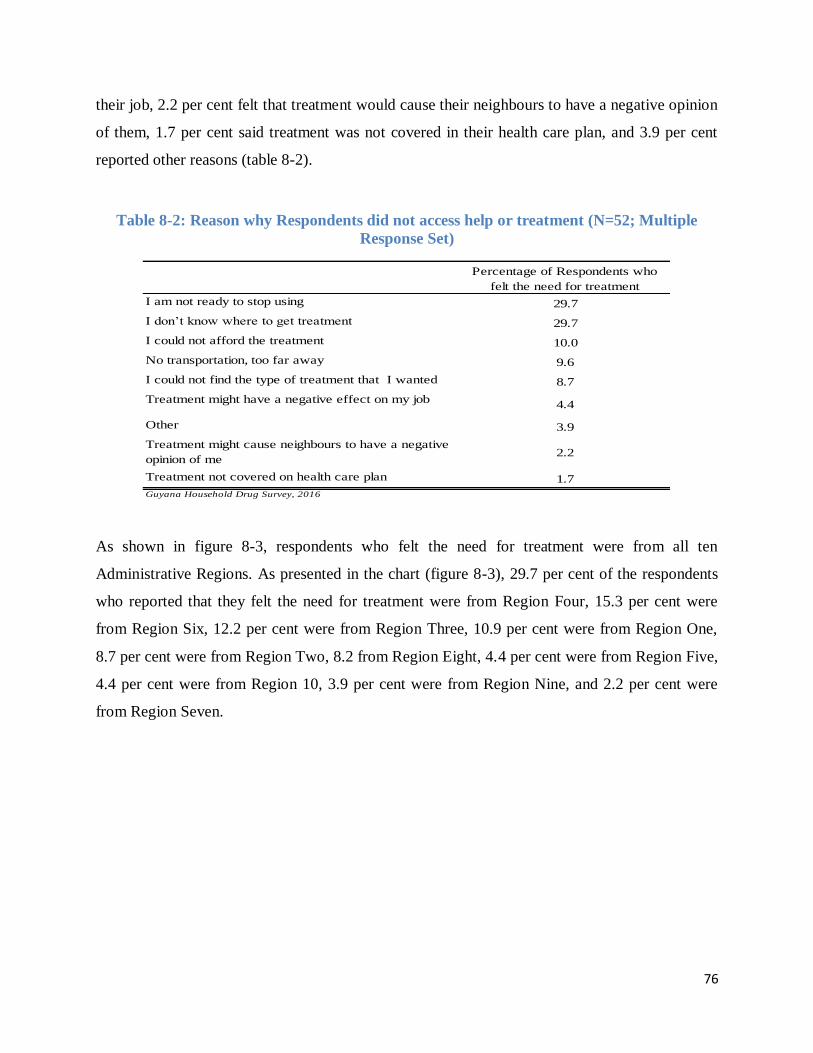
76
their job, 2.2 per cent felt that treatment would cause their neighbours to have a negative opinion
of them, 1.7 per cent said treatment was not covered in their health care plan, and 3.9 per cent
reported other reasons (table 8-2).
Table 8-2: Reason why Respondents did not access help or treatment (N=52; Multiple
Response Set)
As shown in figure 8-3, respondents who felt the need for treatment were from all ten
Administrative Regions. As presented in the chart (figure 8-3), 29.7 per cent of the respondents
who reported that they felt the need for treatment were from Region Four, 15.3 per cent were
from Region Six, 12.2 per cent were from Region Three, 10.9 per cent were from Region One,
8.7 per cent were from Region Two, 8.2 from Region Eight, 4.4 per cent were from Region Five,
4.4 per cent were from Region 10, 3.9 per cent were from Region Nine, and 2.2 per cent were
from Region Seven.
Percentage of Respondents who
felt the need for treatment
I am not ready to stop using 29.7
I don’t know where to get treatment 29.7
I could not afford the treatment 10.0
No transportation, too far away 9.6
I could not find the type of treatment that I wanted 8.7
Treatment might have a negative effect on my job4.4
Other 3.9
Treatment might cause neighbours to have a negative
opinion of me2.2
Treatment not covered on health care plan 1.7
Guyana Household Drug Survey, 2016
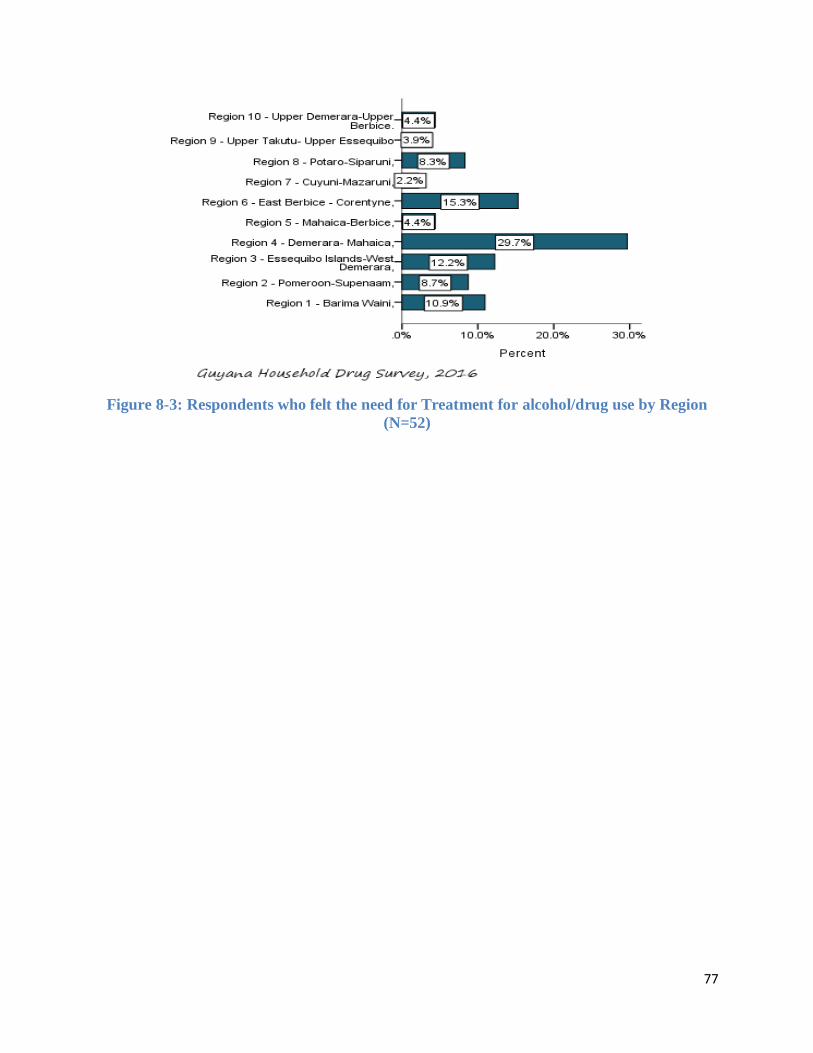
77
Figure 8-3: Respondents who felt the need for Treatment for alcohol/drug use by Region
(N=52)
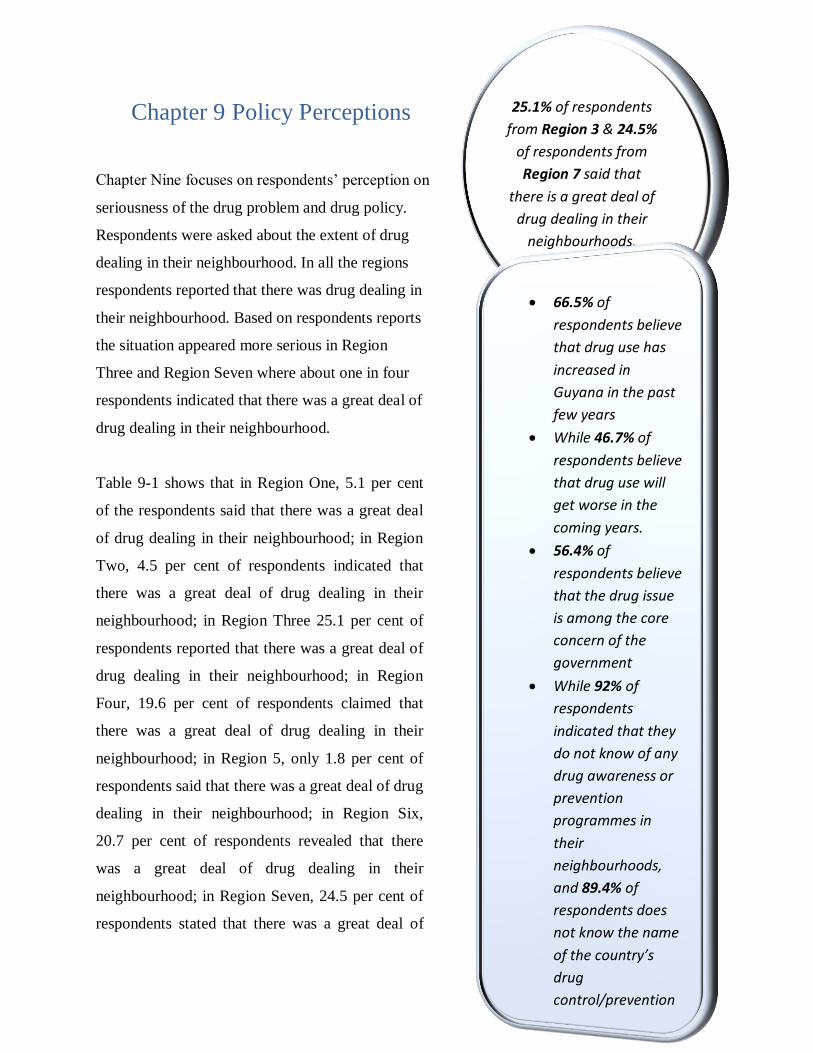
78
25.1% of respondents
from Region 3 & 24.5%
of respondents from
Region 7 said that
there is a great deal of
drug dealing in their
neighbourhoods.
66.5% of
respondents believe
that drug use has
increased in
Guyana in the past
few years
While 46.7% of
respondents believe
that drug use will
get worse in the
coming years.
56.4% of
respondents believe
that the drug issue
is among the core
concern of the
government
While 92% of
respondents
indicated that they
do not know of any
drug awareness or
prevention
programmes in
their
neighbourhoods,
and 89.4% of
respondents does
not know the name
of the country’s
drug
control/prevention
agency
Chapter 9 Policy Perceptions
Chapter Nine focuses on respondents’ perception on
seriousness of the drug problem and drug policy.
Respondents were asked about the extent of drug
dealing in their neighbourhood. In all the regions
respondents reported that there was drug dealing in
their neighbourhood. Based on respondents reports
the situation appeared more serious in Region
Three and Region Seven where about one in four
respondents indicated that there was a great deal of
drug dealing in their neighbourhood.
Table 9-1 shows that in Region One, 5.1 per cent
of the respondents said that there was a great deal
of drug dealing in their neighbourhood; in Region
Two, 4.5 per cent of respondents indicated that
there was a great deal of drug dealing in their
neighbourhood; in Region Three 25.1 per cent of
respondents reported that there was a great deal of
drug dealing in their neighbourhood; in Region
Four, 19.6 per cent of respondents claimed that
there was a great deal of drug dealing in their
neighbourhood; in Region 5, only 1.8 per cent of
respondents said that there was a great deal of drug
dealing in their neighbourhood; in Region Six,
20.7 per cent of respondents revealed that there
was a great deal of drug dealing in their
neighbourhood; in Region Seven, 24.5 per cent of
respondents stated that there was a great deal of
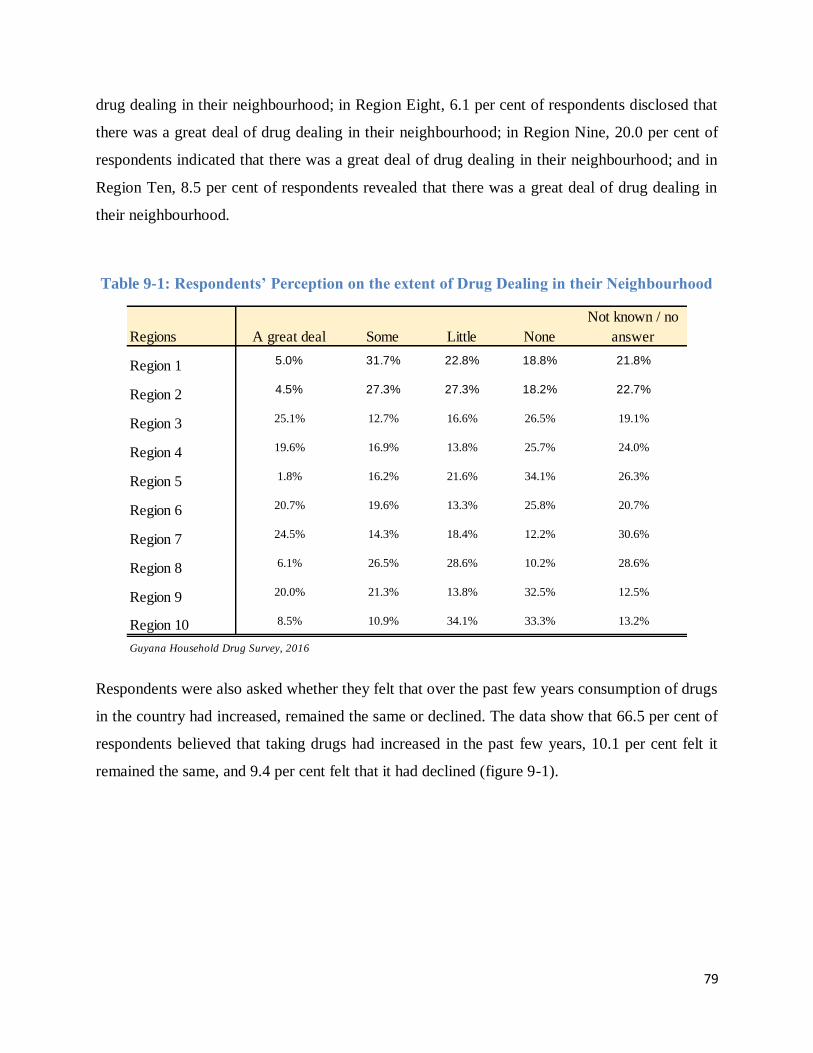
79
drug dealing in their neighbourhood; in Region Eight, 6.1 per cent of respondents disclosed that
there was a great deal of drug dealing in their neighbourhood; in Region Nine, 20.0 per cent of
respondents indicated that there was a great deal of drug dealing in their neighbourhood; and in
Region Ten, 8.5 per cent of respondents revealed that there was a great deal of drug dealing in
their neighbourhood.
Table 9-1: Respondents’ Perception on the extent of Drug Dealing in their Neighbourhood
Respondents were also asked whether they felt that over the past few years consumption of drugs
in the country had increased, remained the same or declined. The data show that 66.5 per cent of
respondents believed that taking drugs had increased in the past few years, 10.1 per cent felt it
remained the same, and 9.4 per cent felt that it had declined (figure 9-1).
Regions A great deal Some Little None
Not known / no
answer
Region 1 5.0% 31.7% 22.8% 18.8% 21.8%
Region 2 4.5% 27.3% 27.3% 18.2% 22.7%
Region 3 25.1% 12.7% 16.6% 26.5% 19.1%
Region 4 19.6% 16.9% 13.8% 25.7% 24.0%
Region 5 1.8% 16.2% 21.6% 34.1% 26.3%
Region 6 20.7% 19.6% 13.3% 25.8% 20.7%
Region 7 24.5% 14.3% 18.4% 12.2% 30.6%
Region 8 6.1% 26.5% 28.6% 10.2% 28.6%
Region 9 20.0% 21.3% 13.8% 32.5% 12.5%
Region 10 8.5% 10.9% 34.1% 33.3% 13.2%
Guyana Household Drug Survey, 2016
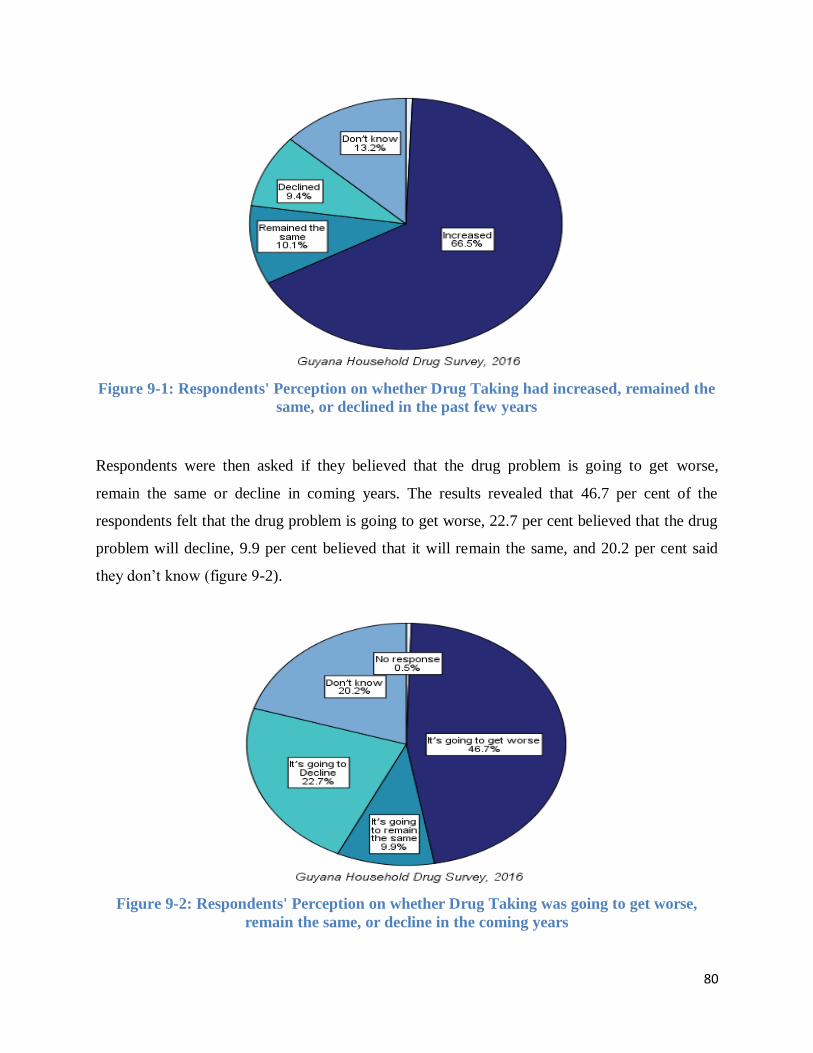
80
Figure 9-1: Respondents' Perception on whether Drug Taking had increased, remained the
same, or declined in the past few years
Respondents were then asked if they believed that the drug problem is going to get worse,
remain the same or decline in coming years. The results revealed that 46.7 per cent of the
respondents felt that the drug problem is going to get worse, 22.7 per cent believed that the drug
problem will decline, 9.9 per cent believed that it will remain the same, and 20.2 per cent said
they don’t know (figure 9-2).
Figure 9-2: Respondents' Perception on whether Drug Taking was going to get worse,
remain the same, or decline in the coming years
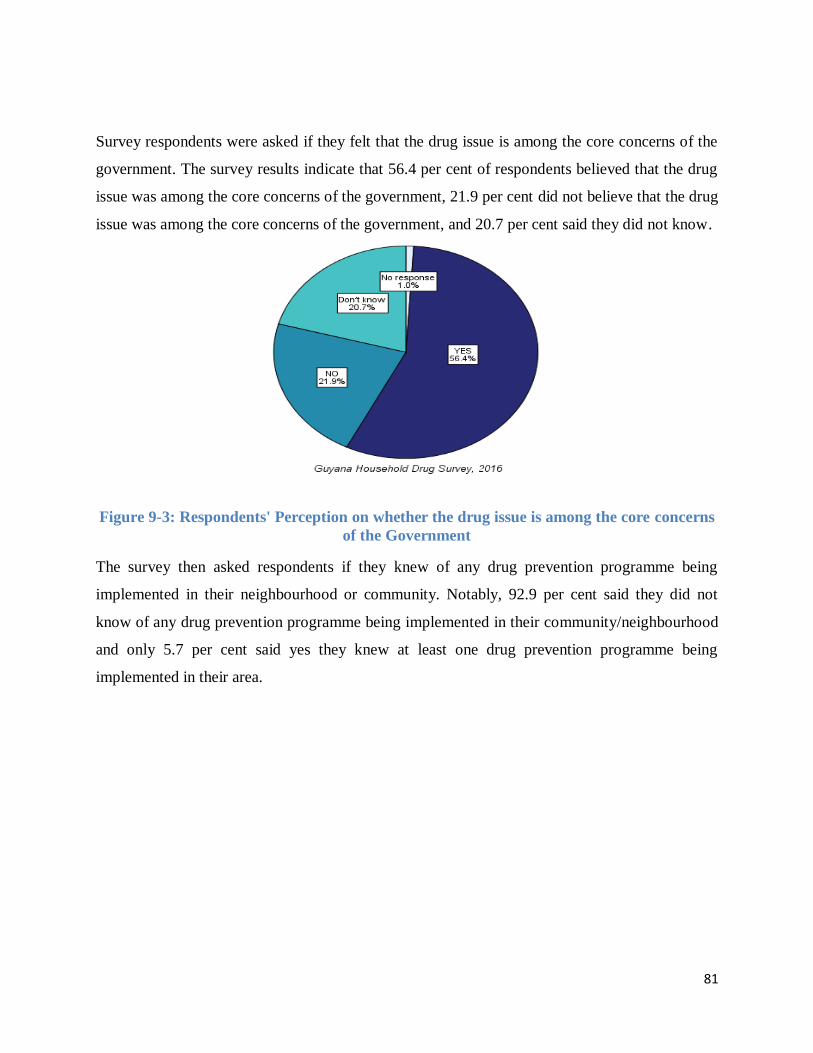
81
Survey respondents were asked if they felt that the drug issue is among the core concerns of the
government. The survey results indicate that 56.4 per cent of respondents believed that the drug
issue was among the core concerns of the government, 21.9 per cent did not believe that the drug
issue was among the core concerns of the government, and 20.7 per cent said they did not know.
Figure 9-3: Respondents' Perception on whether the drug issue is among the core concerns
of the Government
The survey then asked respondents if they knew of any drug prevention programme being
implemented in their neighbourhood or community. Notably, 92.9 per cent said they did not
know of any drug prevention programme being implemented in their community/neighbourhood
and only 5.7 per cent said yes they knew at least one drug prevention programme being
implemented in their area.
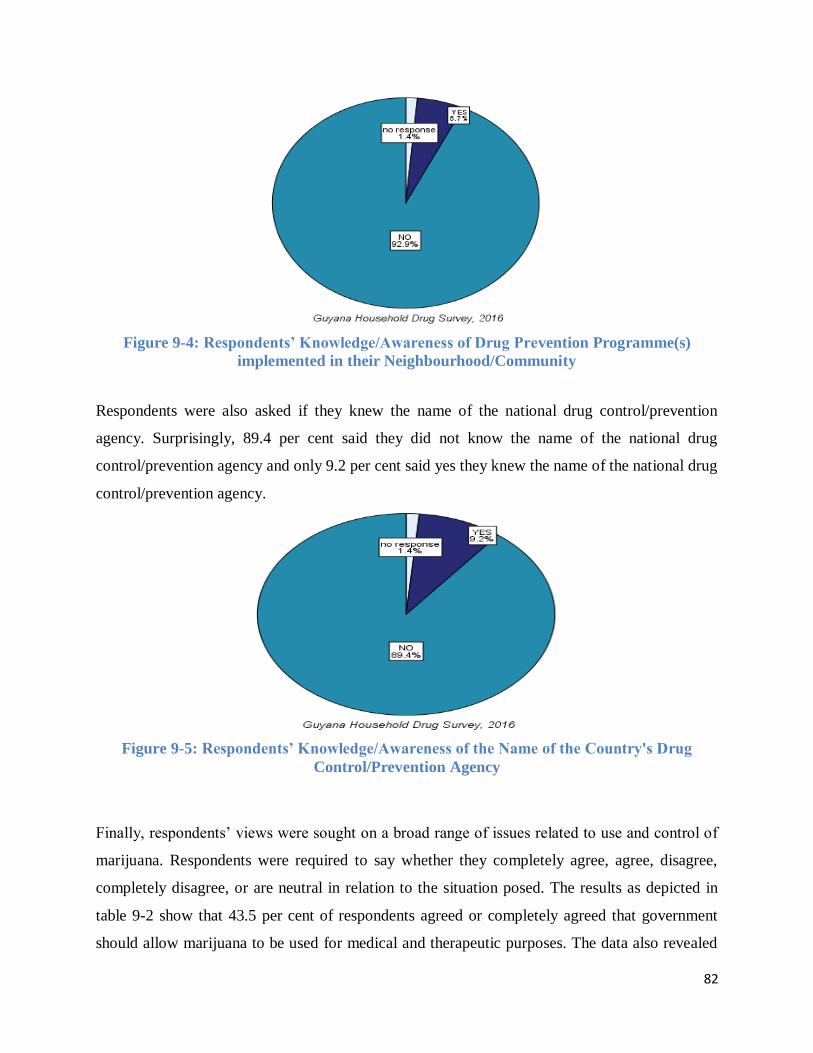
82
Figure 9-4: Respondents’ Knowledge/Awareness of Drug Prevention Programme(s)
implemented in their Neighbourhood/Community
Respondents were also asked if they knew the name of the national drug control/prevention
agency. Surprisingly, 89.4 per cent said they did not know the name of the national drug
control/prevention agency and only 9.2 per cent said yes they knew the name of the national drug
control/prevention agency.
Figure 9-5: Respondents’ Knowledge/Awareness of the Name of the Country's Drug
Control/Prevention Agency
Finally, respondents’ views were sought on a broad range of issues related to use and control of
marijuana. Respondents were required to say whether they completely agree, agree, disagree,
completely disagree, or are neutral in relation to the situation posed. The results as depicted in
table 9-2 show that 43.5 per cent of respondents agreed or completely agreed that government
should allow marijuana to be used for medical and therapeutic purposes. The data also revealed
83
that 17.4 per cent of respondents agreed or completely agreed that government should allow
marijuana to be used for religious purposes (e.g. Rastafarians).
Only 8.9 per cent of respondents agreed or completely agreed that government should allow
marijuana to be grown in limited amounts by individual households. 13.9 per cent of respondents
agreed or completely agreed that government should allow possession of marijuana in limited
amounts for personal use.
Of note 49.0 per cent of respondents agreed or completely agreed that government should allow
persons who are addicted to marijuana and other substances, who commit crimes such as theft, to
be put into a court supervised drug treatment program instead of Prison.
The results also indicate that 23.3 per cent of respondents agreed or completely agreed that
tourists should be allowed to use marijuana for medical or therapeutic purposes with a permit;
and 45.9 per cent of respondents agreed or completely agreed that marijuana should be cultivated
for research purposes.
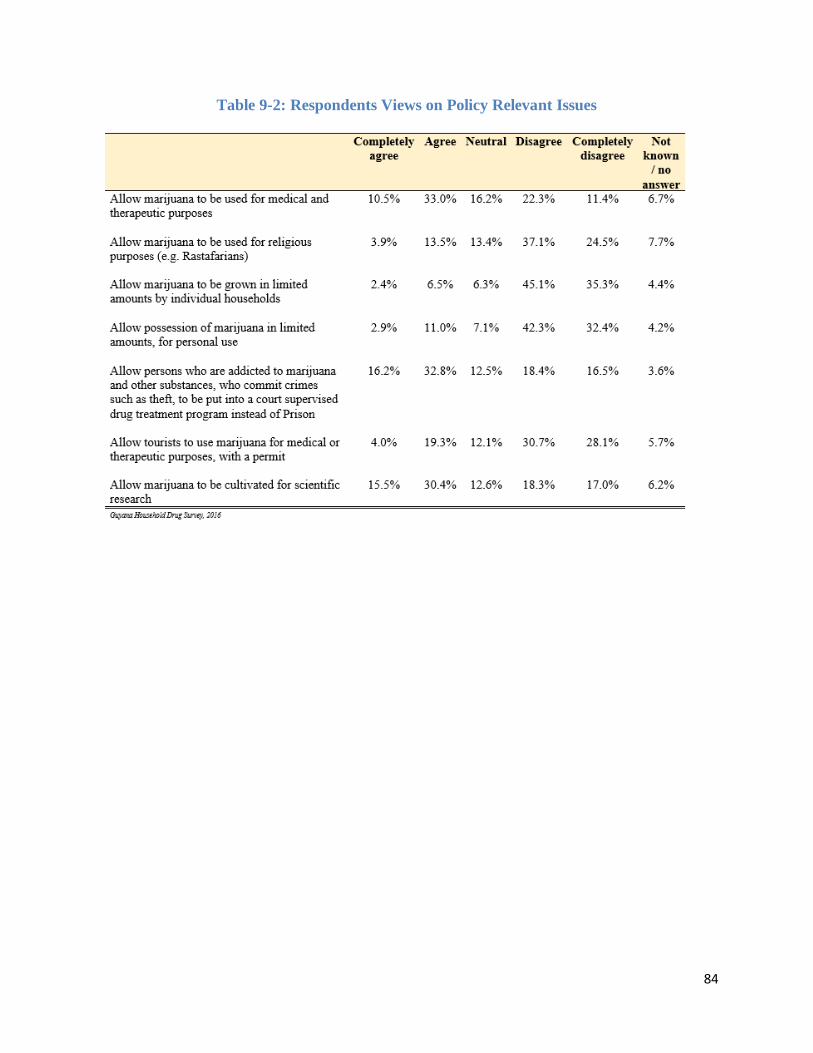
84
Table 9-2: Respondents Views on Policy Relevant Issues
85
Chapter 10 Conclusion & Recommendations
This final chapter offers a brief summary of the key findings of the survey along with and
recommendations for prevention. Overall, the study revealed that alcohol, tobacco (in form of
cigarettes), and marijuana were the three most commonly used substances in Guyana.
The data show that just over 1 in 10 of the respondents indicated current use of tobacco. Males
(18.1%) showed significantly higher levels of current use than their female counterparts (2.9%).
Higher past month prevalence rates were also associated with older respondents. The Hinterland
Region and Region Five reflected higher past month prevalence rates than the national average.
An alarming revelation of the study was that the past month prevalence rate for tobacco use was
inversely related to household income. The clear patterns in tobacco use provide us with
opportunities to launch targeted interventions to address the issue.
Based on the AUDIT scores just over one in four respondents who reported consuming alcohol
in the past year were at risk to alcohol related harm. This ratio is quite significant when we
consider it in the context of 46.2 per cent and 32.5 per cent past year and past month prevalence
rates for alcohol consumption. This risk could translate into higher national health care costs and
loss of productive man hours. Because alcohol is popular in social settings nationally,
widespread education on its dangers should be done. Substance abuse education programmes
should target hinterland communities, which had the highest past month prevalence rate for
alcohol consumption. Persons involved in physically demanding work should be targeted
because the data revealed a higher past month prevalence rate among this group. Work place
based prevention programmes can offer opportunities for targeted intervention to reduce the
likelihood of excessive alcohol use. Worksite interventions are generally attractive to employers
since they can enhance productivity and decrease absenteeism.
The level of binge drinking was also worrisome. For respondents reporting consuming alcohol
within two weeks of the survey, results indicate that 64.2 per cent males and 46.3 per cent
females admitted to binge drinking. The authorities should seek to raise awareness on the
dangers of binge drinking. Here collaboration with sports group, creative arts groups, and
86
community based organisation can play important roles in tackling binge drinking. Key to
tackling binge drinking is communicating the fact that people can have fun without excessive
drinking. From a policy standpoint Government can consider implementing server liability
regulations. Here alcohol servers can be held liable for injuries and deaths from traffic accidents
following irresponsible selling and serving of alcohol. Bermuda has a regime where to be
licensed; servers must go through a sensitization exercise on how to identify problem drinkers
and the appropriate actions to be taken.
Of all illicit drugs on the market marijuana remains the most popular drug being offered to buy
or use in Guyana. Four out of ten respondents felt that marijuana was easy to access and two out
of ten respondents felt cocaine was easy to access. These findings should be of interest for those
implementing supply reduction programmes.
Further, respondents, particularly from Regions 3 and 7, felt that there was a great deal of drug
dealing in their neighbourhood. The data also show that approximately 2 out of 3 respondents
believed that drug use has increased in Guyana in the past few years. Many analysts point to
Guyana’s role as a transhipment point for drugs. However, the reported ease of access for drugs
like cocaine tells the story of domestic supply chains. Intelligence led supply control operations
are needed to reduce the availability of illegal drugs.
The focus for illicit drug awareness education programmes should be on marijuana use. The
CAST analysis suggests that over half of the respondents using marijuana within the past year
were at high risk problem use. This situation demands immediate attention. Mass media
programmes on drug awareness and prevention that aim to build individuals’ resilience in
resisting the social influences to use licit and illicit drugs should be implemented. Further,
behavioural programmes and peer leadership can be implemented among youths to further delay
drug use. The research also highlights the need for increased awareness on available treatment
and for expansion of treatment facilities outside of Region 4.
Leadership is pivotal to prevention efforts. An agency/department must be identified to lead on
drug education, awareness, and prevention programmes. This will contribute to sustained efforts,
87
targeted programmes, and efficient use of resources. Good leadership will also contribute to
acquiring technical expertise, securing the right partnerships, and mobilising financial resources
for programme implementation.
Epidemiology and surveillance provide a robust foundation for prevention services. Thus the
need for ongoing, systematic collection, analysis, and interpretation of drug use and treatment
data cannot be overemphasised. Drug use and treatment surveillance data should be the basis for
the development and implementation of any drug use prevention programme. Research on social
and environmental factors contributing to increases in the use of licit and illicit drugs must be an
ongoing feature. Researchers can employ methods such as randomized controlled trials and time-
series analysis to determine the effectiveness of prevention initiatives. The resulting data may
both inform policy and guide community and educational prevention efforts.
Finally, even though lifetime use of tranquilizers, ecstasy, inhalants, heroin, amphetamines,
cocaine, and crack cocaine were reported, few respondents reported current use of these
substances. It was therefore difficult to obtain any useful information with regard to past month
and past year prevalence rates due to the low rates of use.
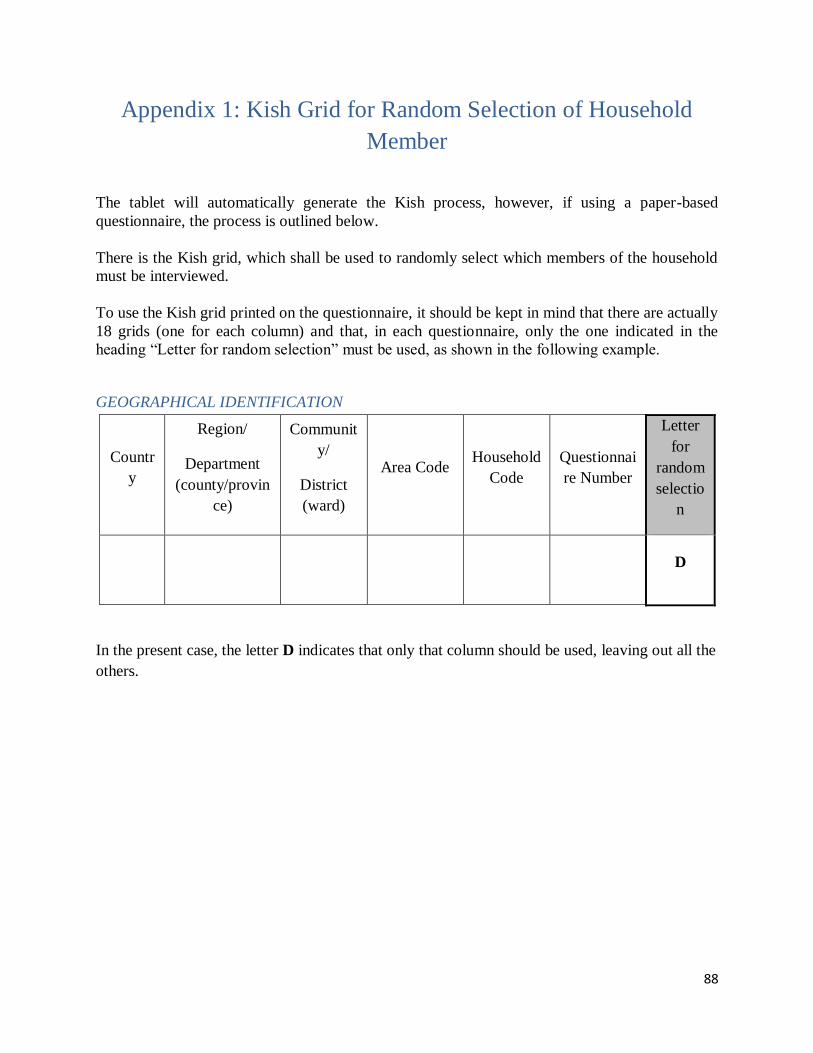
88
Appendix 1: Kish Grid for Random Selection of Household
Member
The tablet will automatically generate the Kish process, however, if using a paper-based
questionnaire, the process is outlined below.
There is the Kish grid, which shall be used to randomly select which members of the household
must be interviewed.
To use the Kish grid printed on the questionnaire, it should be kept in mind that there are actually
18 grids (one for each column) and that, in each questionnaire, only the one indicated in the
heading “Letter for random selection” must be used, as shown in the following example.
GEOGRAPHICAL IDENTIFICATION
Countr
y
Region/
Department
(county/provin
ce)
Communit
y/
District
(ward)
Area Code Household
Code
Questionnai
re Number
Letter
for
random
selectio
n
D
In the present case, the letter D indicates that only that column should be used, leaving out all the
others.
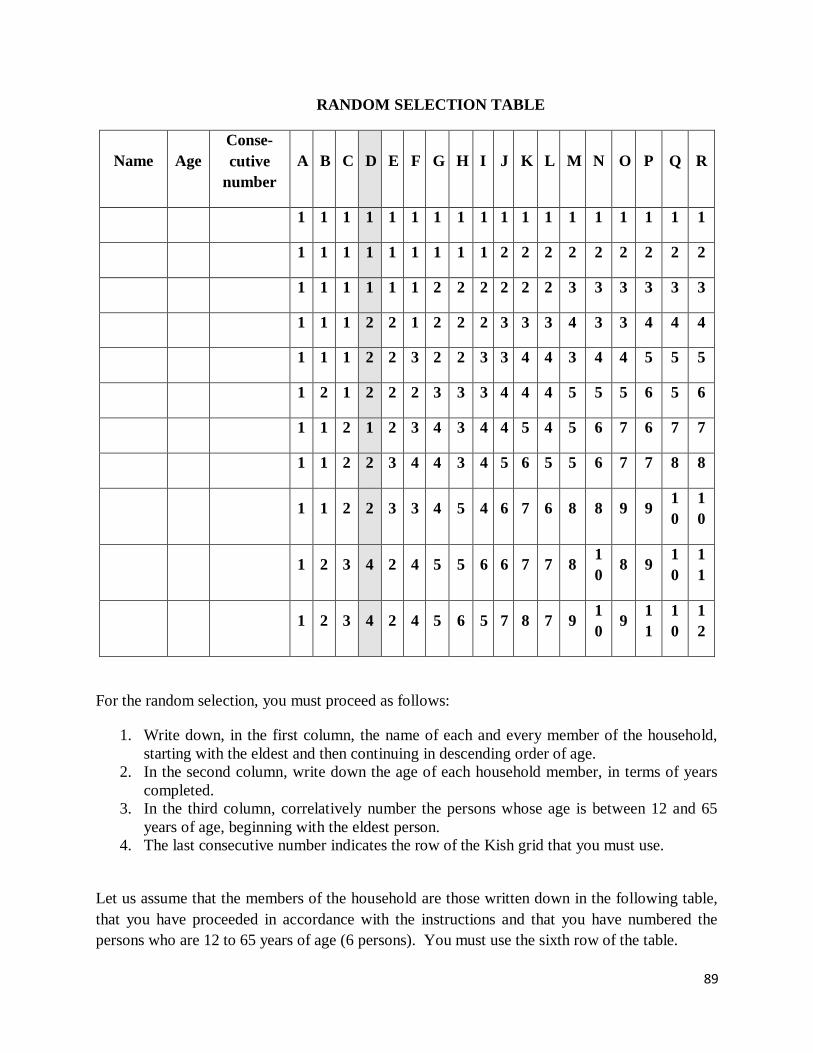
89
RANDOM SELECTION TABLE
Name Age
Conse-
cutive
number
A B C D E F G H I J K L M N O P Q R
1 1 1 1 1 1 1 1 1 1 1 1 1 1 1 1 1 1
1 1 1 1 1 1 1 1 1 2 2 2 2 2 2 2 2 2
1 1 1 1 1 1 2 2 2 2 2 2 3 3 3 3 3 3
1 1 1 2 2 1 2 2 2 3 3 3 4 3 3 4 4 4
1 1 1 2 2 3 2 2 3 3 4 4 3 4 4 5 5 5
1 2 1 2 2 2 3 3 3 4 4 4 5 5 5 6 5 6
1 1 2 1 2 3 4 3 4 4 5 4 5 6 7 6 7 7
1 1 2 2 3 4 4 3 4 5 6 5 5 6 7 7 8 8
1 1 2 2 3 3 4 5 4 6 7 6 8 8 9 9 1
0
1
0
1 2 3 4 2 4 5 5 6 6 7 7 8 1
0 8 9
1
0
1
1
1 2 3 4 2 4 5 6 5 7 8 7 9 1
0 9
1
1
1
0
1
2
For the random selection, you must proceed as follows:
1. Write down, in the first column, the name of each and every member of the household,
starting with the eldest and then continuing in descending order of age.
2. In the second column, write down the age of each household member, in terms of years
completed.
3. In the third column, correlatively number the persons whose age is between 12 and 65
years of age, beginning with the eldest person.
4. The last consecutive number indicates the row of the Kish grid that you must use.
Let us assume that the members of the household are those written down in the following table,
that you have proceeded in accordance with the instructions and that you have numbered the
persons who are 12 to 65 years of age (6 persons). You must use the sixth row of the table.
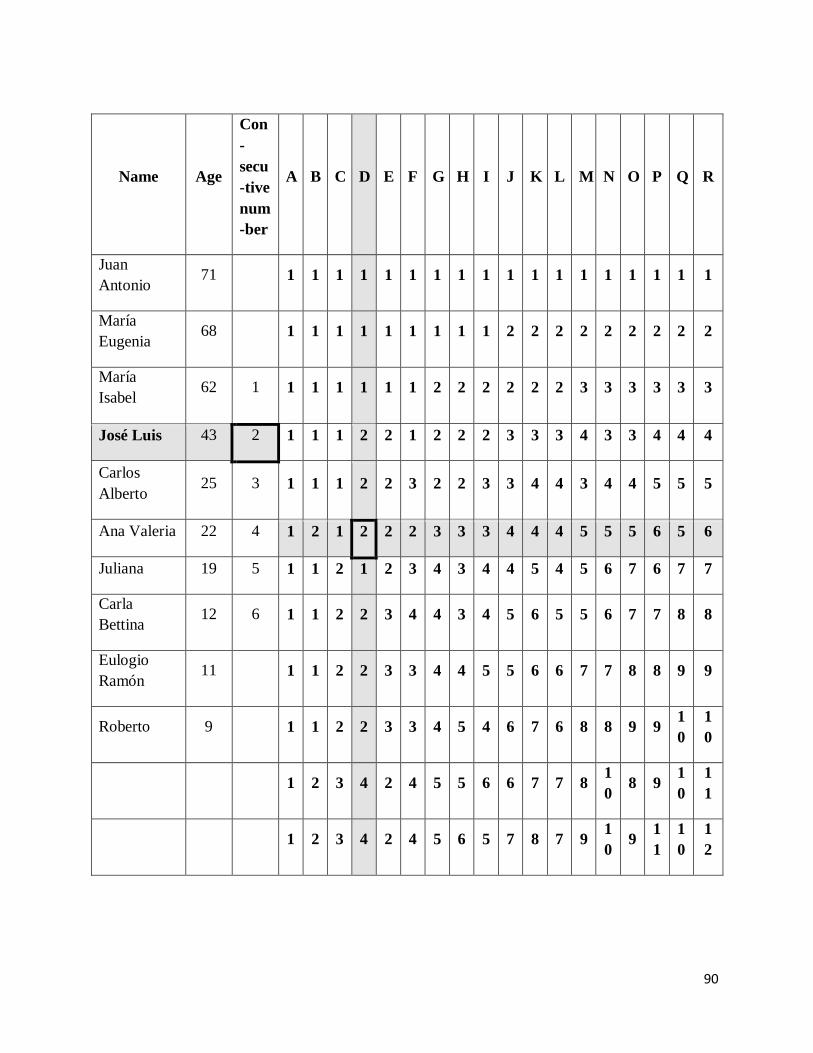
90
Name Age
Con
-
secu
-tive
num
-ber
A B C D E F G H I J K L M N O P Q R
Juan
Antonio 71 1 1 1 1 1 1 1 1 1 1 1 1 1 1 1 1 1 1
María
Eugenia 68 1 1 1 1 1 1 1 1 1 2 2 2 2 2 2 2 2 2
María
Isabel 62 1 1 1 1 1 1 1 2 2 2 2 2 2 3 3 3 3 3 3
José Luis 43 2 1 1 1 2 2 1 2 2 2 3 3 3 4 3 3 4 4 4
Carlos
Alberto 25 3 1 1 1 2 2 3 2 2 3 3 4 4 3 4 4 5 5 5
Ana Valeria 22 4 1 2 1 2 2 2 3 3 3 4 4 4 5 5 5 6 5 6
Juliana 19 5 1 1 2 1 2 3 4 3 4 4 5 4 5 6 7 6 7 7
Carla
Bettina 12 6 1 1 2 2 3 4 4 3 4 5 6 5 5 6 7 7 8 8
Eulogio
Ramón 11 1 1 2 2 3 3 4 4 5 5 6 6 7 7 8 8 9 9
Roberto 9 1 1 2 2 3 3 4 5 4 6 7 6 8 8 9 9 1
0
1
0
1 2 3 4 2 4 5 5 6 6 7 7 8 1
0 8 9
1
0
1
1
1 2 3 4 2 4 5 6 5 7 8 7 9 1
0 9
1
1
1
0
1
2
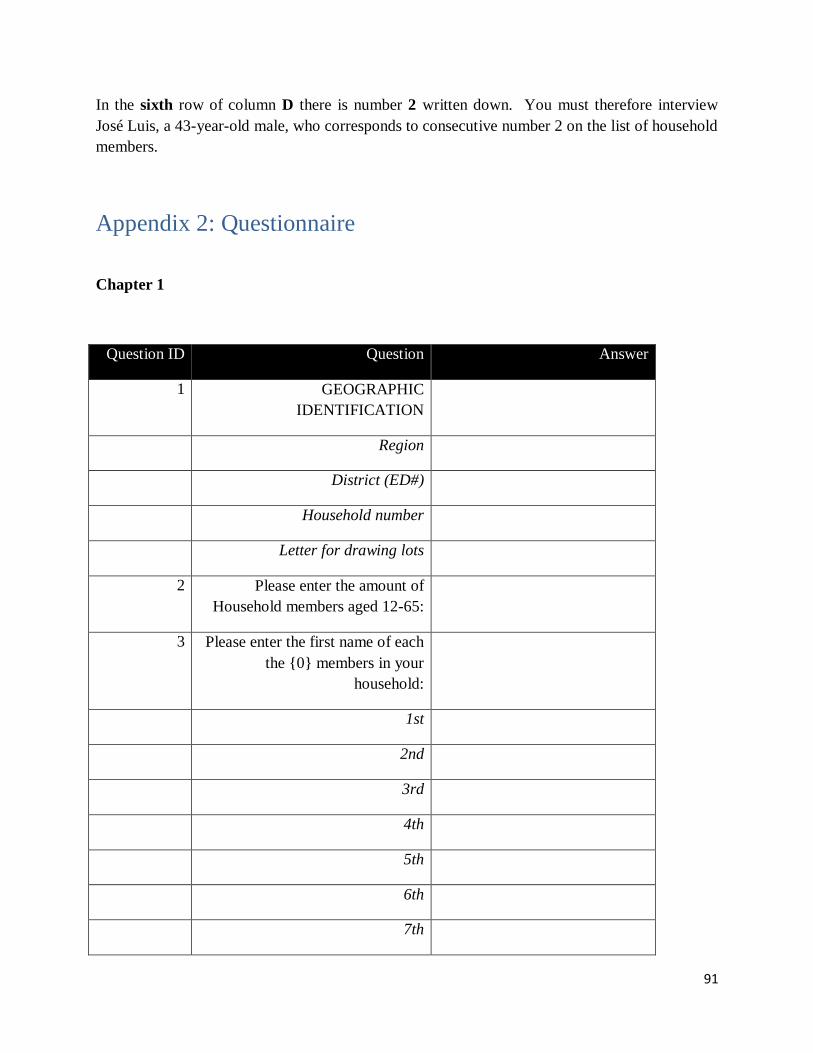
91
In the sixth row of column D there is number 2 written down. You must therefore interview
José Luis, a 43-year-old male, who corresponds to consecutive number 2 on the list of household
members.
Appendix 2: Questionnaire
Chapter 1
Question ID Question Answer
1 GEOGRAPHIC
IDENTIFICATION
Region
District (ED#)
Household number
Letter for drawing lots
2 Please enter the amount of
Household members aged 12-65:
3 Please enter the first name of each
the {0} members in your
household:
1st
2nd
3rd
4th
5th
6th
7th
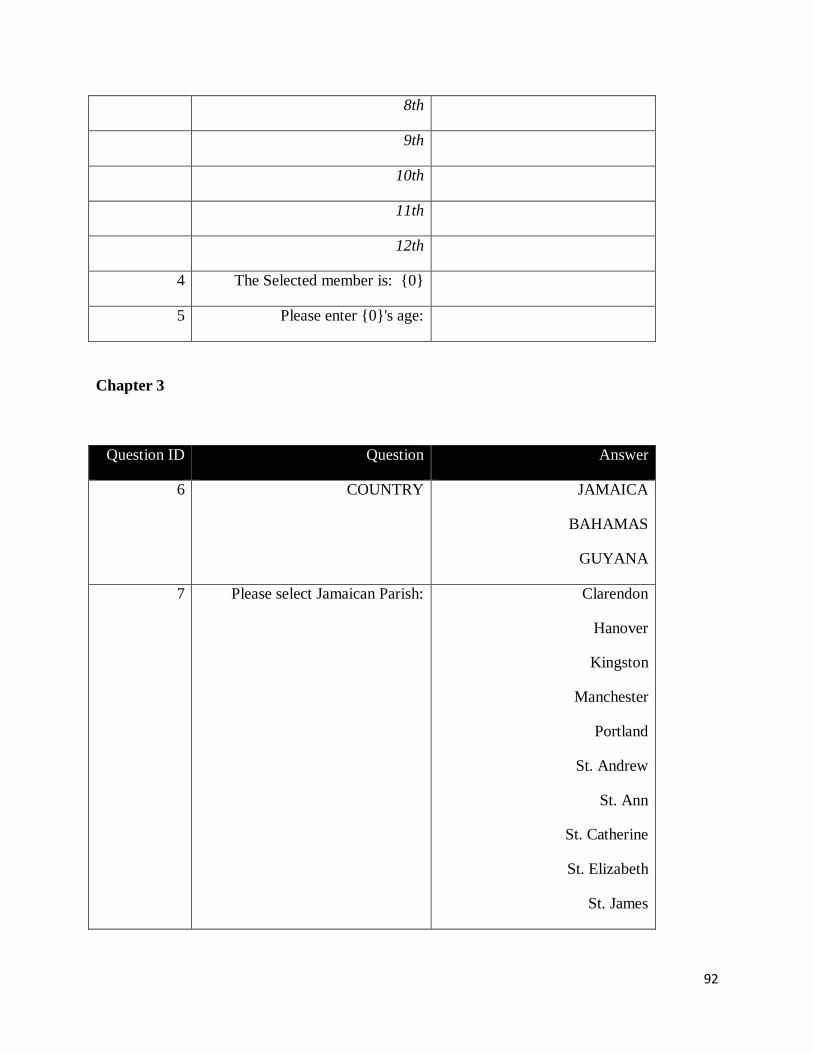
92
8th
9th
10th
11th
12th
4 The Selected member is: {0}
5 Please enter {0}'s age:
Chapter 3
Question ID Question Answer
6 COUNTRY JAMAICA
BAHAMAS
GUYANA
7 Please select Jamaican Parish: Clarendon
Hanover
Kingston
Manchester
Portland
St. Andrew
St. Ann
St. Catherine
St. Elizabeth
St. James
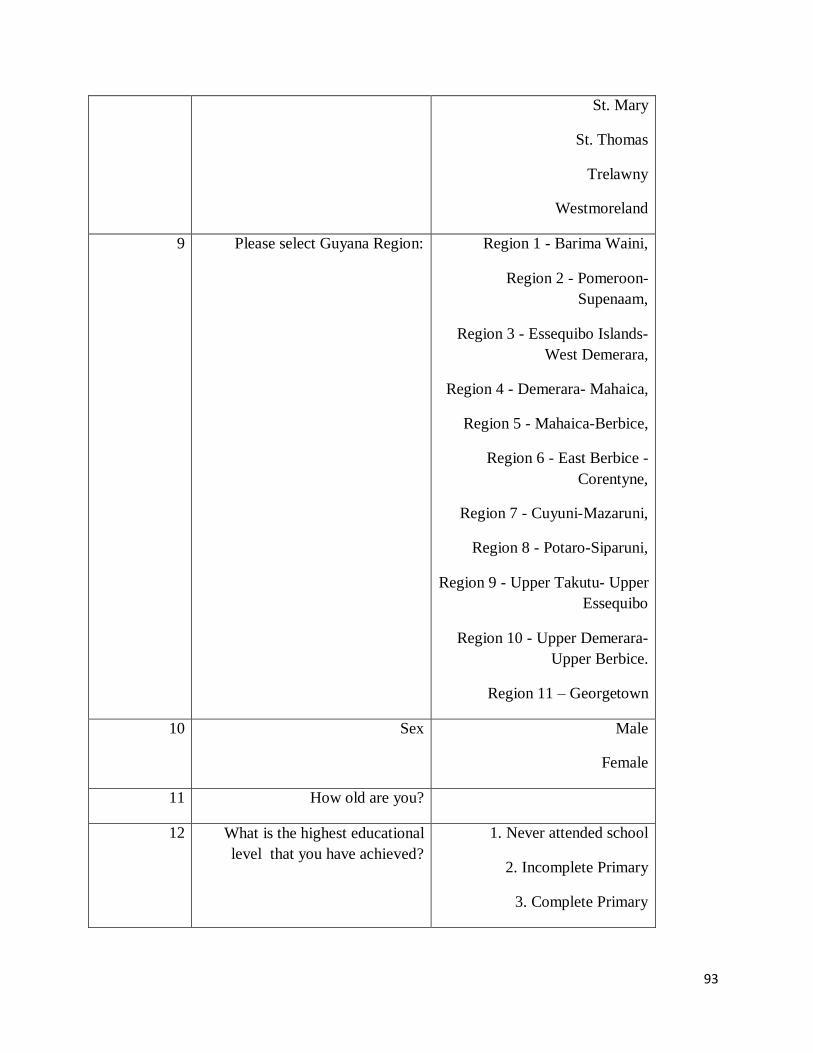
93
St. Mary
St. Thomas
Trelawny
Westmoreland
9 Please select Guyana Region: Region 1 - Barima Waini,
Region 2 - Pomeroon-
Supenaam,
Region 3 - Essequibo Islands-
West Demerara,
Region 4 - Demerara- Mahaica,
Region 5 - Mahaica-Berbice,
Region 6 - East Berbice -
Corentyne,
Region 7 - Cuyuni-Mazaruni,
Region 8 - Potaro-Siparuni,
Region 9 - Upper Takutu- Upper
Essequibo
Region 10 - Upper Demerara-
Upper Berbice.
Region 11 – Georgetown
10 Sex Male
Female
11 How old are you?
12 What is the highest educational
level that you have achieved?
1. Never attended school
2. Incomplete Primary
3. Complete Primary
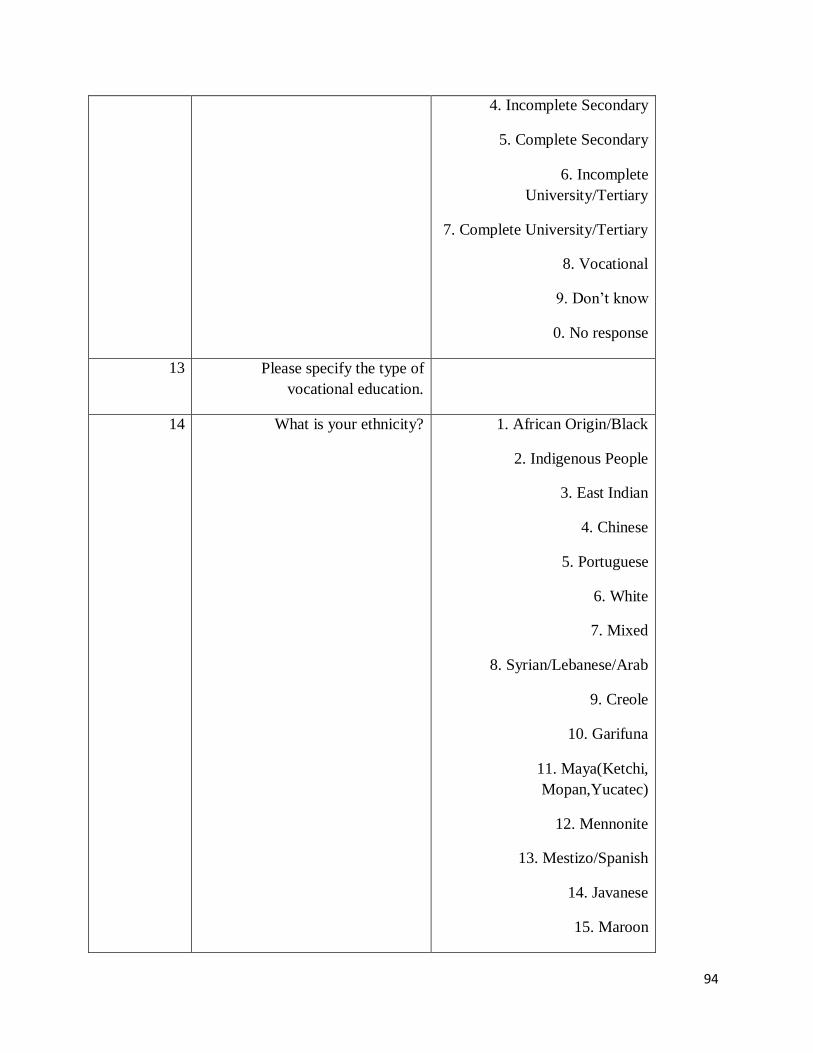
94
4. Incomplete Secondary
5. Complete Secondary
6. Incomplete
University/Tertiary
7. Complete University/Tertiary
8. Vocational
9. Don’t know
0. No response
13 Please specify the type of
vocational education.
14 What is your ethnicity? 1. African Origin/Black
2. Indigenous People
3. East Indian
4. Chinese
5. Portuguese
6. White
7. Mixed
8. Syrian/Lebanese/Arab
9. Creole
10. Garifuna
11. Maya(Ketchi,
Mopan,Yucatec)
12. Mennonite
13. Mestizo/Spanish
14. Javanese
15. Maroon
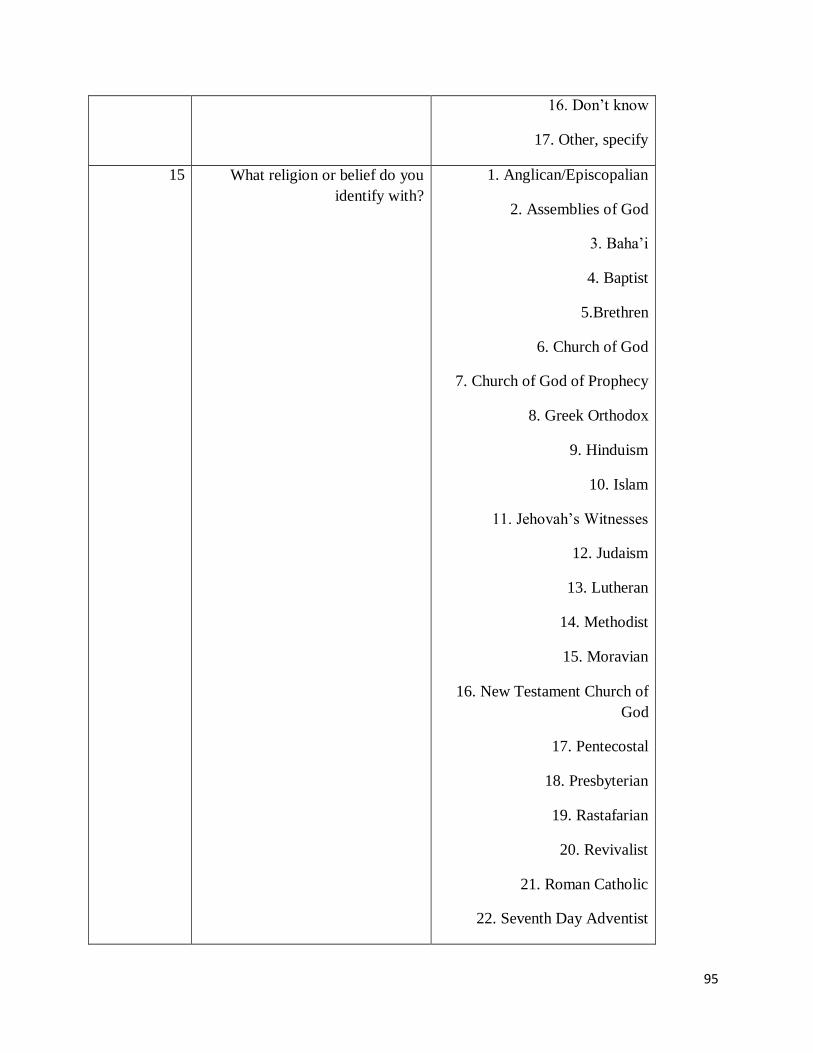
95
16. Don’t know
17. Other, specify
15 What religion or belief do you
identify with?
1. Anglican/Episcopalian
2. Assemblies of God
3. Baha’i
4. Baptist
5.Brethren
6. Church of God
7. Church of God of Prophecy
8. Greek Orthodox
9. Hinduism
10. Islam
11. Jehovah’s Witnesses
12. Judaism
13. Lutheran
14. Methodist
15. Moravian
16. New Testament Church of
God
17. Pentecostal
18. Presbyterian
19. Rastafarian
20. Revivalist
21. Roman Catholic
22. Seventh Day Adventist
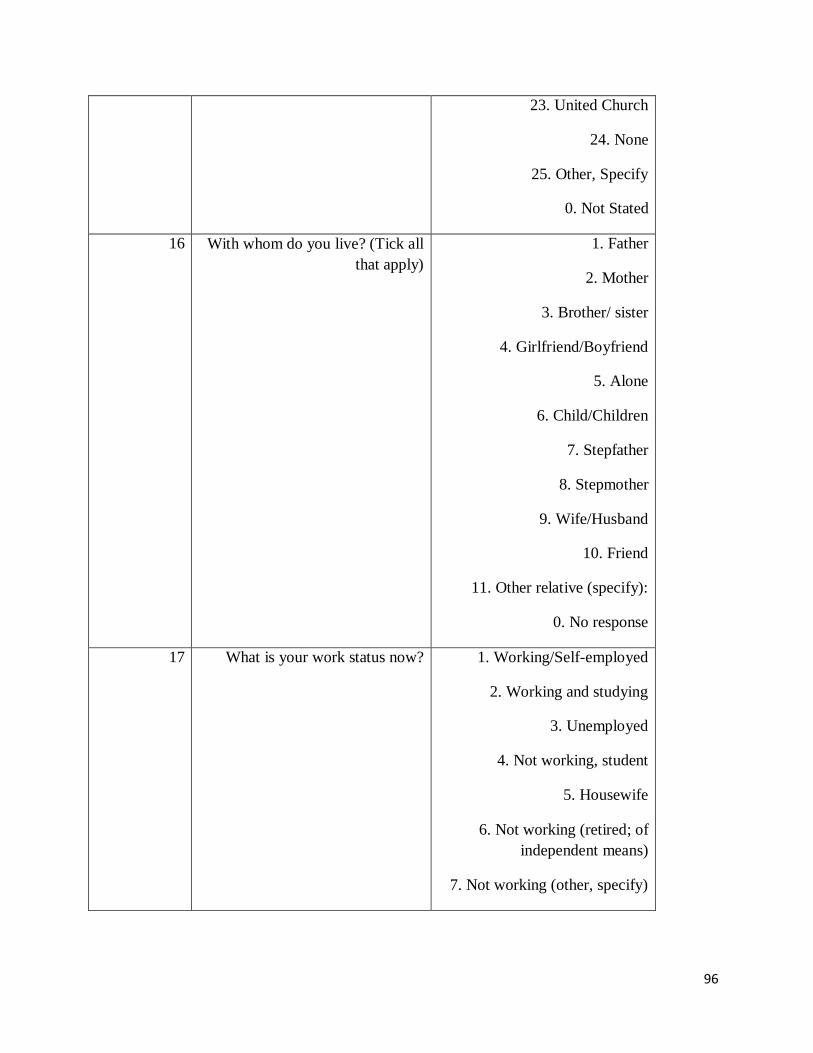
96
23. United Church
24. None
25. Other, Specify
0. Not Stated
16 With whom do you live? (Tick all
that apply)
1. Father
2. Mother
3. Brother/ sister
4. Girlfriend/Boyfriend
5. Alone
6. Child/Children
7. Stepfather
8. Stepmother
9. Wife/Husband
10. Friend
11. Other relative (specify):
0. No response
17 What is your work status now? 1. Working/Self-employed
2. Working and studying
3. Unemployed
4. Not working, student
5. Housewife
6. Not working (retired; of
independent means)
7. Not working (other, specify)
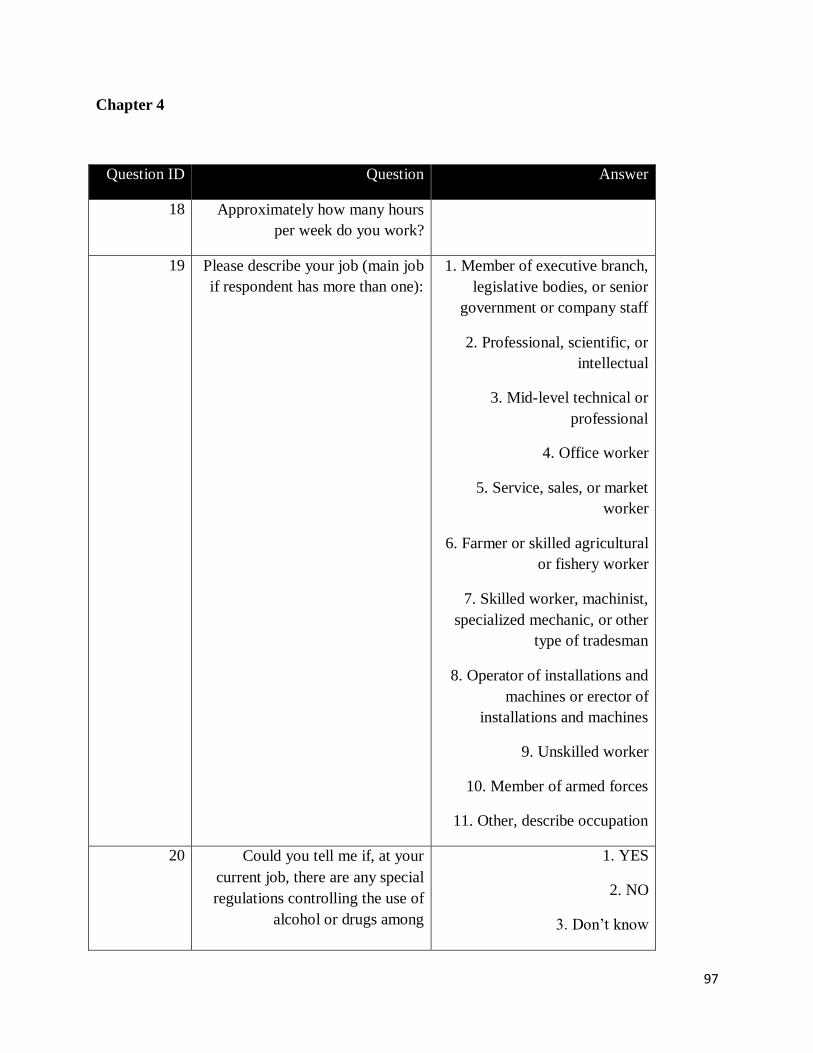
97
Chapter 4
Question ID Question Answer
18 Approximately how many hours
per week do you work?
19 Please describe your job (main job
if respondent has more than one):
1. Member of executive branch,
legislative bodies, or senior
government or company staff
2. Professional, scientific, or
intellectual
3. Mid-level technical or
professional
4. Office worker
5. Service, sales, or market
worker
6. Farmer or skilled agricultural
or fishery worker
7. Skilled worker, machinist,
specialized mechanic, or other
type of tradesman
8. Operator of installations and
machines or erector of
installations and machines
9. Unskilled worker
10. Member of armed forces
11. Other, describe occupation
20 Could you tell me if, at your
current job, there are any special
regulations controlling the use of
alcohol or drugs among
1. YES
2. NO
3. Don’t know
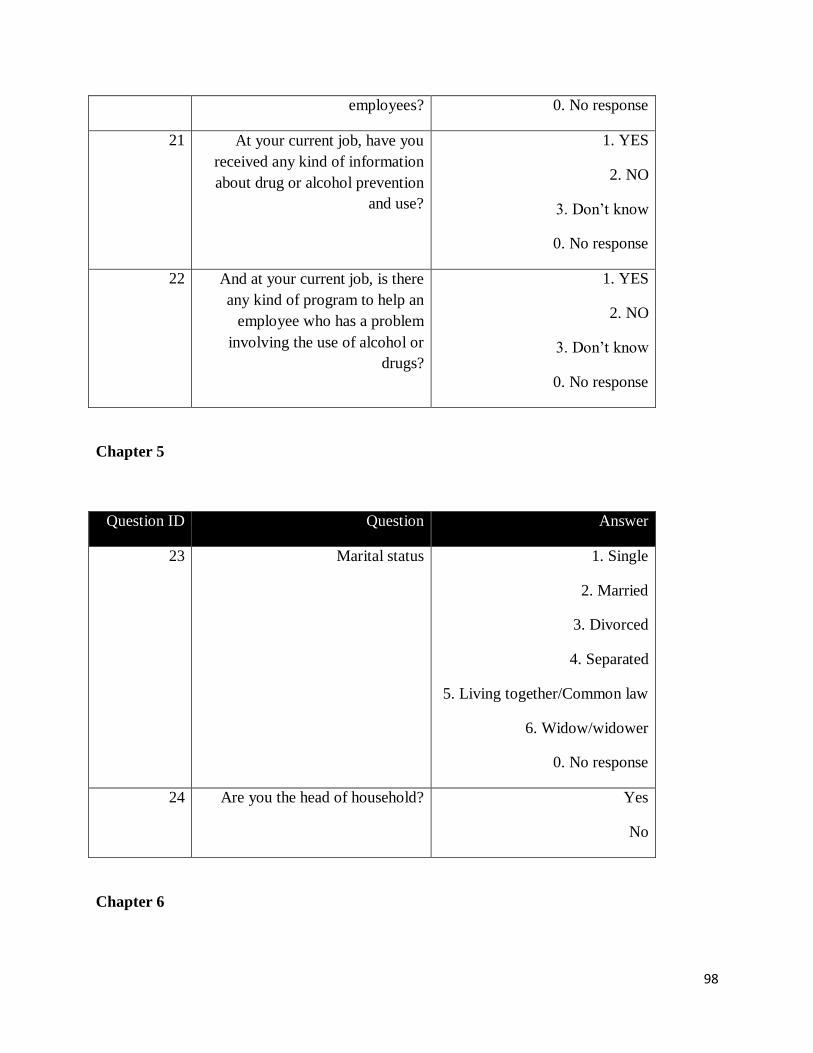
98
employees? 0. No response
21 At your current job, have you
received any kind of information
about drug or alcohol prevention
and use?
1. YES
2. NO
3. Don’t know
0. No response
22 And at your current job, is there
any kind of program to help an
employee who has a problem
involving the use of alcohol or
drugs?
1. YES
2. NO
3. Don’t know
0. No response
Chapter 5
Question ID Question Answer
23 Marital status 1. Single
2. Married
3. Divorced
4. Separated
5. Living together/Common law
6. Widow/widower
0. No response
24 Are you the head of household? Yes
No
Chapter 6
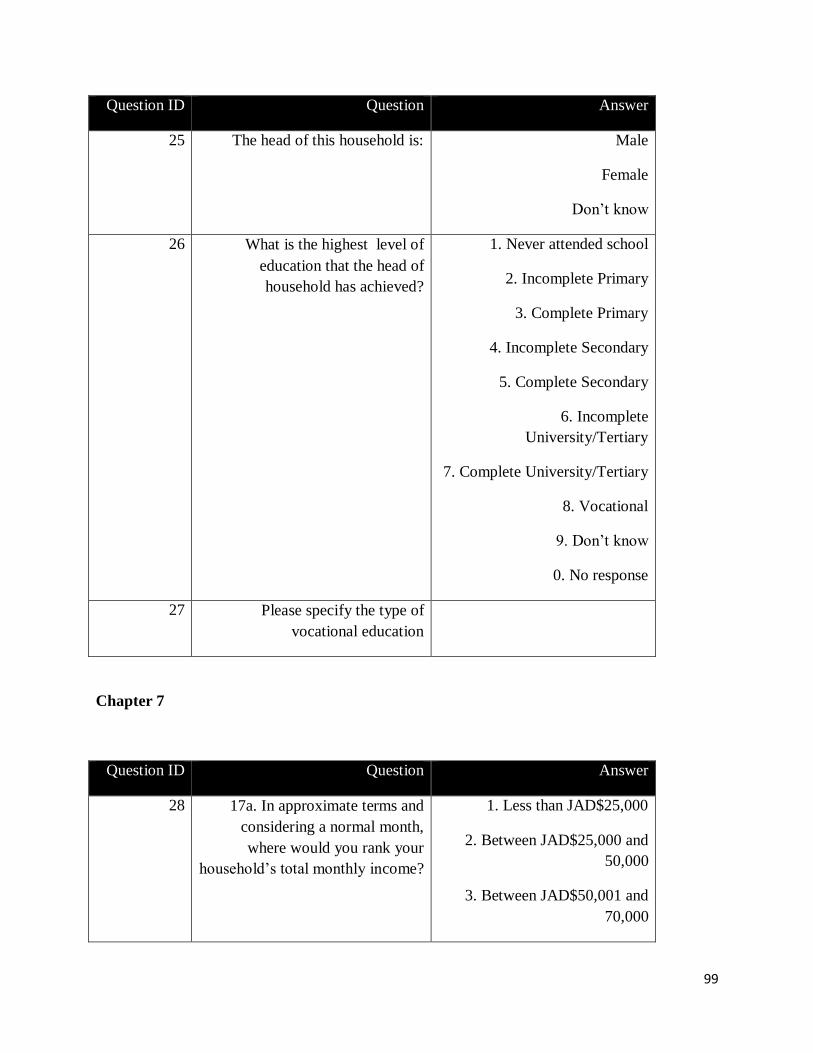
99
Question ID Question Answer
25 The head of this household is: Male
Female
Don’t know
26 What is the highest level of
education that the head of
household has achieved?
1. Never attended school
2. Incomplete Primary
3. Complete Primary
4. Incomplete Secondary
5. Complete Secondary
6. Incomplete
University/Tertiary
7. Complete University/Tertiary
8. Vocational
9. Don’t know
0. No response
27 Please specify the type of
vocational education
Chapter 7
Question ID Question Answer
28 17a. In approximate terms and
considering a normal month,
where would you rank your
household’s total monthly income?
1. Less than JAD$25,000
2. Between JAD$25,000 and
50,000
3. Between JAD$50,001 and
70,000
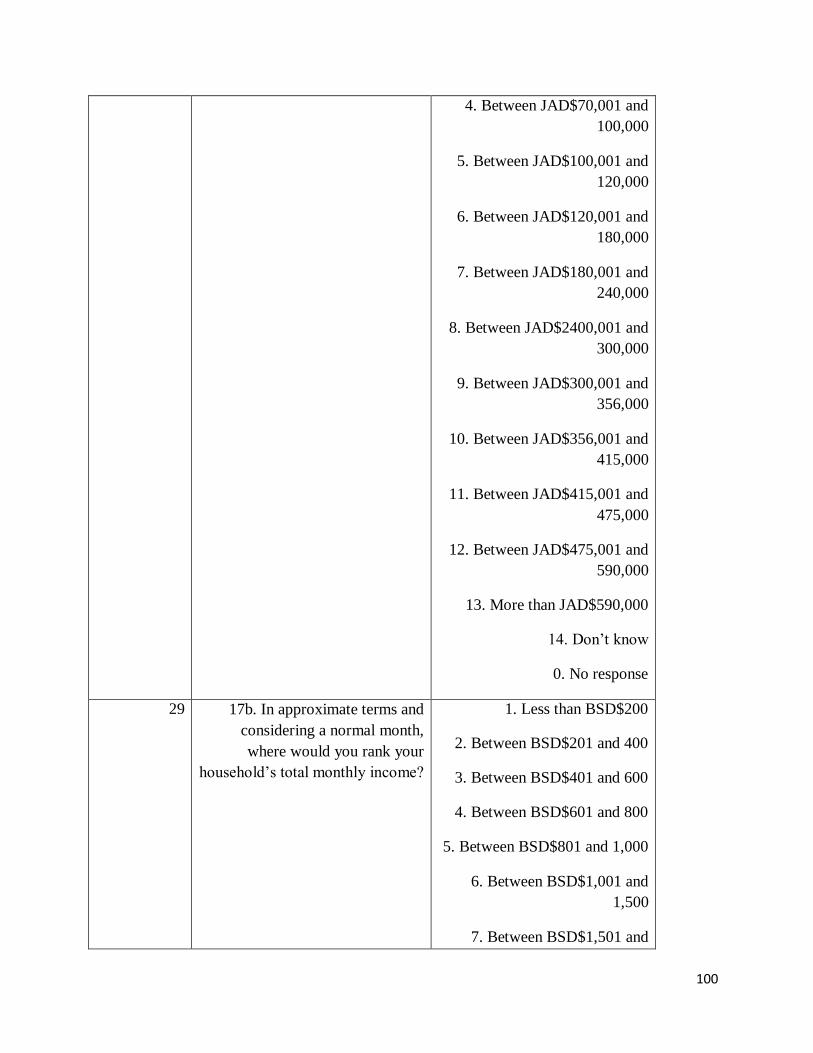
100
4. Between JAD$70,001 and
100,000
5. Between JAD$100,001 and
120,000
6. Between JAD$120,001 and
180,000
7. Between JAD$180,001 and
240,000
8. Between JAD$2400,001 and
300,000
9. Between JAD$300,001 and
356,000
10. Between JAD$356,001 and
415,000
11. Between JAD$415,001 and
475,000
12. Between JAD$475,001 and
590,000
13. More than JAD$590,000
14. Don’t know
0. No response
29 17b. In approximate terms and
considering a normal month,
where would you rank your
household’s total monthly income?
1. Less than BSD$200
2. Between BSD$201 and 400
3. Between BSD$401 and 600
4. Between BSD$601 and 800
5. Between BSD$801 and 1,000
6. Between BSD$1,001 and
1,500
7. Between BSD$1,501 and
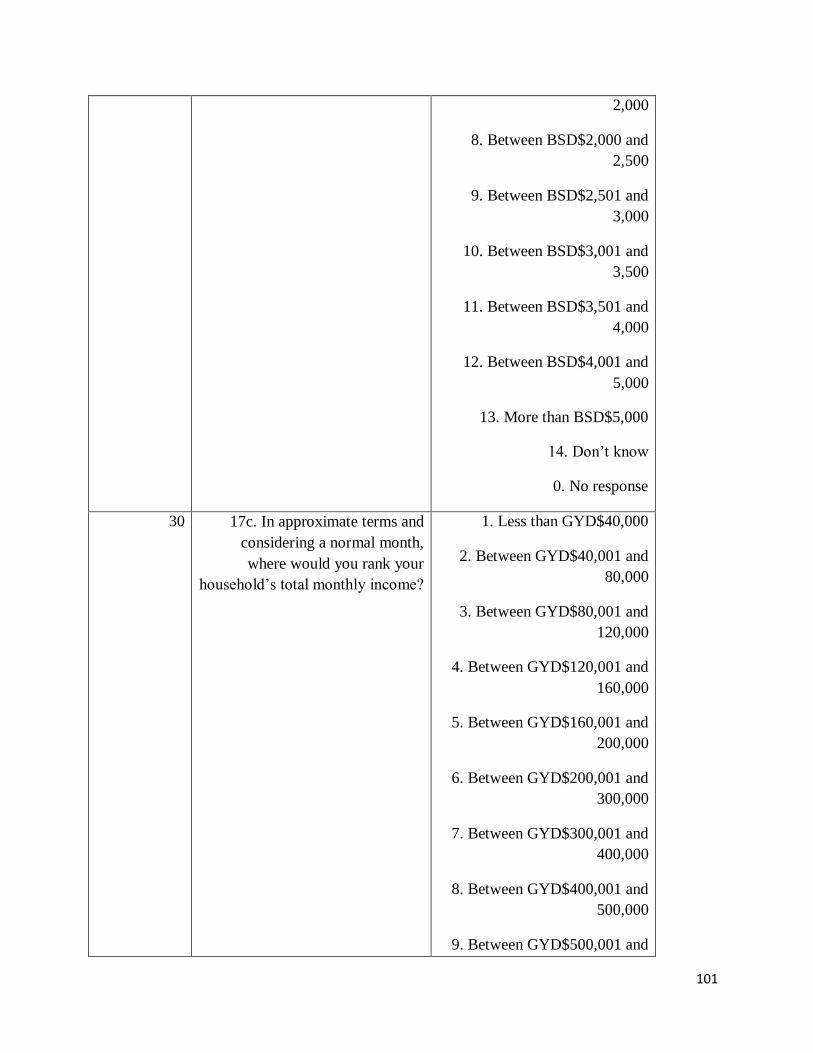
101
2,000
8. Between BSD$2,000 and
2,500
9. Between BSD$2,501 and
3,000
10. Between BSD$3,001 and
3,500
11. Between BSD$3,501 and
4,000
12. Between BSD$4,001 and
5,000
13. More than BSD$5,000
14. Don’t know
0. No response
30 17c. In approximate terms and
considering a normal month,
where would you rank your
household’s total monthly income?
1. Less than GYD$40,000
2. Between GYD$40,001 and
80,000
3. Between GYD$80,001 and
120,000
4. Between GYD$120,001 and
160,000
5. Between GYD$160,001 and
200,000
6. Between GYD$200,001 and
300,000
7. Between GYD$300,001 and
400,000
8. Between GYD$400,001 and
500,000
9. Between GYD$500,001 and
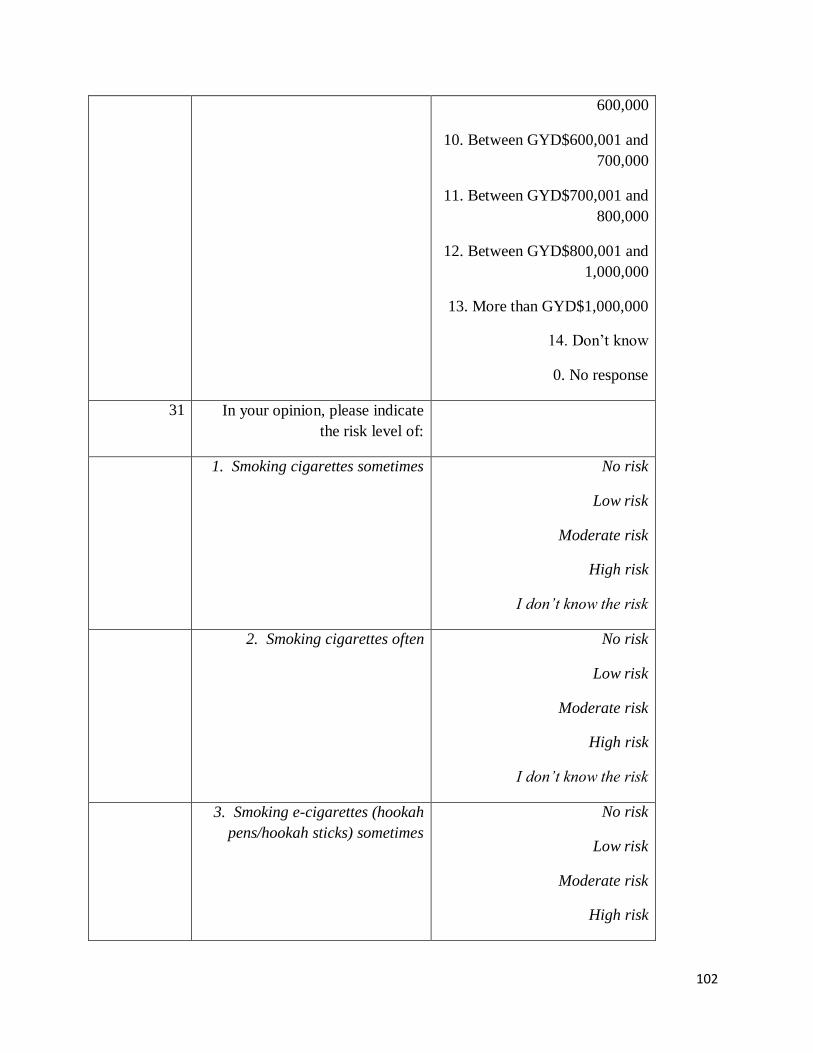
102
600,000
10. Between GYD$600,001 and
700,000
11. Between GYD$700,001 and
800,000
12. Between GYD$800,001 and
1,000,000
13. More than GYD$1,000,000
14. Don’t know
0. No response
31 In your opinion, please indicate
the risk level of:
1. Smoking cigarettes sometimes No risk
Low risk
Moderate risk
High risk
I don’t know the risk
2. Smoking cigarettes often No risk
Low risk
Moderate risk
High risk
I don’t know the risk
3. Smoking e-cigarettes (hookah
pens/hookah sticks) sometimes
No risk
Low risk
Moderate risk
High risk
103
I don’t know the risk
4. Smoking e-cigarettes (hookah
pens/hookah sticks) often
No risk
Low risk
Moderate risk
High risk
I don’t know the risk
5. Smoking hookah pipes (tobacco
water pipes) sometimes
No risk
Low risk
Moderate risk
High risk
I don’t know the risk
6. Smoking hookah pipes (tobacco
water pipes) often
No risk
Low risk
Moderate risk
High risk
I don’t know the risk
7. Drinking alcoholic beverages
sometimes
No risk
Low risk
Moderate risk
High risk
I don’t know the risk
8. Drinking alcoholic beverages
often
No risk
Low risk
Moderate risk
104
High risk
I don’t know the risk
9. Becoming drunk No risk
Low risk
Moderate risk
High risk
I don’t know the risk
10. Taking unprescribed
tranquilizers/stimulants sometimes
No risk
Low risk
Moderate risk
High risk
I don’t know the risk
11. Taking unprescribed
tranquilizers/stimulants often
No risk
Low risk
Moderate risk
High risk
I don’t know the risk
12. Using inhalants/solvents to
get high sometimes (glue, paint,
varnish, deodorants, gasoline)
No risk
Low risk
Moderate risk
High risk
I don’t know the risk
13. Using inhalants solvents to get
high often (glue, paint, varnish,
deodorants, gasoline)
No risk
Low risk
105
Moderate risk
High risk
I don’t know the risk
14. Smoking marijuana sometimes No risk
Low risk
Moderate risk
High risk
I don’t know the risk
15. Smoking marijuana often No risk
Low risk
Moderate risk
High risk
I don’t know the risk
16. Using marijuana in drinks
sometimes (teas, juice etc.)
No risk
Low risk
Moderate risk
High risk
I don’t know the risk
17. Using marijuana in drinks
often
No risk
Low risk
Moderate risk
High risk
I don’t know the risk
18. Using marijuana in food
sometimes (pastries, candy/sweets,
No risk
106
cooked/uncooked meals) Low risk
Moderate risk
High risk
I don’t know the risk
19. Using marijuana in food often No risk
Low risk
Moderate risk
High risk
I don’t know the risk
20. Using marijuana for medicine
sometimes
No risk
Low risk
Moderate risk
High risk
I don’t know the risk
21. Using marijuana for medicine
often
No risk
Low risk
Moderate risk
High risk
I don’t know the risk
22. Using cocaine sometimes No risk
Low risk
Moderate risk
High risk
I don’t know the risk
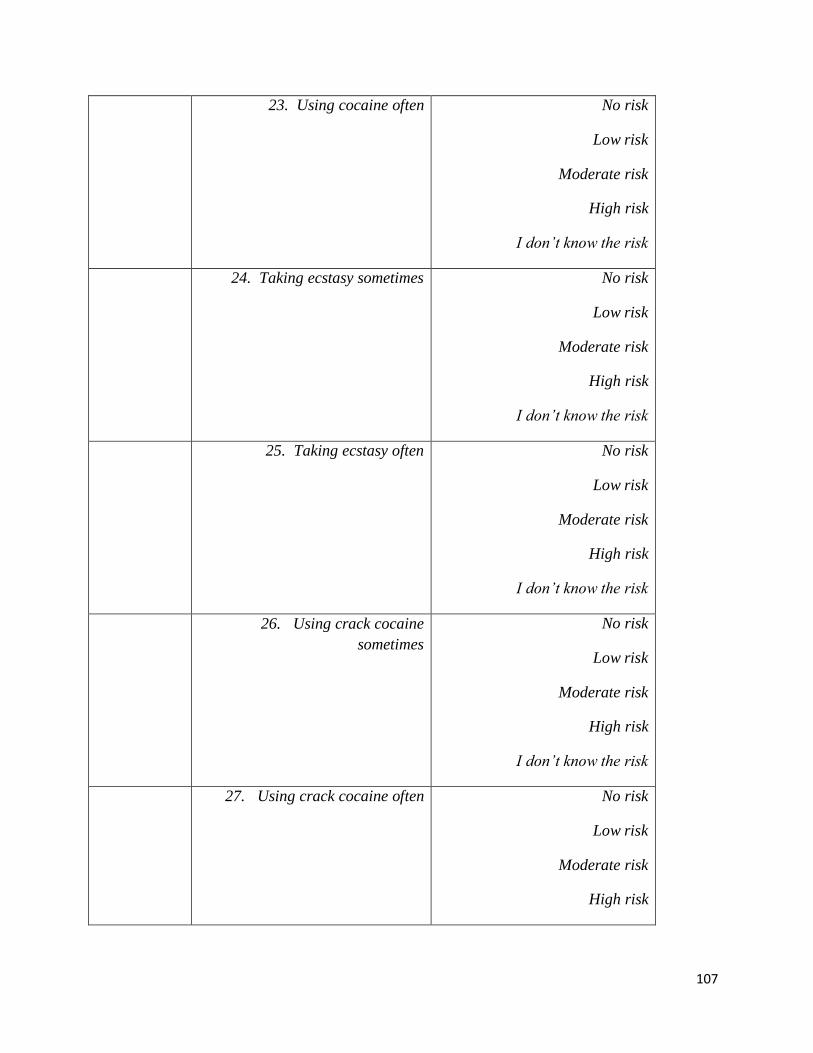
107
23. Using cocaine often No risk
Low risk
Moderate risk
High risk
I don’t know the risk
24. Taking ecstasy sometimes No risk
Low risk
Moderate risk
High risk
I don’t know the risk
25. Taking ecstasy often No risk
Low risk
Moderate risk
High risk
I don’t know the risk
26. Using crack cocaine
sometimes
No risk
Low risk
Moderate risk
High risk
I don’t know the risk
27. Using crack cocaine often No risk
Low risk
Moderate risk
High risk
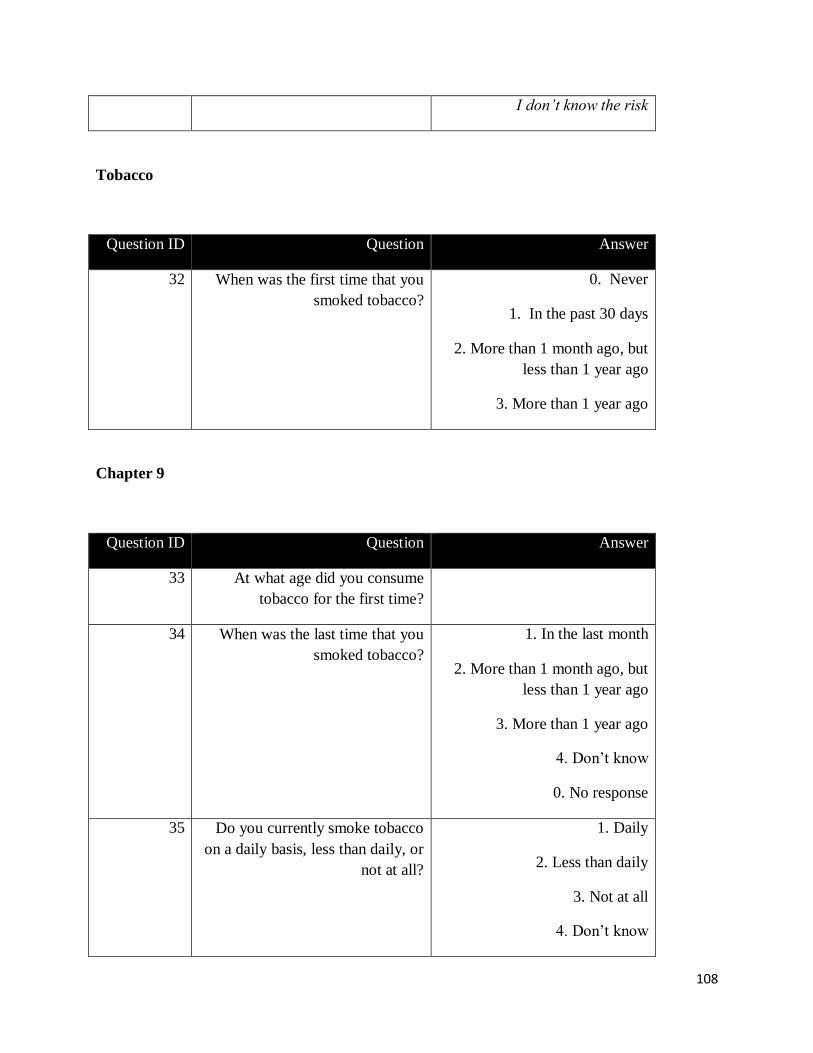
108
I don’t know the risk
Tobacco
Question ID Question Answer
32 When was the first time that you
smoked tobacco?
0. Never
1. In the past 30 days
2. More than 1 month ago, but
less than 1 year ago
3. More than 1 year ago
Chapter 9
Question ID Question Answer
33 At what age did you consume
tobacco for the first time?
34 When was the last time that you
smoked tobacco?
1. In the last month
2. More than 1 month ago, but
less than 1 year ago
3. More than 1 year ago
4. Don’t know
0. No response
35 Do you currently smoke tobacco
on a daily basis, less than daily, or
not at all?
1. Daily
2. Less than daily
3. Not at all
4. Don’t know
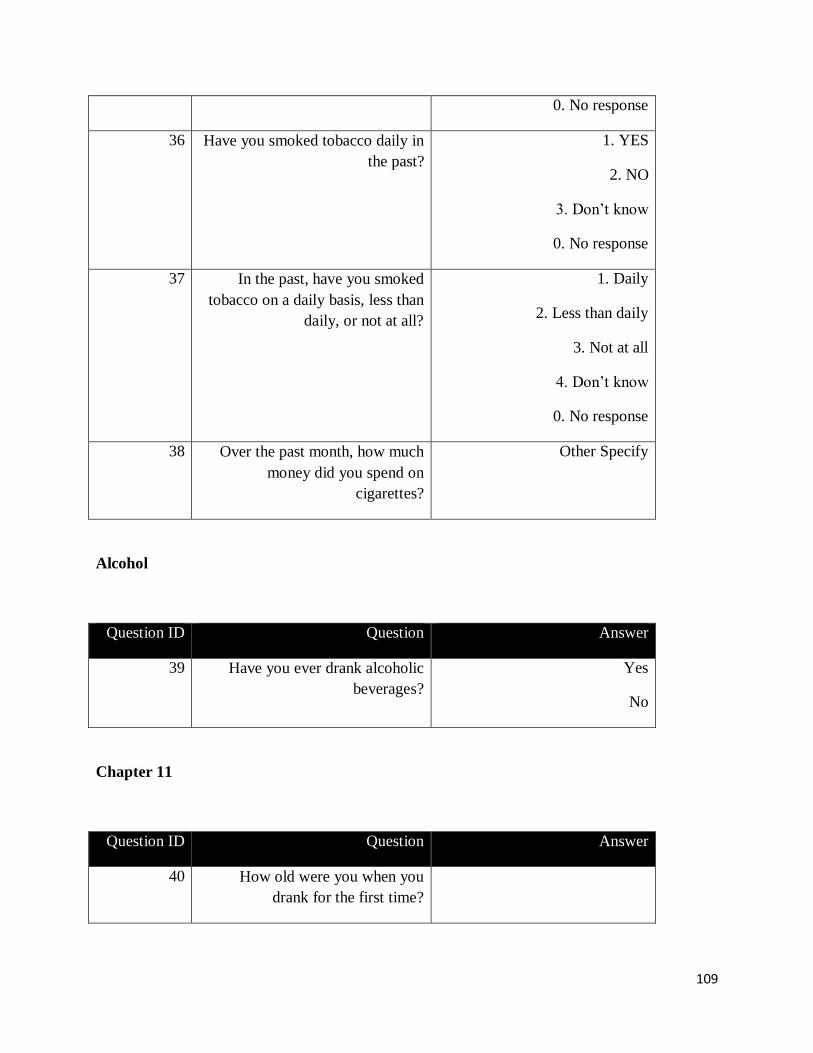
109
0. No response
36 Have you smoked tobacco daily in
the past?
1. YES
2. NO
3. Don’t know
0. No response
37 In the past, have you smoked
tobacco on a daily basis, less than
daily, or not at all?
1. Daily
2. Less than daily
3. Not at all
4. Don’t know
0. No response
38 Over the past month, how much
money did you spend on
cigarettes?
Other Specify
Alcohol
Question ID Question Answer
39 Have you ever drank alcoholic
beverages?
Yes
No
Chapter 11
Question ID Question Answer
40 How old were you when you
drank for the first time?
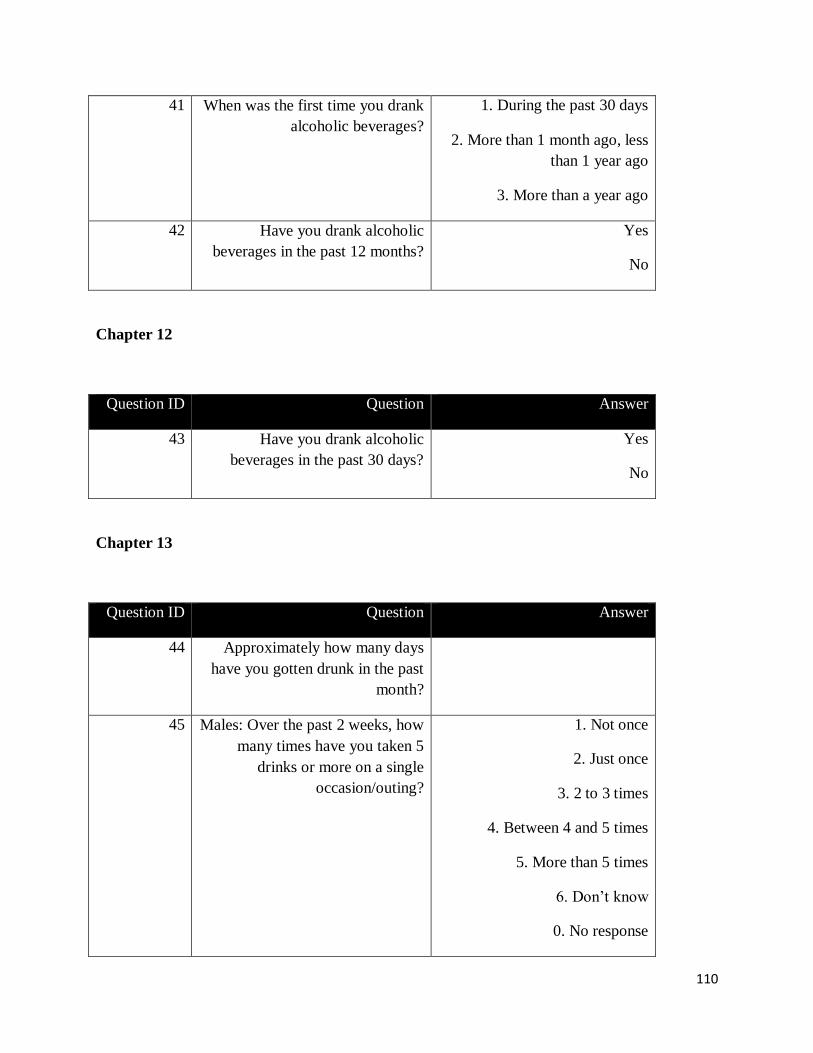
110
41 When was the first time you drank
alcoholic beverages?
1. During the past 30 days
2. More than 1 month ago, less
than 1 year ago
3. More than a year ago
42 Have you drank alcoholic
beverages in the past 12 months?
Yes
No
Chapter 12
Question ID Question Answer
43 Have you drank alcoholic
beverages in the past 30 days?
Yes
No
Chapter 13
Question ID Question Answer
44 Approximately how many days
have you gotten drunk in the past
month?
45 Males: Over the past 2 weeks, how
many times have you taken 5
drinks or more on a single
occasion/outing?
1. Not once
2. Just once
3. 2 to 3 times
4. Between 4 and 5 times
5. More than 5 times
6. Don’t know
0. No response
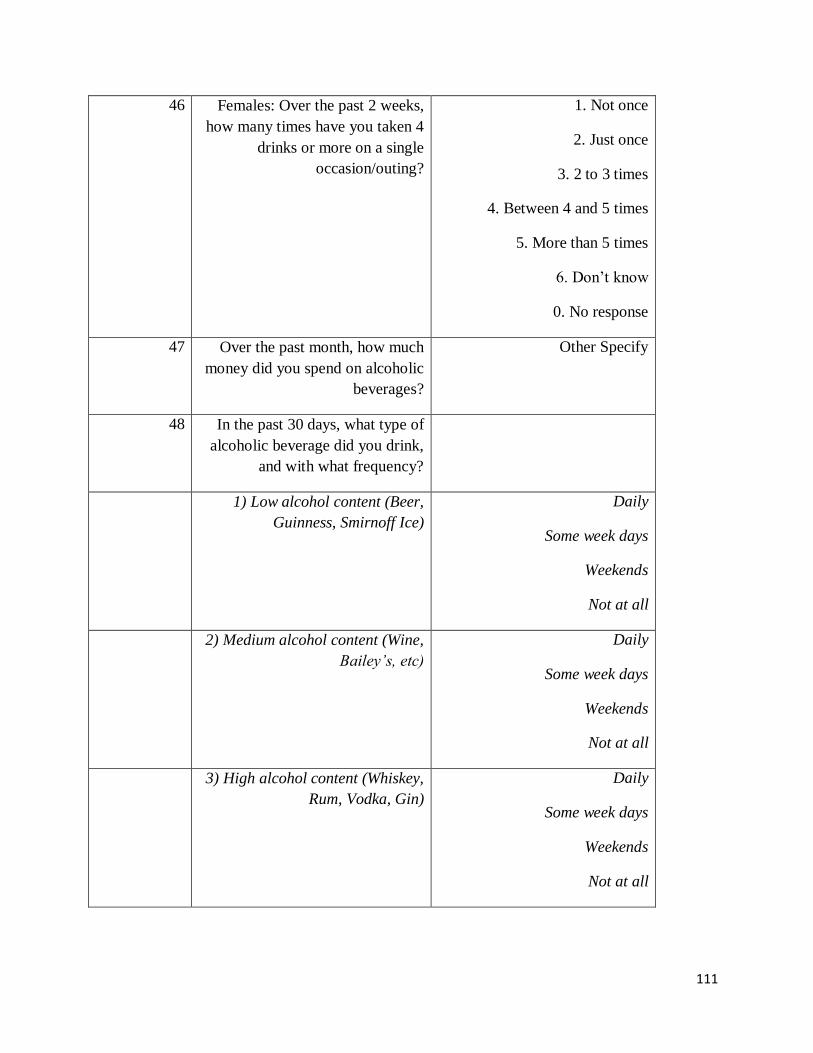
111
46 Females: Over the past 2 weeks,
how many times have you taken 4
drinks or more on a single
occasion/outing?
1. Not once
2. Just once
3. 2 to 3 times
4. Between 4 and 5 times
5. More than 5 times
6. Don’t know
0. No response
47 Over the past month, how much
money did you spend on alcoholic
beverages?
Other Specify
48 In the past 30 days, what type of
alcoholic beverage did you drink,
and with what frequency?
1) Low alcohol content (Beer,
Guinness, Smirnoff Ice)
Daily
Some week days
Weekends
Not at all
2) Medium alcohol content (Wine,
Bailey’s, etc)
Daily
Some week days
Weekends
Not at all
3) High alcohol content (Whiskey,
Rum, Vodka, Gin)
Daily
Some week days
Weekends
Not at all
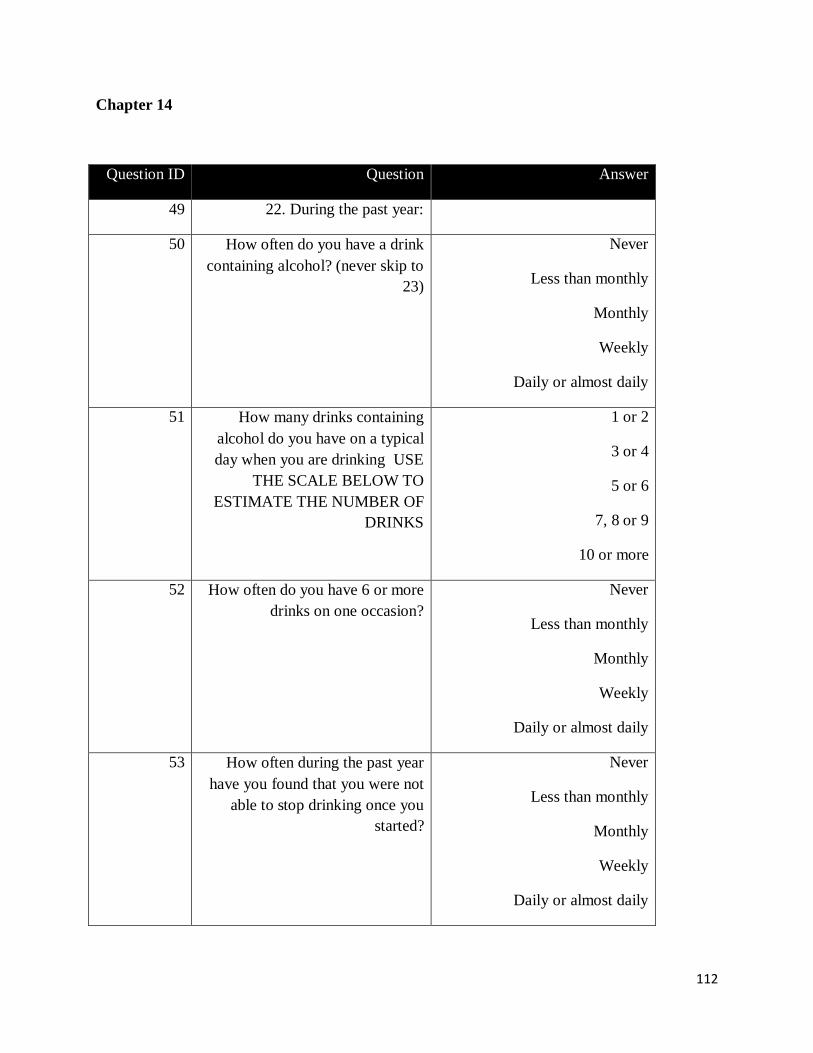
112
Chapter 14
Question ID Question Answer
49 22. During the past year:
50 How often do you have a drink
containing alcohol? (never skip to
23)
Never
Less than monthly
Monthly
Weekly
Daily or almost daily
51 How many drinks containing
alcohol do you have on a typical
day when you are drinking USE
THE SCALE BELOW TO
ESTIMATE THE NUMBER OF
DRINKS
1 or 2
3 or 4
5 or 6
7, 8 or 9
10 or more
52 How often do you have 6 or more
drinks on one occasion?
Never
Less than monthly
Monthly
Weekly
Daily or almost daily
53 How often during the past year
have you found that you were not
able to stop drinking once you
started?
Never
Less than monthly
Monthly
Weekly
Daily or almost daily
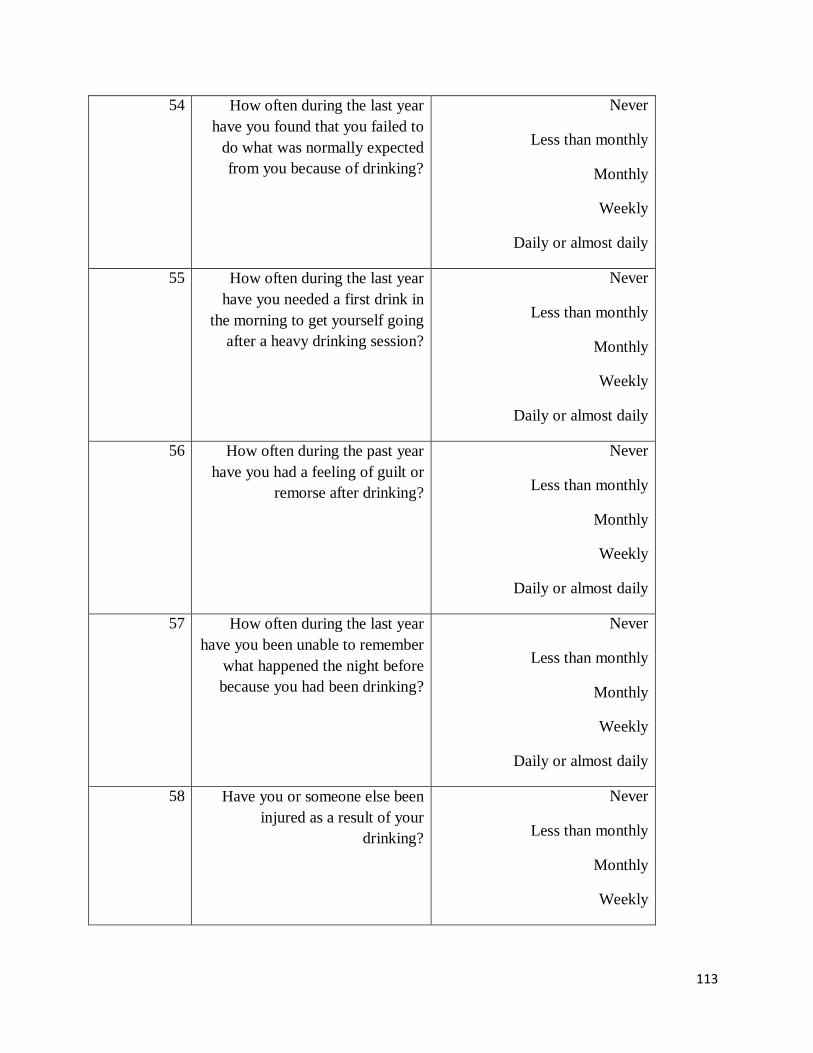
113
54 How often during the last year
have you found that you failed to
do what was normally expected
from you because of drinking?
Never
Less than monthly
Monthly
Weekly
Daily or almost daily
55 How often during the last year
have you needed a first drink in
the morning to get yourself going
after a heavy drinking session?
Never
Less than monthly
Monthly
Weekly
Daily or almost daily
56 How often during the past year
have you had a feeling of guilt or
remorse after drinking?
Never
Less than monthly
Monthly
Weekly
Daily or almost daily
57 How often during the last year
have you been unable to remember
what happened the night before
because you had been drinking?
Never
Less than monthly
Monthly
Weekly
Daily or almost daily
58 Have you or someone else been
injured as a result of your
drinking?
Never
Less than monthly
Monthly
Weekly
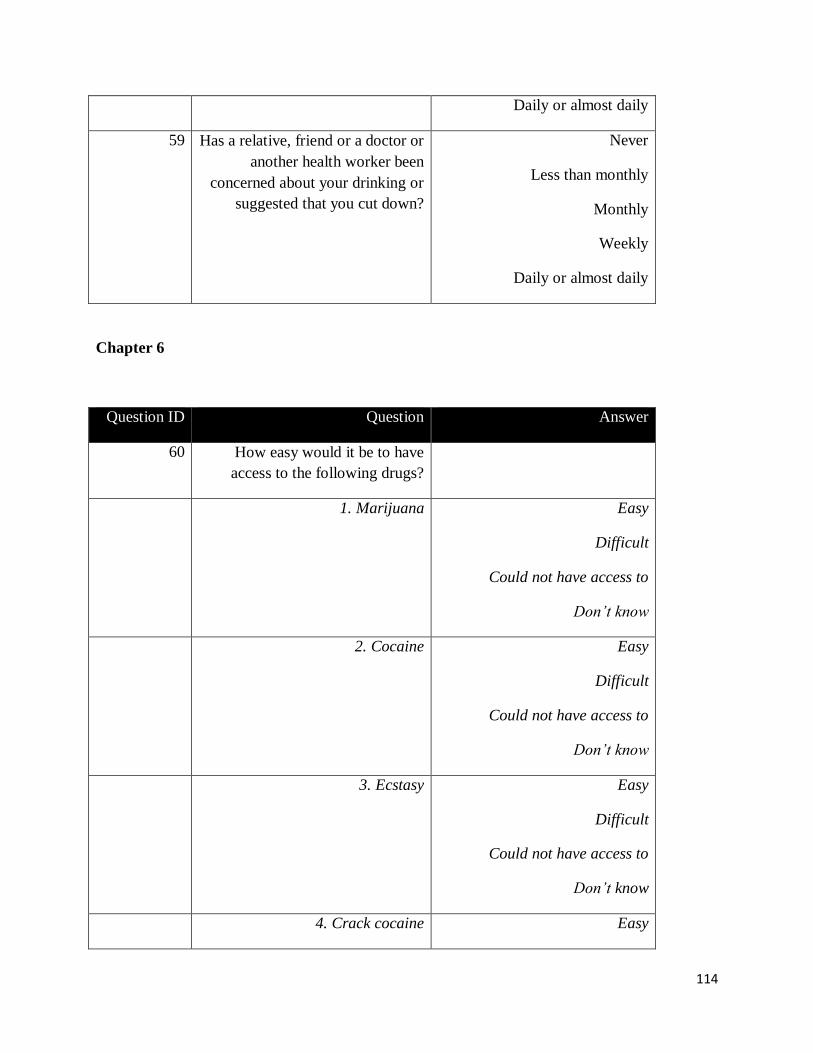
114
Daily or almost daily
59 Has a relative, friend or a doctor or
another health worker been
concerned about your drinking or
suggested that you cut down?
Never
Less than monthly
Monthly
Weekly
Daily or almost daily
Chapter 6
Question ID Question Answer
60 How easy would it be to have
access to the following drugs?
1. Marijuana Easy
Difficult
Could not have access to
Don’t know
2. Cocaine Easy
Difficult
Could not have access to
Don’t know
3. Ecstasy Easy
Difficult
Could not have access to
Don’t know
4. Crack cocaine Easy
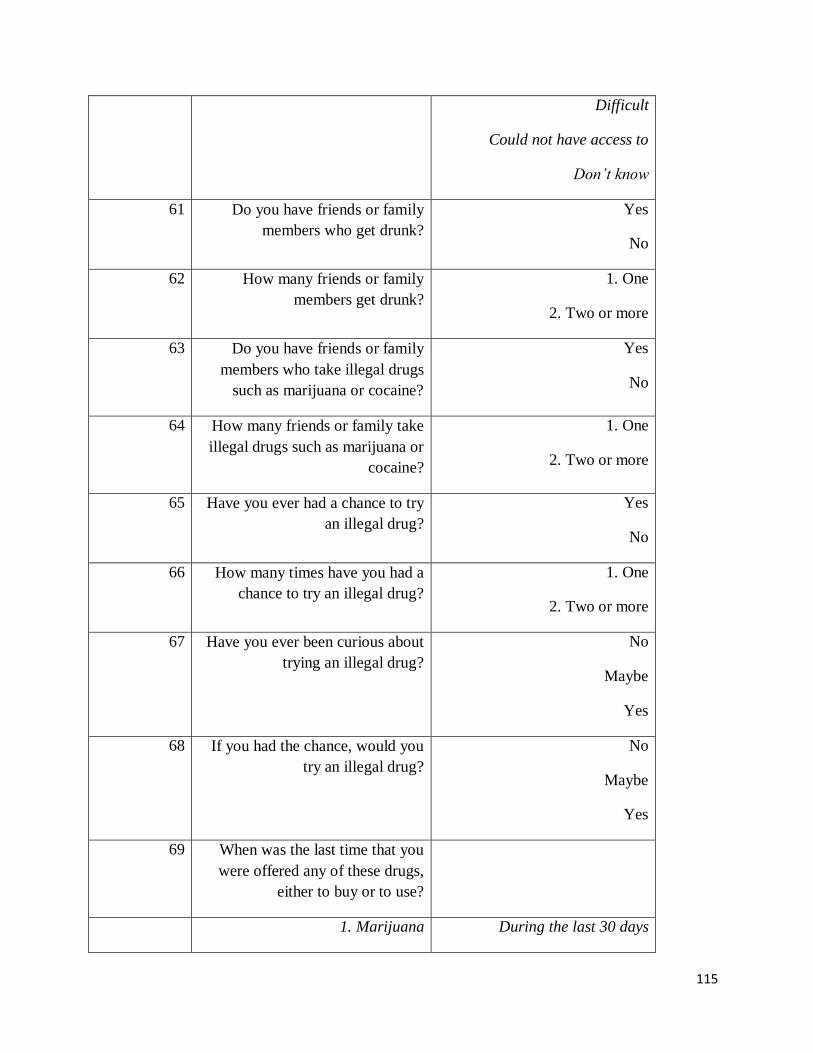
115
Difficult
Could not have access to
Don’t know
61 Do you have friends or family
members who get drunk?
Yes
No
62 How many friends or family
members get drunk?
1. One
2. Two or more
63 Do you have friends or family
members who take illegal drugs
such as marijuana or cocaine?
Yes
No
64 How many friends or family take
illegal drugs such as marijuana or
cocaine?
1. One
2. Two or more
65 Have you ever had a chance to try
an illegal drug?
Yes
No
66 How many times have you had a
chance to try an illegal drug?
1. One
2. Two or more
67 Have you ever been curious about
trying an illegal drug?
No
Maybe
Yes
68 If you had the chance, would you
try an illegal drug?
No
Maybe
Yes
69 When was the last time that you
were offered any of these drugs,
either to buy or to use?
1. Marijuana During the last 30 days
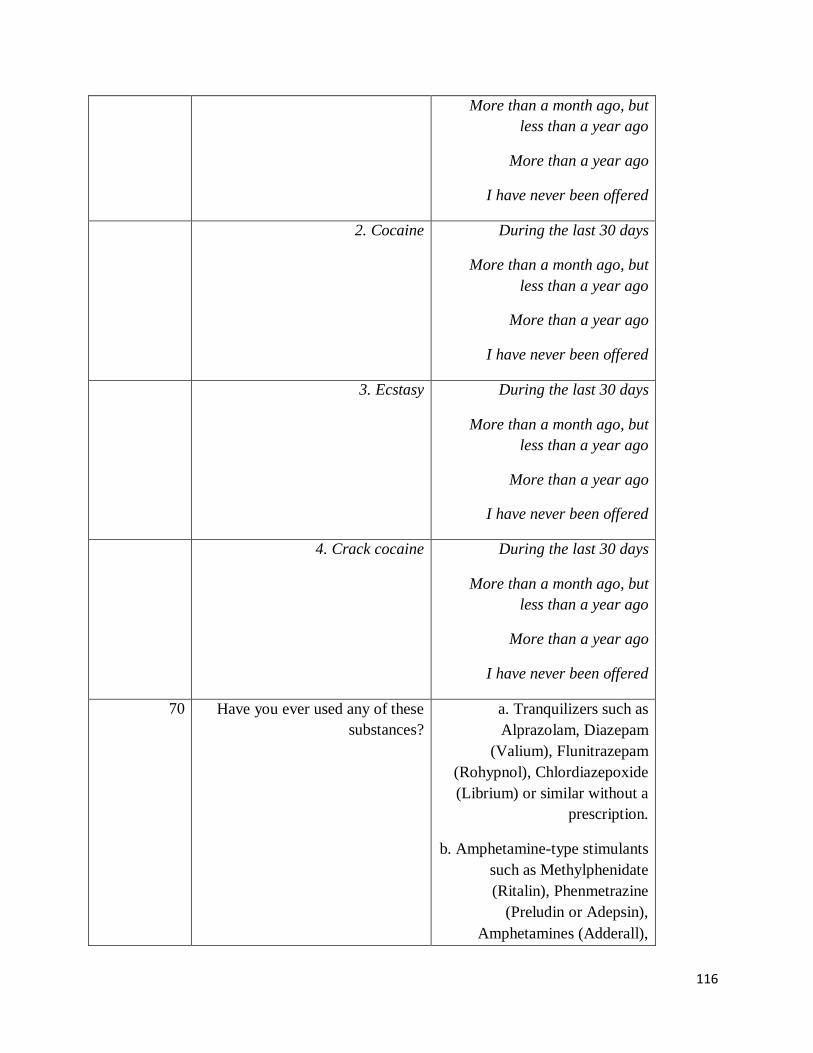
116
More than a month ago, but
less than a year ago
More than a year ago
I have never been offered
2. Cocaine During the last 30 days
More than a month ago, but
less than a year ago
More than a year ago
I have never been offered
3. Ecstasy During the last 30 days
More than a month ago, but
less than a year ago
More than a year ago
I have never been offered
4. Crack cocaine During the last 30 days
More than a month ago, but
less than a year ago
More than a year ago
I have never been offered
70 Have you ever used any of these
substances?
a. Tranquilizers such as
Alprazolam, Diazepam
(Valium), Flunitrazepam
(Rohypnol), Chlordiazepoxide
(Librium) or similar without a
prescription.
b. Amphetamine-type stimulants
such as Methylphenidate
(Ritalin), Phenmetrazine
(Preludin or Adepsin),
Amphetamines (Adderall),
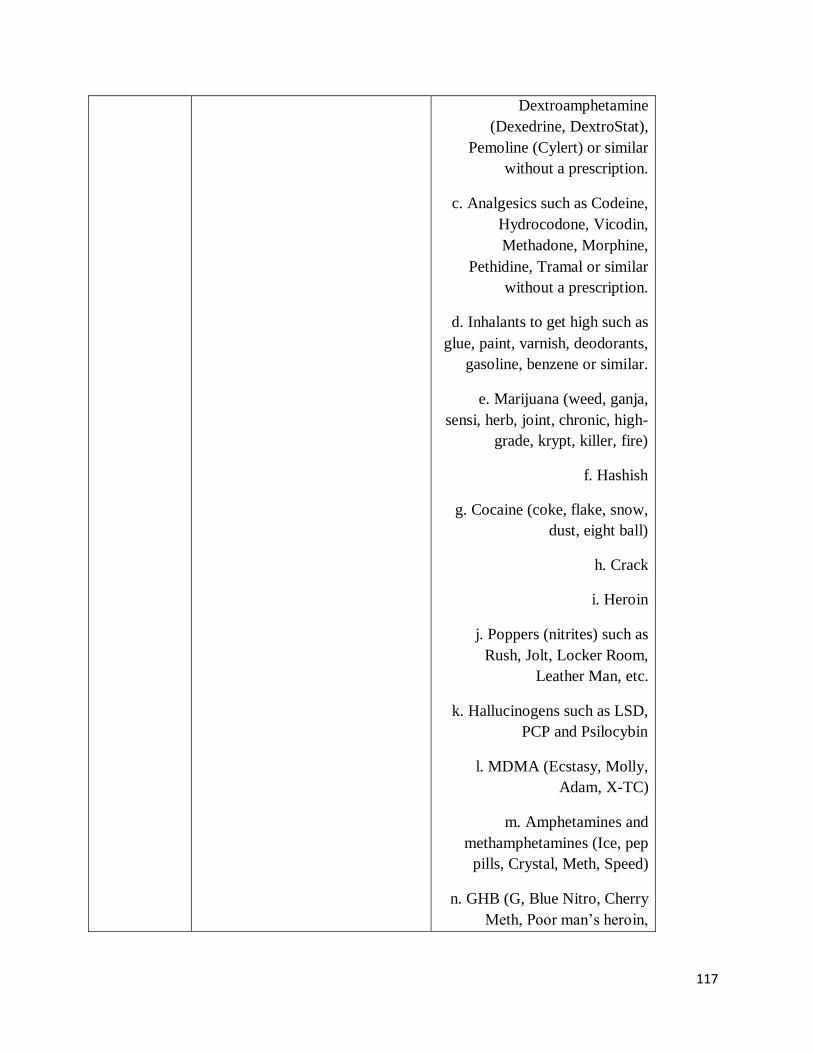
117
Dextroamphetamine
(Dexedrine, DextroStat),
Pemoline (Cylert) or similar
without a prescription.
c. Analgesics such as Codeine,
Hydrocodone, Vicodin,
Methadone, Morphine,
Pethidine, Tramal or similar
without a prescription.
d. Inhalants to get high such as
glue, paint, varnish, deodorants,
gasoline, benzene or similar.
e. Marijuana (weed, ganja,
sensi, herb, joint, chronic, high-
grade, krypt, killer, fire)
f. Hashish
g. Cocaine (coke, flake, snow,
dust, eight ball)
h. Crack
i. Heroin
j. Poppers (nitrites) such as
Rush, Jolt, Locker Room,
Leather Man, etc.
k. Hallucinogens such as LSD,
PCP and Psilocybin
l. MDMA (Ecstasy, Molly,
Adam, X-TC)
m. Amphetamines and
methamphetamines (Ice, pep
pills, Crystal, Meth, Speed)
n. GHB (G, Blue Nitro, Cherry
Meth, Poor man’s heroin,
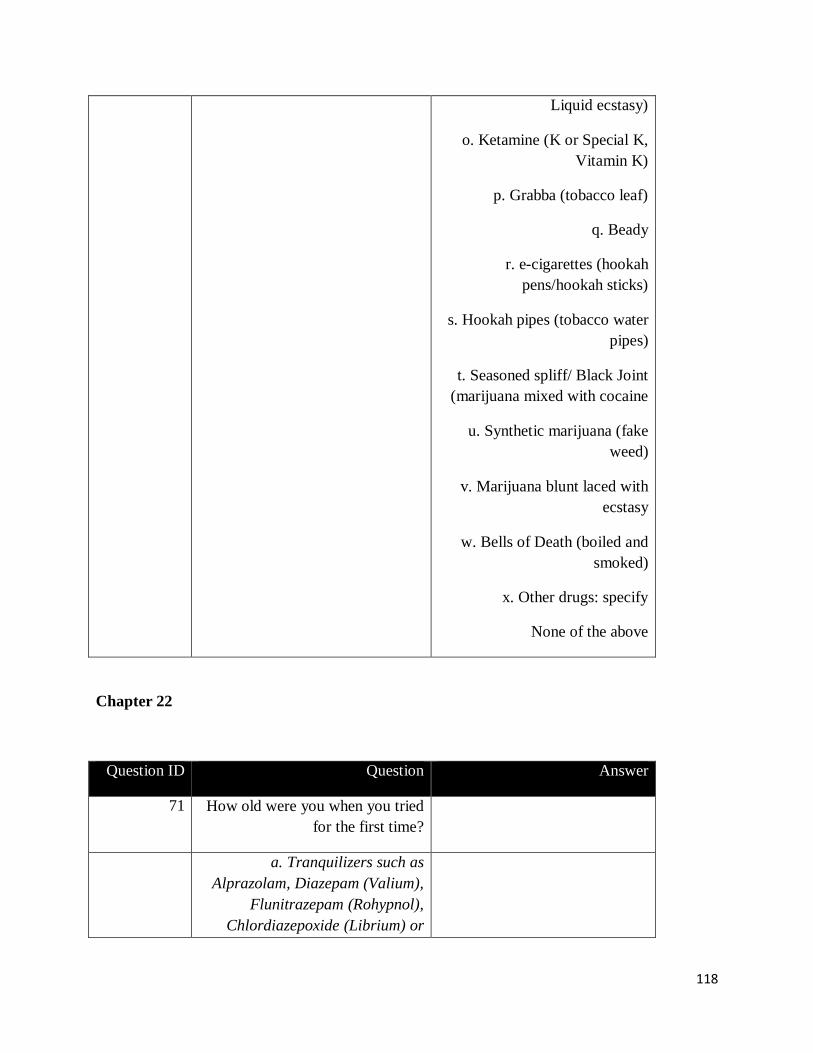
118
Liquid ecstasy)
o. Ketamine (K or Special K,
Vitamin K)
p. Grabba (tobacco leaf)
q. Beady
r. e-cigarettes (hookah
pens/hookah sticks)
s. Hookah pipes (tobacco water
pipes)
t. Seasoned spliff/ Black Joint
(marijuana mixed with cocaine
u. Synthetic marijuana (fake
weed)
v. Marijuana blunt laced with
ecstasy
w. Bells of Death (boiled and
smoked)
x. Other drugs: specify
None of the above
Chapter 22
Question ID Question Answer
71 How old were you when you tried
for the first time?
a. Tranquilizers such as
Alprazolam, Diazepam (Valium),
Flunitrazepam (Rohypnol),
Chlordiazepoxide (Librium) or
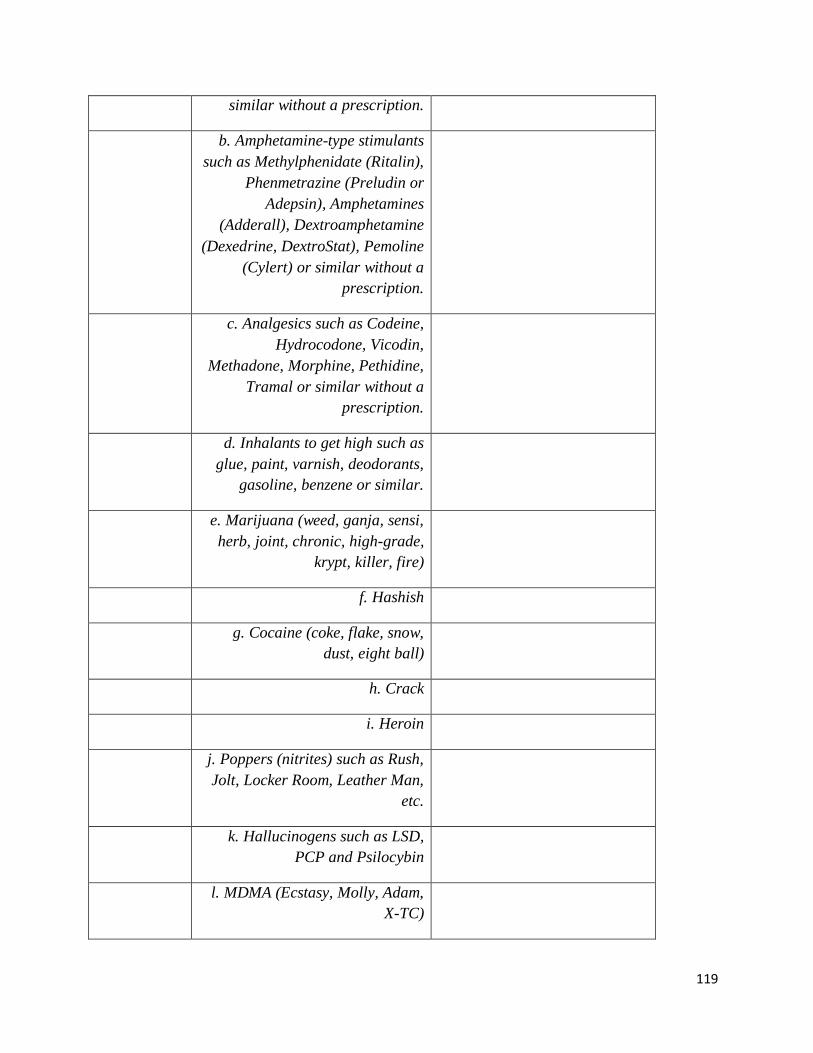
119
similar without a prescription.
b. Amphetamine-type stimulants
such as Methylphenidate (Ritalin),
Phenmetrazine (Preludin or
Adepsin), Amphetamines
(Adderall), Dextroamphetamine
(Dexedrine, DextroStat), Pemoline
(Cylert) or similar without a
prescription.
c. Analgesics such as Codeine,
Hydrocodone, Vicodin,
Methadone, Morphine, Pethidine,
Tramal or similar without a
prescription.
d. Inhalants to get high such as
glue, paint, varnish, deodorants,
gasoline, benzene or similar.
e. Marijuana (weed, ganja, sensi,
herb, joint, chronic, high-grade,
krypt, killer, fire)
f. Hashish
g. Cocaine (coke, flake, snow,
dust, eight ball)
h. Crack
i. Heroin
j. Poppers (nitrites) such as Rush,
Jolt, Locker Room, Leather Man,
etc.
k. Hallucinogens such as LSD,
PCP and Psilocybin
l. MDMA (Ecstasy, Molly, Adam,
X-TC)
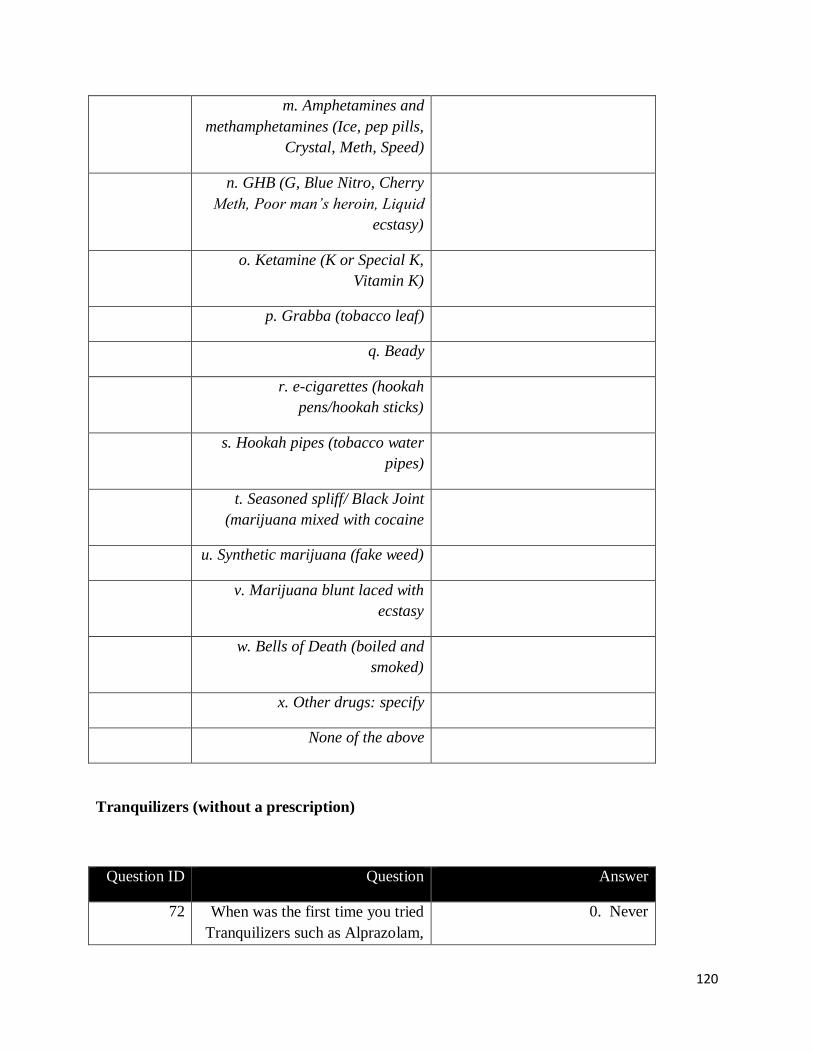
120
m. Amphetamines and
methamphetamines (Ice, pep pills,
Crystal, Meth, Speed)
n. GHB (G, Blue Nitro, Cherry
Meth, Poor man’s heroin, Liquid
ecstasy)
o. Ketamine (K or Special K,
Vitamin K)
p. Grabba (tobacco leaf)
q. Beady
r. e-cigarettes (hookah
pens/hookah sticks)
s. Hookah pipes (tobacco water
pipes)
t. Seasoned spliff/ Black Joint
(marijuana mixed with cocaine
u. Synthetic marijuana (fake weed)
v. Marijuana blunt laced with
ecstasy
w. Bells of Death (boiled and
smoked)
x. Other drugs: specify
None of the above
Tranquilizers (without a prescription)
Question ID Question Answer
72 When was the first time you tried
Tranquilizers such as Alprazolam,
0. Never
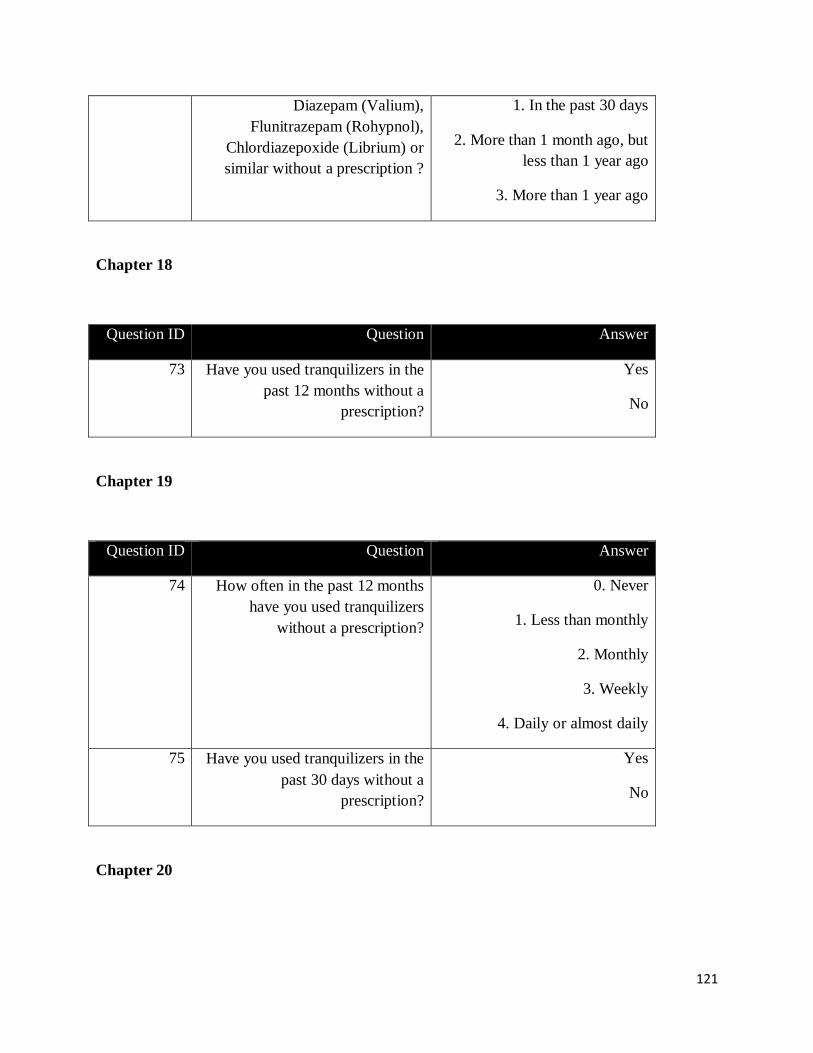
121
Diazepam (Valium),
Flunitrazepam (Rohypnol),
Chlordiazepoxide (Librium) or
similar without a prescription ?
1. In the past 30 days
2. More than 1 month ago, but
less than 1 year ago
3. More than 1 year ago
Chapter 18
Question ID Question Answer
73 Have you used tranquilizers in the
past 12 months without a
prescription?
Yes
No
Chapter 19
Question ID Question Answer
74 How often in the past 12 months
have you used tranquilizers
without a prescription?
0. Never
1. Less than monthly
2. Monthly
3. Weekly
4. Daily or almost daily
75 Have you used tranquilizers in the
past 30 days without a
prescription?
Yes
No
Chapter 20
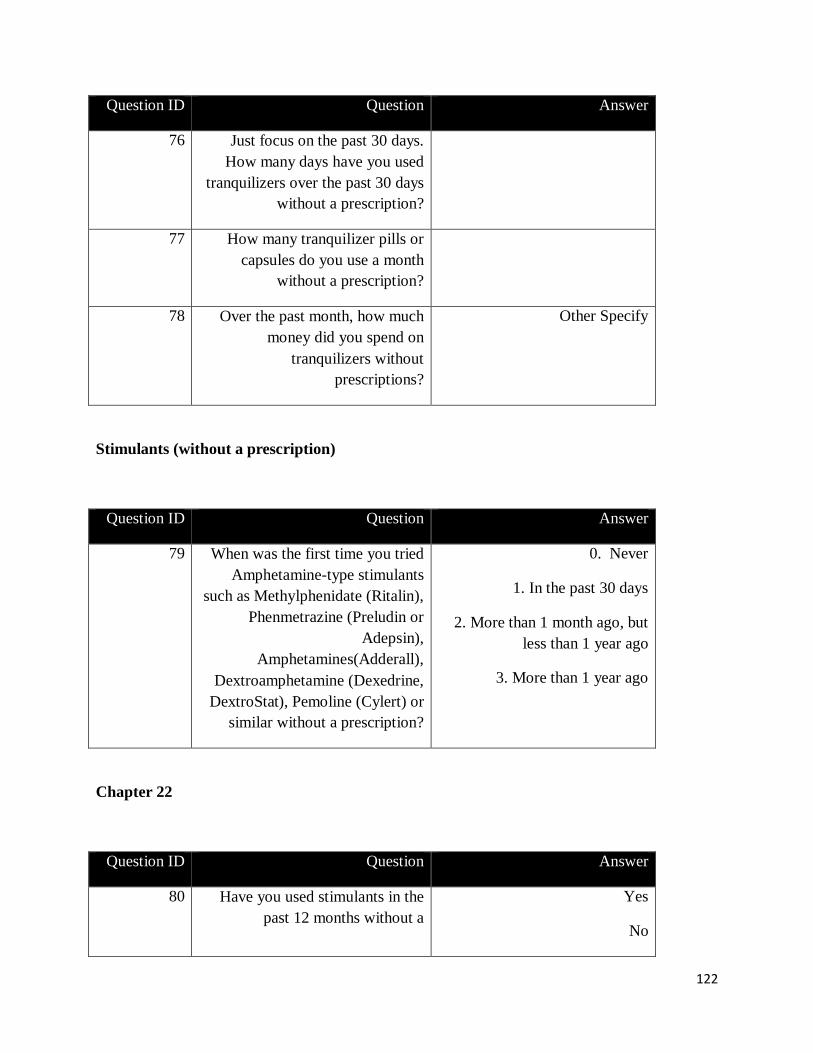
122
Question ID Question Answer
76 Just focus on the past 30 days.
How many days have you used
tranquilizers over the past 30 days
without a prescription?
77 How many tranquilizer pills or
capsules do you use a month
without a prescription?
78 Over the past month, how much
money did you spend on
tranquilizers without
prescriptions?
Other Specify
Stimulants (without a prescription)
Question ID Question Answer
79 When was the first time you tried
Amphetamine-type stimulants
such as Methylphenidate (Ritalin),
Phenmetrazine (Preludin or
Adepsin),
Amphetamines(Adderall),
Dextroamphetamine (Dexedrine,
DextroStat), Pemoline (Cylert) or
similar without a prescription?
0. Never
1. In the past 30 days
2. More than 1 month ago, but
less than 1 year ago
3. More than 1 year ago
Chapter 22
Question ID Question Answer
80 Have you used stimulants in the
past 12 months without a
Yes
No
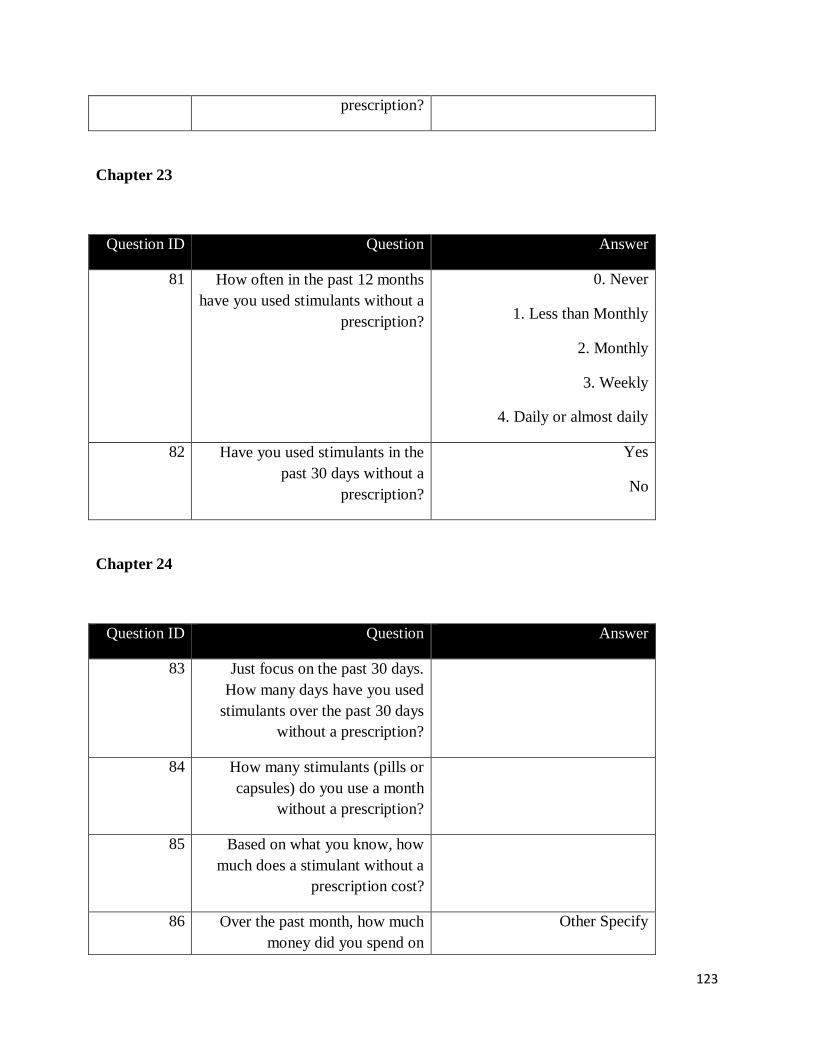
123
prescription?
Chapter 23
Question ID Question Answer
81 How often in the past 12 months
have you used stimulants without a
prescription?
0. Never
1. Less than Monthly
2. Monthly
3. Weekly
4. Daily or almost daily
82 Have you used stimulants in the
past 30 days without a
prescription?
Yes
No
Chapter 24
Question ID Question Answer
83 Just focus on the past 30 days.
How many days have you used
stimulants over the past 30 days
without a prescription?
84 How many stimulants (pills or
capsules) do you use a month
without a prescription?
85 Based on what you know, how
much does a stimulant without a
prescription cost?
86 Over the past month, how much
money did you spend on
Other Specify
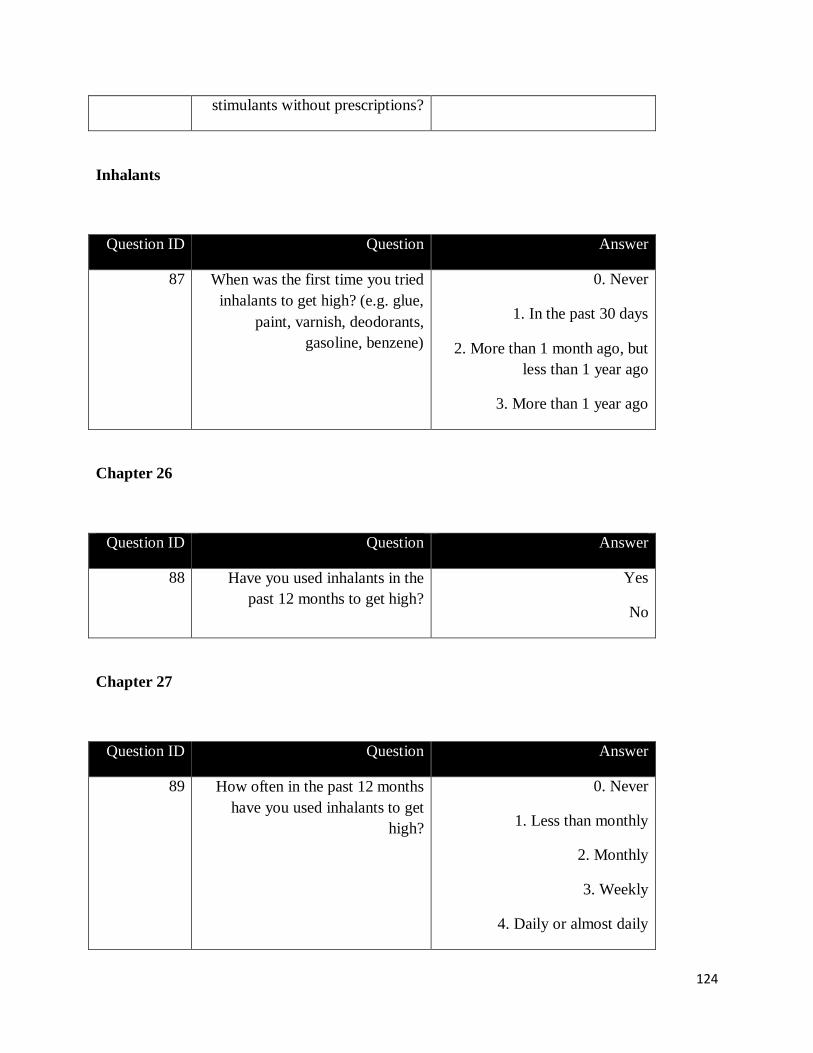
124
stimulants without prescriptions?
Inhalants
Question ID Question Answer
87 When was the first time you tried
inhalants to get high? (e.g. glue,
paint, varnish, deodorants,
gasoline, benzene)
0. Never
1. In the past 30 days
2. More than 1 month ago, but
less than 1 year ago
3. More than 1 year ago
Chapter 26
Question ID Question Answer
88 Have you used inhalants in the
past 12 months to get high?
Yes
No
Chapter 27
Question ID Question Answer
89 How often in the past 12 months
have you used inhalants to get
high?
0. Never
1. Less than monthly
2. Monthly
3. Weekly
4. Daily or almost daily
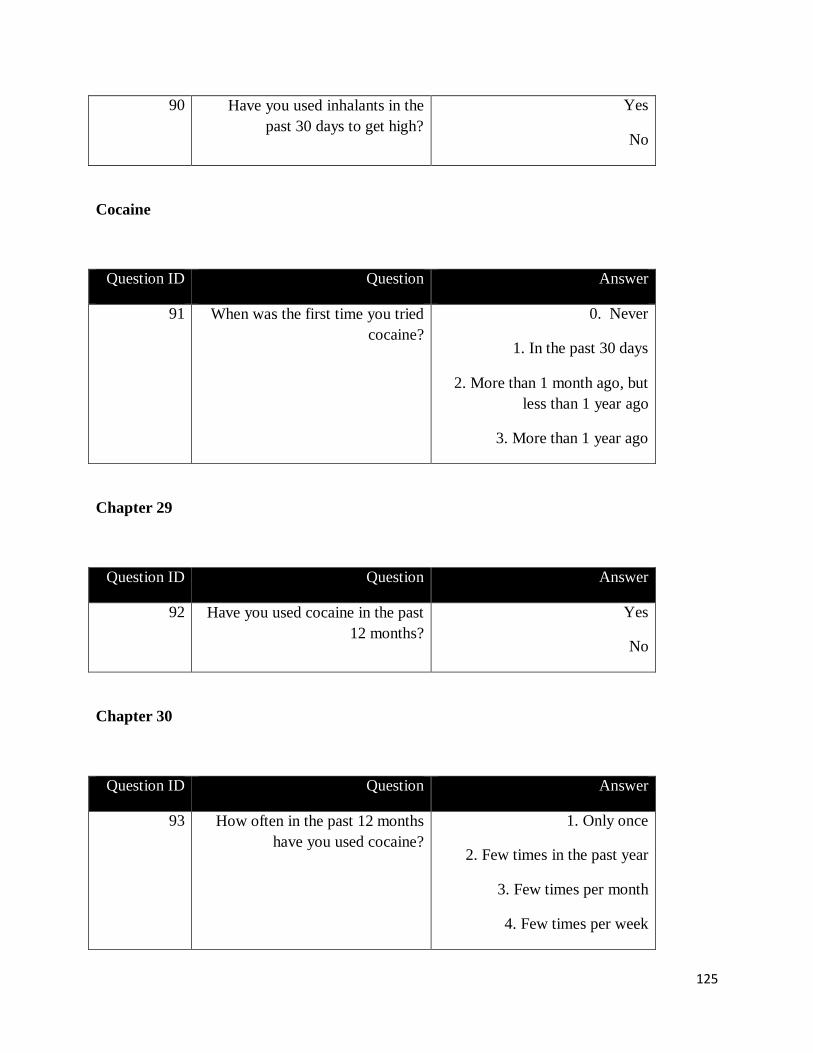
125
90 Have you used inhalants in the
past 30 days to get high?
Yes
No
Cocaine
Question ID Question Answer
91 When was the first time you tried
cocaine?
0. Never
1. In the past 30 days
2. More than 1 month ago, but
less than 1 year ago
3. More than 1 year ago
Chapter 29
Question ID Question Answer
92 Have you used cocaine in the past
12 months?
Yes
No
Chapter 30
Question ID Question Answer
93 How often in the past 12 months
have you used cocaine?
1. Only once
2. Few times in the past year
3. Few times per month
4. Few times per week
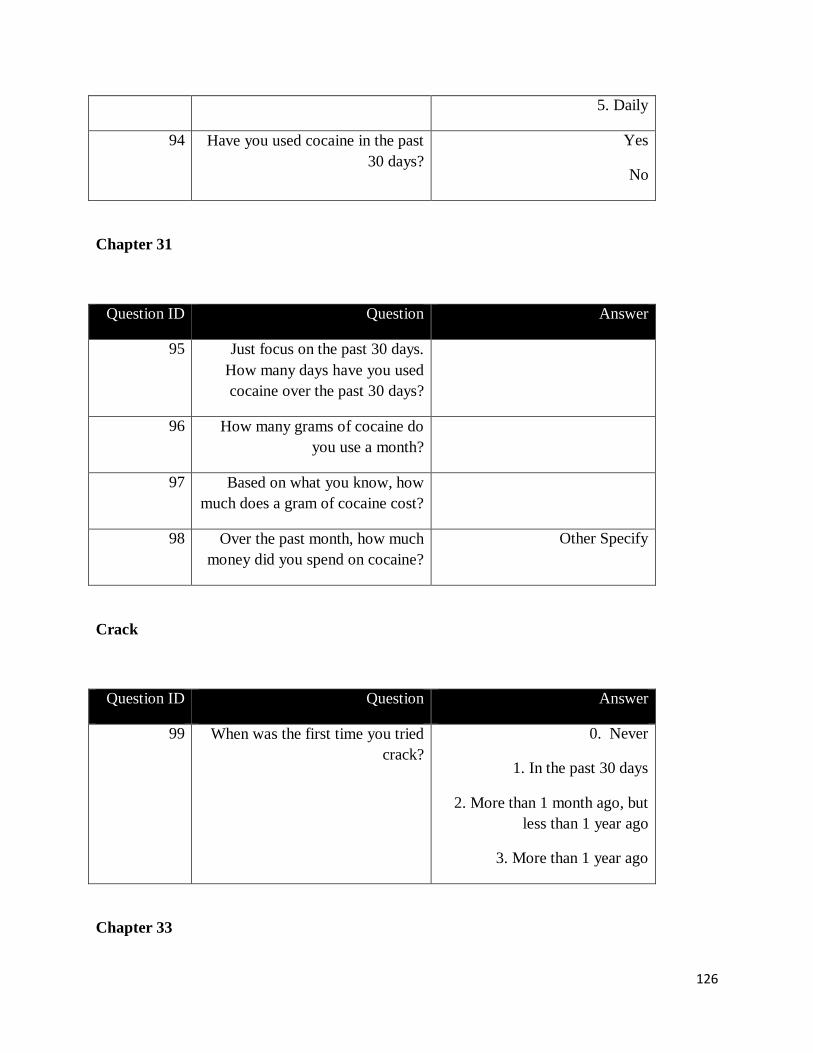
126
5. Daily
94 Have you used cocaine in the past
30 days?
Yes
No
Chapter 31
Question ID Question Answer
95 Just focus on the past 30 days.
How many days have you used
cocaine over the past 30 days?
96 How many grams of cocaine do
you use a month?
97 Based on what you know, how
much does a gram of cocaine cost?
98 Over the past month, how much
money did you spend on cocaine?
Other Specify
Crack
Question ID Question Answer
99 When was the first time you tried
crack?
0. Never
1. In the past 30 days
2. More than 1 month ago, but
less than 1 year ago
3. More than 1 year ago
Chapter 33
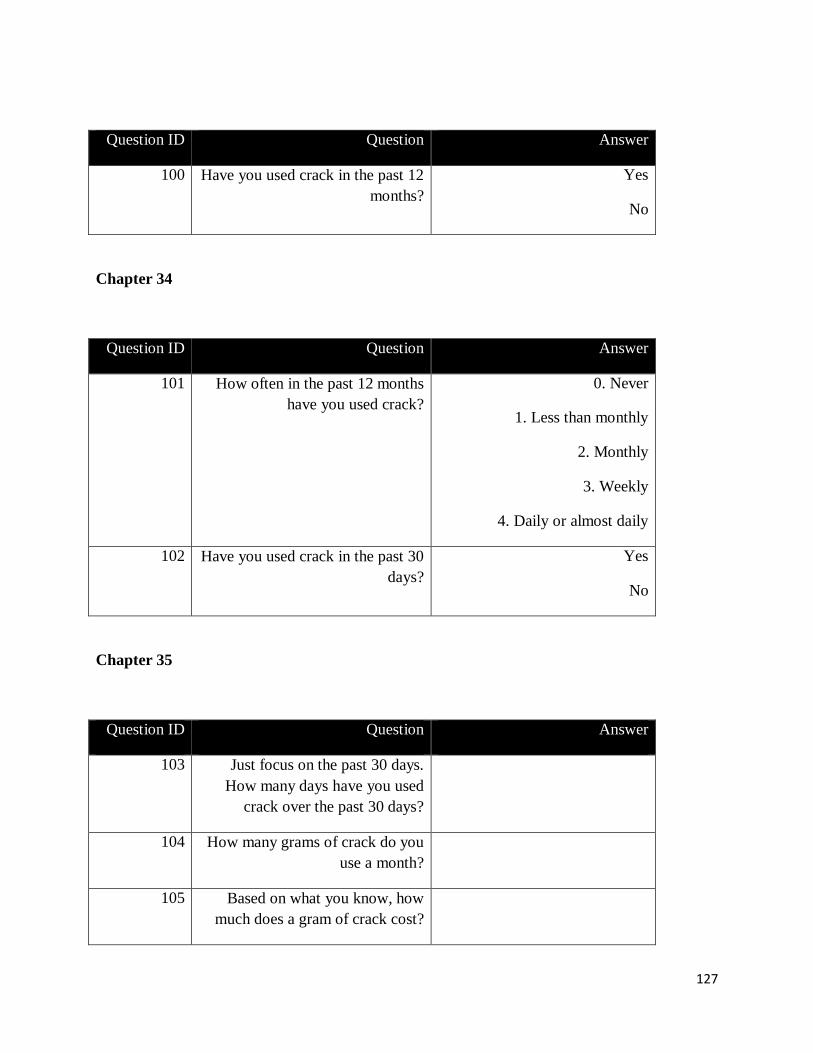
127
Question ID Question Answer
100 Have you used crack in the past 12
months?
Yes
No
Chapter 34
Question ID Question Answer
101 How often in the past 12 months
have you used crack?
0. Never
1. Less than monthly
2. Monthly
3. Weekly
4. Daily or almost daily
102 Have you used crack in the past 30
days?
Yes
No
Chapter 35
Question ID Question Answer
103 Just focus on the past 30 days.
How many days have you used
crack over the past 30 days?
104 How many grams of crack do you
use a month?
105 Based on what you know, how
much does a gram of crack cost?
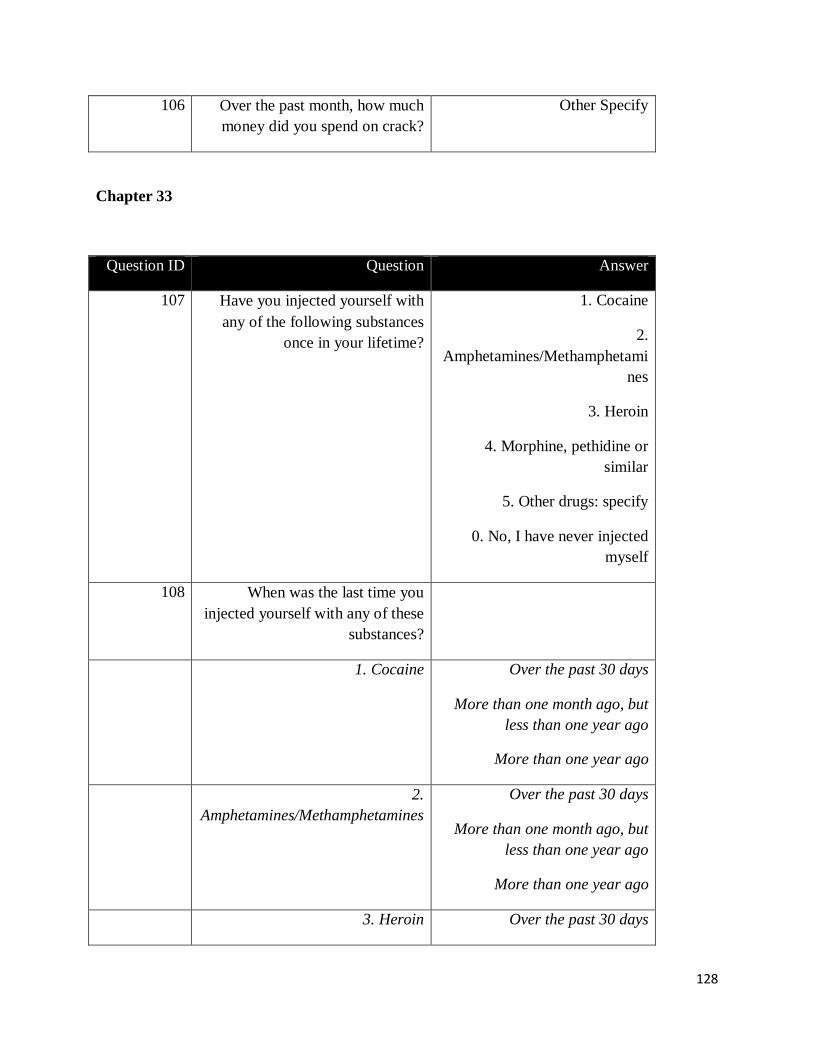
128
106 Over the past month, how much
money did you spend on crack?
Other Specify
Chapter 33
Question ID Question Answer
107 Have you injected yourself with
any of the following substances
once in your lifetime?
1. Cocaine
2.
Amphetamines/Methamphetami
nes
3. Heroin
4. Morphine, pethidine or
similar
5. Other drugs: specify
0. No, I have never injected
myself
108 When was the last time you
injected yourself with any of these
substances?
1. Cocaine Over the past 30 days
More than one month ago, but
less than one year ago
More than one year ago
2.
Amphetamines/Methamphetamines
Over the past 30 days
More than one month ago, but
less than one year ago
More than one year ago
3. Heroin Over the past 30 days
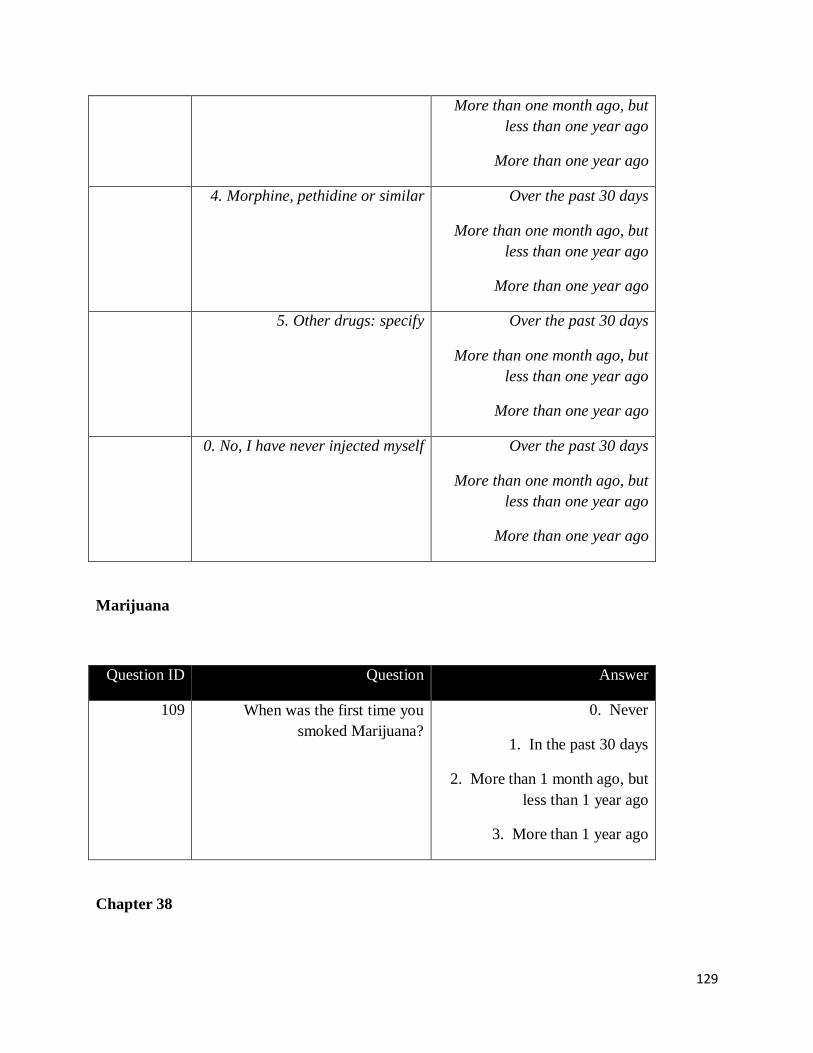
129
More than one month ago, but
less than one year ago
More than one year ago
4. Morphine, pethidine or similar Over the past 30 days
More than one month ago, but
less than one year ago
More than one year ago
5. Other drugs: specify Over the past 30 days
More than one month ago, but
less than one year ago
More than one year ago
0. No, I have never injected myself Over the past 30 days
More than one month ago, but
less than one year ago
More than one year ago
Marijuana
Question ID Question Answer
109 When was the first time you
smoked Marijuana?
0. Never
1. In the past 30 days
2. More than 1 month ago, but
less than 1 year ago
3. More than 1 year ago
Chapter 38
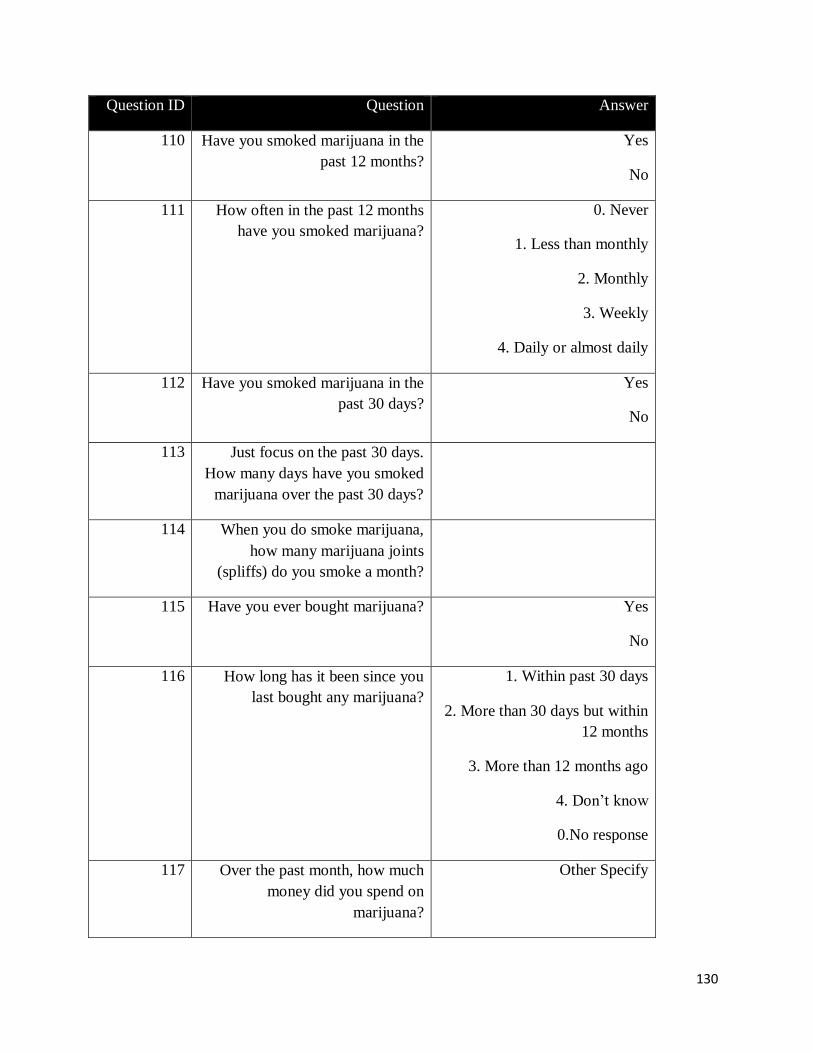
130
Question ID Question Answer
110 Have you smoked marijuana in the
past 12 months?
Yes
No
111 How often in the past 12 months
have you smoked marijuana?
0. Never
1. Less than monthly
2. Monthly
3. Weekly
4. Daily or almost daily
112 Have you smoked marijuana in the
past 30 days?
Yes
No
113 Just focus on the past 30 days.
How many days have you smoked
marijuana over the past 30 days?
114 When you do smoke marijuana,
how many marijuana joints
(spliffs) do you smoke a month?
115 Have you ever bought marijuana? Yes
No
116 How long has it been since you
last bought any marijuana?
1. Within past 30 days
2. More than 30 days but within
12 months
3. More than 12 months ago
4. Don’t know
0.No response
117 Over the past month, how much
money did you spend on
marijuana?
Other Specify
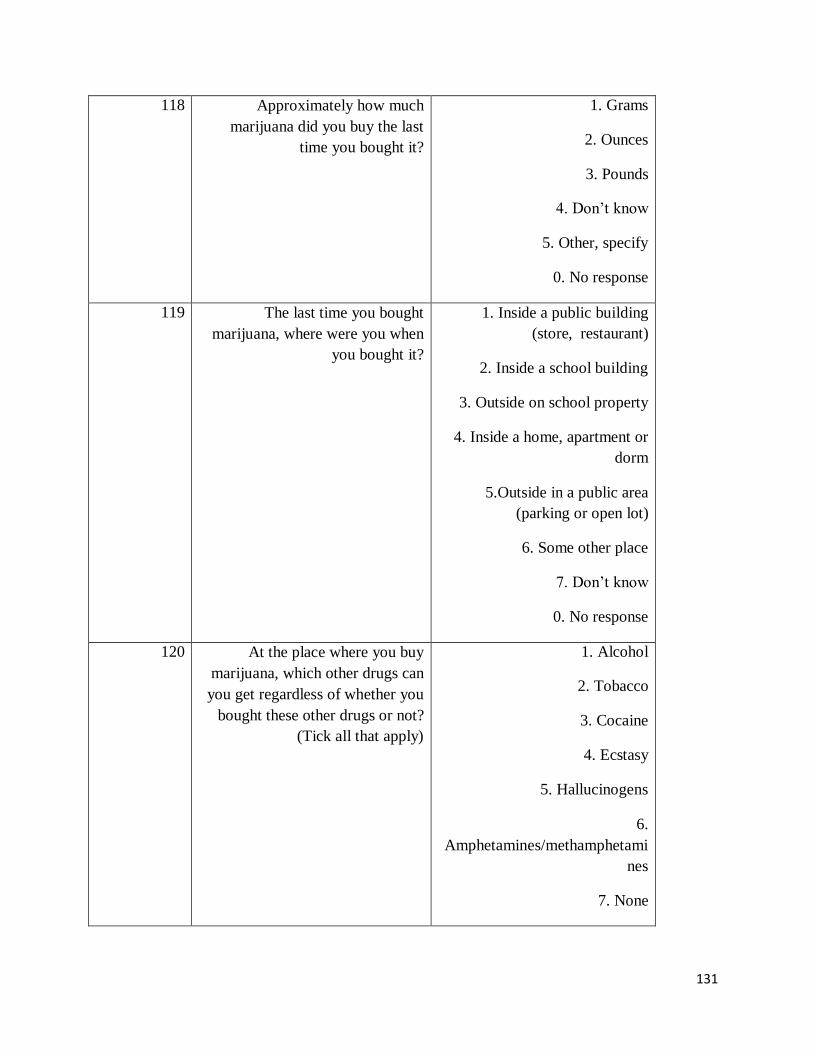
131
118 Approximately how much
marijuana did you buy the last
time you bought it?
1. Grams
2. Ounces
3. Pounds
4. Don’t know
5. Other, specify
0. No response
119 The last time you bought
marijuana, where were you when
you bought it?
1. Inside a public building
(store, restaurant)
2. Inside a school building
3. Outside on school property
4. Inside a home, apartment or
dorm
5.Outside in a public area
(parking or open lot)
6. Some other place
7. Don’t know
0. No response
120 At the place where you buy
marijuana, which other drugs can
you get regardless of whether you
bought these other drugs or not?
(Tick all that apply)
1. Alcohol
2. Tobacco
3. Cocaine
4. Ecstasy
5. Hallucinogens
6.
Amphetamines/methamphetami
nes
7. None
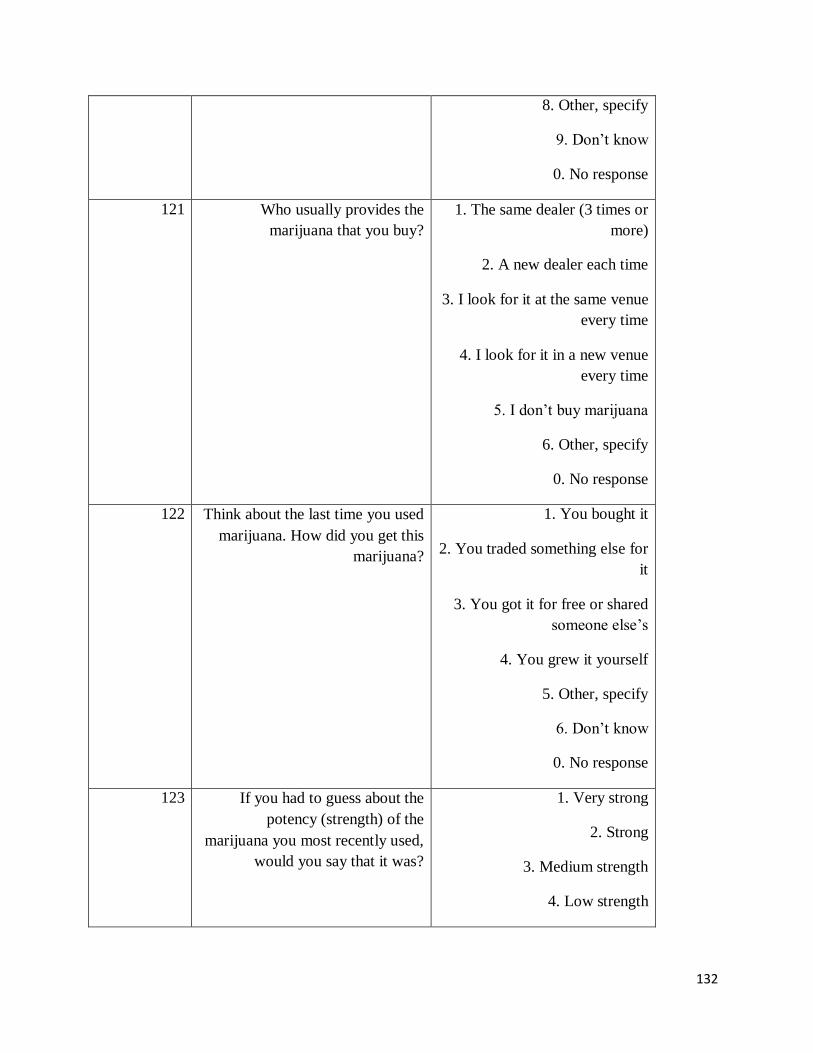
132
8. Other, specify
9. Don’t know
0. No response
121 Who usually provides the
marijuana that you buy?
1. The same dealer (3 times or
more)
2. A new dealer each time
3. I look for it at the same venue
every time
4. I look for it in a new venue
every time
5. I don’t buy marijuana
6. Other, specify
0. No response
122 Think about the last time you used
marijuana. How did you get this
marijuana?
1. You bought it
2. You traded something else for
it
3. You got it for free or shared
someone else’s
4. You grew it yourself
5. Other, specify
6. Don’t know
0. No response
123 If you had to guess about the
potency (strength) of the
marijuana you most recently used,
would you say that it was?
1. Very strong
2. Strong
3. Medium strength
4. Low strength
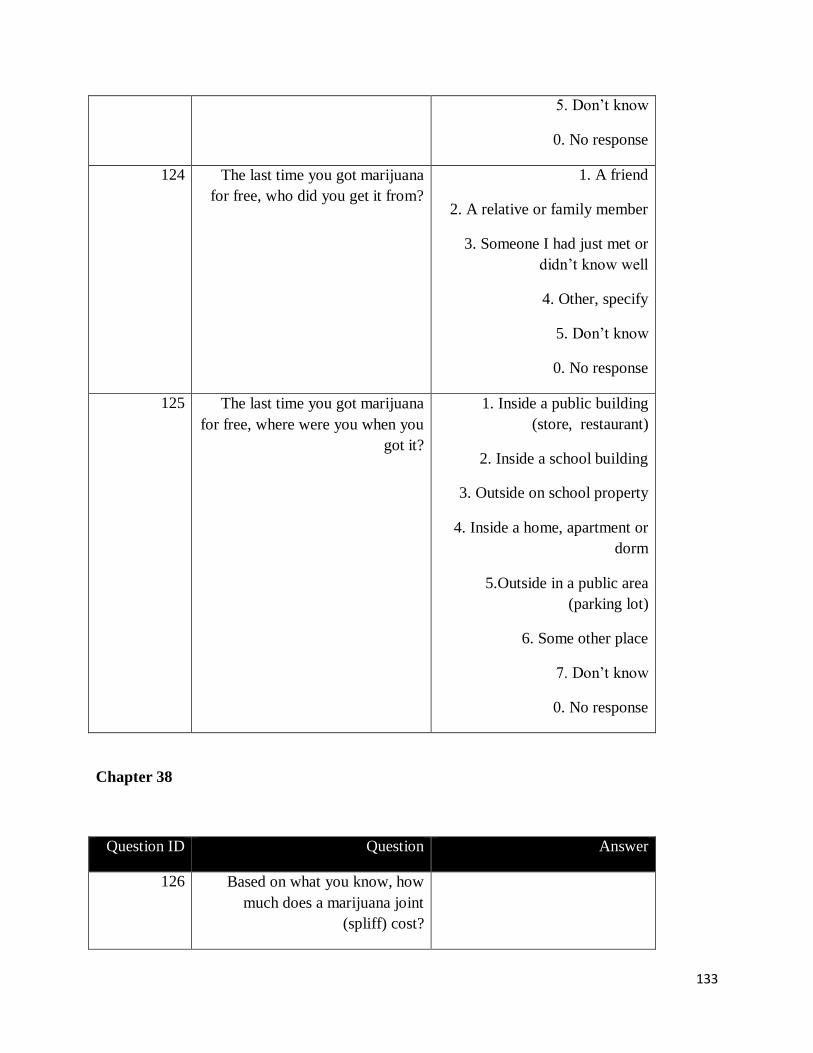
133
5. Don’t know
0. No response
124 The last time you got marijuana
for free, who did you get it from?
1. A friend
2. A relative or family member
3. Someone I had just met or
didn’t know well
4. Other, specify
5. Don’t know
0. No response
125 The last time you got marijuana
for free, where were you when you
got it?
1. Inside a public building
(store, restaurant)
2. Inside a school building
3. Outside on school property
4. Inside a home, apartment or
dorm
5.Outside in a public area
(parking lot)
6. Some other place
7. Don’t know
0. No response
Chapter 38
Question ID Question Answer
126 Based on what you know, how
much does a marijuana joint
(spliff) cost?
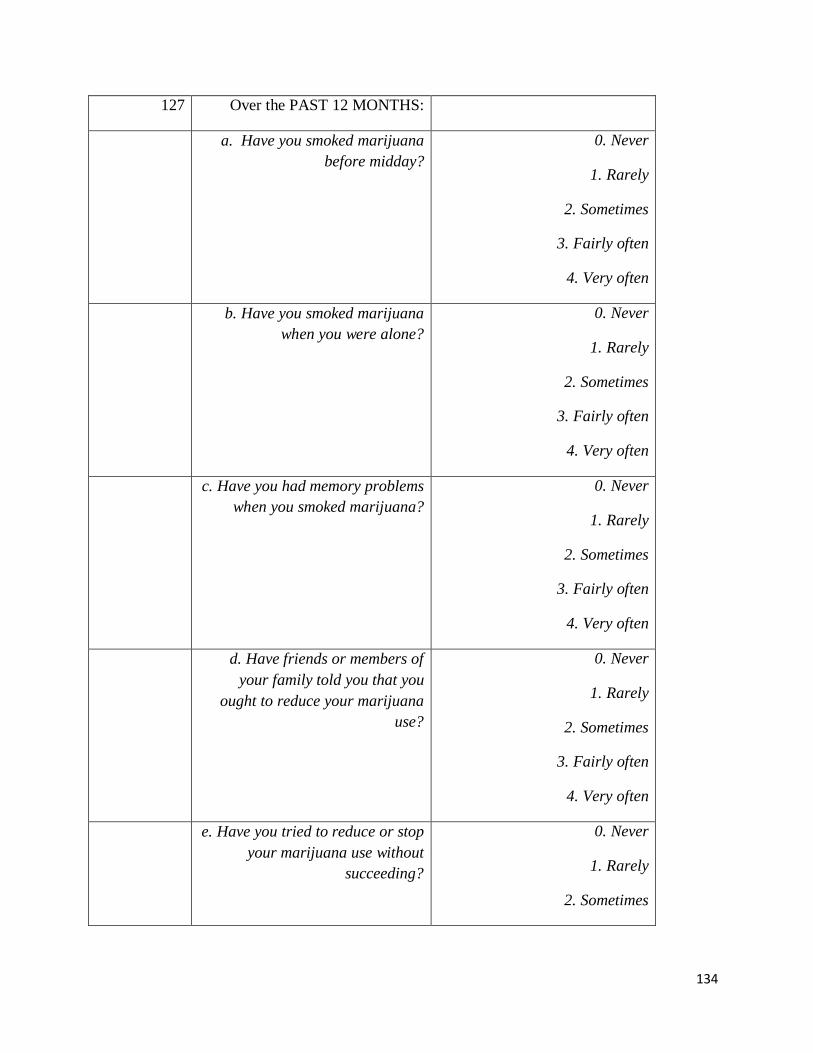
134
127 Over the PAST 12 MONTHS:
a. Have you smoked marijuana
before midday?
0. Never
1. Rarely
2. Sometimes
3. Fairly often
4. Very often
b. Have you smoked marijuana
when you were alone?
0. Never
1. Rarely
2. Sometimes
3. Fairly often
4. Very often
c. Have you had memory problems
when you smoked marijuana?
0. Never
1. Rarely
2. Sometimes
3. Fairly often
4. Very often
d. Have friends or members of
your family told you that you
ought to reduce your marijuana
use?
0. Never
1. Rarely
2. Sometimes
3. Fairly often
4. Very often
e. Have you tried to reduce or stop
your marijuana use without
succeeding?
0. Never
1. Rarely
2. Sometimes
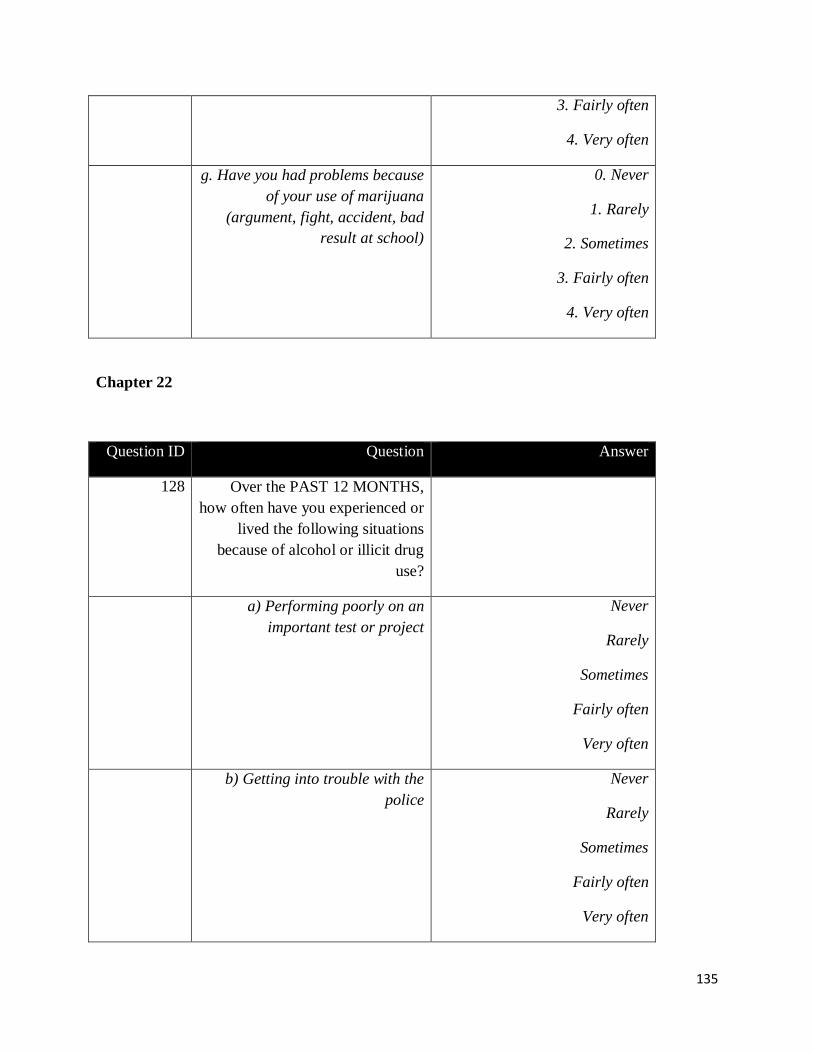
135
3. Fairly often
4. Very often
g. Have you had problems because
of your use of marijuana
(argument, fight, accident, bad
result at school)
0. Never
1. Rarely
2. Sometimes
3. Fairly often
4. Very often
Chapter 22
Question ID Question Answer
128 Over the PAST 12 MONTHS,
how often have you experienced or
lived the following situations
because of alcohol or illicit drug
use?
a) Performing poorly on an
important test or project
Never
Rarely
Sometimes
Fairly often
Very often
b) Getting into trouble with the
police
Never
Rarely
Sometimes
Fairly often
Very often
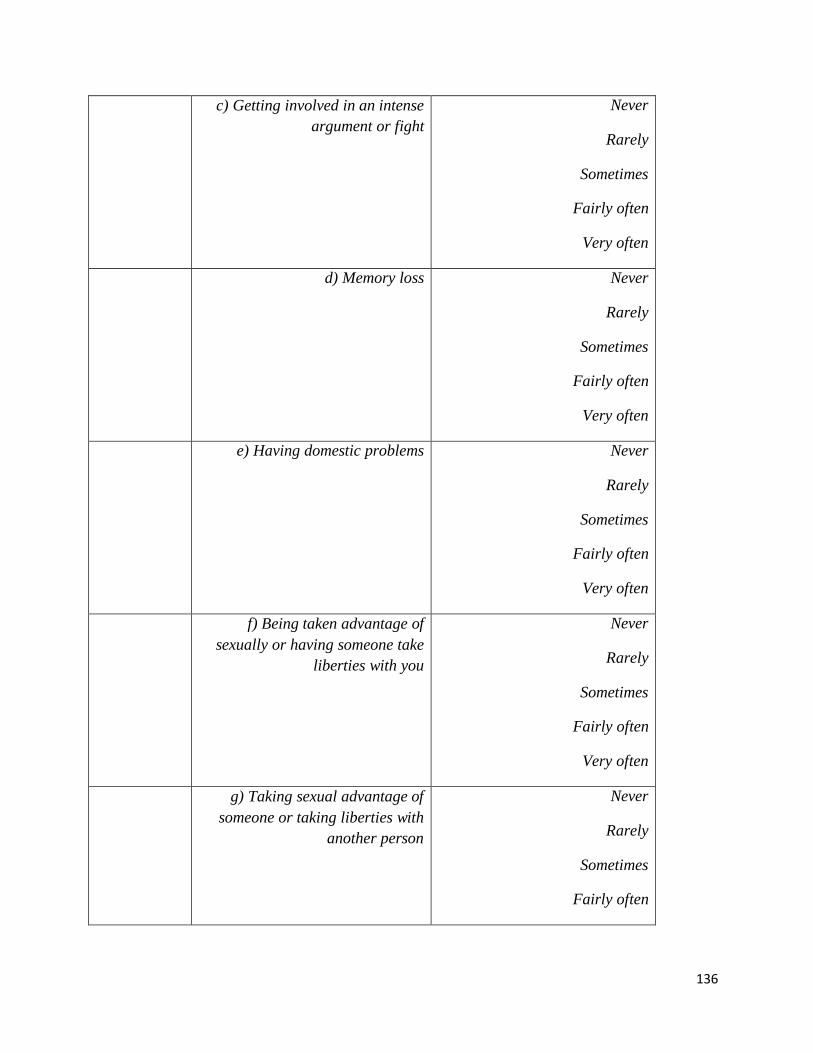
136
c) Getting involved in an intense
argument or fight
Never
Rarely
Sometimes
Fairly often
Very often
d) Memory loss Never
Rarely
Sometimes
Fairly often
Very often
e) Having domestic problems Never
Rarely
Sometimes
Fairly often
Very often
f) Being taken advantage of
sexually or having someone take
liberties with you
Never
Rarely
Sometimes
Fairly often
Very often
g) Taking sexual advantage of
someone or taking liberties with
another person
Never
Rarely
Sometimes
Fairly often
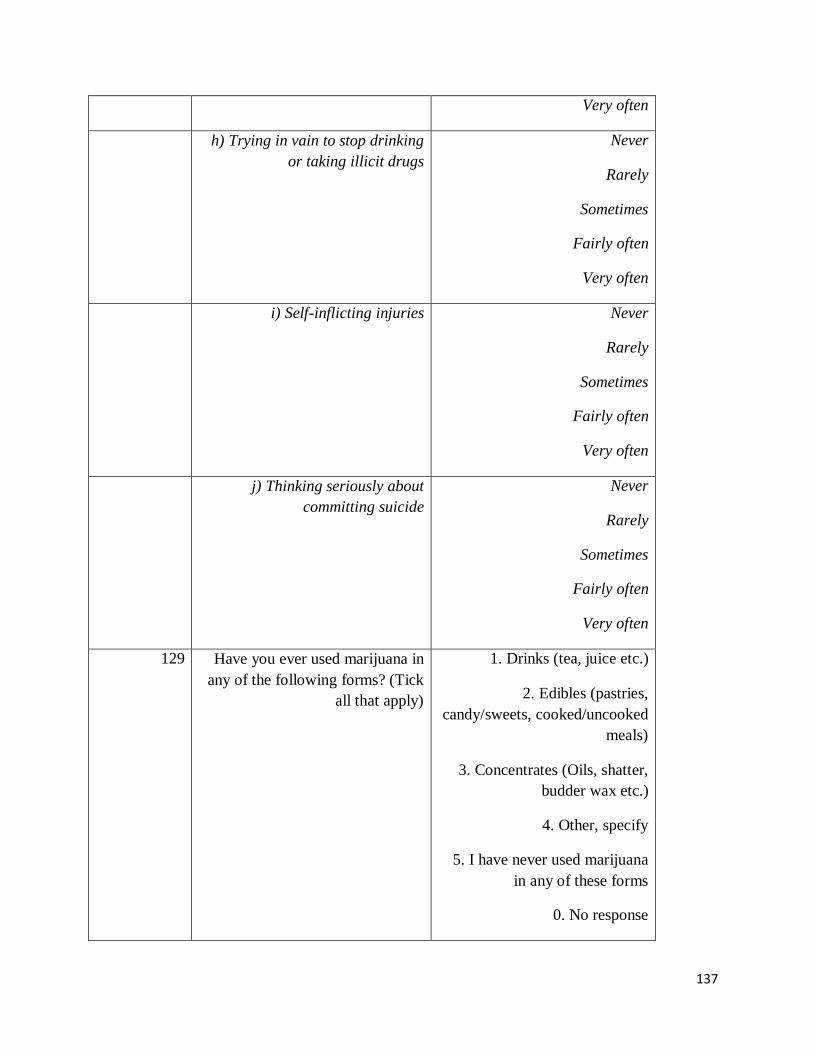
137
Very often
h) Trying in vain to stop drinking
or taking illicit drugs
Never
Rarely
Sometimes
Fairly often
Very often
i) Self-inflicting injuries Never
Rarely
Sometimes
Fairly often
Very often
j) Thinking seriously about
committing suicide
Never
Rarely
Sometimes
Fairly often
Very often
129 Have you ever used marijuana in
any of the following forms? (Tick
all that apply)
1. Drinks (tea, juice etc.)
2. Edibles (pastries,
candy/sweets, cooked/uncooked
meals)
3. Concentrates (Oils, shatter,
budder wax etc.)
4. Other, specify
5. I have never used marijuana
in any of these forms
0. No response
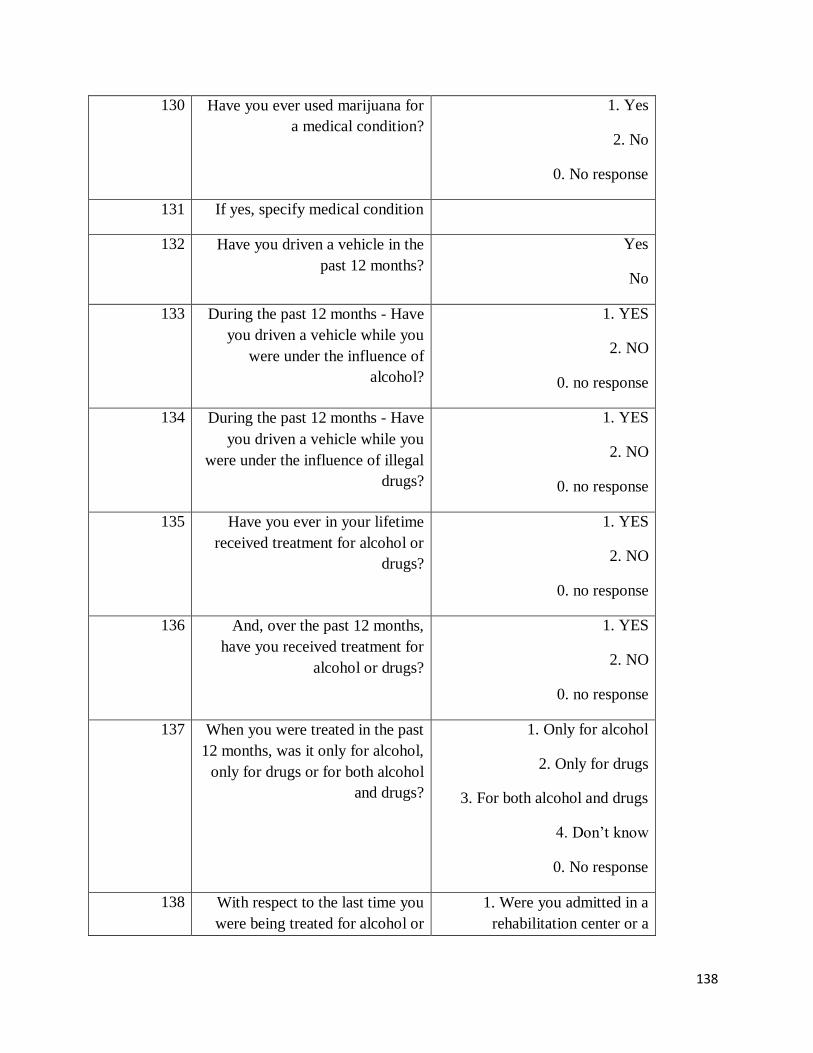
138
130 Have you ever used marijuana for
a medical condition?
1. Yes
2. No
0. No response
131 If yes, specify medical condition
132 Have you driven a vehicle in the
past 12 months?
Yes
No
133 During the past 12 months - Have
you driven a vehicle while you
were under the influence of
alcohol?
1. YES
2. NO
0. no response
134 During the past 12 months - Have
you driven a vehicle while you
were under the influence of illegal
drugs?
1. YES
2. NO
0. no response
135 Have you ever in your lifetime
received treatment for alcohol or
drugs?
1. YES
2. NO
0. no response
136 And, over the past 12 months,
have you received treatment for
alcohol or drugs?
1. YES
2. NO
0. no response
137 When you were treated in the past
12 months, was it only for alcohol,
only for drugs or for both alcohol
and drugs?
1. Only for alcohol
2. Only for drugs
3. For both alcohol and drugs
4. Don’t know
0. No response
138 With respect to the last time you
were being treated for alcohol or
1. Were you admitted in a
rehabilitation center or a
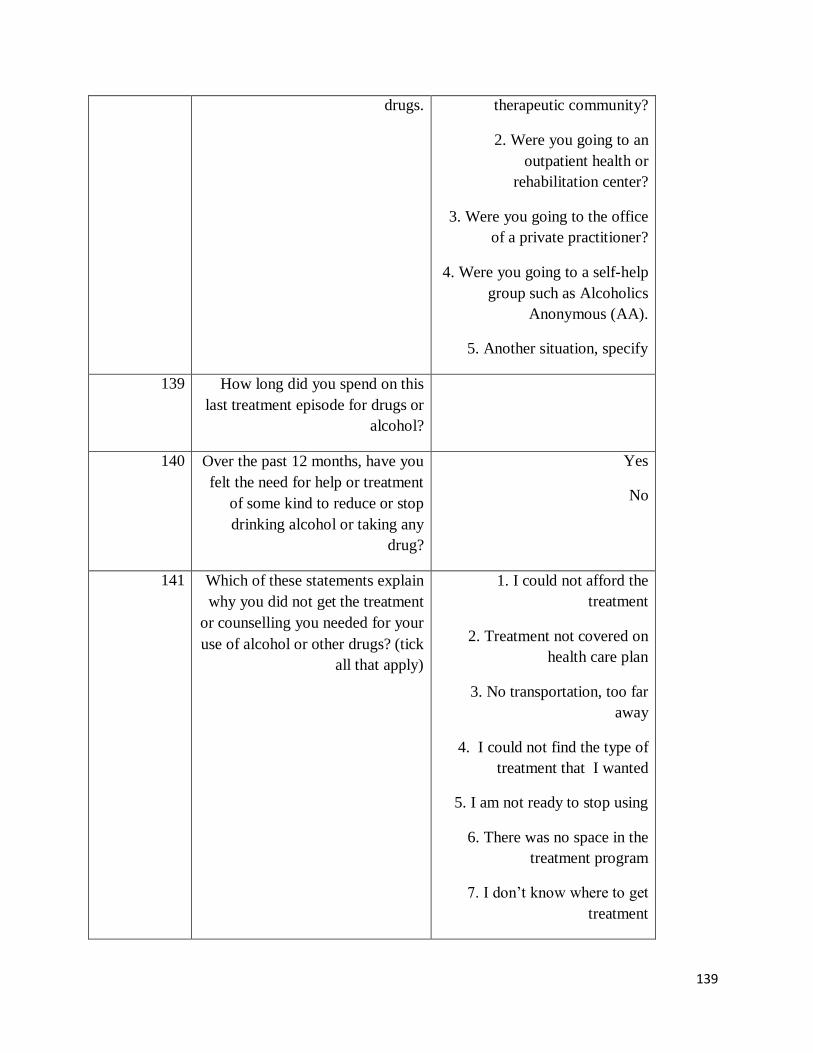
139
drugs. therapeutic community?
2. Were you going to an
outpatient health or
rehabilitation center?
3. Were you going to the office
of a private practitioner?
4. Were you going to a self-help
group such as Alcoholics
Anonymous (AA).
5. Another situation, specify
139 How long did you spend on this
last treatment episode for drugs or
alcohol?
140 Over the past 12 months, have you
felt the need for help or treatment
of some kind to reduce or stop
drinking alcohol or taking any
drug?
Yes
No
141 Which of these statements explain
why you did not get the treatment
or counselling you needed for your
use of alcohol or other drugs? (tick
all that apply)
1. I could not afford the
treatment
2. Treatment not covered on
health care plan
3. No transportation, too far
away
4. I could not find the type of
treatment that I wanted
5. I am not ready to stop using
6. There was no space in the
treatment program
7. I don’t know where to get
treatment
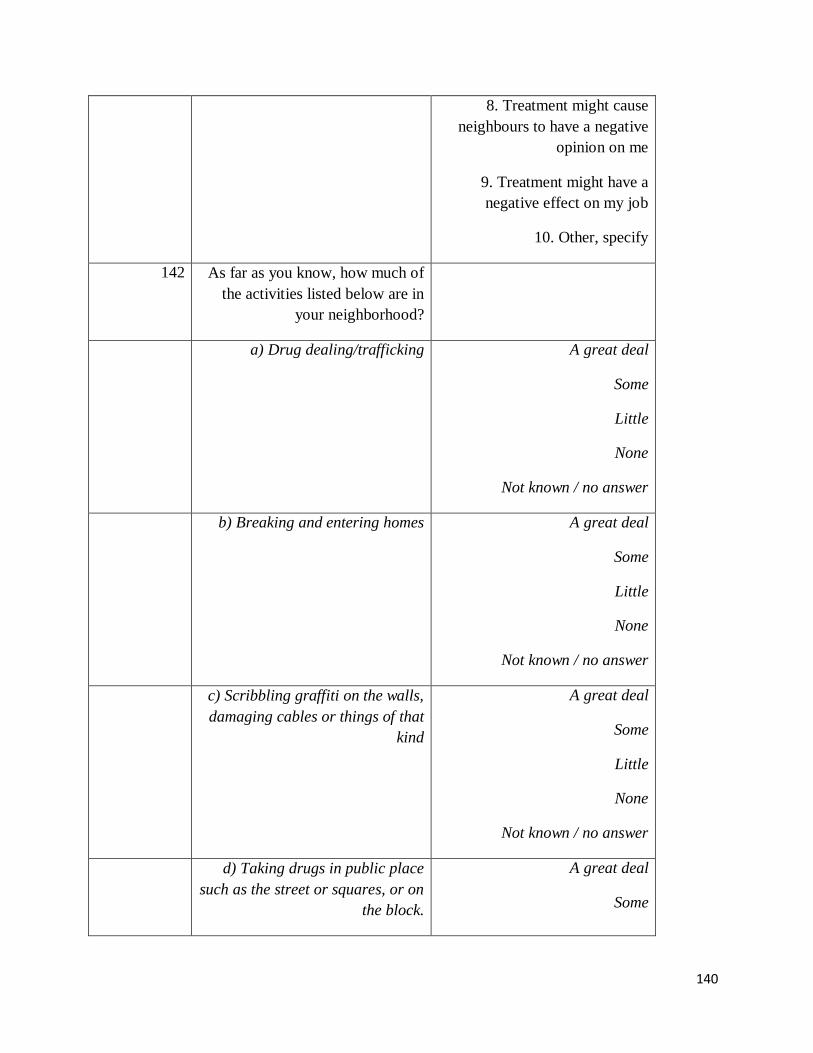
140
8. Treatment might cause
neighbours to have a negative
opinion on me
9. Treatment might have a
negative effect on my job
10. Other, specify
142 As far as you know, how much of
the activities listed below are in
your neighborhood?
a) Drug dealing/trafficking A great deal
Some
Little
None
Not known / no answer
b) Breaking and entering homes A great deal
Some
Little
None
Not known / no answer
c) Scribbling graffiti on the walls,
damaging cables or things of that
kind
A great deal
Some
Little
None
Not known / no answer
d) Taking drugs in public place
such as the street or squares, or on
the block.
A great deal
Some
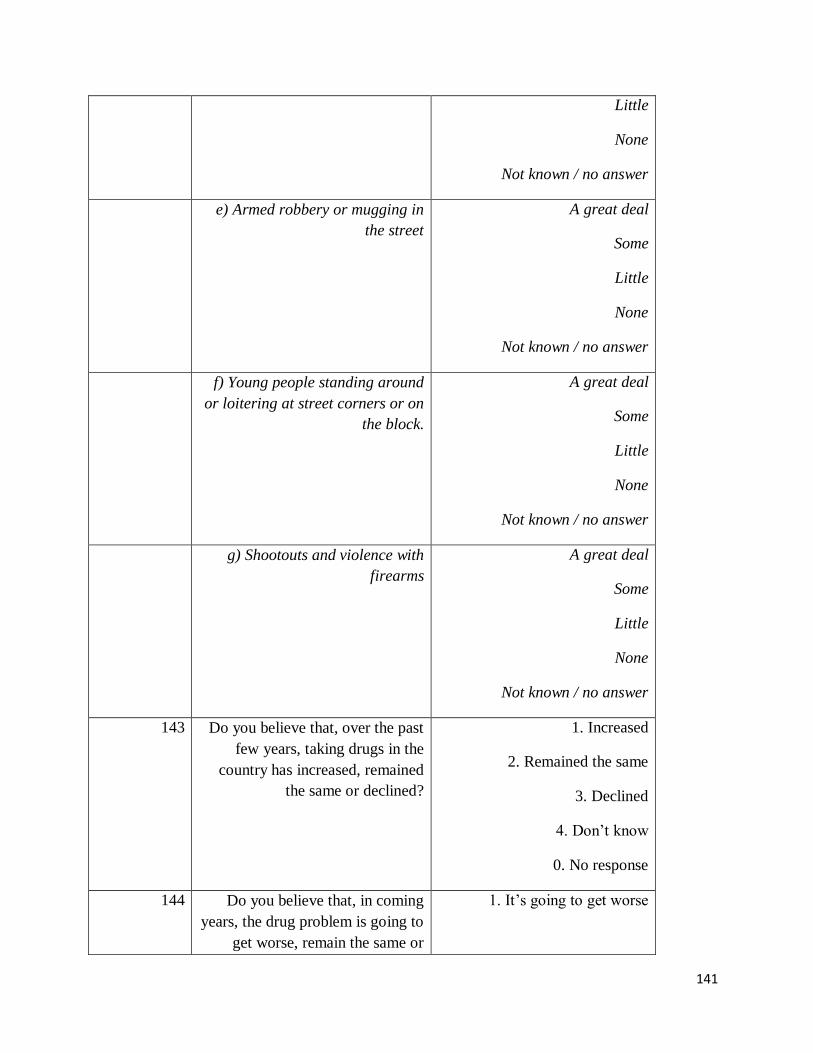
141
Little
None
Not known / no answer
e) Armed robbery or mugging in
the street
A great deal
Some
Little
None
Not known / no answer
f) Young people standing around
or loitering at street corners or on
the block.
A great deal
Some
Little
None
Not known / no answer
g) Shootouts and violence with
firearms
A great deal
Some
Little
None
Not known / no answer
143 Do you believe that, over the past
few years, taking drugs in the
country has increased, remained
the same or declined?
1. Increased
2. Remained the same
3. Declined
4. Don’t know
0. No response
144 Do you believe that, in coming
years, the drug problem is going to
get worse, remain the same or
1. It’s going to get worse
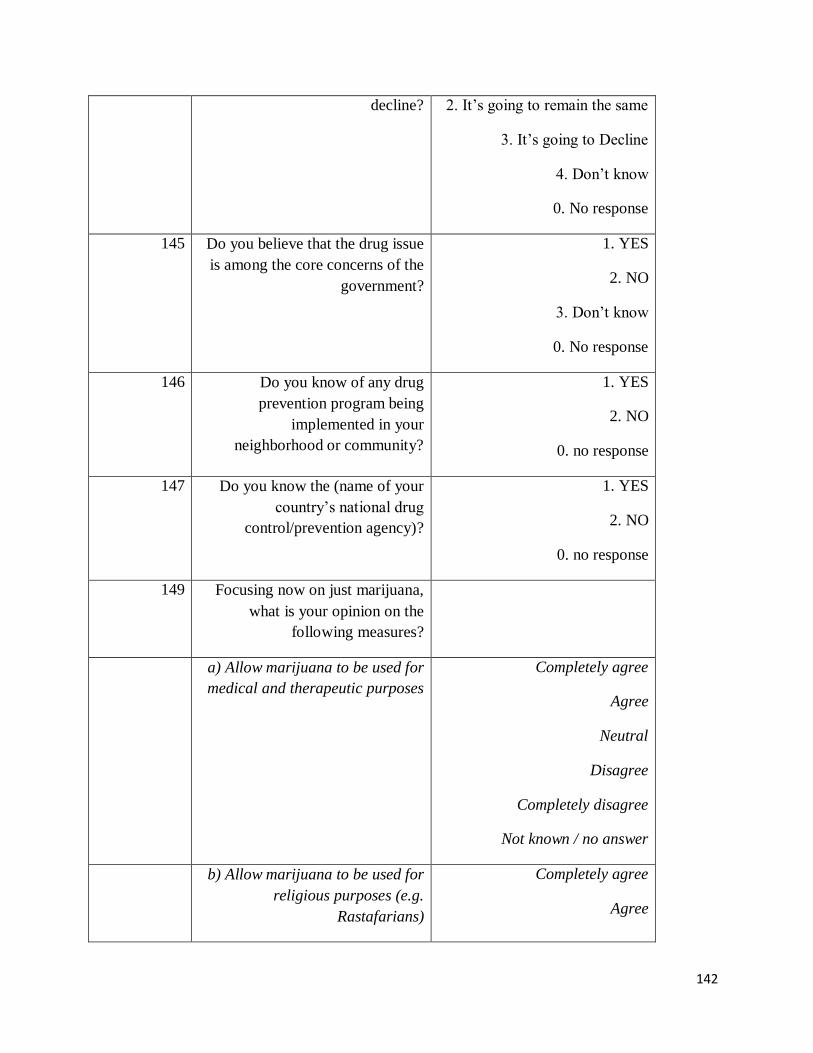
142
decline? 2. It’s going to remain the same
3. It’s going to Decline
4. Don’t know
0. No response
145 Do you believe that the drug issue
is among the core concerns of the
government?
1. YES
2. NO
3. Don’t know
0. No response
146 Do you know of any drug
prevention program being
implemented in your
neighborhood or community?
1. YES
2. NO
0. no response
147 Do you know the (name of your
country’s national drug
control/prevention agency)?
1. YES
2. NO
0. no response
149 Focusing now on just marijuana,
what is your opinion on the
following measures?
a) Allow marijuana to be used for
medical and therapeutic purposes
Completely agree
Agree
Neutral
Disagree
Completely disagree
Not known / no answer
b) Allow marijuana to be used for
religious purposes (e.g.
Rastafarians)
Completely agree
Agree
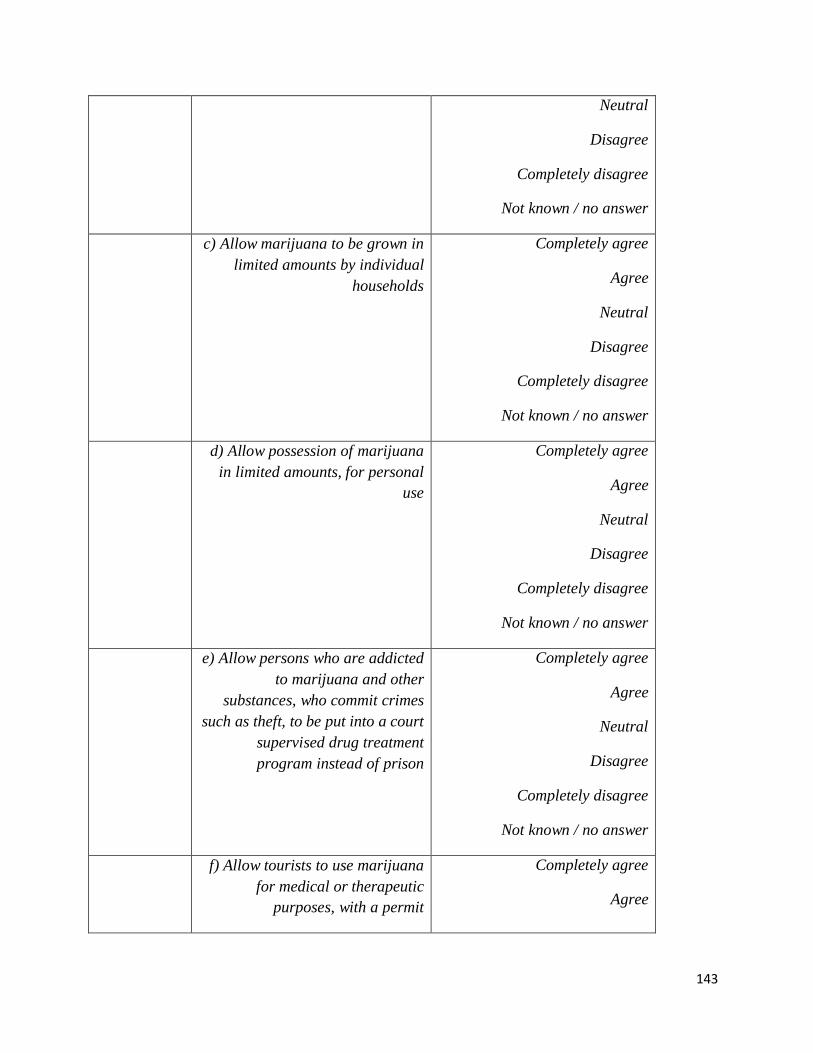
143
Neutral
Disagree
Completely disagree
Not known / no answer
c) Allow marijuana to be grown in
limited amounts by individual
households
Completely agree
Agree
Neutral
Disagree
Completely disagree
Not known / no answer
d) Allow possession of marijuana
in limited amounts, for personal
use
Completely agree
Agree
Neutral
Disagree
Completely disagree
Not known / no answer
e) Allow persons who are addicted
to marijuana and other
substances, who commit crimes
such as theft, to be put into a court
supervised drug treatment
program instead of prison
Completely agree
Agree
Neutral
Disagree
Completely disagree
Not known / no answer
f) Allow tourists to use marijuana
for medical or therapeutic
purposes, with a permit
Completely agree
Agree
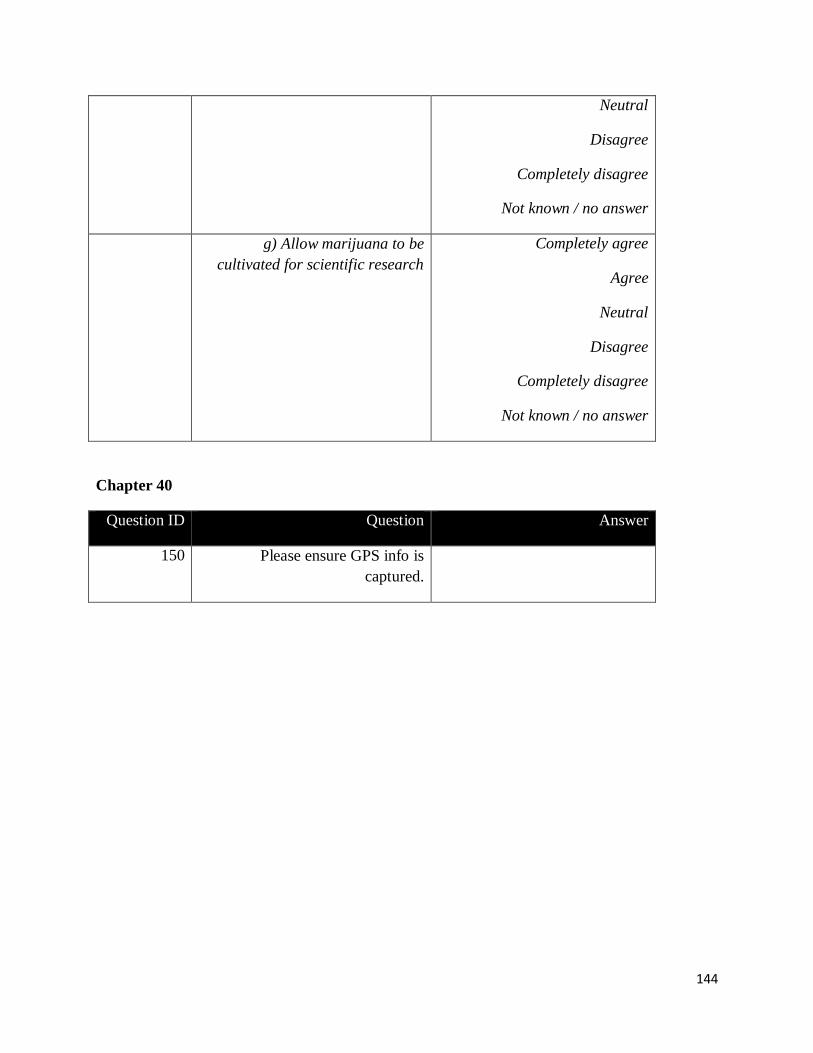
144
Neutral
Disagree
Completely disagree
Not known / no answer
g) Allow marijuana to be
cultivated for scientific research
Completely agree
Agree
Neutral
Disagree
Completely disagree
Not known / no answer
Chapter 40
Question ID Question Answer
150 Please ensure GPS info is
captured.
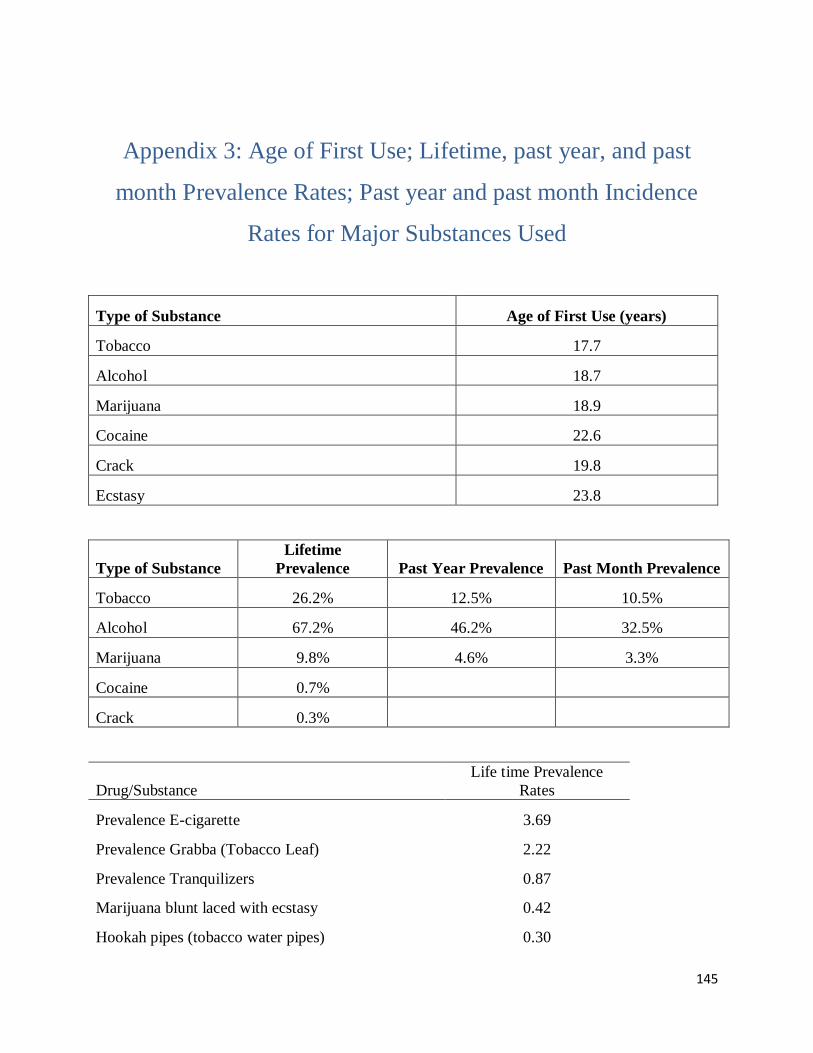
145
Appendix 3: Age of First Use; Lifetime, past year, and past
month Prevalence Rates; Past year and past month Incidence
Rates for Major Substances Used
Type of Substance Age of First Use (years)
Tobacco 17.7
Alcohol 18.7
Marijuana 18.9
Cocaine 22.6
Crack 19.8
Ecstasy 23.8
Type of Substance
Lifetime
Prevalence Past Year Prevalence Past Month Prevalence
Tobacco 26.2% 12.5% 10.5%
Alcohol 67.2% 46.2% 32.5%
Marijuana 9.8% 4.6% 3.3%
Cocaine 0.7%
Crack 0.3%
Drug/Substance
Life time Prevalence
Rates
Prevalence E-cigarette 3.69
Prevalence Grabba (Tobacco Leaf) 2.22
Prevalence Tranquilizers 0.87
Marijuana blunt laced with ecstasy 0.42
Hookah pipes (tobacco water pipes) 0.30
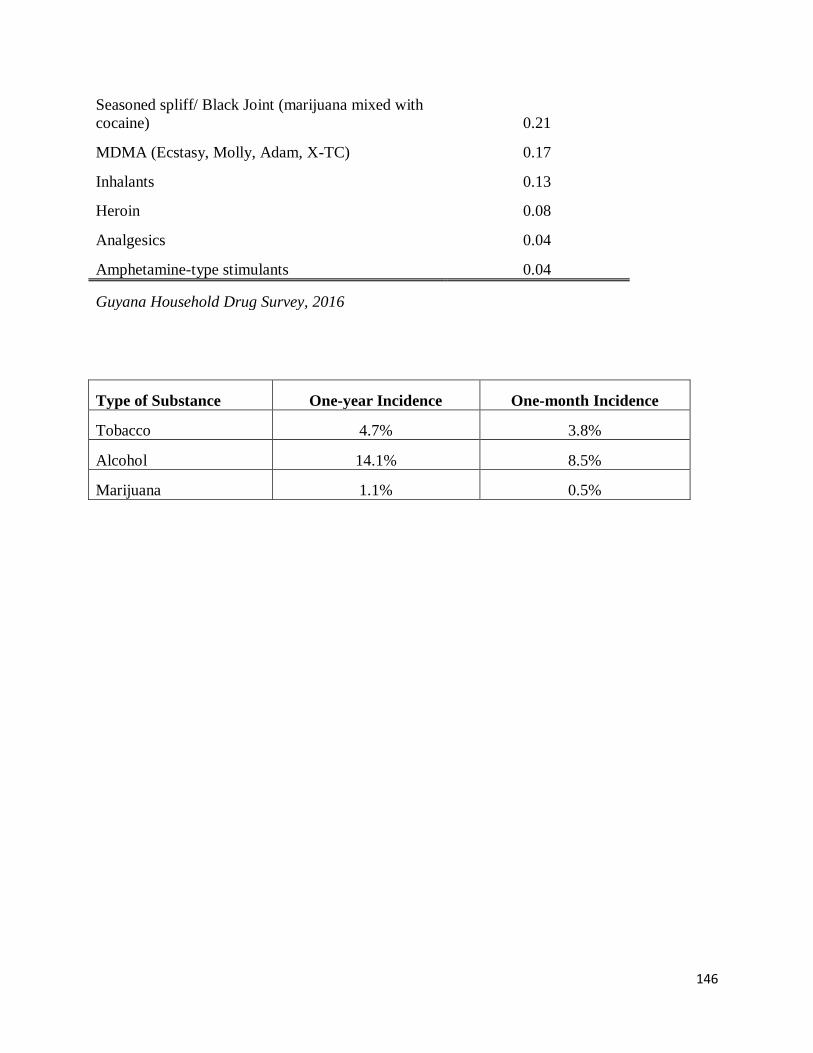
146
Seasoned spliff/ Black Joint (marijuana mixed with
cocaine) 0.21
MDMA (Ecstasy, Molly, Adam, X-TC) 0.17
Inhalants 0.13
Heroin 0.08
Analgesics 0.04
Amphetamine-type stimulants 0.04
Guyana Household Drug Survey, 2016
Type of Substance One-year Incidence One-month Incidence
Tobacco 4.7% 3.8%
Alcohol 14.1% 8.5%
Marijuana 1.1% 0.5%
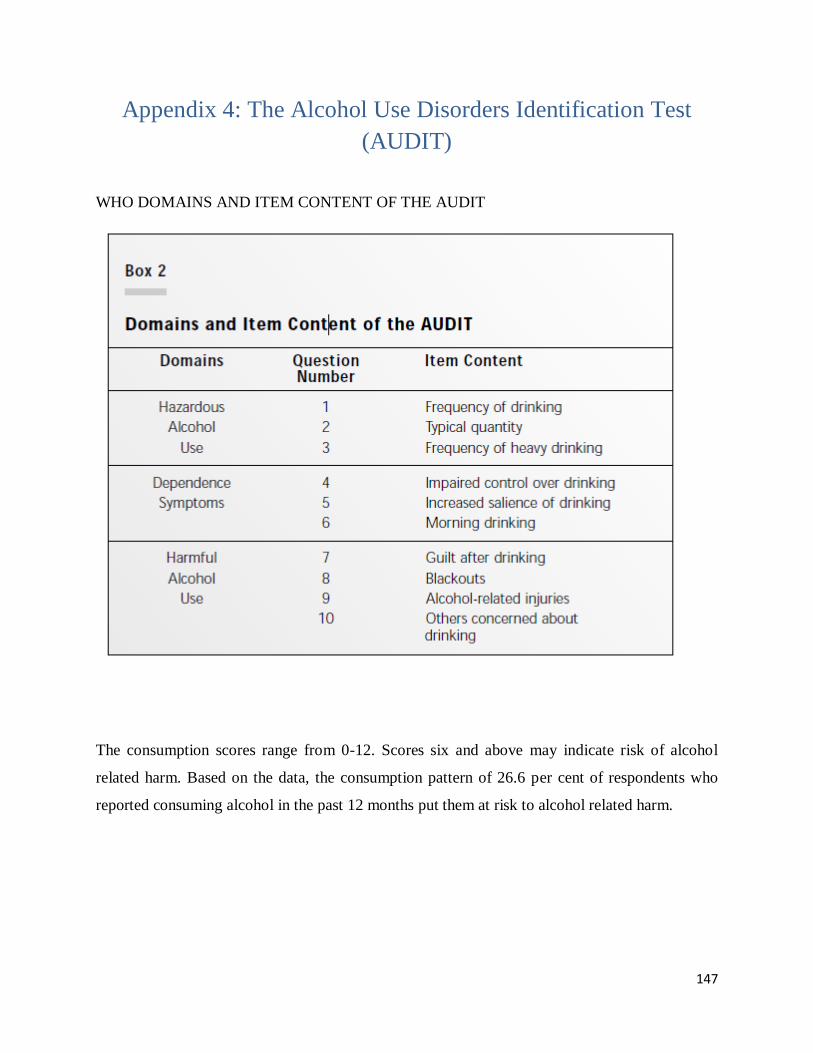
147
Appendix 4: The Alcohol Use Disorders Identification Test
(AUDIT)
WHO DOMAINS AND ITEM CONTENT OF THE AUDIT
The consumption scores range from 0-12. Scores six and above may indicate risk of alcohol
related harm. Based on the data, the consumption pattern of 26.6 per cent of respondents who
reported consuming alcohol in the past 12 months put them at risk to alcohol related harm.
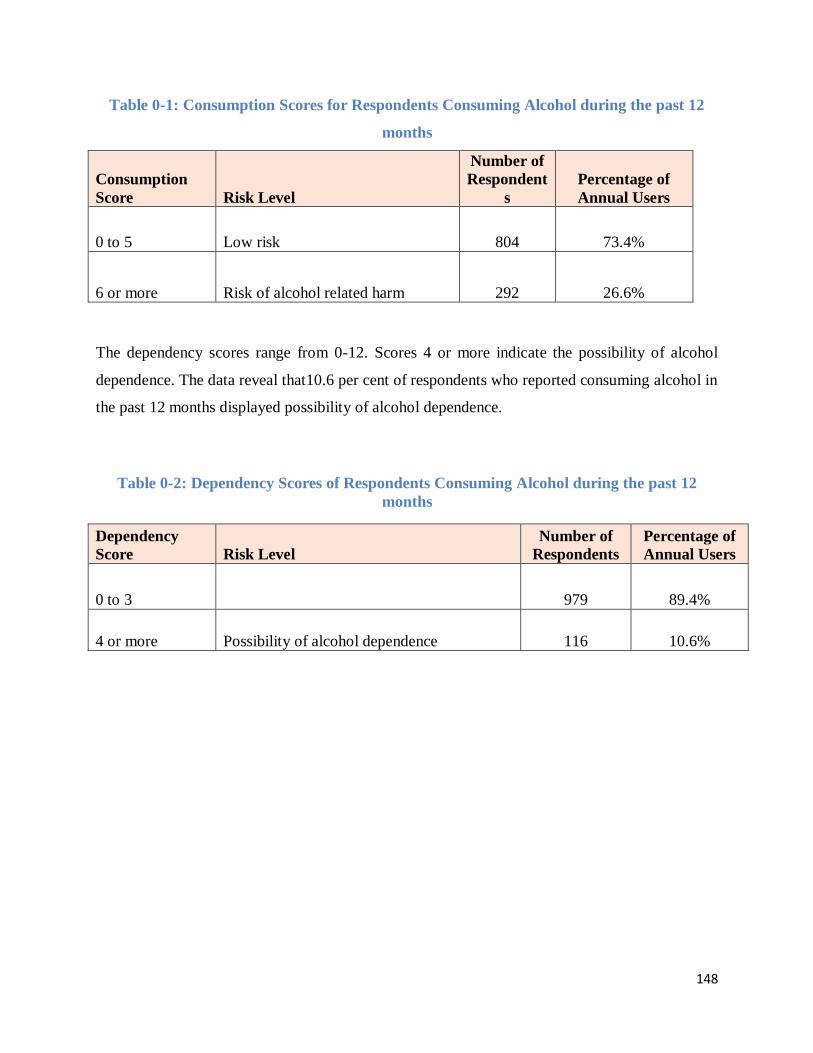
148
Table 0-1: Consumption Scores for Respondents Consuming Alcohol during the past 12
months
Consumption
Score Risk Level
Number of
Respondent
s
Percentage of
Annual Users
0 to 5 Low risk 804 73.4%
6 or more Risk of alcohol related harm 292 26.6%
The dependency scores range from 0-12. Scores 4 or more indicate the possibility of alcohol
dependence. The data reveal that10.6 per cent of respondents who reported consuming alcohol in
the past 12 months displayed possibility of alcohol dependence.
Table 0-2: Dependency Scores of Respondents Consuming Alcohol during the past 12
months
Dependency
Score Risk Level
Number of
Respondents
Percentage of
Annual Users
0 to 3 979 89.4%
4 or more Possibility of alcohol dependence 116 10.6%
149
References
Spilka, Stanisla, Eric Janssen, and Stephane Legleye. 2013. “Detection of Problem Cannabis
Use: the Cannabis Abuse Screening Test (CAST).” Drugs, addictions and key data, The
French Monitoring Centre for Drugs and Drug Addiction (OFDT).

150
The Inter Agency Task Force on Narcotics and Illicit Weapons
Ministry of Public Security
Georgetown
Network
Recommended