Halbjahresfinanzbericht 2013
Contents
1
Nine Months Report 2014
Contents
CONTENTS
1
TO OUR SHAREHOLDERS
Letter to Shareholders p. 4
Key Figures p. 6
HUGO BOSS on the Capital Market p. 7
2
CONSOLIDATED INTERIM
MANAGEMENT REPORT
Group Sales and Results of Operations p. 11
General Economic Situation p. 11
Sector Performance p. 12
Sales Performance p. 13
Earnings Development p. 17
Profit Development of the Business Segments p. 19
Europe p. 19
Americas p. 20
Asia /Pacific p. 21
Royalties p. 22
Net Assets and Financial Position p. 23
Net Assets p. 23
Financial Position p. 26
Capital Expenditure p. 27
Report on Risks and Opportunities p. 28
Subsequent Events and Outlook p. 29
Subsequent Events p. 29
Outlook p. 29
Summary on Earnings, Net Assets and Financial
Position p. 34
3
CONSOLIDATED INTERIM
FINANCIAL STATEMENTS
Consolidated Income Statement p. 36
Consolidated Statement of Comprehensive
Income p. 37
Consolidated Statement of Financial Position p. 38
Consolidated Statement of Changes in Equity p. 39
Consolidated Statement of Cash Flows p. 40
Condensed Notes to the Consolidated Interim
Financial Statements p. 41
4
FURTHER INFORMATION
Forward-Looking Statements p. 67
Financial Calendar p. 68
Contacts p. 68

Halbjahresfinanzbericht 2013
Contents
3
Nine Months Report 2014
Letter to Shareholders
4
LETTER TO SHAREHOLDERS
Dear Shareholders,
Ladies and Gentlemen,
HUGO BOSS remains on a solid growth trajectory. In fact, we were able to increase our rate of growth in the
third quarter. Accordingly, currency-adjusted Group sales rose by 8% and operating profit by 4% in the first nine
months.
Our womenswear business made an important contribution to this, growing at a double-digit rate during this
period. The Fall/Winter collection, which was developed by our new Artistic Director for BOSS Womenswear,
Jason Wu, for the first time and which has been available in our stores and from our retail partners since July,
has exceeded the high expectations which we have pinned to it. Now we are, of course, looking further into the
future: At the beginning of September we presented our Spring/Summer 2015 collection against a spectacular
backdrop on the 54th floor of the World Trade Center in New York. With its elegant feminine looks, the
collection met with a favorable response on the part of the trade press and our wholesale customers, strength-
ening us in our expectation of being able to achieve above-average growth over the next few years.
We expanded again in all regions in the first nine months. In Europe, the strong performance achieved in the
first half of the year continued. Sales have climbed by 9% in this region, also thanks to our wholesale partners'
demand, which has been strong as expected over the last few months. Consequently, Europe remains the
Group's fastest-growing region. In the Americas, we were able to gain further momentum after a fairly muted
start to the year. As a result, sales were up a currency-adjusted 6% at the end of the first nine months. Finally,
we have been noting an encouraging acceleration of growth in Asia over the past few months. However, time-
based effects in the delivery of our collections played a key role here and cannot conceal the still challenging
macroeconomic environment and sector-specific conditions.
Our own retail business remains the driving force behind our sales growth. In the first nine months, sales in this
distribution channel rose by 16% in currency-adjusted terms. Whereas retail comp store sales remain very solid
compared to the market as a whole, the contribution to sales made by new stores declined as expected. This
particularly reflects the gradual fading of sales effects from the take-over of shop-in-shops last year. At the same
time, however, the substantially slower momentum of the industry in Europe and uncertainty in Asia have left
traces on the performance of our own retail business in the last few weeks. Customer footfall in our stores has
weakened in both regions, clearly reflecting more muted consumer confidence particularly amid geopolitical
tensions and macroeconomic concerns.
Nine Months Report 2014
Letter to Shareholders
5
Looking forward over the next few months, we therefore expect market conditions to remain challenging,
particularly in this part of the business, and that will in all probability exert pressure on our sales and earnings.
Against this backdrop, we are specifying our full-year guidance and are expecting an increase of 6% to 8% in
currency-adjusted sales, with operating profit set to grow by a rate of 5% to 7%.
Sincerely yours,
Claus-Dietrich Lahrs
CEO and Chairman of the Managing Board
Nine Months Report 2014
Key Figures
6
KEY FIGURES
Jan. ‒ Sep.
2014
Jan. ‒ Sep.
2013
Change
in %
3rd Quarter
2014
3rd Quarter
2013
Change
in %
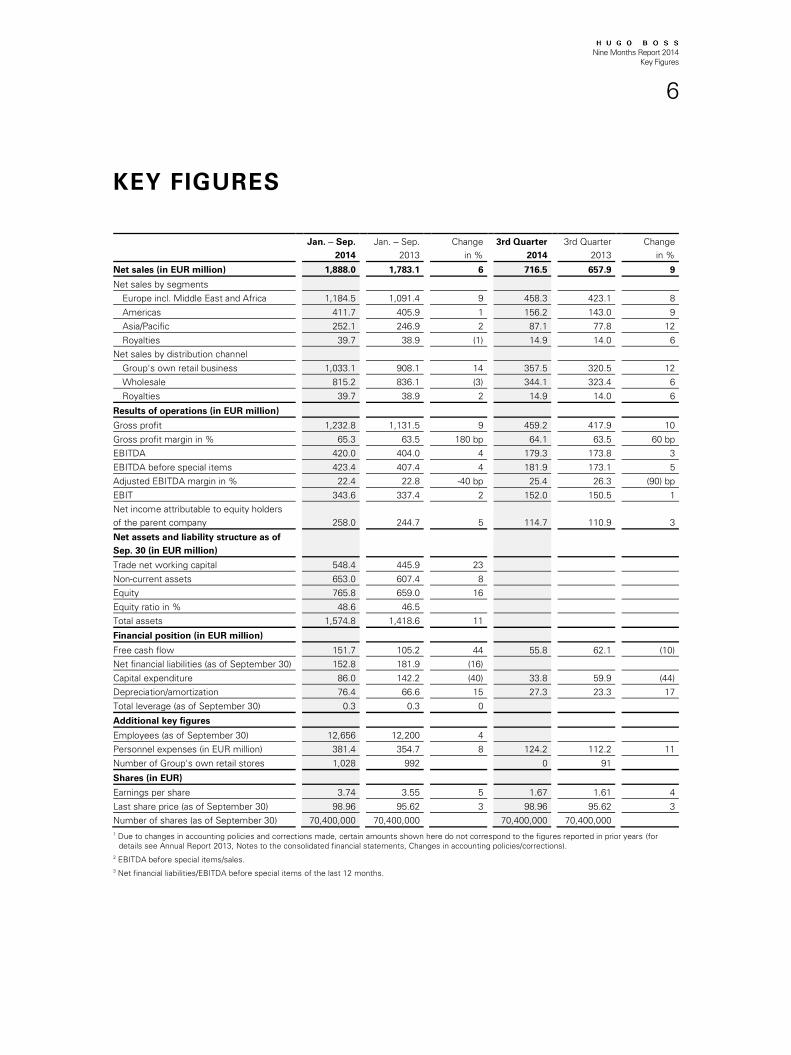
Net sales (in EUR million)
1,888.0
1,783.1
6
716.5
657.9
9
Net sales by segments
Europe incl. Middle East and Africa
1,184.5
1,091.4
9
458.3
423.1
8
Americas
411.7
405.9
1
156.2
143.0
9
Asia/Pacific
252.1
246.9
2
87.1
77.8
12
Royalties
39.7
38.9
(1)
14.9
14.0
6
Net sales by distribution channel
Group's own retail business
1,033.1
908.1
14
357.5
320.5
12
Wholesale
815.2
836.1
(3)
344.1
323.4
6
Royalties
39.7
38.9
2
14.9
14.0
6
Results of operations (in EUR million)
Gross profit
1,232.8
1,131.5
9
459.2
417.9
10
Gross profit margin in %
65.3
63.5
180 bp
64.1
63.5
60 bp
EBITDA
420.0
404.0
4
179.3
173.8
3
EBITDA before special items
423.4
407.4
4
181.9
173.1
5
Adjusted EBITDA margin in %
22.4
22.8
-40 bp
25.4
26.3
(90) bp
EBIT
343.6
337.4
2
152.0
150.5
1
Net income attributable to equity holders
of the parent company
258.0
244.7
5
114.7
110.9
3
Net assets and liability structure as of
Sep. 30 (in EUR million)
Trade net working capital
548.4
445.9
23
Non-current assets
653.0
607.4
8
Equity
765.8
659.0
16
Equity ratio in %
48.6
46.5
Total assets
1,574.8
1,418.6
11
Financial position (in EUR million)
Free cash flow
151.7
105.2
44
55.8
62.1
(10)
Net financial liabilities (as of September 30)
152.8
181.9
(16)
Capital expenditure
86.0
142.2
(40)
33.8
59.9
(44)
Depreciation/amortization
76.4
66.6
15
27.3
23.3
17
Total leverage (as of September 30)
0.3
0.3
0
Additional key figures
Employees (as of September 30)
12,656
12,200
4
Personnel expenses (in EUR million)
381.4
354.7
8
124.2
112.2
11
Number of Group's own retail stores
1,028
992
0
91
Shares (in EUR)
Earnings per share
3.74
3.55
5
1.67
1.61
4
Last share price (as of September 30)
98.96
95.62
3
98.96
95.62
3
Number of shares (as of September 30)
70,400,000
70,400,000
70,400,000
70,400,000
1 Due to changes in accounting policies and corrections made, certain amounts shown here do not correspond to the figures reported in prior years (for
details see Annual Report 2013, Notes to the consolidated financial statements, Changes in accounting policies/corrections).
2 EBITDA before special items/sales.
3 Net financial liabilities/EBITDA before special items of the last 12 months.
Nine Months Report 2014
HUGO BOSS on the Capital Market
7
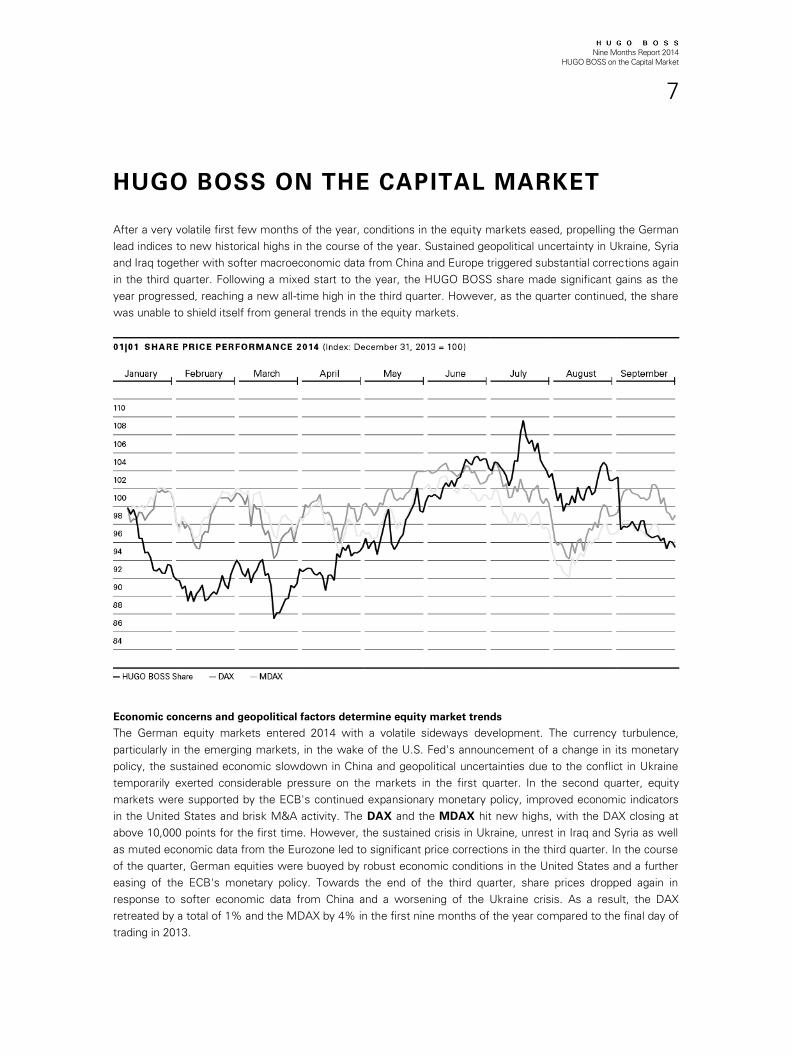
HUGO BOSS ON THE CAPITAL MARKET
After a very volatile first few months of the year, conditions in the equity markets eased, propelling the German
lead indices to new historical highs in the course of the year. Sustained geopolitical uncertainty in Ukraine, Syria
and Iraq together with softer macroeconomic data from China and Europe triggered substantial corrections again
in the third quarter. Following a mixed start to the year, the HUGO BOSS share made significant gains as the
year progressed, reaching a new all-time high in the third quarter. However, as the quarter continued, the share
was unable to shield itself from general trends in the equity markets.
Economic concerns and geopolitical factors determine equity market trends
The German equity markets entered 2014 with a volatile sideways development. The currency turbulence,
particularly in the emerging markets, in the wake of the U.S. Fed's announcement of a change in its monetary
policy, the sustained economic slowdown in China and geopolitical uncertainties due to the conflict in Ukraine
temporarily exerted considerable pressure on the markets in the first quarter. In the second quarter, equity
markets were supported by the ECB's continued expansionary monetary policy, improved economic indicators
in the United States and brisk M&A activity. The DAX and the MDAX hit new highs, with the DAX closing at
above 10,000 points for the first time. However, the sustained crisis in Ukraine, unrest in Iraq and Syria as well
as muted economic data from the Eurozone led to significant price corrections in the third quarter. In the course
of the quarter, German equities were buoyed by robust economic conditions in the United States and a further
easing of the ECB's monetary policy. Towards the end of the third quarter, share prices dropped again in
response to softer economic data from China and a worsening of the Ukraine crisis. As a result, the DAX
retreated by a total of 1% and the MDAX by 4% in the first nine months of the year compared to the final day of
trading in 2013.
Nine Months Report 2014
HUGO BOSS on the Capital Market
8
Muted market conditions weigh on HUGO BOSS share in the third quarter
At the beginning of the year, the HUGO BOSS share came under pressure as the earnings published in the
premium and luxury goods industry were perceived as disappointing and because of the macroeconomic
uncertainties in many emerging markets that are of above-average importance for the sector. However,
following the publication of the Group's results for 2013 and the positive outlook for the current year, the HUGO
BOSS share recovered significantly from mid-March onwards, receiving further support after the figures for the
first quarter of 2014 were published at the beginning of May. After the distribution of the dividend for 2013 in
mid-May triggered only a temporary correction in its price, the share climbed to a new record high of
EUR 113.55 in mid-July. Disappointing earnings in the sector in tandem with a significant deterioration in
sentiment in the equity markets then triggered a price correction, which the share was able to partially reverse
by the end of August however. Thereafter, the placement of just under 8 million shares by majority shareholder
Permira at the beginning of September and the more cautious outlook for the premium and luxury goods
industry triggered further price corrections. At the end of the reporting period, the HUGO BOSS share was
trading at EUR 98.96, 4% down on its 2013 closing price of EUR 103.50.
The MSCI World Textiles, Apparel & Luxury Goods Index, which tracks the share price performance of
companies operating in these sectors, fell by 9% in the first nine months. Accordingly, the HUGO BOSS share
outperformed the sector as a whole in the period from January through September, keeping pace with and
slightly underperforming the German lead indices MDAX and DAX, respectively.
HUGO BOSS with a higher weighting in the MDAX
The MDAX-listed HUGO BOSS share held 7th place in the Deutsche Börse ranking at the end of September
2014 on the basis of market capitalization adjusted for free float (September 30, 2013: 11th place). It ranked 8th
by trading volume (September 30, 2013: 5th place). Consequently, HUGO BOSS had a weighting of 3.3% in the
MDAX at the end of September (September 30, 2013: 2.9%). On average, 134,334 shares per day were traded
on XETRA in the first nine months of 2014 (2013: 151,088).
Increase in free float of HUGO BOSS shares
After placing some 4 million shares on May 27, 2014, majority shareholder Permira sold a further package of just
under 8 million shares on September 2, 2014. As a result, HUGO BOSS AG had the following shareholder
structure as of September 30, 2014: 39% of the shares are held by Permira Funds via Red & Black Lux S.à r.l.
(December 31, 2013: 56%) and 2% of the capital is held by HUGO BOSS AG as own shares (December 31,
2013: 2%). The remaining 59% of the shares are free float (December 31, 2013: 42%).
Voting right notifications in accordance with section 21 WpHG
In accordance with section 21 WpHG ["Gesetz über den Wertpapierhandel": German Securities Trading Act],
shareholders are required to report the level of their shareholdings if they exceed or fall below certain thresh-
olds. The reporting thresholds are 3%, 5%, 10%, 15%, 20%, 25%, 30%, 50% and 75%. In the period from
January 1 through September 30, 2014, the Company received several such notifications, the wording of which
has been published under "Financial Releases" in the Investor Relations section of the Group's website at
group.hugoboss.com.
Nine Months Report 2014
HUGO BOSS on the Capital Market
9
Reportable securities transactions in accordance with section 15 a WpHG
One notification of reportable transactions in the Company's shares in accordance with section 15 a WpHG was
given to the Company by the Managing Board and Supervisory Board in the period from January 1 to September
30, 2014. In sum, members of the Managing Board and Supervisory Board hold less than 1% of the shares
issued by HUGO BOSS AG. Reportable securities transactions are published under "Financial Releases" in the
Investor Relations section of the Group's website at group.hugoboss.com.

Halbjahresfinanzbericht 2013
HUGO BOSS on the Capital Market
10
Nine Months Report 2014
Group Sales and Results of Operations
11
GROUP SALES AND RESULTS OF
OPERATIONS
GENERAL ECONOMIC SITUATION
Mixed development of the global economy
Contrary to the original expectation of a significant recovery, conditions in the global economy have proved
disappointing in the year to date. Although growth generally accelerated slightly over the previous year, it varied
from region to region and was dragged down by setbacks. The emerging markets tended to be weaker than the
industrialized nations.
Slight growth in the European economy
As a whole, the European economy expanded slightly in the first nine months of the year, with growth
weakening again after a strong first quarter. This was primarily due to muted capital expenditure and weak
exports. In addition, geopolitical uncertainty had a further dampening effect. On the other hand, consumer
spending supported the economy. Monetary policy was additionally eased to boost lending as a means of
spurring the economy. The German economy outperformed the region as a whole. However, there have been
mounting signs over the past few weeks of a slowdown in economic activity in the third quarter. Whereas the
French economy remained flat, the British economy has strengthened appreciably in the year to date.
U.S. economy expanding after a sluggish start to the year
After the slump in the first quarter, the U.S. economy regained momentum as the year progressed. Growth
was driven by robust investment, particularly from foreign countries, a recovery in consumer spending and
increased employment. The normalization of monetary conditions initiated by the Fed has so far not had any
immediately adverse effects. The economy in Latin America was unexpectedly weak in the first nine months
of the year, with a drop in foreign direct investment together with political uncertainty exerting a drag. Consumer
spending also slowed significantly.
Regionally uneven development in the Asian economy
The economy in Asia has been painting a mixed picture in the year to date. Whereas growth remained consist-
ently strong in many of the smaller countries, it saw a slowdown in China. As in other countries, it felt the
effects of weaker exports in the wake of softer global demand. In addition, muted growth in production and
trade as well as the consolidation of the real estate market took their toll. By contrast, the Japanese economy
remained robust despite April's value added tax hike, with growth underpinned by the Bank of Japan's highly
accommodative monetary policy, rising wages and salaries as well as brighter consumer and business confi-
dence. In Australia, economic expansion was spurred by strengthening consumption and export activities.
Nine Months Report 2014
Group Sales and Results of Operations
12
SECTOR PERFORMANCE
Moderate sector growth in the first nine months
The premium and luxury goods sector has faced further challenging macroeconomic conditions and slow
consumer activity in the year to date, particularly in the emerging markets. Even so, it has been able to continue
on its growth trajectory due to the favorable performance of the retail channel in particular, with most of the
growth generated by the addition of new floor space. Unfavorable currency effects had an adverse effect on
many companies’ sales and earnings.
Sector growth in large parts of Europe was influenced by mixed macroeconomic conditions. Retail customer
footfall was down in many cases. In Eastern Europe, the sector felt the effects of the protracted Ukrainian
conflict, which were also reflected in a reduced number of Russian tourists in other parts of the region. Despite
this, tourist demand continued to spur market growth particularly in the metropolitan regions of Western and
Southern Europe. After a muted start to the year, the premium and luxury segment of the clothing industry in
the Americas picked up as the year progressed, underpinned by improved economic conditions, rising consum-
er confidence and strong tourist demand. As a result, promotional activity gradually diminished. In Asia, the
sector has developed unevenly in the different markets in the year to date. In China, slower macroeconomic
growth exerted pressure, while more muted consumer confidence in the wake of the government's anti-
corruption legislation also left traces on the sector. Likewise, growth in Hong Kong slowed significantly, in
particular as a result of mounting political tension. On the other hand, the sector expanded in Japan thanks to
solid demand on the part of domestic consumers and the growing number of tourists.
Nine Months Report 2014
Group Sales and Results of Operations
13
SALES PERFORMANCE
8% increase in HUGO BOSS sales on a currency-adjusted basis
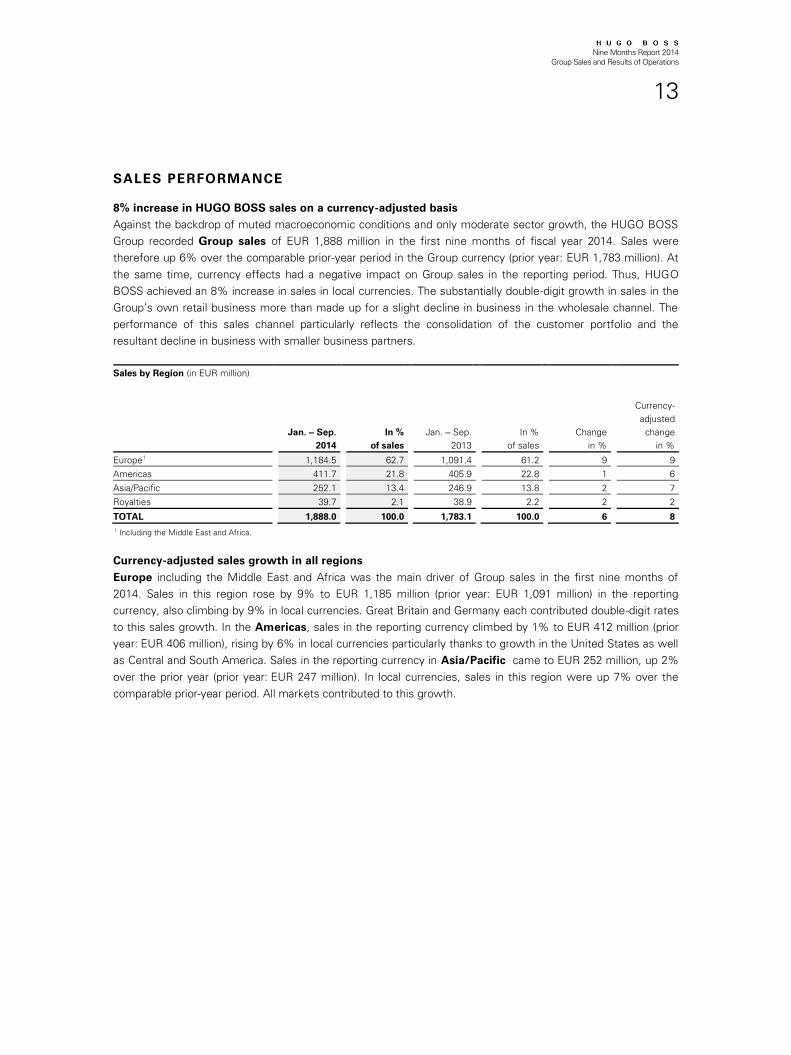
Against the backdrop of muted macroeconomic conditions and only moderate sector growth, the HUGO BOSS
Group recorded Group sales of EUR 1,888 million in the first nine months of fiscal year 2014. Sales were
therefore up 6% over the comparable prior-year period in the Group currency (prior year: EUR 1,783 million). At
the same time, currency effects had a negative impact on Group sales in the reporting period. Thus, HUGO
BOSS achieved an 8% increase in sales in local currencies. The substantially double-digit growth in sales in the
Group’s own retail business more than made up for a slight decline in business in the wholesale channel. The
performance of this sales channel particularly reflects the consolidation of the customer portfolio and the
resultant decline in business with smaller business partners.
Sales by Region (in EUR million)
Jan. ‒ Sep.
2014
In %
of sales
Jan. ‒ Sep.
2013
In %
of sales
Change
in %
Currency-
adjusted
change
in %
Europe
1
1,184.5
62.7
1,091.4
61.2
9
9
Americas
411.7
21.8
405.9
22.8
1
6
Asia/Pacific
252.1
13.4
246.9
13.8
2
7
Royalties
39.7
2.1
38.9
2.2
2
2
TOTAL
1,888.0
100.0
1,783.1
100.0
6
8
1 Including the Middle East and Africa.
Currency-adjusted sales growth in all regions
Europe including the Middle East and Africa was the main driver of Group sales in the first nine months of
2014. Sales in this region rose by 9% to EUR 1,185 million (prior year: EUR 1,091 million) in the reporting
currency, also climbing by 9% in local currencies. Great Britain and Germany each contributed double-digit rates
to this sales growth. In the Americas, sales in the reporting currency climbed by 1% to EUR 412 million (prior
year: EUR 406 million), rising by 6% in local currencies particularly thanks to growth in the United States as well
as Central and South America. Sales in the reporting currency in Asia/Pacific came to EUR 252 million, up 2%
over the prior year (prior year: EUR 247 million). In local currencies, sales in this region were up 7% over the
comparable prior-year period. All markets contributed to this growth.
Nine Months Report 2014
Group Sales and Results of Operations
14
SALES BY DISTRIBUTION CHANNEL in EUR million)
Jan. ‒ Sep.
2014
In % of
sales
Jan. ‒ Sep.
2013
In % of
sales
Change
in %
Currency-
adjusted
change
in %
Group's own retail business
1,033.1
54.7
908.1
50.9
14
16
Directly operated stores
686.5
36.4
597.9
33.5
15
17
Outlet
299.0
15.8
268.1
15.0
12
13
Online
47.6
2.5
42.0
2.4
13
14
Wholesale
815.2
43.2
836.1
46.9
(3)
(1)
Royalties
39.7
2.1
38.9
2.2
2
2
TOTAL
1,888.0
100.0
1,783.1
100.0
6
8
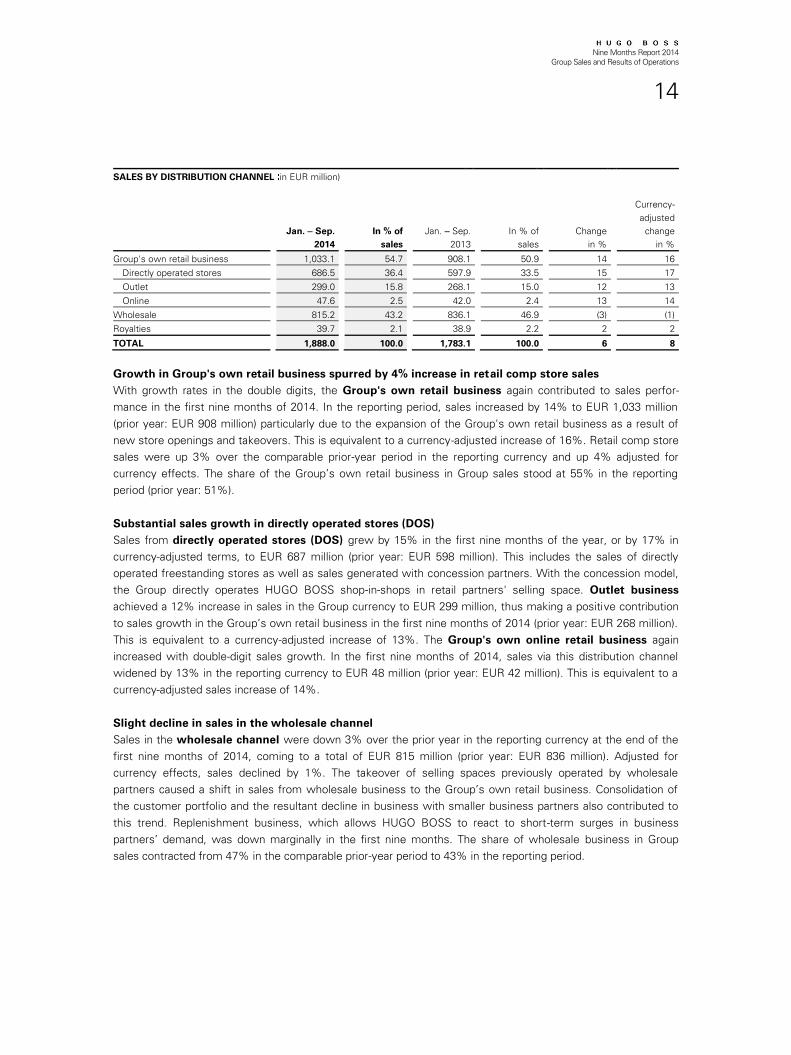
Growth in Group's own retail business spurred by 4% increase in retail comp store sales
With growth rates in the double digits, the Group's own retail business again contributed to sales perfor-
mance in the first nine months of 2014. In the reporting period, sales increased by 14% to EUR 1,033 million
(prior year: EUR 908 million) particularly due to the expansion of the Group's own retail business as a result of
new store openings and takeovers. This is equivalent to a currency-adjusted increase of 16%. Retail comp store
sales were up 3% over the comparable prior-year period in the reporting currency and up 4% adjusted for
currency effects. The share of the Group’s own retail business in Group sales stood at 55% in the reporting
period (prior year: 51%).
Substantial sales growth in directly operated stores (DOS)
Sales from directly operated stores (DOS) grew by 15% in the first nine months of the year, or by 17% in
currency-adjusted terms, to EUR 687 million (prior year: EUR 598 million). This includes the sales of directly
operated freestanding stores as well as sales generated with concession partners. With the concession model,
the Group directly operates HUGO BOSS shop-in-shops in retail partners' selling space. Outlet business
achieved a 12% increase in sales in the Group currency to EUR 299 million, thus making a positive contribution
to sales growth in the Group’s own retail business in the first nine months of 2014 (prior year: EUR 268 million).
This is equivalent to a currency-adjusted increase of 13%. The Group's own online retail business again
increased with double-digit sales growth. In the first nine months of 2014, sales via this distribution channel
widened by 13% in the reporting currency to EUR 48 million (prior year: EUR 42 million). This is equivalent to a
currency-adjusted sales increase of 14%.
Slight decline in sales in the wholesale channel
Sales in the wholesale channel were down 3% over the prior year in the reporting currency at the end of the
first nine months of 2014, coming to a total of EUR 815 million (prior year: EUR 836 million). Adjusted for
currency effects, sales declined by 1%. The takeover of selling spaces previously operated by wholesale
partners caused a shift in sales from wholesale business to the Group’s own retail business. Consolidation of
the customer portfolio and the resultant decline in business with smaller business partners also contributed to
this trend. Replenishment business, which allows HUGO BOSS to react to short-term surges in business
partners’ demand, was down marginally in the first nine months. The share of wholesale business in Group
sales contracted from 47% in the comparable prior-year period to 43% in the reporting period.
Nine Months Report 2014
Group Sales and Results of Operations
15
Increase in royalties sales
Royalties sales increased by 2% to EUR 40 million in the nine-month period (prior year: EUR 39 million) and
were also up 2% after currency adjustment. The products manufactured by partners include fragrances,
eyewear and watches. Royalties for watches and eyewear in particular were higher and broadly held steady over
the prior-year period in the case of fragrances. The proportion of royalties sales in Group sales remained
unchanged at 2%.
9% increase in sales of BOSS core brand after currency adjustment
In the first nine months of fiscal year 2014, the BOSS core brand reported growth of 7% compared to the prior-
year period, achieving sales of EUR 1,350 million (prior year: EUR 1,264 million). This translates into a 9%
increase after currency adjustment. Sales of the BOSS Green brand climbed by 14% in the same period to EUR
159 million (prior year: EUR 139 million) and by 15% in local currencies. At EUR 198 million, sales of the BOSS
Orange brand were down 7% from the comparable prior-year period (prior year: EUR 214 million) and down 6%
in currency-adjusted terms, whereas the HUGO brand generated sales of EUR 181 million, an increase of 9%
over the comparable prior-year period (prior year: EUR 166 million). HUGO achieved growth of 10% after
currency adjustment.
Double-digit growth in womenswear sales
In the reporting period, menswear sales were up 5% over the comparable prior-year period, coming to a total
of EUR 1,672 million (prior year: EUR 1,590 million). Sales growth of 7% was reported after currency adjust-
ment. The proportion of menswear in total sales is unchanged at 89%. Womenswear sales grew at a dispro-
portionately fast rate of 12% in the reporting currency and 14% in local currencies, coming to EUR 216 million
(prior year: EUR 193 million). This performance was aided by intensified brand communication activities,
resulting in improved brand awareness levels. Womenswear continued to contribute 11% to total sales.
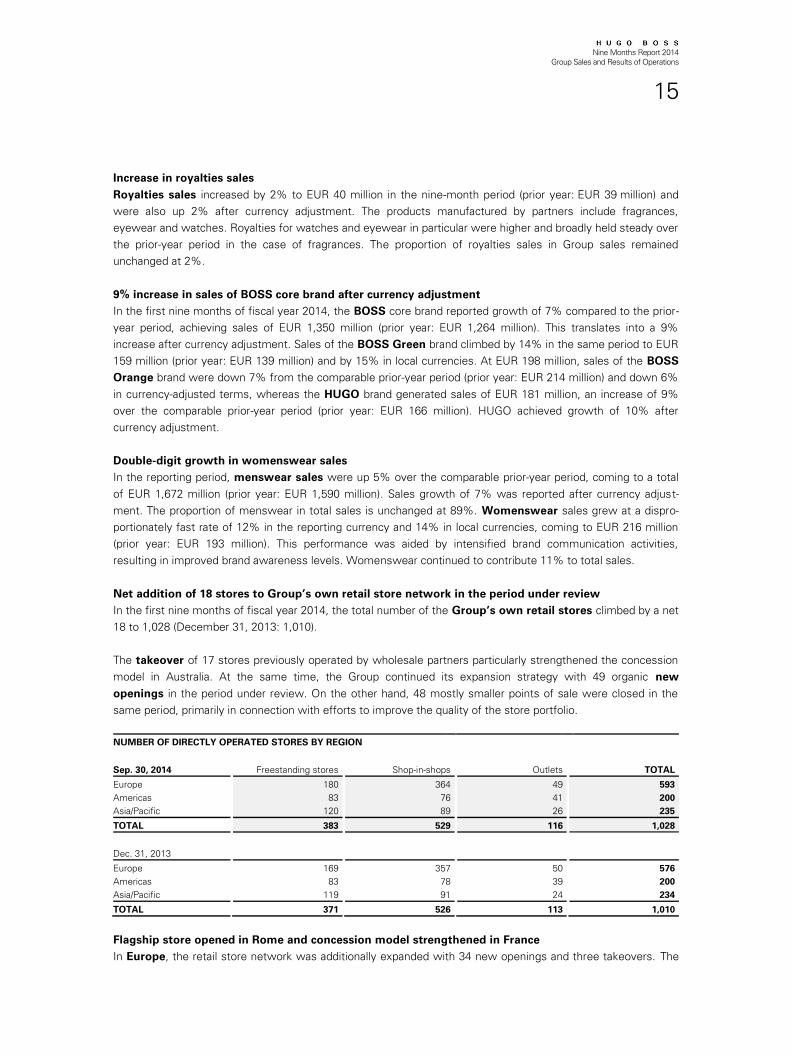
Net addition of 18 stores to Group’s own retail store network in the period under review
In the first nine months of fiscal year 2014, the total number of the Group’s own retail stores climbed by a net
18 to 1,028 (December 31, 2013: 1,010).
The takeover of 17 stores previously operated by wholesale partners particularly strengthened the concession
model in Australia. At the same time, the Group continued its expansion strategy with 49 organic new
openings in the period under review. On the other hand, 48 mostly smaller points of sale were closed in the
same period, primarily in connection with efforts to improve the quality of the store portfolio.
NUMBER OF DIRECTLY OPERATED STORES BY REGION
Sep. 30, 2014
Freestanding stores
Shop-in-shops
Outlets
TOTAL
Europe
180
364
49
593
Americas
83
76
41
200
Asia/Pacific
120
89
26
235
TOTAL
383
529
116
1,028
Dec. 31, 2013
Europe
169
357
50
576
Americas
83
78
39
200
Asia/Pacific
119
91
24
234
TOTAL
371
526
113
1,010
Flagship store opened in Rome and concession model strengthened in France
In Europe, the retail store network was additionally expanded with 34 new openings and three takeovers. The
Nine Months Report 2014
Group Sales and Results of Operations
16
opening of a flagship store in Rome further strengthened brand presence in Italy. The Group also expanded its
retail store network in France in particular. Taking into account the closure of 20 mostly smaller stores, there
was a net increase of 17 to a total of 593 own retail stores in Europe (December 31, 2013: 576).
Growing retail store network in Canada and Mexico
In the Americas, two retail stores were opened in each Canada and Mexico respectively and one in Washington
D.C., United States, in the reporting period. Including five closures, this results in an unchanged number of 200
own retail stores in this region (December 31, 2013: 200).
Market presence in Asia/Pacific strengthened by takeovers in Australia
As part of the Group's expansion in Asia/Pacific, a flagship store was opened on Canton Road in Hong Kong
alongside a further nine new retail stores in the first nine months of 2014. 14 stores were taken over in Australia
and Taiwan. Including the closure of 23 mostly smaller stores, there was a net increase of one to a total of 235
own retail stores in this region (December 31, 2013: 234).
Nine Months Report 2014
Group Sales and Results of Operations
17
EARNINGS DEVELOPMENT
INCOME STATEMENT(in EUR million)
Jan. ‒ Sep.
2014
In % of
sales
Jan. ‒ Sep.
2013
1
In % of
sales
Change
in %
Sales
1,888.0
100.0
1,783.1
100.0
6
Cost of sales
(655.2)
(34.7)
(651.6)
(36.5)
(1)
Gross profit
1,232.8
65.3
1,131.5
63.5
9
Selling and distribution expenses
(705.9)
(37.4)
(627.1)
(35.2)
(13)
Administration costs
(179.9)
(9.5)
(163.6)
(9.2)
(10)
Other operating income and expenses
(3.4)
(0.2)
(3.4)
(0.2)
(1)
Operating result (EBIT)
343.6
18.2
337.4
18.9
2
Net interest income/expenses
(3.3)
(0.2)
(7.5)
(0.4)
56
Other financial items
(3.7)
(0.2)
(8.2)
(0.5)
55
Financial result
(7.0)
(0.4)
(15.7)
(0.9)
55
Earnings before taxes
336.6
17.8
321.7
18.0
5
Income taxes
(77.4)
(4.1)
(74.0)
(4.2)
(5)
Net income
259.2
13.7
247.7
13.9
5
Attributable to:
Equity holders of the parent company
258.0
13.7
244.7
13.7
5
Non-controlling interests
1.2
0.0
3.0
0.2
(60)
Earnings per share (EUR)
2
3.74
3.55
5
EBITDA
420.0
22.2
404.0
22.7
4
Special items
(3.4)
(0.2)
(3.4)
(0.2)
(1)
EBITDA before special items
423.4
22.4
407.4
22.8
4
Income tax rate in %
23
23
1 Due to changes in accounting policies and corrections made, certain amounts shown here do not correspond to the figures reported in prior years (for
details see Annual Report 2013, Notes to the consolidated financial statements, Changes in accounting policies/corrections).
2 Basic and diluted earnings per share.
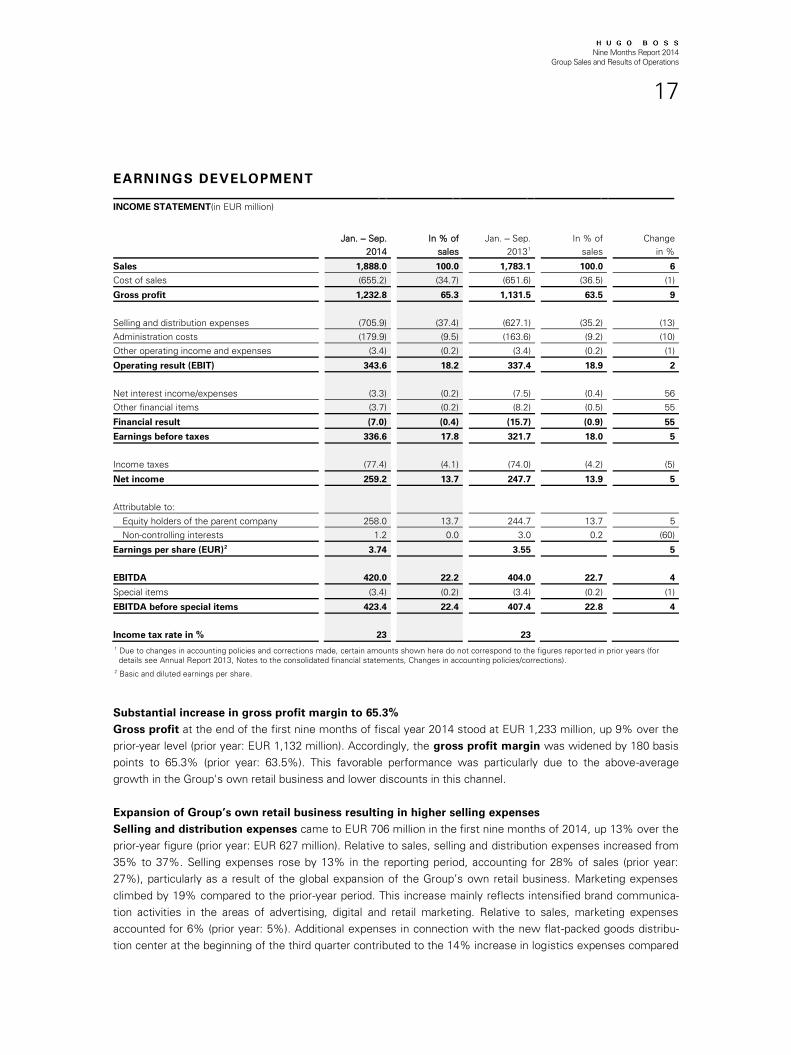
Substantial increase in gross profit margin to 65.3%
Gross profit at the end of the first nine months of fiscal year 2014 stood at EUR 1,233 million, up 9% over the
prior-year level (prior year: EUR 1,132 million). Accordingly, the gross profit margin was widened by 180 basis
points to 65.3% (prior year: 63.5%). This favorable performance was particularly due to the above-average
growth in the Group's own retail business and lower discounts in this channel.
Expansion of Group’s own retail business resulting in higher selling expenses
Selling and distribution expenses came to EUR 706 million in the first nine months of 2014, up 13% over the
prior-year figure (prior year: EUR 627 million). Relative to sales, selling and distribution expenses increased from
35% to 37%. Selling expenses rose by 13% in the reporting period, accounting for 28% of sales (prior year:
27%), particularly as a result of the global expansion of the Group’s own retail business. Marketing expenses
climbed by 19% compared to the prior-year period. This increase mainly reflects intensified brand communica-
tion activities in the areas of advertising, digital and retail marketing. Relative to sales, marketing expenses
accounted for 6% (prior year: 5%). Additional expenses in connection with the new flat-packed goods distribu-
tion center at the beginning of the third quarter contributed to the 14% increase in logistics expenses compared
Nine Months Report 2014
Group Sales and Results of Operations
18
with the prior year. At 3% of sales, they remained stable at the prior year's level. Bad debt allowances and bad
debts were again immaterial in the reporting period 2014 on account of the continued strict receivables
management and the declining proportion of wholesale business in consolidated sales.
Increase in administration expenses
Administration expenses came to EUR 180 million in the first nine months of 2014, up 10% over the prior-
year figure (prior year: EUR 164 million). Relative to sales, they remained at the prior-year level of 9%. General
administration expenses increased by 11% and, at 7%, were unchanged in relation to sales compared to the
prior-year period. Research and development costs incurred in the creation of fashion collections rose by 8%
over the prior-year period and at 2% also remained at the prior-year level relative to sales.
Special items with no material influence on earnings
The net expense of EUR 3 million (prior year: net expense of EUR 3 million) arising from other operating
expenses and income resulted from special items that were caused mainly by organizational changes in the
regions of Europe and the Americas. Income generated in the first quarter in connection with the sale of a
showroom in France was completely compensated.
4% increase in EBITDA before special items
The key internal performance indicator EBITDA before special items increased by 4% over the comparable
prior-year period to EUR 423 million (prior year: EUR 407 million). At 22.4%, the adjusted EBITDA margin was
down 40 basis points from the prior year (prior year: 22.8%). The increase in selling and marketing expenses
was not fully compensated by the increase in the gross profit margin. Amortization and depreciation came to
EUR 76 million, up 15% over the prior year (prior year: EUR 67 million), due to an increase in the ratio of
property, plant and equipment to total assets as a result of investments in the Group's own retail business. At
the end of the first nine months of fiscal year 2014, EBIT stood at EUR 344 million, up 2% over the prior year
(prior year: EUR 337 million).
Improvement in financial result
The financial result, measured as net expense after aggregating net interest income/expenses and other
financial items, improved in the first nine months of fiscal year 2014 to EUR 7 million (prior year: EUR 16 million).
This was mainly due to the lower debt compared with the prior-year period and lower interest rates.
5% increase in net income
Earnings before taxes increased by 5% over the prior-year period to EUR 337 million (prior year: EUR 322
million). At 23%, the Group’s tax rate was unchanged over the prior year. In the first nine months of fiscal year
2014, net income rose by 5% to EUR 259 million (prior year: EUR 248 million). The consolidated net income
attributable to equity holders of the parent company increased by 5% to EUR 258 million (prior year: EUR 245
million). The share attributable to non-controlling interests of EUR 1 million mainly comprised the 40% share
held by the Rainbow Group in the joint venture entities in China in the first six month of the year, as they were
taken over in full at the end of June (prior year: EUR 3 million). Earnings per share climbed by 5% compared to
the prior year to EUR 3.74 (prior year: EUR 3.55).
Nine Months Report 2014
Sales and Profit Development of the Business Segments
19
SALES AND PROFIT DEVELOPMENT OF THE
BUSINESS SEGMENTS
EUROPE
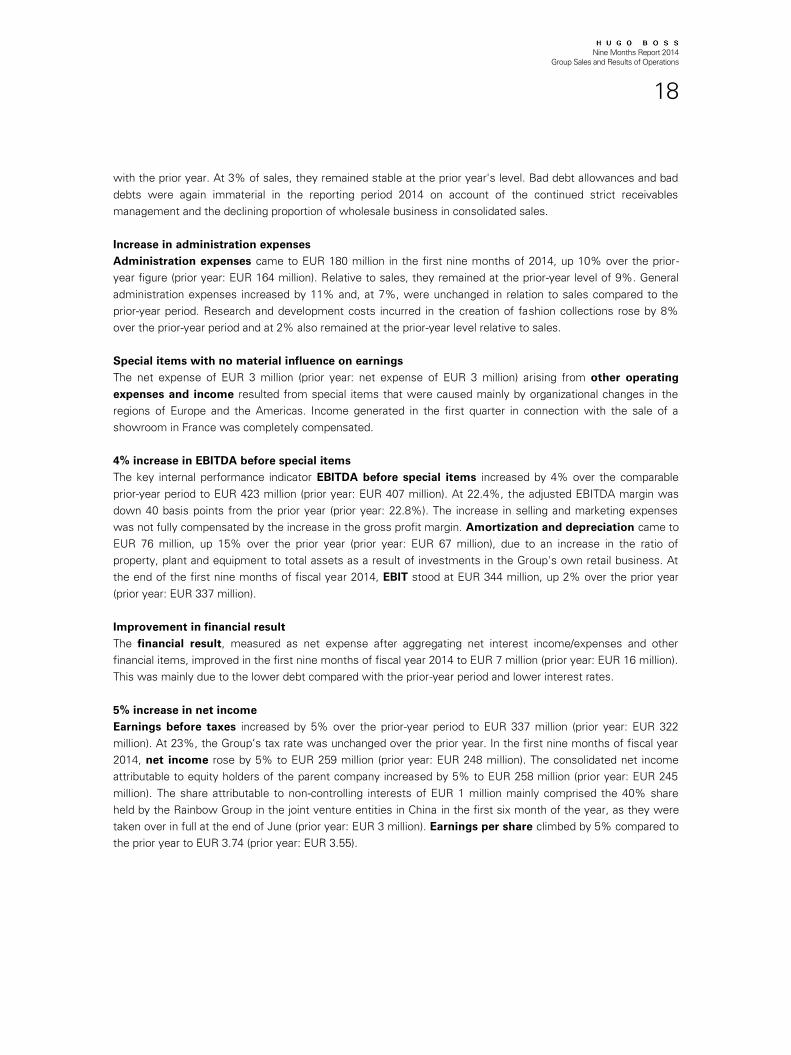
Currency-adjusted 9% increase in sales
In the first nine months of fiscal year 2014, sales in the reporting currency in Europe including the Middle East
and Africa increased by 9% to EUR 1,185 million (prior year: EUR 1,091 million). This similarly corresponds to an
increase of 9% in local currencies.
Ongoing transformation of the business model and increased selling-space productivity
Sales in the Group’s own retail business increased by 17% to EUR 611 million in Europe (prior year: EUR 521
million) and were also up 17% in local currencies. In addition to continued selling space expansion, this favorable
performance was particularly due to the heightened productivity of existing retail selling space. Sales with
wholesale customers climbed by 1% in the same period to EUR 574 million (prior year: EUR 571 million) in the
reporting currency. With sector conditions still challenging, sales in local currencies also rose by 1%.
Great Britain still the fastest growing core market within the region
At EUR 336 million, sales in Germany were up 12% over the comparable prior-year period (prior year: EUR 301
million), underpinned by double-digit growth in the Group's own retail business and solid performance in the
wholesale channel. In Great Britain, sales in the reporting currency came to EUR 182 million, up 22% over the
comparable prior-year period (prior year: EUR 149 million). This is equivalent to a 17% increase in sales in the
local currency. This positive performance was supported by the Group's own retail business as well as whole-
sale business. In France, the double-digit growth in sales in the Group's own retail business in the first nine
months fully made up for the decline in sales with wholesale partners. Thus, at EUR 134 million, sales were up
4% over the comparable prior-year period (prior year: EUR 129 million). Reflecting the difficult market environ-
ment in the Netherlands, sales in the Benelux countries came to EUR 111 million, down 5% from the compara-
ble prior-year period (prior year: EUR 117 million). However, the Group’s own retail business also grew in this
market during the reporting period.
Nine Months Report 2014
Sales and Profit Development of the Business Segments
20
Improved segment profit thanks to higher gross profit
At EUR 416 million, segment profit in Europe was up 13% over the comparable prior-year period (prior year:
EUR 369 million). The higher selling and distribution expenses were covered by the increase in gross profit. The
adjusted EBITDA margin widened by 130 basis points to 35.1% (prior year: 33.8%).
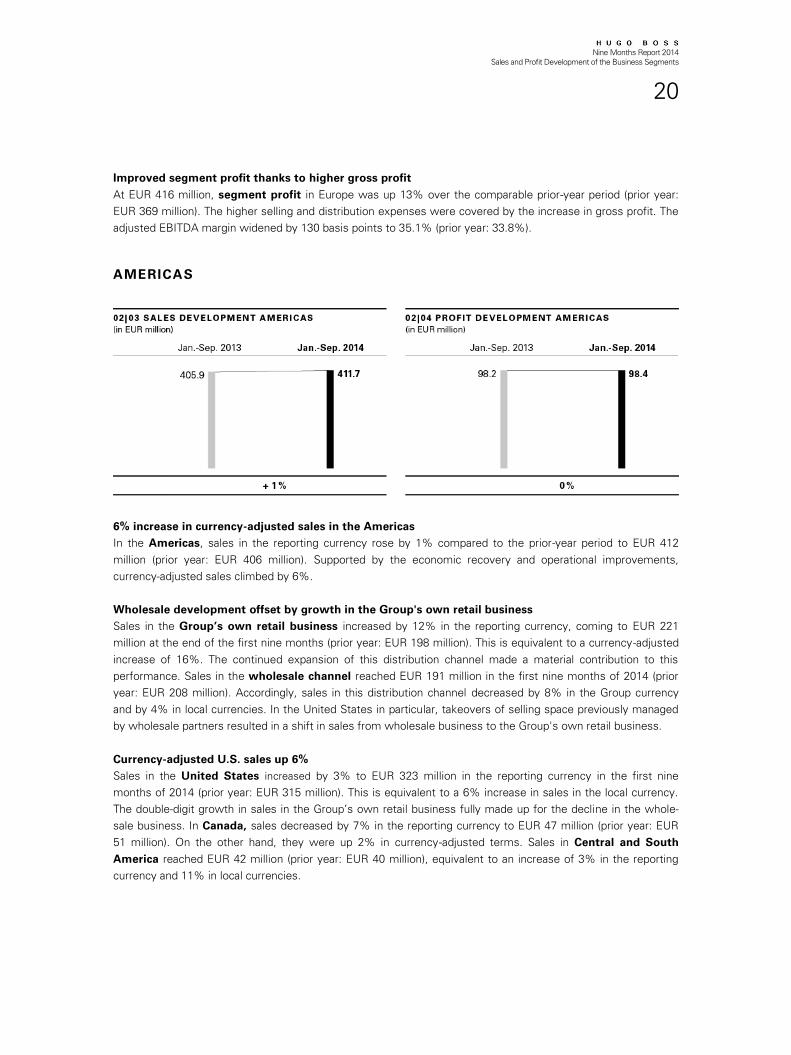
AMERICAS
6% increase in currency-adjusted sales in the Americas
In the Americas, sales in the reporting currency rose by 1% compared to the prior-year period to EUR 412
million (prior year: EUR 406 million). Supported by the economic recovery and operational improvements,
currency-adjusted sales climbed by 6%.
Wholesale development offset by growth in the Group's own retail business
Sales in the Group’s own retail business increased by 12% in the reporting currency, coming to EUR 221
million at the end of the first nine months (prior year: EUR 198 million). This is equivalent to a currency-adjusted
increase of 16%. The continued expansion of this distribution channel made a material contribution to this
performance. Sales in the wholesale channel reached EUR 191 million in the first nine months of 2014 (prior
year: EUR 208 million). Accordingly, sales in this distribution channel decreased by 8% in the Group currency
and by 4% in local currencies. In the United States in particular, takeovers of selling space previously managed
by wholesale partners resulted in a shift in sales from wholesale business to the Group's own retail business.
Currency-adjusted U.S. sales up 6%
Sales in the United States increased by 3% to EUR 323 million in the reporting currency in the first nine
months of 2014 (prior year: EUR 315 million). This is equivalent to a 6% increase in sales in the local currency.
The double-digit growth in sales in the Group’s own retail business fully made up for the decline in the whole-
sale business. In Canada, sales decreased by 7% in the reporting currency to EUR 47 million (prior year: EUR
51 million). On the other hand, they were up 2% in currency-adjusted terms. Sales in Central and South
America reached EUR 42 million (prior year: EUR 40 million), equivalent to an increase of 3% in the reporting
currency and 11% in local currencies.
Nine Months Report 2014
Sales and Profit Development of the Business Segments
21
Segment profit stable
At EUR 98 million, segment profit in the Americas held steady at the previous year's level. The improved
gross profit margin was offset by an increase in selling and marketing expenses due to expansion of the
Group's own retail activities. At the end of the first nine months of the year, the adjusted EBITDA margin in
this region stood at 23.9%, 30 basis points down from the prior-year figure of 24.2%.
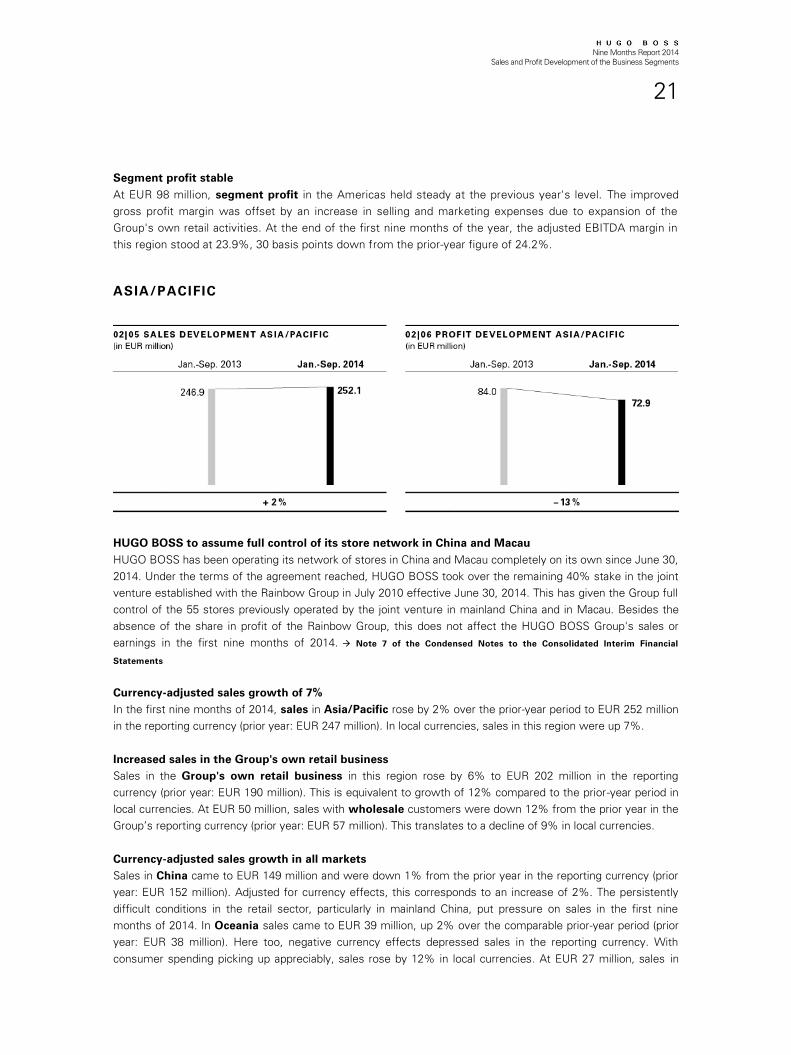
ASIA/PACIFIC
HUGO BOSS to assume full control of its store network in China and Macau
HUGO BOSS has been operating its network of stores in China and Macau completely on its own since June 30,
2014. Under the terms of the agreement reached, HUGO BOSS took over the remaining 40% stake in the joint
venture established with the Rainbow Group in July 2010 effective June 30, 2014. This has given the Group full
control of the 55 stores previously operated by the joint venture in mainland China and in Macau. Besides the
absence of the share in profit of the Rainbow Group, this does not affect the HUGO BOSS Group's sales or
earnings in the first nine months of 2014. Note 7 of the Condensed Notes to the Consolidated Interim Financial
Statements
Currency-adjusted sales growth of 7%
In the first nine months of 2014, sales in Asia/Pacific rose by 2% over the prior-year period to EUR 252 million
in the reporting currency (prior year: EUR 247 million). In local currencies, sales in this region were up 7%.
Increased sales in the Group's own retail business
Sales in the Group's own retail business in this region rose by 6% to EUR 202 million in the reporting
currency (prior year: EUR 190 million). This is equivalent to growth of 12% compared to the prior-year period in
local currencies. At EUR 50 million, sales with wholesale customers were down 12% from the prior year in the
Group’s reporting currency (prior year: EUR 57 million). This translates to a decline of 9% in local currencies.
Currency-adjusted sales growth in all markets
Sales in China came to EUR 149 million and were down 1% from the prior year in the reporting currency (prior
year: EUR 152 million). Adjusted for currency effects, this corresponds to an increase of 2%. The persistently
difficult conditions in the retail sector, particularly in mainland China, put pressure on sales in the first nine
months of 2014. In Oceania sales came to EUR 39 million, up 2% over the comparable prior-year period (prior
year: EUR 38 million). Here too, negative currency effects depressed sales in the reporting currency. With
consumer spending picking up appreciably, sales rose by 12% in local currencies. At EUR 27 million, sales in
Nine Months Report 2014
Sales and Profit Development of the Business Segments
22
Japan were down 5% from the prior year (prior year: EUR 28 million) but were up 4% after currency adjust-
ment.
Segment profit down from prior year
At EUR 73 million, segment profit in Asia/Pacific was down 13% from the comparable prior-year period (prior
year: EUR 84 million). This was mainly due to a disproportionately sharp increase in selling and marketing
expenses particularly in connection with the expansion of the Group's own retail business. At 28.9%, the
adjusted EBITDA margin was down 510 basis points from the prior year (prior year: 34.0%).
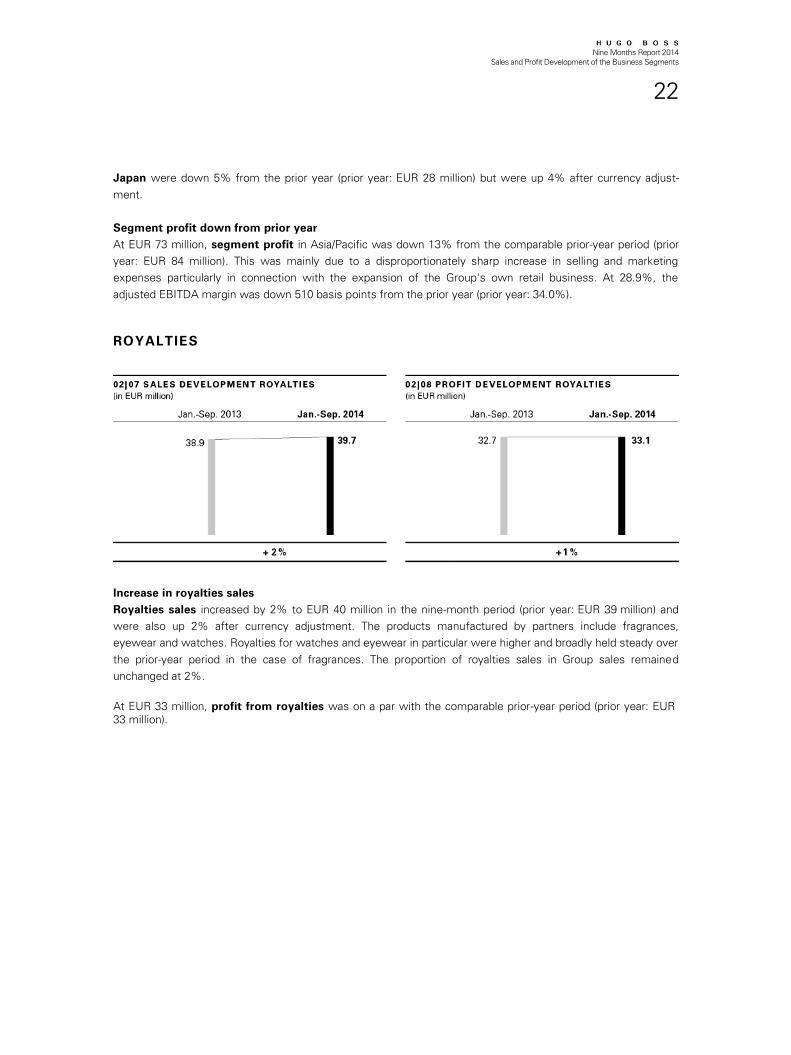
ROYALTIES
Increase in royalties sales
Royalties sales increased by 2% to EUR 40 million in the nine-month period (prior year: EUR 39 million) and
were also up 2% after currency adjustment. The products manufactured by partners include fragrances,
eyewear and watches. Royalties for watches and eyewear in particular were higher and broadly held steady over
the prior-year period in the case of fragrances. The proportion of royalties sales in Group sales remained
unchanged at 2%.
At EUR 33 million, profit from royalties was on a par with the comparable prior-year period (prior year: EUR
33 million).
Nine Months Report 2014
Net Assets and Financial Position
23
NET ASSETS AND FINANCIAL POSITION
Certain amounts shown here do not correspond to the figures reported in previous years and reflect adjust-
ments made. Annual Report 2013, Notes to the consolidated financial statements, Changes in accounting
policies/corrections
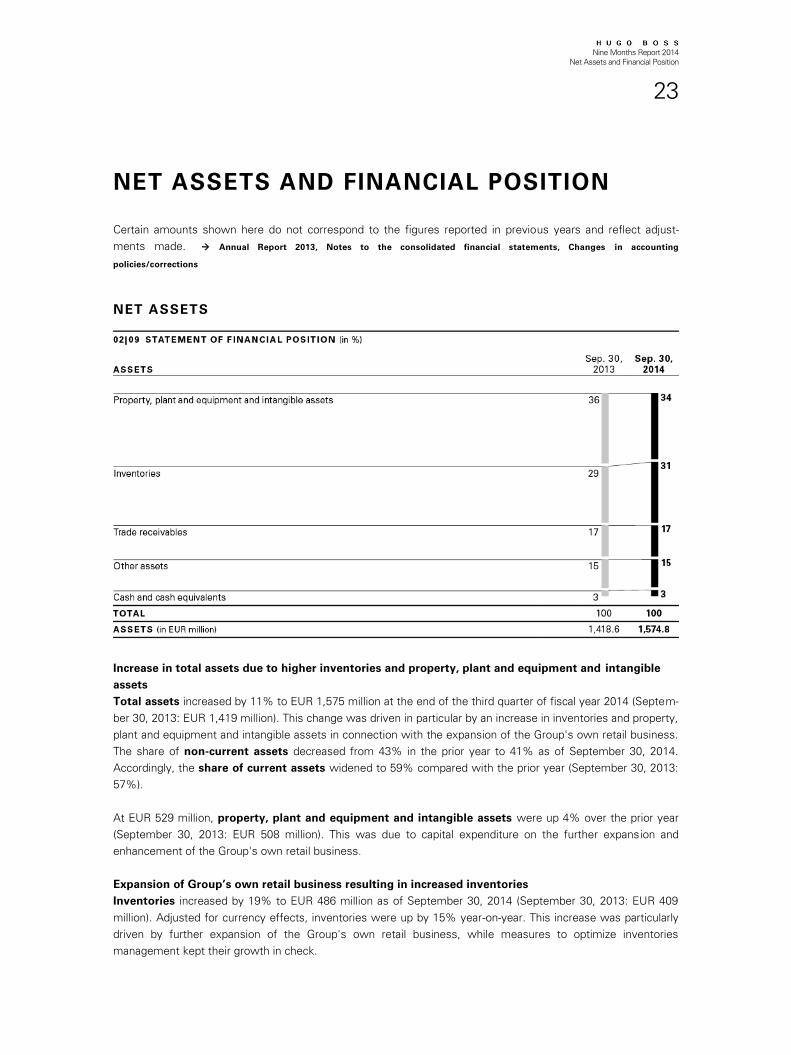
NET ASSETS
Increase in total assets due to higher inventories and property, plant and equipment and intangible
assets
Total assets increased by 11% to EUR 1,575 million at the end of the third quarter of fiscal year 2014 (Septem-
ber 30, 2013: EUR 1,419 million). This change was driven in particular by an increase in inventories and property,
plant and equipment and intangible assets in connection with the expansion of the Group's own retail business.
The share of non-current assets decreased from 43% in the prior year to 41% as of September 30, 2014.
Accordingly, the share of current assets widened to 59% compared with the prior year (September 30, 2013:
57%).
At EUR 529 million, property, plant and equipment and intangible assets were up 4% over the prior year
(September 30, 2013: EUR 508 million). This was due to capital expenditure on the further expansion and
enhancement of the Group's own retail business.
Expansion of Group’s own retail business resulting in increased inventories
Inventories increased by 19% to EUR 486 million as of September 30, 2014 (September 30, 2013: EUR 409
million). Adjusted for currency effects, inventories were up by 15% year-on-year. This increase was particularly
driven by further expansion of the Group's own retail business, while measures to optimize inventories
management kept their growth in check.
Nine Months Report 2014
Net Assets and Financial Position
24
Increase in trade receivables
Trade receivables increased by 10% compared to the prior-year period to EUR 265 million (September 30,
2013: EUR 242 million). Adjusted for currency effects, this equates to an increase of 7% and is primarily due to
stronger wholesale business in the third quarter as well as receivables in connection with the expansion of the
concession model.
Other assets climbed by 16% compared to the prior-year period to EUR 245 million (September 30, 2013: EUR
212 million). This increase is due to higher deferred tax assets among other things.
At EUR 50 million, cash and cash equivalents were up 2% over the prior year (September 30, 2013: EUR 49
million).
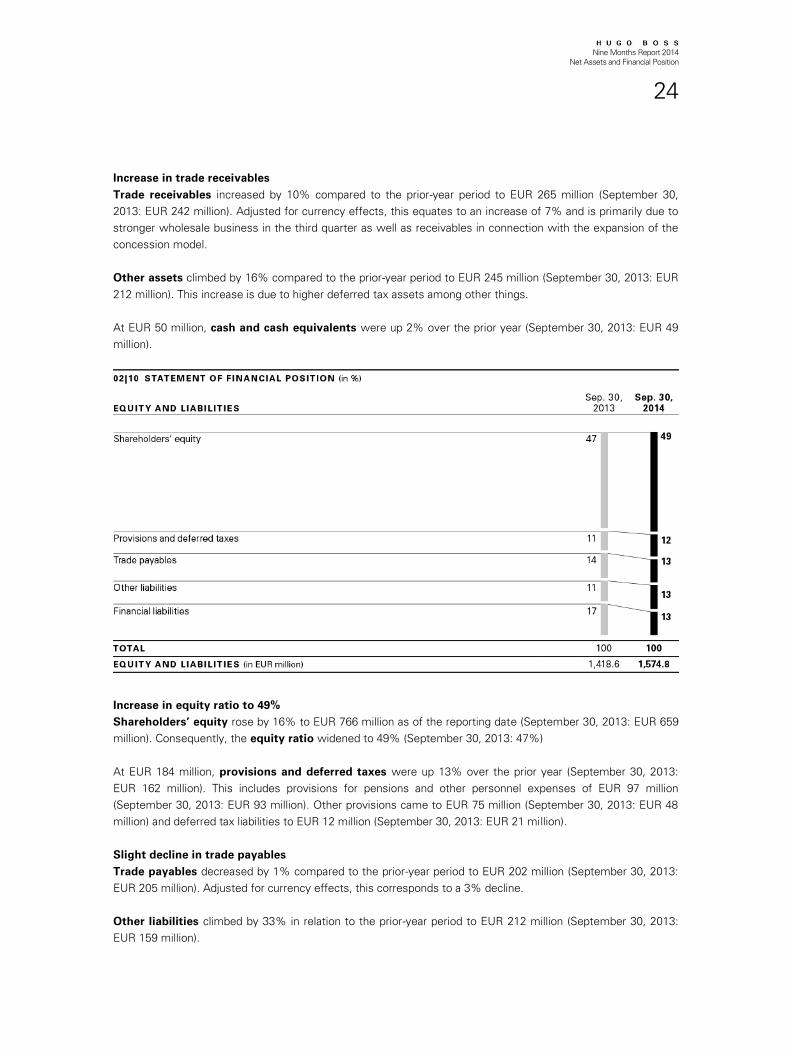
Increase in equity ratio to 49%
Shareholders’ equity rose by 16% to EUR 766 million as of the reporting date (September 30, 2013: EUR 659
million). Consequently, the equity ratio widened to 49% (September 30, 2013: 47%)
At EUR 184 million, provisions and deferred taxes were up 13% over the prior year (September 30, 2013:
EUR 162 million). This includes provisions for pensions and other personnel expenses of EUR 97 million
(September 30, 2013: EUR 93 million). Other provisions came to EUR 75 million (September 30, 2013: EUR 48
million) and deferred tax liabilities to EUR 12 million (September 30, 2013: EUR 21 million).
Slight decline in trade payables
Trade payables decreased by 1% compared to the prior-year period to EUR 202 million (September 30, 2013:
EUR 205 million). Adjusted for currency effects, this corresponds to a 3% decline.
Other liabilities climbed by 33% in relation to the prior-year period to EUR 212 million (September 30, 2013:
EUR 159 million).
Nine Months Report 2014
Net Assets and Financial Position
25
Total current and non-current financial liabilities fell by 10% to EUR 211 million as of the reporting date
(September 30, 2013: EUR 234 million) principally as a result of the lower utilization of the syndicated loan,
which amounted to EUR 127 million (September 30, 2013: EUR 140 million).
Trade net working capital as a percentage of sales above prior-year level
Trade net working capital is the HUGO BOSS Group's key performance indicator for measuring the efficiency
of capital employed. The only components factored into its calculation are inventories, trade receivables and
trade payables. It climbed by 23% over the prior-year period to EUR 548 million (September 30, 2013: EUR 446
million) as a result of the increase in inventories and trade receivables. At 18.7%, the 12-month moving average
of trade net working capital as a percentage of sales was up over the prior-year period (prior year: 18.0%).
Nine Months Report 2014
Net Assets and Financial Position
26
FINANCIAL POSITION
The statement of cash flows is presented in accordance with IAS 7. The cash and cash equivalents reported
here correspond to the "Cash and cash equivalents" item in the balance sheet. These figures cannot be drawn
from the balance sheet since the presentation in the statement of cash flows is adjusted for currency effects.
At EUR 236 million, cash flow from operating activities was down 5% from the prior-year period (prior year:
EUR 249 million). Here, the positive effect arising from higher earnings was offset by an increased cash outflow
from current net assets. The cash outflow from investing activities came to EUR 84 million, substantially
lower than in the prior-year period (prior year: EUR 144 million). In the prior-year period, capital expenditure on
the new flat-packed goods distribution center in particular had resulted in an increased cash outflow.
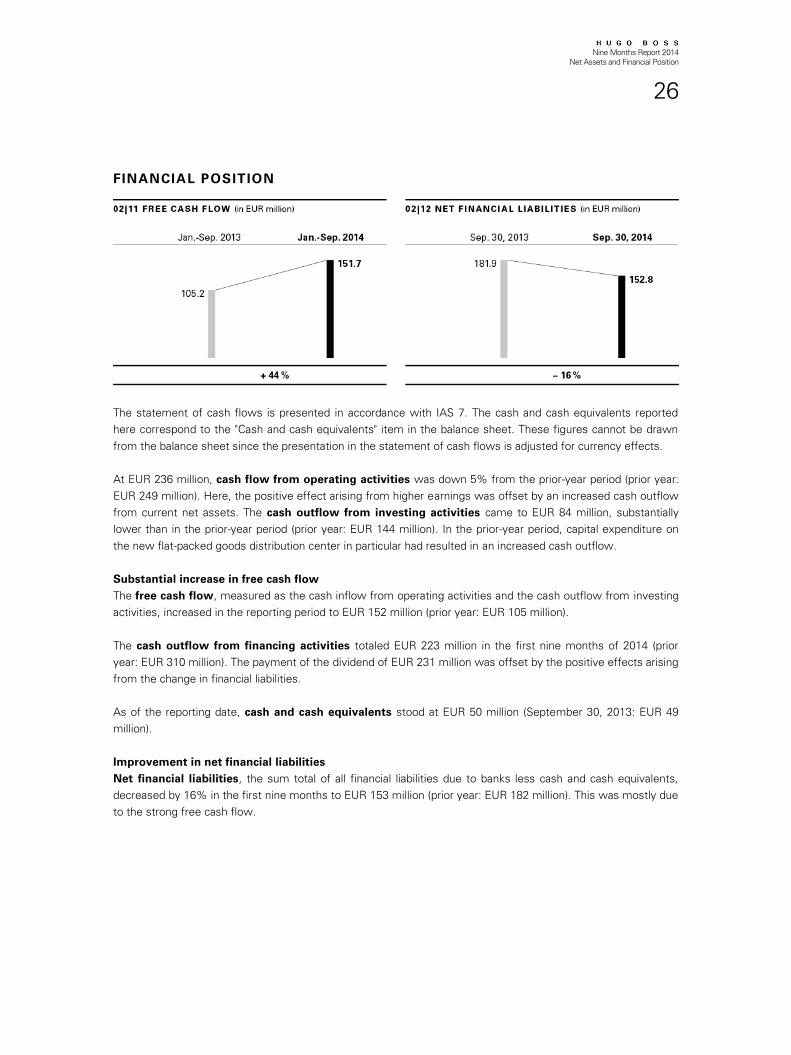
Substantial increase in free cash flow
The free cash flow, measured as the cash inflow from operating activities and the cash outflow from investing
activities, increased in the reporting period to EUR 152 million (prior year: EUR 105 million).
The cash outflow from financing activities totaled EUR 223 million in the first nine months of 2014 (prior
year: EUR 310 million). The payment of the dividend of EUR 231 million was offset by the positive effects arising
from the change in financial liabilities.
As of the reporting date, cash and cash equivalents stood at EUR 50 million (September 30, 2013: EUR 49
million).
Improvement in net financial liabilities
Net financial liabilities, the sum total of all financial liabilities due to banks less cash and cash equivalents,
decreased by 16% in the first nine months to EUR 153 million (prior year: EUR 182 million). This was mostly due
to the strong free cash flow.
Nine Months Report 2014
Net Assets and Financial Position
27
CAPITAL EXPENDITURE
Focus of capital expenditure on the Group's own retail business
The HUGO BOSS Group's total capital expenditure on property, plant and equipment and intangible assets came
to EUR 86 million in the first nine months of 2014, less than in the prior year (prior year: EUR 142 million). The
decrease is mainly attributable to capital expenditure on the expansion of logistics capacities in the prior -year
period which did not recur in the period under review.
Accounting for 75% of the total volume, global expansion and modernization of the Group's own retail
business remained the focus of capital expenditure in the reporting period (prior year: 60%). This translates into
total capital expenditure of EUR 62 million (prior year: EUR 85 million). Capital expenditure on openings of the
Group's own new retail stores came to EUR 32 million in the first nine months of 2014 (prior year: EUR 58
million). In addition, EUR 30 million was spent on the renovation and modernization of existing retail
locations in all three regions in the reporting period (prior year: EUR 27 million). In Europe, for example, such
work included the renovation of retail stores in London and Zurich. In the Americas, a store in Mexico City was
renovated, while various retail stores in Asia/Pacific also underwent less extensive renovation work.
Capital expenditure on the production, logistics and distribution structure and on research and
development came to EUR 8 million (prior year: EUR 37 million). Capital expenditure on administration came
to EUR 16 million in the first nine months of fiscal year 2014 (prior year: EUR 20 million). This mainly entails
enlargement of the IT infrastructure.
Nine Months Report 2014
Report on Risks and Opportunities
28
REPORT ON RISKS AND OPPORTUNITIES
HUGO BOSS has a comprehensive risk management system enabling Management to identify and analyze
opportunities and risks as well as to take appropriate measures at an early stage. The risk situation has not
changed materially compared to the reporting year 2013. A detailed overview of the risks and opportunities can
be found in the Annual Report 2013. All statements included therein regarding risks and opportunities continue
to be valid.
Nine Months Report 2014
Subsequent Events and Outlook
29
SUBSEQUENT EVENTS AND OUTLOOK
HUGO BOSS expects continued growth in 2014 despite a still-challenging economic and sector-specific
environment. The implementation of the Group strategy and initiatives derived from it will take sales and
operating profit to new record levels in the Company's history. Group sales will grow between 6% and 8% after
adjustment for currency effects. The Group also assumes that it will be able to increase operating profit (EBITDA
before special items) by 5% to 7%.
SUBSEQUENT EVENTS
No reportable events
Between the end of the third quarter of fiscal year 2014 and the publication of this report, there were no
material macroeconomic, socio-political, sector-related or company-specific changes that the Management
expects to have a significant influence on the earnings, net assets, and financial position of the Group.
OUTLOOK
Forward-looking statements
The following report sets out the HUGO BOSS Management's outlook for future business performance and
describes the anticipated development of the main economic and sector-specific conditions. It reflects the
current knowledge of the Management at the time the report was prepared, while also taking into account that
the actual development may differ considerably from these forecasts, either positively or negatively, due to the
occurrence of risks and opportunities as described in the report on risks and opportunities in the Annual Report
2013. Other than the statutory publication requirements, the HUGO BOSS Group does not assume any
obligation to update the statements contained in this report.
Business development subject to external influences
Economic and industry-specific developments influence the Group’s operating and financial development. It is
therefore very important for the Group to identify related trends at an early stage so that it can react to them in
good time with suitable measures.
Outlook for global growth overshadowed by risks
The IMF expects the global economy to grow by 3.3% in 2014 as a whole. This forecast has thus been scaled
back slightly since the beginning of the year. Easing fiscal burdens in many key market economies, the com-
mitment by central banks to reduce their monetary stimulus measures only gradually and an acceleration in
world trade in the course of the year should support the outlook for growth. However, the absence of structural
reforms, muted capital spending and mounting geopolitical tensions are placing a damper on global economic
growth. As well as this, the persistently high levels of debt and historically low inflation rates in Europe could
also pose a threat to growth.
European economy recovering slowly
According to the IMF's estimates, the European economy should expand by 0.8% in 2014, spurred by easing
government austerity measures and sustained low interest rates. In addition, there is political debate on the
need for additional investments. However, faltering reform efforts, continued high public-sector debt in many
countries across the region, historically low inflation rates and, linked to this, fears of deflation, which may place
Nine Months Report 2014
Subsequent Events and Outlook
30
a damper on demand, as well as sustained geopolitical tension harbor risks for the economy. The IMF expects
growth in Germany to again exceed the average for the region in 2014 as a whole, although it has recently
lowered its forecast to 1.4%. It projects growth of 0.4% in France, while the slow implementation of economic
reforms is continuing to exert a drag. In Great Britain, economic growth is expected to accelerate to 3.2%.
Looking forward, however, the momentum will slow primarily as the Bank of England is expected to tighten the
monetary reins.
Robust expansion expected for the U.S. economy
After a weak start to the year, the IMF assumes that growth in the U.S. economy will pick up to 2.2% for 2014
as a whole. Robust capital expenditure, mounting improvements in the employment and real estate markets as
well as increased public spending should spur economic growth. On the other hand, the outlook for the Latin
American economies has clouded over, with the IMF now only expecting growth of 1.3% in 2014. This is
mostly due to muted industrial growth, which is being dragged down by deteriorating competitiveness and, as a
result, a lack of investment. Consumer spending is also expected to slow.
Stable economic growth in Asia
The Asian economy is characterized by regional differences in the rate of growth. The IMF anticipates growth
for the region to be 6.5% and thus nearly on a par with the previous year. It expects the Chinese economy to
expand by 7.4% and, hence, at a slightly lower rate than in the prior year due to slower growth in trade and
production. However, the reforms and investments implemented in many areas should spur growth. In Japan,
the economy looks set to continue to recover from the slump arising in the second quarter after the increase of
value added tax and grow by 0.9% over the year as a whole. Growth rates in Australia should rise somewhat
compared to the prior year supported by a modest increase in consumer spending, as well as a recovery in the
export sector.
Continued sector growth in 2014
Growth in the premium and luxury goods sector is expected to continue in 2014. According to Altagamma and
Bain & Company, growth should come to 5% in currency-adjusted terms, thus falling slightly short of the
previous year. It is expected that companies in the sector will continue to focus primarily on their own retail
businesses. However, the number of new store openings is likely to decline compared to prior years. Instead,
many market players will concentrate on upgrading existing stores in order to improve the shopping experience
and achieve productivity gains. Growing importance is being attributed to the online sales channel and its
integration into bricks-and-mortar retailing. In contrast, department stores and specialist multi-brand dealers,
many of them owner-managed, are under pressure.
All regions will probably contribute to the sector's growth in 2014. Tourism, particularly from Asian countries,
will lead to an increasing shift of sales towards the European and American markets. Despite the gradual
improvement in economic conditions in Southern Europe in particular, sector growth in Europe will continue to
suffer from subdued consumer sentiment and declining customer footfall in retail stores in many areas. In
Eastern Europe, the sector is likely to suffer from the political tensions emanating from the Ukraine conflict. All
in all, the sector is expected to grow by 2% in Europe in 2014. In the Americas, the luxury goods sector should
expand by 6% in currency-adjusted terms in 2014. After a slow start to the year, the sector should benefit from
rising local consumer spending and tourist demand in the United States in the wake of the general economic
recovery. By contrast, growth is likely to be somewhat weaker in Latin America. Industry experts project
expansion of 5% in currency-adjusted terms for Asia. The slower rate of growth in the Chinese economy and
the sustained anti-corruption campaign being waged by the government are likely to continue curbing local
demand for luxury goods, meaning that business in mainland China is expected to decline. In Hong Kong, the
sector is likely to be adversely affected by political protests. As a result, demand on the part of Chinese tourists
Nine Months Report 2014
Subsequent Events and Outlook
31
is expected to increasingly shift to other markets within the region. The Japanese market, among others, will
benefit from this trend alongside brisk demand from domestic consumers.
Group sales expected to increase by 6% to 8% on a currency-adjusted basis
Despite the continuing challenging economic and industry-specific situation in many markets, HUGO BOSS
expects to increase its currency-neutral sales in 2014 by a rate of 6% to 8%. The Group assumes that its growth
will outperform that of the global economy and the luxury goods industry.
OUTLOOK 2014
SALES GROWTH
(CURRENCY-NEUTRAL)
6% to 8%
GROWTH IN
EBITDA BEFORE SPECIAL ITEMS
5% to 7%
CAPITAL EXPENDITURE
Around EUR 130 million
OWN RETAIL NETWORK
Opening of around 50 new stores (excluding takeovers)
Growth expected in all regions
All regions should contribute to the Group's forecasted sales growth in 2014. Growth is expected in virtually all
markets, driven by the region's increasing orientation towards own retail and stronger wholesale demand in the
second half of the year. Growth is projected for the Americas, underpinned by substantial gains not only in the
U.S. market but also in Central and Latin America. The Group is also planning for increases in Asia. In the key
Chinese market, HUGO BOSS is especially working on the implementation of a range of measures to boost
growth. Royalties sales should also be stronger.
Double-digit growth projected for own retail business
Sales in the Group's own retail business are likely to grow at a double-digit rate in 2014. In addition to increases
at the Group's own retail stores, the online business will also contribute to this. Beyond the contribution to sales
from additions to the store network, an increase in retail comp store sales is also expected. This will be
supported by stepped-up brand communication activities and the implementation of measures to improve retail
management. Taking over mono-brand selling spaces previously managed by retail partners or franchisees will
have a moderately positive impact on the growth of Group sales. A more or less stable sales trend is forecasted
for the wholesale segment. This outlook is based on the development of order intake, feedback from trading
partners on the new collections and expectations about the replenishment business. The progressive consolida-
tion of the Company's customer portfolio and associated decline in business with smaller trading partners will
have a negative impact on the trend in sales in this channel.
Nine Months Report 2014
Subsequent Events and Outlook
32
Growth in retail network to continue
The HUGO BOSS Group will continue to expand its own retail business and add about 50 new stores to its
network in 2014. Based on an analysis of its market penetration, the Group sees opportunities to profitably
increase its selling space in all regions. In addition, the Group is taking over HUGO BOSS shop-in-shop units
previously managed by retail partners. The Group will also close points of sale in the course of improving the
quality of its store portfolio, particularly in Asia. In many cases, this development will be related to the relocation
and consolidation of existing stores in more up-market, larger points of sale.
Gross profit margin will increase
HUGO BOSS expects an increase in its gross profit margin in 2014. While efficiency improvements in produc-
tion and sourcing will probably be offset by rising labor costs, the growing share from the Group's own retail
business will support this increase. The gross profit margin earned in this distribution channel is higher than that
of the wholesale business. At the same time, it expects decreased markdowns in its own retail business to have
a favorable effect on margins.
Operating expenses will rise due to retail expansion and higher marketing expenses
The Group's operating expenses will increase, mainly due to the continuing expansion of its own retail business.
In addition, the Group will significantly increase its marketing expenses compared to the prior year in order to
strengthen customer demand. Logistics expenses will rise due to temporary effects in connection with the
opening of the new flat-packed goods distribution center in Germany. The cost effects arising from the migration
of the existing sites in the first half of the year will offset the positive effects of efficiency gains in the second
half of the year. A moderate increase in research and development costs is also expected. Overall, however,
administrative expenses will grow at a slower rate than sales.
Operating profit expected to increase by 5% to 7%
The forecasted increases in sales and the gross profit margin will cause operating profit (EBITDA before special items)
to rise by 5% to 7%. The Group's net income and earnings per share are expected to rise at a high single-digit rate,
underpinned in particular by reduced net financial expense as a result of lower average liabilities and the absence of
profit of non-controlling interests following the takeover of the joint venture entities in China.
Strict management of trade net working capital
The strict management of trade net working capital continues to have a high priority in order to support
improvements in operating cash flow. Further medium-term potential for improvement is particularly seen in a
decrease in days inventories outstanding. However, the Group assumes that in the current year trade net
working capital relative to sales will exceed the level achieved at the end of 2013. This will particularly be due to
higher inventories in connection with the expansion of the Group's own retail business and the systematic use
of sales opportunities.
Investing activities to focus on own retail business
Capital expenditure in 2014 will focus on the expansion of the Group's own retail activities and the renovation of
existing stores and shops. The Group will also strengthen its operational infrastructure in the areas of IT,
logistics and production. Capital expenditure will therefore come to around EUR 130 million in 2014.
Nine Months Report 2014
Subsequent Events and Outlook
33
Strong cash flow supporting reduction in net financial liabilities
The Group expects a strong cash flow in 2014 primarily due to the forecasted increase in earnings, strict
management of trade net working capital and value-enhancing capital expenditure. Funds in excess of the
dividend payment will be held as a liquidity reserve. Accordingly, it assumes that cash and cash equivalents will
roughly equal gross financial liabilities at the end of the year. In light of the Group's strong internal financing
capability and long-term financing concluded on favorable terms in the form of a syndicated loan, the Group is
not planning any significant financing activities in 2014.
Further improvements in sales and earnings planned for the year 2015 and beyond
The Group also plans to achieve increases in sales and earnings in the year 2015 and beyond. Its corporate
strategy here is based on organic growth of the existing brand portfolio. Consolidated sales are planned to reach
EUR 3 billion in 2015. More than 60% of sales should then be generated by the Group's own retail business.
The Group likewise expects to generate a larger share of its sales in emerging markets in the future and
therefore to achieve a more balanced spread of its revenue by region. HUGO BOSS has also set itself the goal
of earning an adjusted operating margin (EBITDA before special items in relation to sales) of 25% in the medium
term. To this end, the Group is planning further progress in 2015. Negative macroeconomic and sector-specific
developments in core markets, cost inflation in sourcing processes and a decline in the attractiveness of the
Group's brands could jeopardize the achievement of these goals. The Group has taken precautions to limit the
probability of these or other risks occurring and mitigate their impact if they do. Details can be found in the risk
report in the Annual Report 2013.
Nine Months Report 2014
Summary on Earnings, Net Assets and Financial Position
34
SUMMARY ON EARNINGS, NET ASSETS AND
FINANCIAL POSITION
In summary, the results of operations, net assets, and financial position indicate that the HUGO BOSS Group
continued to be in a sound financial position as of the date on which this report for the first nine months of fiscal
year 2014 was prepared.
Metzingen, October 23, 2014
HUGO BOSS AG
The Managing Board
Claus-Dietrich Lahrs
Christoph Auhagen
Mark Langer

Halbjahresfinanzbericht 2013
Summary on Earnings, Net Assets and Financial Position
35
Nine Months Report 2014
Consolidated Income Statement
36
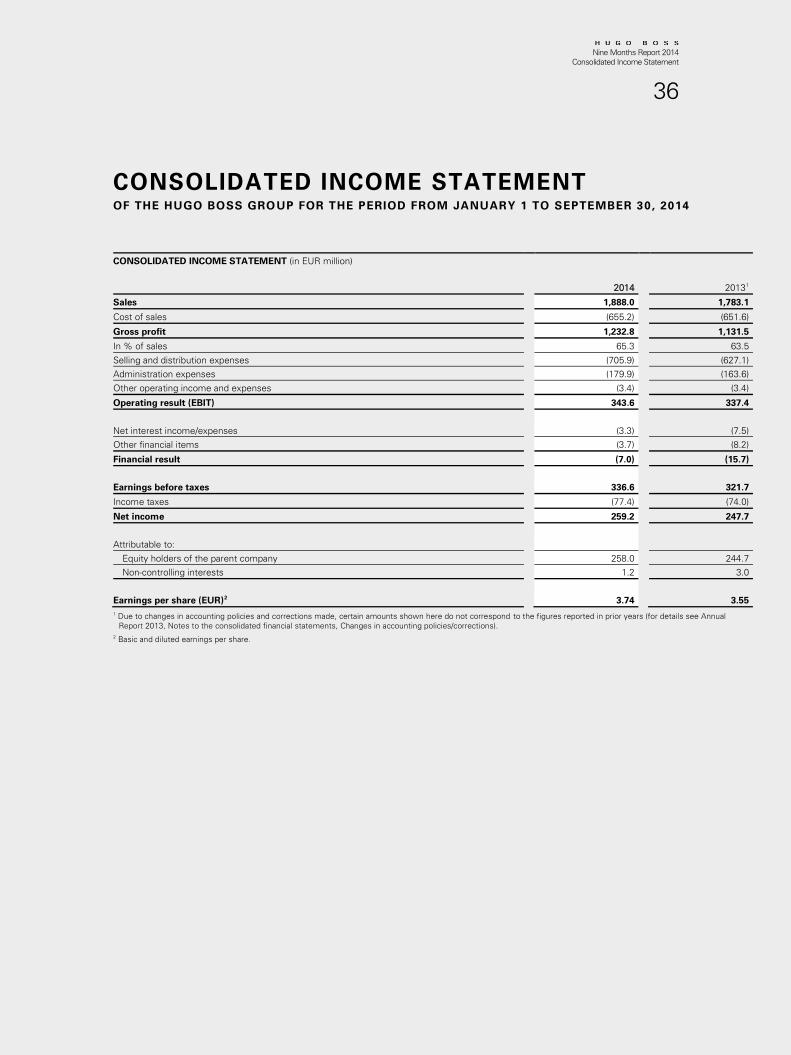
CONSOLIDATED INCOME STATEMENT
OF THE HUGO BOSS GROUP FOR THE PERIOD FROM JANUARY 1 TO SEPTEMBER 30, 2014
CONSOLIDATED INCOME STATEMENT (in EUR million)
2014
2013
1
Sales
1,888.0
1,783.1
Cost of sales
(655.2)
(651.6)
Gross profit
1,232.8
1,131.5
In % of sales
65.3
63.5
Selling and distribution expenses
(705.9)
(627.1)
Administration expenses
(179.9)
(163.6)
Other operating income and expenses
(3.4)
(3.4)
Operating result (EBIT)
343.6
337.4
Net interest income/expenses
(3.3)
(7.5)
Other financial items
(3.7)
(8.2)
Financial result
(7.0)
(15.7)
Earnings before taxes
336.6
321.7
Income taxes
(77.4)
(74.0)
Net income
259.2
247.7
Attributable to:
Equity holders of the parent company
258.0
244.7
Non-controlling interests
1.2
3.0
Earnings per share (EUR)
2
3.74
3.55
1 Due to changes in accounting policies and corrections made, certain amounts shown here do not correspond to the figures reported in prior years (for details see Annual
Report 2013, Notes to the consolidated financial statements, Changes in accounting policies/corrections).
2 Basic and diluted earnings per share.
Nine Months Report 2014
Consolidated Statement of Comprehensive Income
37
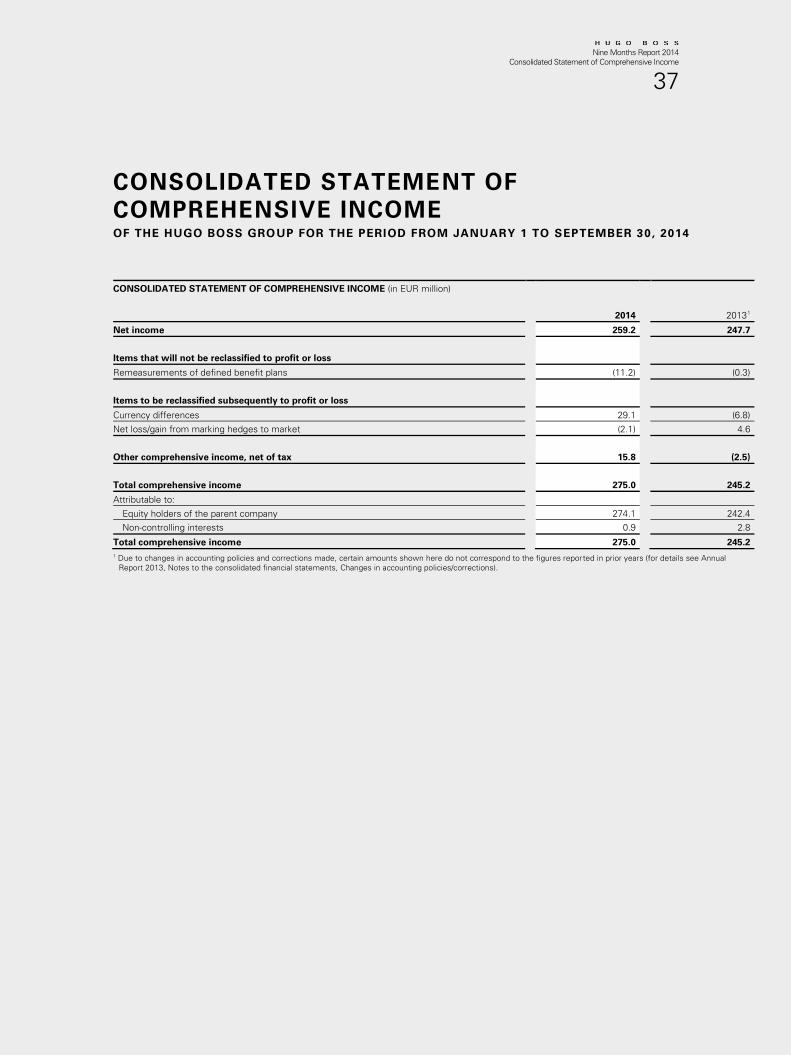
CONSOLIDATED STATEMENT OF
COMPREHENSIVE INCOME
OF THE HUGO BOSS GROUP FOR THE PERIOD FROM JANUARY 1 TO SEPTEMBER 30, 2014
CONSOLIDATED STATEMENT OF COMPREHENSIVE INCOME (in EUR million)
2014
2013
1
Net income
259.2
247.7
Items that will not be reclassified to profit or loss
Remeasurements of defined benefit plans
(11.2)
(0.3)
Items to be reclassified subsequently to profit or loss
Currency differences
29.1
(6.8)
Net loss/gain from marking hedges to market
(2.1)
4.6
Other comprehensive income, net of tax
15.8
(2.5)
Total comprehensive income
275.0
245.2
Attributable to:
Equity holders of the parent company
274.1
242.4
Non-controlling interests
0.9
2.8
Total comprehensive income
275.0
245.2
1 Due to changes in accounting policies and corrections made, certain amounts shown here do not correspond to the figures reported in prior years (for details see Annual
Report 2013, Notes to the consolidated financial statements, Changes in accounting policies/corrections).
Nine Months Report 2014
Consolidated Statement of Financial Position
38
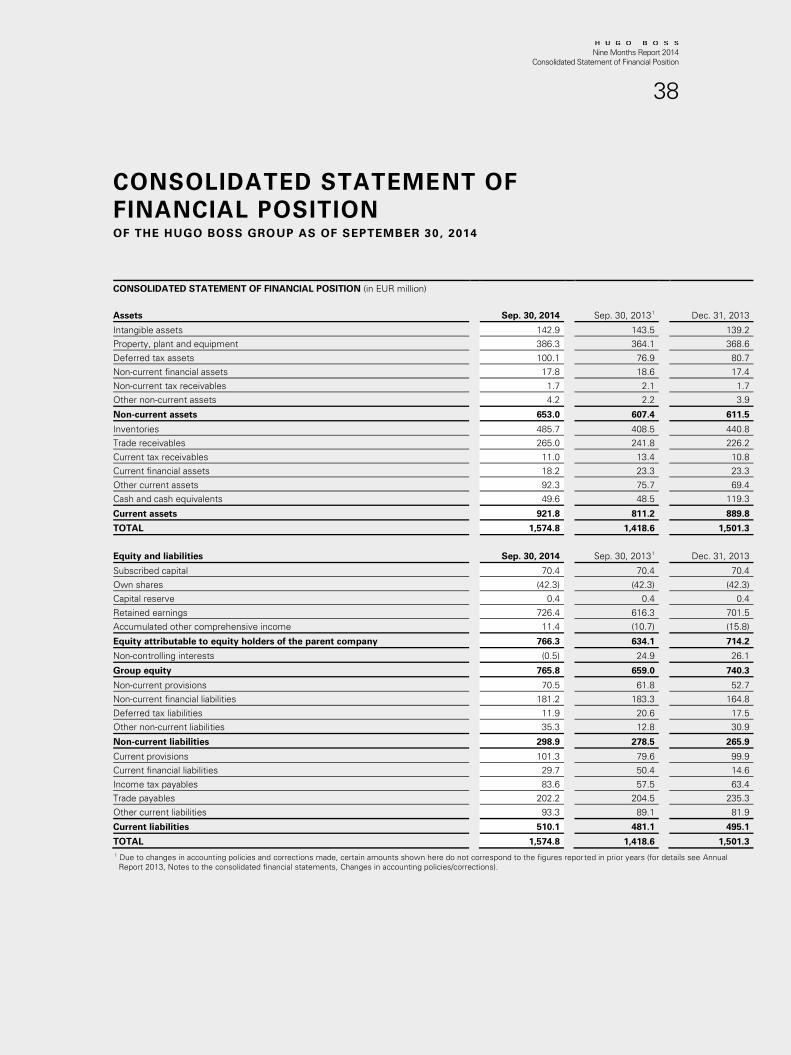
CONSOLIDATED STATEMENT OF
FINANCIAL POSITION
OF THE HUGO BOSS GROUP AS OF SEPTEMBER 30, 2014
CONSOLIDATED STATEMENT OF FINANCIAL POSITION (in EUR million)
Assets
Sep. 30, 2014
Sep. 30, 2013
1
Dec. 31, 2013
Intangible assets
142.9
143.5
139.2
Property, plant and equipment
386.3
364.1
368.6
Deferred tax assets
100.1
76.9
80.7
Non-current financial assets
17.8
18.6
17.4
Non-current tax receivables
1.7
2.1
1.7
Other non-current assets
4.2
2.2
3.9
Non-current assets
653.0
607.4
611.5
Inventories
485.7
408.5
440.8
Trade receivables
265.0
241.8
226.2
Current tax receivables
11.0
13.4
10.8
Current financial assets
18.2
23.3
23.3
Other current assets
92.3
75.7
69.4
Cash and cash equivalents
49.6
48.5
119.3
Current assets
921.8
811.2
889.8
TOTAL
1,574.8
1,418.6
1,501.3
Equity and liabilities
Sep. 30, 2014
Sep. 30, 2013
1
Dec. 31, 2013
Subscribed capital
70.4
70.4
70.4
Own shares
(42.3)
(42.3)
(42.3)
Capital reserve
0.4
0.4
0.4
Retained earnings
726.4
616.3
701.5
Accumulated other comprehensive income
11.4
(10.7)
(15.8)
Equity attributable to equity holders of the parent company
766.3
634.1
714.2
Non-controlling interests
(0.5)
24.9
26.1
Group equity
765.8
659.0
740.3
Non-current provisions
70.5
61.8
52.7
Non-current financial liabilities
181.2
183.3
164.8
Deferred tax liabilities
11.9
20.6
17.5
Other non-current liabilities
35.3
12.8
30.9
Non-current liabilities
298.9
278.5
265.9
Current provisions
101.3
79.6
99.9
Current financial liabilities
29.7
50.4
14.6
Income tax payables
83.6
57.5
63.4
Trade payables
202.2
204.5
235.3
Other current liabilities
93.3
89.1
81.9
Current liabilities
510.1
481.1
495.1
TOTAL
1,574.8
1,418.6
1,501.3
1 Due to changes in accounting policies and corrections made, certain amounts shown here do not correspond to the figures reported in prior years (for details see Annual
Report 2013, Notes to the consolidated financial statements, Changes in accounting policies/corrections).
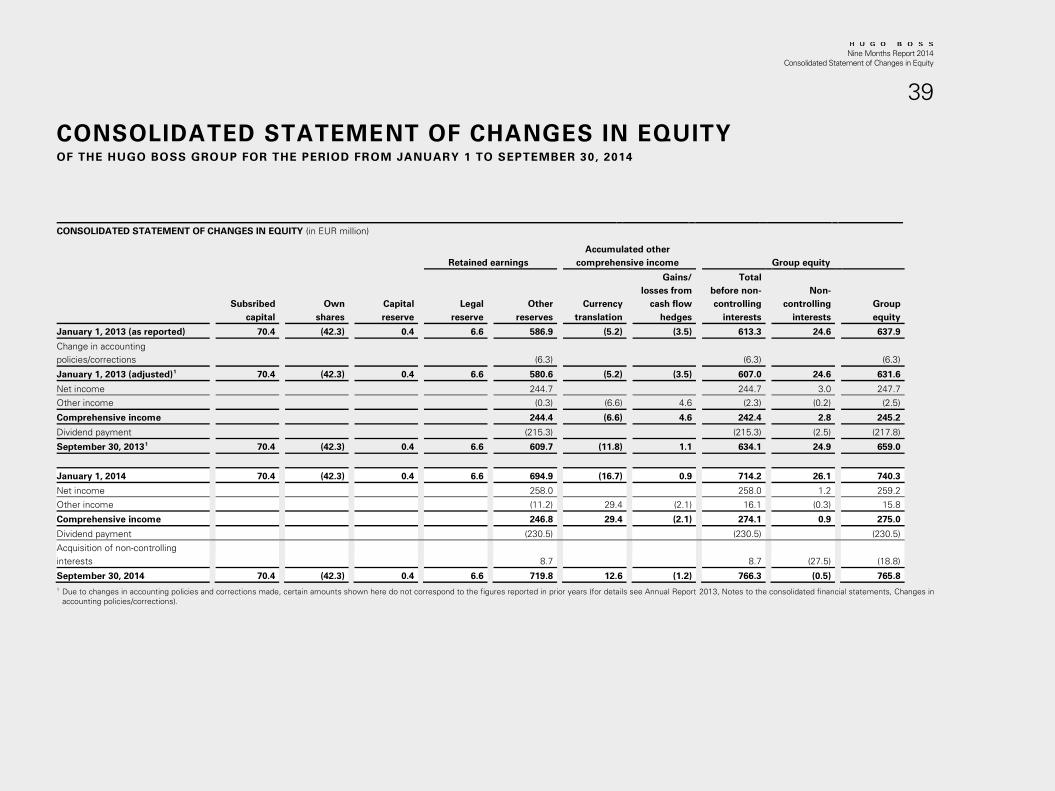
Nine Months Report 2014
Consolidated Statement of Changes in Equity
39
CONSOLIDATED STATEMENT OF CHANGES IN EQUITY
OF THE HUGO BOSS GROUP FOR THE PERIOD FROM JANUARY 1 TO SEPTEMBER 30, 2014
CONSOLIDATED STATEMENT OF CHANGES IN EQUITY (in EUR million)
Retained earnings
Accumulated other
comprehensive income
Group equity
Subsribed
capital
Own
shares
Capital
reserve
Legal
reserve
Other
reserves
Currency
translation
Gains/
losses from
cash flow
hedges
Total
before non-
controlling
interests
Non-
controlling
interests
Group
equity
January 1, 2013 (as reported)
70.4
(42.3)
0.4
6.6
586.9
(5.2)
(3.5)
613.3
24.6
637.9
Change in accounting
policies/corrections
(6.3)
(6.3)
(6.3)
January 1, 2013 (adjusted)
1
70.4
(42.3)
0.4
6.6
580.6
(5.2)
(3.5)
607.0
24.6
631.6
Net income
244.7
244.7
3.0
247.7
Other income
(0.3)
(6.6)
4.6
(2.3)
(0.2)
(2.5)
Comprehensive income
244.4
(6.6)
4.6
242.4
2.8
245.2
Dividend payment
(215.3)
(215.3)
(2.5)
(217.8)
September 30, 2013
1
70.4
(42.3)
0.4
6.6
609.7
(11.8)
1.1
634.1
24.9
659.0
January 1, 2014
70.4
(42.3)
0.4
6.6
694.9
(16.7)
0.9
714.2
26.1
740.3
Net income
258.0
258.0
1.2
259.2
Other income
(11.2)
29.4
(2.1)
16.1
(0.3)
15.8
Comprehensive income
246.8
29.4
(2.1)
274.1
0.9
275.0
Dividend payment
(230.5)
(230.5)
(230.5)
Acquisition of non-controlling
interests 8.7 8.7 (27.5) (18.8)
September 30, 2014
70.4
(42.3)
0.4
6.6
719.8
12.6
(1.2)
766.3
(0.5)
765.8
1 Due to changes in accounting policies and corrections made, certain amounts shown here do not correspond to the figures reported in prior years (for details see Annual Report 2013, Notes to the consolidated financial statements, Changes in
accounting policies/corrections).
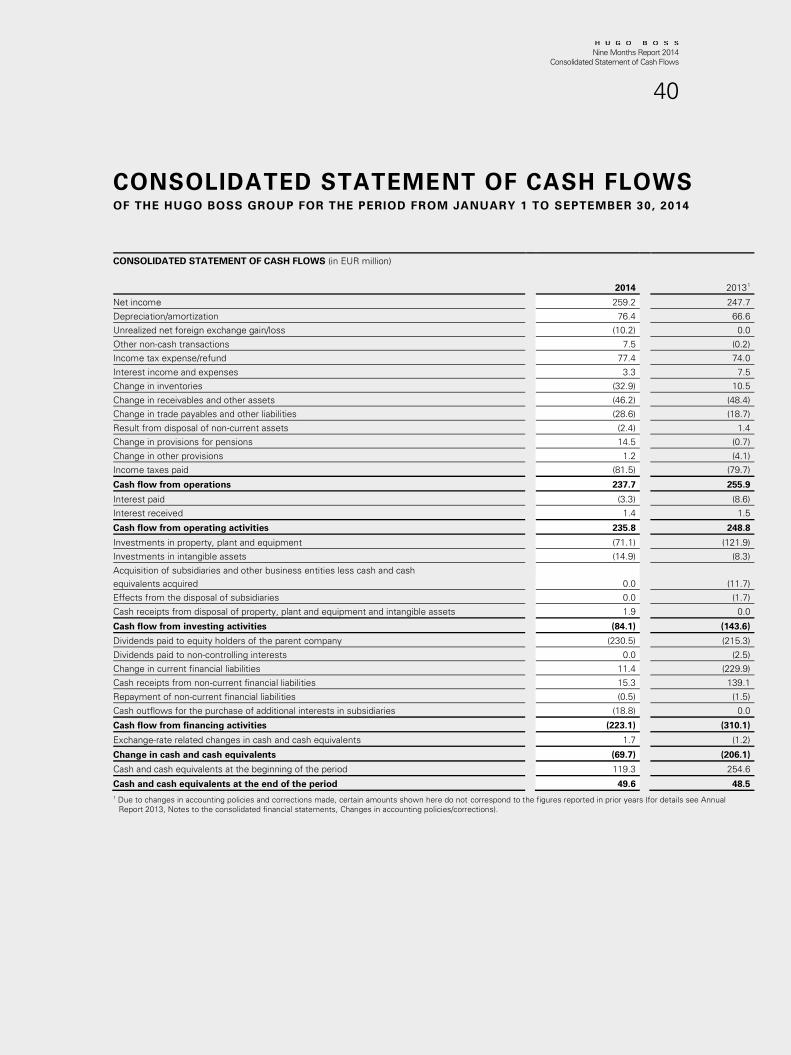
Nine Months Report 2014
Consolidated Statement of Cash Flows
40
CONSOLIDATED STATEMENT OF CASH FLOWS
OF THE HUGO BOSS GROUP FOR THE PERIOD FROM JANUARY 1 TO SEPTEMBER 30, 2014
CONSOLIDATED STATEMENT OF CASH FLOWS (in EUR million)
2014
2013
1
Net income
259.2
247.7
Depreciation/amortization
76.4
66.6
Unrealized net foreign exchange gain/loss
(10.2)
0.0
Other non-cash transactions
7.5
(0.2)
Income tax expense/refund
77.4
74.0
Interest income and expenses
3.3
7.5
Change in inventories
(32.9)
10.5
Change in receivables and other assets
(46.2)
(48.4)
Change in trade payables and other liabilities
(28.6)
(18.7)
Result from disposal of non-current assets
(2.4)
1.4
Change in provisions for pensions
14.5
(0.7)
Change in other provisions
1.2
(4.1)
Income taxes paid
(81.5)
(79.7)
Cash flow from operations
237.7
255.9
Interest paid
(3.3)
(8.6)
Interest received
1.4
1.5
Cash flow from operating activities
235.8
248.8
Investments in property, plant and equipment
(71.1)
(121.9)
Investments in intangible assets
(14.9)
(8.3)
Acquisition of subsidiaries and other business entities less cash and cash
equivalents acquired
0.0
(11.7)
Effects from the disposal of subsidiaries
0.0
(1.7)
Cash receipts from disposal of property, plant and equipment and intangible assets
1.9
0.0
Cash flow from investing activities
(84.1)
(143.6)
Dividends paid to equity holders of the parent company
(230.5)
(215.3)
Dividends paid to non-controlling interests
0.0
(2.5)
Change in current financial liabilities
11.4
(229.9)
Cash receipts from non-current financial liabilities
15.3
139.1
Repayment of non-current financial liabilities
(0.5)
(1.5)
Cash outflows for the purchase of additional interests in subsidiaries
(18.8)
0.0
Cash flow from financing activities
(223.1)
(310.1)
Exchange-rate related changes in cash and cash equivalents
1.7
(1.2)
Change in cash and cash equivalents
(69.7)
(206.1)
Cash and cash equivalents at the beginning of the period
119.3
254.6
Cash and cash equivalents at the end of the period
49.6
48.5
1 Due to changes in accounting policies and corrections made, certain amounts shown here do not correspond to the figures reported in prior years (for details see Annual
Report 2013, Notes to the consolidated financial statements, Changes in accounting policies/corrections).
Nine Months Report 2014
Condensed Notes to the Consolidated Interim Financial Statements
41
CONDENSED NOTES TO THE CONSOLIDATED
INTERIM FINANCIAL STATEMENTS
1 // GENERAL INFORMATION
The interim financial statements of HUGO BOSS AG as of September 30, 2014, were prepared pursuant to Sec.
37x WpHG [“Wertpapierhandelsgesetz”: Securities Trading Act] in accordance with the International Financial
Reporting Standards (IFRSs) and their interpretations applicable as of the reporting date. The provisions of IAS
34 on interim financial reporting were applied in particular.
This interim management report and the consolidated interim financial statements were neither audited in
accordance with Sec. 317 HGB [“Handelsgesetzbuch”: German Commercial Code] nor reviewed by a person
qualified to audit financial statements. In a resolution dated October 23, 2014, the condensed interim financial
statements and the interim management report were authorized for issue to the Supervisory Board by the
Managing Board. Before they were published, the interim management report and the condensed interim
financial statements were also discussed with the audit committee of the Supervisory Board.
2 // ACCOUNTING POLICIES
All the interim financial statements of the companies included in the consolidated interim financial statements
were prepared in accordance with uniform accounting policies. A detailed description of the accounting policies
and consolidation measures applied can be found in the notes to the 2013 consolidated financial statements. As
of January 1, 2014, the adoption of new or amended IFRSs did not result in any change in the accounting
policies.
CHANGED ACCOUNTING RULES
No significant impact on the basis of consolidation of HUGO BOSS AG and therefore on the nine month report
resulted from the adoption of "IFRS 10 - Consolidated Financial Statements", which became mandatory on
January 1, 2014, and whose principles for the preparation and presentation of consolidated financial statements
replace those of the earlier "IAS 27 – Consolidated and Separate Financial Statements" and "SIC-12 – Consolida-
tion – Special Purpose Entities". Likewise, the first-time adoption of "IFRS 11 – Joint Arrangements", which
replaces "IAS 31 – Interests in Joint Ventures" and "SIC-13 – Jointly Controlled Entities – Non-Monetary Contribu-
tions by Venturers", and of the new "IFRS 12 – Disclosure of Interests in Other Entities" had no significant impact
on the nine-month report. In addition, "IAS 32 – Offsetting Financial Assets and Financial Liabilities" and "IAS 39 –
Novation of OTC derivatives and continuing designation for hedge accounting" were subject to mandatory
application from January 1, 2014. Neither had any impact on the nine month report.
CHANGES IN ACCOUNTING POLICIES/CORRECTIONS
The changes to the accounting policies and corrections described in the 2013 consolidated financial statements
on page 170 et seq. were also taken into account as of September 30, 2014. As of December 31, 2013, the
prior-year figures were adjusted with retroactive effect in accordance with the requirements of IAS 8. This
corrected presentation had the following effects on the income statement for the prior-year period:
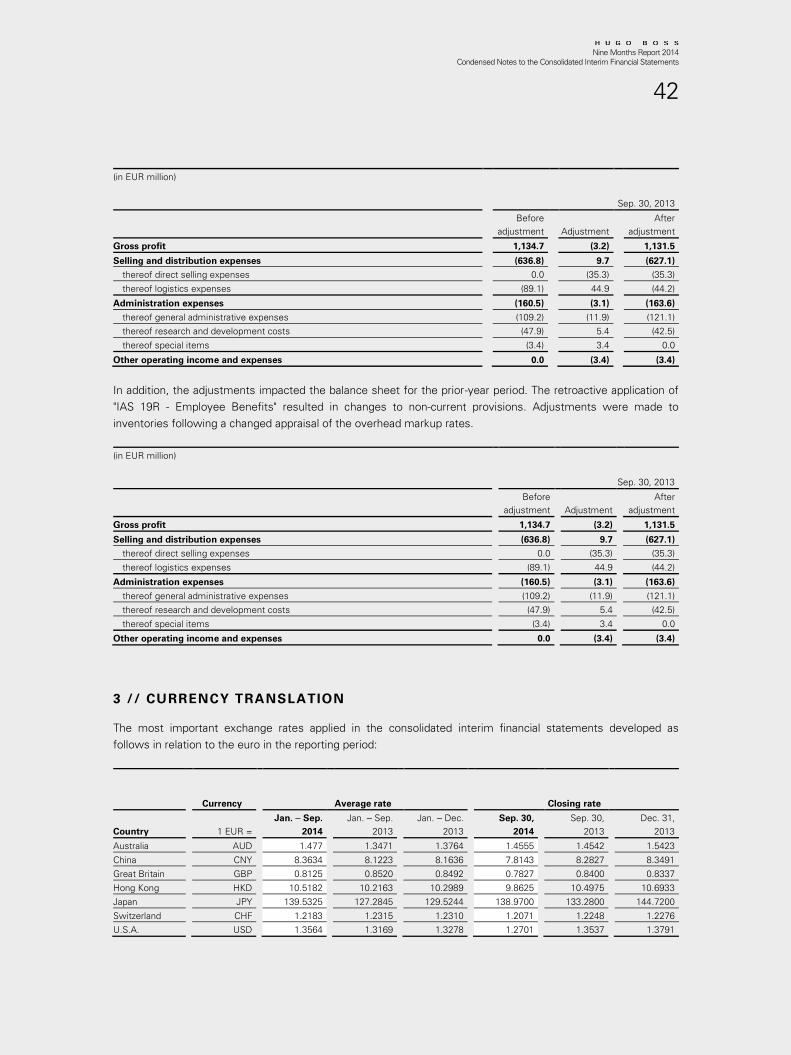
Nine Months Report 2014
Condensed Notes to the Consolidated Interim Financial Statements
42
(in EUR million)
Sep. 30, 2013
Before
adjustment Adjustment
After
adjustment
Gross profit
1,134.7
(3.2)
1,131.5
Selling and distribution expenses
(636.8)
9.7
(627.1)
thereof direct selling expenses
0.0
(35.3)
(35.3)
thereof logistics expenses
(89.1)
44.9
(44.2)
Administration expenses
(160.5)
(3.1)
(163.6)
thereof general administrative expenses
(109.2)
(11.9)
(121.1)
thereof research and development costs
(47.9)
5.4
(42.5)
thereof special items
(3.4)
3.4
0.0
Other operating income and expenses
0.0
(3.4)
(3.4)
In addition, the adjustments impacted the balance sheet for the prior-year period. The retroactive application of
"IAS 19R - Employee Benefits" resulted in changes to non-current provisions. Adjustments were made to
inventories following a changed appraisal of the overhead markup rates.
(in EUR million)
Sep. 30, 2013
Before
adjustment Adjustment
After
adjustment
Gross profit
1,134.7
(3.2)
1,131.5
Selling and distribution expenses
(636.8)
9.7
(627.1)
thereof direct selling expenses
0.0
(35.3)
(35.3)
thereof logistics expenses
(89.1)
44.9
(44.2)
Administration expenses
(160.5)
(3.1)
(163.6)
thereof general administrative expenses
(109.2)
(11.9)
(121.1)
thereof research and development costs
(47.9)
5.4
(42.5)
thereof special items
(3.4)
3.4
0.0
Other operating income and expenses
0.0
(3.4)
(3.4)
3 // CURRENCY TRANSLATION
The most important exchange rates applied in the consolidated interim financial statements developed as
follows in relation to the euro in the reporting period:
Currency
Average rate
Closing rate
Country
1 EUR =
Jan. ‒ Sep.
2014
Jan. ‒ Sep.
2013
Jan. ‒ Dec.
2013
Sep. 30,
2014
Sep. 30,
2013
Dec. 31,
2013
Australia
AUD
1.477
1.3471
1.3764
1.4555
1.4542
1.5423
China
CNY
8.3634
8.1223
8.1636
7.8143
8.2827
8.3491
Great Britain
GBP
0.8125
0.8520
0.8492
0.7827
0.8400
0.8337
Hong Kong
HKD
10.5182
10.2163
10.2989
9.8625
10.4975
10.6933
Japan
JPY
139.5325
127.2845
129.5244
138.9700
133.2800
144.7200
Switzerland
CHF
1.2183
1.2315
1.2310
1.2071
1.2248
1.2276
U.S.A.
USD
1.3564
1.3169
1.3278
1.2701
1.3537
1.3791
Nine Months Report 2014
Condensed Notes to the Consolidated Interim Financial Statements
43
4 // ECONOMIC AND SEASONAL INFLUENCES
As a globally operating company, the HUGO BOSS Group is exposed to a variety of economic developments.
Sector-related seasonal fluctuations are typical for HUGO BOSS. However, its business has changed fundamen-
tally over the past few years. The business, which used to be dominated by the two pre-order seasons
(spring / summer and fall / winter) with early orders placed accordingly, has become increasingly more complex.
Pre-order business now consists of four seasonal pre-sales every year. Furthermore, the importance of seasonal
influence is declining as a result of the global expansion of the Group’s own retail operations. Moreover, HUGO
BOSS is seeking to increase efficiency through greater use of replenishment business to service less fashion-
oriented items. The number of monthly theme-oriented deliveries is also increasing continuously. These factors
are steadily reducing the seasonality of its business.
5 // BASIS OF CONSOLIDATION
In the reporting period from January 1 to September 30, 2014, the number of consolidated companies in
comparison to the consolidated financial statements as of December 31, 2013, rose from 55 to 56.
In the second quarter, HUGO BOSS Finland OY, Finland, was consolidated as a 100% subsidiary for the first
time.
Effective July 4, 2014, the HUGO BOSS Group established a new subsidiary in South Korea, known as HUGO
BOSS Korea Ltd., South Korea, in which it holds 100% of the capital. HUGO BOSS Korea Ltd. was not consoli-
dated as of September 30, 2014, as the Group considers it to be of only immaterial significance.
Companies that may have a significant influence on HUGO BOSS AG in accordance with IAS 28 and are joint
ventures within the meaning of IFRS 11 are included in the consolidated financial statements applying the equity
method. A significant influence is assumed if the company holds between 20% and 50% of the voting rights.
The shares in Distributionszentrum Vermietungsgesellschaft mbH & Co. Objekt HUGO BOSS Filderstadt KG and
GRETANA Grundstücks-Vermietungsgesellschaft mbH & Co. Objekt D19 KG, which are measured at equity, are
included in other financial assets.
6 // BUSINESS COMBINATIONS
In the first nine months of 2013, the HUGO BOSS Group had taken over a total of ten stores and the related
assets and inventories under asset deals with former franchise partners in Australia, the United States and
Singapore. The acquisitions were based on provisional purchase price allocations as not all of the information
needed to account for them in full was available in 2013. Following the finalization of the purchase price
allocations in the first nine months of 2014, there was an insignificant reclassification within intangible assets.
The finalization of the purchase price allocations had only an insignificant effect on the HUGO BOSS Group's net
assets, financial position and earnings in the first nine months of 2014 and the comparable period in 2013.
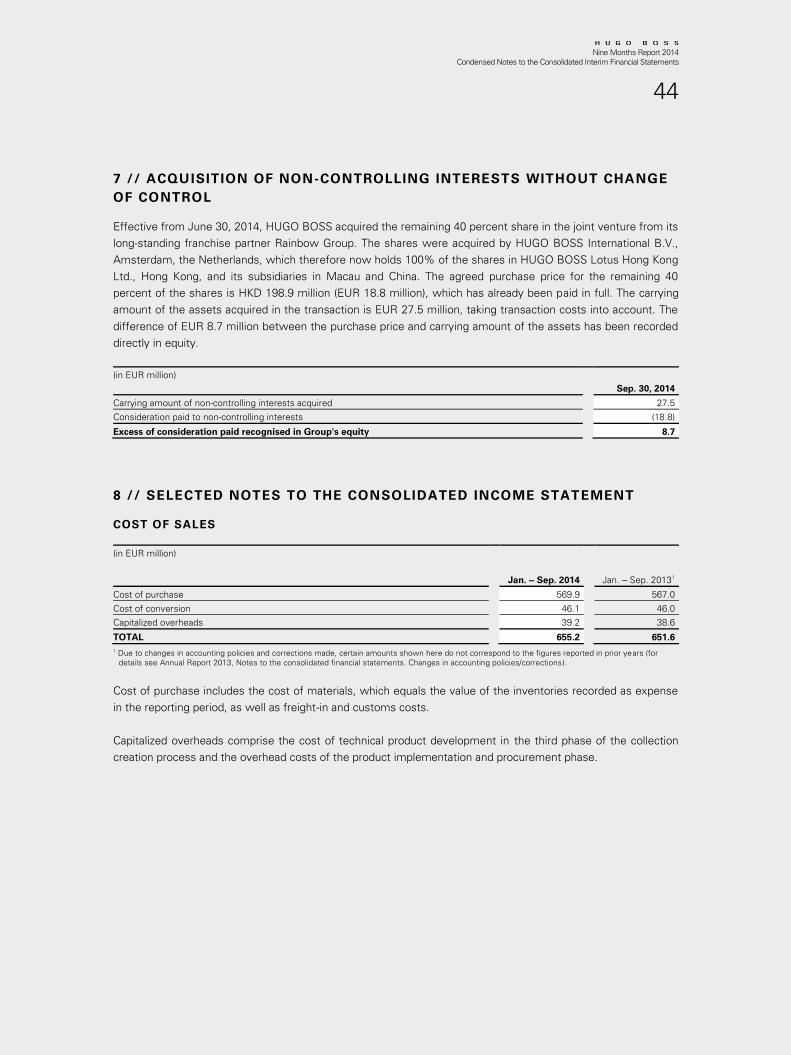
Nine Months Report 2014
Condensed Notes to the Consolidated Interim Financial Statements
44
7 // ACQUISITION OF NON-CONTROLLING INTERESTS WITHOUT CHANGE
OF CONTROL
Effective from June 30, 2014, HUGO BOSS acquired the remaining 40 percent share in the joint venture from its
long-standing franchise partner Rainbow Group. The shares were acquired by HUGO BOSS International B.V.,
Amsterdam, the Netherlands, which therefore now holds 100% of the shares in HUGO BOSS Lotus Hong Kong
Ltd., Hong Kong, and its subsidiaries in Macau and China. The agreed purchase price for the remaining 40
percent of the shares is HKD 198.9 million (EUR 18.8 million), which has already been paid in full. The carrying
amount of the assets acquired in the transaction is EUR 27.5 million, taking transaction costs into account. The
difference of EUR 8.7 million between the purchase price and carrying amount of the assets has been recorded
directly in equity.
(in EUR million)
Sep. 30, 2014
Carrying amount of non-controlling interests acquired
27.5
Consideration paid to non-controlling interests
(18.8)
Excess of consideration paid recognised in Group's equity
8.7
8 // SELECTED NOTES TO THE CONSOLIDATED INCOME STATEMENT
COST OF SALES
(in EUR million)
Jan. ‒ Sep. 2014
Jan. ‒ Sep. 2013
1
Cost of purchase
569.9
567.0
Cost of conversion
46.1
46.0
Capitalized overheads
39.2
38.6
TOTAL
655.2
651.6
1 Due to changes in accounting policies and corrections made, certain amounts shown here do not correspond to the figures reported in prior years (for
details see Annual Report 2013, Notes to the consolidated financial statements. Changes in accounting policies/corrections).
Cost of purchase includes the cost of materials, which equals the value of the inventories recorded as expense
in the reporting period, as well as freight-in and customs costs.
Capitalized overheads comprise the cost of technical product development in the third phase of the collection
creation process and the overhead costs of the product implementation and procurement phase.
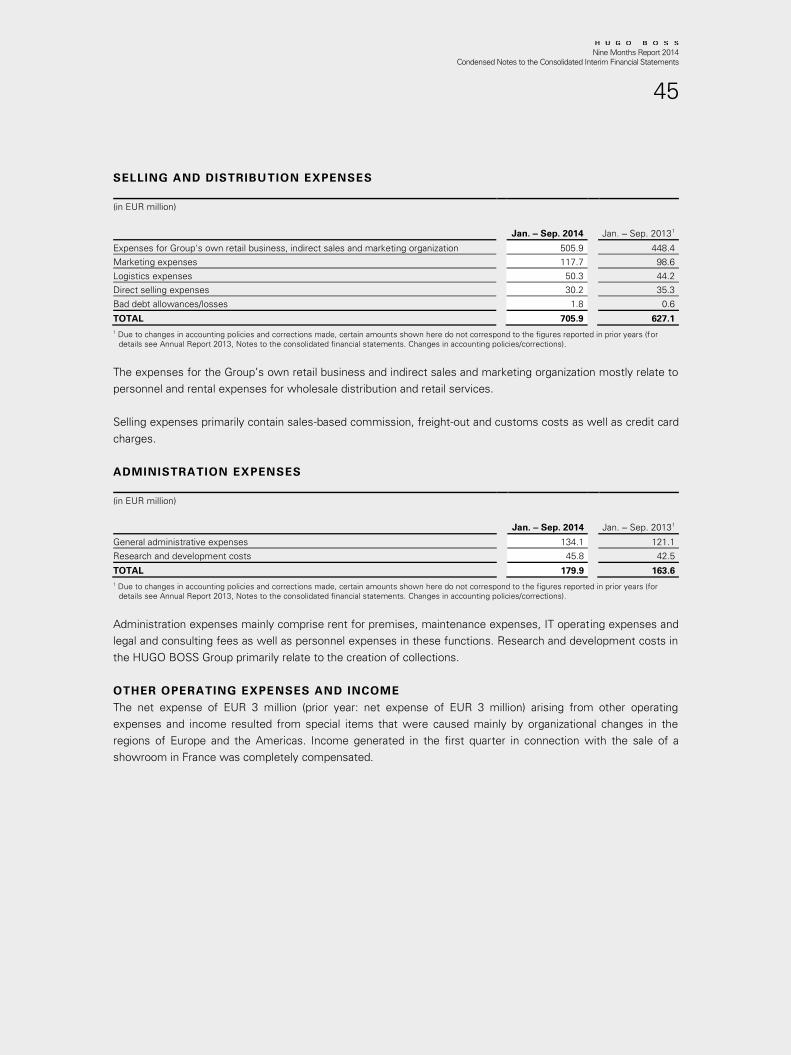
Nine Months Report 2014
Condensed Notes to the Consolidated Interim Financial Statements
45
SELLING AND DISTRIBUTION EXPENSES
(in EUR million)
Jan. ‒ Sep. 2014
Jan. ‒ Sep. 2013
1
Expenses for Group's own retail business, indirect sales and marketing organization
505.9
448.4
Marketing expenses
117.7
98.6
Logistics expenses
50.3
44.2
Direct selling expenses
30.2
35.3
Bad debt allowances/losses
1.8
0.6
TOTAL
705.9
627.1
1 Due to changes in accounting policies and corrections made, certain amounts shown here do not correspond to the figures reported in prior years (for
details see Annual Report 2013, Notes to the consolidated financial statements. Changes in accounting policies/corrections).
The expenses for the Group’s own retail business and indirect sales and marketing organization mostly relate to
personnel and rental expenses for wholesale distribution and retail services.
Selling expenses primarily contain sales-based commission, freight-out and customs costs as well as credit card
charges.
ADMINISTRATION EXPENSES
(in EUR million)
Jan. ‒ Sep. 2014
Jan. ‒ Sep. 2013
1
General administrative expenses
134.1
121.1
Research and development costs
45.8
42.5
TOTAL
179.9
163.6
1 Due to changes in accounting policies and corrections made, certain amounts shown here do not correspond to the figures reported in prior years (for
details see Annual Report 2013, Notes to the consolidated financial statements. Changes in accounting policies/corrections).
Administration expenses mainly comprise rent for premises, maintenance expenses, IT operating expenses and
legal and consulting fees as well as personnel expenses in these functions. Research and development costs in
the HUGO BOSS Group primarily relate to the creation of collections.
OTHER OPERATING EXPENSES AND INCOME
The net expense of EUR 3 million (prior year: net expense of EUR 3 million) arising from other operating
expenses and income resulted from special items that were caused mainly by organizational changes in the
regions of Europe and the Americas. Income generated in the first quarter in connection with the sale of a
showroom in France was completely compensated.
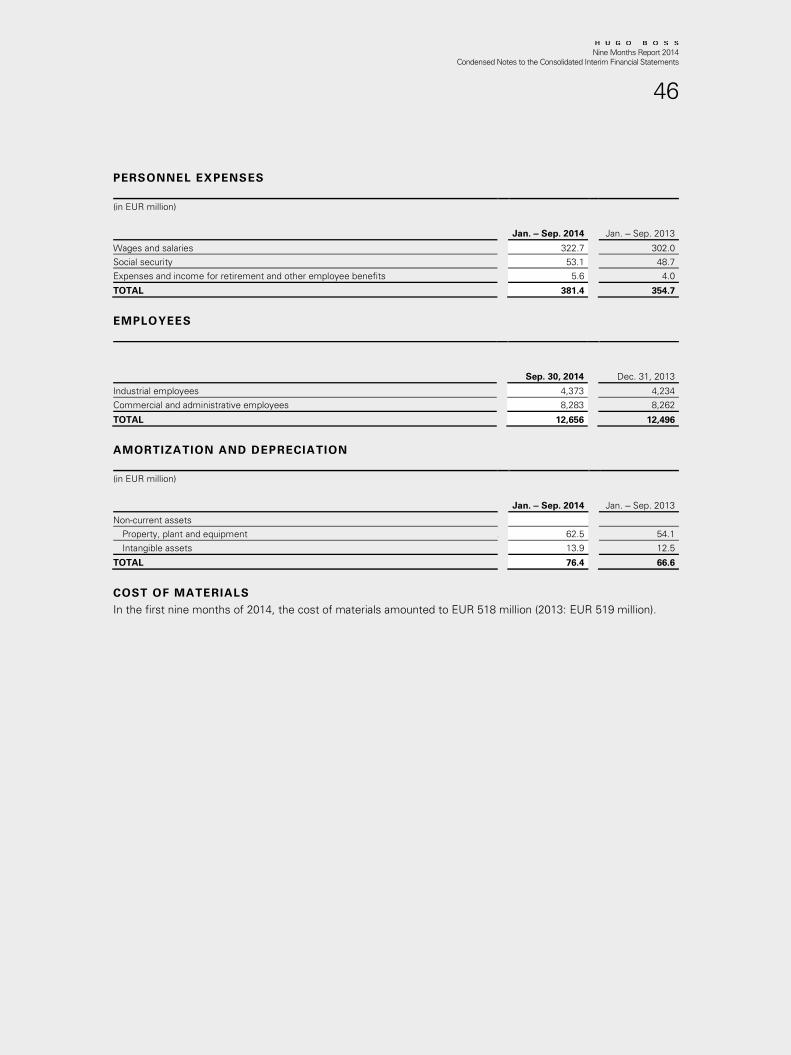
Nine Months Report 2014
Condensed Notes to the Consolidated Interim Financial Statements
46
PERSONNEL EXPENSES
(in EUR million)
Jan. ‒ Sep. 2014
Jan. ‒ Sep. 2013
Wages and salaries
322.7
302.0
Social security
53.1
48.7
Expenses and income for retirement and other employee benefits
5.6
4.0
TOTAL
381.4
354.7
EMPLOYEES
Sep. 30, 2014
Dec. 31, 2013
Industrial employees
4,373
4,234
Commercial and administrative employees
8,283
8,262
TOTAL
12,656
12,496
AMORTIZATION AND DEPRECIATION
(in EUR million)
Jan. ‒ Sep. 2014
Jan. ‒ Sep. 2013
Non-current assets
Property, plant and equipment a 62.5
54.1
Intangible assets
13.9
12.5
TOTAL
76.4
66.6
COST OF MATERIALS
In the first nine months of 2014, the cost of materials amounted to EUR 518 million (2013: EUR 519 million).
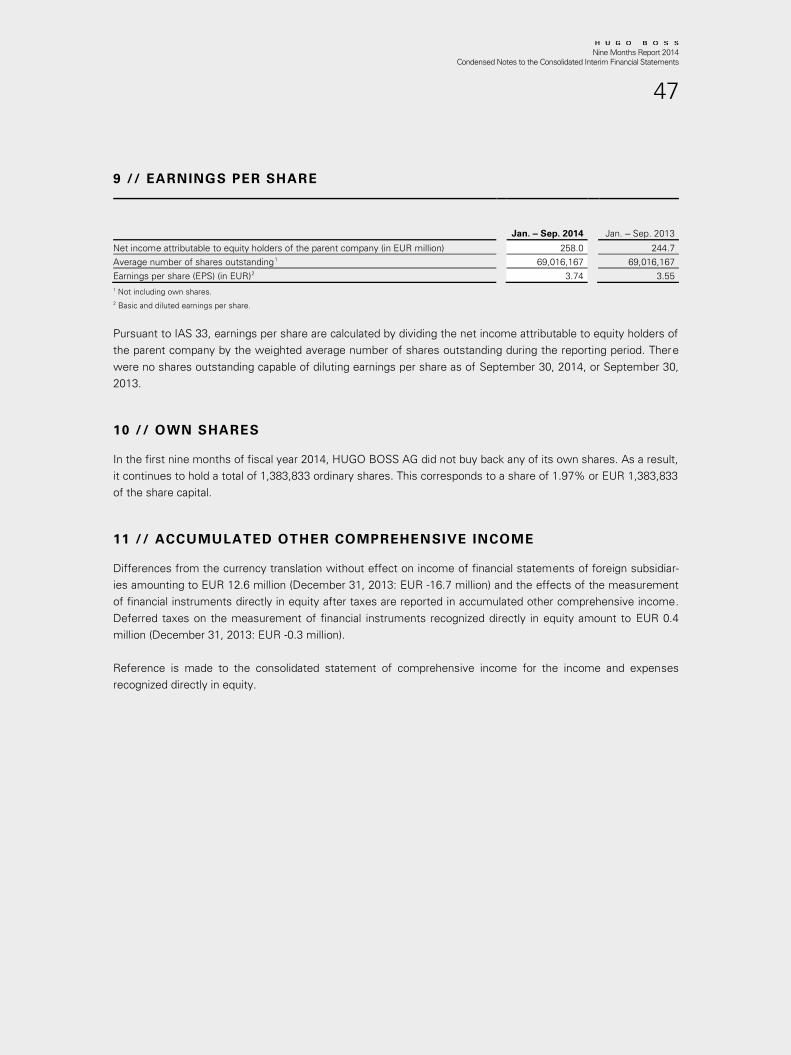
Nine Months Report 2014
Condensed Notes to the Consolidated Interim Financial Statements
47
9 // EARNINGS PER SHARE
Jan. ‒ Sep. 2014
Jan. ‒ Sep. 2013
Net income attributable to equity holders of the parent company (in EUR million)
258.0
244.7
Average number of shares outstanding
1
69,016,167
69,016,167
Earnings per share (EPS) (in EUR)
2
3.74
3.55
1 Not including own shares.
2 Basic and diluted earnings per share.
Pursuant to IAS 33, earnings per share are calculated by dividing the net income attributable to equity holders of
the parent company by the weighted average number of shares outstanding during the reporting period. There
were no shares outstanding capable of diluting earnings per share as of September 30, 2014, or September 30,
2013.
10 // OWN SHARES
In the first nine months of fiscal year 2014, HUGO BOSS AG did not buy back any of its own shares. As a result,
it continues to hold a total of 1,383,833 ordinary shares. This corresponds to a share of 1.97% or EUR 1,383,833
of the share capital.
11 // ACCUMULATED OTHER COMPREHENSIVE INCOME
Differences from the currency translation without effect on income of financial statements of foreign subsidiar-
ies amounting to EUR 12.6 million (December 31, 2013: EUR -16.7 million) and the effects of the measurement
of financial instruments directly in equity after taxes are reported in accumulated other comprehensive income.
Deferred taxes on the measurement of financial instruments recognized directly in equity amount to EUR 0.4
million (December 31, 2013: EUR -0.3 million).
Reference is made to the consolidated statement of comprehensive income for the income and expenses
recognized directly in equity.
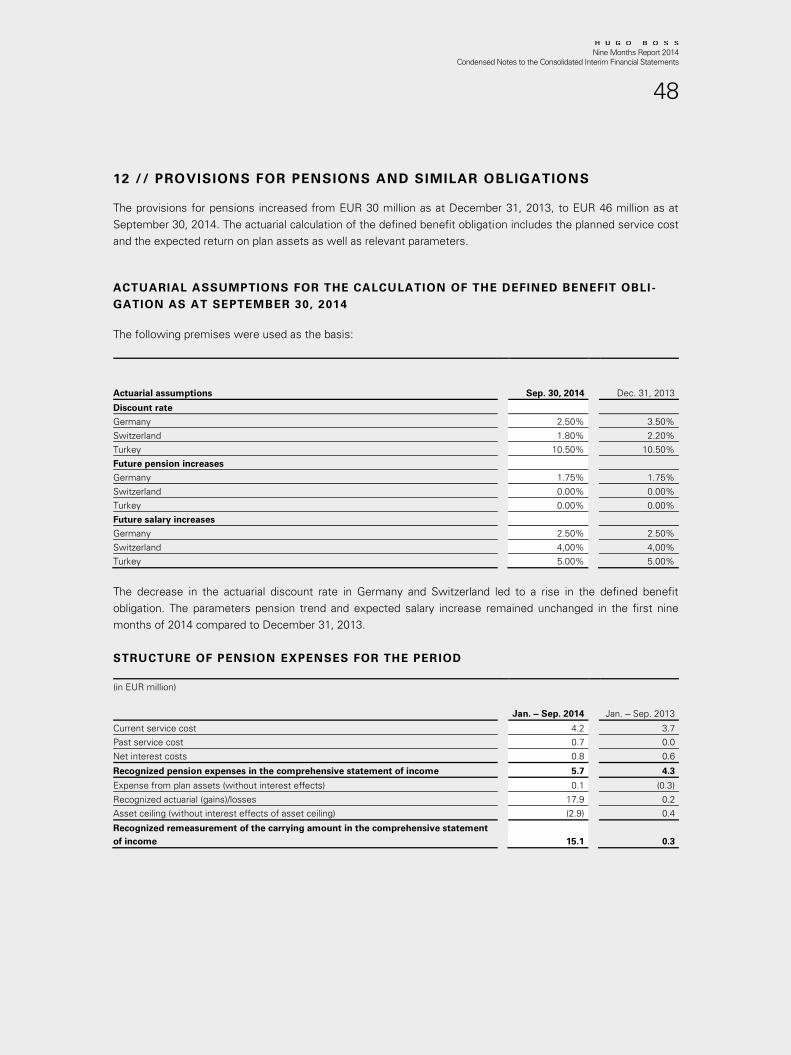
Nine Months Report 2014
Condensed Notes to the Consolidated Interim Financial Statements
48
12 // PROVISIONS FOR PENSIONS AND SIMILAR OBLIGATIONS
The provisions for pensions increased from EUR 30 million as at December 31, 2013, to EUR 46 million as at
September 30, 2014. The actuarial calculation of the defined benefit obligation includes the planned service cost
and the expected return on plan assets as well as relevant parameters.
ACTUARIAL ASSUMPTIONS FOR THE CALCULATION OF THE DEFINED BENEFIT OBLI -
GATION AS AT SEPTEMBER 30, 2014
The following premises were used as the basis:
Actuarial assumptions
Sep. 30, 2014
Dec. 31, 2013
Discount rate
Germany
2.50%
3.50%
Switzerland
1.80%
2.20%
Turkey
10.50%
10.50%
Future pension increases
Germany
1.75%
1.75%
Switzerland
0.00%
0.00%
Turkey
0.00%
0.00%
Future salary increases
Germany
2.50%
2.50%
Switzerland
4,00%
4,00%
Turkey
5.00%
5.00%
The decrease in the actuarial discount rate in Germany and Switzerland led to a rise in the defined benefit
obligation. The parameters pension trend and expected salary increase remained unchanged in the first nine
months of 2014 compared to December 31, 2013.
STRUCTURE OF PENSION EXPENSES FOR THE PERIOD
(in EUR million)
Jan. ‒ Sep. 2014
Jan. ‒ Sep. 2013
Current service cost
4.2
3.7
Past service cost
0.7
0.0
Net interest costs
0.8
0.6
Recognized pension expenses in the comprehensive statement of income
5.7
4.3
Expense from plan assets (without interest effects)
0.1
(0.3)
Recognized actuarial (gains)/losses
17.9
0.2
Asset ceiling (without interest effects of asset ceiling)
(2.9)
0.4
Recognized remeasurement of the carrying amount in the comprehensive statement
of income
15.1
0.3
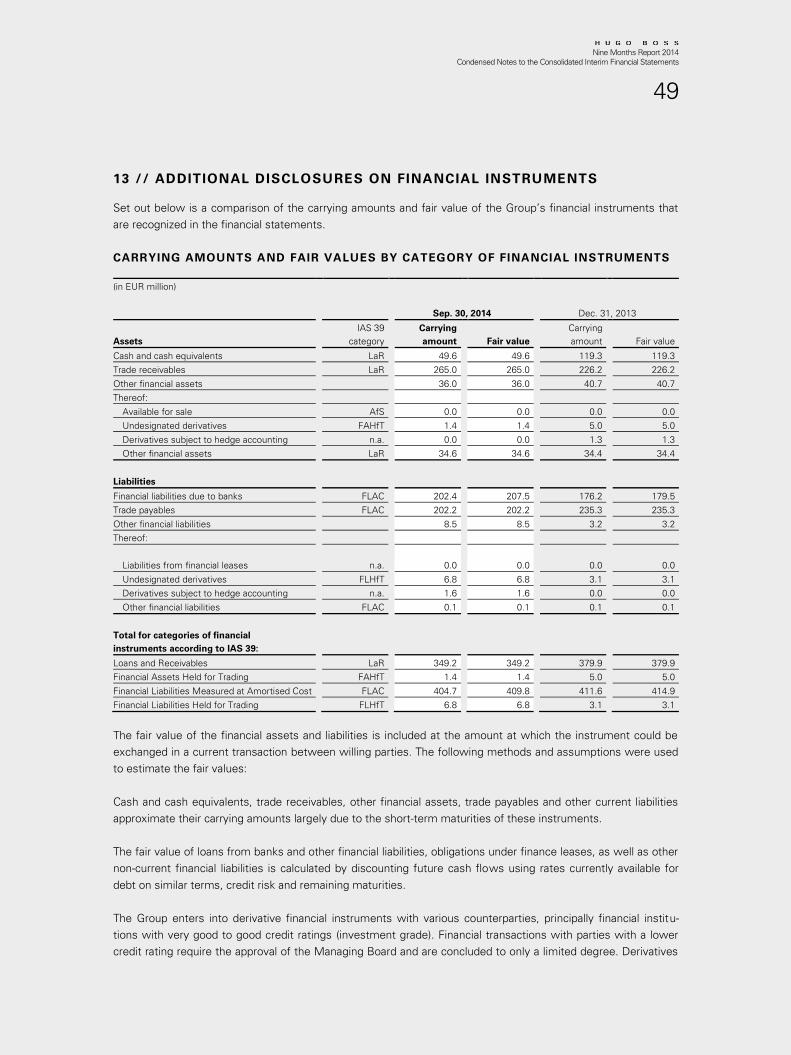
Nine Months Report 2014
Condensed Notes to the Consolidated Interim Financial Statements
49
13 // ADDITIONAL DISCLOSURES ON FINANCIAL INSTRUMENTS
Set out below is a comparison of the carrying amounts and fair value of the Group’s financial instruments that
are recognized in the financial statements.
CARRYING AMOUNTS AND FAIR VALUES BY CATEGORY OF FINANCIAL INSTRUMENTS
(in EUR million)
Sep. 30, 2014
Dec. 31, 2013
Assets
IAS 39
category
Carrying
amount Fair value
Carrying
amount Fair value
Cash and cash equivalents
LaR
49.6
49.6
119.3
119.3
Trade receivables
LaR
265.0
265.0
226.2
226.2
Other financial assets
36.0
36.0
40.7
40.7
Thereof:
Available for sale
AfS
0.0
0.0
0.0
0.0
Undesignated derivatives
FAHfT
1.4
1.4
5.0
5.0
Derivatives subject to hedge accounting
n.a.
0.0
0.0
1.3
1.3
Other financial assets
LaR
34.6
34.6
34.4
34.4
Liabilities
Financial liabilities due to banks
FLAC
202.4
207.5
176.2
179.5
Trade payables
FLAC
202.2
202.2
235.3
235.3
Other financial liabilities
8.5
8.5
3.2
3.2
Thereof:
Liabilities from financial leases
n.a.
0.0
0.0
0.0
0.0
Undesignated derivatives
FLHfT
6.8
6.8
3.1
3.1
Derivatives subject to hedge accounting
n.a.
1.6
1.6
0.0
0.0
Other financial liabilities
FLAC
0.1
0.1
0.1
0.1
Total for categories of financial
instruments according to IAS 39:
Loans and Receivables
LaR
349.2
349.2
379.9
379.9
Financial Assets Held for Trading
FAHfT
1.4
1.4
5.0
5.0
Financial Liabilities Measured at Amortised Cost
FLAC
404.7
409.8
411.6
414.9
Financial Liabilities Held for Trading
FLHfT
6.8
6.8
3.1
3.1
The fair value of the financial assets and liabilities is included at the amount at which the instrument could be
exchanged in a current transaction between willing parties. The following methods and assumptions were used
to estimate the fair values:
Cash and cash equivalents, trade receivables, other financial assets, trade payables and other current liabilities
approximate their carrying amounts largely due to the short-term maturities of these instruments.
The fair value of loans from banks and other financial liabilities, obligations under finance leases, as well as other
non-current financial liabilities is calculated by discounting future cash flows using rates currently available for
debt on similar terms, credit risk and remaining maturities.
The Group enters into derivative financial instruments with various counterparties, principally financial institu-
tions with very good to good credit ratings (investment grade). Financial transactions with parties with a lower
credit rating require the approval of the Managing Board and are concluded to only a limited degree. Derivatives
Nine Months Report 2014
Condensed Notes to the Consolidated Interim Financial Statements
50
valued using valuation techniques with observable market data are mainly interest rate swaps and forward
exchange contracts. The most frequently applied techniques include forward pricing and swap models, using
present value calculations. The models incorporate various inputs including the credit worthiness of counterpar-
ties, foreign exchange spot and forward rates, interest rate curves and forward rate curves of the underlying
base rates.
As of September 30, 2014, the marked to market value of derivative asset positions is net of a credit valuation
adjustment attributable to derivative counterparty default risk. The credit risk of the counterparty did not lead to
any significant effects.
FAIR VALUE HIERARCHY
The Group uses the following hierarchy for determining and disclosing the fair value of financial instruments by
valuation technique:
Level 1: Quoted (unadjusted) prices in active markets for identical assets or liabilities
Level 2: Other methods for which all inputs which have a significant effect on the recorded fair value are
observable, either directly or indirectly
Level 3: Methods that use inputs with a significant effect on the recorded fair value that are not based on
observable market data
As in the prior year, all financial instruments measured at fair value in the categories FAHfT, FLHfT and deriva-
tives designated to a hedge relationship were assigned to level 2 as of September 30, 2014. During the first nine
months of fiscal year 2014, there were no transfers between level 1 and level 2 or from level 3. The financial
instruments measured at fair value comprised forward exchange contracts, currency swaps and interest
derivatives. These were assigned to the categories FAHfT, FLHfT as well as derivatives used for hedging. The
assets amounted to EUR 1.4 million and the liabilities to EUR 6.8 million. The fair value of financial instruments
carried at amortized cost is also measured using the level 2 method.
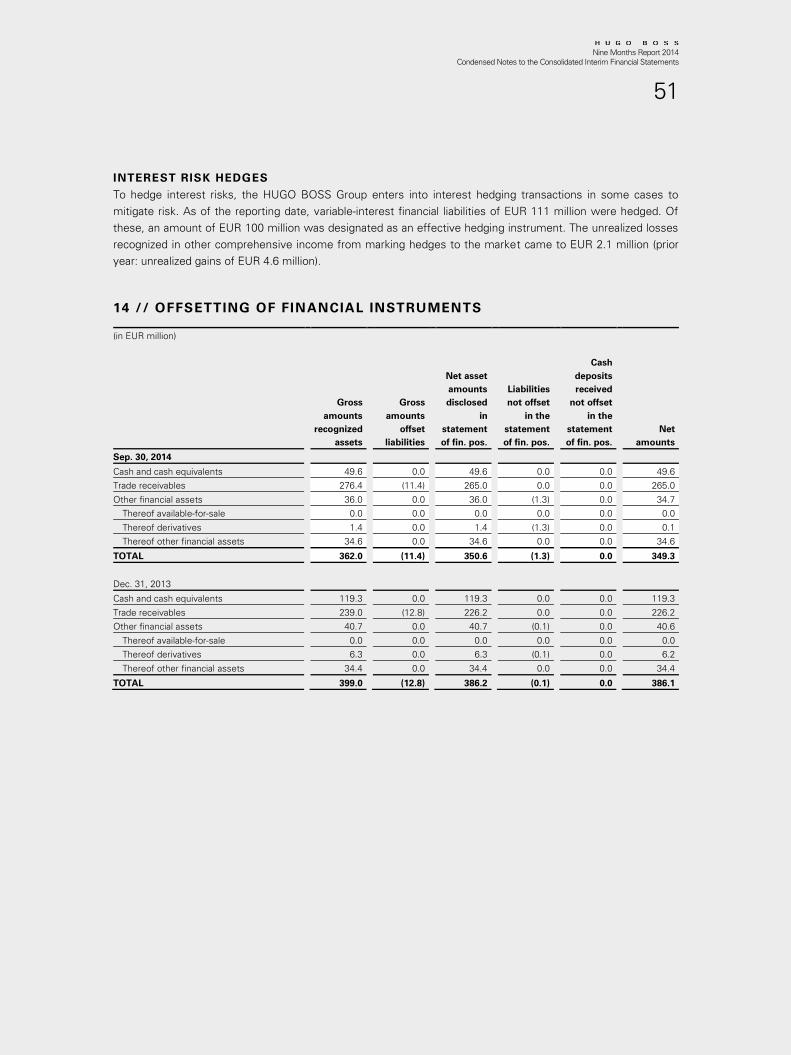
Nine Months Report 2014
Condensed Notes to the Consolidated Interim Financial Statements
51
INTEREST RISK HEDGES
To hedge interest risks, the HUGO BOSS Group enters into interest hedging transactions in some cases to
mitigate risk. As of the reporting date, variable-interest financial liabilities of EUR 111 million were hedged. Of
these, an amount of EUR 100 million was designated as an effective hedging instrument. The unrealized losses
recognized in other comprehensive income from marking hedges to the market came to EUR 2.1 million (prior
year: unrealized gains of EUR 4.6 million).
14 // OFFSETTING OF FINANCIAL INSTRUMENTS
(in EUR million)
Gross
amounts
recognized
assets
Gross
amounts
offset
liabilities
Net asset
amounts
disclosed
in
statement
of fin. pos.
Liabilities
not offset
in the
statement
of fin. pos.
Cash
deposits
received
not offset
in the
statement
of fin. pos.
Net
amounts
Sep. 30, 2014
Cash and cash equivalents
49.6
0.0
49.6
0.0
0.0
49.6
Trade receivables
276.4
(11.4)
265.0
0.0
0.0
265.0
Other financial assets
36.0
0.0
36.0
(1.3)
0.0
34.7
Thereof available-for-sale
0.0
0.0
0.0
0.0
0.0
0.0
Thereof derivatives
1.4
0.0
1.4
(1.3)
0.0
0.1
Thereof other financial assets
34.6
0.0
34.6
0.0
0.0
34.6
TOTAL
362.0
(11.4)
350.6
(1.3)
0.0
349.3
Dec. 31, 2013
Cash and cash equivalents
119.3
0.0
119.3
0.0
0.0
119.3
Trade receivables
239.0
(12.8)
226.2
0.0
0.0
226.2
Other financial assets
40.7
0.0
40.7
(0.1)
0.0
40.6
Thereof available-for-sale
0.0
0.0
0.0
0.0
0.0
0.0
Thereof derivatives
6.3
0.0
6.3
(0.1)
0.0
6.2
Thereof other financial assets
34.4
0.0
34.4
0.0
0.0
34.4
TOTAL
399.0
(12.8)
386.2
(0.1)
0.0
386.1
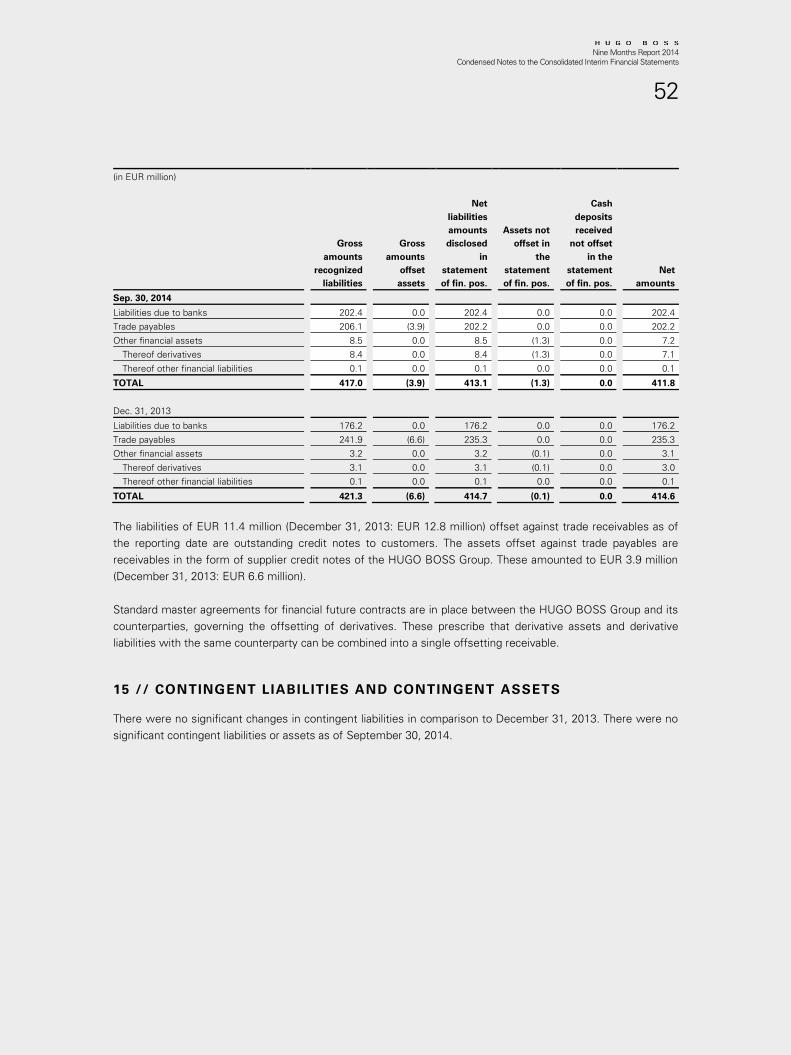
Nine Months Report 2014
Condensed Notes to the Consolidated Interim Financial Statements
52
(in EUR million)
Gross
amounts
recognized
liabilities
Gross
amounts
offset
assets
Net
liabilities
amounts
disclosed
in
statement
of fin. pos.
Assets not
offset in
the
statement
of fin. pos.
Cash
deposits
received
not offset
in the
statement
of fin. pos.
Net
amounts
Sep. 30, 2014
Liabilities due to banks
202.4
0.0
202.4
0.0
0.0
202.4
Trade payables
206.1
(3.9)
202.2
0.0
0.0
202.2
Other financial assets
8.5
0.0
8.5
(1.3)
0.0
7.2
Thereof derivatives
8.4
0.0
8.4
(1.3)
0.0
7.1
Thereof other financial liabilities
0.1
0.0
0.1
0.0
0.0
0.1
TOTAL
417.0
(3.9)
413.1
(1.3)
0.0
411.8
Dec. 31, 2013
Liabilities due to banks
176.2
0.0
176.2
0.0
0.0
176.2
Trade payables
241.9
(6.6)
235.3
0.0
0.0
235.3
Other financial assets
3.2
0.0
3.2
(0.1)
0.0
3.1
Thereof derivatives
3.1
0.0
3.1
(0.1)
0.0
3.0
Thereof other financial liabilities
0.1
0.0
0.1
0.0
0.0
0.1
TOTAL
421.3
(6.6)
414.7
(0.1)
0.0
414.6
The liabilities of EUR 11.4 million (December 31, 2013: EUR 12.8 million) offset against trade receivables as of
the reporting date are outstanding credit notes to customers. The assets offset against trade payables are
receivables in the form of supplier credit notes of the HUGO BOSS Group. These amounted to EUR 3.9 million
(December 31, 2013: EUR 6.6 million).
Standard master agreements for financial future contracts are in place between the HUGO BOSS Group and its
counterparties, governing the offsetting of derivatives. These prescribe that derivative assets and derivative
liabilities with the same counterparty can be combined into a single offsetting receivable.
15 // CONTINGENT LIABILITIES AND CONTINGENT ASSETS
There were no significant changes in contingent liabilities in comparison to December 31, 2013. There were no
significant contingent liabilities or assets as of September 30, 2014.
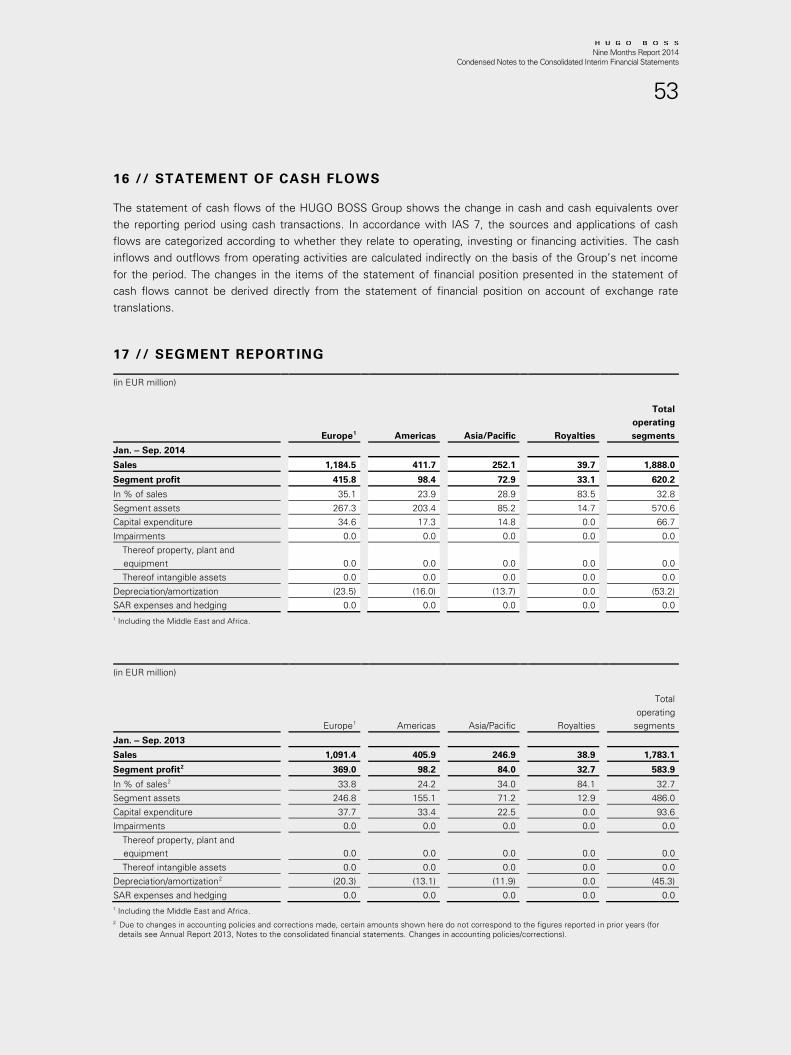
Nine Months Report 2014
Condensed Notes to the Consolidated Interim Financial Statements
53
16 // STATEMENT OF CASH FLOWS
The statement of cash flows of the HUGO BOSS Group shows the change in cash and cash equivalents over
the reporting period using cash transactions. In accordance with IAS 7, the sources and applications of cash
flows are categorized according to whether they relate to operating, investing or financing activities. The cash
inflows and outflows from operating activities are calculated indirectly on the basis of the Group’s net income
for the period. The changes in the items of the statement of financial position presented in the statement of
cash flows cannot be derived directly from the statement of financial position on account of exchange rate
translations.
17 // SEGMENT REPORTING
(in EUR million)
Europe
1
Americas
Asia/Pacific
Royalties
Total
operating
segments
Jan. ‒ Sep. 2014
Sales
1,184.5
411.7
252.1
39.7
1,888.0
Segment profit
415.8
98.4
72.9
33.1
620.2
In % of sales
35.1
23.9
28.9
83.5
32.8
Segment assets
267.3
203.4
85.2
14.7
570.6
Capital expenditure
34.6
17.3
14.8
0.0
66.7
Impairments
0.0
0.0
0.0
0.0
0.0
Thereof property, plant and
equipment
0.0
0.0
0.0
0.0
0.0
Thereof intangible assets
0.0
0.0
0.0
0.0
0.0
Depreciation/amortization
(23.5)
(16.0)
(13.7)
0.0
(53.2)
SAR expenses and hedging
0.0
0.0
0.0
0.0
0.0
1 Including the Middle East and Africa.
(in EUR million)
Europe
1
Americas
Asia/Pacific
Royalties
Total
operating
segments
Jan. ‒ Sep. 2013
Sales
1,091.4
405.9
246.9
38.9
1,783.1
Segment profit
2
369.0
98.2
84.0
32.7
583.9
In % of sales
2
33.8
24.2
34.0
84.1
32.7
Segment assets
246.8
155.1
71.2
12.9
486.0
Capital expenditure
37.7
33.4
22.5
0.0
93.6
Impairments
0.0
0.0
0.0
0.0
0.0
Thereof property, plant and
equipment
0.0
0.0
0.0
0.0
0.0
Thereof intangible assets
0.0
0.0
0.0
0.0
0.0
Depreciation/amortization
2
(20.3)
(13.1)
(11.9)
0.0
(45.3)
SAR expenses and hedging
0.0
0.0
0.0
0.0
0.0
1 Including the Middle East and Africa.
2 Due to changes in accounting policies and corrections made, certain amounts shown here do not correspond to the figures reported in prior years (for
details see Annual Report 2013, Notes to the consolidated financial statements. Changes in accounting policies/corrections).
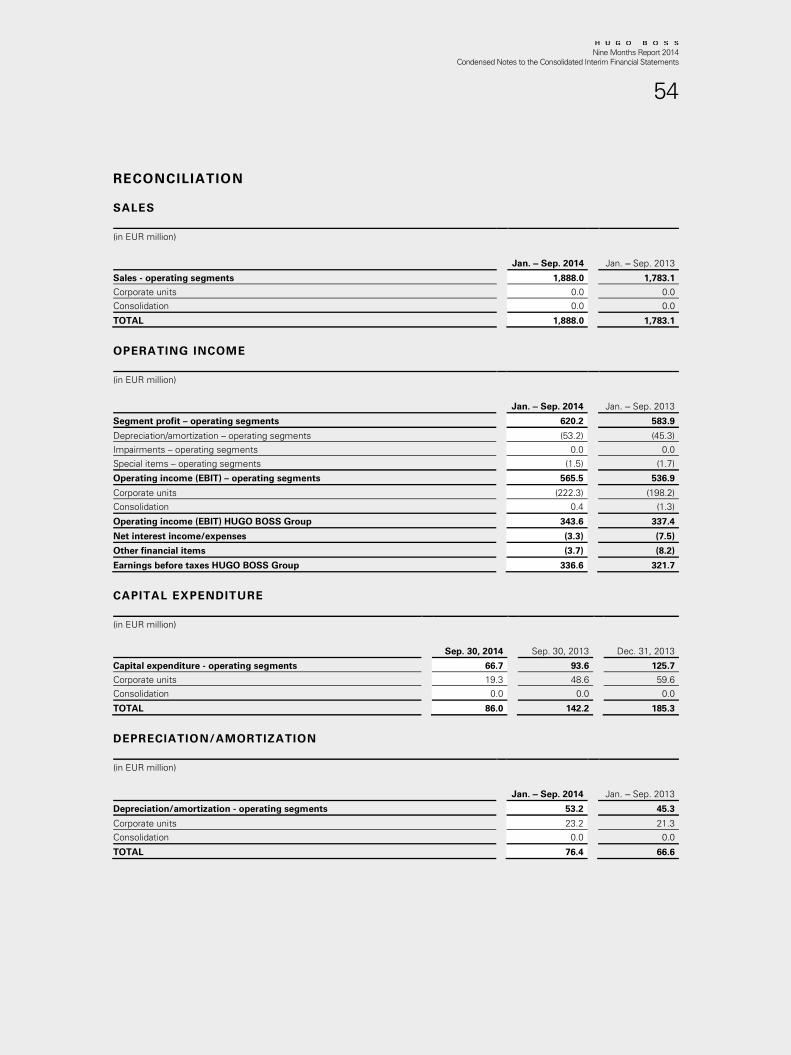
Nine Months Report 2014
Condensed Notes to the Consolidated Interim Financial Statements
54
RECONCILIATION
SALES
(in EUR million)
Jan. ‒ Sep. 2014
Jan. ‒ Sep. 2013
Sales - operating segments
1,888.0
1,783.1
Corporate units
0.0
0.0
Consolidation
0.0
0.0
TOTAL
1,888.0
1,783.1
OPERATING INCOME
(in EUR million)
Jan. ‒ Sep. 2014
Jan. ‒ Sep. 2013
Segment profit – operating segments
620.2
583.9
Depreciation/amortization – operating segments
(53.2)
(45.3)
Impairments – operating segments
0.0
0.0
Special items – operating segments
(1.5)
(1.7)
Operating income (EBIT) – operating segments
565.5
536.9
Corporate units
(222.3)
(198.2)
Consolidation
0.4
(1.3)
Operating income (EBIT) HUGO BOSS Group
343.6
337.4
Net interest income/expenses
(3.3)
(7.5)
Other financial items
(3.7)
(8.2)
Earnings before taxes HUGO BOSS Group
336.6
321.7
CAPITAL EXPENDITURE
(in EUR million)
Sep. 30, 2014
Sep. 30, 2013
Dec. 31, 2013
Capital expenditure - operating segments
66.7
93.6
125.7
Corporate units
19.3
48.6
59.6
Consolidation
0.0
0.0
0.0
TOTAL
86.0
142.2
185.3
DEPRECIATION/AMORTIZATION
(in EUR million)
Jan. ‒ Sep. 2014
Jan. ‒ Sep. 2013
Depreciation/amortization - operating segments
53.2
45.3
Corporate units
23.2
21.3
Consolidation
0.0
0.0
TOTAL
76.4
66.6
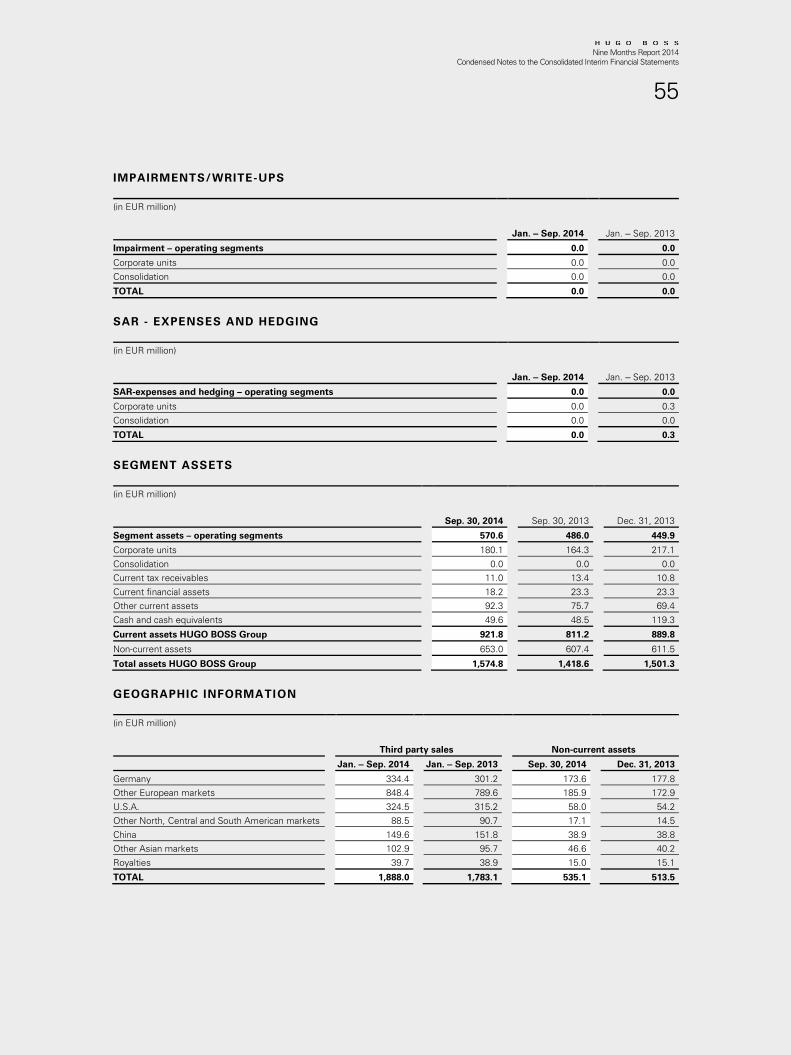
Nine Months Report 2014
Condensed Notes to the Consolidated Interim Financial Statements
55
IMPAIRMENTS/WRITE-UPS
(in EUR million)
Jan. ‒ Sep. 2014
Jan. ‒ Sep. 2013
Impairment – operating segments
0.0
0.0
Corporate units
0.0
0.0
Consolidation
0.0
0.0
TOTAL
0.0
0.0
SAR - EXPENSES AND HEDGING
(in EUR million)
Jan. ‒ Sep. 2014
Jan. ‒ Sep. 2013
SAR-expenses and hedging – operating segments
0.0
0.0
Corporate units
0.0
0.3
Consolidation
0.0
0.0
TOTAL
0.0
0.3
SEGMENT ASSETS
(in EUR million)
Sep. 30, 2014
Sep. 30, 2013
Dec. 31, 2013
Segment assets – operating segments
570.6
486.0
449.9
Corporate units
180.1
164.3
217.1
Consolidation
0.0
0.0
0.0
Current tax receivables
11.0
13.4
10.8
Current financial assets
18.2
23.3
23.3
Other current assets
92.3
75.7
69.4
Cash and cash equivalents
49.6
48.5
119.3
Current assets HUGO BOSS Group
921.8
811.2
889.8
Non-current assets
653.0
607.4
611.5
Total assets HUGO BOSS Group
1,574.8
1,418.6
1,501.3
GEOGRAPHIC INFORMATION
(in EUR million)
Third party sales
Non-current assets
Jan. ‒ Sep. 2014 Jan. ‒ Sep. 2013
Sep. 30, 2014 Dec. 31, 2013
Germany
334.4
301.2
173.6
177.8
Other European markets
848.4
789.6
185.9
172.9
U.S.A.
324.5
315.2
58.0
54.2
Other North, Central and South American markets
88.5
90.7
17.1
14.5
China
149.6
151.8
38.9
38.8
Other Asian markets
102.9
95.7
46.6
40.2
Royalties
39.7
38.9
15.0
15.1
TOTAL
1,888.0
1,783.1
535.1
513.5
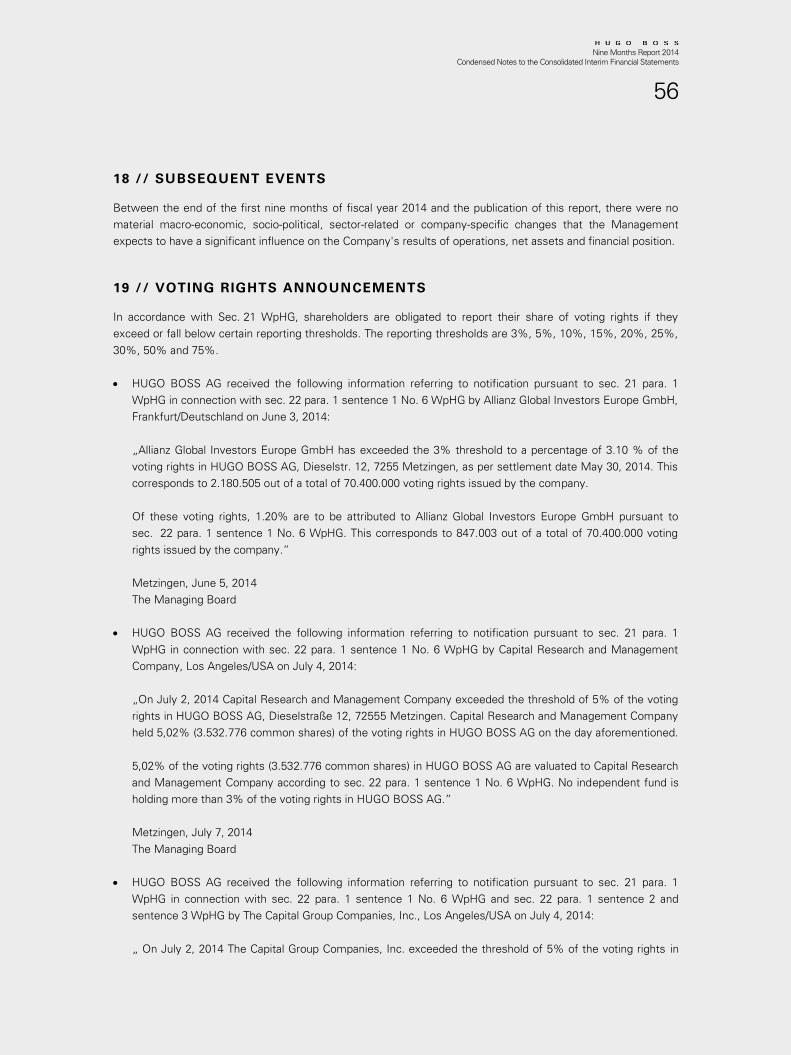
Nine Months Report 2014
Condensed Notes to the Consolidated Interim Financial Statements
56
18 // SUBSEQUENT EVENTS
Between the end of the first nine months of fiscal year 2014 and the publication of this report, there were no
material macro-economic, socio-political, sector-related or company-specific changes that the Management
expects to have a significant influence on the Company's results of operations, net assets and financial position.
19 // VOTING RIGHTS ANNOUNCEMENTS
In accordance with Sec. 21 WpHG, shareholders are obligated to report their share of voting rights if they
exceed or fall below certain reporting thresholds. The reporting thresholds are 3%, 5%, 10%, 15%, 20%, 25%,
30%, 50% and 75%.
HUGO BOSS AG received the following information referring to notification pursuant to sec. 21 para. 1
WpHG in connection with sec. 22 para. 1 sentence 1 No. 6 WpHG by Allianz Global Investors Europe GmbH,
Frankfurt/Deutschland on June 3, 2014:
„Allianz Global Investors Europe GmbH has exceeded the 3% threshold to a percentage of 3.10 % of the
voting rights in HUGO BOSS AG, Dieselstr. 12, 7255 Metzingen, as per settlement date May 30, 2014. This
corresponds to 2.180.505 out of a total of 70.400.000 voting rights issued by the company.
Of these voting rights, 1.20% are to be attributed to Allianz Global Investors Europe GmbH pursuant to
sec. 22 para. 1 sentence 1 No. 6 WpHG. This corresponds to 847.003 out of a total of 70.400.000 voting
rights issued by the company.”
Metzingen, June 5, 2014
The Managing Board
HUGO BOSS AG received the following information referring to notification pursuant to sec. 21 para. 1
WpHG in connection with sec. 22 para. 1 sentence 1 No. 6 WpHG by Capital Research and Management
Company, Los Angeles/USA on July 4, 2014:
„On July 2, 2014 Capital Research and Management Company exceeded the threshold of 5% of the voting
rights in HUGO BOSS AG, Dieselstraße 12, 72555 Metzingen. Capital Research and Management Company
held 5,02% (3.532.776 common shares) of the voting rights in HUGO BOSS AG on the day aforementioned.
5,02% of the voting rights (3.532.776 common shares) in HUGO BOSS AG are valuated to Capital Research
and Management Company according to sec. 22 para. 1 sentence 1 No. 6 WpHG. No independent fund is
holding more than 3% of the voting rights in HUGO BOSS AG.”
Metzingen, July 7, 2014
The Managing Board
HUGO BOSS AG received the following information referring to notification pursuant to sec. 21 para. 1
WpHG in connection with sec. 22 para. 1 sentence 1 No. 6 WpHG and sec. 22 para. 1 sentence 2 and
sentence 3 WpHG by The Capital Group Companies, Inc., Los Angeles/USA on July 4, 2014:
„ On July 2, 2014 The Capital Group Companies, Inc. exceeded the threshold of 5% of the voting rights in
Nine Months Report 2014
Condensed Notes to the Consolidated Interim Financial Statements
57
HUGO BOSS AG, Dieselstraße 12, 72555 Metzingen. The Capital Group Companies, Inc. held 5,02%
(3.532.776 common shares) of the voting rights in HUGO BOSS AG on the day aforementioned.
5,02% of the voting rights (3.532.776 common shares) in HUGO BOSS AG are valuated to The Capital Group
Companies, Inc. according to sec. 22 para. 1 sentence 1 No. 6 WpHG in connection with sec. 22 para. 1
sentence 2 and sentence 3 WpHG. No independent fund is holding more than 3% of the voting rights in
HUGO BOSS AG.”
Metzingen, July 7, 2014
The Managing Board
HUGO BOSS AG received the following information referring to notification pursuant to sec. 21 para. 1
WpHG by Allianz Global Investors Europe GmbH, Frankfurt/Deutschland on July 23, 2014:
„Allianz Global Investors Europe GmbH has exceeded the 5% threshold to a percentage of 5.01 % of the
voting rights in HUGO BOSS AG, Dieselstr. 12, 7255 Metzingen, as per July 21, 2014. This corresponds to
3,528,250 out of a total of 70.400.000 voting rights issued by the company.
Of these voting rights, 3.12% are to be attributed to Allianz Global Investors Europe GmbH pursuant to
sec. 22 para. 1 sentence 1 No. 6 WpHG. This corresponds to 2,195,445 out of a total of 70.400.000 voting
rights issued by the company.”
Metzingen, July 24, 2014
The Managing Board
HUGO BOSS AG received the following information referring to notification pursuant to sec. 21 para. 1
WpHG by Allianz Global Investors Europe GmbH, Frankfurt/Deutschland on August 29, 2014:
„Allianz Global Investors Europe GmbH has fallen below the 5% threshold to a percentage of 4.998 % of the
voting rights in HUGO BOSS AG, Dieselstr. 12, 72555 Metzingen, as per settlement date August 26, 2014.
This corresponds to 3,519,142 out of a total of 70.400.000 voting rights issued by the company.
Of these voting rights, 3.11% are to be attributed to Allianz Global Investors Europe GmbH pursuant to sec.
22 para. 1 sentence 1 No. 6 WpHG. This corresponds to 2,187,712 out of a total of 70.400.000 voting rights
issued by the company.”
Metzingen, September 2, 2014
The Managing Board
HUGO BOSS AG received the following information referring to notification pursuant to sec. 21 para. 1
WpHG by Allianz Global Investors Europe GmbH, Frankfurt/Deutschland on September 02, 2014:
„ Allianz Global Investors Europe GmbH has exceeded the 5% threshold to a percentage of 5.002 % of the
voting rights in HUGO BOSS AG, Dieselstr. 12, 7255 Metzingen, as per settlement date September 01,
2014. This corresponds to 3,521,980 out of a total of 70.400.000 voting rights issued by the company.
Of these voting rights, 3.11% are to be attributed to Allianz Global Investors Europe GmbH pursuant to sec.
22 para. 1 sentence 1 No. 6 WpHG. This corresponds to 2,190,550 out of a total of 70.400.000 voting rights
Nine Months Report 2014
Condensed Notes to the Consolidated Interim Financial Statements
58
issued by the company.”
Metzingen, September 03, 2014
The Managing Board
HUGO BOSS AG received the following information referring to notification pursuant to sec. 21 para. 1
WpHG by Allianz Global Investors Europe GmbH, Frankfurt/Deutschland on September 4, 2014:
„Allianz Global Investors Europe GmbH fell below the 5% threshold to a percentage of 4.98% of the voting
rights in HUGO BOSS AG, Dieselstr. 12, 7255 Metzingen, as per set-tlement date September 02, 2014. This
corresponds to 3,506,968 out of a total of 70.400.000 voting rights issued by the company.
Of these voting rights, 3.08% are to be attributed to Allianz Global Investors Europe GmbH pursuant to sec.
22 para. 1 sentence 1 No. 6 WpHG. This corresponds to 2,170,708 out of a total of 70.400.000 voting rights
issued by the company.”
Metzingen, September 5, 2014
The Managing Board
On September 8, 2014, HUGO BOSS AG received the following voting rights notifications in accordance
with Sections 21 (1) and 22 WpHG from the companies specified below:
1. Red & Black Lux S.à r.l.
On September 5, 2014, the share of voting rights held by Red & Black Lux S.à r.l., Luxembourg, Luxem-
bourg, in HUGO BOSS AG, Metzingen, Germany, fell below the threshold of 50% due to a change in the
total number of voting rights as a result of the sale of ordinary shares with voting rights. Its share of the
voting rights now amounts to 38.78% (27,300,001 voting rights) and is held by Red & Black Lux S.à r.l. di-
rectly in accordance with Section 21 (1) WpHG.
2. Red & Black Topco S.à r.l.
On September 5, 2014, the share of voting rights held by Red & Black Topco S.à r.l., Luxembourg, Luxem-
bourg, in HUGO BOSS AG, Metzingen, Germany, fell below the threshold of 50% due to a change in the
total number of voting rights as a result of the sale of ordinary shares with voting rights. Its share of the
voting rights now amounts to 38.78% (27,300,001 voting rights) and is attributed to Red & Black Topco S.à
r.l. from shares held by Red & Black Lux S.à r.l. in accordance with Section 22 (1) Sentence 1 No. 1 in con-
junction with Sentence 3 WpHG. Red & Black Lux S.à r.l. is controlled by Red & Black Topco S.à r.l.
3. Red & Black Holdco S.à r.l. (in voluntary liquidation)
On September 5, 2014, the share of voting rights held by Red & Black Holdco S.à r.l. (in voluntary liquida-
tion), Luxembourg, Luxembourg, in HUGO BOSS AG, Metzingen, Germany, fell below the threshold of 50%
due to a change in the total number of voting rights as a result of the sale of ordinary shares with voting
rights. Its share of the voting rights now amounts to 38.78% (27,300,001 voting rights) and is attributed to
Red & Black Holdco S.à r.l. (in voluntary liquidation) from shares held by Red & Black Lux S.à r.l. in accord-
ance with Section 22 (1) Sentence 1 No. 1 in conjunction with Sentence 3 WpHG. Red & Black Lux S.à r.l. is
controlled indirectly by Red & Black Holdco S. à r.l. (in voluntary liquidation) via Red & Black Topco S.à r.l.
4. Red & Black Holdco 2 S.à r.l. (in voluntary liquidation)
On September 5, 2014, the share of voting rights held by Red & Black Holdco 2 S.à r.l. (in voluntary liquida-
Nine Months Report 2014
Condensed Notes to the Consolidated Interim Financial Statements
59
tion), Luxembourg, Luxembourg, in HUGO BOSS AG, Metzingen, Germany, fell below the threshold of 50%
due to a change in the total number of voting rights as a result of the sale of ordinary shares with voting
rights. Its share of the voting rights now amounts to 38.78% (27,300,001 voting rights) and is attributed to
Red & Black Holdco 2 S.à r.l. (in voluntary liquidation) from shares held by Red & Black Lux S.à r.l. in accord-
ance with Section 22 (1) Sentence 1 No. 1 in conjunction with Sentence 3 WpHG. Red & Black Lux S.à r.l. is
controlled indirectly by Red & Black Holdco 2 S.à r.l. (in voluntary liquidation) via Red & Black Topco S.à r.l.
5. P4 Sub L.P.1
On September 5, 2014, the share of voting rights held by P4 Sub L.P.1, St Peter Port, Guernsey, Channel
Islands, in HUGO BOSS AG, Metzingen, Germany, fell below the threshold of 50% due to a change in the
total number of voting rights as a result of the sale of ordinary shares with voting rights. Its share of the
voting rights now amounts to 38.78% (27,300,001 voting rights) and is attributed to P4 Sub L.P.1 from
shares held by Red & Black Lux S.à r.l. in accordance with Section 22 (1) Sentence 1 No. 1 in conjunction
with Sentence 3 WpHG. Red & Black Lux S.à r.l. is controlled indirectly by P4 Sub L.P.1 via Red & Black
Holdco 2 S.à r.l. (in voluntary liquidation) and Red & Black Topco S.à r.l.
6. Permira IV L.P.1
On September 5, 2014, the share of voting rights held by Permira IV L.P.1, St Peter Port, Guernsey, Channel
Islands, in HUGO BOSS AG, Metzingen, Germany, fell below the threshold of 50% due to a change in the
total number of voting rights as a result of the sale of ordinary shares with voting rights. Its share of the
voting rights now amounts to 38.78% (27,300,001 voting rights) and is attributed to Permira IV L.P.1 from
shares held by Red & Black Lux S.à r.l. in accordance with Section 22 (1) Sentence 1 No. 1 in conjunction
with Sentence 3 WpHG. Red & Black Lux S.à r.l. is controlled indirectly by Permira IV L.P.1 via P4 Sub L.P.1,
Red & Black Holdco 2 S.à r.l. (in voluntary liquidation) and Red & Black Topco S.à r.l.
7. Permira IV Managers L.P.
On September 5, 2014, the share of voting rights held by Permira IV Managers L.P., St Peter Port, Guernsey,
Channel Islands, in HUGO BOSS AG, Metzingen, Germany, fell below the threshold of 50% due to a change
in the total number of voting rights as a result of the sale of ordinary shares with voting rights. Its share of
the voting rights now amounts to 38.78% (27,300,001 voting rights) and is attributed to Permira IV Manag-
ers L.P. from shares held by Red & Black Lux S.à r.l. in accordance with Section 22 (1) Sentence 1 No. 1 in
conjunction with Sentence 3 WpHG. Red & Black Lux S.à r.l. is controlled indirectly by Permira IV Managers
L.P. via Permira IV L.P.1, P4 Sub L.P.1, Red & Black Holdco 2 S.à r.l. (in voluntary liquidation), Permira IV
L.P.2, Red & Black Holdco S.à r.l. (in voluntary liquidation) and Red & Black Topco S.à r.l.
8. Permira IV Managers Limited
On September 5, 2014, the share of voting rights held by Permira IV Managers Limited, St Peter Port,
Guernsey, Channel Islands, in HUGO BOSS AG, Metzingen, Germany, fell below the threshold of 50% due
to a change in the total number of voting rights as a result of the sale of ordinary shares with voting rights.
Its share of the voting rights now amounts to 38.78% (27,300,001 voting rights) and is attributed to Permira
IV Managers Limited from shares held by Red & Black Lux S.à r.l. in accordance with Section 22 (1) Sen-
tence 1 No. 1 in conjunction with Sentence 3 WpHG. Red & Black Lux S.à r.l. is controlled indirectly by
Permira IV Managers Limited via Permira IV Managers L.P., Permira IV L.P.1, P4 Sub L.P.1, Red & Black
Holdco 2 S.à r.l. (in voluntary liquidation), Permira IV L.P.2, Red & Black Holdco S.à r.l. (in voluntary liquida-
tion) and Red & Black Topco S.à r.l.
9. Permira IV L.P.2
On September 5, 2014, the share of voting rights held by Permira IV L.P.2, St Peter Port, Guernsey, Channel
Nine Months Report 2014
Condensed Notes to the Consolidated Interim Financial Statements
60
Islands, in HUGO BOSS AG, Metzingen, Germany, fell below the threshold of 50% due to a change in the
total number of voting rights as a result of the sale of ordinary shares with voting rights. Its share of the
voting rights now amounts to 38.78% (27,300,001 voting rights) and is attributed to Permira IV L.P.2 from
shares held by Red & Black Lux S.à r.l. in accordance with Section 22 (1) Sentence 1 No. 1 in conjunction
with Sentence 3 WpHG. Red & Black Lux S.à r.l. is controlled indirectly by Permira IV L.P.2 via Red & Black
Holdco S.à r.l. (in voluntary liquidation) and Red & Black Topco S.à r.l.
10. P4 Co-Investment L.P.
On September 5, 2014, the share of voting rights held by P4 Co-Investment L.P., St Peter Port, Guernsey,
Channel Islands, in HUGO BOSS AG, Metzingen, Germany, fell below the threshold of 50% due to a change
in the total number of voting rights as a result of the sale of ordinary shares with voting rights. Its share of
the voting rights now amounts to 38.78% (27,300,001 voting rights) and is attributed to P4 Co-Investment
L.P. from shares held by Red & Black Lux S.à r.l. in accordance with Section 22 (1) Sentence 1 No. 1 in con-
junction with Sentence 3 WpHG. Red & Black Lux S.à r.l. is controlled indirectly by P4 Co-Investment L.P. via
Red & Black Holdco S.à r.l. (in voluntary liquidation) and Red & Black Topco S.à r.l.
11. Permira Investments Limited
On September 5, 2014, the share of voting rights held by Permira Investments Limited, St Peter Port,
Guernsey, Channel Islands, in HUGO BOSS AG, Metzingen, Germany, fell below the threshold of 50% due
to a change in the total number of voting rights as a result of the sale of ordinary shares with voting rights.
Its share of the voting rights now amounts to 38.78% (27,300,001 voting rights) and is attributed to Permira
Investments Limited from shares held by Red & Black Lux S.à r.l. in accordance with Section 22 (1) Sen-
tence 1 No. 1 in conjunction with Sentence 3 WpHG. Red & Black Lux S.à r.l. is controlled indirectly by
Permira Investments Limited via Red & Black Holdco S.à r.l. (in voluntary liquidation) and Red & Black Topco
S.à r.l.
12. Permira IV GP L.P.
On September 5, 2014, the share of voting rights held by Permira IV GP L.P., St Peter Port, Guernsey, Chan-
nel Islands, in HUGO BOSS AG, Metzingen, Germany, fell below the threshold of 50% due to a change in
the total number of voting rights as a result of the sale of ordinary shares with voting rights. Its share of the
voting rights now amounts to 38.78% (27,300,001 voting rights) and is attributed to Permira IV GP L.P. from
shares held by Red & Black Lux S.à r.l. in accordance with Section 22 (1) Sentence 1 No. 1 in conjunction
with Sentence 3 WpHG. Red & Black Lux S.à r.l. is controlled indirectly by Permira IV GP L.P. via Permira IV
L.P.1, P4 Sub L.P.1, Red & Black Holdco 2 S.à r.l. (in voluntary liquidation), Permira IV L.P.2, P4 Co-
Investment L.P., Red & Black Holdco S.à r.l. (in voluntary liquidation) and Red & Black Topco S.à r.l.
13. Permira IV GP Limited
On September 5, 2014, the share of voting rights held by Permira IV GP Limited, St Peter Port, Guernsey,
Channel Islands, in HUGO BOSS AG, Metzingen, Germany, fell below the threshold of 50% due to a change
in the total number of voting rights as a result of the sale of ordinary shares with voting rights. Its share of
the voting rights now amounts to 38.78% (27,300,001 voting rights) and is attributed to Permira IV GP Lim-
ited from shares held by Red & Black Lux S.à r.l. in accordance with Section 22 (1) Sentence 1 No. 1 in con-
junction with Sentence 3 WpHG. Red & Black Lux S.à r.l. is controlled indirectly by Permira IV GP Limited via
Permira IV GP L.P., Permira IV L.P.1, P4 Sub L.P.1, Red & Black Holdco 2 S.à r.l. (in voluntary liquidation),
Permira IV L.P.2, P4 Co-Investment L.P., Red & Black Holdco S.à r.l. (in voluntary liquidation) and Red &
Black Topco S.à r.l.
Nine Months Report 2014
Condensed Notes to the Consolidated Interim Financial Statements
61
14. Permira Nominees Limited
On September 5, 2014, the share of voting rights held by Permira Nominees Limited, St Peter Port, Guern-
sey, Channel Islands, in HUGO BOSS AG, Metzingen, Germany, fell below the threshold of 50% due to a
change in the total number of voting rights as a result of the sale of ordinary shares with voting rights. Its
share of the voting rights now amounts to 38.78% (27,300,001 voting rights) and is attributed to Permira
Nominees Limited from shares held by Red & Black Lux S.à r.l. in accordance with Section 22 (1) Sentence 1
No. 1 in conjunction with Sentence 3 WpHG. Red & Black Lux S.à r.l. is controlled indirectly by Permira
Nominees Limited via Permira Investments Limited, Red & Black Holdco S.à r.l. (in voluntary liquidation) and
Red & Black Topco S.à r.l.
15. Permira Holdings Limited
On September 5, 2014, the share of voting rights held by Permira Holdings Limited, St Peter Port, Guernsey,
Channel Islands, in HUGO BOSS AG, Metzingen, Germany, fell below the threshold of 50% due to a change
in the total number of voting rights as a result of the sale of ordinary shares with voting rights. Its share of
the voting rights now amounts to 38.78% (27,300,001 voting rights) and is attributed to Permira Holdings
Limited from shares held by Red & Black Lux S.à r.l. in accordance with Section 22 (1) Sentence 1 No. 1 in
conjunction with Sentence 3 WpHG. Red & Black Lux S.à r.l. is controlled indirectly by Permira Holdings
Limited via Permira IV GP Limited, Permira IV GP L.P., Permira IV Managers Limited, Permira IV Managers
L.P., Permira IV L.P.1, P4 Sub L.P.1, Red & Black Holdco 2 S.à r.l. (in voluntary liquidation), Permira IV L.P.2,
P4 Co-Investment L.P., Permira Nominees Limited, Permira Investments Limited, Red & Black Holdco S.à r.l.
(in voluntary liquidation) and Red & Black Topco S.à r.l.
Metzingen, September 9, 2014
The Managing Board
HUGO BOSS AG received the following information referring to notification pursuant to sec. 21para. 1
WpHG by Allianz Global Investors Europe GmbH, Frankfurt/Deutschland on Sep-tember 09, 2014:
„Allianz Global Investors Europe GmbH has exceeded the 5% threshold to a percentage of 5.15% of the
voting rights in HUGO BOSS AG, Dieselstr. 12, 72555 Metzingen, as per set-tlement date September 05,
2014. This corresponds to 3,624,257out of a total of 70,400,000 voting rights issued by the company.
Of these voting rights, 3.25% are to be attributed to Allianz Global Investors Europe GmbH pursuant to sec.
22 para. 1 sentence1 No. 6 WpHG. This corresponds to 2,287,997 out of a total of 70,400,000 voting rights
issued by the company.”
Metzingen, September 9, 2014
The Managing Board
HUGO BOSS AG received the following information referring to notification pursuant to sec. 25a para. 1
WpHG by ZETA FINANCE S.A., Luxembourg, Luxembourg on 11 September 2014:
“ZETA FINANCE S.A. herewith notify pursuant to sec. 25a para. 1 sentence 1 WpHG that on 5 September
2014 we held an instrument pursuant to sec. 25a para. 1 sentence 1 WpHG enabling us under certain cir-
cumstances to indirectly acquire voting rights in the proportion of 38.78% (equals: 27,300,001 voting rights)
in HUGO BOSS AG calculated from the total amount of voting rights in HUGO BOSS AG in the amount of
70,400,000. As per this date we would have fallen below the threshold of 50% of voting rights.
Nine Months Report 2014
Condensed Notes to the Consolidated Interim Financial Statements
62
The instrument held by us relates to a right of first offer (Recht zur Abgabe eines ersten An-gebots) con-
tained in a Shareholders Agreement, which was signed in 2007 and ends on 2 August 2017, between our
company and PFC S.r.l. as minority shareholders and Red & Black Holdco S.à r.l. and Red & Black Holdco 2
S.à r.l. as majority shareholders of the holding company Red & Black Topco S.à r.l. ("Topco").
The right of first offer does not directly relate to shares in HUGO BOSS AG but does only enable us – sub-
ject to the majority shareholders of Topco intending to sell their controlling stake in Topco or its immediate
subsidiary and under certain other conditions and only in certain limited circumstances – to make an offer
and, if the majority shareholders accept such offer, to acquire the majority of the shares in Topco or such
subsidiary which in turn – among other assets on 5 September 2014 indirectly holds a voting rights propor-
tion of 38.78% (equals: 27,300,001 voting rights) in HUGO BOSS AG after shares in HUGO BOSS AG with
a voting rights proportion of 11.22% (equals:7,900,000 voting rights) were placed.”
Metzingen, 11 September 2014
Managing Board
HUGO BOSS AG received the following information referring to notification pursuant to sec. 25a para. 1
WpHG by Zignago Holding S.p.A., Fossalta, Italy, on 11 September 2014:
Zignago Holding S.p.A. held on 5 September 2014 indirectly an instrument pursuant to sec. 25a para. 1 sen-
tence 1 WpHG under which ZETA FINANCE S.A. is enabled to indirectly acquire voting rights in the propor-
tion of 38.78% (equals: 27,300,001 voting rights) in HUGO BOSS AG calculated from the total amount of
voting rights in HUGO BOSS AG in the amount of 70,400,000. As per this date Zignago Holding S.p.A. would
have fallen below the threshold of 50% of voting rights.
The instrument indirectly held by Zignago Holding S.p.A. relates to a right of first offer (Recht zur Abgabe
eines ersten Angebots) contained in a Shareholders Agreement, which was signed in 2007 and ends on 2
August 2017, between ZETA FINANCE S.A. and PFC S.r.l. as minority shareholders and Red & Black Holdco
S.à r.l. and Red & Black Holdco 2 S.à r.l. as majority shareholders of the holding company Red & Black Topco
S.à r.l. ("Topco"). The in-strument indirectly held by Zignago Holding S.p.A. is directly held by ZETA FINANCE
S.A. which is directly controlled by Zignago Holding S.p.A..
The right of first offer does not directly relate to shares in HUGO BOSS AG but does only enable Zignago
Holding S.p.A. – subject to the majority shareholders of Topco intending to sell their controlling stake in
Topco or its immediate subsidiary and under certain other conditions and only in certain limited circumstanc-
es – to make an offer and, if the majority shareholders accept such offer, to acquire the majority of the
shares in Topco or such sub-sidiary which in turn – among other assets on 5 September 2014 indirectly
holds a voting rights proportion of 38.78% (equals: 27,300,001 voting rights) in HUGO BOSS AG after shares
in HUGO BOSS AG with a voting rights proportion of 11.22% (equals:7,900,000 voting rights) were placed.
Metzingen, 11 September 2014
The Managing Board
HUGO BOSS AG received the following information referring to notification pursuant to sec. 25a para. 1
WpHG by PFC S.r.l., Vicenza, Italy, on 11 September 2014:
PFC S.r.l. notify pursuant to sec. 25a para. 1 WpHG that on 5 September 2014 by aggregat-ing
Nine Months Report 2014
Condensed Notes to the Consolidated Interim Financial Statements
63
- voting rights from common shares, PFC S.r.l. are enabled under certain circumstances to indirectly acquire
on the basis of a directly held instrument pursuant to sec. 25a para. 1 sentence 1 WpHG, and
- voting rights held by PFC S.r.l. pursuant to sec. 21 WpHG
PFC S.r.l. held/would have held a voting rights proportion of 39.14% (equals: 27,557,159 voting rights) in
HUGO BOSS AG calculated from the total amount of voting rights in HUGO BOSS AG in the amount of
70,400,000. As per this date PFC S.r.l. would have fallen below the threshold of 50% of voting rights.
In detail,
- PFC S.r.l. voting rights proportion pursuant to sec. 21 WpHG amounts to 0.37% (equals: 257,158 voting
rights), and
- PFC S.r.l. voting rights proportion indirectly acquirable on the basis of a directly held instrument pursuant to
sec. 25a para. 1 sentence 1 WpHG amounts to 38.78% (equals: 27,300,001 voting rights).
The instrument held by PFC S.r.l. relates to a right of first offer (Recht zur Abgabe eines ersten Angebots)
contained in a Shareholders Agreement, which was signed in 2007 and ends on 2 August 2017, between
PFC S.r.l. and ZETA FINANCE S.A. as minority shareholders and Red & Black Holdco S.à r.l. and Red & Black
Holdco 2 S.à r.l. as majority shareholders of the holding company Red & Black Topco S.à r.l. ("Topco").
The right of first offer does not directly relate to shares in HUGO BOSS AG but does only enable PFC S.r.l. –
subject to the majority shareholders of Topco intending to sell their con-trolling stake in Topco or its immedi-
ate subsidiary and under certain other conditions and only in certain limited circumstances – to make an offer
and, if the majority shareholders ac-cept such offer, to acquire the majority of the shares in Topco or such
subsidiary which in turn – among other assets on 5 September 2014 indirectly holds a voting rights propor-
tion of 38.78% (equals: 27,300,001 voting rights) in HUGO BOSS AG after shares in HUGO BOSS AG with a
voting rights proportion of 11.22% (equals: 7,900,000 voting rights) were placed.
Metzingen, 11 September 2014
The Managing Board
HUGO BOSS AG received the following information referring to notification pursuant to sec. 25a para. 1
WpHG by UniCredit Bank AG and UniCredit S.p.A on 11 September 2014:
1. The holding within the meaning of section 25a para. 1 WpHG of UniCredit Bank AG in HUGO BOSS AG,
Dieselstr. 12, 2755 Metzingen, has on 5 September 2014 fallen below the threshold of 50% of the voting
rights in HUGO BOSS AG. On that day, UniCredit Bank AG directly held financial instruments and other
instruments pursuant to section 25a para. 1 WpHG which are structured in a manner that enable UniCredit
Bank AG to acquire - together with holdings of UniCredit Bank AG pursuant to sections 21 and 25 WpHG -
up to 38.85% of the voting rights (27,350,110 out of 70,400,000 common shares) in HUGO BOSS AG.
Thereof, 10,213 voting rights in HUGO BOSS AG (corresponding to 0.02% of the voting rights) are directly
held by UniCredit Bank AG (holding pursuant to section 21 WpHG).
39,891 voting rights in HUGO BOSS AG (corresponding to 0.06% of the voting rights) may be acquired by
Nine Months Report 2014
Condensed Notes to the Consolidated Interim Financial Statements
64
UniCredit Bank AG on the basis of financial instruments pursuant to section 25 WpHG directly held by
UniCredit Bank AG.
The financial and other instruments directly held by UniCredit Bank AG within the meaning of section 25a
para. 1 WpHG are structured in a manner that enable UniCredit Bank AG to acquire up to 27,300,006 voting
rights in HUGO BOSS AG (corresponding to 38.78% of the voting rights). One relevant instrument within
the meaning of section 25a para. 1WpHG is a share pledge which was granted to UniCredit Bank AG in
connection with its lending business in 2009 and enables UniCredit Bank AG in an enforcement event to
acquire up to 27,300,001 of the voting rights in HUGO BOSS AG. The other relevant instrument within the
meaning of section 25a para. 1 WpHG is a cash-settled put option without expiration date which relates to 5
voting rights in HUGO BOSS AG.
2. The holding within the meaning of section 25a para. 1 WpHG of UniCredit S.p.A., in HUGO BOSS AG,
Dieselstr. 12, 72555 Metzingen, has on 5 September 2014 fallen below the threshold of 50% of the voting
rights in HUGO BOSS AG. On that day, UniCredit S.p.A. via UnitCredit Bank AG, which is controlled by
UniCredit S.p.A., indirectly held financial in-struments and other instruments pursuant to section 25a para. 1
WpHG which are struc-tured in a manner that enable UniCredit Bank AG to acquire - together with holdings
of UniCredit Bank AG pursuant to sections 21 and 25 WpHG and correspondingly (indirect) holdings of
UniCredit S.p.A. pursuant to sections 22 and 25 WpHG - up to 38.85% of the voting rights (27,350,110 out
of 70,400,000 common shares) in HUGO BOSS AG.
Thereof, 10,213 voting rights in HUGO BOSS AG (corresponding to 0.02% of the voting rights) are directly
held by UniCredit Bank AG and are attributed to UniCredit S.p.A. pursuant to section 22 para.1 sent. 1 no. 1
WpHG.
39,891 voting rights in HUGO BOSS AG (corresponding to 0.06% of the voting rights) relate to financial
instruments within the meaning of section 25 WpHG indirectly held by UniCredit S.p.A. via its German sub-
sidiary UniCredit Bank AG.
The financial and other instruments within the meaning of section 25a para. 1 WpHG indi-rectly held by
UniCredit S.p.A. via its German subsidiary UniCredit Bank AG are structured in a manner that enable
UniCredit Bank AG to acquire up to 27,300,006 voting rights in HUGO BOSS AG (corresponding to 38.78%
of the voting rights). One relevant instrument within the meaning of section 25a para. 1 WpHG is a share
pledge which was granted to UniCredit Bank AG in connection with its lending business in 2009 and ena-
bles UniCredit Bank AG in an enforcement event to acquire up to 27,300,001of the voting rights in HUGO
BOSS AG. The other relevant instrument within the meaning of section 25a para. 1 WpHG is a cash-settled
put option without expiration date which relates to 5 voting rights in HUGO BOSS AG.
Metzingen, 15 September 2014
The Managing Board
The Company published these announcements as worded on its investor relations website.
Nine Months Report 2014
Condensed Notes to the Consolidated Interim Financial Statements
65
Metzingen, October 23, 2014
HUGO BOSS AG
The Managing Board
Claus-Dietrich Lahrs
Christoph Auhagen
Mark Langer

Halbjahresfinanzbericht 2013
Condensed Notes to the Consolidated Interim Financial Statements
66
WEITERE ANGABEN
Nine Months Report 2014
Forward-Looking Statements
67
FORWARD-LOOKING STATEMENTS
This document contains forward-looking statements that reflect management’s current views with respect to
future events. The words “anticipate”, “assume”, “believe”, “estimate”, “expect”, “intend”, “may”, “plan”,
“project”, “should”, and similar expressions identify forward-looking statements. Such statements are subject
to risks and uncertainties. If any of these or other risks or uncertainties occur, or if the assumptions underlying
any of these statements prove incorrect, then actual results may be materially different from those expressed or
implied by such statements. We do not intend or assume any obligation to update any forward-looking state-
ment, which speaks only as of the date on which it is made.
Nine Months Report 2014
Financial Calendar
68
FINANCIAL CALENDAR
NOVEMBER 19, 2014
Investor Field Trip, Paris
MARCH 12, 2015
Press and Analysts‘ Conference
MAY 6, 2015
Publication of the First Quarter Report 2015
MAY 12, 2015
Annual Shareholders‘ Meeting
AUGUST 4, 2015
Publication of the First Half Year Report 2015
NOVEMBER 3, 2015
Publication of the Nine Months Report 2015
CONTACTS
INVESTOR RELATIONS
Phone +49 (0) 7123 94 - 80903
E-Mail [email protected]
DENNIS WEBER
Head of Investor Relations
Phone +49 (0) 7123 94 - 86267
Fax +49 (0) 7123 94 - 886267
DR. HJÖRDIS KETTENBACH
Head of Corporate Communication
Phone +49 (0) 7123 94 - 2375
Fax +49 (0) 7123 94 - 80237
REQUEST FOR ANNUAL REPORTS
group.hugoboss.com / Investor Relations / Order Form Annual Reports

Halbjahresfinanzbericht 2013
Financial Calendar
69
Recommended