Health and Climate Implications of Emissions from Small Scale
Industries in MexicoRufus Edwards
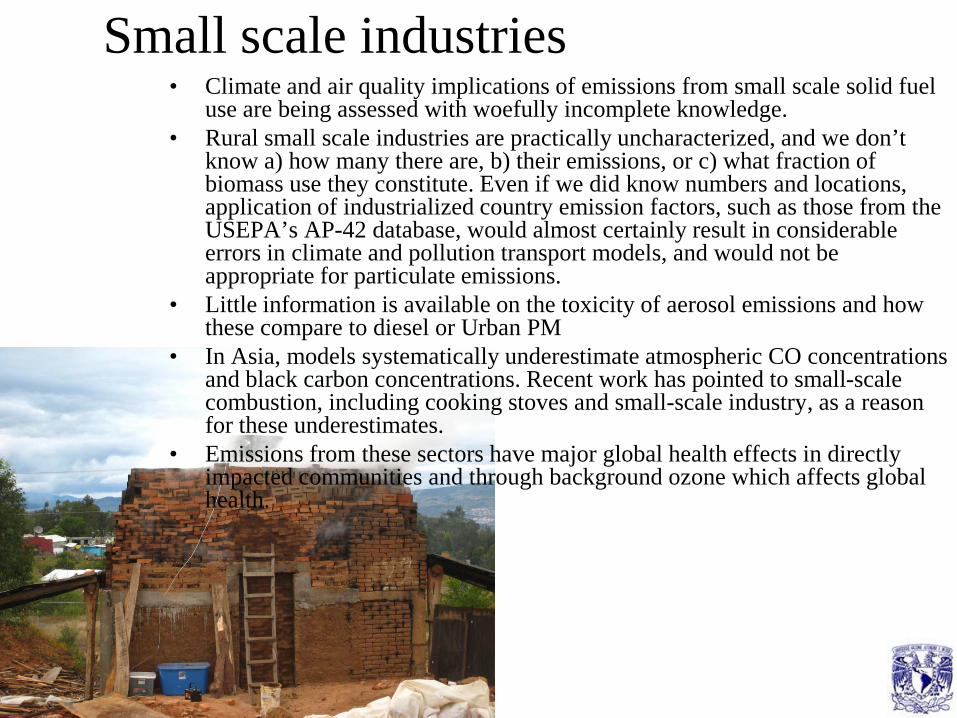
Small scale industries• Climate and air quality implications of emissions from small scale solid fuel
use are being assessed with woefully incomplete knowledge. • Rural small scale industries are practically uncharacterized, and we don’t
know a) how many there are, b) their emissions, or c) what fraction of biomass use they constitute. Even if we did know numbers and locations, application of industrialized country emission factors, such as those from the USEPA’s AP-42 database, would almost certainly result in considerable errors in climate and pollution transport models, and would not be appropriate for particulate emissions.
• Little information is available on the toxicity of aerosol emissions and how these compare to diesel or Urban PM
• In Asia, models systematically underestimate atmospheric CO concentrations and black carbon concentrations. Recent work has pointed to small-scale combustion, including cooking stoves and small-scale industry, as a reason for these underestimates.
• Emissions from these sectors have major global health effects in directly impacted communities and through background ozone which affects global health.
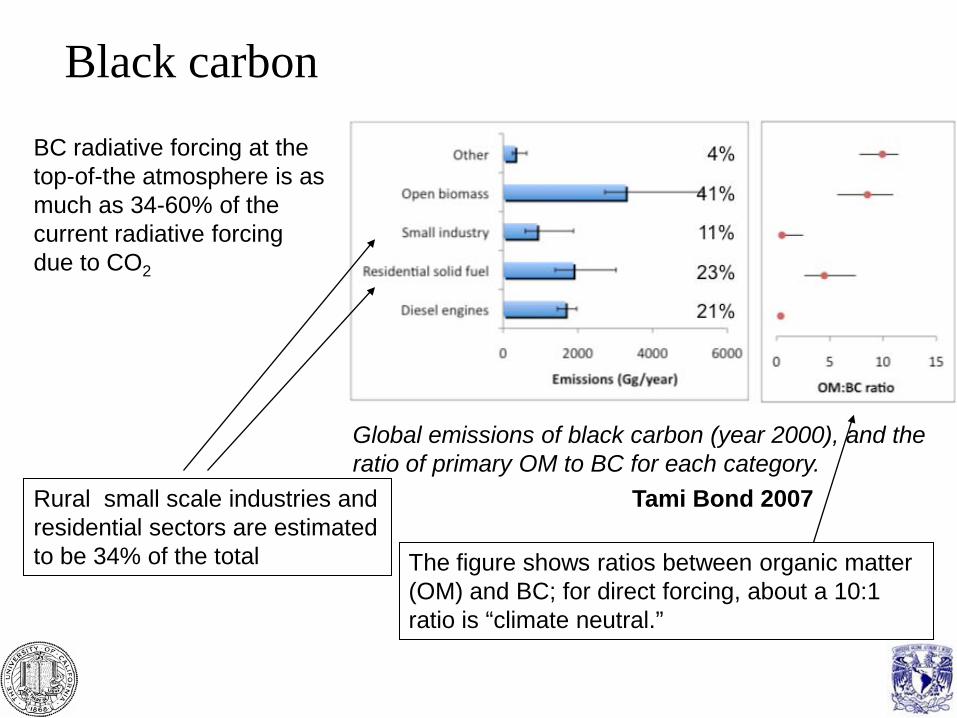
Black carbon
Tami Bond 2007
BC radiative forcing at the top-of-the atmosphere is as much as 34-60% of the current radiative forcing due to CO2
Rural small scale industries and residential sectors are estimated to be 34% of the total
Global emissions of black carbon (year 2000), and the ratio of primary OM to BC for each category.
The figure shows ratios between organic matter (OM) and BC; for direct forcing, about a 10:1 ratio is “climate neutral.”

Combustion related biomass consumption
CharcoalCharcoal Pottery
Purepecha regionbrick 22%copper 0%pottery 15%bread 1%domestic 61%
Nationalcharcoal 15%domestic 80%brick 5%
Brick

Charcoal

Global warming compounds produced by biomass combustion
• Under ideal circumstances carbon based fuels produce only water and CO2
• Circumstances are rarely ideal however
• In addition combustion temperature results in nitrous oxides (N20)
OHCOCarbonfuel 22 +⇒
OHCOCarbonfuel 22 +⇒
mattereparticulatNMHCCHCO
combustiontinefficien
+++⇓
4

Kiln measurements


Brick kiln
0
1000
2000
3000
4000
5000
6000
7000
0.6
0.65
0.7
0.75
0.8
0.85
0.9
0.95
1
12:43:12 12:50:24 12:57:36 13:04:48 13:12:00 13:19:12 13:26:24 13:33:36 13:40:48 13:48:00
CO
2, C
O (p
pm)
CO
2/(C
O2+
CO
) (p
roxy
for c
ombu
stio
n ef
ficie
ncy)
Time
CO2/(CO2+CO)CO2CO
Fugitive
Plume
Fugitive
Plume
Fugitive
Plume
Mean combustion efficiency of ~85%
15% of combusted carbon is being emitted as methane, black carbon, and other products of incomplete combustion.

NCE and Emissions
Charcoal kiln 1 was more efficient due to air entry
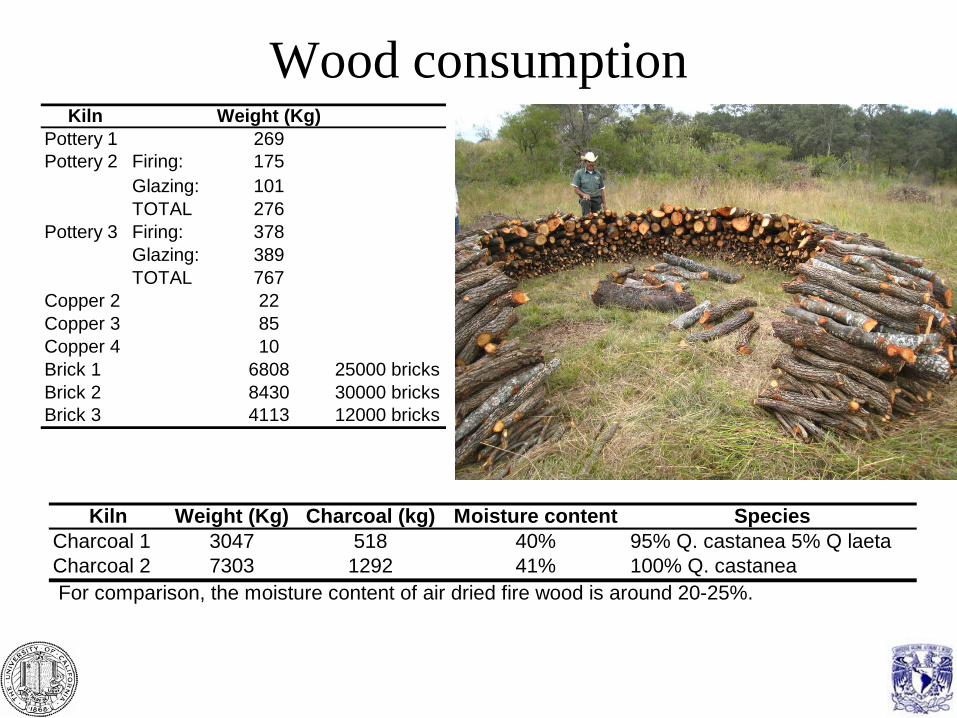
Wood consumptionKiln Weight (Kg)
Pottery 1 269Pottery 2 Firing: 175
Glazing: 101TOTAL 276
Pottery 3 Firing: 378Glazing: 389TOTAL 767
Copper 2 22Copper 3 85Copper 4 10Brick 1 6808 25000 bricksBrick 2 8430 30000 bricksBrick 3 4113 12000 bricks
Kiln Weight (Kg) Charcoal (kg) Moisture content SpeciesCharcoal 1 3047 518 40% 95% Q. castanea 5% Q laetaCharcoal 2 7303 1292 41% 100% Q. castanea For comparison, the moisture content of air dried fire wood is around 20-25%.

Invitro Assays• Live/Dead Viability/Cytotoxicity Assay, by Neutral red
assay with absorbance Spectrometry. Neutral red picked up by live cells and stored in vescicles
• Superoxide Production During Respiratory Burst Activity following stimulation with PMA (phorbol 12-myristate 13-acetate) by lucigenin-amplified chemiluminescence. Macrophages generate ROS in order to kill some types of bacteria that they engulf by phagocytosis. In vivo and in vitro models show suppression of defense against infection after exposure to particulate matter.
• Griess Reagent System, Nitric Oxide (NO) Determination by Absorbance Spectrometry. NO production has been repeatedly shown to be a major antimicrobial mechanism of macrophages. Increased NO production indicates an activation of immune inflammatory response.
• Doses approximately equivalent to a cumulative 5 day work week exposure in Los Angeles – less in rural Mexico

Reduced cell viability
0%
20%
40%
60%
80%
100%
120%
Diesel Urban dust Brick Charcoal Copper Pottery
Cel
l via
bilit
y (%
)
µg/mL 25µg/mL 50µg/mL 100
Higher doses trigger defensive reaction through antioxidant defense mechanisms (Andre Nel)

Reduction in ROS production
0%
20%
40%
60%
80%
100%
120%
Brick Charcoal Copper Pottery
RLU
/con
trol
RLU
µg/mL 25µg/mL 50µg/mL 100
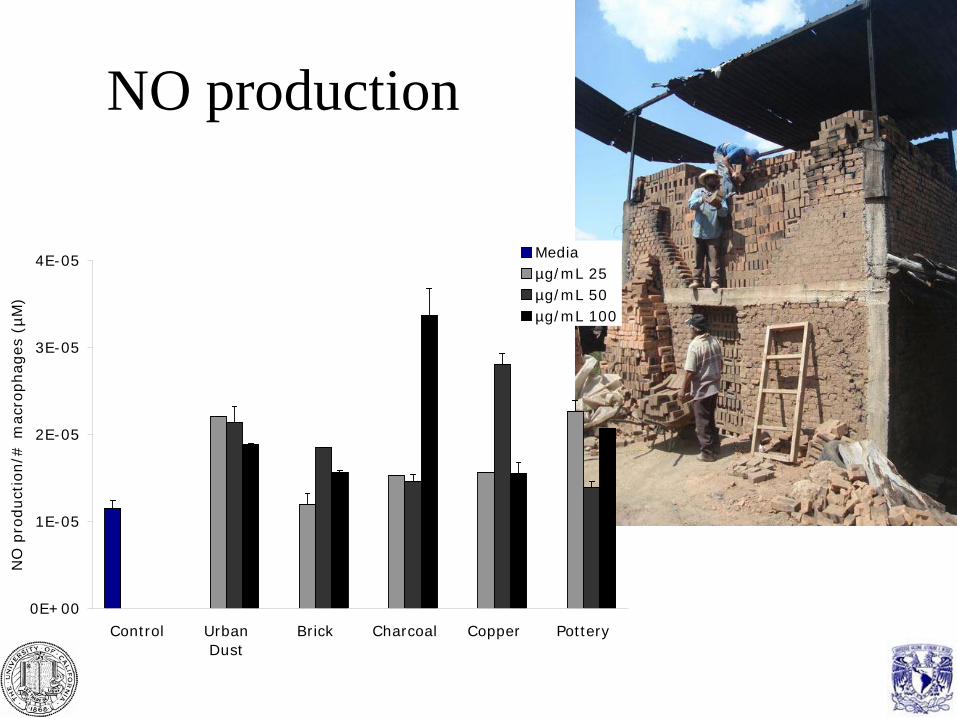
NO production
0E+00
1E-05
2E-05
3E-05
4E-05
Control UrbanDust
Brick Charcoal Copper Pottery
NO
pro
duct
ion/
# m
acro
phag
es (
µM)
Mediaµg/mL 25µg/mL 50µg/mL 100
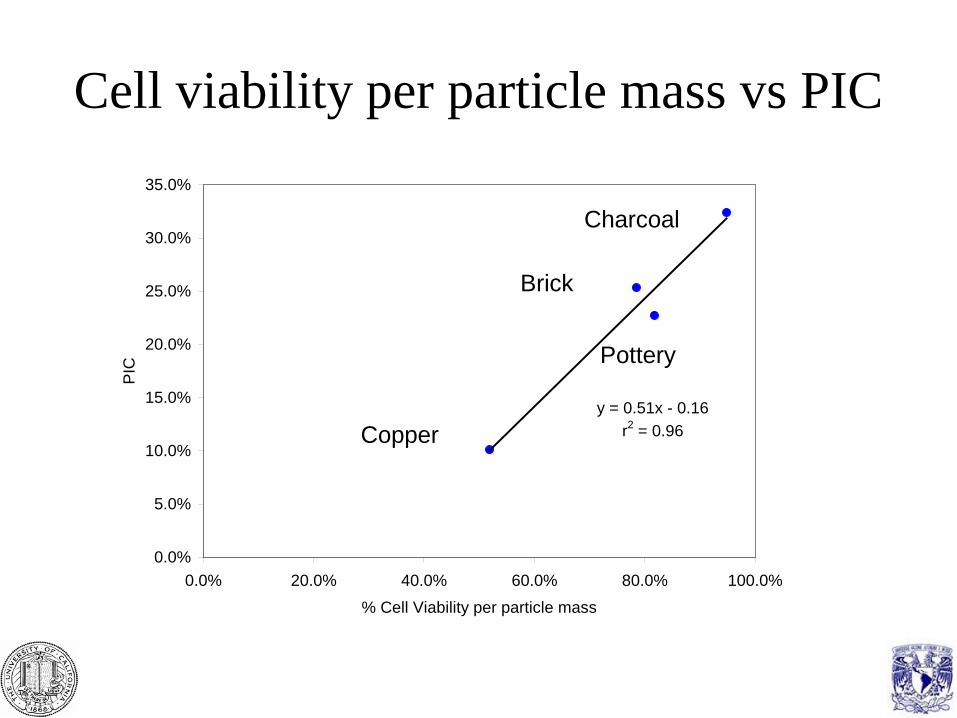
Cell viability per particle mass vs PIC
y = 0.51x - 0.16r2 = 0.96
0.0%
5.0%
10.0%
15.0%
20.0%
25.0%
30.0%
35.0%
0.0% 20.0% 40.0% 60.0% 80.0% 100.0%% Cell Viability per particle mass
PIC
Charcoal
Brick
Pottery
Copper

y = -1.2E04x + 0.46r2 = 0.75
0.0%
5.0%
10.0%
15.0%
20.0%
25.0%
30.0%
35.0%
0.0E+00 5.0E-06 1.0E-05 1.5E-05 2.0E-05 2.5E-05 3.0E-05NO production per viable cell (µM)
PIC
NO production per particle mass vs PIC
Charcoal
Brick
Pottery
Copper
Consistent with the cell viability - Peroxynitrite formed from NO attacks cell membranes leading to cell death

y = -0.29x + 0.43r2 = 0.7
0.0%
5.0%
10.0%
15.0%
20.0%
25.0%
30.0%
35.0%
0.0% 20.0% 40.0% 60.0% 80.0% 100.0% 120.0%
PIC
ROS reduction per viable cell
Reduction is ROS production per viable cell and PIC
Charcoal
Brick
Pottery
Copper

Conclusions•Combustion in Small scale industries is largely inefficient and contributes substantially to regional PIC emissions.•Particle emissions impact macrophages which are a primary defense mechanism of the body. Decrease free radical production which impairs defense against infection. Increase NO production indicating an activation of immune inflammatory response•Toxicity of particles varies for different small scale industries both on a particle mass basis and an overall emission basis. Currently we are not sure of the drivers of the differential toxicity•Health implications and emissions of greenhouse species should not be generalized across types

Acknowledgements
•UC Mexus•UCI Environment Institute•Dr. Omar Maser•Dr Adrian Ghilardi•Dr Loyda Mendez•Dr Mike Kleinman•Dr Michael Johnson•Alejandro del Valle Reynoso•Melissa Benitez
Recommended