Health Budgets& Financial Policy
2009 UBO/UBU Conference2009 UBO/UBU ConferenceWhere the Pieces Come Together
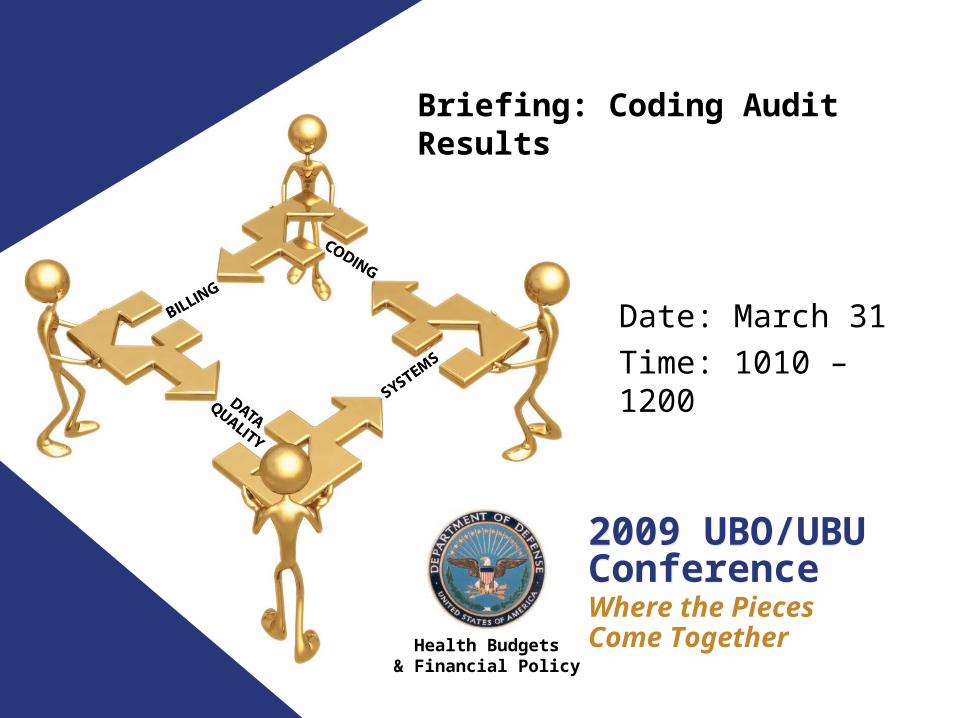
Date: March 31
Time: 1010 – 1200
Briefing: Coding Audit Results
2009 UBO/UBU ConferenceWhere the Pieces Come Together Objectives
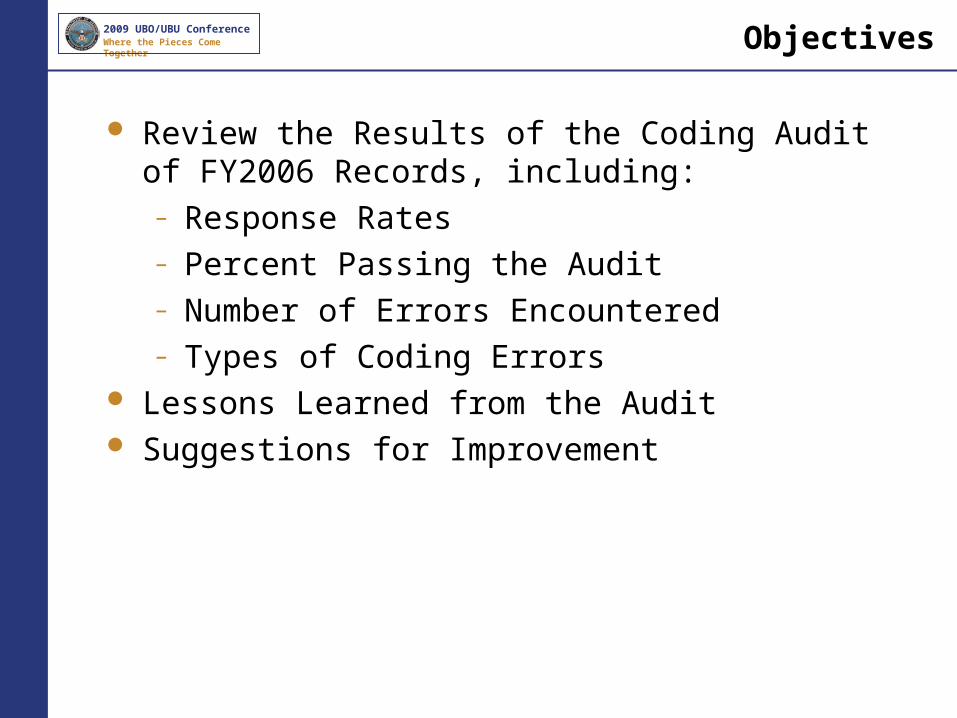
Review the Results of the Coding Audit of FY2006 Records, including:– Response Rates– Percent Passing the Audit – Number of Errors Encountered– Types of Coding Errors
Lessons Learned from the Audit Suggestions for Improvement
2009 UBO/UBU ConferenceWhere the Pieces Come Together
3
Audit Goals
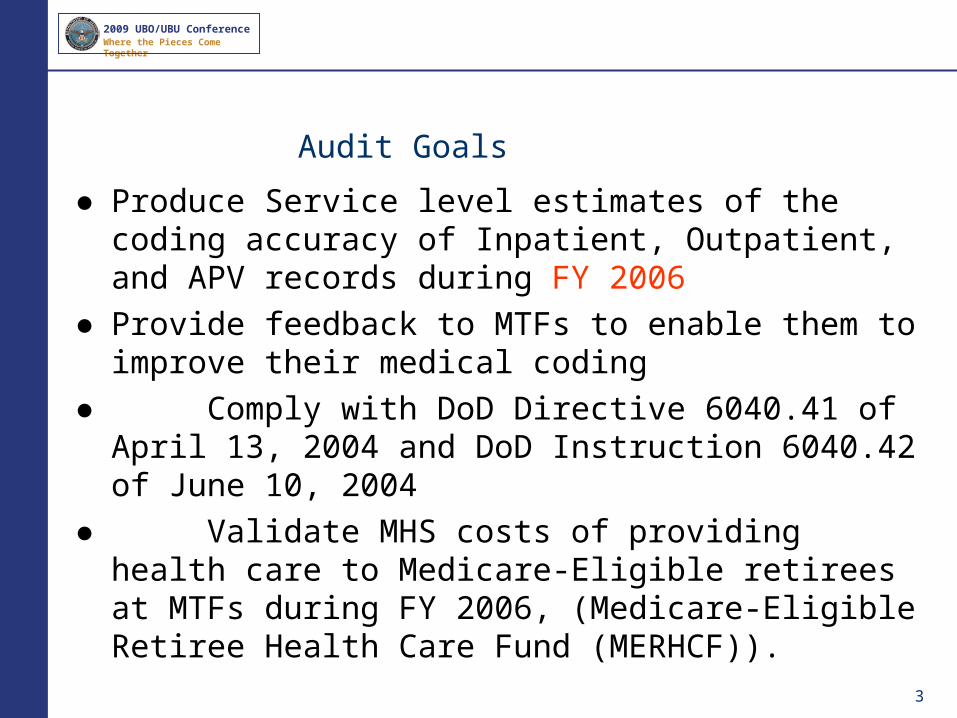
● Produce Service level estimates of the coding accuracy of Inpatient, Outpatient, and APV records during FY 2006
● Provide feedback to MTFs to enable them to improve their medical coding
● Comply with DoD Directive 6040.41 of April 13, 2004 and DoD Instruction 6040.42 of June 10, 2004
● Validate MHS costs of providing health care to Medicare-Eligible retirees at MTFs during FY 2006, (Medicare-Eligible Retiree Health Care Fund (MERHCF)).
2009 UBO/UBU ConferenceWhere the Pieces Come Together
4
Audit Methods
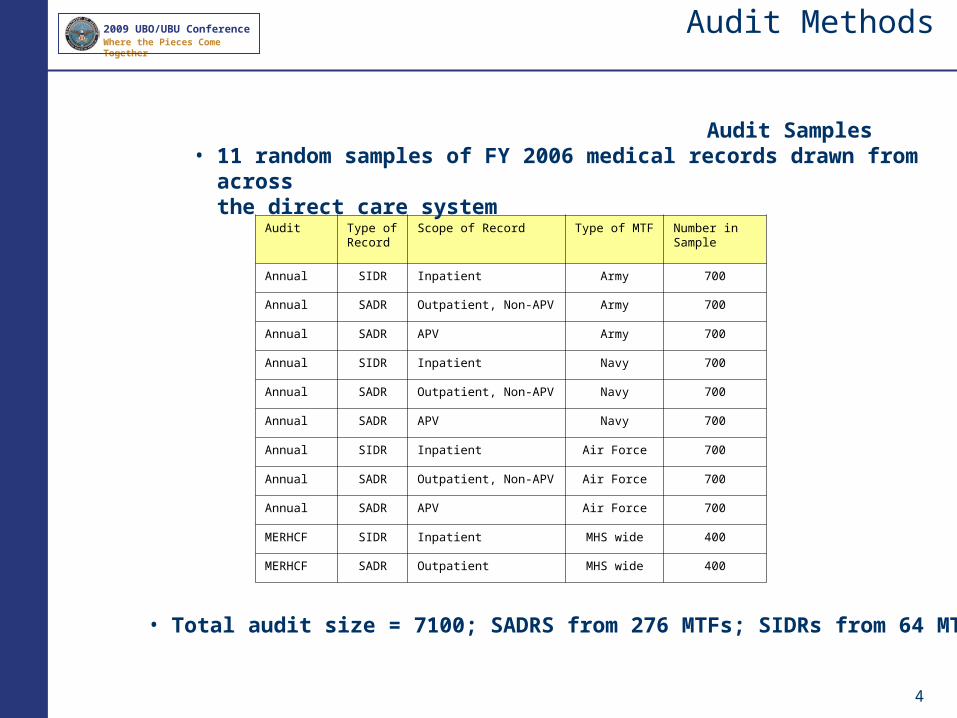
Audit Type of Record
Scope of Record Type of MTF Number in Sample
Annual SIDR Inpatient Army 700
Annual SADR Outpatient, Non-APV Army 700
Annual SADR APV Army 700
Annual SIDR Inpatient Navy 700
Annual SADR Outpatient, Non-APV Navy 700
Annual SADR APV Navy 700
Annual SIDR Inpatient Air Force 700
Annual SADR Outpatient, Non-APV Air Force 700
Annual SADR APV Air Force 700
MERHCF SIDR Inpatient MHS wide 400
MERHCF SADR Outpatient MHS wide 400
Audit Samples• 11 random samples of FY 2006 medical records drawn from across
the direct care system
• Total audit size = 7100; SADRS from 276 MTFs; SIDRs from 64 MTFs
2009 UBO/UBU ConferenceWhere the Pieces Come Together
Outpatient Results
2009 UBO/UBU ConferenceWhere the Pieces Come Together
6
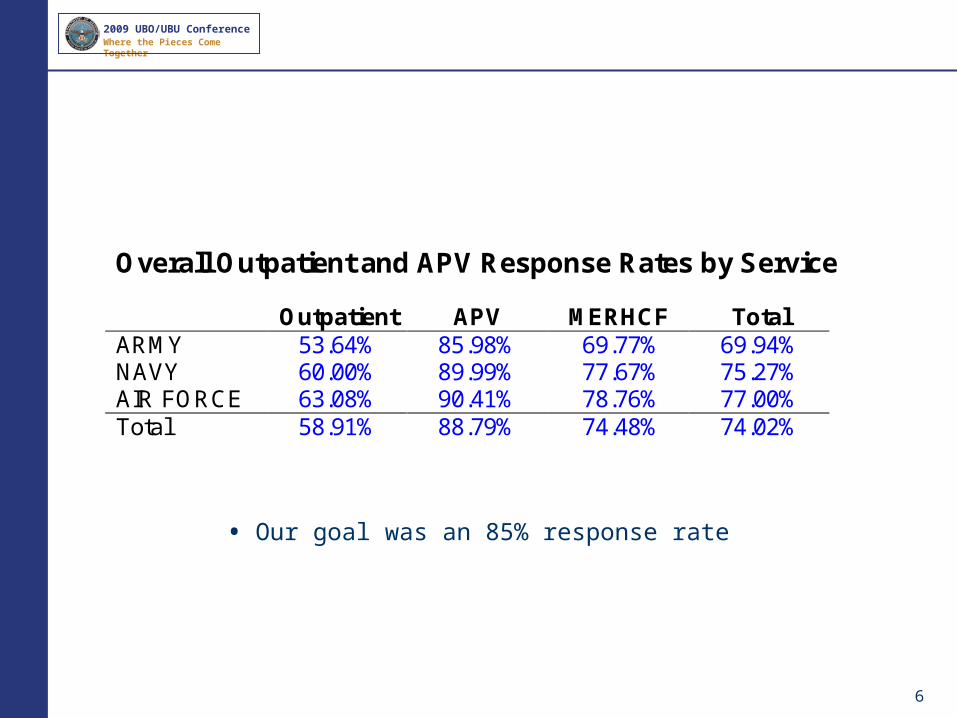
• Our goal was an 85% response rate
Overall Outpatient and APV Response Rates by Service Outpatient APV MERHCF Total ARMY 53.64% 85.98% 69.77% 69.94% NAVY 60.00% 89.99% 77.67% 75.27% AIR FORCE 63.08% 90.41% 78.76% 77.00% Total 58.91% 88.79% 74.48% 74.02%

2009 UBO/UBU ConferenceWhere the Pieces Come Together
Outpatient Response Rates by Bencat
0
10
20
30
40
50
60
70
80
90
100
AD ADFM DR DS G RET
Per
cen
t OP
APV
MERHCF
2009 UBO/UBU ConferenceWhere the Pieces Come Together
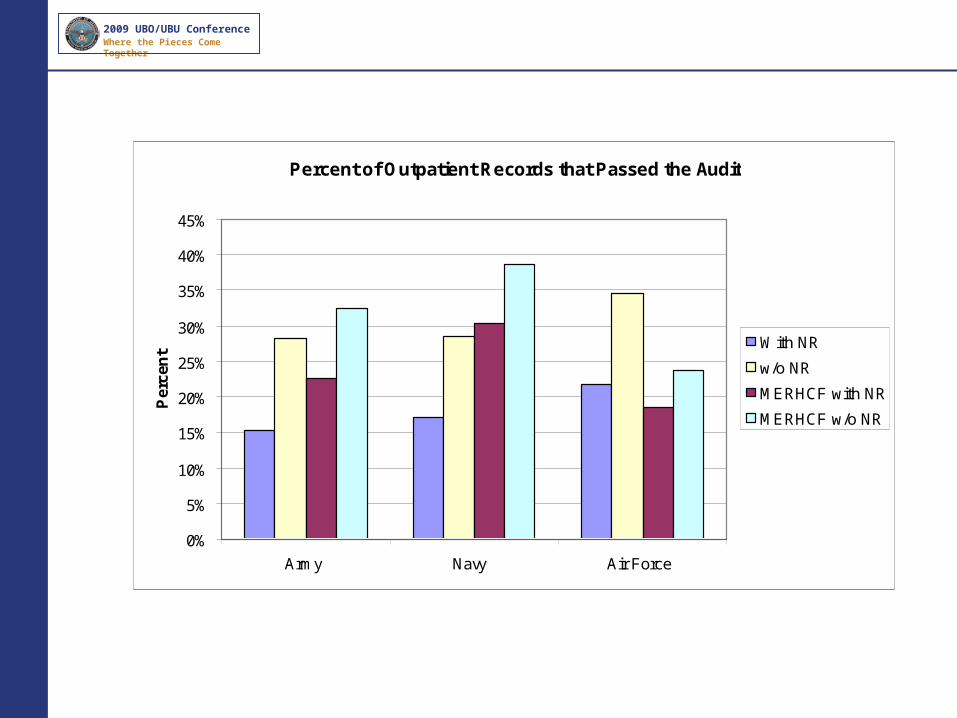
Percent of Outpatient Records that Passed the Audit
0%
5%
10%
15%
20%
25%
30%
35%
40%
45%
Army Navy Air Force
Per
cen
t
With NR
w/o NR
MERHCF with NR
MERHCF w/o NR
2009 UBO/UBU ConferenceWhere the Pieces Come Together
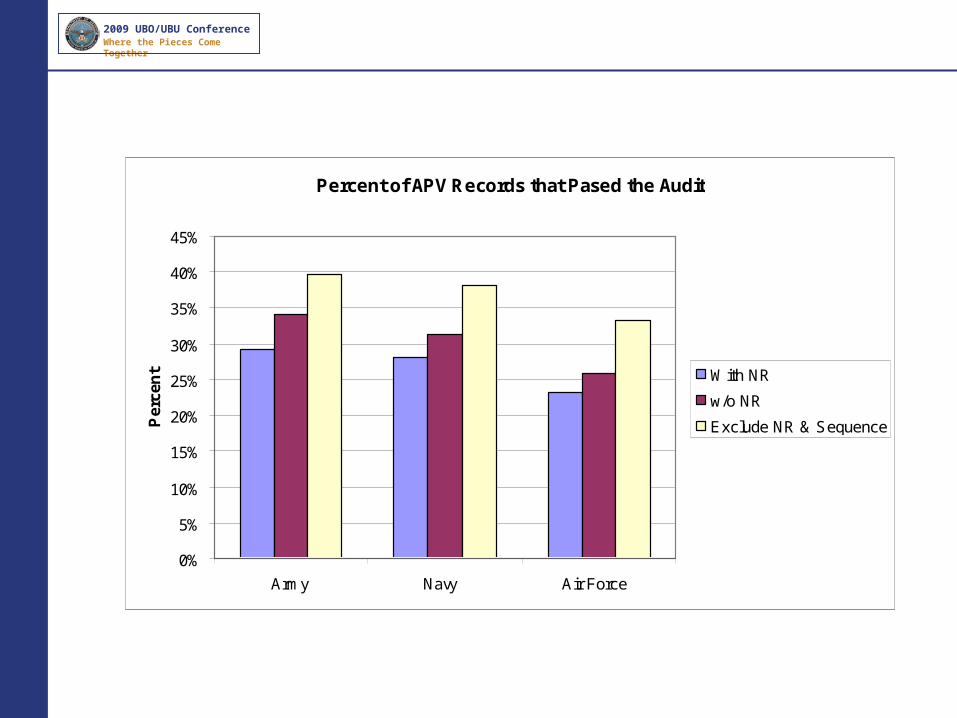
Percent of APV Records that Pased the Audit
0%
5%
10%
15%
20%
25%
30%
35%
40%
45%
Army Navy Air Force
Per
cen
t With NR
w/o NR
Exclude NR & Sequence
2009 UBO/UBU ConferenceWhere the Pieces Come Together
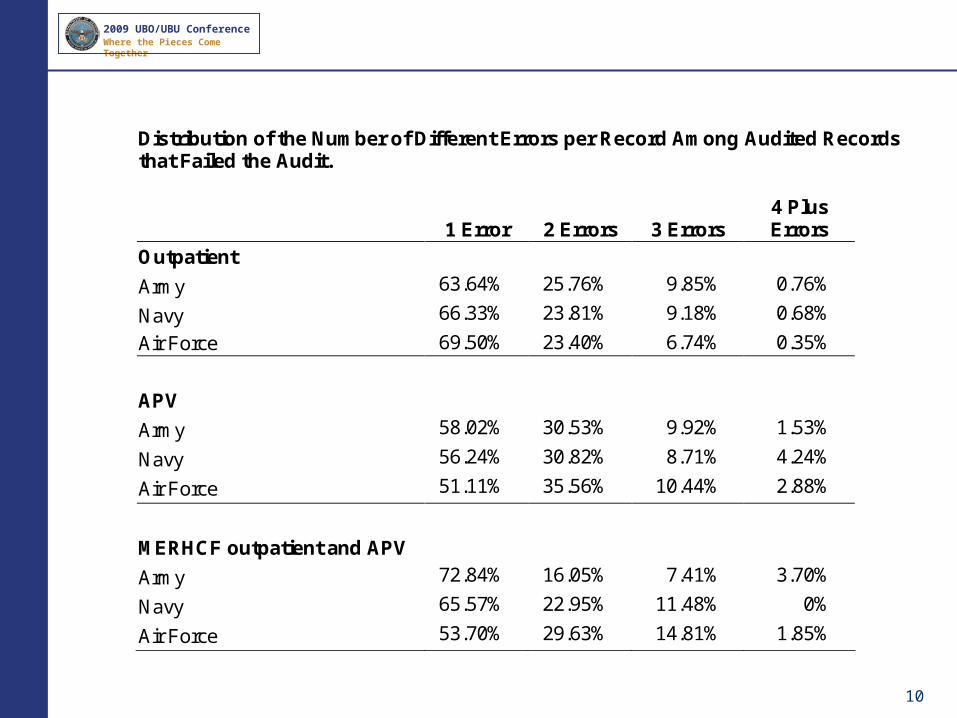
10
Distribution of the Number of Different Errors per Record Among Audited Records that Failed the Audit.
1 Error 2 Errors 3 Errors 4 Plus Errors
Outpatient
Army 63.64% 25.76% 9.85% 0.76%
Navy 66.33% 23.81% 9.18% 0.68%
Air Force 69.50% 23.40% 6.74% 0.35%
APV
Army 58.02% 30.53% 9.92% 1.53%
Navy 56.24% 30.82% 8.71% 4.24%
Air Force 51.11% 35.56% 10.44% 2.88%
MERHCF outpatient and APV
Army 72.84% 16.05% 7.41% 3.70%
Navy 65.57% 22.95% 11.48% 0%
Air Force 53.70% 29.63% 14.81% 1.85%
2009 UBO/UBU ConferenceWhere the Pieces Come Together
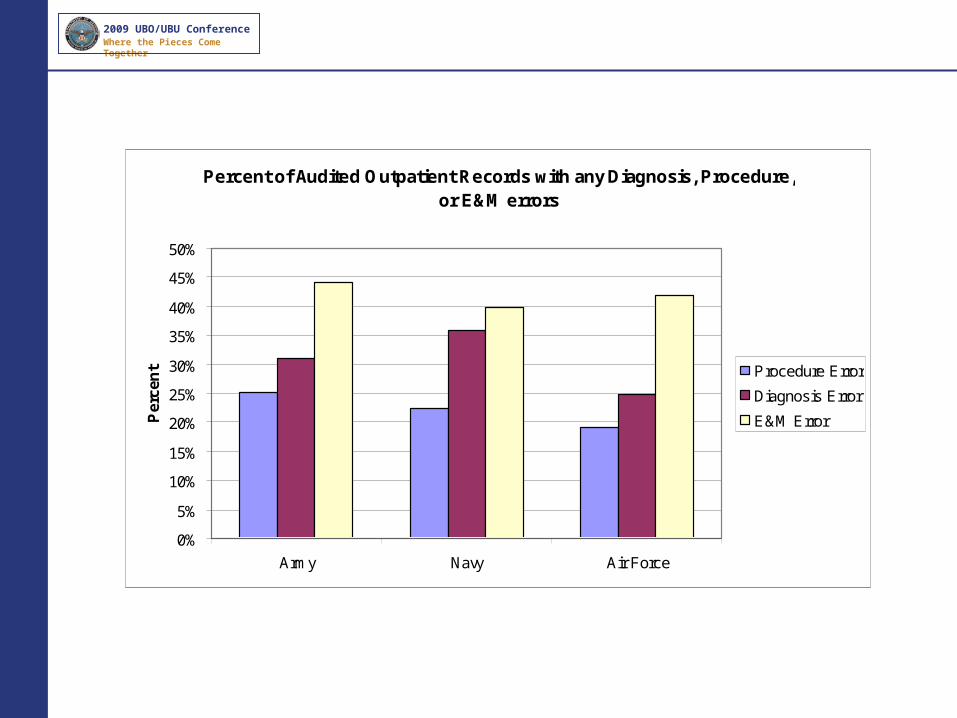
Percent of Audited Outpatient Records with any Diagnosis, Procedure, or E&M errors
0%
5%
10%
15%
20%
25%
30%
35%
40%
45%
50%
Army Navy Air Force
Per
cen
t Procedure Error
Diagnosis Error
E&M Error
2009 UBO/UBU ConferenceWhere the Pieces Come Together
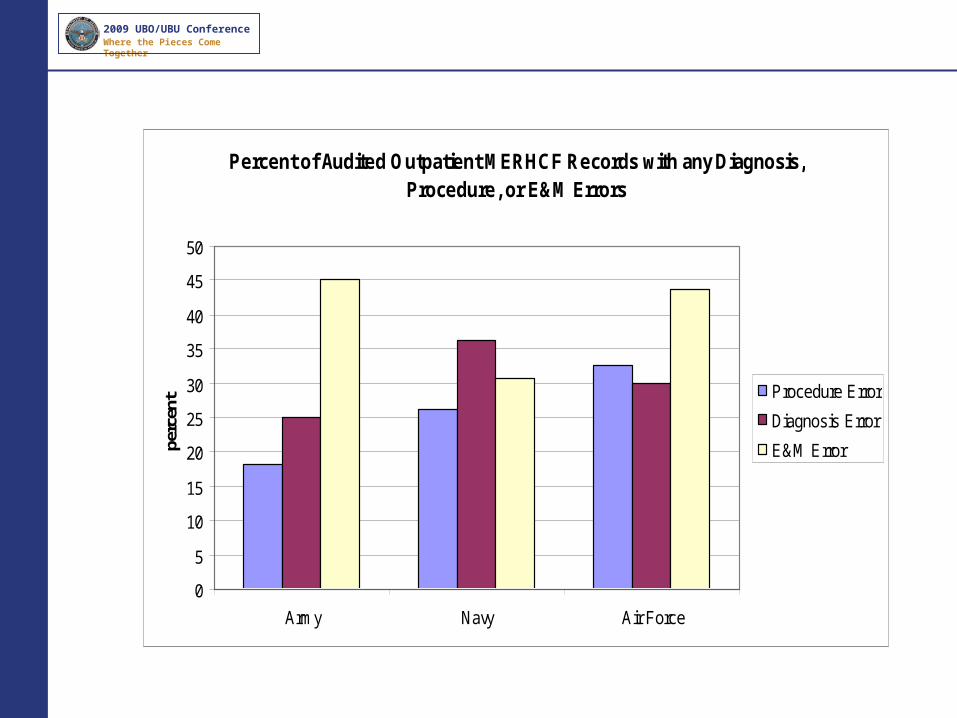
Percent of Audited Outpatient MERHCF Records with any Diagnosis, Procedure, or E&M Errors
0
5
10
15
20
25
30
35
40
45
50
Army Navy Air Force
perc
ent Procedure Error
Diagnosis Error
E&M Error
2009 UBO/UBU ConferenceWhere the Pieces Come Together
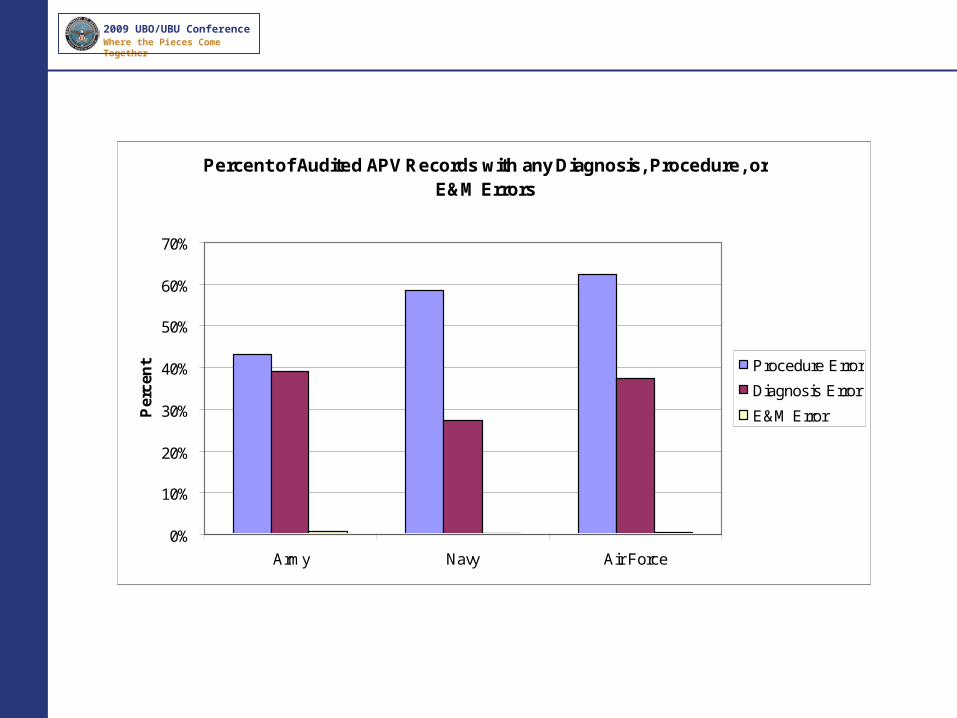
Percent of Audited APV Records with any Diagnosis, Procedure, or E&M Errors
0%
10%
20%
30%
40%
50%
60%
70%
Army Navy Air Force
Per
cen
t Procedure Error
Diagnosis Error
E&M Error
2009 UBO/UBU ConferenceWhere the Pieces Come Together
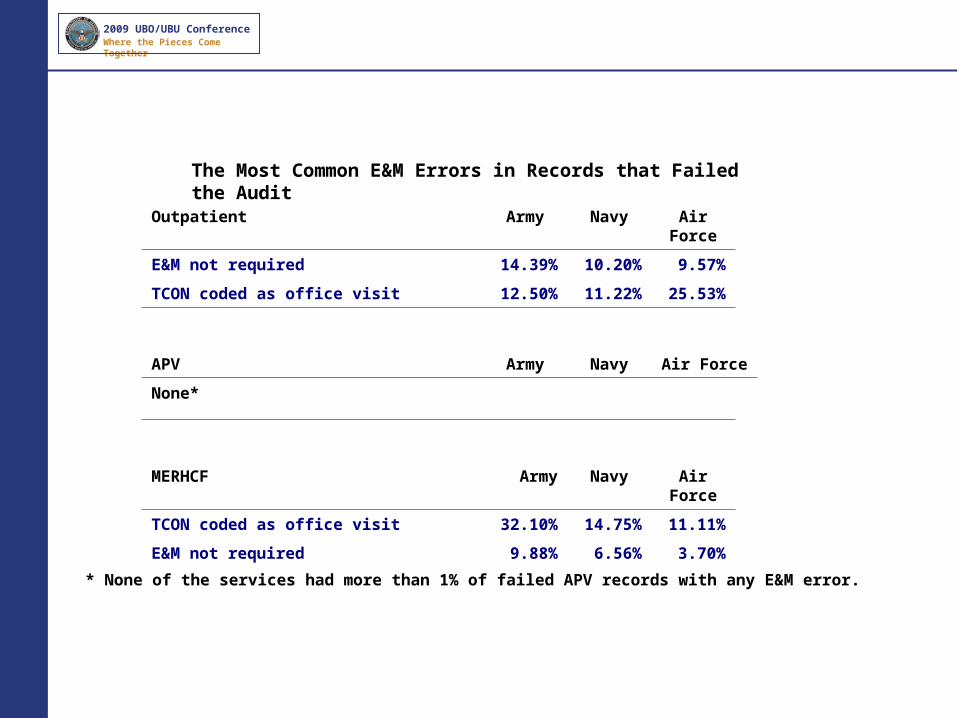
The Most Common E&M Errors in Records that Failed the Audit
Outpatient Army Navy Air Force
E&M not required 14.39% 10.20% 9.57%
TCON coded as office visit 12.50% 11.22% 25.53%
APV Army Navy Air Force
None*
MERHCF Army Navy Air Force
TCON coded as office visit 32.10% 14.75% 11.11%
E&M not required 9.88% 6.56% 3.70%
* None of the services had more than 1% of failed APV records with any E&M error.

2009 UBO/UBU ConferenceWhere the Pieces Come Together
The Most Common Diagnosis Errors in Records that Failed the Audit
Outpatient Army Navy Air Force Documentation does not support coded diagnosis
27.65% 24.49% 21.28%
Primary diagnosis not reason for visit 5.68% 2.72% 3.55% APV Army Navy Air Force Documentation does not support coded diagnosis
35.88% 21.65% 30.89%
Primary diagnosis not reason for visit 15.01% 9.65% 10.22% MERHCF Army Navy Air Force Documentation does not support coded diagnosis
20.99% 13.11% 31.48%
Primary diagnosis not reason for visit 6.17% 4.92% 5.56%
2009 UBO/UBU ConferenceWhere the Pieces Come Together
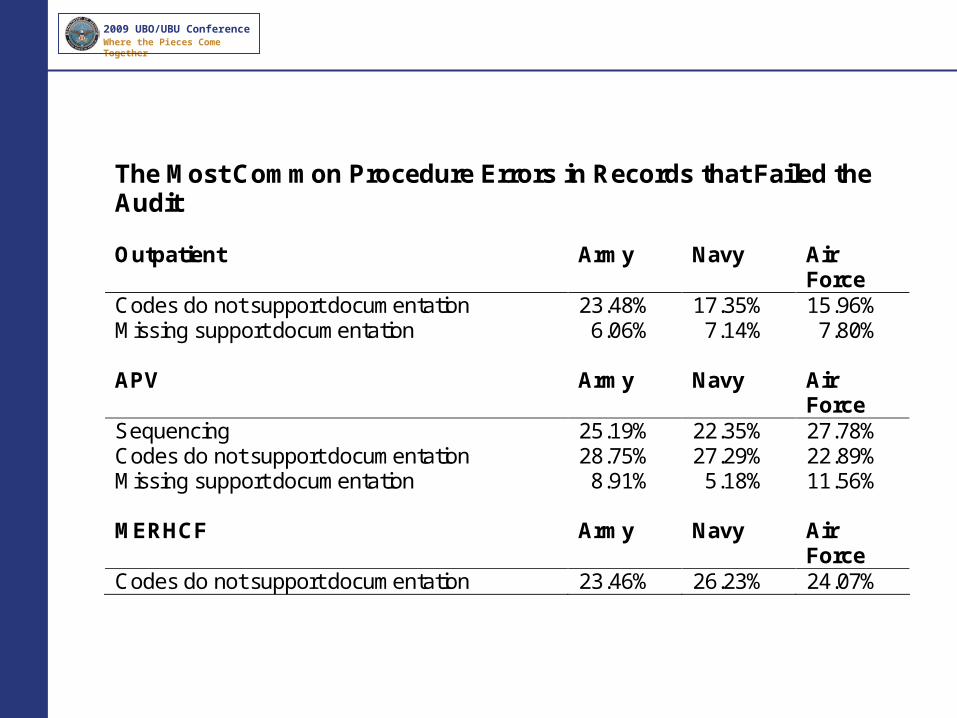
The Most Common Procedure Errors in Records that Failed the Audit Outpatient Army Navy Air
Force Codes do not support documentation 23.48% 17.35% 15.96% Missing support documentation 6.06% 7.14% 7.80% APV Army Navy Air
Force Sequencing 25.19% 22.35% 27.78% Codes do not support documentation 28.75% 27.29% 22.89% Missing support documentation 8.91% 5.18% 11.56% MERHCF Army Navy Air
Force Codes do not support documentation 23.46% 26.23% 24.07%
2009 UBO/UBU ConferenceWhere the Pieces Come Together
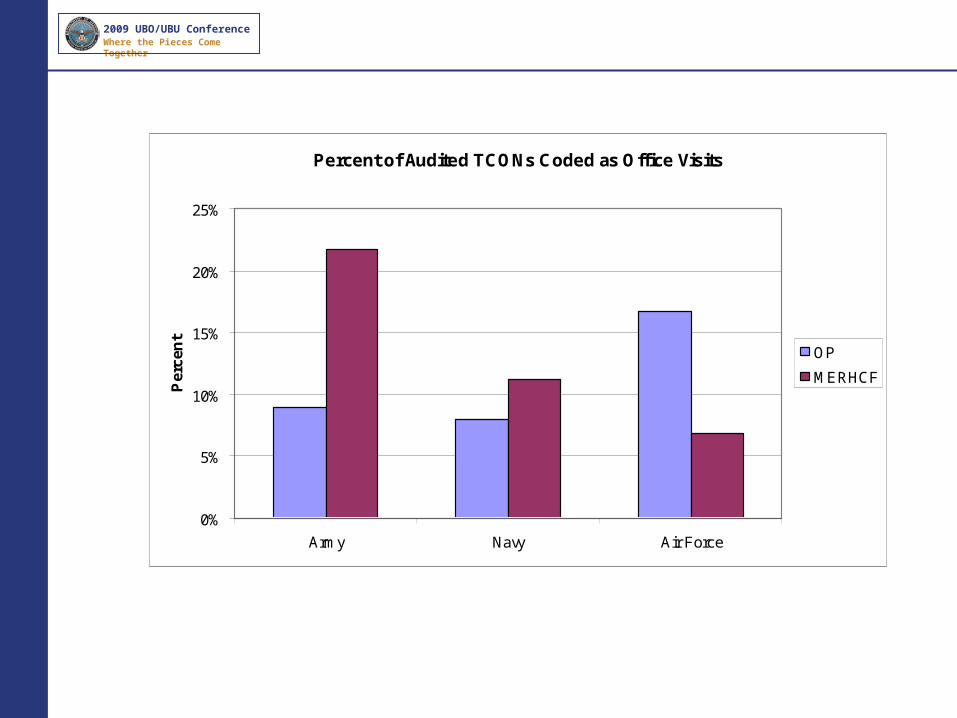
Percent of Audited TCONs Coded as Office Visits
0%
5%
10%
15%
20%
25%
Army Navy Air Force
Per
cen
t
OP
MERHCF
2009 UBO/UBU ConferenceWhere the Pieces Come Together
Inpatient Results
2009 UBO/UBU ConferenceWhere the Pieces Come Together
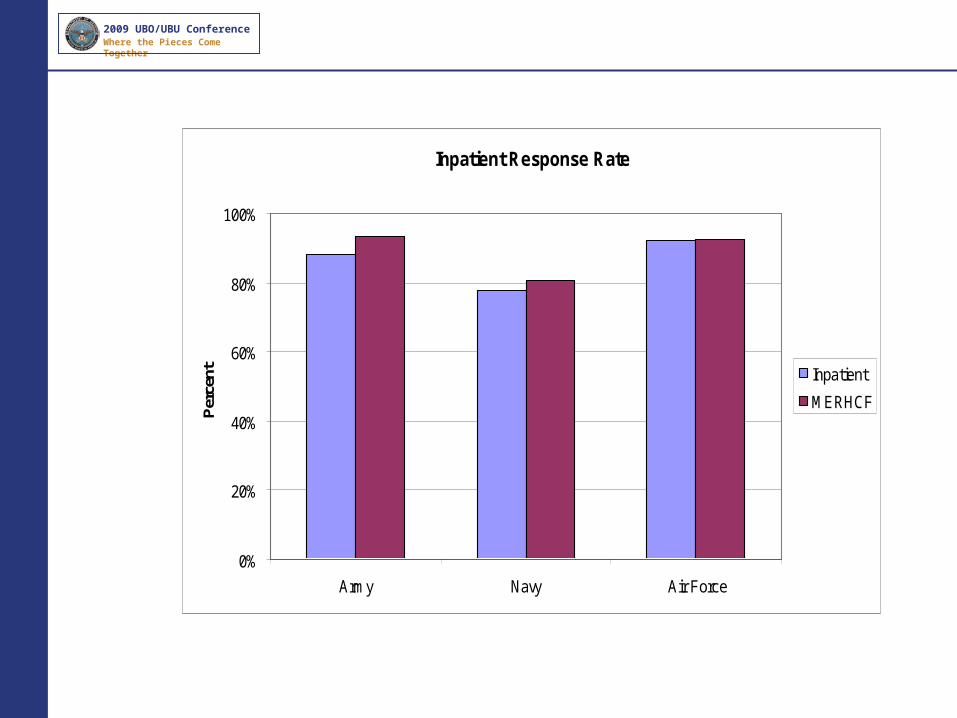
Inpatient Response Rate
0%
20%
40%
60%
80%
100%
Army Navy Air Force
Per
cent Inpatient
MERHCF

2009 UBO/UBU ConferenceWhere the Pieces Come Together
Percent of Inpatient Records that Passed the Audit Based On Correct DRG
0%
10%
20%
30%
40%
50%
60%
70%
80%
90%
100%
Army Navy Air Force
Per
cen
t with NR
w/o NR
MERHCF with NR
MERHCF w/o NR
2009 UBO/UBU ConferenceWhere the Pieces Come Together
21
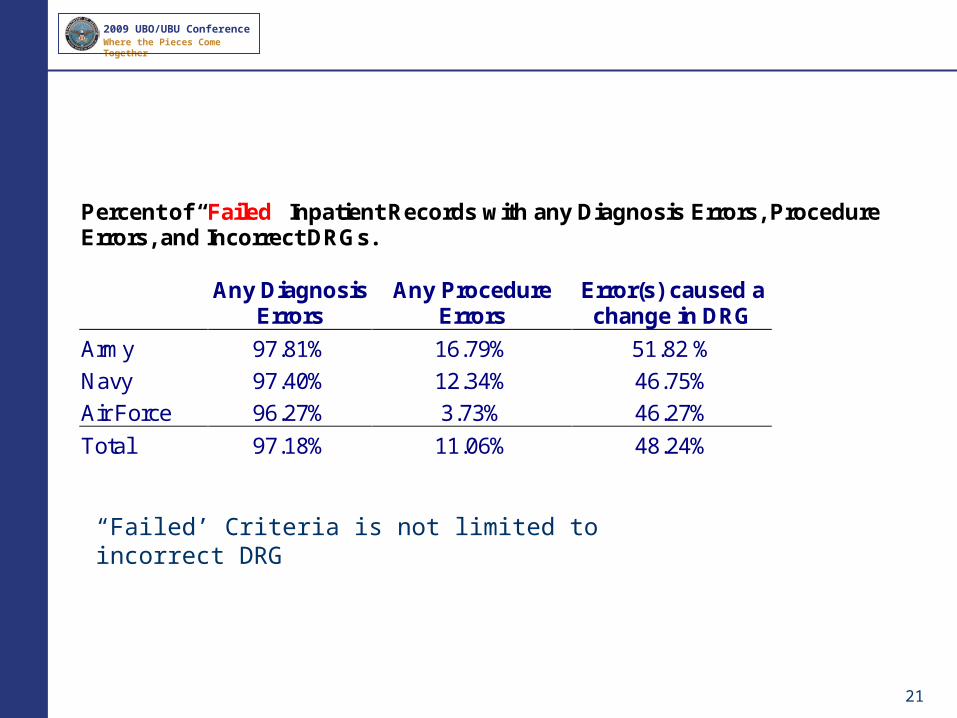
Percent of “Failed” Inpatient Records with any Diagnosis Errors, Procedure Errors, and Incorrect DRGs.
Any Diagnosis
Errors Any Procedure
Errors Error(s) caused a change in DRG
Army 97.81% 16.79% 51.82 %
Navy 97.40% 12.34% 46.75%
Air Force 96.27% 3.73% 46.27%
Total 97.18% 11.06% 48.24%
“Failed’ Criteria is not limited to incorrect DRG
2009 UBO/UBU ConferenceWhere the Pieces Come Together
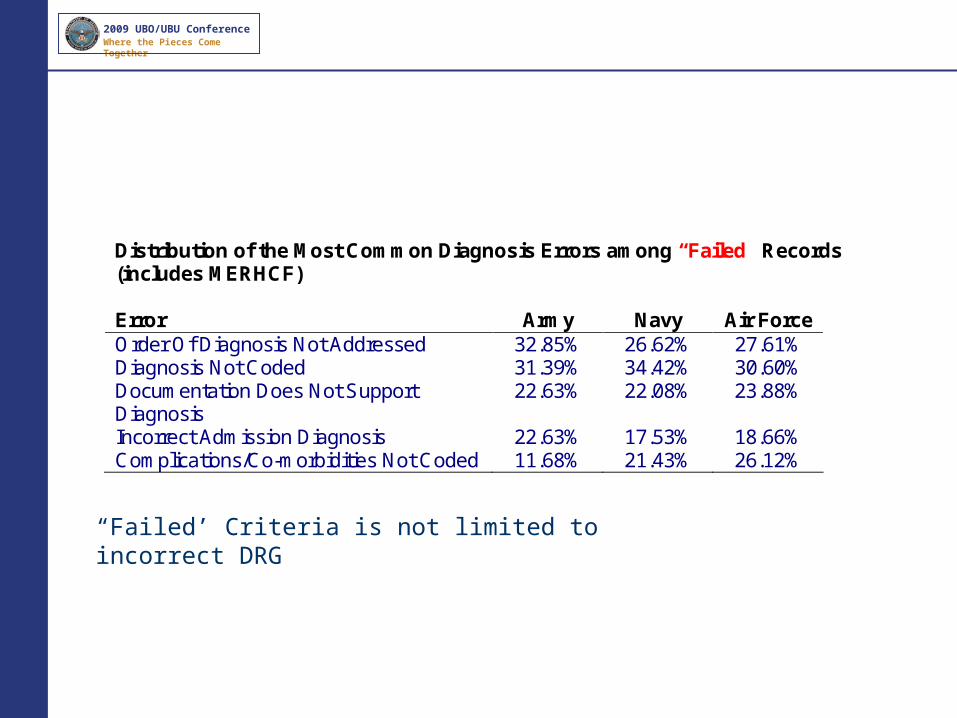
Distribution of the Most Common Diagnosis Errors among “Failed” Records (includes MERHCF) Error Army Navy Air Force Order Of Diagnosis Not Addressed 32.85% 26.62% 27.61% Diagnosis Not Coded 31.39% 34.42% 30.60% Documentation Does Not Support Diagnosis
22.63% 22.08% 23.88%
Incorrect Admission Diagnosis 22.63% 17.53% 18.66% Complications/Co-morbidities Not Coded 11.68% 21.43% 26.12%
“Failed’ Criteria is not limited to incorrect DRG

2009 UBO/UBU ConferenceWhere the Pieces Come Together
Quality Assurance
23
Percent Agreement Inter-examiner Reliability (Agreement between the Study Auditor and a Reference
Auditor) Agreement
SIDR 93.42% SADR 96.35%
Percent Agreement for Intra-examiner Reliability(Agreement between the Study Auditor and themselves)
Agreement SIDR 96.49%SADR 97.65%

2009 UBO/UBU ConferenceWhere the Pieces Come Together Summary
Reviewed the Results of the Coding Audit of FY2006 Records, including:– Response Rates– Percent Passing the Audit – Number of Errors Encountered– Types of Coding Errors
Lessons Learned from the Audit Suggestions for Improvement
2009 UBO/UBU ConferenceWhere the Pieces Come Together Speaker Information
<Redacted>
Recommended