Healthcare Measure Development Meeting
August 24, 2018

Agenda
• Introduction
• Overview of Human Services Performance Management System
• Overview of Measure Development Process
• Overview of Healthcare Applications
• Overview of Balanced Sets of Measures
• Measure Development Exercises2

Agenda
Overview of Human Services Performance Management System
3

History
• 2009 Service Delivery Act• Established Steering Committee• Recommendations made in 2012 report
• 2013 Legislation• Adopted recommendations• Provided resources• Established Performance Council
• 2014 Planning• Built structure• Hired staff• Provided baseline reports• Established thresholds
• 2015 Implementation4
Children’s services
Adult services
Income supports

Mission and Values
Mission: to improve outcomes for people through creativity, flexibility, accountability,
collaboration, and performance management
Values: accountability, collaboration, continuous improvement, equity, flexibility,
inclusiveness, reliance on data, sustainability, and transparency
No single entity can achieve client outcomes alone.
We need to work together to improve lives for the people we serve.
5

Performance
Assureperformance
thresholds are metImprovement
Provide technical assistance
Measurement
Developperformance framework
Develop Performance Improvement Plans
Performance Management System Overview
The Human Services Performance Management System creates an opportunity for the Minnesota Department of Human
Services, counties, and community partners to work more closely together to improve the lives of people served.
Goals:• Establish shared outcomes and measures • Allow counties more flexibility in the “how”
• Emphasis on continuous improvement • Ensure achievement of positive outcomes
• Create accountability and provides transparency

Outcomes and Measures
Adults and children are safe and secure
Of all children who were victims of a substantiated maltreatment report during a
12-month reporting period, the percent who were not victims of another
substantiated maltreatment report within 12 months of their initial report.
Percent of vulnerable adult maltreatment
allegations where there is not a repeat of the
same type within six months
Children have stability in their living situation
Of all children who enter foster care in a 12-month period, the percent who are
discharged to permanency within 12 months of entering foster care. (Includes
discharges from foster care to reunification with the child’s parents or primary
caregivers, living with a relative, guardianship, or adoption.)
Percent of current child support that is paid
Children have the opportunity to develop to their fullest potential
Of all days that children spent in family foster care settings during a 12-month
reporting period, the percentage of days spent with a relative.
Percent of open child support cases for which
paternity is established
People are economically secure
Percent of MFIP/DWP adults
working 30 or more hours per
week or off cash assistance
three years after baseline (Self-
Support Index)
Percent of expedited SNAP
applications where support was
issued within one business day
of application
Percent of public assistance
applicants who received
benefits within mandated
timeframes
Percent of open child support
cases with a child support order
established
Vulnerable adults experience quality of life
People have access to health care and receive effective services

Agenda
Overview of Measure Development Process
8

Measure Development Approach
• Bring together stakeholders from DHS, Counties, and the community to develop shared measures.
• Performance management is more than developing measures. A successful system integrates the use of data into all facets of the organization.
• We meet our partners where they are on their performance management journey to develop a system that meets their organizations unique needs.
• We leverage our partners expertise throughout the process of developing a performance management system.
9

Team Team Members Team Responsibilities
Steering Committee
• Representatives from DHS
• Representatives from Counties
• Agency & County Performance
• Provide background information and understanding of DHS Healthcare services
• Provide feedback on key deliverables
• Guide measure development work
Data Team • Representatives from Policy, Program,
and Data areas
• Conduct research and provide information aboutHealthcare
• Collect information needed to review Healthcare
Measure
Development Team
• Representatives from DHS
• Representatives from Counties
• Provider representatives
• Partners and advocates
• Provide subject matter expertise, experience, and strategic thinking to develop
Performance Measures forADAD
Agency & County
Performance Project
Team
• Carol Becker, project manager
• Olufemi Fajolu, county data
• Gary Mortensen, HSPM
• Manage the measurement development, gaps analysis, and data infrastructure
phases of the project
• Facilitate the outcome measures development conversations
• Collect and manage project information from County and DHS teams
• Synthesize key findings to develop measurement inventory, data inventory and
program inventory.
Team Roles and Responsibilities

Project Overview (page 1 of 2)
• Steering committee of DHS and county staff identifies participants and reviews meeting agenda.
• Host meeting of DHS, county and community folks to discussion current measures, the Balanced Framework and potential new measures.
• Outcome: List of potential new measures.
• Give list of potential new measures to data team to determine what is feasible.
• Get participants from meeting back together to discuss which potential new measures:
• are feasible.• have data quality issues and what could be done about that.• could be built into future system development.• will not be possible anytime soon.
11

Project Overview (page 2 of 2)
• For measures that are currently possible, move them into the existing measurement processes.
• Develop draft measures for each county. Give them a year to adjust their processes before moving the measure into the PIP process.
• For measures that have data quality issues, carry out discussions among DHS, counties and providers to identify what is needed to improve data quality.
• For measures that could be included in future system development, ensure that these needs are included in planning documents.
• For measures that are not possible, hold further discussions on how to address these needs.
• Repeat process as necessary.
12
Agenda
Overview of Healthcare Applications
13

Health Care Application Processing
Performance Measures Development
August 24, 201814

Federal and State Requirements
• Plain language, accessible, LEP services
• Apply without delay
• No face-to-face interview required
• Questions only needed to determine eligibility
• Agency must provide assistance to applicants
• Document information needed to determine eligibility
• Must take action and notify applicant
• 15-45-60 day processing timelines
15

16
Past Applications

17
Applications and Supplements
• DHS-3531-ENG Application for Medical Assistance for Long-Term-Care Services (MA-LTC)
• DHS-3876-ENG MHCP Application for Certain Populations
• DHS-6696-ENG MNsure Application for Health Coverage and Help Paying Costs
• DHS-6696A-ENG Supplement to MNsure Application (DHS-6696) for Health Coverage and Help Paying Costs
• DHS-6696B-ENG Supplement to the Minnesota Health Care Programs Application (DHS-3876)

Procedures
THEN
• MMIS User Manual
• POLI/TEMP
• Combined Manual (CM)
NOW
• ONEsource
• POLI/TEMP
18

Changing Landscape
19
•Affordable Care Act/MNsure
•Integrated Services Business Model (ISBM)
•Systems Modernization
•Age Wave

Thank You!
Kim Carolan
Christina Cox
20

Agenda
Overview of Balanced Sets of Measures
21

Background
Statutory Requirement - 402A.10 Definitions
Subd. 1a.Balanced set of program measures.
A "balanced set of program measures" is a set of measures that, together, adequately quantify achievement toward a particular program's outcome. As directed by section 402A.16, the Human Services Performance Council must recommend to the commissioner when a particular program has a balanced set of program measures.
Subd. 4d.Performance management system for human services.
A "performance management system for human services" means a process by which performance data for essential human services is collected from counties or service delivery authorities and used to inform a variety of stakeholders and to improve performance over time.
22

Background
Research
• Partnered with the Management Analysis and Development team at MN Management and Budget to guide us in the development of planning Balanced Sets of Measures
• Researched scorecards and performance measures used by other organizations
• Interviewed organizations with strong performance management systems
• Presented to MACSSA Forum for feedback
23

Balanced Sets of Measures – Guiding Principles
• A list of ten guiding principles was created to ensure measures are developed with people and communities at the core, the stakeholders involved, and using the principles of Results-Based Accountability.
• The measures developed will represent the core components that create a strong program so that we can identify and promote what is working, identify systemic issues and work with counties to improve performance.
24
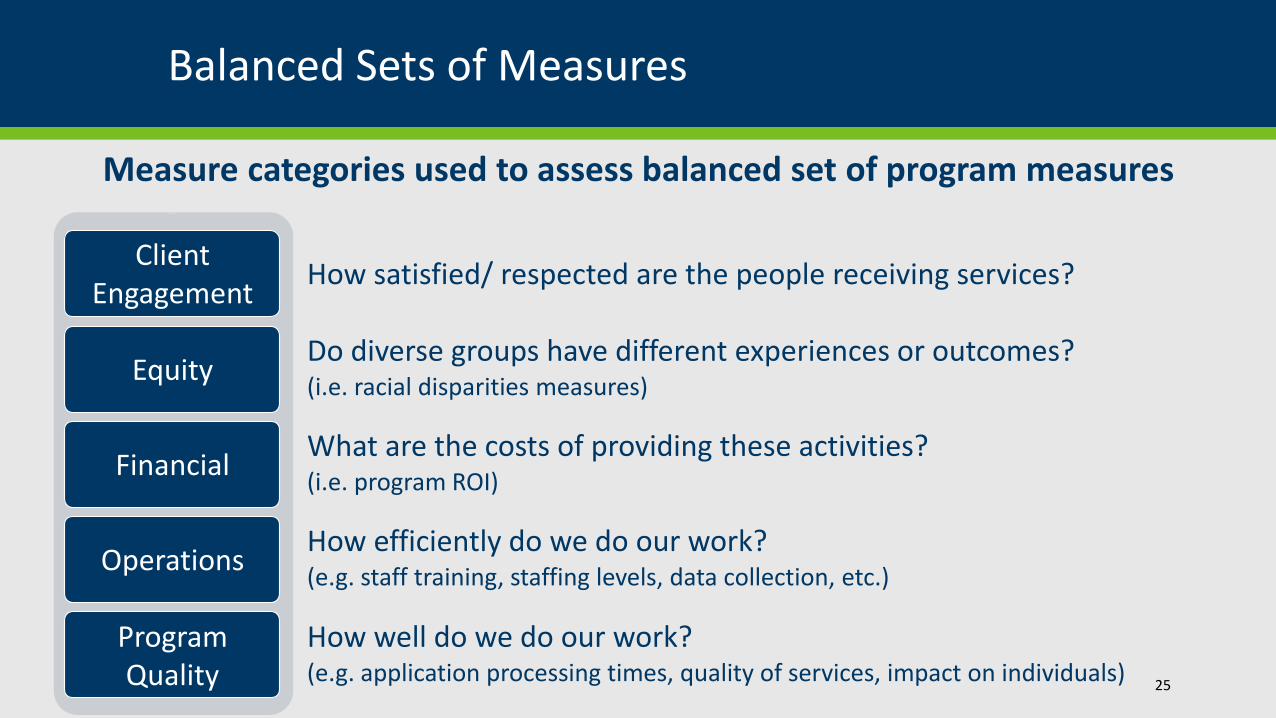
Category How it will be used
Client Engagement
How satisfied/ respected are the people receiving services?
EquityDo diverse groups have different experiences or outcomes? (i.e. racial disparities measures)
FinancialWhat are the costs of providing these activities? (i.e. program ROI)
Operations How efficiently do we do our work? (e.g. staff training, staffing levels, data collection, etc.)
Program Quality
How well do we do our work? (e.g. application processing times, quality of services, impact on individuals)
Balanced Sets of Measures
Measure categories used to assess balanced set of program measures
25
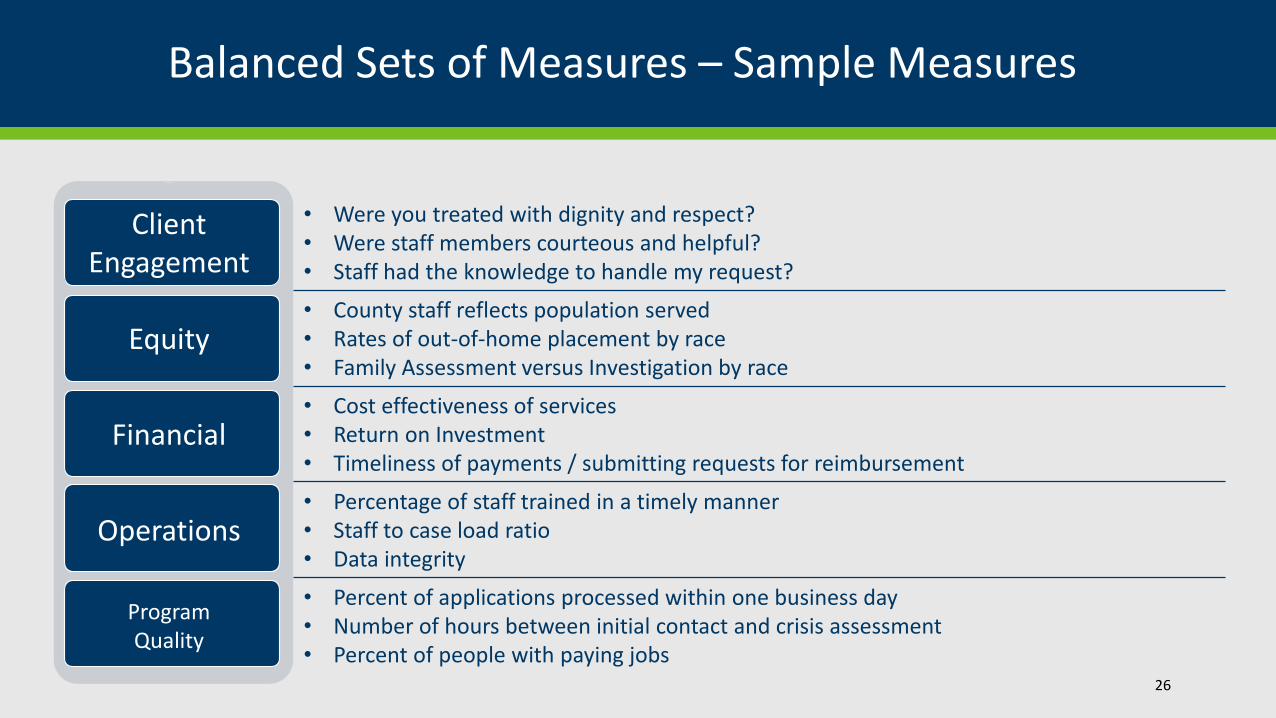
Category Sample Measures
Client Engagement
• Were you treated with dignity and respect?• Were staff members courteous and helpful?• Staff had the knowledge to handle my request?
Equity• County staff reflects population served• Rates of out-of-home placement by race• Family Assessment versus Investigation by race
Financial• Cost effectiveness of services• Return on Investment• Timeliness of payments / submitting requests for reimbursement
Operations • Percentage of staff trained in a timely manner• Staff to case load ratio• Data integrity
Program Quality
• Percent of applications processed within one business day• Number of hours between initial contact and crisis assessment• Percent of people with paying jobs
Balanced Sets of Measures – Sample Measures
26

Criteria Description of Criteria
DataPower
Timely, reliable, currently exists, easily accessible, high validity, low
human error
CommunicationPower
Easily understood, compelling to stakeholders
ProxyPower
Says something of central importance, matches direction of other
measures in the mix
Balanced Sets of Measures
Measure criteria used to select and create a balanced set of measures
27

Comprehensive Performance Measurement Framework
28

Questions?

Agenda
Results Based Accountablity
30

Key RBA concepts
• Two levels of accountability: population and program
• Three questions for program accountability
• How much did we do?
• How well did we do it?
• Is anyone better off?
Optional Tagline Goes Here | mn.gov/dhs 31

Results accountabilityis made up of two parts
Performance accountability:
about the well-being of
client populations
For Programs – Agencies – Service Systems
Population accountability:
about the well-being of
whole populations
For Communities – Cities – Counties – States – Nations
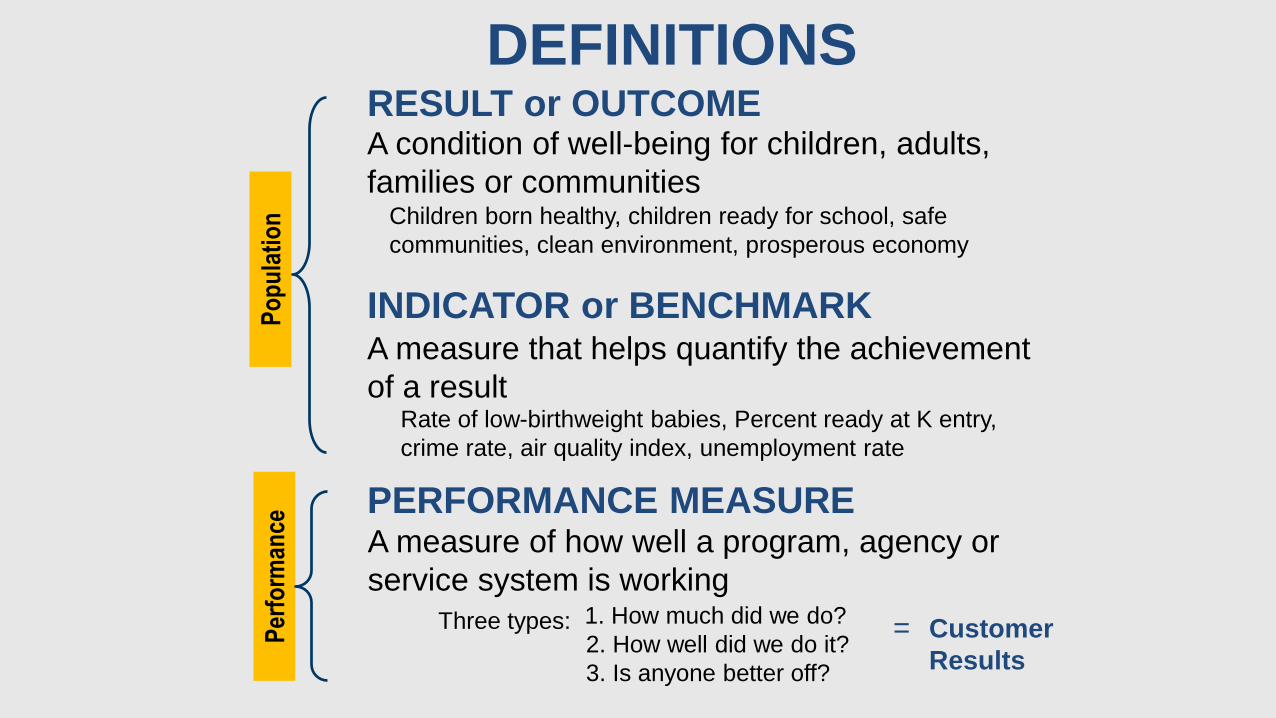
DEFINITIONS
Rate of low-birthweight babies, Percent ready at K entry,
crime rate, air quality index, unemployment rate
1. How much did we do?
2. How well did we do it?
3. Is anyone better off?
RESULT or OUTCOME
INDICATOR or BENCHMARK
PERFORMANCE MEASURE
A condition of well-being for children, adults,
families or communities
A measure that helps quantify the achievement
of a result
A measure of how well a program, agency or
service system is working
Three types: = Customer
Results
Po
pu
lati
on
Per
form
ance
Children born healthy, children ready for school, safe
communities, clean environment, prosperous economy

From Ends to Means
ENDS
MEANS
Po
pu
lati
on
Perf
orm
an
ce
RESULT or OUTCOME
INDICATOR or BENCHMARK
PERFORMANCE
MEASURECustomer result = Ends
Service delivery = Means
From Talk to Action

Key concept 1:
Population accountability
For whole populationsin a geographic area

DEFINITIONS
Rate of low-birthweight babies, Percent ready at K entry,
crime rate, air quality index, unemployment rate
1. How much did we do?
2. How well did we do it?
3. Is anyone better off?
RESULT or OUTCOME
INDICATOR or BENCHMARK
PERFORMANCE MEASURE
A condition of well-being for children, adults,
families or communities
A measure that helps quantify the achievement
of a result
A measure of how well a program, agency or
service system is working
Three types: = Customer
Results
Po
pu
lati
on
Per
form
ance
Children born healthy, children ready for school, safe
communities, clean environment, prosperous economy

Which population are we talking about?

• A safe city
• Inclusive and diverse communities
• Citizens value and protect the natural
environment
• A well-governed county
• A prosperous community
Sample Community Results

Results and Indicators

Key concept 2:
Performance Accountability
For programs, agencies and service systems

Results accountabilityis made up of two parts
Performance accountability:
about the well-being of
client populations
For Programs – Agencies – Service Systems
Population accountability:
about the well-being of
whole populations
For Communities – Cities – Counties – States – Nations

How
Muchdid we do?
( # )
How
Welldid we do it?
( % )
Quantity Quality
Performance Measures

EffortHow hard did we try?
EffectIs anyone better off?
Performance measures

How much
did we do?
Program performance measures
How well
did we do
it?
Is anyone
better off?
Quantity Quality
Eff
ect
E
ffo
rt
# %

How much did we
do?
Education
How well did we do
it?
Is anyone better off?
Quantity Quality
Eff
ect
E
ffo
rt Number of
students
Student-
teacher
ratio
Number of
high school
graduates
Percent of
high school
graduates

RBA Categories Account for All Performance Measures(in the history of the universe)
Quantity Quality
Efficiency, Admin overhead, Unit cost
Staffing ratios, Staff turnover
Staff morale, Access, Waiting time,
Waiting lists, Worker safety
Customer Satisfaction(quality service delivery
& customer benefit)
Cost / Benefit ratio
Return on investment
Client results or client outcomes
Effectiveness
Value added
Productivity
Benefit value
Product
Output
Impact
Process
Input
Eff
ect
Eff
ort
Cost
TQM
Effectiveness
Efficiency

How much did we
do?
Not All Performance Measures Are Created Equal
How well did we do
it?
Is anyone better off?
LeastImportant
Quantity Quality
Eff
ect
E
ffo
rt
MostImportant
Least
Most
Also
Very Important
How much did we
do?
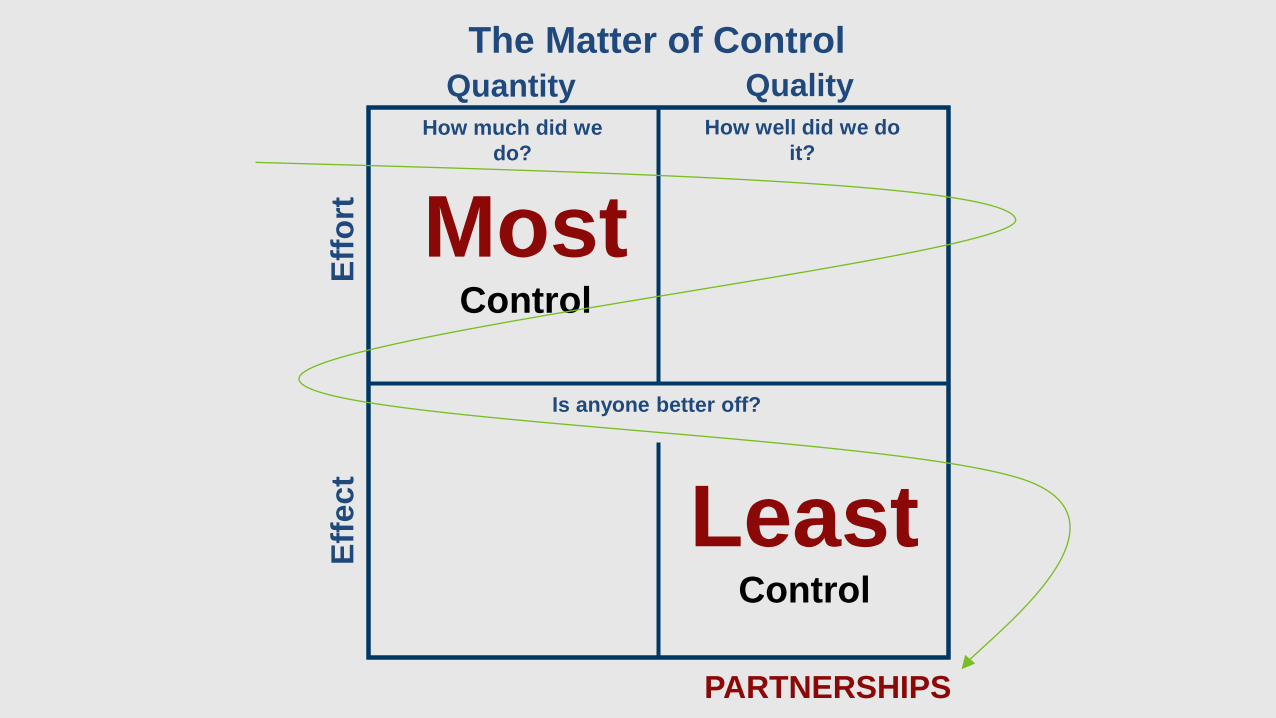
The Matter of Control
How well did we do
it?
Is anyone better off?
Quantity Quality
Eff
ect
E
ffo
rt
LeastControl
PARTNERSHIPS
MostControl

How much did we do?
Types of measures found in each quadrant
How well did we do it?
Is anyone better off?
# Clients/customers
served
# Activities (by type
of activity)
% Common measures
client staff ratio, workload ratio, staff
turnover rate, staff morale, % staff fully
trained, % clients seen in their own
language, worker safety, unit cost
% Skills / Knowledge(e.g. parenting skills)
#
% Attitude / Opinion(e.g. toward drugs)
#
% Behavior(e.g. school attendance)
#
% Circumstance (e.g. working, in stable housing)
#
% Activity-specific measures
% timely, % clients completing activity,
% correct and complete, % meeting
standard
Point in time
vs. point-to-point
improvement

The matter of use
1. The first purpose of performance
measurement is to
IMPROVE PERFORMANCE.
2. Avoid the “performance measurement equals
punishment trap.”
• Create a healthy organizational
environment.
• Start small.
• Build bottom-up and top-down
simultaneously.

Different Descriptions of Progress
1. Data
a) Population indicators: movement for the better away from the baseline
b) Program performance measures: customer progress and better service
How much did we do?How well did we do it?Is anyone better off?
2. Accomplishments: Positive activities, not included above
3. Stories behind the statistics that show how individuals are better off

Agenda
Measure Development Exercises
52

Ground Rules
• All voices hold equal weight
• Respect others, respect yourself
• This is only one step in the process
• Do not assume we are all on the same page
53

Table Introductions
• Share your name
• What “hat” you’re wearing today (your role or roles)
• Ice Breaker
54
Table Introductions
• Share your name
• What “hat” you’re wearing today (your role or roles)
• Ice Breaker
55

Healthcare Application Processing Measures Development Meeting Outcomes: Measures and Data Requests
The potential measures listed below were generated by a workgroup held on Aug. 24, 2018. Participants included representatives from counties and DHS. All potential measures are listed in bold below.
Potential Measures
Average Processing Time
Measure:
• Average processing time per application type
Discussion included the need for the following data by county and application type, in both METS and MAXIS:
• Number of applications received• Number of applications completed• Number of applications still in process• Average number of days prior to moving to a pending status
Meeting participants requested ongoing reporting of this data to assist in county improvement efforts, specifically the number of applications processed within the reporting period, the number and percent of applications processed within the specified time frame for that form (30/60 days depending)
Accuracy
Measures:
• Error rate, the number and percent of applications processed accurately during the reporting period.• Percent of applications approved/Percent of applications denied during this period (Denial rate)• Percent of applications processed without any extra intervention
Discussion included the need for the following data by county and application type, in both METS and MAXIS:
• Number of applications received• Number of applications completed• Number of applications still in process

• Number of applications entered into both systems • Count of applications denied by reason • Number of applications that required reentry
Population Utilization
Measure:
• Percent of population that could be receiving MA but are not (would need to develop threshold for this measure)
Discussion included the need for the following data by county/SDA:
• Number of people receiving health insurance of any type (from MDH) • Number of people eligible for MA • Number of people receiving MA/active on healthcare • Denial rate
Healthcare Utilization
Measures:
• Percent of people actively on MA that used their healthcare benefits o Break down utilization by major categories like preventative care, ER, mental health, dental,
transportation etc.
Meeting participants did not discuss specific data points for this measure.
Equity
Measures:
• Application approval and denial rates by different populations • Number of people using services from different populations • Percent of applications for non-English speakers determined timely and accurately • Number of people receiving coverage by race
Discussion included the need for the following data by county:
• Number of applications by racial and ethnic groups • Number of citizens versus non-citizens by application • Number of applications requested in other languages, by language • Number of incomplete LEP applications

Staffing
Measures:
• Ratio of staff to people using services • Staff turnover rates • Percent of staff fully trained • Number of bilingual staff
Meeting participants did not discuss specific data points for this measure.
Interaction
Measures:
• Percent of phone calls returned in a timely manner • Length of time consumer waits to see worker • Wait times for phone calls • Number of applications received on-line
Meeting participants did not discuss specific data points for this measure.
Incarceration
Measure:
• Percent of people released from incarceration who are screened for MA
Meeting participants did not discuss specific data points for this measure.
Stability
• Percent of people remaining on the program for a full year rather than going on and off
Reapplication
Measure:
• Percent of people reapplying for insurance after having it and then losing it within a specified timeframe
Meeting participants did not discuss specific data points for this measure.
Response time to customer complaints at the County level
• Response time to participant complaints
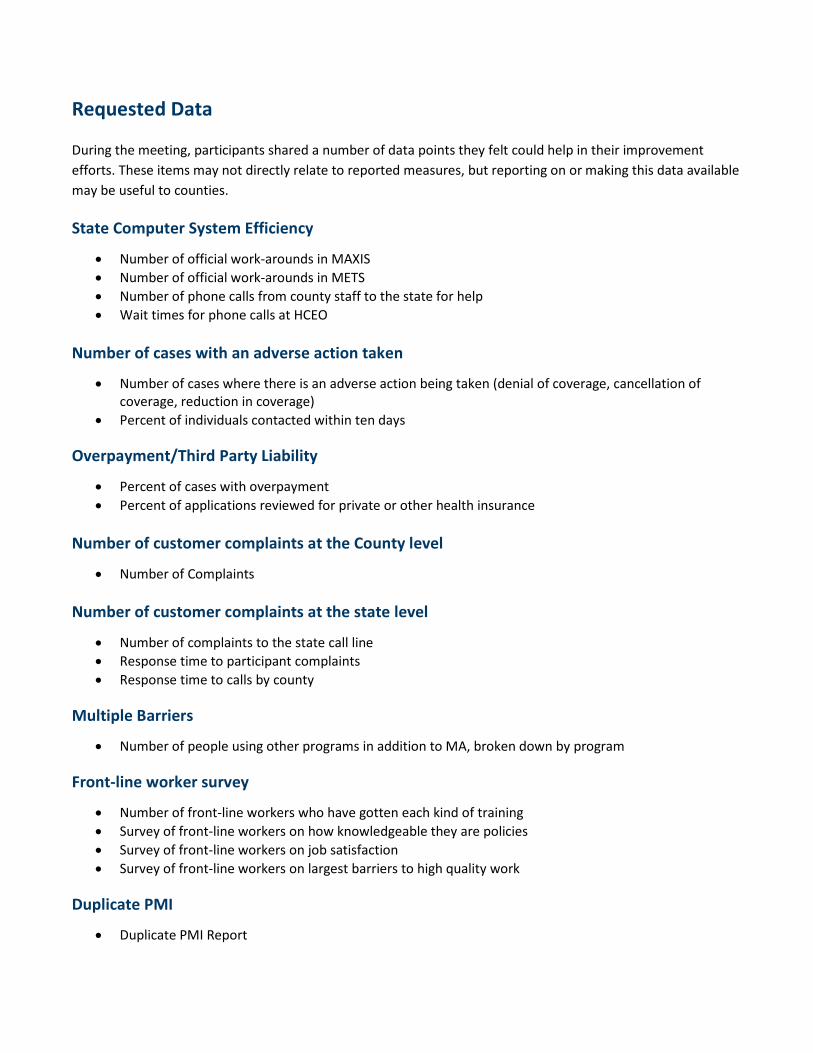
Requested Data
During the meeting, participants shared a number of data points they felt could help in their improvement efforts. These items may not directly relate to reported measures, but reporting on or making this data available may be useful to counties.
State Computer System Efficiency
• Number of official work-arounds in MAXIS • Number of official work-arounds in METS • Number of phone calls from county staff to the state for help • Wait times for phone calls at HCEO
Number of cases with an adverse action taken
• Number of cases where there is an adverse action being taken (denial of coverage, cancellation of coverage, reduction in coverage)
• Percent of individuals contacted within ten days
Overpayment/Third Party Liability
• Percent of cases with overpayment • Percent of applications reviewed for private or other health insurance
Number of customer complaints at the County level
• Number of Complaints
Number of customer complaints at the state level
• Number of complaints to the state call line • Response time to participant complaints • Response time to calls by county
Multiple Barriers
• Number of people using other programs in addition to MA, broken down by program
Front-line worker survey
• Number of front-line workers who have gotten each kind of training • Survey of front-line workers on how knowledgeable they are policies • Survey of front-line workers on job satisfaction • Survey of front-line workers on largest barriers to high quality work
Duplicate PMI
• Duplicate PMI Report

Customer Survey
• Did people understand the services they are eligible for? • Did people receive the services they needed? • Were people happy with the services they got? • Were people happy with how they were treated? • Are people using services knowledgeable about the available programs?
Appeals
• How many appeals filed? • How many appeals lost? • How many appeals from system errors? • How many appeals from client errors? • How many appeals from agency errors?
Outreach
• Report on outreach carried out by the agency
Recommended