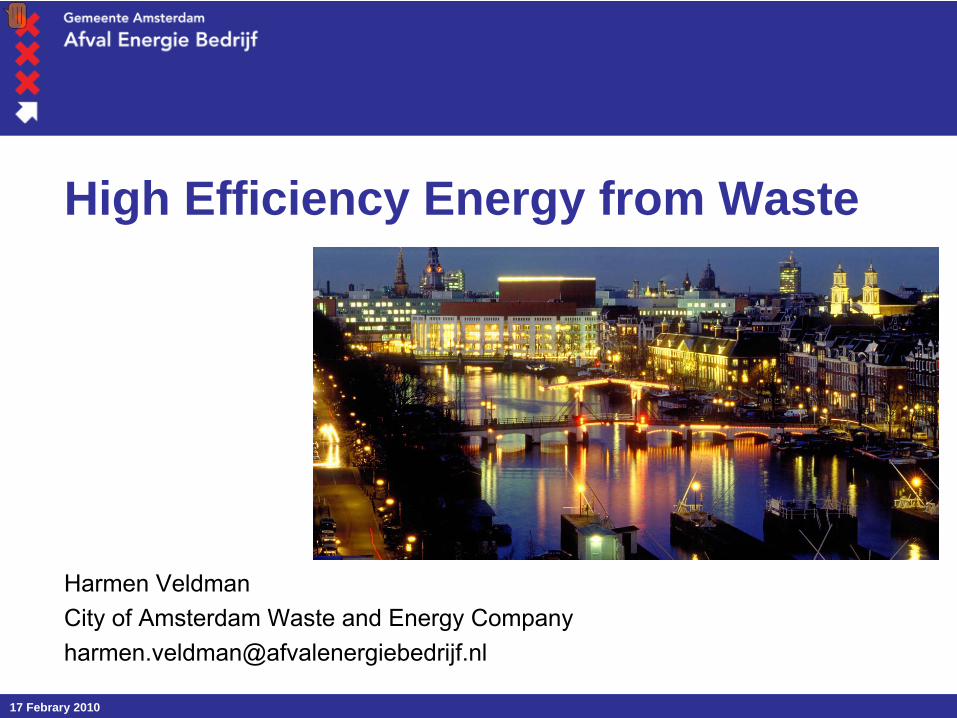
17 Febrary 2010
High Efficiency Energy from Waste
Harmen VeldmanCity of Amsterdam Waste and Energy [email protected]

17 Febrary 2010
Agenda
Dutch waste managementAfval Energie Bedrijf AEBWaste Fired Power Plant

17 Febrary 2010
Dutch waste management
17 Febrary 2010
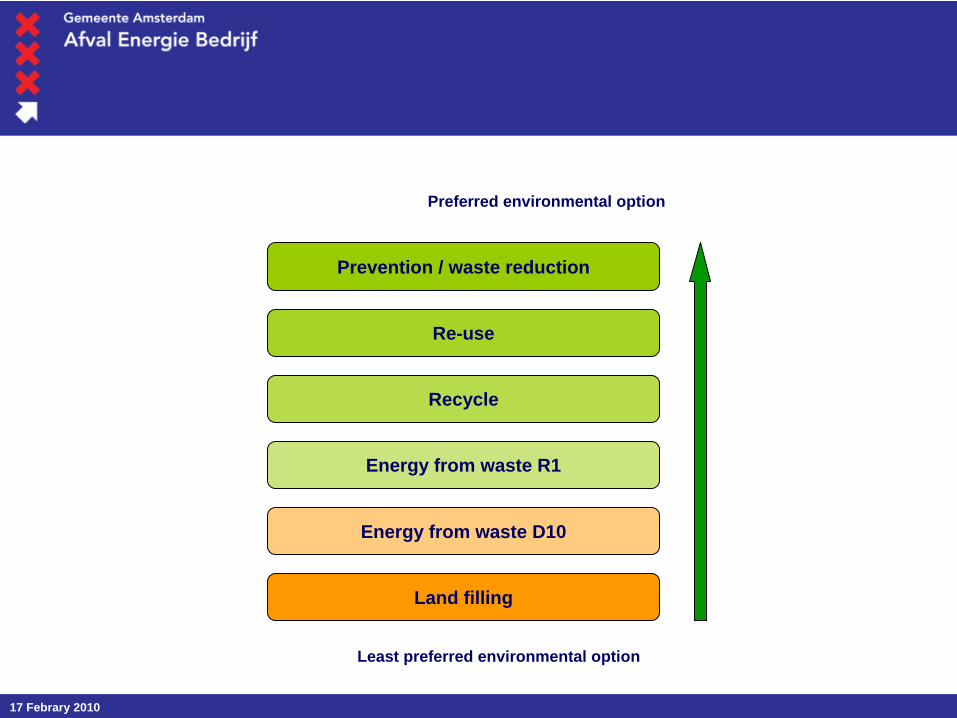
Prevention / waste reduction
Re-use
Recycle
Energy from waste D10
Land filling
Preferred environmental option
Least preferred environmental option
Energy from waste R1

17 Febrary 2010
Household / Commercial waste Source sorting
Paper,Glass, Plastic
Kitchen / garden waste
Mixed waste
Recycling
BiogasCompost
EfW(incineration)
8.5 million tons per year
Batteries,Hazardous waste
64 %
Landfill
34 %
2 %

17 Febrary 2010
Energy from Waste in NL12 installationsTotal capacity 6,4 million tonsR1: 4.3 million tons

17 Febrary 2010
Gemeente Amsterdam Afval Energie Bedrijf

17 Febrary 2010
17 Febrary 2010
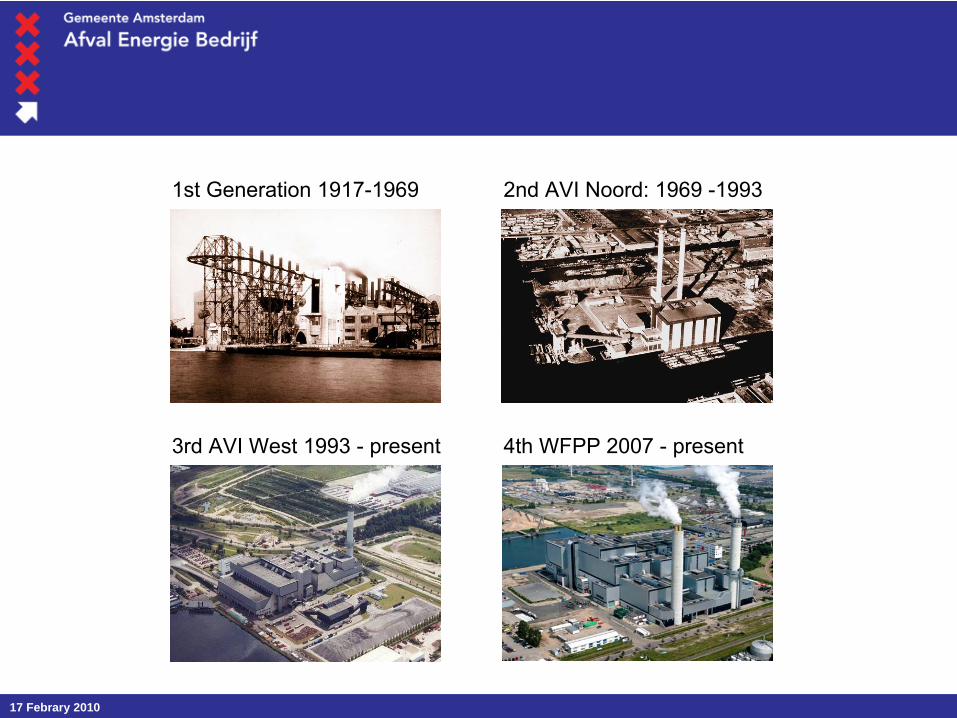
1st Generation
1917-1969 2nd AVI Noord: 1969 -1993
3rd AVI West 1993 -
present 4th WFPP 2007 -
present

17 Febrary 2010
AEB
society
AEB Philosophy: closing the loop
building materials
MSW
energy
Raw materials & energy
Waste & energy

17 Febrary 2010
WTE plant (1993)1.4 millioninhabitants850.000 tons of MSW
WFPP (2007)530.000 tons of commercial waste

17 Febrary 2010
MSW Incineration
Electricity
Heat
Iron scrap / Non ferro
Bottom ash
Flue gas cleaning residue
Amsterdam, APX
District heatingAmsterdam
Metal industry
Road construction
Salt mines Germany
Fly ash Asphalt
17 Febrary 2010
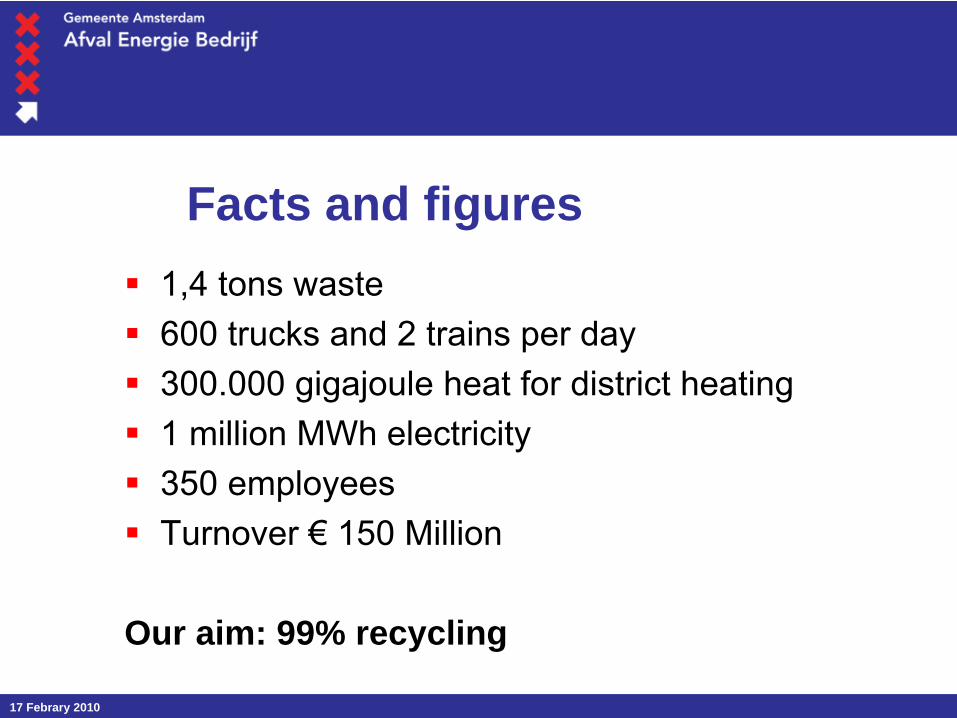
Facts and figures1,4 tons waste600 trucks and 2 trains per day300.000 gigajoule heat for district heating1 million MWh electricity350 employeesTurnover € 150 Million
Our aim: 99% recycling
17 Febrary 2010
Waste Fired Power Plant
designed for recovery

17 Febrary 2010
Efficiency of electricity productionNatural gas 55 %Oil 50 %Coal 45 %Lignite 40 %Biomass 35 %Waste 15…22 %....30%
State-of-
the-Art
State-of-
the-Art
Best available technology
WFPP
Best available technology
WFPP
EU average EU average

17 Febrary 2010
Technology
High steam parameters: 125 bar, 440 ºC (130 bar, 480 ºC)Corrosion reduction:–
Inconel
–
steam-steam reheatingFlue gas recirculationBigger boilerWater cooled condensor

17 Febrary 2010
Why did Amsterdam invest
Sustainable electricity production (source, biomass)–
30% net electrical efficiency (22% WtE
conventional)CO2-reduction (11% of 2025 target for Amsterdam)More revenue, lower waste taxesStrengthen AEB position in the waste market

17 Febrary 2010
History
Investment decision 17
September 2003
First fire19 March 2007
Turbine shaft3 February 2008
Fully operational (again)1 March 2009Hand over
1 August 2007

17 Febrary 2010
Operational results (1)
Nominal waste throughput realised30,5% Nett-efficiency provedStable firing through big boilerCorrosion free superheaterLow boiler foulingBoiler corrosion within specs

17 Febrary 2010
Operational results (2)
Turbine shaftWater hammer cooling water pipeReheater pumpsBack fire flue gas recirculation

17 Febrary 2010
Average monthly efficiency
0,0%
5,0%
10,0%
15,0%
20,0%
25,0%
30,0%
35,0%
aug-
07
sep-
07
okt-0
7
nov-
07
dec-
07
jan-
08
feb-
08
mrt-
08
apr-0
8
mei
-08
jun-
08
jul-0
8
aug-
08
sep-
08
okt-0
8
nov-
08
dec-
08
jan-
09
feb-
09
mrt-
09
apr-0
9
mei
-09
jun-
09
jul-0
9
aug-
09
sep-
09
okt-0
9
nov-
09
dec-
09
Effic
ienc
y (a
ccor
ding
to M
EP)

17 Febrary 2010
0,0%
10,0%
20,0%
30,0%
40,0%
1-0
3-09
8-0
3-09
15-
03-0
9
22-
03-0
9
29-
03-0
9
5-0
4-09
12-
04-0
9
19-
04-0
9
26-
04-0
9
3-0
5-09
10-
05-0
9
17-
05-0
9
24-
05-0
9
31-
05-0
9
7-0
6-09
14-
06-0
9
21-
06-0
9
28-
06-0
9
5-0
7-09
12-
07-0
9
19-
07-0
9
26-
07-0
9
2-0
8-09
9-0
8-09
16-
08-0
9
23-
08-0
9
30-
08-0
9
6-0
9-09
13-
09-0
9
20-
09-0
9
27-
09-0
9
4-1
0-09
11-
10-0
9
18-
10-0
9
25-
10-0
9
1-1
1-09
8-1
1-09
15-
11-0
9
22-
11-0
9
29-
11-0
9
6-1
2-09
13-
12-0
9
20-
12-0
9
27-
12-0
9
Effic
ienc
y
ηMEP ηMEP montly average Best day of the month
26,3%
30,9%29,3%
28,9%27,1%
28,3%
31,0%
32,1% 33,0% 33,3%
E net
+ 2/3 Heat outηMEP
= ----------------------Energy in
Efficiency Waste Fired Power Plant 2009

17 Febrary 2010
FutureOptimize firing conditionsMaterials testingTraining personnel130 bar, 480 ºC
Disseminate operational know howNew co-operations (e.g. CenBio)
Recommended