Höegh LNG – The floating LNG services provider
Höegh LNG’s Capital Markets Day 2014 9 December
Norges Rederiforbund
Forward-looking statements
2
This presentation contains certain forward-looking statements concerning future events and our operations, performance and financial condition.
Forward-looking statements include, without limitation, any statement that may predict, forecast, indicate or imply future results, performance or
achievements, and may contain the words “believe,” “anticipate,” “expect,” “estimate,” “project,” “will be,” “will continue,” “will likely result,” “plan,”
“intend” or words or phrases of similar meanings. These statements involve known and unknown risks and are based upon a number of
assumptions and estimates that are inherently subject to significant uncertainties and contingencies, many of which are beyond our control. Actual
results may differ materially from those expressed or implied by such forward-looking statements. Important factors that could cause actual results
to differ materially include, but are not limited to: FSRU and LNG carrier market trends, including hire rates and factors affecting supply and
demand; our anticipated growth strategies; our anticipated receipt of dividends and repayment of indebtedness from our joint ventures; the effect of
the worldwide economic environment; turmoil in the global financial markets; fluctuations in currencies and interest rates; general market
conditions, including fluctuations in hire rates and vessel values; changes in our operating expenses, including drydocking and insurance costs; our
ability to make cash distributions from either Höegh LNG Holdings Ltd. (“HLNG”) or Höegh LNG Partners LP (“HMLP”) and the amount of any
borrowings that may be necessary to make such distributions; our ability to comply with financing agreements and the expected effect of restrictions
and covenants in such agreements; the future financial condition of our existing or future customers; our ability to make additional borrowings and
to access public equity and debt capital markets; planned capital expenditures and availability of capital resources to fund capital expenditures; the
exercise of purchase options by our customers; our ability to maintain long-term relationships with our customers; our ability to leverage the
relationship between HLNG and HMLP; our reputation in the shipping industry; the ability of HMLP to purchase vessels from HLNG in the future,
including the FSRU Independence and HLNG’s three FSRU newbuildings; our continued ability to enter into long-term, fixed-rate charters; our
ability to maximize the use of our vessels, including the redeployment or disposition of vessels no longer under long-term charters; expected pursuit
of strategic opportunities, including the acquisition of vessels; our ability to compete successfully for future chartering and newbuilding
opportunities; timely acceptance of our vessels by their charterers; termination dates and extensions of charters; the expected cost of, and our
ability to comply with, governmental regulations and maritime self-regulatory organization standards, as well as standard regulations imposed by
our charterers applicable to our business; expected demand in the LNG shipping sector in general and the demand for vessels in particular;
availability of skilled labor, vessel crews and management; our incremental general and administrative expenses as a publicly traded limited
partnership and our fees and expenses payable under the ship management agreements, the technical information and services agreement and
the Administrative Services Agreements; the anticipated taxation of Höegh LNG Partners LP and distributions to our unitholders; estimated future
maintenance and replacement capital expenditures; our ability to retain key employees; customers’ increasing emphasis on environmental and
safety concerns; potential liability from any pending or future litigation; potential disruption of shipping routes due to accidents, political events,
piracy or acts by terrorists; future sales of our common units in the public market; our business strategy and other plans and objectives for future
operations; and other factors listed from time to time in the reports and other documents that we file with the Oslo Børs or the U.S, Securities and
Exchange Commission, including our Registration Statement on Form F-1 for the initial public offering of HMLP, which was declared effective on
August 7, 2014. All forward-looking statements included in this presentation are made only as of the date hereof. We do not intend to release
publicly any updates or revisions to any forward-looking statements contained herein to reflect any change in our expectations with respect thereto
or any change in events, conditions or circumstances on which any such statement is based.
Preparing for next growth phase
Presented by
Sveinung J.S. Støhle – CEO & President
3
Introduction
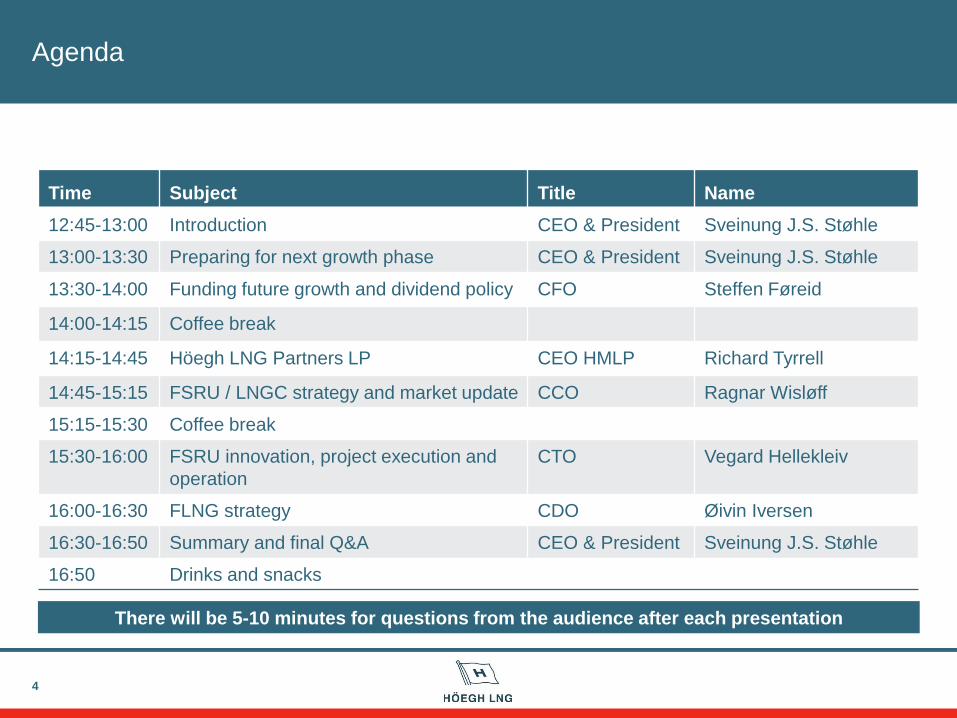
Agenda
4
Time Subject Title Name
12:45-13:00 Introduction CEO & President Sveinung J.S. Støhle
13:00-13:30 Preparing for next growth phase CEO & President Sveinung J.S. Støhle
13:30-14:00 Funding future growth and dividend policy CFO Steffen Føreid
14:00-14:15 Coffee break
14:15-14:45 Höegh LNG Partners LP CEO HMLP Richard Tyrrell
14:45-15:15 FSRU / LNGC strategy and market update CCO Ragnar Wisløff
15:15-15:30 Coffee break
15:30-16:00 FSRU innovation, project execution and
operation
CTO Vegard Hellekleiv
16:00-16:30 FLNG strategy CDO Øivin Iversen
16:30-16:50 Summary and final Q&A CEO & President Sveinung J.S. Støhle
16:50 Drinks and snacks
There will be 5-10 minutes for questions from the audience after each presentation
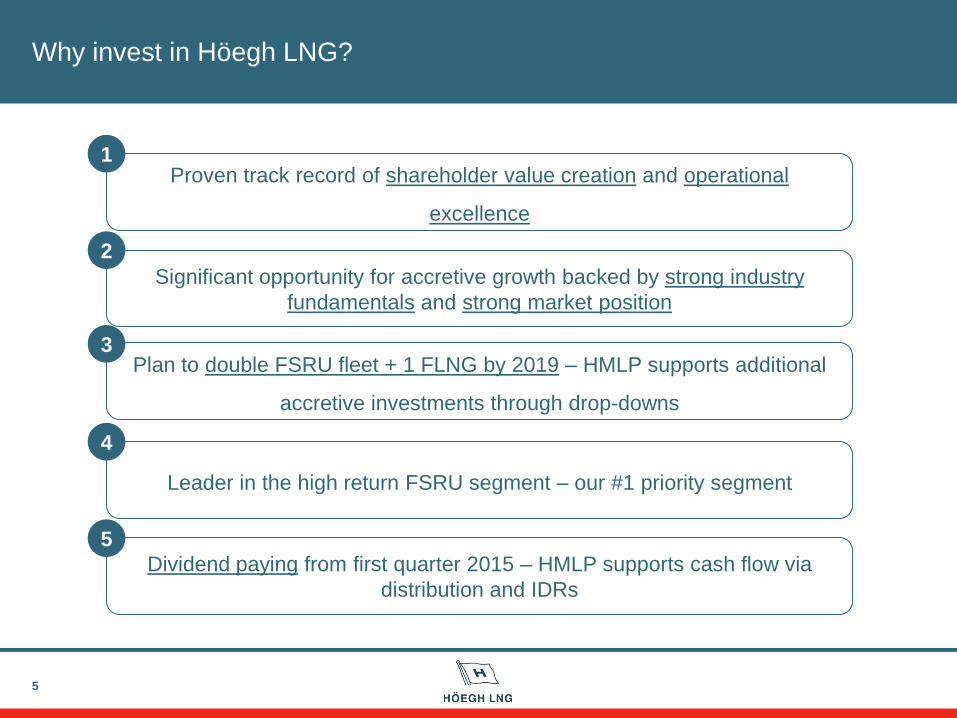
Why invest in Höegh LNG?
5
Significant opportunity for accretive growth backed by strong industry
fundamentals and strong market position
Leader in the high return FSRU segment – our #1 priority segment
Proven track record of shareholder value creation and operational
excellence
Plan to double FSRU fleet + 1 FLNG by 2019 – HMLP supports additional
accretive investments through drop-downs
Dividend paying from first quarter 2015 – HMLP supports cash flow via
distribution and IDRs
1
3
4
5
2
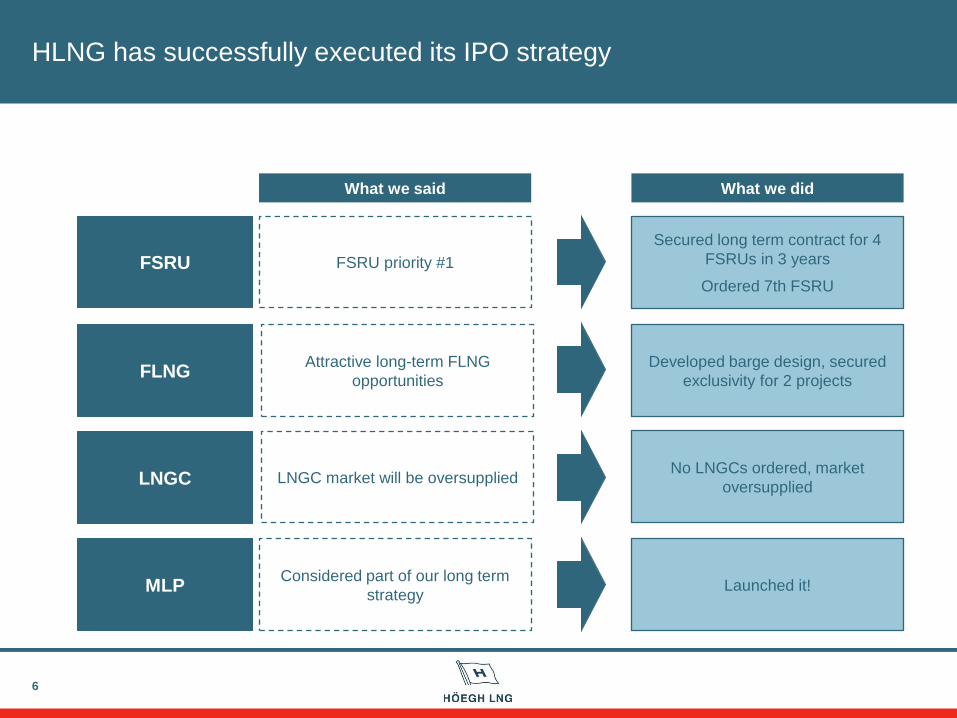
HLNG has successfully executed its IPO strategy
6
FSRU
FLNG
FSRU priority #1
Attractive long-term FLNG
opportunities
Secured long term contract for 4
FSRUs in 3 years
Ordered 7th FSRU
Developed barge design, secured
exclusivity for 2 projects
What we did What we said
LNGC
MLP
LNGC market will be oversupplied
Considered part of our long term
strategy
No LNGCs ordered, market
oversupplied
Launched it!
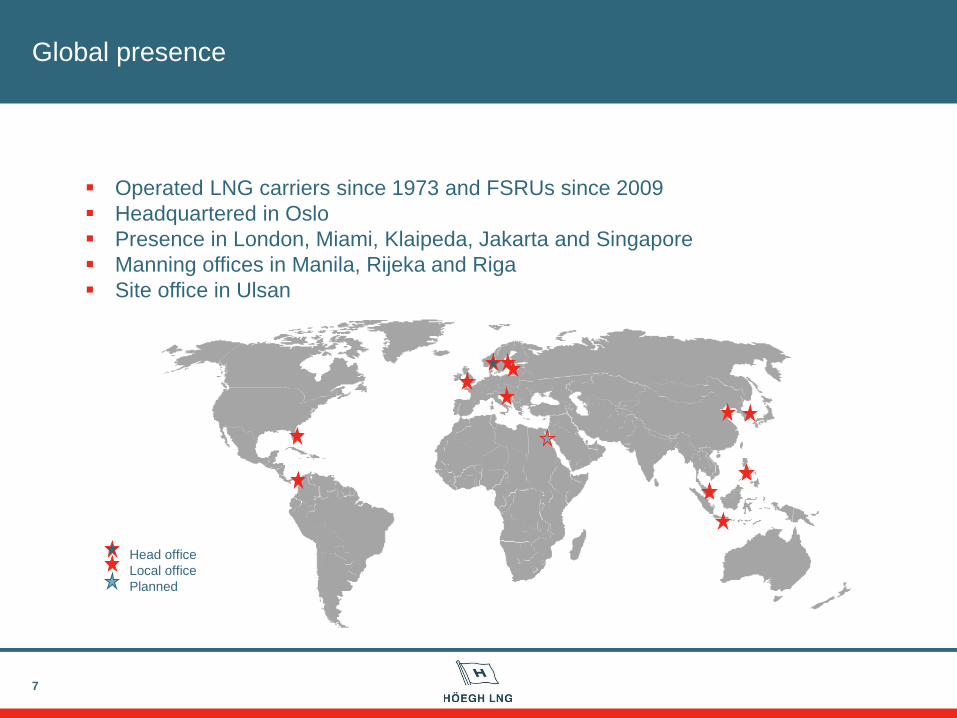
Global presence
7
Operated LNG carriers since 1973 and FSRUs since 2009
Headquartered in Oslo
Presence in London, Miami, Klaipeda, Jakarta and Singapore
Manning offices in Manila, Rijeka and Riga
Site office in Ulsan
Head office
Local office
Planned
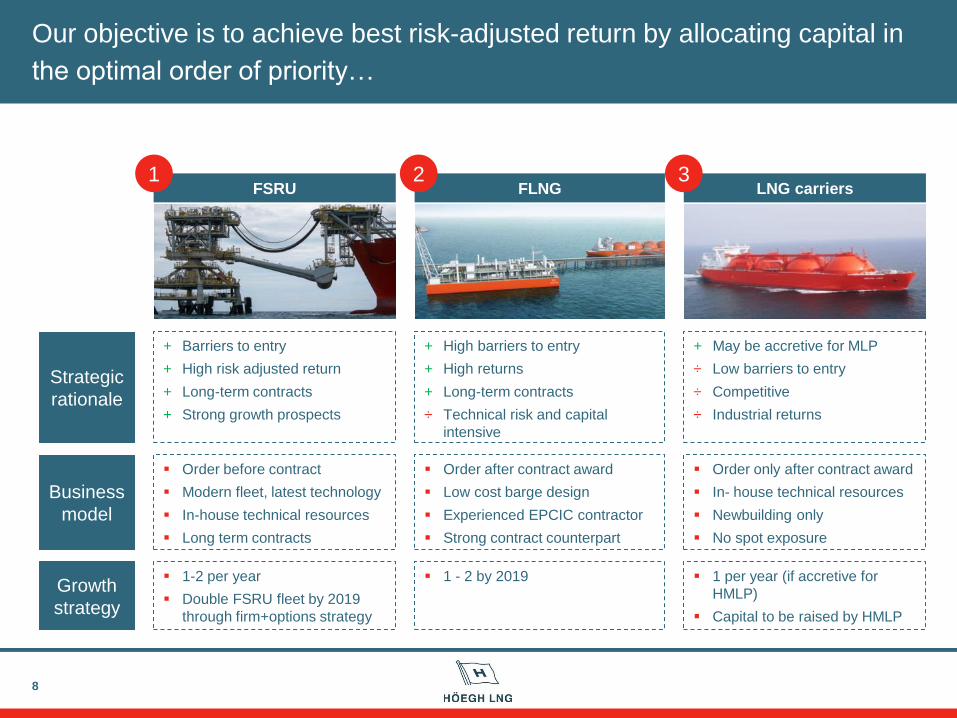
Our objective is to achieve best risk-adjusted return by allocating capital in
the optimal order of priority…
8
Order before contract
Modern fleet, latest technology
In-house technical resources
Long term contracts
Order after contract award
Low cost barge design
Experienced EPCIC contractor
Strong contract counterpart
+ May be accretive for MLP
÷ Low barriers to entry
÷ Competitive
÷ Industrial returns
FSRU LNG carriers FLNG 1
Business
model
+ Barriers to entry
+ High risk adjusted return
+ Long-term contracts
+ Strong growth prospects
+ High barriers to entry
+ High returns
+ Long-term contracts
÷ Technical risk and capital
intensive
Order only after contract award
In- house technical resources
Newbuilding only
No spot exposure
Strategic
rationale
3 2
Growth
strategy
1 per year (if accretive for
HMLP)
Capital to be raised by HMLP
1-2 per year
Double FSRU fleet by 2019
through firm+options strategy
1 - 2 by 2019
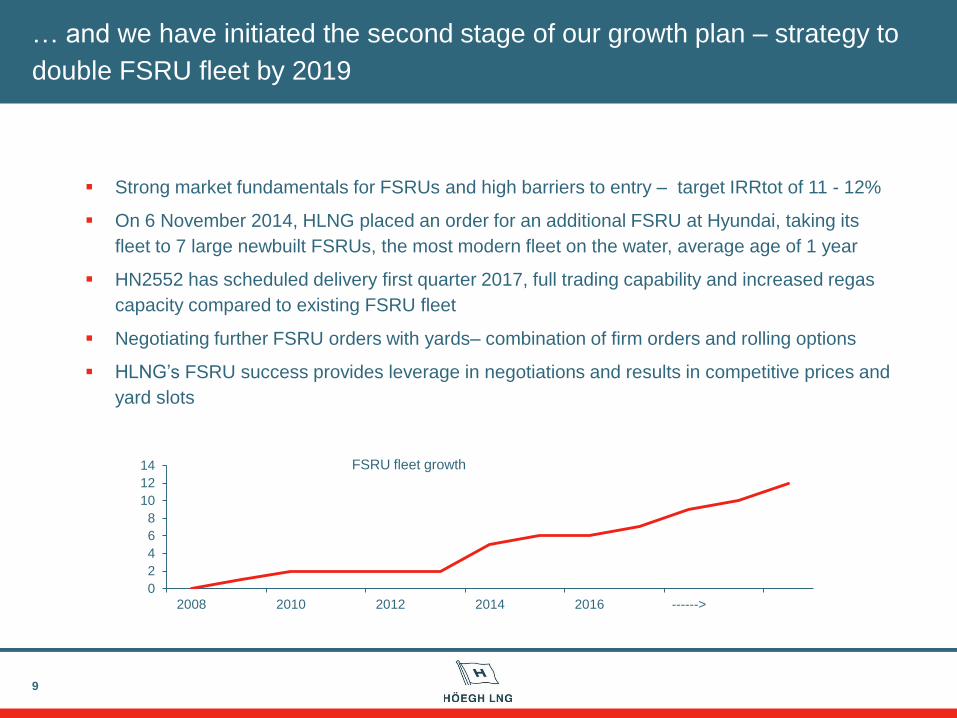
… and we have initiated the second stage of our growth plan – strategy to
double FSRU fleet by 2019
9
Strong market fundamentals for FSRUs and high barriers to entry – target IRRtot of 11 - 12%
On 6 November 2014, HLNG placed an order for an additional FSRU at Hyundai, taking its
fleet to 7 large newbuilt FSRUs, the most modern fleet on the water, average age of 1 year
HN2552 has scheduled delivery first quarter 2017, full trading capability and increased regas
capacity compared to existing FSRU fleet
Negotiating further FSRU orders with yards– combination of firm orders and rolling options
HLNG’s FSRU success provides leverage in negotiations and results in competitive prices and
yard slots
0
2
4
6
8
10
12
14
2008 2010 2012 2014 2016 ------>
FSRU fleet growth
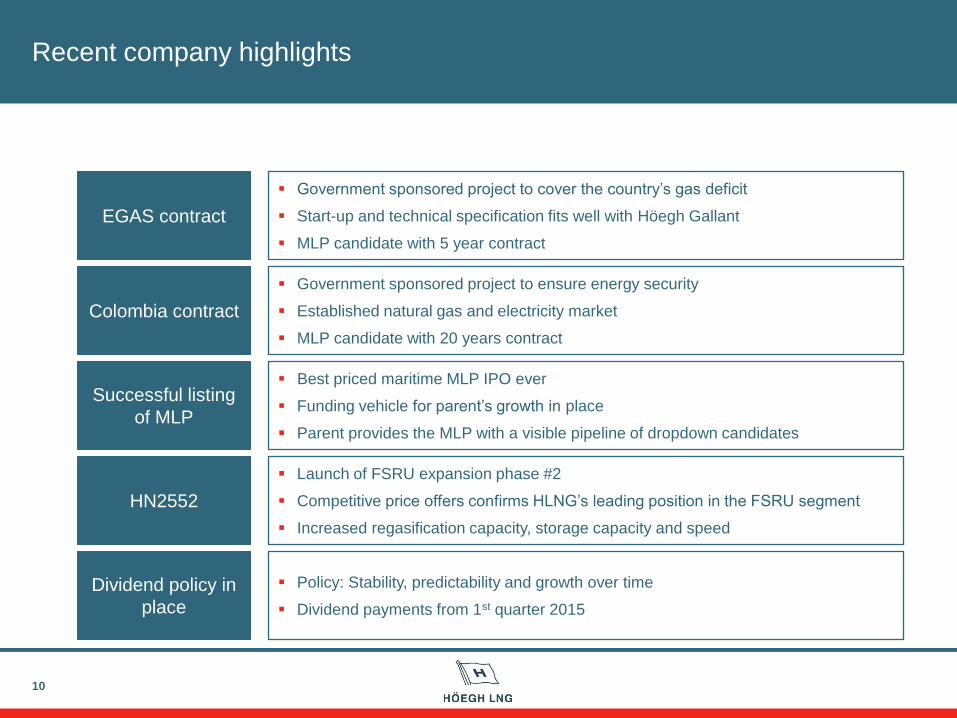
Recent company highlights
10
Successful listing
of MLP
HN2552
Dividend policy in
place
EGAS contract
Colombia contract
Government sponsored project to cover the country’s gas deficit
Start-up and technical specification fits well with Höegh Gallant
MLP candidate with 5 year contract
Government sponsored project to ensure energy security
Established natural gas and electricity market
MLP candidate with 20 years contract
Best priced maritime MLP IPO ever
Funding vehicle for parent’s growth in place
Parent provides the MLP with a visible pipeline of dropdown candidates
Launch of FSRU expansion phase #2
Competitive price offers confirms HLNG’s leading position in the FSRU segment
Increased regasification capacity, storage capacity and speed
Policy: Stability, predictability and growth over time
Dividend payments from 1st quarter 2015
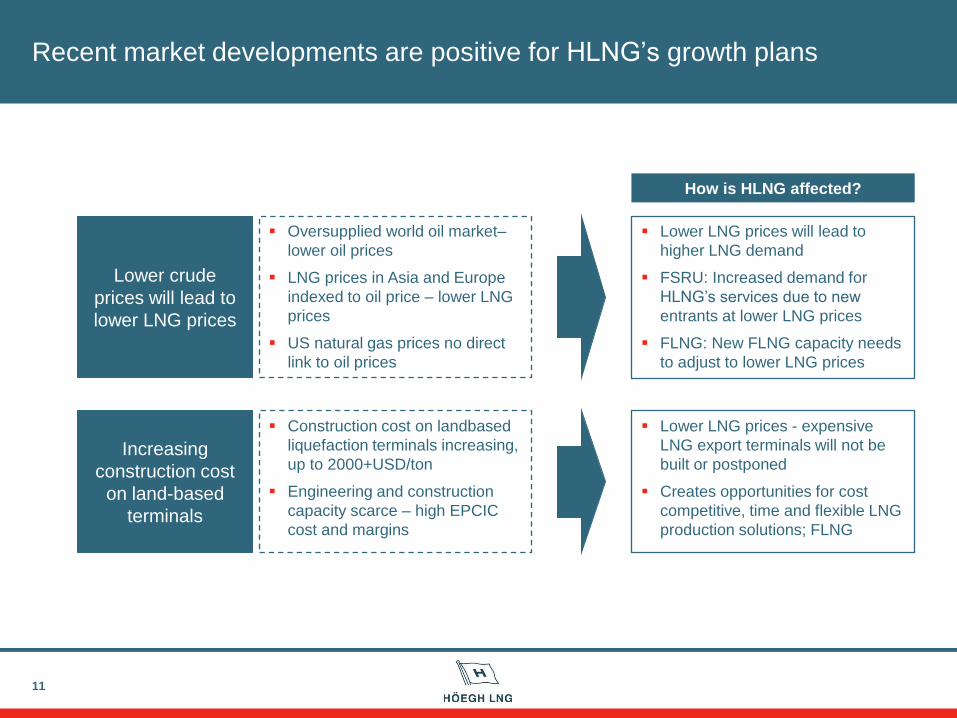
Recent market developments are positive for HLNG’s growth plans
11
Lower crude
prices will lead to
lower LNG prices
Increasing
construction cost
on land-based
terminals
Oversupplied world oil market–
lower oil prices
LNG prices in Asia and Europe
indexed to oil price – lower LNG
prices
US natural gas prices no direct
link to oil prices
Construction cost on landbased
liquefaction terminals increasing,
up to 2000+USD/ton
Engineering and construction
capacity scarce – high EPCIC
cost and margins
Lower LNG prices will lead to
higher LNG demand
FSRU: Increased demand for
HLNG’s services due to new
entrants at lower LNG prices
FLNG: New FLNG capacity needs
to adjust to lower LNG prices
Lower LNG prices - expensive
LNG export terminals will not be
built or postponed
Creates opportunities for cost
competitive, time and flexible LNG
production solutions; FLNG
How is HLNG affected?
12
Funding future growth and dividend policy
Presented by
Steffen Føreid – CFO
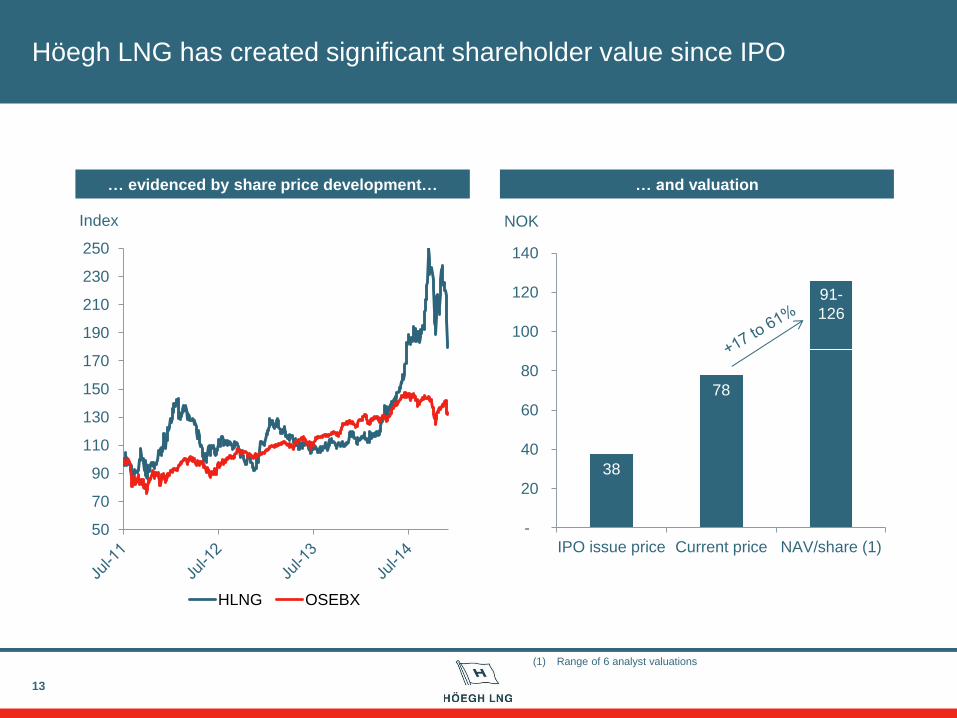
Höegh LNG has created significant shareholder value since IPO
13
38
78
-
20
40
60
80
100
120
140
IPO issue price Current price NAV/share (1)
NOK
… evidenced by share price development… … and valuation
50
70
90
110
130
150
170
190
210
230
250
Index
HLNG OSEBX
(1) Range of 6 analyst valuations
91-
126
91-
126
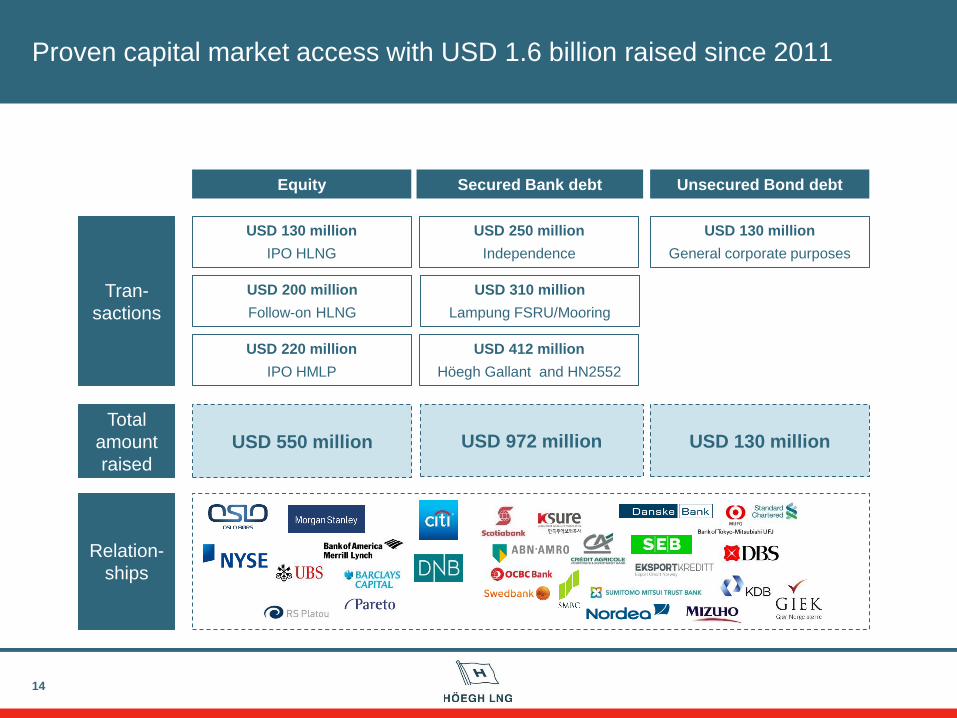
Proven capital market access with USD 1.6 billion raised since 2011
14
USD 550 million USD 972 million
Equity Unsecured Bond debt Secured Bank debt
Total
amount
raised
USD 130 million
IPO HLNG
USD 130 million
Tran-
sactions
Relation-
ships
USD 200 million
Follow-on HLNG
USD 220 million
IPO HMLP
USD 250 million
Independence
USD 310 million
Lampung FSRU/Mooring
USD 412 million
Höegh Gallant and HN2552
USD 130 million
General corporate purposes
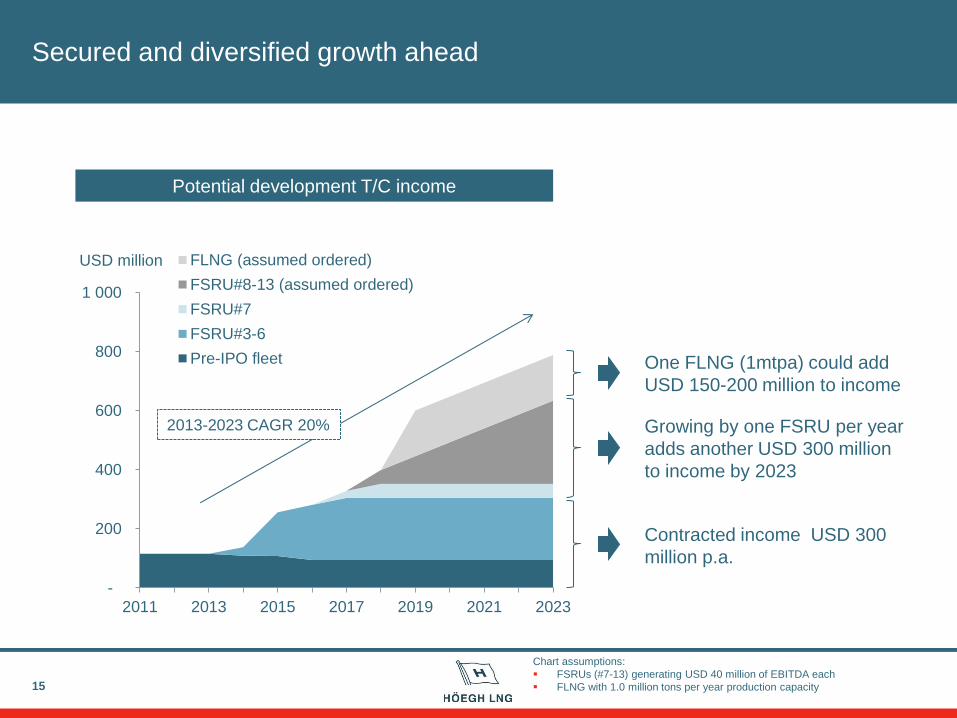
-
200
400
600
800
1 000
2011 2013 2015 2017 2019 2021 2023
USD million FLNG (assumed ordered)
FSRU#8-13 (assumed ordered)
FSRU#7
FSRU#3-6
Pre-IPO fleet
Secured and diversified growth ahead
Potential development T/C income
2013-2023 CAGR 20%
Chart assumptions:
FSRUs (#7-13) generating USD 40 million of EBITDA each
FLNG with 1.0 million tons per year production capacity
Contracted income USD 300
million p.a.
Growing by one FSRU per year
adds another USD 300 million
to income by 2023
One FLNG (1mtpa) could add
USD 150-200 million to income
15
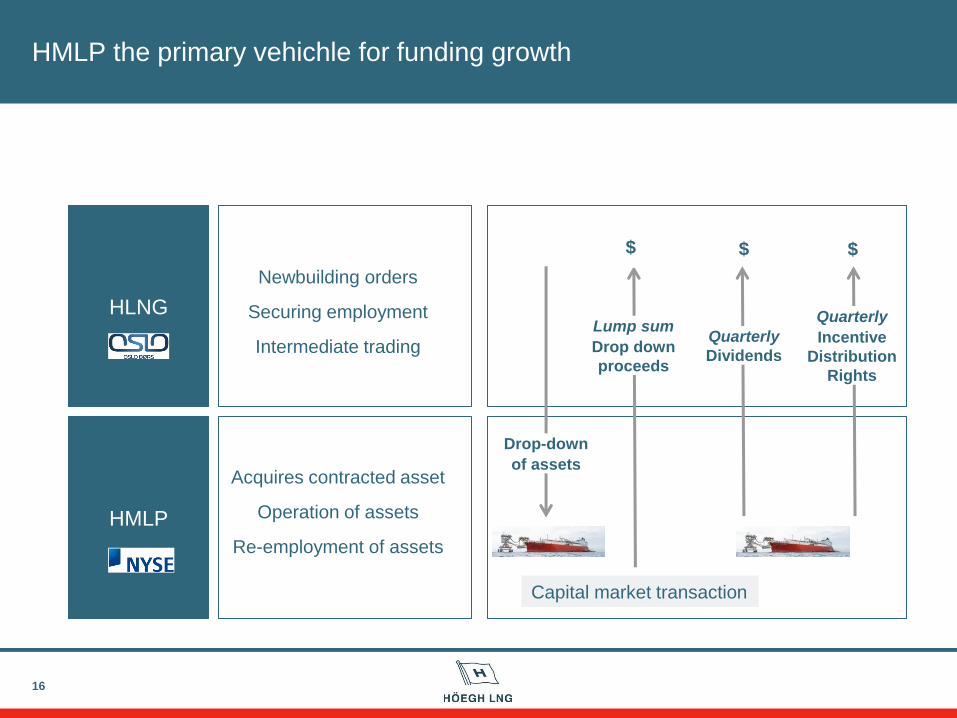
HMLP the primary vehichle for funding growth
16
HLNG
HMLP
HLNG
HMLP
Newbuilding orders
Securing employment
Intermediate trading
Acquires contracted asset
Operation of assets
Re-employment of assets
HLNG
HMLP
Drop-down
of assets
Lump sum
Drop down
proceeds
$ $ $
Quarterly
Dividends
Quarterly
Incentive
Distribution
Rights
Capital market transaction
Newbuildingmultiple (1)
HLNG tradingmultiple (2)
Drop-downmultiple (3)
HMLP tradingmultiple (3)
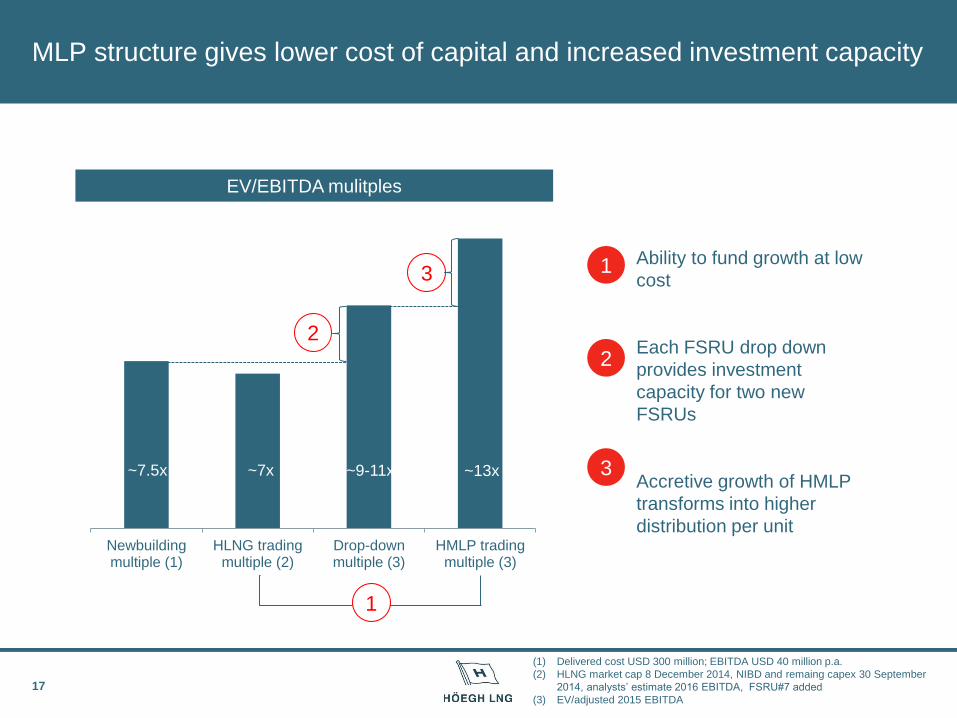
17
MLP structure gives lower cost of capital and increased investment capacity
• Ability to fund growth at low
cost
• Each FSRU drop down
provides investment
capacity for two new
FSRUs
Accretive growth of HMLP
transforms into higher
distribution per unit
EV/EBITDA mulitples
~9-11x ~13x ~7.5x ~7x
1
2
2
3
(1) Delivered cost USD 300 million; EBITDA USD 40 million p.a.
(2) HLNG market cap 8 December 2014, NIBD and remaing capex 30 September
2014, analysts’ estimate 2016 EBITDA, FSRU#7 added
(3) EV/adjusted 2015 EBITDA
1
3
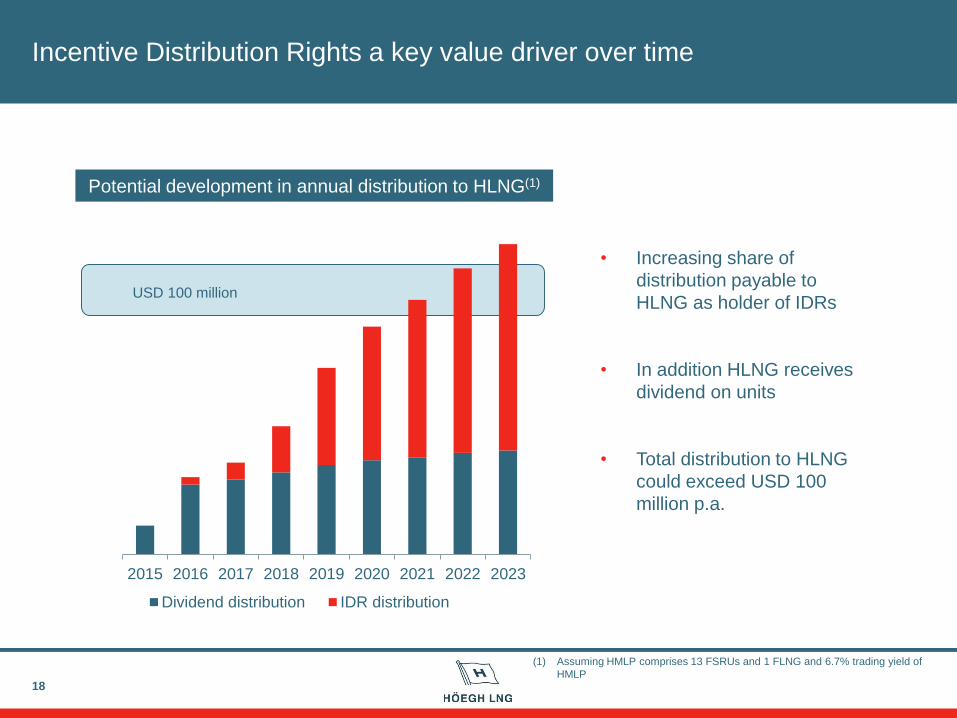
Incentive Distribution Rights a key value driver over time
18
Potential development in annual distribution to HLNG(1)
2015 2016 2017 2018 2019 2020 2021 2022 2023
Dividend distribution IDR distribution
USD 100 million
(1) Assuming HMLP comprises 13 FSRUs and 1 FLNG and 6.7% trading yield of
HMLP
• Increasing share of
distribution payable to
HLNG as holder of IDRs
• In addition HLNG receives
dividend on units
• Total distribution to HLNG
could exceed USD 100
million p.a.
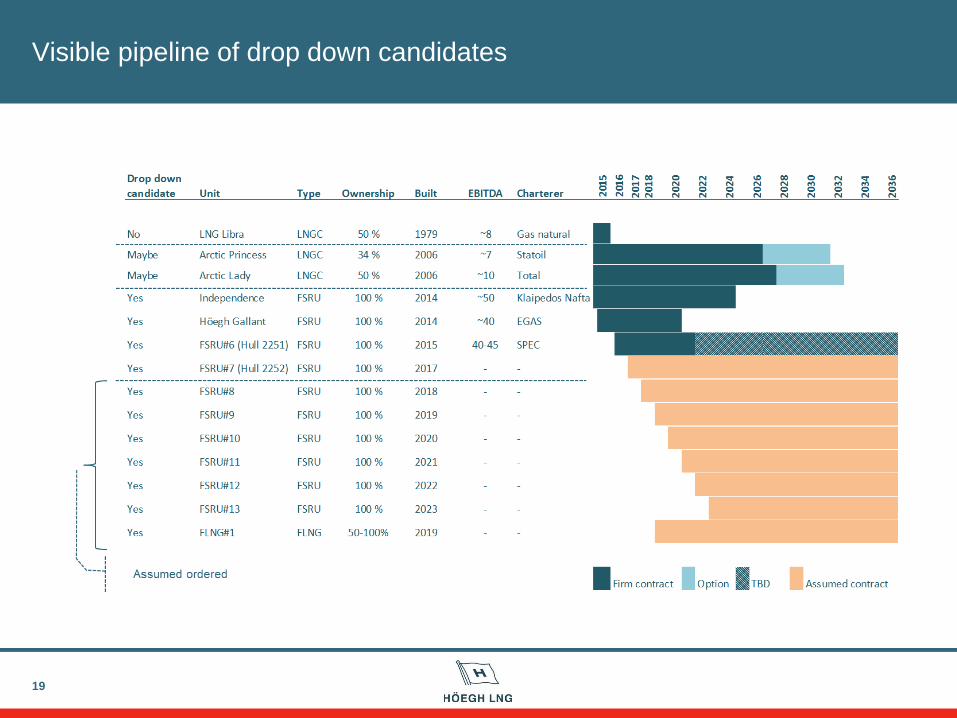
Visible pipeline of drop down candidates
19
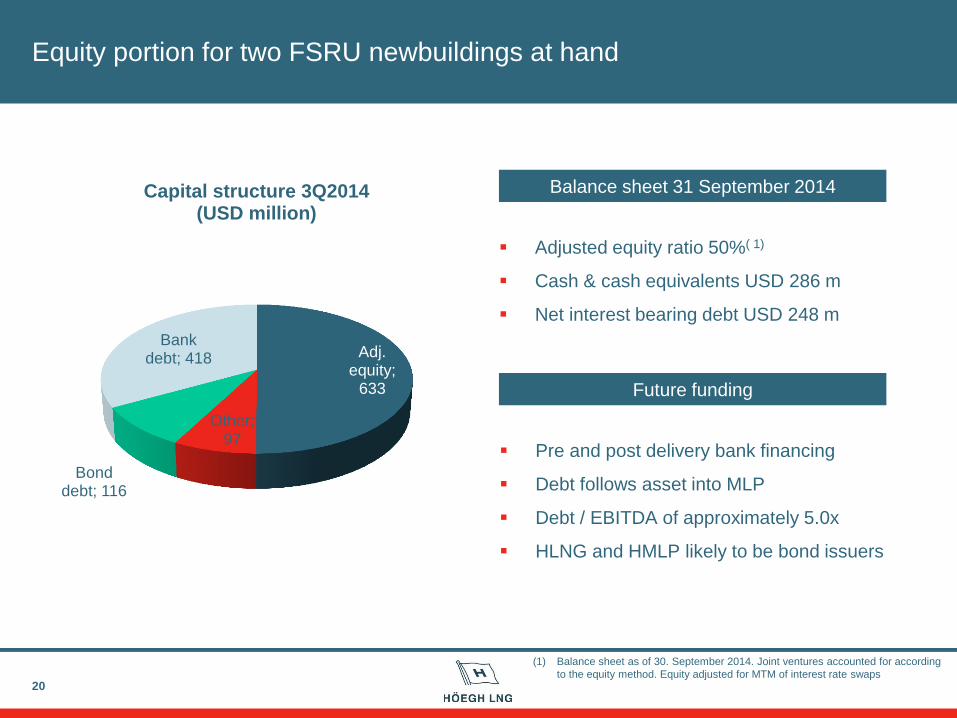
Equity portion for two FSRU newbuildings at hand
20
Adjusted equity ratio 50%( 1)
Cash & cash equivalents USD 286 m
Net interest bearing debt USD 248 m
Balance sheet 31 September 2014
Future funding
Pre and post delivery bank financing
Debt follows asset into MLP
Debt / EBITDA of approximately 5.0x
HLNG and HMLP likely to be bond issuers
Adj. equity;
633
Other; 97
Bond debt; 116
Bank debt; 418
Capital structure 3Q2014 (USD million)
(1) Balance sheet as of 30. September 2014. Joint ventures accounted for according
to the equity method. Equity adjusted for MTM of interest rate swaps
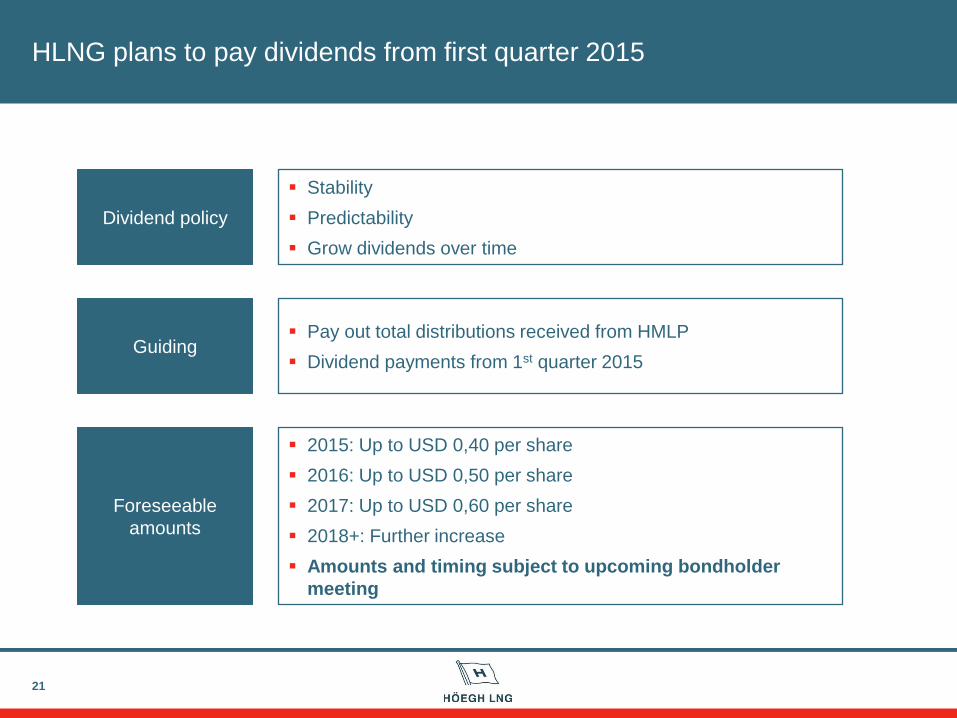
HLNG plans to pay dividends from first quarter 2015
21
Dividend policy
Guiding
Stability
Predictability
Grow dividends over time
Pay out total distributions received from HMLP
Dividend payments from 1st quarter 2015
Foreseeable
amounts
2015: Up to USD 0,40 per share
2016: Up to USD 0,50 per share
2017: Up to USD 0,60 per share
2018+: Further increase
Amounts and timing subject to upcoming bondholder
meeting
Summary
22
Significant shareholder value created since IPO
Proven capital market access
HMLP facilitating growth
Strong balance sheet
Dividend policy in place
23
Höegh LNG Partners LP
Presented by
Richard Tyrrell – CEO HMLP
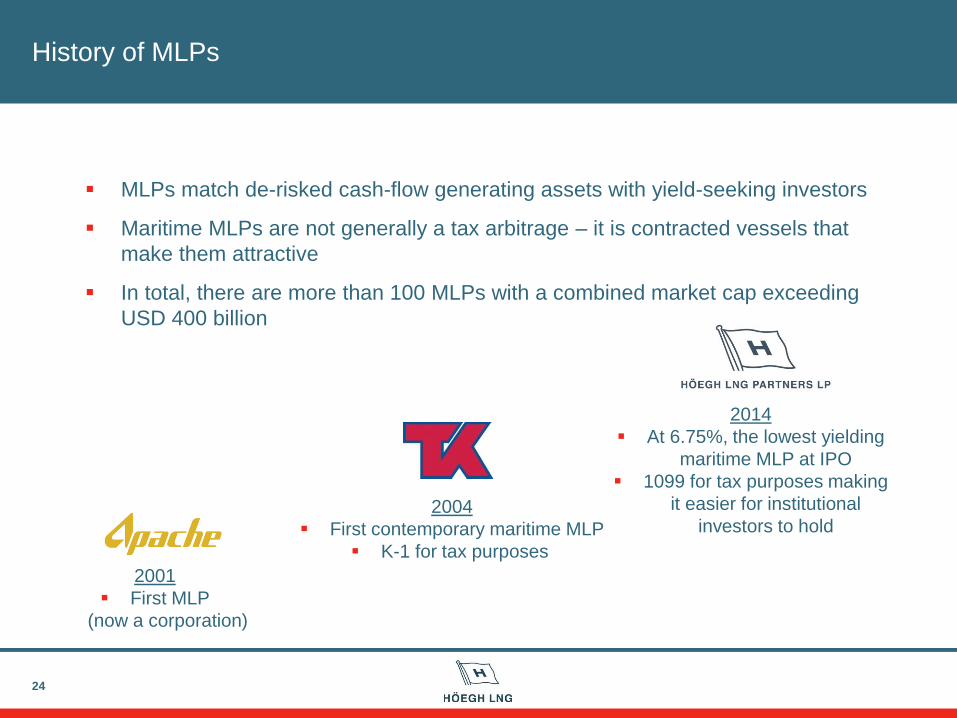
History of MLPs
24
MLPs match de-risked cash-flow generating assets with yield-seeking investors
Maritime MLPs are not generally a tax arbitrage – it is contracted vessels that
make them attractive
In total, there are more than 100 MLPs with a combined market cap exceeding
USD 400 billion
2001
First MLP
(now a corporation)
2004
First contemporary maritime MLP
K-1 for tax purposes
2014
At 6.75%, the lowest yielding
maritime MLP at IPO
1099 for tax purposes making
it easier for institutional
investors to hold
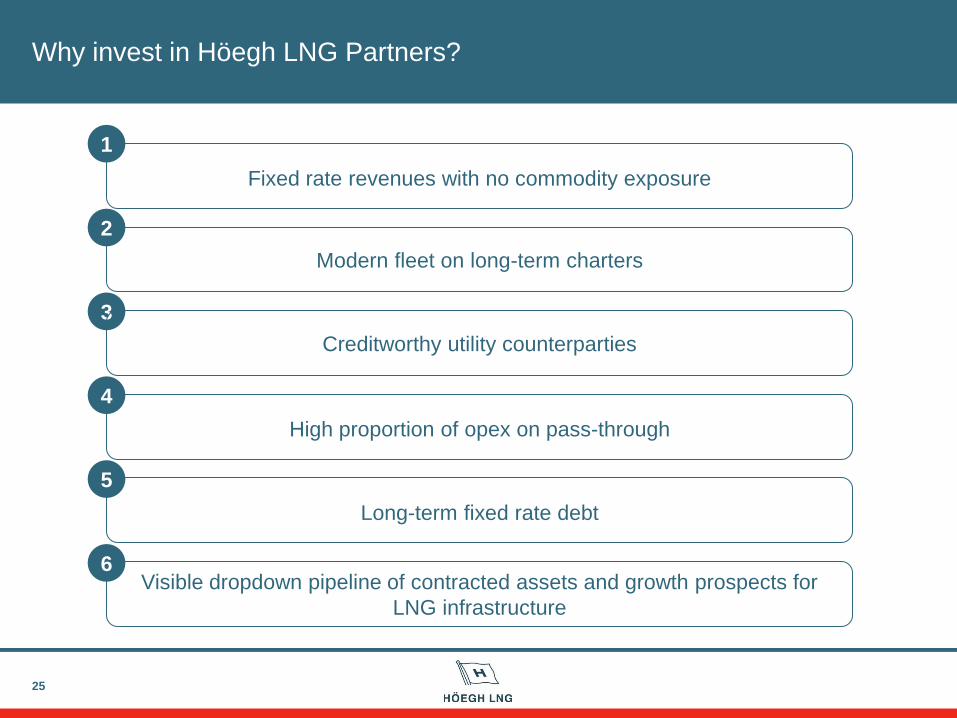
Why invest in Höegh LNG Partners?
25
Modern fleet on long-term charters
Long-term fixed rate debt
Fixed rate revenues with no commodity exposure
High proportion of opex on pass-through
Visible dropdown pipeline of contracted assets and growth prospects for
LNG infrastructure
1
3
4
5
2
Creditworthy utility counterparties
6
26
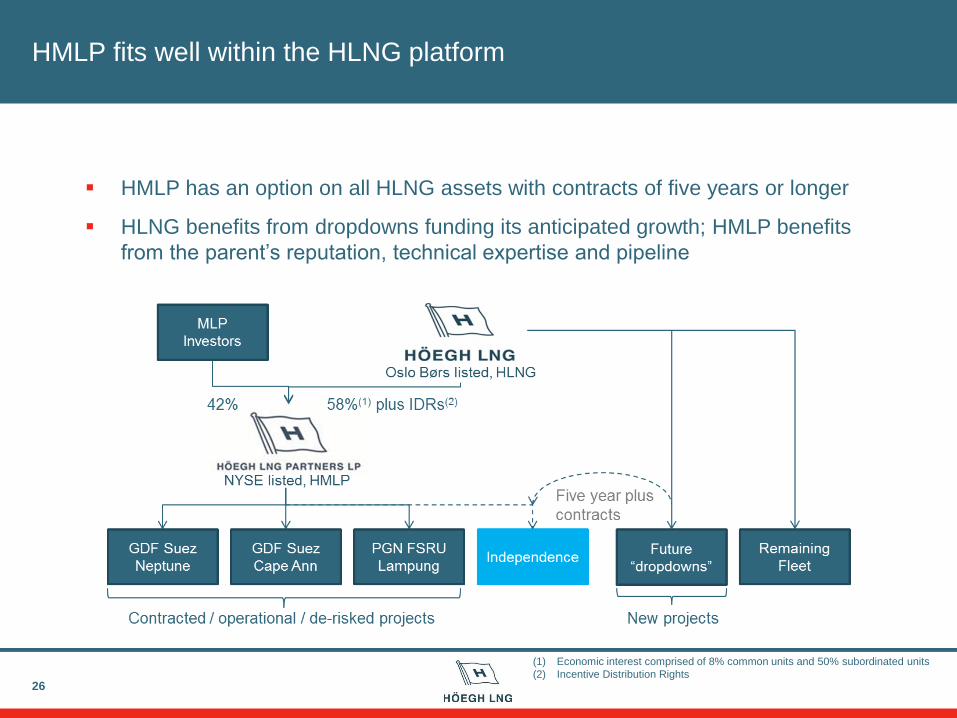
HMLP has an option on all HLNG assets with contracts of five years or longer
HLNG benefits from dropdowns funding its anticipated growth; HMLP benefits
from the parent’s reputation, technical expertise and pipeline
(1) Economic interest comprised of 8% common units and 50% subordinated units
(2) Incentive Distribution Rights
HMLP fits well within the HLNG platform
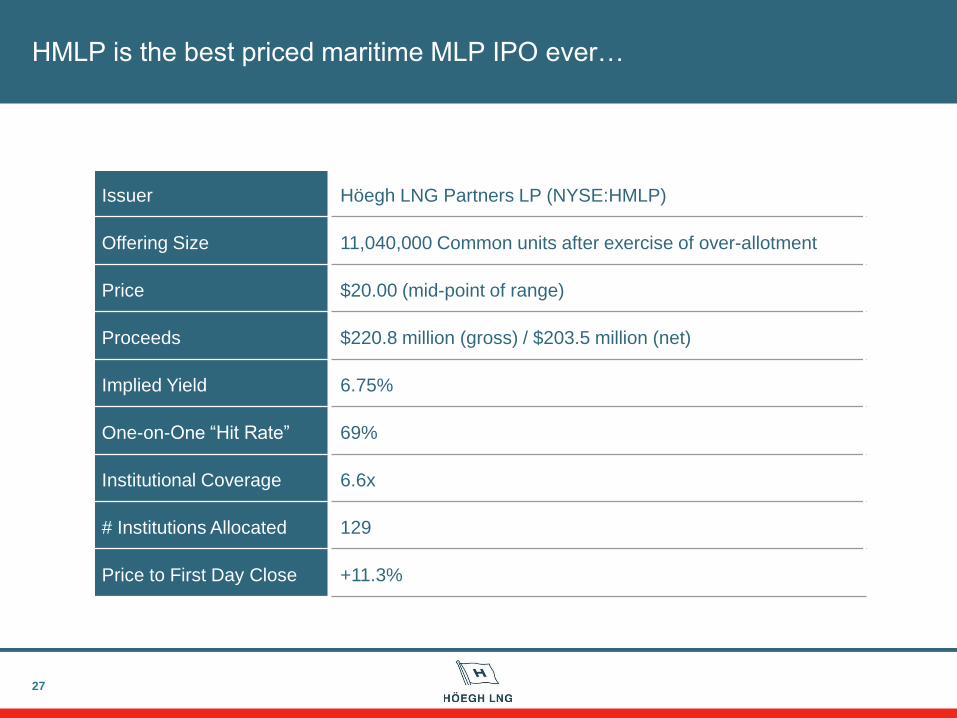
HMLP is the best priced maritime MLP IPO ever…
27
Issuer Höegh LNG Partners LP (NYSE:HMLP)
Offering Size 11,040,000 Common units after exercise of over-allotment
Price $20.00 (mid-point of range)
Proceeds $220.8 million (gross) / $203.5 million (net)
Implied Yield 6.75%
One-on-One “Hit Rate” 69%
Institutional Coverage 6.6x
# Institutions Allocated 129
Price to First Day Close +11.3%
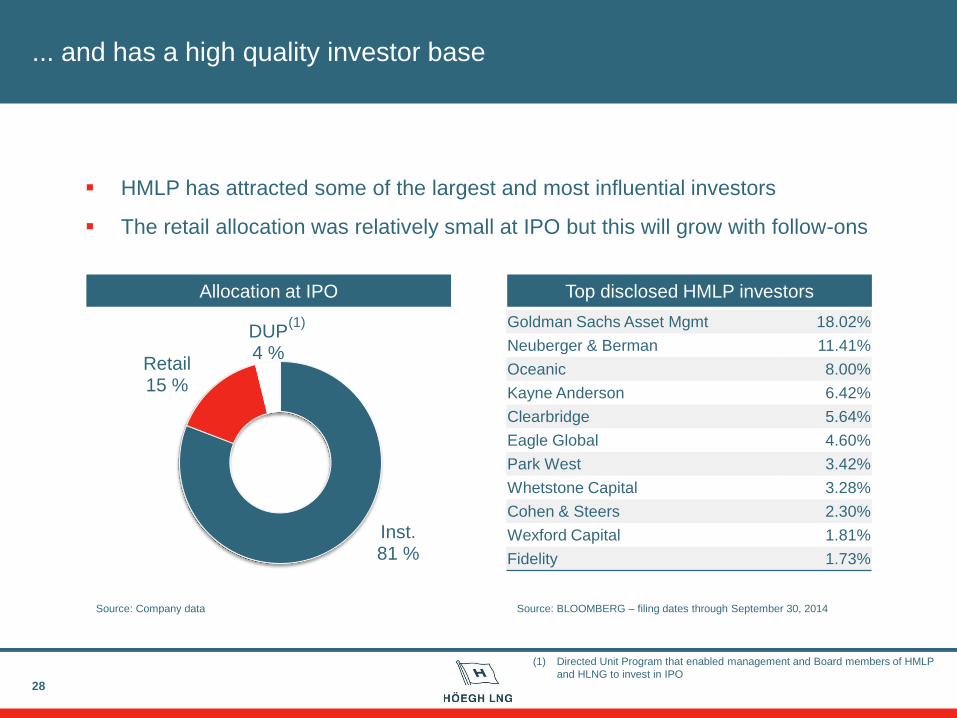
... and has a high quality investor base
28
Top disclosed HMLP investors
Goldman Sachs Asset Mgmt 18.02%
Neuberger & Berman 11.41%
Oceanic 8.00%
Kayne Anderson 6.42%
Clearbridge 5.64%
Eagle Global 4.60%
Park West 3.42%
Whetstone Capital 3.28%
Cohen & Steers 2.30%
Wexford Capital 1.81%
Fidelity 1.73%
Source: BLOOMBERG – filing dates through September 30, 2014
Inst. 81 %
Retail 15 %
DUP 4 %
Source: Company data
Allocation at IPO
(1)
HMLP has attracted some of the largest and most influential investors
The retail allocation was relatively small at IPO but this will grow with follow-ons
(1) Directed Unit Program that enabled management and Board members of HMLP
and HLNG to invest in IPO
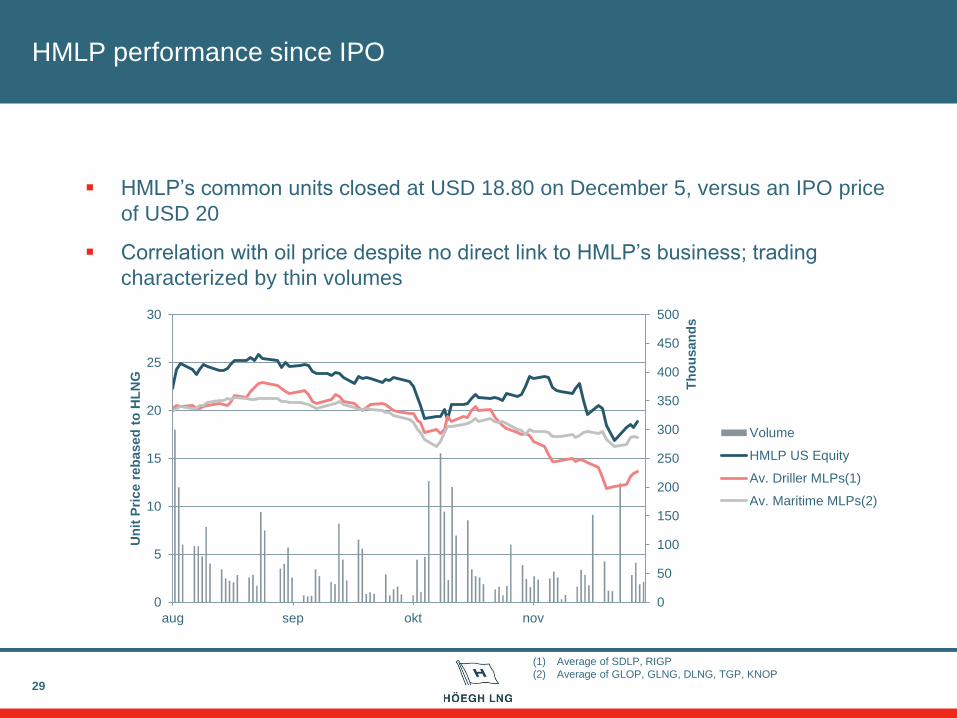
HMLP performance since IPO
29
0
50
100
150
200
250
300
350
400
450
500
0
5
10
15
20
25
30
aug sep okt nov
Th
ou
san
ds
Un
it P
rice r
eb
ased
to
HL
NG
Volume
HMLP US Equity
Av. Driller MLPs(1)
Av. Maritime MLPs(2)
HMLP’s common units closed at USD 18.80 on December 5, versus an IPO price
of USD 20
Correlation with oil price despite no direct link to HMLP’s business; trading
characterized by thin volumes
(1) Average of SDLP, RIGP
(2) Average of GLOP, GLNG, DLNG, TGP, KNOP
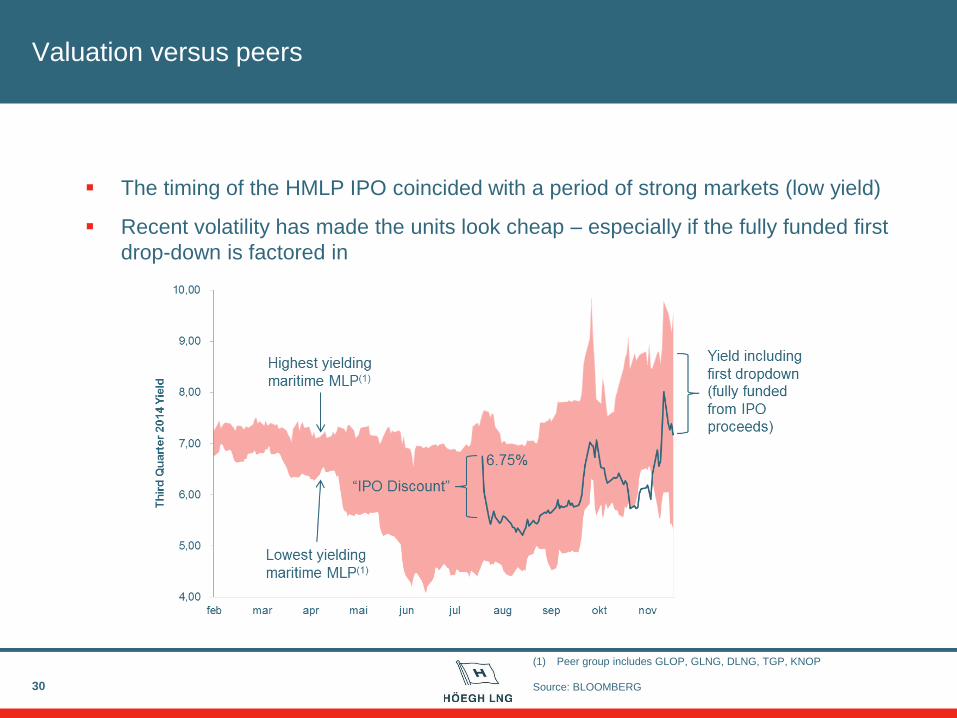
Valuation versus peers
30
The timing of the HMLP IPO coincided with a period of strong markets (low yield)
Recent volatility has made the units look cheap – especially if the fully funded first
drop-down is factored in
(1) Peer group includes GLOP, GLNG, DLNG, TGP, KNOP
Source: BLOOMBERG
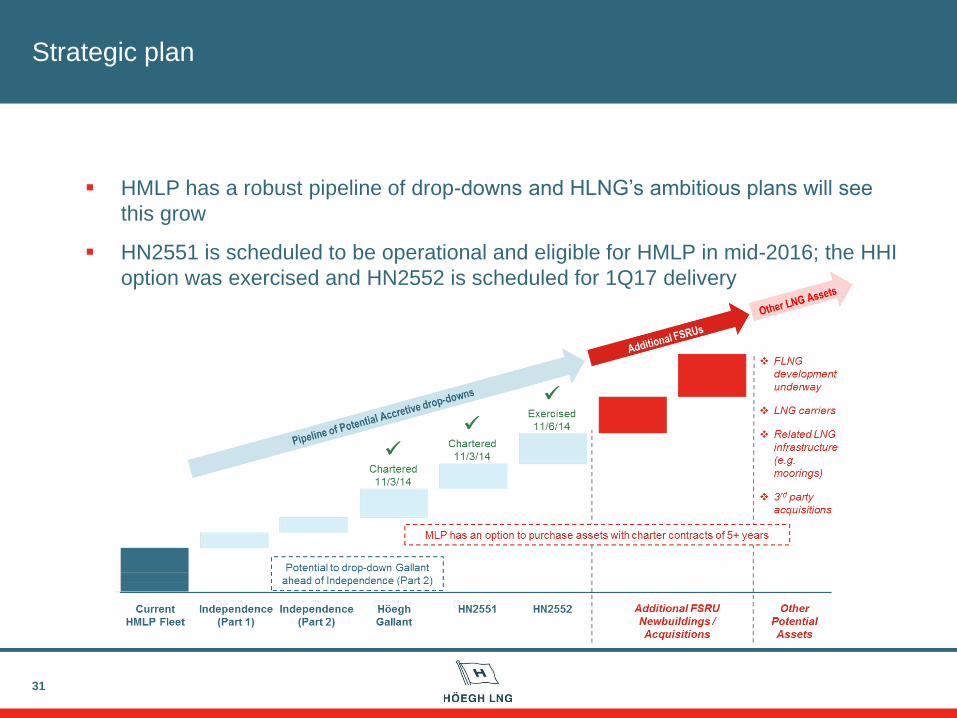
Strategic plan
31
HMLP has a robust pipeline of drop-downs and HLNG’s ambitious plans will see
this grow
HN2551 is scheduled to be operational and eligible for HMLP in mid-2016; the HHI
option was exercised and HN2552 is scheduled for 1Q17 delivery
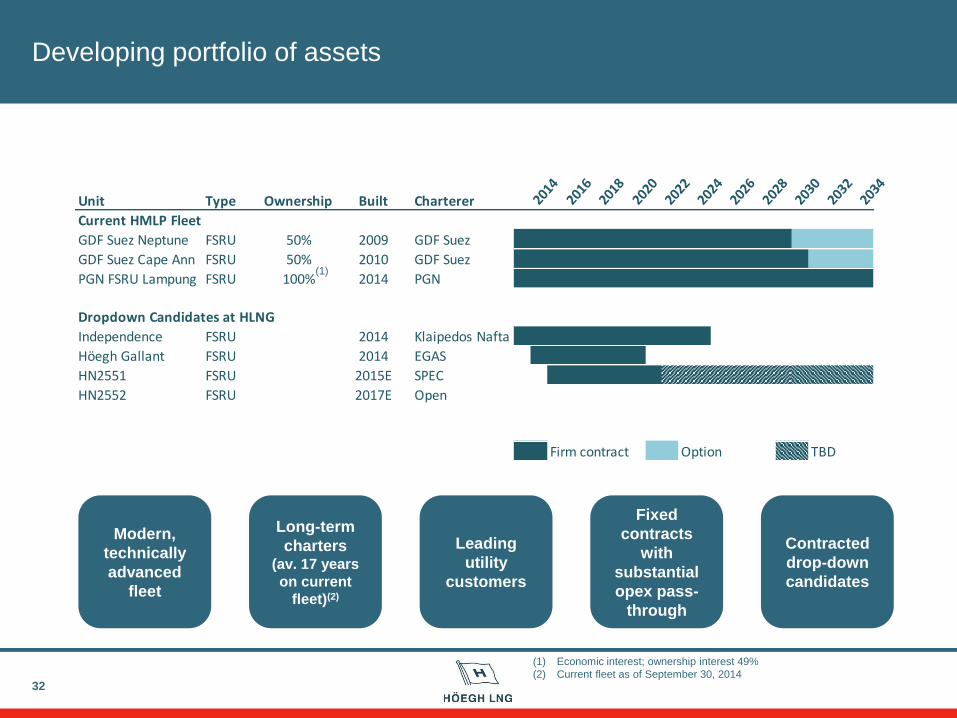
Developing portfolio of assets
32
Modern,
technically
advanced
fleet
Long-term
charters (av. 17 years
on current
fleet)(2)
Leading
utility
customers
Fixed
contracts
with
substantial
opex pass-
through
Contracted
drop-down
candidates
Unit Type Ownership Built Charterer 2014
2016
2018
2020
2022
2024
2026
2028
2030
2032
2034
Current HMLP Fleet
GDF Suez Neptune FSRU 50% 2009 GDF Suez
GDF Suez Cape Ann FSRU 50% 2010 GDF Suez
PGN FSRU Lampung FSRU 100% 2014 PGN
Dropdown Candidates at HLNG
Independence FSRU 2014 Klaipedos Nafta
Höegh Gallant FSRU 2014 EGAS
HN2551 FSRU 2015E SPEC
HN2552 FSRU 2017E Open
Firm contract Option TBD
(1)
(1) Economic interest; ownership interest 49%
(2) Current fleet as of September 30, 2014
Summary
33
Completed the successful IPO of HMLP
Contracts and vessels that are amongst the best suited in the maritime
segment for the asset class
First dropdown (Independence Part 1) funded by IPO proceeds; no follow-
on required
Robust pipeline of accretive dropdown candidates
Parent with ambitious growth plans
34
FSRU / LNGC strategy and market update
Presented by
Ragnar Wisløff – CCO
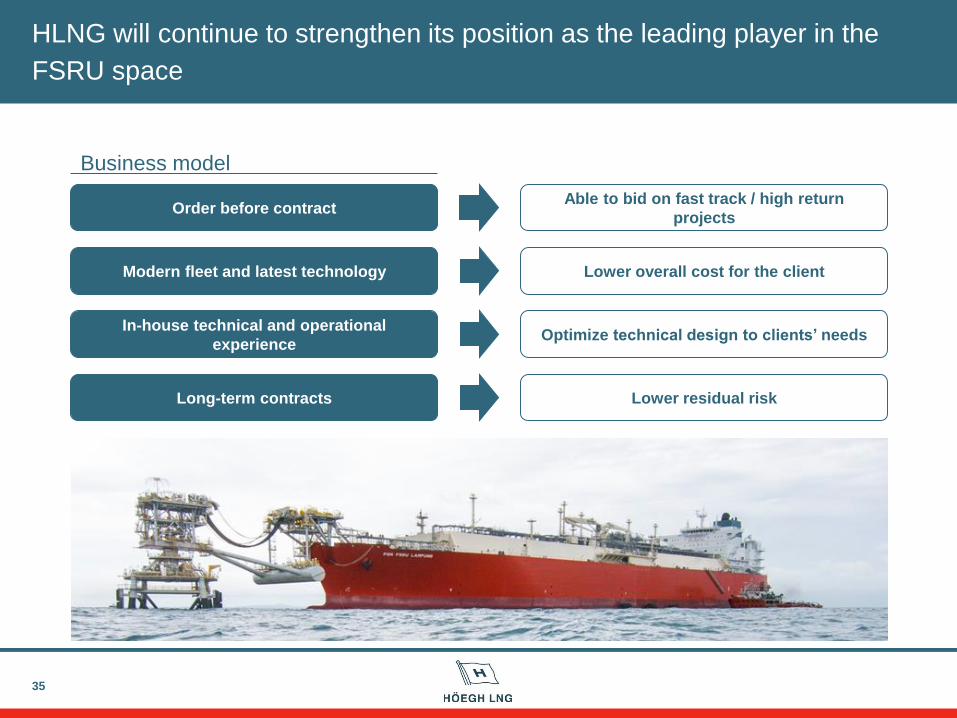
HLNG will continue to strengthen its position as the leading player in the
FSRU space
35
Order before contract
Modern fleet and latest technology
In-house technical and operational
experience
Long-term contracts
Lower overall cost for the client
Optimize technical design to clients’ needs
Lower residual risk
Business model
Able to bid on fast track / high return
projects
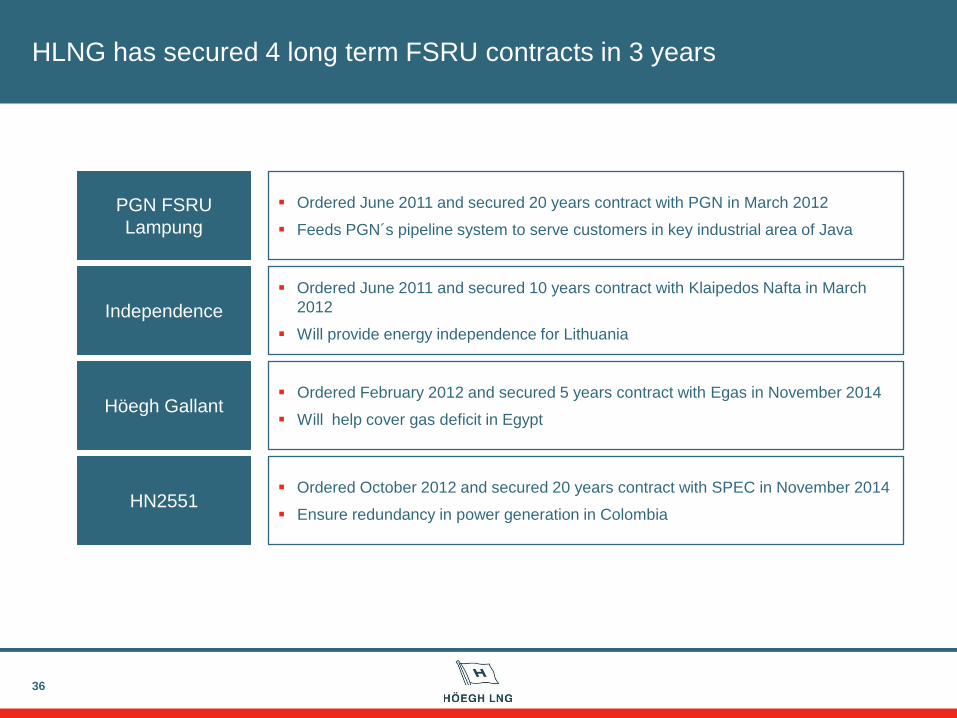
HLNG has secured 4 long term FSRU contracts in 3 years
36
Höegh Gallant
HN2551
PGN FSRU
Lampung
Independence
Ordered June 2011 and secured 20 years contract with PGN in March 2012
Feeds PGN´s pipeline system to serve customers in key industrial area of Java
Ordered June 2011 and secured 10 years contract with Klaipedos Nafta in March
2012
Will provide energy independence for Lithuania
Ordered February 2012 and secured 5 years contract with Egas in November 2014
Will help cover gas deficit in Egypt
Ordered October 2012 and secured 20 years contract with SPEC in November 2014
Ensure redundancy in power generation in Colombia
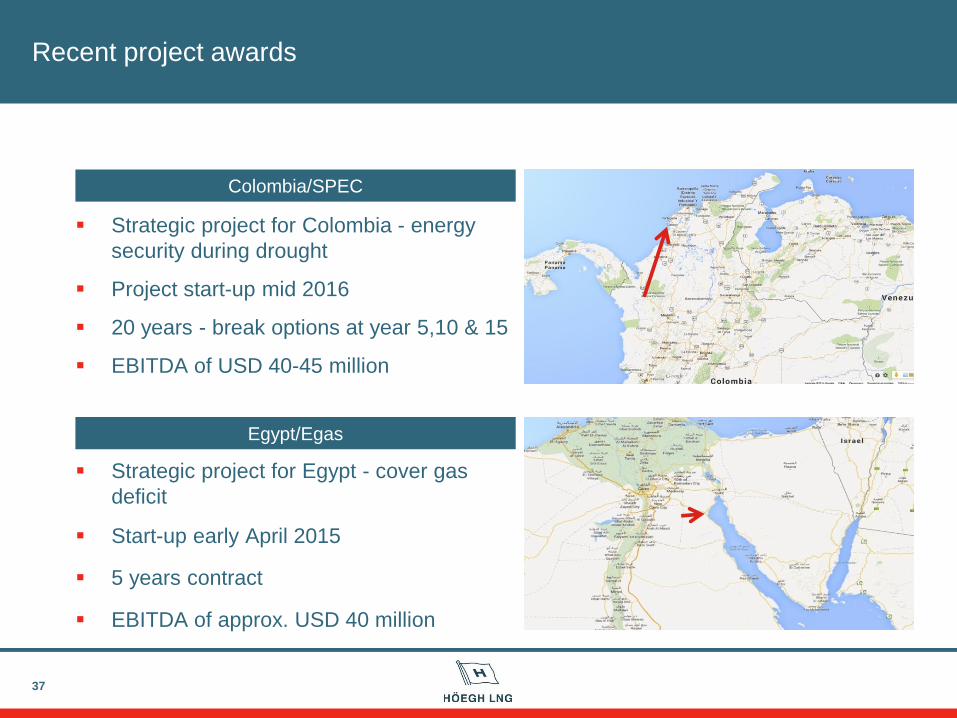
Recent project awards
Strategic project for Colombia - energy
security during drought
Project start-up mid 2016
20 years - break options at year 5,10 & 15
EBITDA of USD 40-45 million
37
Strategic project for Egypt - cover gas
deficit
Start-up early April 2015
5 years contract
EBITDA of approx. USD 40 million
Colombia/SPEC
Egypt/Egas
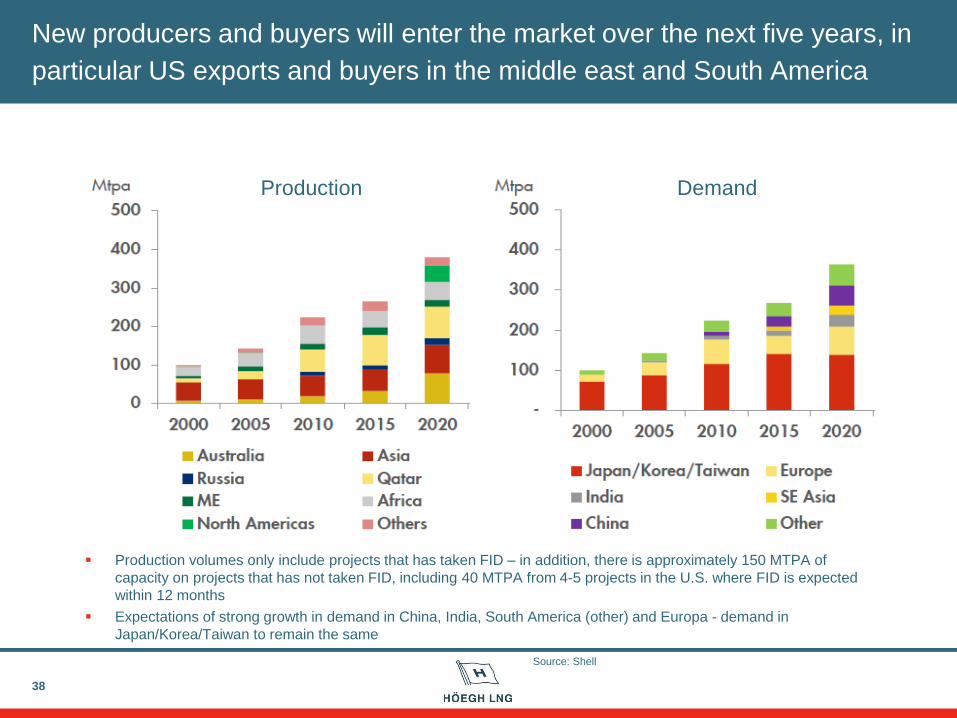
New producers and buyers will enter the market over the next five years, in
particular US exports and buyers in the middle east and South America
38
Production Demand
Production volumes only include projects that has taken FID – in addition, there is approximately 150 MTPA of
capacity on projects that has not taken FID, including 40 MTPA from 4-5 projects in the U.S. where FID is expected
within 12 months
Expectations of strong growth in demand in China, India, South America (other) and Europa - demand in
Japan/Korea/Taiwan to remain the same
Source: Shell
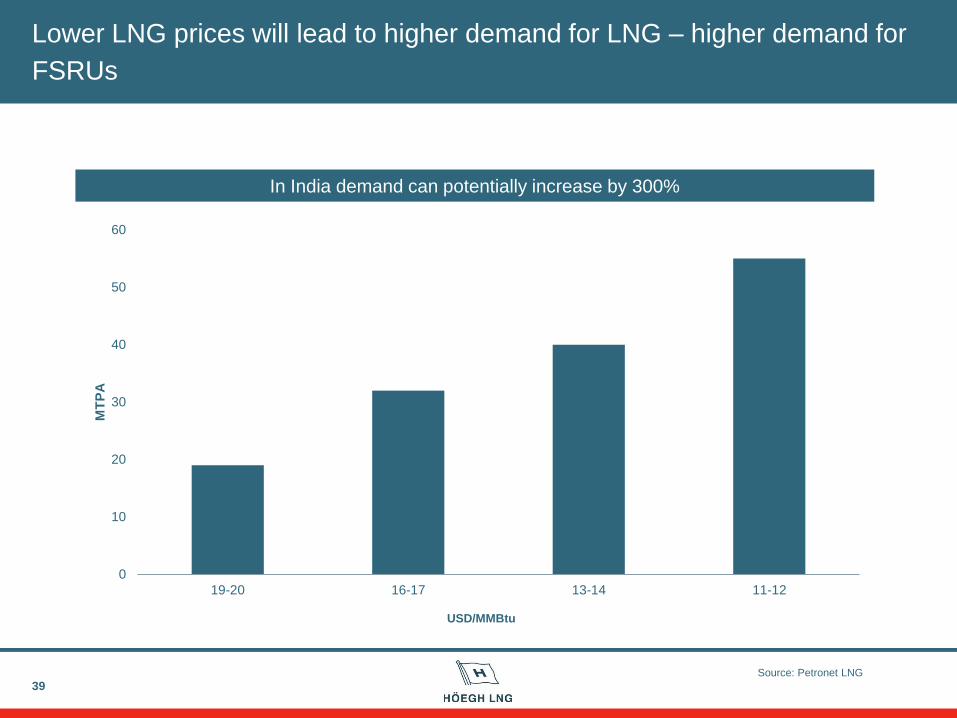
Lower LNG prices will lead to higher demand for LNG – higher demand for
FSRUs
39
In India demand can potentially increase by 300%
Source: Petronet LNG
USD/MMBtu
0
10
20
30
40
50
60
19-20 16-17 13-14 11-12
MT
PA
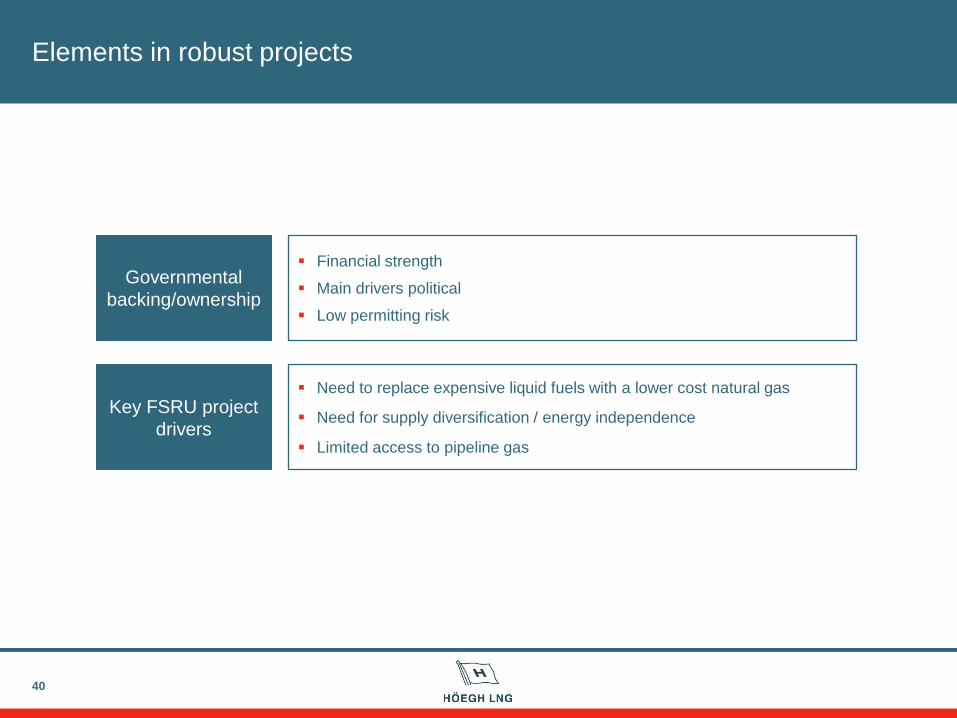
Elements in robust projects
40
Governmental
backing/ownership
Key FSRU project
drivers
Financial strength
Main drivers political
Low permitting risk
Need to replace expensive liquid fuels with a lower cost natural gas
Need for supply diversification / energy independence
Limited access to pipeline gas
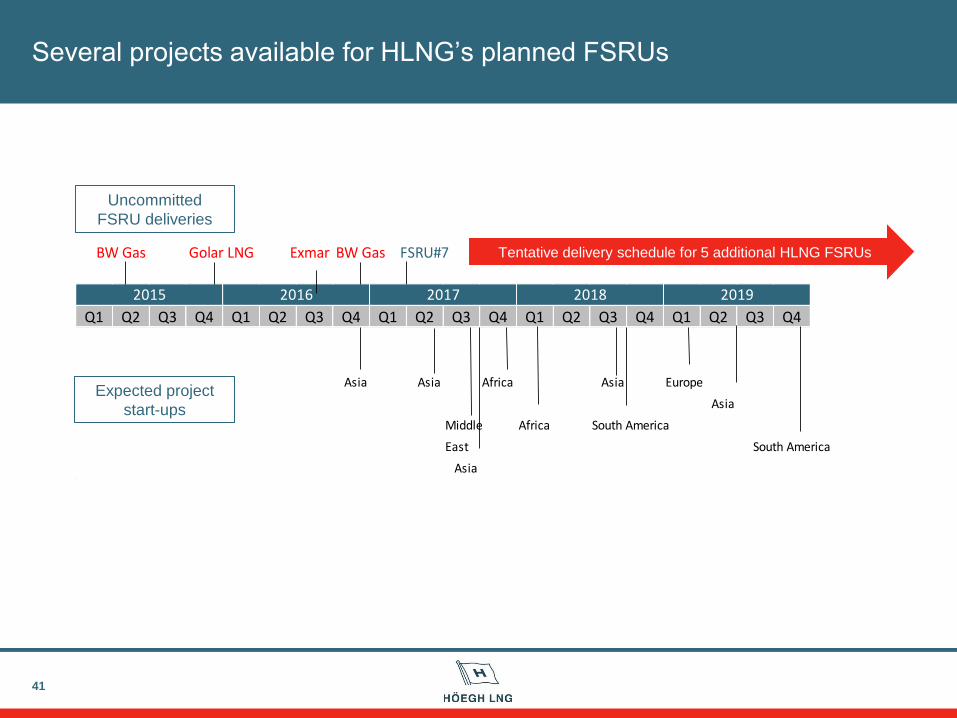
Several projects available for HLNG’s planned FSRUs
41
Uncommitted
FSRU deliveries
BW Gas Golar LNG Exmar BW Gas FSRU#7
Q1 Q2 Q3 Q4 Q1 Q2 Q3 Q4 Q1 Q2 Q3 Q4 Q1 Q2 Q3 Q4 Q1 Q2 Q3 Q4
Asia Asia Africa Asia Europe
Asia
Middle Africa South America
East South America
Asia
2015 2017 2018 20192016
Tentative delivery schedule for 5 additional HLNG FSRUs
Expected project
start-ups
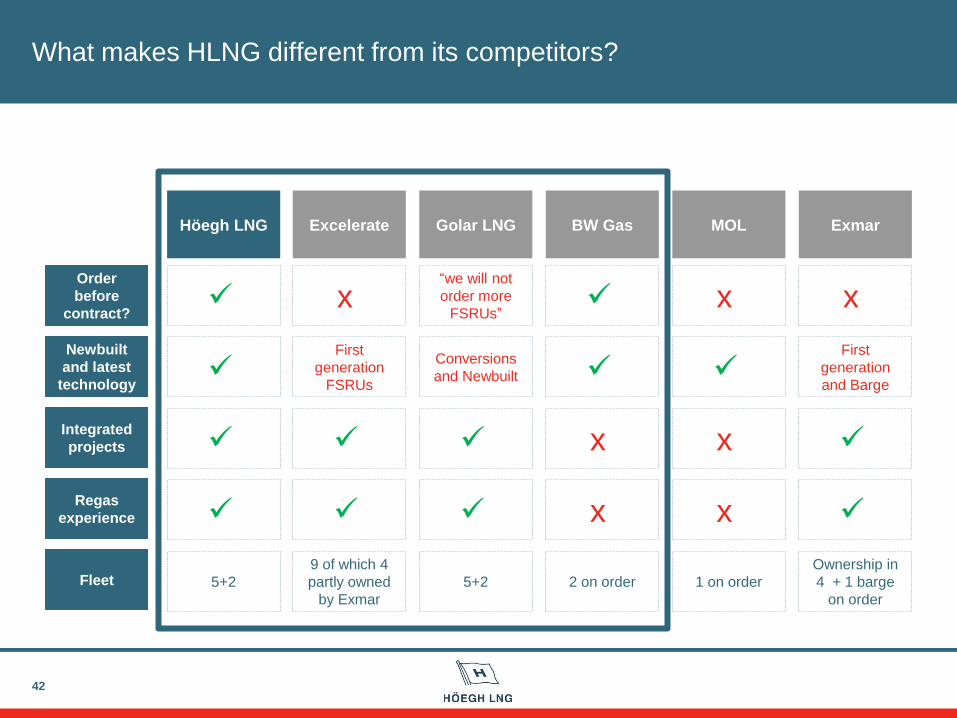
What makes HLNG different from its competitors?
42
i
i
“we will not
order more
FSRUs”
Höegh LNG
Golar LNG
Excelerate
Newbuilt
and latest
technology
i xi Order
before
contract?
Integrated
projects i
First
generation
FSRUs i
xi
Regas
experience i i xi
i
BW Gas
i
xi
xi
Conversions
and Newbuilt
i
MOL
Exmar
xi xi
i
First
generation
and Barge
i i
Fleet 5+2
9 of which 4
partly owned
by Exmar
2 on order 1 on order 5+2
Ownership in
4 + 1 barge
on order
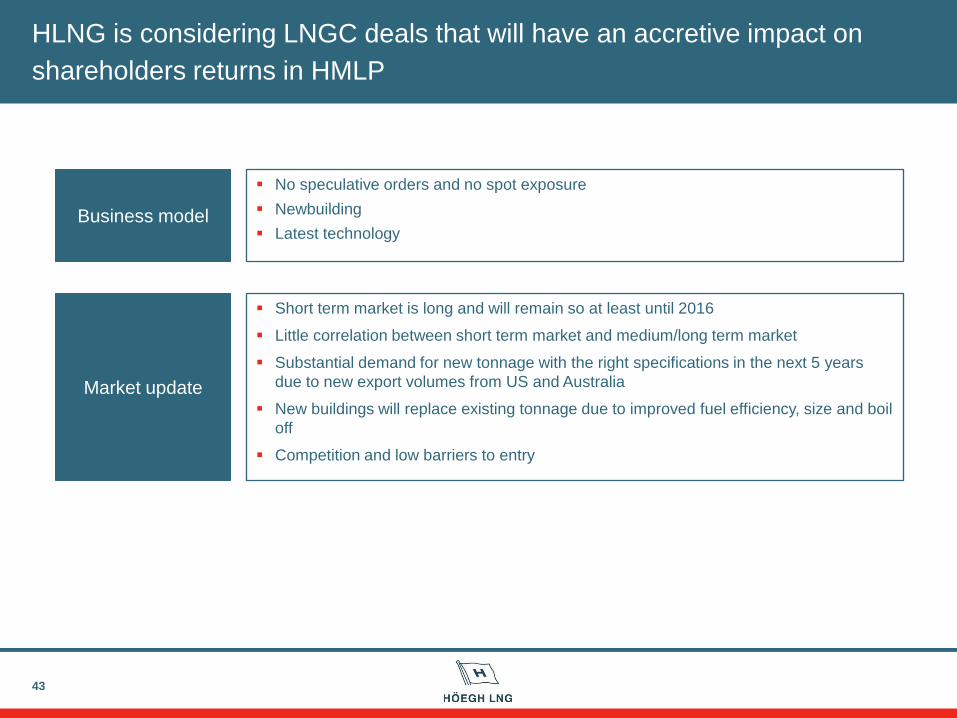
HLNG is considering LNGC deals that will have an accretive impact on
shareholders returns in HMLP
43
Business model
Market update
No speculative orders and no spot exposure
Newbuilding
Latest technology
Short term market is long and will remain so at least until 2016
Little correlation between short term market and medium/long term market
Substantial demand for new tonnage with the right specifications in the next 5 years
due to new export volumes from US and Australia
New buildings will replace existing tonnage due to improved fuel efficiency, size and boil
off
Competition and low barriers to entry
Summary
44
HLNG’s FSRU focus has been a great success – 6 modern FSRUs on long
term contracts
Positive market prospects; increasing demand for FSRUs and entry barriers
continue to be high
HLNG will continue to strengthen its position as the leading player in the
FSRU space
HLNG is considering LNGC deals that will have an accretive impact on
shareholders returns in HMLP
45
FSRU innovation, project execution and operation
Presented by
Vegard Hellekleiv – CTO
Experienced technical team - taken delivery of 3 FSRUs in 7 months
46
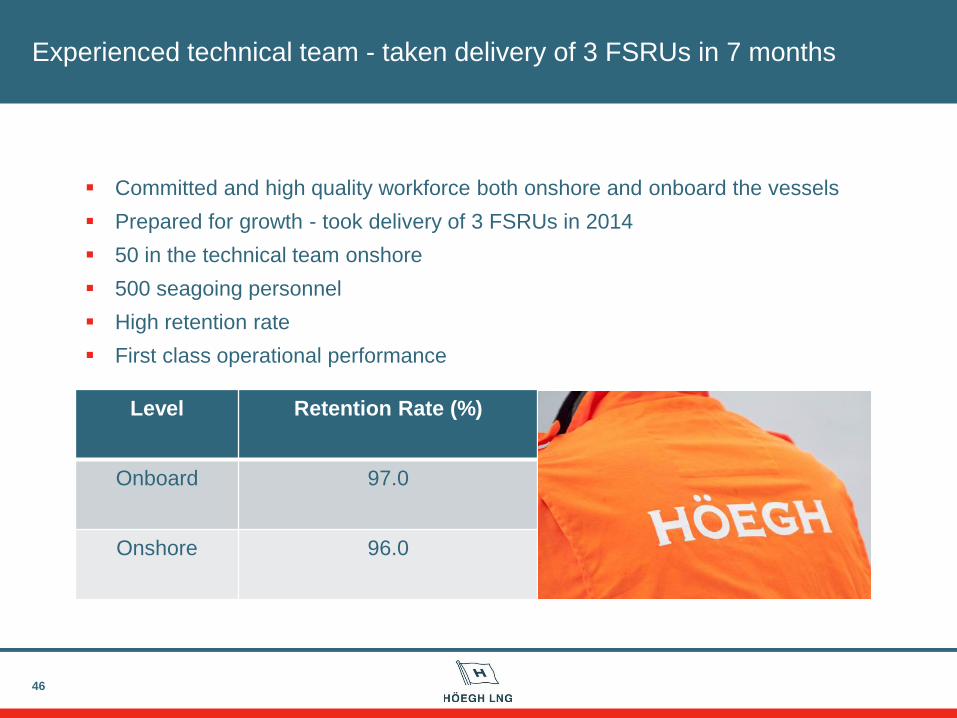
Committed and high quality workforce both onshore and onboard the vessels
Prepared for growth - took delivery of 3 FSRUs in 2014
50 in the technical team onshore
500 seagoing personnel
High retention rate
First class operational performance
Level Retention Rate (%)
Onboard 97.0
Onshore 96.0
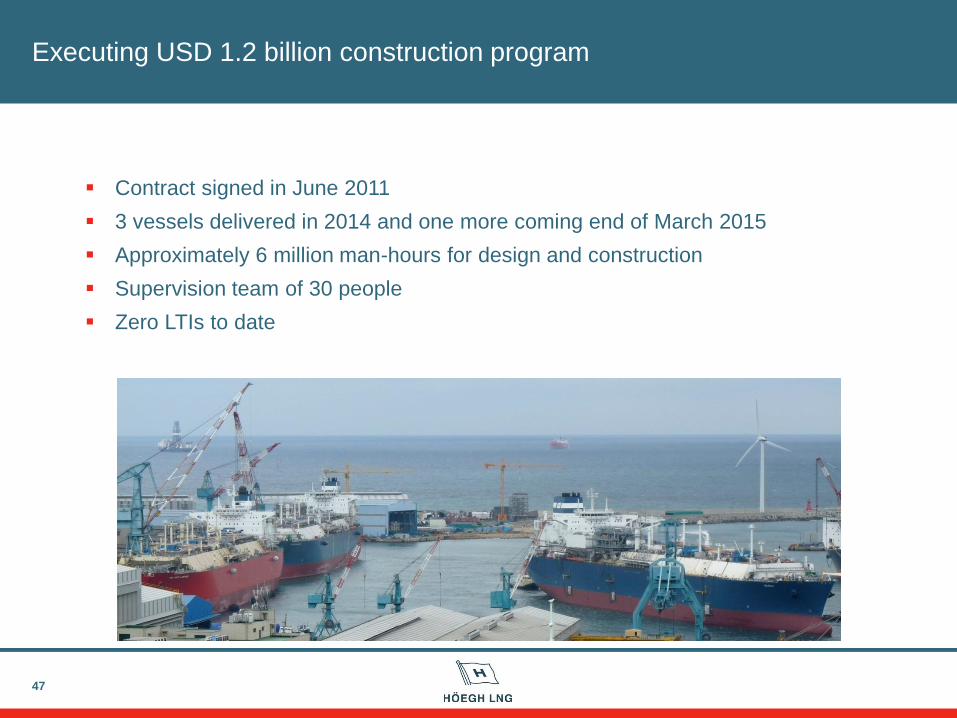
Executing USD 1.2 billion construction program
47
Contract signed in June 2011
3 vessels delivered in 2014 and one more coming end of March 2015
Approximately 6 million man-hours for design and construction
Supervision team of 30 people
Zero LTIs to date
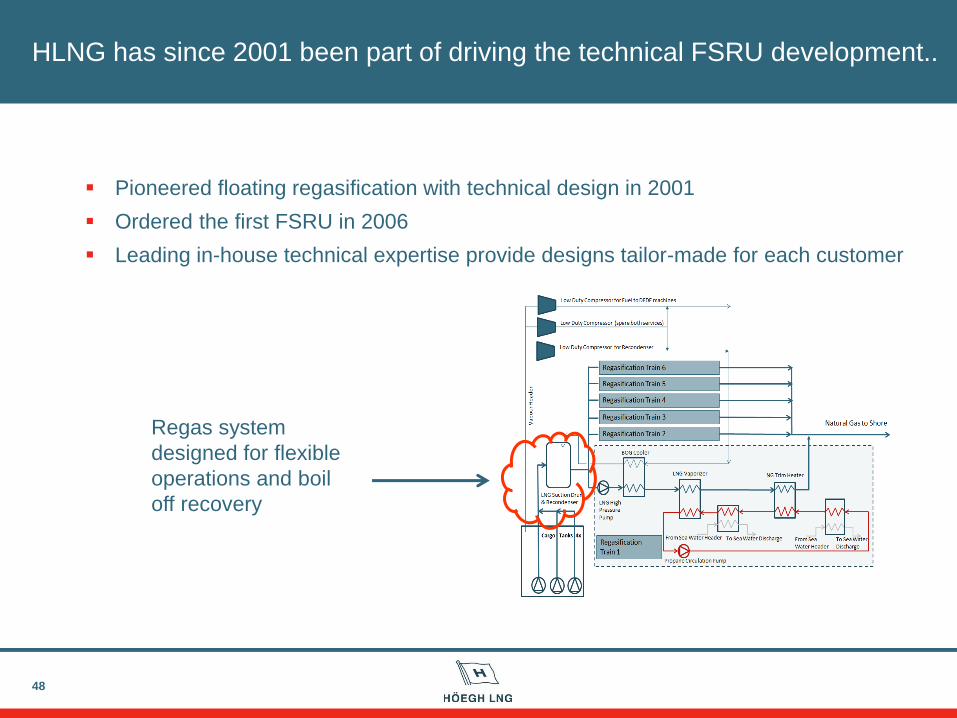
HLNG has since 2001 been part of driving the technical FSRU development..
48
Regas system
designed for flexible
operations and boil
off recovery
Pioneered floating regasification with technical design in 2001
Ordered the first FSRU in 2006
Leading in-house technical expertise provide designs tailor-made for each customer
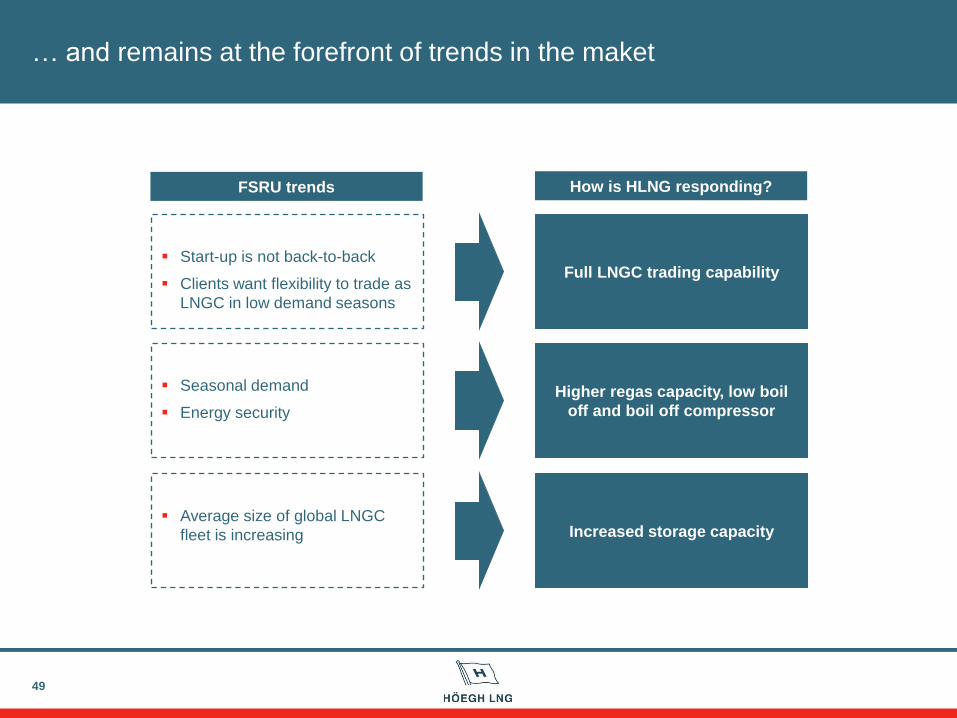
… and remains at the forefront of trends in the maket
49
Full LNGC trading capability
Higher regas capacity, low boil
off and boil off compressor
Start-up is not back-to-back
Clients want flexibility to trade as
LNGC in low demand seasons
Seasonal demand
Energy security
How is HLNG responding?
Increased storage capacity
Average size of global LNGC
fleet is increasing
FSRU trends
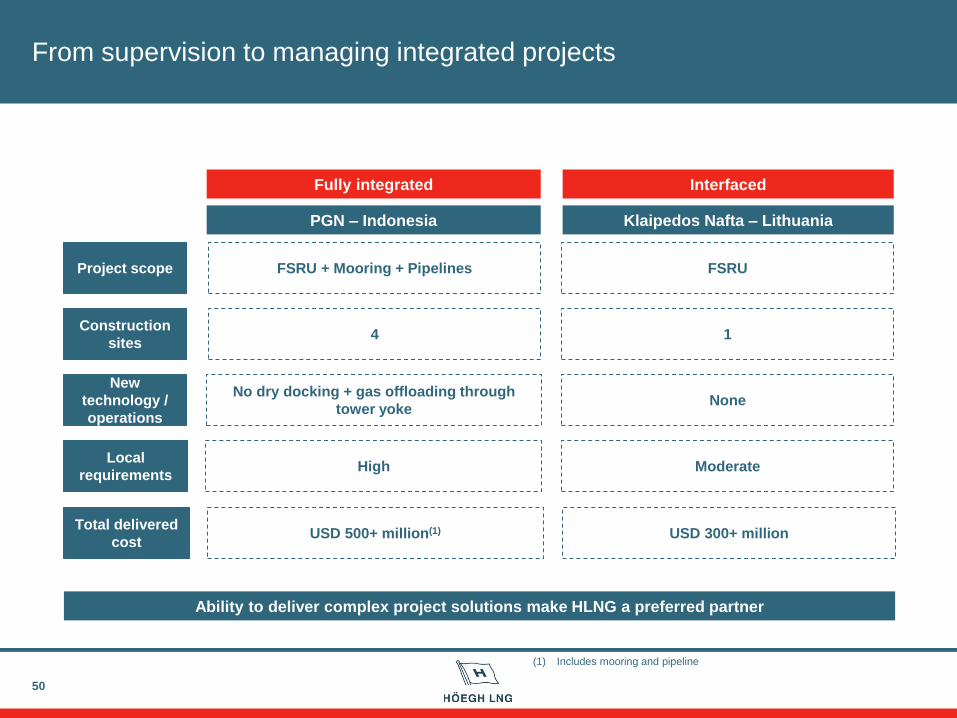
From supervision to managing integrated projects
50
4
None
Construction
sites
FSRU + Mooring + Pipelines FSRU Project scope
New
technology /
operations
No dry docking + gas offloading through
tower yoke
1
Local
requirements High Moderate
Total delivered
cost USD 500+ million(1) USD 300+ million
Ability to deliver complex project solutions make HLNG a preferred partner
Fully integrated Interfaced
PGN – Indonesia Klaipedos Nafta – Lithuania
(1) Includes mooring and pipeline
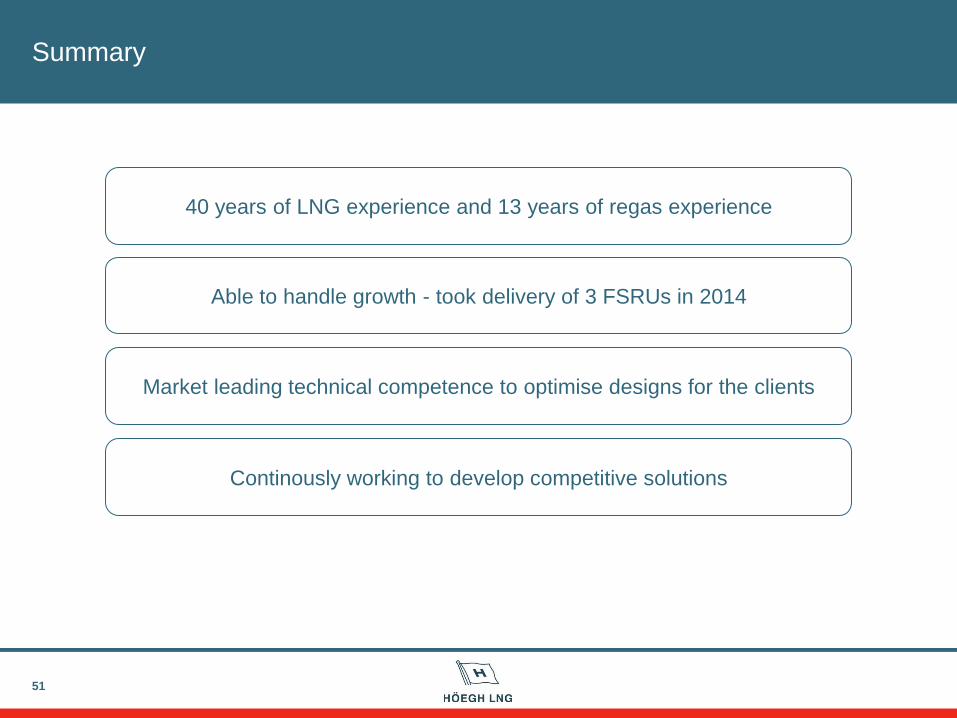
Summary
51
40 years of LNG experience and 13 years of regas experience
Able to handle growth - took delivery of 3 FSRUs in 2014
Market leading technical competence to optimise designs for the clients
Continously working to develop competitive solutions
52
FLNG strategy
Presented by
Øivin Iversen – CDO
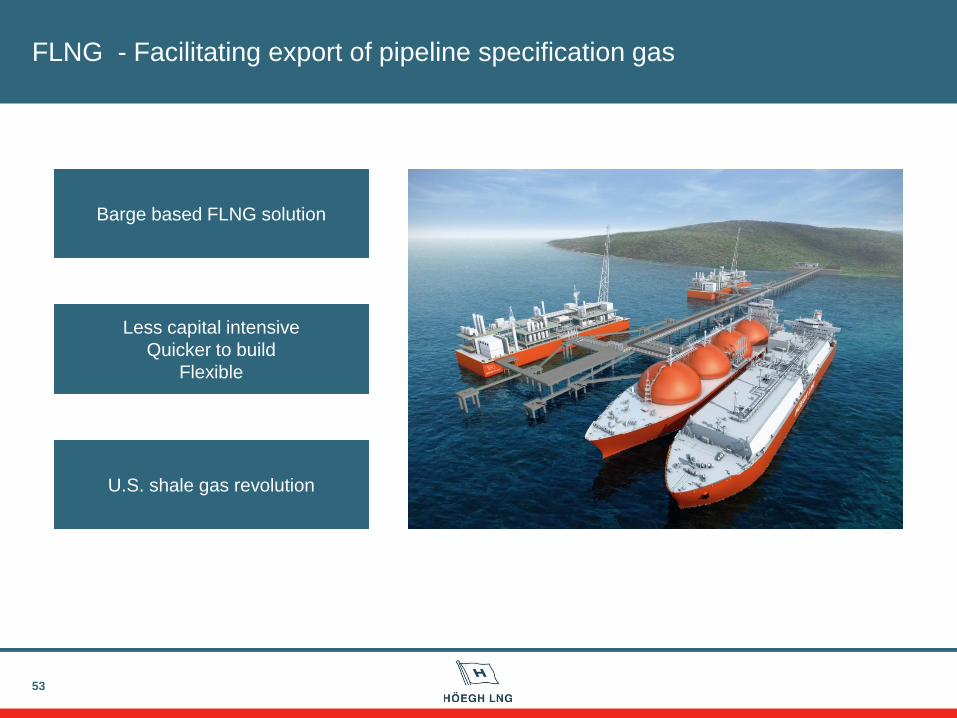
FLNG - Facilitating export of pipeline specification gas
53
U.S. shale gas revolution
Barge based FLNG solution
Less capital intensive
Quicker to build
Flexible
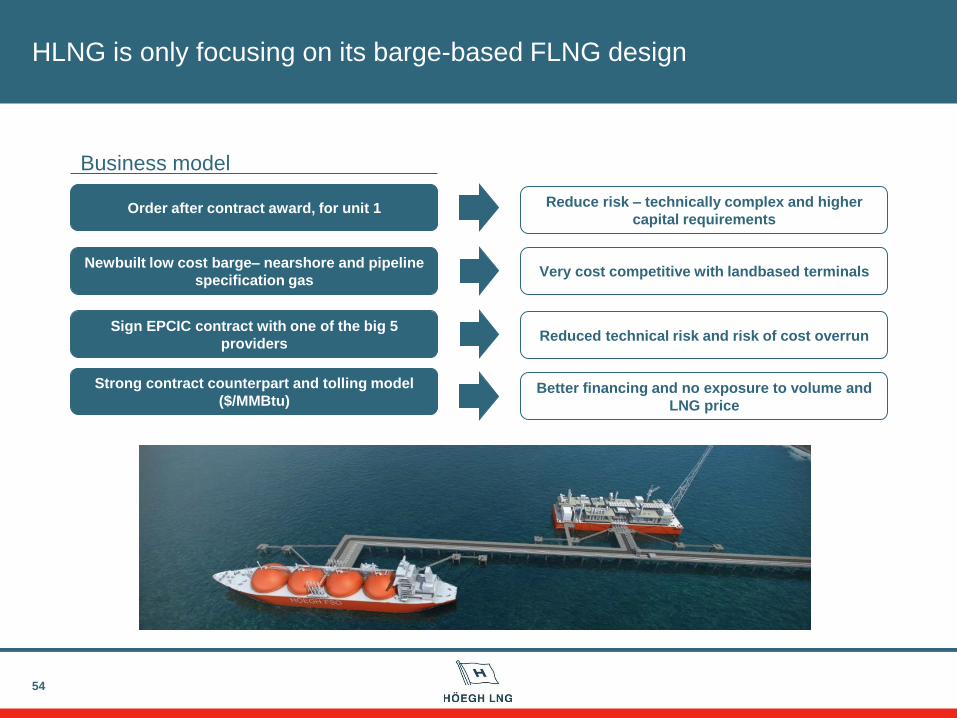
HLNG is only focusing on its barge-based FLNG design
54
Strong contract counterpart and tolling model
($/MMBtu)
Newbuilt low cost barge– nearshore and pipeline
specification gas
Sign EPCIC contract with one of the big 5
providers
Order after contract award, for unit 1
Better financing and no exposure to volume and
LNG price
Very cost competitive with landbased terminals
Reduced technical risk and risk of cost overrun
Reduce risk – technically complex and higher
capital requirements
Business model
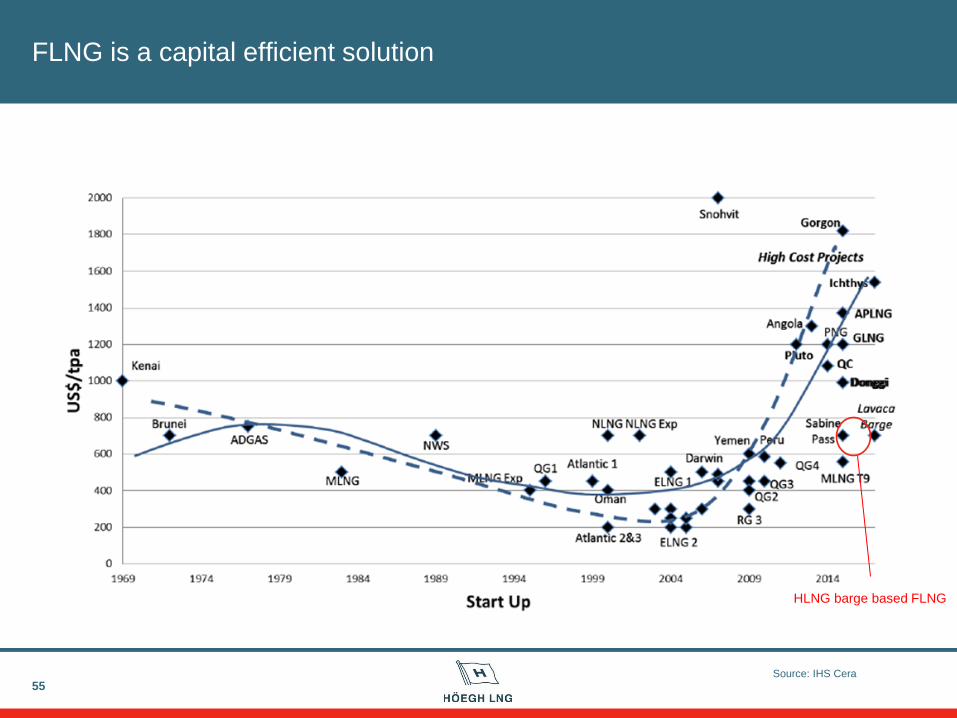
FLNG is a capital efficient solution
55
HLNG barge based FLNG
Source: IHS Cera
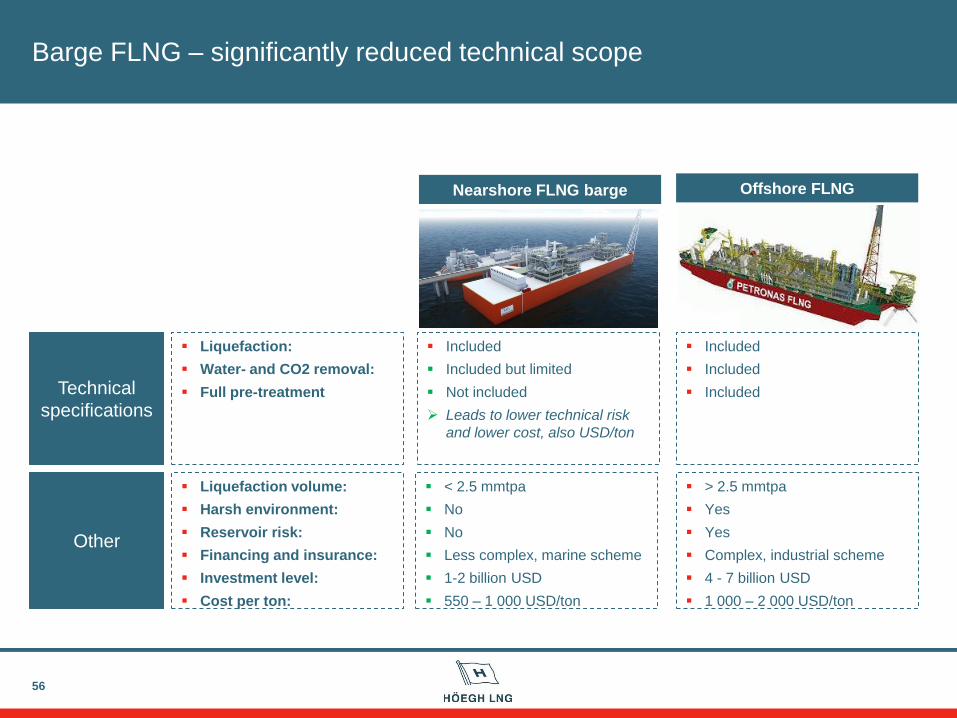
Barge FLNG – significantly reduced technical scope
56
Liquefaction volume:
Harsh environment:
Reservoir risk:
Financing and insurance:
Investment level:
Cost per ton:
> 2.5 mmtpa
Yes
Yes
Complex, industrial scheme
4 - 7 billion USD
1 000 – 2 000 USD/ton
Included
Included but limited
Not included
Leads to lower technical risk
and lower cost, also USD/ton
Other
Liquefaction:
Water- and CO2 removal:
Full pre-treatment
Included
Included
Included
< 2.5 mmtpa
No
No
Less complex, marine scheme
1-2 billion USD
550 – 1 000 USD/ton
Technical
specifications
Nearshore FLNG barge Offshore FLNG
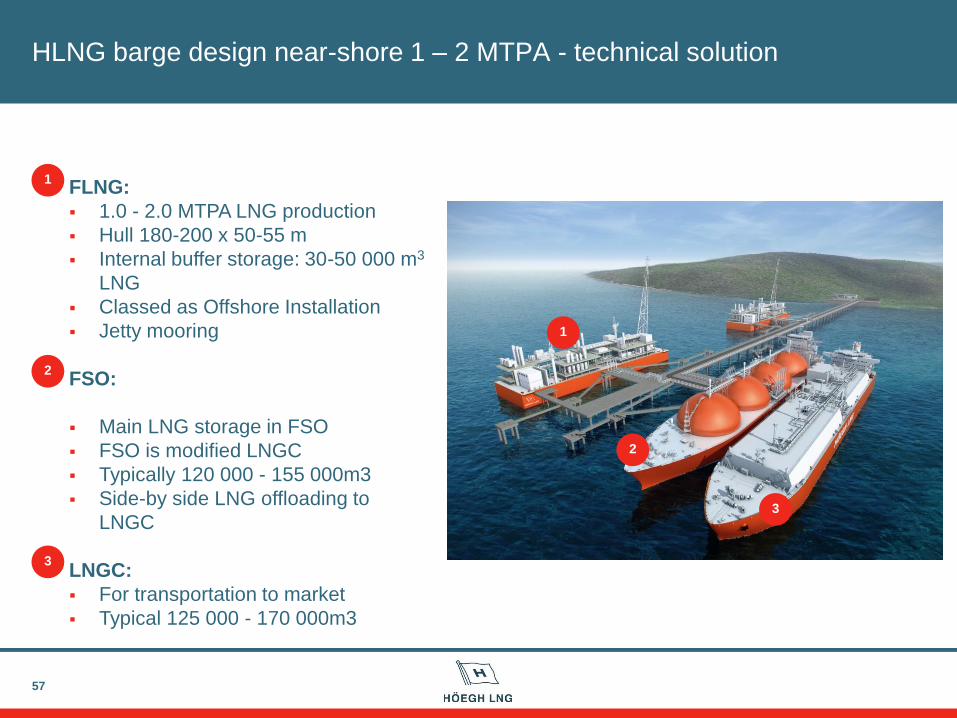
57
FLNG:
1.0 - 2.0 MTPA LNG production
Hull 180-200 x 50-55 m
Internal buffer storage: 30-50 000 m3
LNG
Classed as Offshore Installation
Jetty mooring
FSO:
Main LNG storage in FSO
FSO is modified LNGC
Typically 120 000 - 155 000m3
Side-by side LNG offloading to
LNGC
LNGC:
For transportation to market
Typical 125 000 - 170 000m3
1
2
2
3
3
HLNG barge design near-shore 1 – 2 MTPA - technical solution
1
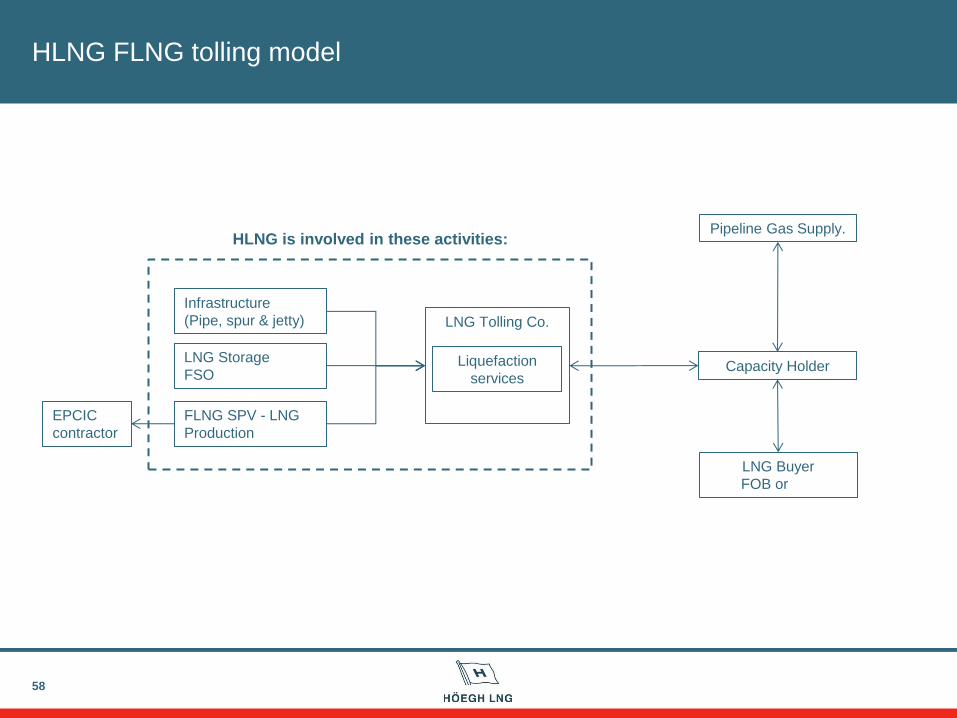
HLNG FLNG tolling model
58
Infrastructure
(Pipe, spur & jetty)
FLNG SPV - LNG
Production
LNG Storage
FSO
LNG Tolling Co.
Liquefaction
services
LNG Buyer
FOB or CIF
Capacity Holder
Pipeline Gas Supply.
EPCIC
contractor
HLNG is involved in these activities:
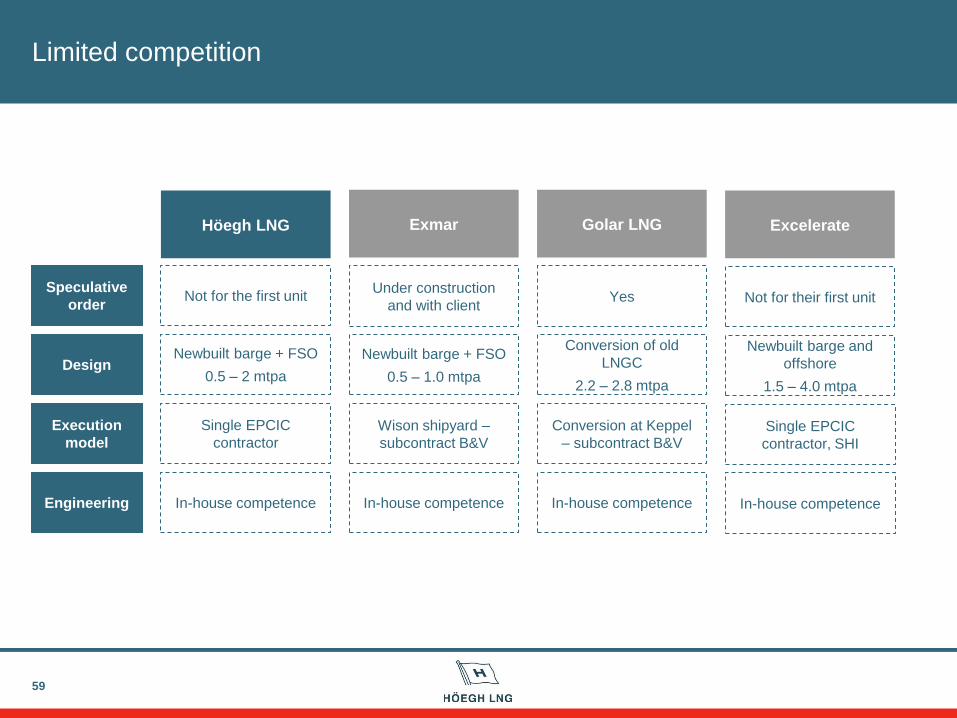
Limited competition
59
Newbuilt barge + FSO
0.5 – 2 mtpa
Wison shipyard –
subcontract B&V
Yes
Höegh LNG
Golar LNG
Exmar
Design
Not for the first unit Under construction
and with client
Speculative
order
Execution
model
Single EPCIC
contractor
Newbuilt barge + FSO
0.5 – 1.0 mtpa
Conversion of old
LNGC
2.2 – 2.8 mtpa
Conversion at Keppel
– subcontract B&V
Engineering In-house competence In-house competence In-house competence
Not for their first unit
Excelerate
Newbuilt barge and
offshore
1.5 – 4.0 mtpa
Single EPCIC
contractor, SHI
In-house competence
60
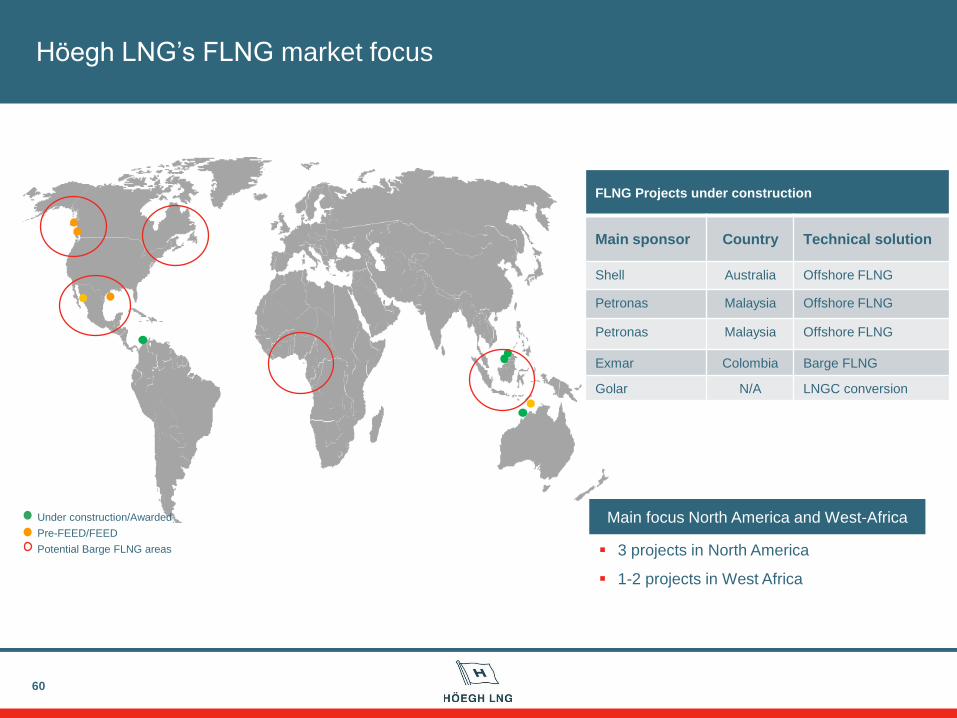
FLNG Projects under construction
Main sponsor Country Technical solution
Shell Australia Offshore FLNG
Petronas Malaysia Offshore FLNG
Petronas Malaysia Offshore FLNG
Exmar Colombia Barge FLNG
Golar N/A LNGC conversion
Under construction/Awarded
Pre-FEED/FEED
Potential Barge FLNG areas
Höegh LNG’s FLNG market focus
Main focus North America and West-Africa
3 projects in North America
1-2 projects in West Africa
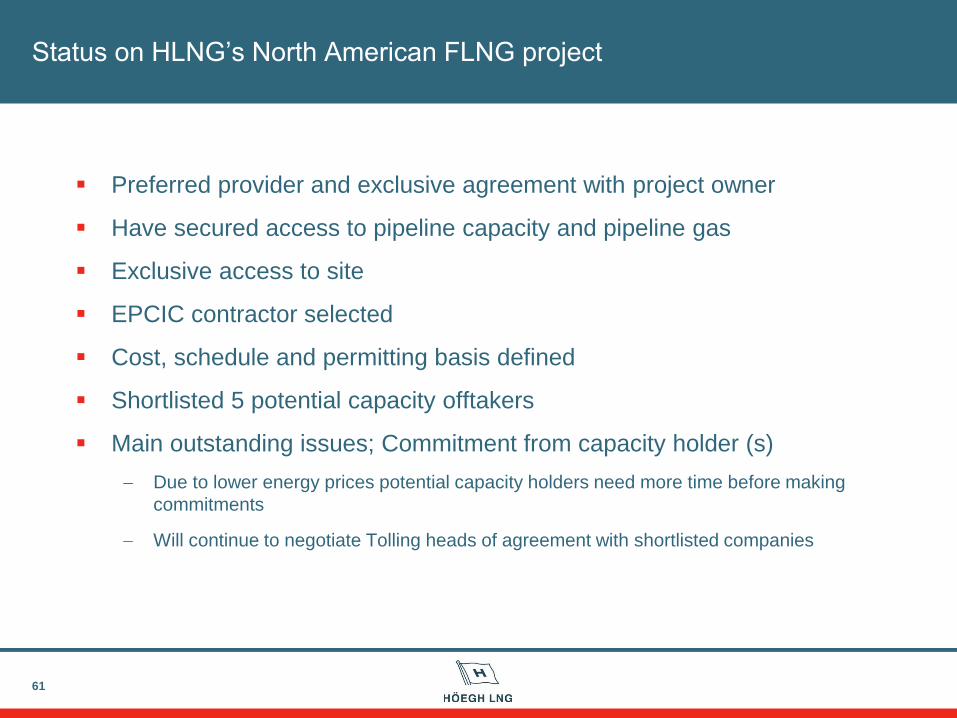
Status on HLNG’s North American FLNG project
Preferred provider and exclusive agreement with project owner
Have secured access to pipeline capacity and pipeline gas
Exclusive access to site
EPCIC contractor selected
Cost, schedule and permitting basis defined
Shortlisted 5 potential capacity offtakers
Main outstanding issues; Commitment from capacity holder (s)
Due to lower energy prices potential capacity holders need more time before making
commitments
Will continue to negotiate Tolling heads of agreement with shortlisted companies
61
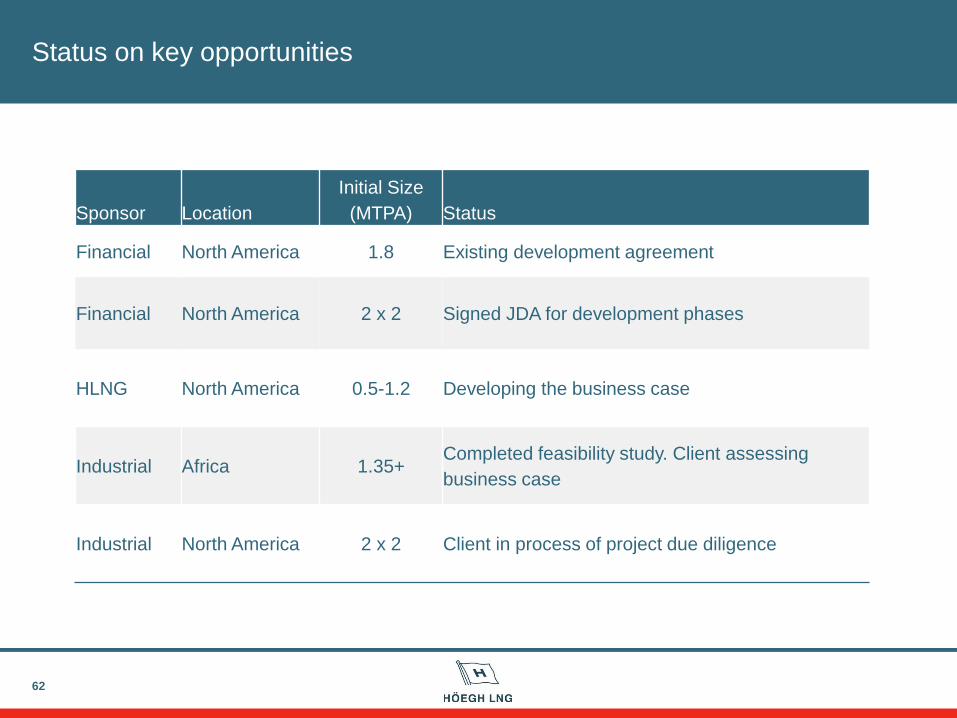
Status on key opportunities
62
Sponsor Location
Initial Size
(MTPA) Status
Financial North America 1.8 Existing development agreement
Financial North America 2 x 2 Signed JDA for development phases
HLNG North America 0.5-1.2 Developing the business case
Industrial Africa 1.35+ Completed feasibility study. Client assessing
business case
Industrial North America 2 x 2 Client in process of project due diligence
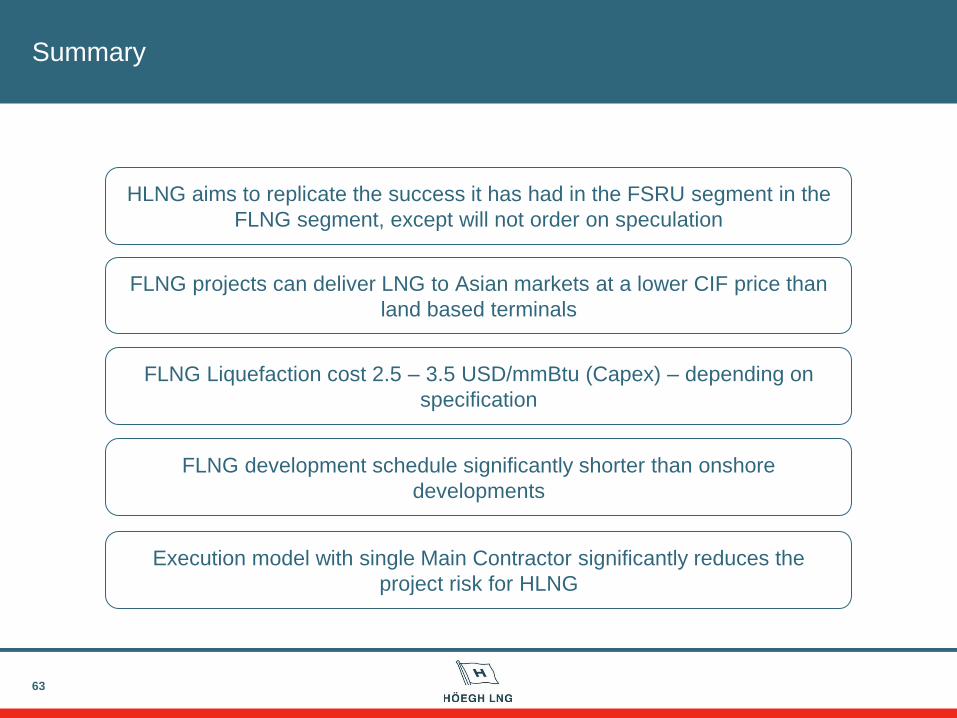
Summary
63
HLNG aims to replicate the success it has had in the FSRU segment in the
FLNG segment, except will not order on speculation
FLNG projects can deliver LNG to Asian markets at a lower CIF price than
land based terminals
FLNG Liquefaction cost 2.5 – 3.5 USD/mmBtu (Capex) – depending on
specification
FLNG development schedule significantly shorter than onshore
developments
Execution model with single Main Contractor significantly reduces the
project risk for HLNG
64
Closing remarks
Presented by
Sveinung J.S. Støhle – CEO & President
65
HLNG’s Strategy proven success – have successfully positioned company as the
leading provider of FSRU’s in the market
HLNG will continue with its proven strategy - stronger platform allows more aggresive growth
New LNG volumes and lower LNG prices ensures continued demand for FSRUs
The MLP platform enables growth and dividend without diluting shareholders –
increasing value for shareholders
Recommended