Hotel Investor Sentiment Survey
Hotels & Hospitality Group | Q4 2016

2JLL | Global Hotel Investor Sentiment Survey | Q4 2016
Key themes:
1. Markets remain liquid despite softening in investor outlook page 3
2. Hotel operating performance outlook softens but remains positive page 4
3. Recent trends compared to one year ago page 5
4. Investors expect that initial yields (cap rates) will widen page 6
Geographies:
Stage in the investment cycle page 7
Regional detail page 8
Contents

Markets remain liquid despite softening in investor outlook
Investors’ outlook decreases from one year ago as more hotel investment markets reach a plateau in performance: Hotel investors’ outlook for the next two years shifts from 39 percent positive one year ago to 23 percent positive, according to the survey.
With investors generally making less bold plays due to the mitigated growth outlook, hotel transaction volumes are expected to end 2016 down approximately 40 percent from the extraordinary levels posted in 2015. That said, large transactions continue to reach completion and the proportion of cross-border transactions is at an all-time high.
Initial yields (cap rates) have marked a nominal increase from our last survey, driven by investors’ expectations that interest rates will rise in a number of mature markets, investors’ outlook for slower growth in hotels’ operating income, and an overall less liquid transactions environment.
The upward push to cap rates is expected to result in a narrowing in seller and buyer expectations and to underpin continued healthy levels of transactions.
Despite the challenges investors are anticipating, real estate private equity funds and institutional investors continue to raise a significant amount of capital, and hotel real estate investment trusts have posted a recent recovery in share prices.
JLL | Global Hotel Investor Sentiment Survey | Q4 2016 3
Net balance of
investors’ hotel
operating
performance
expectations:
The net balance
represents the
proportion of
respondents who
expect hotel
operating
performance to
increase, minus
the proportion of
respondents who
expect
performance to
decrease during
the given time
frames.
About the survey
JLL’s Hotel Investor Sentiment Survey is the only truly global survey of its kind and has been referenced by the global hotel
investment community since its inception in 2000. Responses for JLL’s most recent survey were collected during October 2016. This
survey represents a compilation of 12,000+ data points from hotel investors on future hotel operating performance expectations, yield
requirements and future cap rate trends.
39%23%
40%
TRANSACTIONVOLUMES
POSITIVEOUTLOOK
CAPRATES
SELLER
BUYER
EXPECTATIONS
$$$$$$$$$$$$
PRIVATEEQUITY FUNDS
INSTITUTIONALINVESTORS

Hotel operating performance outlook softens but remains positive
4
Note: Data is a weighted average of the total number of responses
Source: JLL
-60%
-40%
-20%
0%
20%
40%
60%
80%
Dec
-00
Dec
-01
Dec
-02
Oct
-03
Oct
-04
Oct
-05
Nov
-06
Oct
-07
Oct
-08
Oct
-09
Oct
-10
Oct
-11
Oct
-12
Oct
-13
Oct
-14
Oct
-15
Oct
-16
Net
bal
ance
of r
espo
nses
decr
ease
/ no
cha
nge
/ inc
reas
e
Investors' global hotel operating performance sentiment
Short Term (Six Months) Medium Term (Two Years)
0% 5% 10% 15% 20% 25% 30% 35%
Global Average
Asia Pacific
EMEA
North America
Net balance of responsesdecrease / no change / increase
Investors' hotel operating performance expectations by region
Short Term (Six Months) Medium Term (Two Years)
Note: Data is a weighted average of the total number of responses
Source: JLL
Investor sentiment dips for second
consecutive survey, but sentiment
remains positive as a whole. The
softening in investors’ performance
outlook for the medium term has
leveled off somewhat, suggesting
upside on the horizon during the next
two years.
Investors surveyed
by JLL generally
have the least
positive outlook for
markets across North
America, with the
most positive outlook
recorded for markets
across Asia Pacific.
JLL | Global Hotel Investor Sentiment Survey | Q4 2016

Recent trends compared to one year ago
5
Markets in China and Spain marked among the most significant improvement in investors’ hotel performance outlook versus
one year ago. On the other hand, investors’ outlook for Miami and Chicago has seen the most protracted softening.
Markets with most significant improvement in short-term hotel
operating performance expectations
Markets with most significant softening in short-term hotel
operating performance expectations
1. Shanghai
2. Beijing
3. Hong Kong
4. Spanish Resorts
5. Kuala Lumpur
6. Moscow
7. Amsterdam
8. Madrid
9. Bangkok
10. Barcelona
1. Miami
2. Chicago
3. Taipei
4. Paris
5. Osaka
6. Caribbean
7. New York
8. Brussels
9. London
10. Melbourne
-60%
-40%
-20%
0%
20%
40%
60%
80%
Net
bal
ance
of r
espo
nses
decr
ease
/ no
cha
nge
/ inc
reas
e
Investors' short-term (next six months) hotel operating performance sentiment
North America EMEA Asia Pacific
-60%
-40%
-20%
0%
20%
40%
60%
80%
Net
bal
ance
of r
espo
nses
decr
ease
/ no
cha
nge
/ inc
reas
eInvestors' medium-term (next two years)
hotel operating performance sentiment
North America EMEA Asia Pacific
In the short term, investors have the least positive outlook for
markets in North America, followed by EMEA and Asia Pacific. In
EMEA, investors’ expectations had shifted from a survey high
two years ago to being more cautious one year ago as investors
priced in uncertainty related to the EU Referendum vote. Now
that much of the initial shock has been processed, investors
responded with more positive expectations for
the short term.
Note: The regional averages represent responses by market weighted by number of responses.
Source: JLL
Investors’ medium-term outlook is also the least positive for
North America, which is expected to result in an increased
number of investors seeking to dispose of assets.
JLL | Global Hotel Investor Sentiment Survey | Q4 2016

Investors expect that initial yields (cap rates) will widen
6
Target cap rates increased by 20 basis points globally from one year ago according to survey respondents. The increase is most
pronounced in North America at 35 basis points, and least so in EMEA, where investors have indicated a further slight sharpening in
yield requirements, in particular for markets across Germany and Spain.
5%
6%
7%
8%
9%
10%
11%
12%
Dec-00 Dec-01 Jun-02 Dec-02 Oct-03 Oct-04 Oct-05 Nov-06 Oct-07 Oct-08 Oct-09 Oct-10 Oct-11 Oct-12 Oct-13 Oct-14 Oct-15 Oct-16
Investors' average surveyed initial yields (cap rates) by region
North America EMEA Asia Pacific Global
Note: The regional averages represent responses by market weighted by number of responses.
Source: JLL
0% 5% 10% 15% 20% 25% 30% 35%
Global Average
Asia Pacific
EMEA
North America
Net balance of responsesdecrease / no change / increase
Short-term initial yield (cap rate) trend
Net balance of investors’
expected short-term initial
yield (cap rate) trend:
The net balance represents the
proportion of respondents who
expect initial yields (cap rates)
to increase, minus the
proportion of respondents who
expect yields to decrease
during the next
six months.
Note: The regional averages represent responses by market weighted by number of responses within the region.
Source: JLL
Over the next six months, initial yields (cap rates) are slated to see the greatest
amount of upward pressure in North America, followed by Asia Pacific and EMEA.
JLL | Global Hotel Investor Sentiment Survey | Q4 2016
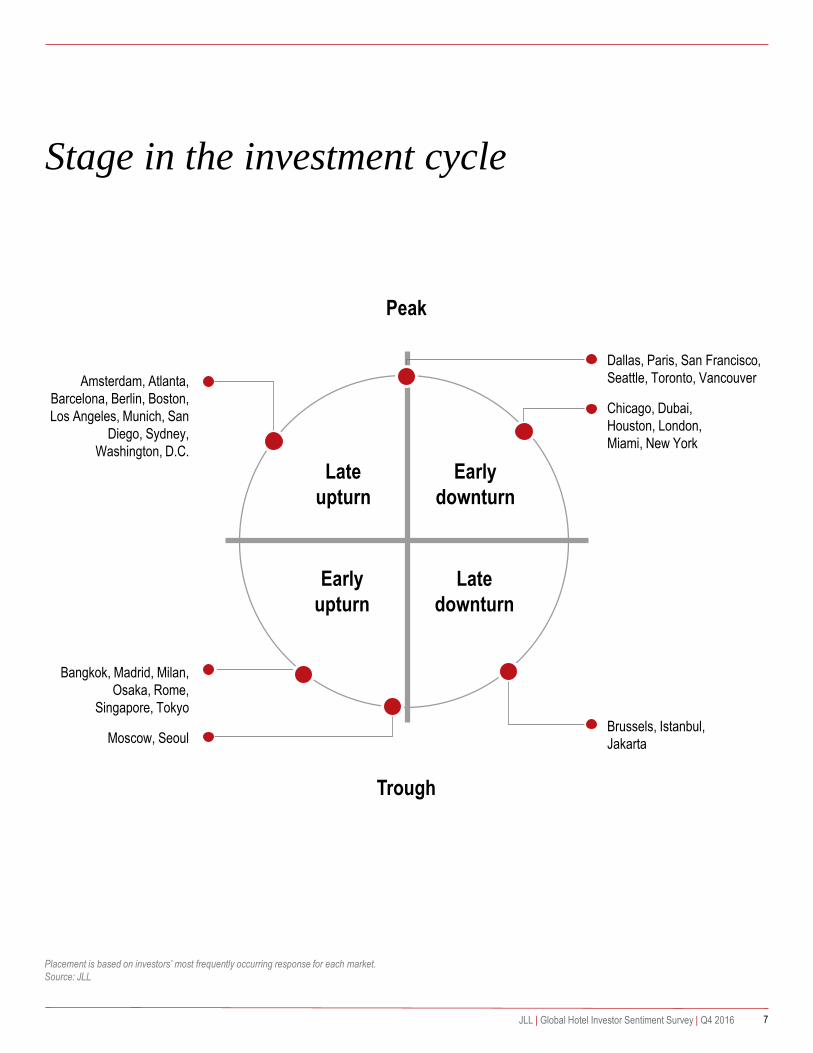
Stage in the investment cycle
7
Placement is based on investors’ most frequently occurring response for each market.
Source: JLL
Late
upturn
Early
downturn
Early
upturn
Late
downturn
Brussels, Istanbul,
Jakarta
Peak
Trough
Chicago, Dubai,
Houston, London,
Miami, New York
Dallas, Paris, San Francisco,
Seattle, Toronto, VancouverAmsterdam, Atlanta,
Barcelona, Berlin, Boston,
Los Angeles, Munich, San
Diego, Sydney,
Washington, D.C.
Bangkok, Madrid, Milan,
Osaka, Rome,
Singapore, Tokyo
Moscow, Seoul
JLL | Global Hotel Investor Sentiment Survey | Q4 2016

-80% -60% -40% -20% 0% 20% 40% 60% 80%
MadridTokyo
AmsterdamBarcelona
SydneyLisbon
Spanish ResortsDublin
BostonHawaii
Washington, D.C.Atlanta
BerlinMelbourne
SeattleToronto
Los AngelesMunich
FrankfurtSan Diego
Hong KongAucklandPhoenix
HamburgOsaka
CopenhagenShanghai
StockholmVancouver
MilanSan Francisco
RomeSeoulDallas
ViennaManila
Cape TownBeijing
SingaporeManchester
TaipeiLondonJakarta
BaliKuala Lumpur
MoscowDubai
BangkokParis
ChicagoCaribbean
BrusselsMiami
New YorkHoustonIstanbul
Net balance of responsesdecrease / no change / increase
Investors' hotel operating performance expectations
Short Term (Six Months) Medium Term (Two Years)
Regional detail
8
Investors have the most
positive outlook for Madrid,
Tokyo, Amsterdam, Barcelona
and Sydney.
For Houston, New York, Miami,
Brussels and Paris, a greater
proportion of investors expect
operating fundamentals in the
short term to decrease rather
than increase.
For Paris, this is expected to be
the most short-lived, with
investors indicating they expect
to see a notable improvement in
performance once uncertainty
related to terrorism subsides.
Source: JLL
JLL | Global Hotel Investor Sentiment Survey | Q4 2016

9
0%
1%
2%
3%
4%
5%
6%
7%
8%
9%
10%
New
Yor
k
San
Fra
ncis
co
Haw
aii
Van
couv
er
Sea
ttle
Was
hing
ton
D.C
.
Bos
ton
Los
Ang
eles
Tor
onto
Mia
mi
San
Die
go
Chi
cago
Atla
nta
Dal
las
Pho
enix
Hou
ston
North America surveyed initial yields (cap rates)
0%
1%
2%
3%
4%
5%
6%
7%
8%
9%
10%
Par
isLo
ndon
Mun
ich
Vie
nna
Am
ster
dam
Rom
eB
arce
lona
Ham
burg
Mila
nF
rank
furt
Ber
linS
tock
holm
Mad
ridD
ublin
Cop
enha
gen
Bru
ssel
sM
anch
este
rLi
sbon
Spa
nish
Res
orts
Dub
aiM
osco
wC
ape
Tow
nIs
tanb
ul
EMEA surveyed initial yields (cap rates)
0%
1%
2%
3%
4%
5%
6%
7%
8%
9%
10%
Tok
yo
Sin
gapo
re
Osa
ka
Hon
g K
ong
Tai
pei
Syd
ney
Seo
ul
Bei
jing
Sha
ngha
i
Mel
bour
ne
Auc
klan
d
Ban
gkok
Kua
la L
umpu
r
Bal
i
Man
ila
Jaka
rta
Asia Pacific surveyed initial yields (cap rates)
Investors have the lowest yield requirements for:
JLL | Global Hotel Investor Sentiment Survey | Q4 2016
North America EMEA Asia Pacific
New York
San Francisco
Hawaii
Paris
London
Munich
Tokyo
Singapore
Osaka

10
Investors expect cap rates to rise
across North American markets.
Investors expect Washington,
D.C. and Los Angeles to see the
most minimal upward pressure,
with markets such as Chicago
and Houston expected to face a
greater widening of yields.
Overall, cap rates are anticipated
to increase only marginally as
nominal lending rates remain
suppressed by spread
compression.
-20% 0% 20% 40% 60%
Houston
Chicago
Miami
Caribbean
New York
Dallas
Phoenix
San Diego
Atlanta
San Francisco
Hawaii
Boston
Seattle
Vancouver
Toronto
Los Angeles
Washington DC
Net balance of responsesdecrease / no change / increase
North America markets: short-term initial yield (cap rate) trend
-40% -20% 0% 20% 40% 60%
London
Istanbul
Manchester
Moscow
Brussels
Dubai
Cape Town
Paris
Milan
Lisbon
Rome
Vienna
Stockholm
Amsterdam
Berlin
Hamburg
Copenhagen
Frankfurt
Barcelona
Munich
Dublin
Madrid
Net balance of responsesdecrease / no change / increase
EMEA markets: short-terminitial yield (cap rate) trend
-40% -20% 0% 20% 40%
Seoul
Bangkok
Kuala Lumpur
Manila
Tapei
Shanghai
Hong Kong
Jakarta
Bali
Auckland
Osaka
Singapore
Beijing
Melbourne
Sydney
Tokyo
Net balance of responsesdecrease / no change / increase
Asia Pacific markets: short-term initial yield (cap rate) trend
Investors expect to see a
tightening of yields in 60
percent of markets surveyed in
EMEA, with investors most
bullish on value appreciation in
Madrid, Dublin, Munich and
Barcelona. Given ongoing
uncertainty from the EU
Referendum vote, respondents
expect markets in the UK to
experience a widening of yields.
Tokyo, Sydney and Melbourne
are among markets where
investors anticipate that initial
yields will mark further
compression during the next
six months, whereas
investors expect a widening
of yields in Kuala Lumpur,
Bangkok and Seoul.
Taipei
JLL | Global Hotel Investor Sentiment Survey | Q4 2016
Washington, D.C.

11JLL | Global Hotel Investor Sentiment Survey | Q4 2016

About JLL’s Hotels & Hospitality Group
JLL’s Hotels & Hospitality Group has completed more transactions than any other hotels and hospitality real estate advisor over the last five years,
totaling more than $68 billion worldwide. Between negotiating the world’s most extraordinary, enticing, and profitable property deals, the group’s 350-
strong global team also closed more than 4,400 advisory, valuation and asset management assignments. Investors worldwide turn to JLL to shape
their strategies, tailor their portfolios and maximize the value of their assets. We are recognized as the global leader in real estate services across
hospitality properties of all shapes and sizes. Our expert advice is backed by industry-leading research. We apply our broad spectrum of hotel
valuation, brokerage, asset management and consultancy services through every phase of the hotel lifecycle. We have helped more hotel investors,
owners and operators achieve high returns on their assets than any other real estate advisor in the world. Whether you are looking for a hotel or you're
ready to sell, we'll use our capital markets expertise, hospitality industry knowledge and global relationships to put the right parties together and
execute a bespoke deal that exceeds your objectives.
To find out more, talk to JLL.
www.jll.com/hospitality
About JLL
JLL (NYSE: JLL) is a professional services and investment management firm offering specialized real estate services to clients seeking increased
value by owning, occupying and investing in real estate. JLL is a Fortune 500 company with, as of December 31, 2015, revenue of $6.0 billion and fee
revenue of $5.2 billion, more than 280 corporate offices, operations in over 80 countries and a global workforce of more than 70,000. On behalf of its
clients, the company provides management and real estate outsourcing services for a property portfolio of 4.0 billion square feet, or 372 million square
meters, and completed $138 billion in sales, acquisitions and finance transactions in 2015. As of September 30, 2016, its investment management
business, LaSalle Investment Management, has $59.7 billion of real estate assets under management. JLL is the brand name, and a registered
trademark, of Jones Lang LaSalle Incorporated. For further information, visit www.jll.com.
© 2016 Jones Lang LaSalle IP, Inc. All rights reserved. All information contained herein is from sources deemed reliable; however, no representation
or warranty is made to the accuracy thereof.
Recommended