1
Household electricity consumption in the Netherlands: A model-based policy analysis
Abstract
Electric appliances are an indispensable part of a household, and through their sheer number
contribute substantially to its electricity consumption. This paper explores potential reductions
in residential appliance electricity consumption in the Netherlands with smart meters, combining
two perspectives: a sociotechnical approach and a bottom up engineering approach. The first is
used to shed light on particular factors that affect household electricity consumption, while with
the second policy scenarios are explored regarding efficiency, smart meter diffusion and
consumer behaviour. Simulation results indicate the extent of potential electricity consumption
reductions.
Keywords: households, electricity consumption, system dynamics
1. Introduction
Household energy consumption is important, whether it comes from heating, lighting, leisure
activities, or cooking. In the Netherlands, the housing sector constitutes approximately 41% of
the total national final energy consumption (Guerra Santin et al., 2009). Developing and
implementing policies in order to reduce it in line with European guidelines for 2020, is a
significant challenge (Klunder, 2005; Beerepoot, 2007). Previous work has shown that it is not
easy to overcome the inertia of the housing stock and improve its energy efficiency through
renovation, demolition of old houses and raising energy standards of new constructions (Yucel,
2013).
The present paper presents work done as part of a project funded by the Netherlands Organisation
for Scientific Research (NWO) that looks at the Dutch energy transition with a focus on the built
environment. Numerous studies have looked at household heating and cooling energy
consumption (for a review see Swan and Ugursal, 2009; Kavgic et al., 2010; Lee and Yao, 2013),
but very few concern the Netherlands, or look at appliance electricity consumption which is a
complementary, non overlapping aspect of household energy use. Policies aiming to reduce it
through feedback from smart meters, are key for meeting the EU intended target of a 20%
reduction in primary energy use by 2020 relative to 2005 baseline levels (Schleich et al., 2013).

2
This paper uses a system dynamics model to explore the potential effect of smart meter
introduction on household electricity consumption in the Netherlands, where an explicit target
of at least 80% smart meter adoption by 2020 has been set. This is important because (i) the large
scale introduction of smart meters in 2014 is seen as a step towards smart grids (Faruqui et al.,
2009), (ii) the number of household electrical appliances is growing, (iii) appliances left in
standby mode constitute approximately 10% of residential electricity consumption in many
OECD countries (IEA, 2009, p346) and (iv) recent trends in household electricity consumption
in the Netherlands show that it has reached 20% of total energy consumption (EDC, 2013). These
trends apply broadly in most developed countries. For example, it is estimated that by 2020
Information and Communication Technology (ICT) appliances will account for 45% of UK
household electricity consumption (Owen, 2007).
However, household electricity consumption is not just determined by appliance specifications.
Consumption in identical homes, even in low-energy dwellings, can easily differ by a factor of
two or more, depending on occupant behaviour (Darby, 2006). Hence, technical and physical
improvements in household efficiency are not enough to warrant reduced electricity
consumption. This is a sociotechnical issue (Grin et al., 2010), in the sense that innovation and
technology policies, as well as electricity supply and consumer behaviour are all intricately
connected. Therefore, policies aiming to reduce electricity consumption must have a demand
side component aiming at reducing electricity demand, as well as a supply-technical component
aiming at improving the energy efficiency of appliances (Harmsen and Graus, 2013; Antal and
van den Bergh, 2014). Consequently, the analysis of electricity consumption in this paper is
informed by drawing insights from a sociotechnical perspective.
To the extent that changing consumer behaviour and energy consumption practices lead to real
and persistent energy savings, they will contribute towards achieving emission policy goals as
well. Using carbon intensity values for the Dutch power production mix a range of CO2
emissions reduction based on smart meter scenarios is presented.
The rest of the paper is organised as follows. Section 2 discusses top down and bottom up
approaches to energy consumption studies, and explains why the latter was chosen. It presents
data used in the study, issues relevant to household electricity consumption and the assumptions
that were made in the system dynamics model that was developed. Section 3 details the scenarios

3
that were explored. Section 4 presents and discusses the results of the simulation runs. Section 5
discusses insights and potential extensions to the study, and section 6 concludes the paper.
2. Modelling Household Electricity Consumption
Modelling Approaches
Two approaches are widely used for studying household electricity consumption: top down and
bottom up (Kavgic et al., 2010). Top-down approaches derive long-term energy consumption
trends for macro supply analysis, drawing primarily on aggregated, available historical energy
consumption information and input variables (e.g. GDP, employment and income rates, energy
price indices, climatic conditions, housing market conditions). These models use econometric,
technology related, and combined techniques.
In contrast, bottom-up approaches use input data on the energy consumption of individual end-
uses (e.g. appliances or buildings) and extrapolate this information at a regional or national level.
The vast majority of bottom up models, with a few exceptions (e.g. Yao and Steemers, 2005),
concerns energy consumption for space heating and cooling. Some recent work takes into
account occupant behaviour as well (Guerra Santin et al., 2009; Kavgic et al., 2010; Lee and
Yao, 2013).
A bottom up method was chosen for this study because (i) it enables an explicit account of the
energy consumption of end-uses based on appliance power rating, while (ii) top down
approaches falter when a technological discontinuity is encountered (Swan and Ugursal, 2009).
Although they may account for future technology penetration based on historic rates of change,
they do not provide an indication of the potential impacts of new technologies, and are therefore
not helpful in developing relevant policies. In this paper, the introduction of smart meters is
considered to be a discontinuity and thus a bottom up approach is used. This was also chosen in
order to utilise the data already collected and available through previous work in the project
(Yucel, 2013).
Despite their suitability, bottom up methods have some drawbacks. First, they require
assumptions regarding household electricity consumption behaviour. This it was dealt with in
this paper by introducing scenarios of household responses to smart meter readings. Second, they
are poor at describing market interactions, the relationship between energy use and
macroeconomic activity, and they fail to address adequately factors that are intrinsically socio-

4
technical, such as the use of ICT (Kavgic, et al., 2010). In order to compensate for this, a
sociotechnical approach (Grin et al., 2010) was also employed to look at innovation, and the
connection of supply and demand patterns at an individual and at a macro level. This leads to
some important insights with regard to ICT appliance use and there have have been integrated
in the bottom up analysis.
Household Appliance Data
Given the range and variety of characteristics that household appliances have, it is difficult to
collect and compile aggregate data on all of them. Instead, the study collected data on commonly
used appliances that are not used for heating or cooling in the house, from online manufacturer
sites and academic studies (Mahalingam, 2013; Tselekis, 2012). In total 600 specification sets
were collected from 13 manufacturers for thirteen appliances currently on offer in the
Netherlands. A simple strategy was followed to overcome the difficulty of determining the
market shares for each brand. Data were extracted from manufacturer sites about the best selling
appliances if available, or a sample of the widest appliance range available. There was no
significant difference between the two approaches.
The appliance list was divided in two groups to calculate electricity consumption. For appliances
1-8 (Table 1) data on adoption rate, standby hours, average use time and product life time were
compiled from Tselekis (2012) and Fraunhofer Institute (2009). From these, the annual standby
and use consumption per appliance was calculated. For appliances 9-13, manufacturers provide
data for kWh assuming standard values of operating cycles per year (European Council, 2010).
Consequently, smart meter savings do not apply to these appliances. The total number of
appliances was calculated from their adoption percentage, Dutch population projections from
United Nations (2012), and assuming 431 dwellings per thousand inhabitants, a number which
has remained stable (Pittini and Laino, 2012). The demand for the construction of new dwellings
in the model is assumed to be satisfied with some delay.
The list of appliances and their initial adoption percentage for the year 2000 was compiled from
CBS data (2013) and Tselekis (2012) and is shown in Table 1. The diffusion trends for these
appliances were assessed and an estimate as to their final higher adoption percentage in 2050
was made. A worst case is assumed where the adoption for most appliances increases.

5
Table 1 List of appliances and adoption percentage
It is assumed that the best available technology (BAT) currently on offer for appliances 1-8,
becomes the average in Dutch houses with some delay. This is taken to be the average watt rating
of appliances with an A++ or A+++ ecolabel rating. For appliances 9-13, an efficiency
improvement curve for the years 2000-2010 has been used for the Netherlands (ECN, 2012, Fig
4.5) and extrapolated for the period up to 2050.
Smart Meter Adoption in EU
Reducing electricity use is particularly difficult, because it differs from other consumer goods.
It is invisible and is consumed indirectly for example when working with a computer (Fischer
2008; Hargreaves et al. 2010). Providing households with direct feedback on their electricity
demand, is one out of several possible interventions to reduce consumption and shift electricity
peak loads (Han et al., 2013). A range of direct feedback intervention types exists (see EEA,
2013 for a list) but the most effective ones include (Darby, 2006; Ehrhardt-Martinez et al., 2010):
(i) direct feedback from smart meter displays, (ii) interactive feedback via computers or through
other devices, (iv) customized energy advice (via audits), and (v) dynamic pricing.
The European Directive (2006/32/EC) on end-use energy efficiency and energy services requires
member states to introduce consumer feedback including more frequent billing, historic and
normative comparisons, and provide further information on energy efficiency. Smart meters
should be installed in EU member states when a conventional meter is replaced at the end of its
life, when new buildings are connected to the grid, or when an existing building undergoes
renovation if this is technically feasible and economically reasonable. The aim is for smart
meters to reach 80% of consumers in EU member states by 2020, and member states may decide
Computer 60 100
Printer 60 100
TV 99 99
TV receiver box 15 93.4
DVD Player 13 90
Electric oven 61.6 80
Microwave oven 74 90
Kettle 97.5 97.5
Washing machine 95 96
Dryer 53 60
Dish washer 38 60
Refrigerator 97 97
Freezer 71 90
Appliance2000
Adoption (%)
2050
Adoption %

6
on their own implementation strategies. The cost of smart meter investment in the European
Union has been estimated at €51 billion, with potential financial benefits ranging from €14 to
€67 billion (Faruqui et al., 2009).
Several potential benefits come from smart meter introduction (Darby, 2010; Cuijpers and
Koops, 2012). First, their adoption, is seen as part of the electricity system transition towards
smart grids and as a means for electricity suppliers to engage consumers. Second, smart meters
provide detailed, accurate and frequent information to consumers thus potentially reducing
electricity consumption and cost, (Paetz et al., 2011; Hargreaves, 2010). This will contribute
towards meeting the overarching EU target of a 20% reduction in primary energy use by 2020
relative to 2005 baseline levels (Schleich et al., 2013). It will also lead to carbon emission
reductions and better supply management for electricity providers. Another important aspect
related to smart meters is that they visualize household electricity consumption. This places
people in a position to consider the remote environmental impacts of their actions and thus lead
to cognitive dissonance to the extent that they value energy conservation behaviours
(Martiskaïnen, 2008). Finally, they can potentially improve customer relations acting as
communication hubs and reduce fraud (Darby, 2010).
Some issues counterbalancing the adoption of smart meters include the cognitive effort involved
in attending to the feedback and/or the added complexity of the device and information, the effort
involved in changing long established habits and everyday routines, and issues of privacy
protection. These all require some consumer familiarity with technology. In this study it is
assumed that a single type of smart meter with a display is made available to consumers, which
eventually reaches widespread adoption. It is assumed that there is no additional feedback or
information provision to households. Nevertheless, the range of savings that can be achieved
varies with the type of feedback provided, for example energy advice and detailed billing
(Ehrhardt-Martinez et al., 2010). It is assumed that the age of occupants is not a factor in
feedback and technology acceptance and therefore does not influence electricity savings.
Further issues relating to the integration of smart meters in household practices and the long term
effect they have on electricity consumption, have not been addressed explicitly in this paper.
Nevertheless, there is more to smart meter use than just reading figures off a screen. For example,
their aesthetics and their location within the household appear to be important to their usage, as
over time their use may fade in the background of everyday routine. They may influence

7
relationships between family members, the built environment, systems of supply and
consumption, social norms, expectations and self efficacy (Thøgersen and Grønhøj, 2010).
Engagement with smart meters can promote feelings either of empowerment, disempowerment
or conflict among household occupants. For example men are generally more interested in smart
meters than women. Their use may not be tolerated by all the occupants as it reveals the pattern
of their activities (e.g. teenager parties) (Hargreaves et al., 2010).
Smart Meters in the Netherlands
Currently in the Netherlands approximately 200.000 smart meters have been installed in the
residential sector in pilot projects (Lukszo and Al-Abdulkarim, 2009; European Smart Metering
Alliance, 2010). The Dutch government has announced its intention to install 7.5 million
electricity and 7 million gas smart meters by 2017 (Cooke, 2011). This large scale rollout of
smart meters will increase the heterogeneity of the user base and the range of potential savings
that can be achieved (Kuijpers, 2013).
A wide smart meter adoption is also contingent on issues such as the perceived security and
privacy violations of consumers (AlAbdulkarim et al., 2012; Cuijpers and Koops, 2012).
Potential delays may arise from these if they are not appropriately addressed at an early stage
(McKenna, 2012). For example, legislation for a mandatory roll-out was rejected in the Dutch
Senate in 2009 because there where legal concerns that frequent smart meter readings are a
breach of private and family life. After this initial setback, in order to ensure the support for the
smart meter bill, the government was forced to announce the introduction of a trial period of at
least two years ahead of a large-scale rollout. During this trial period, their effect will be
monitored. Until the large scale rollout decision, expected by the end of 2013, estimates of smart
meter energy savings will be subject to reconsideration (van Elburg, 2013).
Nevertheless, the requirements for frequent smart meter data readings can be minimized by
applying appropriate data selection or processing techniques so that deriving details about
personal life patterns may be avoided (McKenna, 2012). Some additional time may be required
to address these issues. The proposed new European Directive on energy efficiency does not
seem to require a mandatory roll-out of smart meters (European Commission, 2011). The
mandated smart meter is restricted to daily measurements at most with an in home display
showing electricity use information to household occupants (Cuijpers and Koops, 2012). This
minimum functionality is assumed in this study as well.

8
Smart Meter Electricity Savings
Although studies and data about feedback impact on electricity use date back to 1970s (Winett
and Nietzel, 1975), the present paper uses data on average savings achieved by direct feedback
exclusively from studies made in the past 10 years. The reason for using only recent studies on
direct feedback is the difference in electricity savings figures between earlier studies and those
conducted post 1995. Figures for the latter in the literature are lower, regardless of the feedback
policy implemented (Ehrhardt-Martinez et al., 2010; Delmas et al., 2013). This finding is
important because it is an indication of the impact that shifts in culture, politics, and lifestyles
can have on generating energy savings from feedback. Consequently, this paper utilises only
recent figures referring to direct smart meter feedback. A range of 5-15% has been implemented
in the model because in addition to the literature, this is quoted by the European Smart Metering
Industry Group (ESMIG, 2013) and by the European Environment Agency (2013). An average
of 7.8% is used because it is the most recent available figure for the Netherlands (van Dam,
2013).
Table 2 Smart meter savings range
The introduction of smart meters is a policy instrument to empower users in households, increase
their awareness about electricity use and prompt them to reduce unnecessary consumption. Yet
the question remains how, or if, such feedback could lead towards new behaviours, sustainable,
persistent electricity savings. Inevitably this is linked to the way that families create a home
identity through the way they handle and use appliances in their everyday life (Gram-Hanssen
and Bech-Danielsen, 2004). The introduction of smart meters may change the time schedule of
the family, the way they use appliances, much as the adoption of video-recorders did, by allowing
TV programmes to be recorded for viewing at a later time (Silverstone, 1993).
Reference Savings Range (mean) Length of study Feedback Type
Schleich et al. 2013 4.50% 11 months direct and indirect
Darby, 2006 5-15% literature review direct
Fischer, 2008 5 - 12% literature review varies
Ehrhardt-Martinez et al., 2010 4 - 12% (9.1%) meta review direct and indirect
Grønhøj and Thøgersen, 2011 6.70% 5 months direct
Vine et al., 2013 5 - 20% literature review direct
Faruqui et al., 2010 7% literature review direct
Delmas et al., 2013 12.17% literature review direct
Houde et al., 2013 5.70% 3 months direct
Gleerup et al., 2010 3% 12 months indirect email
van Dam, 2013 7.80% 15 months direct

9
An important aspect is that electricity consumption per person is lower when more people live
together (Gram-Hanssen, 2013). Deeply held individualistic cultural trends in Western societies,
run counter to that and place an additional barrier to electricity savings. This fact and the
literature reviewed suggest that user behaviour related savings may be a greater barrier than
technological efficiency. Therefore technological innovation for improving appliance efficiency
is indispensible. Given that changing consumer demand behaviour and improving appliance
technological efficiency are broadly the two areas where policy can have an impact, it is worth
taking a closer look at the effect of ICT appliance trends on electricity consumption.
The Effect of Increasing ICT Use Trend
The advent of information and communication devices (ICT) has brought about a third
household electrification phase which involves new practices relating to electrical appliances
(Gram-Hanssen, 2013). In Denmark, for example the increasing integration of computers and
internet functionalities across everyday practices transforms these practices in the process, such
as different sports and do-it-yourself activities (Røpke et al., 2010). It illustrates that energy
consumption behaviours do not take place in isolation but are interwoven and reflect broader
social and cultural influences on individual energy consumption behaviour (Sweeney et al.,
2013).
It is likely that household energy consumption in the future will be caused by ICT use ds to an
even higher degree as a range of appliances will become “smart” with the ability of connecting
to the internet or being accessed through mobile devices. For example, in Denmark the share of
residential electricity consumption of consumer electronics, computers and related equipment
has increased from 17% in 1997 to 26% in 2006 and it can be expected to rise to 50% by 2020
(Jensen et al. 2009). From 2000 to 2007, electricity consumption for non-ICT fell by nearly 10%,
while consumption for ICT increased by 135% (Gram-Hanssen et al., 2009). Attending to the
growing ICT portion of electricity consumption in developed countries will be even more
important in the future as it is projected to increase by 250% by 2030 (IEA, 2009). Touch panel
production trends seem to confirm this as it is projected to reach 2.4 billion units in 2017, a 170%
increase of their 2013 volume (Displaybank, 2013).
The use of ICT devices has many aspects and their trends are related to many factors (Røpke and
Christensen, 2012; Røpke, 2012). They warrant the application of a sociotechnical, multi level
perspective, so that they are at least acknowledged (Grin et al., 2012). At the micro level (black

10
arrows in Figure 1), ICT growth is related to all the practices and activities that people perform
with them, which in turn enable a host of recurrent information flows and functionality.
Technological innovation decreases the per-unit cost of ICT user utility thereby increasing the
demand for ICT. The latter thus, develops in close connection with the applications in consumer
electronics. This constitutes a self reinforcing loop (R1) where most ICT appliances are
integrated into a broad variety of everyday practices as in the case of Denmark (Røpke et al.,
2010; Røpke, 2012). In addition users of appliances are also creatively expanding the range of
uses they put their appliances to. For example, televisions are not used just for viewing programs
during the day, they are also used to play games, search the web, watch DVDs and videos, listen
to the radio and watch films and sporting events on demand via satellite and cable broadcasts
(Crosbie, 2008). Given the growing number of consumer home electronics and the way they are
becoming embedded into everyday life, incremental improvements on current products
efficiency will do little to stem the tide of increasing household electricity consumption.
The second reinforcing loop (R2) is related to how the digital and the physical world become
increasingly interwoven. Opportunities for social interaction around common interests and work
collaboration initiate in the physical or digital space but usually expand to the other domain as
well (Røpke et al., 2010). The use of ICT in more activities is partially decoupling some practices
from their previously bounded time-space location (Røpke and Christensen, 2012). In some cases
it can complement or reinforce previously existing practices, for example e-shopping and in-
store shopping (Farag et al., 2007). R1 and R2 have been taken into consideration in the ICT trend
that was applied in the model.
It would appear that reducing ICT related electricity consumption would be straightforward if
only these two loops were controlled or decoupled. While this may be feasible, it is not easy to
achieve, because R1 and R2 are driven by long term trends at the meso level (grey arrows) relating
to energy, raw material prices, and continuously decreasing prices in ICT appliances. ICT is
integrated in the economy, firm productivity and innovation activities. It has wide-ranging
implications for economic growth across sectors (OECD, 2003) that have been demonstrated for
the US (Jorgenson, 2001; Atkinson and Stewart, 2013) and the Dutch economy (Atkinson, 2007;
Polder et al., 2012).
In a globally competitive world, it is imperative that innovation policies are used to strengthen
the competitiveness of national hi-tech sectors. All developed nations have in place innovation

11
policies that support and strengthen their ICT sector as the new information infrastructure will
be the most important public utility in 21st century service economies (Melody, 2007). National
competitiveness is understood to be best served by general policies that leave free markets to
determine the directionality of innovations. In the case of ICT, this requires that new appliances
are continuously introduced and sold to users thus sustaining growth in consumer demand is
important. Innovation drives the range of appliances on offer and generally improves their energy
efficiency, while growing demand increases their number and uses.
Figure 1 A sociotechnical perspective on ICT use
Innovation in the ICT sector leads inevitably to a proliferation of devices and applications, a
trajectory that has built considerable momentum in the past decades and drives electricity
consumption. An example is the introduction of high definition, plasma and LCD tvs in the
market. While the latter consumes less electricity, the diffusion of plasma tvs and the increase in
screens size increase total electricity consumption (OECD, 2009).
The trends in ICT present both opportunities and threats for energy efficiency. They will enable
the adoption of novel electricity management systems and thus improve efficiency through
greater consumer control and price-responsiveness. However, the uptake of these appliances and
services can increase electricity demand because they are constantly connected to the internet
and never go on standby mode. Globally, the related amount of additional electricity used due
to networked appliances staying online constantly could reach 550 terawatt hours (TWh) or
2.4% of the projected total consumption by 2020 (IEA, 2010). While these direct effects of ICT
+
+
+
+
++
++
+
+
+
+
+
+
+ICT enabled
everyday practices
ICT applications to handle everyday
complexity
ICT practices decoupled from time – space constraints
Work – social network activities in physical space
Consumer affluence, Energy prices, Innovation
policies
ICT Selection Environment
Trajectory
Technology Innovation
Marketing Promotion
R1
R2
Population

12
devices are important, their systemic environmental implications of ICT relating to material use
should not be overlooked (Williams, 2011).
This discussion highlights a paradox where efficiency improvements coming from R&D in ICT
simultaneously increase appliance efficiency and generate a vast array of new products, which
are then sold and increase ICT related electricity consumption (Figure 2). What compounds this
effect, is the potentially new uses that consumers put technology to (Von Hippel, 2005). This
paradox is explored further with the simulation model.
Figure 2 Effects of technology innovation
Income related consumer behaviour
In the model, the nominal use of electrical appliances considered is assumed to be approximately
similar across all dwelling types in the model: detached, terraced and gallery flats. These are
taken to correspond to high, medium and low income households. They map closely onto the
four segments identified empirically for the Netherlands in Han et al. (2013). Segment 3 concerns
residents that enjoy comfort and amenities and are less inclined to change their behaviour to save
energy. Segment 4 concerns consumers that are environmentally minded, have a high level of
income and invest in energy efficient products. Both segments have been lumped into the
detached dwelling type in this paper that represents high income levels and a preference to invest
in energy efficient products rather than changing their behaviour in response to smart meter
feedback. This has been done in order to utilise dwelling data already available in the project
(Yucel, 2013).
Occupants’ behavioural response to feedback on their electricity consumption levels is thus also
contingent on their level of income and hence is relevant to this study. Low income households
+
+
+
+
-
+
Electricity Consumption
ICT products
Appliance Efficiency
Technology Innovation
ICT Demand (R1,R2)

13
are associated with low electricity use. Hence, if they decrease electricity consumption in
response to smart meter feedback, it is likely that this extra income will be spent (i) on additional
electricity use (rebound effect), thereby offsetting part of the electricity savings, or (ii) other
activities inside or outside the house that are beyond the scope of this study. It is also plausible
that low income households may not alter their behaviour at all, because they may have
exhausted the potential to reduce electricity use in the first place. Through the use of smart meters
they may find that they cannot achieve further savings without foregoing some of their basic
daily routines, hence feedback will hardly have any impact (Paetz et al., 2011). In the event that
their consumption is better than average, feedback may lead to an increase in electricity
consumption (Schultz et al., 2008).
High income households may be also adamant about their daily routines and not be willing to
forego the amenities provided by electricity. Even if considerable gains are to be made by saving
electricity, they may have little motivation to do so because it is a small part of household
expenditure. Hence, they may engage only in energy investment behaviour and buy efficient
appliances (Han et al., 2013). Furthermore, once equipped with knowledge about their actual
consumption and their daily routines, they may become frustrated by the absence of wider policy
and market support (Hargreaves et al., 2013).
In either income case, smart meter installation may add inertia to the system, because it will
make both low and high income households aware of the response threshold beyond which they
will not go easily i.e. reduce electricity consumption and/or purchase efficient appliances. Hence,
subsequent reductions in household electricity consumption will become difficult, an issue that
is worth exploring in future research.
The growth in electricity consumption, however, does not necessarily relate only to appliance
efficiency and individual use patterns. It must also be understood as a consequence of other
societal processes, which have been described as drivers behind consumption, including
changing social norms and expectations coming from new technical possibilities (Røpke, 1999;
Gram-Hanssen, 2013). It is an involved issue regarding the invisibility of electricity
consumption, habits and personal comfort (Kollmuss and Agyeman, 2002; Marechal, 2009),
existing technologies and appliance characteristics (Pierce et al., 2010), the weather and building
characteristics (Strengers, 2010), psychological factors (Abrahamse and Steg, 2009), the

14
economic and political climate (Press and Arnould, 2009) and people's social and cultural
practices (Hargreaves et al., 2010; Nye and Hargreaves, 2009; Stephenson et al., 2010).
Rebound effect and persistence of savings
The rebound effect arises in human activities where significant efficiency gains result in energy
savings, some of which is subsequently re-spent in other activities (Herring and Sorrell, 2008).
It is estimated to be in the range of 0% for residential appliances in EU (EEA, 2013) and 17%
for electricity in general in the Netherlands (Antal and van den Bergh, 2013). While the rebound
effect in electricity consumption or increase in the number of household appliances has not been
explicitly modelled, it is accounted for by allowing non persistent electricity savings.
The issue of whether smart meter related savings persist, is debated in the literature (Houde et
al., 2013; Ehrhardt-Martinez et al., 2010). Consequently, both non persistent and persistent
savings in the range of 5-15% are explored in this paper. In order for savings to persist the use
of smart meters needs to be related to appliance use and incorporated into household everyday
routines that can be easily adhered to (Gram-Hanssen, 2011). However, as different family
members use different appliances at different times, together or alone, changing these practices
is complicated. For example, people watch different tv programs, listen to music, play games or
use computers in their rooms. Furthermore, a change in one practice might affect other practices
because they share elements or are linked through technology.
An additional assumption in the model is that consumers do not switch from electricity to gas or
other renewable resources as a result of using smart meters. This is a plausible assumption as the
target of the Dutch government is to install smart meters both for electricity and gas by 2017
(Cooke, 2011).
Figure 3 is a simplified representation of the bottom up model constructed that utilises the data
collected for the analysis. It shows how appliance efficiency, Best Available Technology (BAT),
smart meter introduction, and population trends influence household electricity consumption.
All factors under consideration increase electricity consumption apart from appliance efficiency,
while smart meters introduce the only short term balancing feedback (-ve sign).
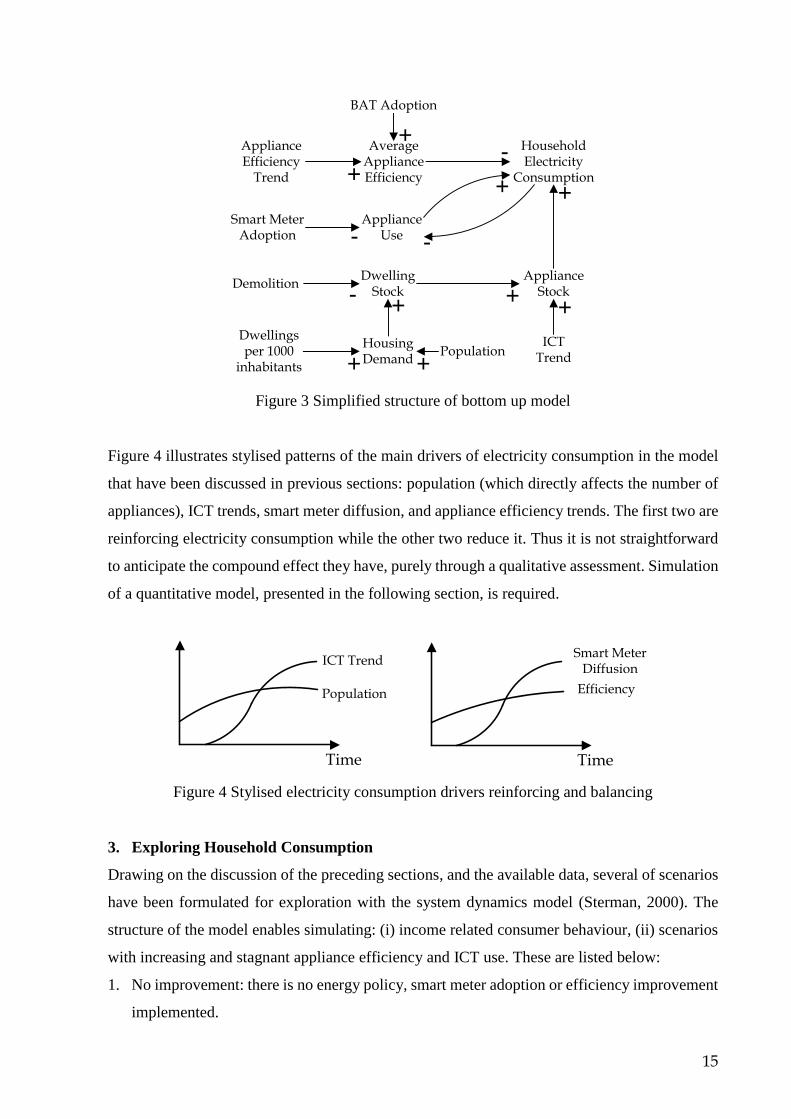
15
Figure 3 Simplified structure of bottom up model
Figure 4 illustrates stylised patterns of the main drivers of electricity consumption in the model
that have been discussed in previous sections: population (which directly affects the number of
appliances), ICT trends, smart meter diffusion, and appliance efficiency trends. The first two are
reinforcing electricity consumption while the other two reduce it. Thus it is not straightforward
to anticipate the compound effect they have, purely through a qualitative assessment. Simulation
of a quantitative model, presented in the following section, is required.
Figure 4 Stylised electricity consumption drivers reinforcing and balancing
3. Exploring Household Consumption
Drawing on the discussion of the preceding sections, and the available data, several of scenarios
have been formulated for exploration with the system dynamics model (Sterman, 2000). The
structure of the model enables simulating: (i) income related consumer behaviour, (ii) scenarios
with increasing and stagnant appliance efficiency and ICT use. These are listed below:
1. No improvement: there is no energy policy, smart meter adoption or efficiency improvement
implemented.
-
+
+ +
-
+-+
+ +
-+
+
Appliance Efficiency
Trend
Average Appliance Efficiency
BAT Adoption
Household Electricity
Consumption
PopulationHousing Demand
Dwellings per 1000
inhabitants
Dwelling Stock
DemolitionAppliance
Stock
Smart Meter Adoption
Appliance Use
ICT Trend
Efficiency
Smart Meter Diffusion
Time
ICT Trend
Population
Time

16
2. Business as Usual: there is no policy implemented, only efficiency improvements in
appliances. It is used as a reference for the 20% electricity consumption reduction in 2020.
3. Reference Policy: The diffusion of smart meters starts in 2011 with a normal rate of dwelling
construction and renovation. Wider diffusion takes place after 2013 and installation of
electricity smart meters is assumed to be complete by the end of 2017.
4. Reference policy with behaviour: A pessimistic scenario where high income households do
not reduce their electricity consumption because it is a very small part of their expenditure
and the low income households do not either, because their lifestyle is already adjusted to a
lower level of electricity and energy consumption.
5. Reference policy with varied behaviour: high income households buy efficient appliances
only, middle income households engage in electricity savings and buy efficient appliances,
and low income households engage only in electricity savings. Higher income households
resort to investment behaviour while low income households engage in energy saving
behaviour (Han et al., 2013).
6. Adoption of best available technology (BAT): BAT appliances are promoted thus barriers
relating to their higher prices are removed (Attali et al., 2010). The average efficiency of the
appliance stock approaches quickly the average of the most efficient appliances, currently on
offer with energy rating A++ or A+++.
All simulation scenarios assume that the adoption of smart meters and standby killer devices by
2017 exceeds the target of 80% in line with Dutch government policy (Cooke, 2011). All of the
scenarios have been explored with and without an annual increase of 7% in ICT related
consumption in the Netherlands (ECN, 2012). It is applied to computers and tv appliances in the
model and is allowed to go up to a fivefold increase. The model has been calibrated so that in
the reference policy scenario 3, 450 thousand smart meters are installed by 2013. The simulation
time step is ¼ year. For calculating the annual monetary savings per household, electricity price
figures were used for the Netherlands up to 2011 (Eurostat, 2013) and then projections up to
2050 were used (WIP, 2012).
4. Simulation Results
Scenarios 1-6 with an ICT trend, average savings from smart meter diffusion, using high,
medium and low Dutch population projections (UN, 2012) are shown in Figure 5 (left). The
scenarios (dotted lines) are enclosed between solid lines corresponding to high population
growth and no smart meter savings and low growth and maximum savings. Scenarios where

17
electricity consumption returns in 2050 close to current levels are those with low population
growth. In most scenarios there is an inflection point in electricity consumption trends around
2030-2040 after which they remain unchanged. This is the time when population and IST use
trends peak. Figure 5 on the right shows scenarios with average settings for population and
electricity savings.
Figure 5 All scenarios (left) and scenarios with average settings (right)
The reference scenario 3 is shown in Figure 6. The bandwidth of smart meter related savings of
0-15% is enveloped between the black and green solid lines. Max and min limits on electricity
consumption are shown for worst case of maximum population growth and no savings, or the
best case of minimum population growth and 15% savings (left). Figure 6 (right) illustrates
scenario 3 with and without the effect of ICT growth for average population projections. Current
policies will at best result in a short term improvement but won’t be sufficient to meet the 20%
reduction of projected consumption in 2020. Electricity consumption will keep rising until the
Dutch population peaks around 2040 and then it will decline slowly. Consequently, there is a
window of opportunity until 2040 to reduce electricity consumption and arrive at a lower peak.
It is important that this is exploited. Since population decreases slowly, further reductions will
probably be harder to achieve for reasons discussed in previous sections. Hence, electricity
consumption will remain above present levels for a long time.

18
Figure 6 Scenario 3 max and min trends (left) with and without ICT growth trend (right)
Figure 7 shows scenarios where behaviour related consumer electricity savings and appliance
efficiency improvements vary (Gram-Hanssen, 2013). The best case of average population
trends, maximum savings and efficiency improvement results in 10% increase in electricity use
(green line). With average smart meter savings, the final consumption is approximately 8%
higher than that (black line). Then a combination of low savings and efficiency can result in final
electricity consumption that is 30-50% higher than present levels (red line). Overall the range of
results falls within the projected 36-45% increase in total electricity household consumption for
Netherlands (EU Energy Savings Potential Database, 2013). It is obvious that the combination
of consumer behaviour and appliance efficiency is instrumental in reducing electricity
consumption.
Figure 7 Comparison of efficiency vs behaviour scenarios
Figure 8 explores ways of meeting electricity reduction targets in reference scenario 3 (solid red
line), with average smart meter savings of 7.8% and ICT use trends. It is clear that policies are
effective in reducing somewhat electricity consumption from the business as usual case (black
solid line) but not nearly enough. Electricity consumption can be kept close to present levels
(dotted red line on the left) if efficiency improves uniformly across appliances 1-13 (red line on
the right), following the trend of appliances 9-13. Nevertheless, this scenario is unrealistic
because the efficiency of some appliances like kettles is not going to improve, a uniform response
from all consumer segments is highly unlikely and ICT growth is set to reach 500%. A more
realistic scenario is one where ICT growth reaches 250% by 2030 (IEA, 2009) (blue solid line).
Allowing for varied consumer response where only a percentage of consumers in each dwelling
class achieves average savings, it is still possible to reach the desired objective (blue dotted line).
However, if ICT growth overshoots projections (400%) then the response from consumers must

19
also be complemented with further efficiency improvements (green line on the right) to keep
electricity consumption close to targets. Table 3 results obtained through goal seeking, illustrate
this trade off between ICT growth. With growth levels above 300% electricity savings must
exceed the average of 7.8% found in van Dam (2013), in order to keep electricity consumption
levels in 2050 close to 2000 levels.
Figure 8 Efficiency scenarios (left) and efficiency trend (right)
Table 3 Summary of scenario 3 goal seeking results
The important insight from these results is that current efficiency trends (red line on the right)
that apply to large home appliances (ECN, 2012) do not necessarily result in sufficient savings
to account for variability in response of consumers, even if all appliances in this study, follow
this trend. Results with increased efficiency (green line) are in agreement with related results by
Fraunhofer Institute (2009) stating that it is (p76): “technically but not economically feasible to
counterbalance the pressure of the demographic and socio-economic drivers”. It might be
possible to accelerate efficiency trends enough to keep electricity consumption in control but not
enough to counterbalance the pressure of the demographic and socio-economic drivers:
household numbers, appliance proliferation and increase in ICT use. In every case, the 7% annual
increase in ICT related consumption needs to be curbed by 2030 to less that 300% in order to
keep total electricity consumption at current levels.
Household savings and CO2 emissions
ICT growth % Detached % Terrace % Gallery % kWh % at 2050
200 5.07 2.11 2.50 96%
300 8.42 7.02 8.35 100%
400 13.81 11.47 13.73 97.5%
500 18.41 15.37 18.25 97.8%

20
Since user behaviour is at least as important as appliance efficiency, it is worth looking at the
impact of electricity savings on household income. Given the short discount rate individuals use,
it makes sense to use savings per household as a motive for the adoption of smart meters. In
order to calculate savings per household, electricity price values were used for the Netherlands
up to 2011 (Eurostat, 2013) and then projections up to 2050 (PV parity project, 2012). In the
reference scenario 3, each household is worse off approximately 100 euros annually across the
range of minimum and maximum price projections (black dotted lines in Figure 9, left). In 2050,
with 15% electricity savings, there is approximately no additional cost and at worst cost is €200
annually (red line). Figures of electricity annual cost are important as they can be used to engage
consumers in electricity savings thus moving from the efficiency only (green dotted line) to the
reference scenario 3 (black line) (Figure 9 on the right). The best case is with max savings and
efficiency (red solid line). What is important, is that if smart meter diffusion brings about a
response from consumers, there is short term financial gain for consumers from 2015 to 2020.
Figure 9 Smart meter cost savings for scenario 3
Finally, despite the fact that electricity consumption results in our model, concern 13 appliances
only, it is worth looking at CO2 emissions. An initial value of 540g CO2/kWh carbon intensity
is used and then current trends for the Dutch power production mix are extrapolated to 2050
(Harmsen and Graus, 2013). The initial value chosen reflects the fact that a considerable amount
of power and heat in the Netherlands is produced from Combined Heat and Power plants. It also
includes transmission and distribution losses because the current paper looks at electricity
savings by end-users. It is assumed that the resultant electricity savings from smart meters are
small relative to total production capacity in the Netherlands and thus they have no significant
influence on the production mix and its carbon intensity.
Ideally a marginal CO2 intensity approach is preferred when it comes to scenario-based
approaches for CO2 emission reduction. However, this would require an explicit representation

21
of the power capacity in the Netherlands which was deemed to be outside the scope of the study.
Instead best and worst case scenarios were explored: one using the carbon intensity curve for
2005 – 2010 in Harmsen and Graus (2013) and extending it to 2050 and one where the current
carbon intensity is kept constant. In both cases, it is assumed that under current Dutch and
European policies for emission reductions, it will not increase in the future.
Figure 10 shows that if the current electricity production mix stays as is, appliance related
emissions are contingent on population trends (solid lines). The best case scenario is obviously
that the energy production mix continues on the 2005 – 2010 downward trend (Harmsen and
Graus, 2013) and becomes zero by 2045 (dotted lines).
Figure 10 Household appliance emissions for scenario 3
5. Insights and future extensions
Drawing on simulation results and the discussion so far, two important points need to be made
for policy. First, innovation on appliance and ICT efficiency in particular, must continue in the
future while demand and use trends must be at least stabilised until 2020. Goal seeking runs on
electricity consumption showed that if ICT related consumption only doubled by 2020 then this
could contribute to keeping electricity consumption in current levels. While there is some margin
for demand growth, it seems that innovation pace must accelerate with respect to demand.
Second, current and future electricity reduction policies must have an effect before 2040 when
Dutch population peaks (United Nations, 2013; de Jong and Hilderink, 2004) so that electricity
consumption arrives at the lowest possible peak in 2040. One cannot hope for population driven
reductions in electricity consumption given the inertia of demographic change.
Nevertheless, drawing on the simulation results, some savings are definitely within reach, but
achieving a 20% reduction compared to “business as usual” is difficult. The current efficiency

22
trend in appliances (ECN, 2012) is not enough even if it applies to all appliances considered in
this study, which admittedly are a subset of those found in a household. Thus, more needs to be
done, and in this respect the results of the study are in agreement with suggestions for a threefold
increase in policy impact compared to energy savings policies adopted since the 2006 Energy
Efficiency Action Plan (Wesseling et al., 2010). An effective increase in energy prices combined
with mechanisms to ensure continued increase over time would perhaps change demand patterns
and the direction of R&D efforts (Røpke, 2012). A combination of appliance standards, smart
technology and behavioral incentives might help to avoid high respending rebound (Antal and
van den Bergh, 2014).
A further insight from the study is that a differentiated focus on appliance groups is needed in
all subsequent work because user behaviour and appliance efficiency also differs for each group.
Appliances 9-13, and those similar to them, constitute a separate group, because their efficiency
is likely to continue to improve along their current trends (ECN, 2012) while their use will remain
similar thus reducing their overall electricity consumption. For appliances 1-8, studying ICT user
behaviour and energy efficiency will be even more important in the future. Hence, it is also
important that this group, be broken down into ICT and non ICT and include appliances like
mobile phones, tablets, sound systems, and those that can be expected in the future to become
“smart” or connected to the internet.
An issue related to appliance efficiency is that average electricity consumption figures in the
paper have been derived from appliances available in the Dutch market in 2013. This results in
conservative electricity consumption figures as older, less efficient appliances are obviously still
in use while not being on offer. More accurate figures would require data on the actual household
appliance inventory and their energy ratings.
A related behavioural factor in electricity saving behaviour is house ownership. Homeowners,
as opposed to renters, have a stronger propensity to engage in savings and invest in efficient
appliances (Martinsson et al., 2011). In contrast, landlords have little financial incentive to
provide more energy efficient appliances to their tenants if energy costs are paid by them, while
all inclusive rental contracts hardly encourage any savings by tenants. Hence, different
intervention strategies are likely to be required for households of different levels of income,
education, age, ownership and type (Thøgersen and Grønhøj, 2010; Han et al., 2013). Given that
consumer behaviour is contingent on these factors, a broad policy approach is merited, one that

23
draws on behavioral sciences and focuses on particular household segments (Shah and Dawney,
2005; Allcot and Mullainathan, 2013; Han et al., 2013). Collection of more detailed
socioeconomic data and appliance use data will enable disaggregating the model further and
exploring policies that are specific to house type and income level.
In exploring policies that can have an impact, it is necessary to research the link of electricity
consumption, number of occupants, and connect it to their lifestyle (Vale and Vale, 2010). Smart
meters will allow consumers to identify the level of personal comfort, utility, leisure, cost and
environmental impact beyond which they are not willing to go for electricity savings. Obviously,
a minimum level of use on most appliances is inevitable and this will differ for each consumer.
This line of research should not pay attention only to reducing electricity consumption by
switching appliances off, but also attend to the growing number of devices in the home (Gram-
Hanssen, 2009).
Finally, these insights inevitably draw on the particular perspective of suppliers and consumers
adopted in this study and the range of empirical data that were used to inform the model. They
provide a record of consumer options and electricity use patterns. It seems that there is a
particular consumption threshold alluded to by the literature (15%) beyond which consumers are
not willing to go. However, seen under a social practice perspective both in terms of research
and policy making this limit may not be impermeable (Strengers, 2012). The problem of
electricity demand can be also seen as coming from changing expectations and conventions
associated with everyday household practices, such as cooling, cooking, heating and
entertaining. If data were drawn from social practice case studies on electricity consumption
reduction that sought to actively debate and challenge taken for granted lifestyle ‘needs’, perhaps
a different picture and thus different policy recommendations could be drawn. It would be
potentially possible to lower the consumption threshold if policy orientation changes towards
shifting the ensemble of practices that contribute to electricity demand not just behaviours
relating to, for example, washing machine or ICT use end uses.
6. Conclusion
The paper explored the effect of smart meter introduction, appliance efficiency and consumer
behaviour on electricity consumption in the Netherlands. Overall, electricity consumption is
reduced assuming smart meter adoption greater than 80% and savings of 7.8%, but long term
trends on population and ICT use overturn these gains. Consequently, the aim of 20% reduction

24
of projected consumer demand in 2020 is not met. These results are in agreement with related
results from Fraunhofer Institute (2009) which call for more policy efforts. Nevertheless, even
minor reductions in end use electricity consumption are desirable, as they result in upstream
savings where network distribution and electricity production losses are 4.4% (Harmsen and
Graus, 2013).
The increasing trends of population, appliance and ICT use in particular, present a distinct
window of opportunity for policy making before they peak in 2040, as is evident in simulation
results. Out of these, ICT use and appliance efficiency are more amenable to short term policy
intervention which is important because they may also bring about a further wave of household
electrification. Once certain appliance use patterns become embedded in household everyday
practices they acquire inertia and are hard to change. Thus behavioural considerations in the
same time window are also important. A further policy related issue is whether smart meter
savings persist or fade with time because in the literature there is evidence to support either case.
Simulation results suggest that the effect of persistent savings is considerable thus it is imperative
that in future policy studies, smart meter use is explored in conjunction with policies designed
to sustain the savings made.
Given that electricity savings from consumer behaviour cannot be expected to exceed 15% or
even be persistent, appliance efficiency provides a complementary means by which to control
electricity demand. This can be done through innovation policies focusing on national hi tech
sectors such as ICT. However, innovation inevitably leads to a proliferation of appliances and
applications, a trajectory that has gained considerable momentum in past decades and drives ICT
electricity consumption. This creates a paradox as improvements in ICT appliance efficiency
with the potential to reduce electricity consumption are coupled to the development of new
products ranges that are sold, used and increase ICT electricity consumption. Hence, policies
must aim to improve appliance efficiency and manage ICT adoption and consumer behaviour
simultaneously, so that their combined effect does not result in an increase in household
electricity consumption. Ideally, one must be decoupled from the other in order to achieve
substantial reductions in electricity consumption.
In conclusion there is no single ‘silver bullet’ for achieving deep and large-scale energy
savings. Rather a mix of appliance standards, smart technology, behavioral incentives and
national innovation policies will be needed, tailored to the Dutch context.

25
Acknowledgements
I would like to thank Pieter Bots for comments on previous versions of the paper. This research
was funded under NWO project number 434-09-250
References
Recommended