How to optimize your website acquisition
HOST AND PRESENTERS
PresenterSimon Kvist Gaulshøj
Global Publishing DirectorAudienceProject
HostRune Werliin
Head of Marketing and Communications
AudienceProject
PresenterAlexander Widmark
CEOLess Friction
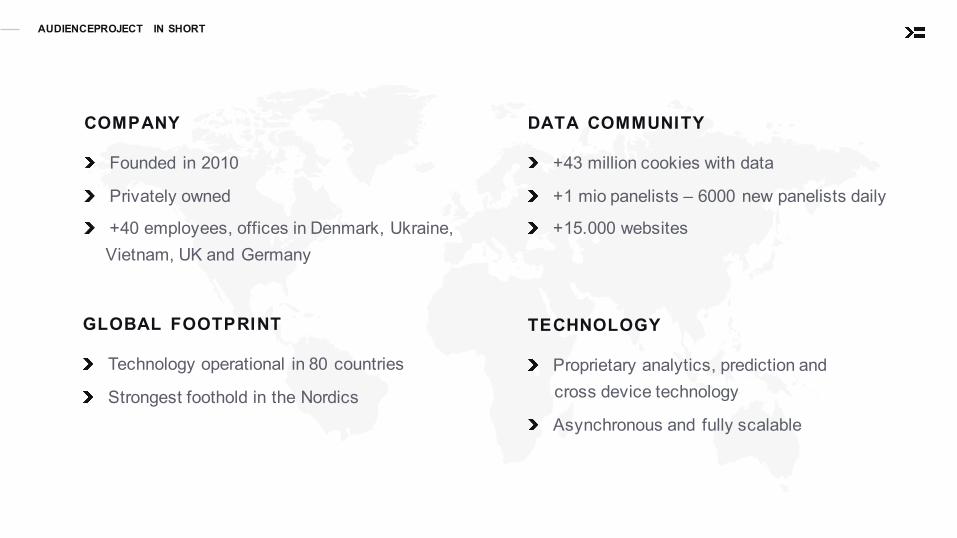
AUDIENCEPROJECT IN SHORT
COMPANY
Founded in 2010
Privately owned
+40 employees, offices in Denmark, Ukraine, Vietnam, UK and Germany
DATA COMMUNITY
+43 million cookies with data
+1 mio panelists – 6000 new panelists daily
+15.000 websites
TECHNOLOGY
Proprietary analytics, prediction and cross device technology
Asynchronous and fully scalable
GLOBAL FOOTPRINT
Technology operational in 80 countries
Strongest foothold in the Nordics
Alexander Widmark | CEO @ Less Friction
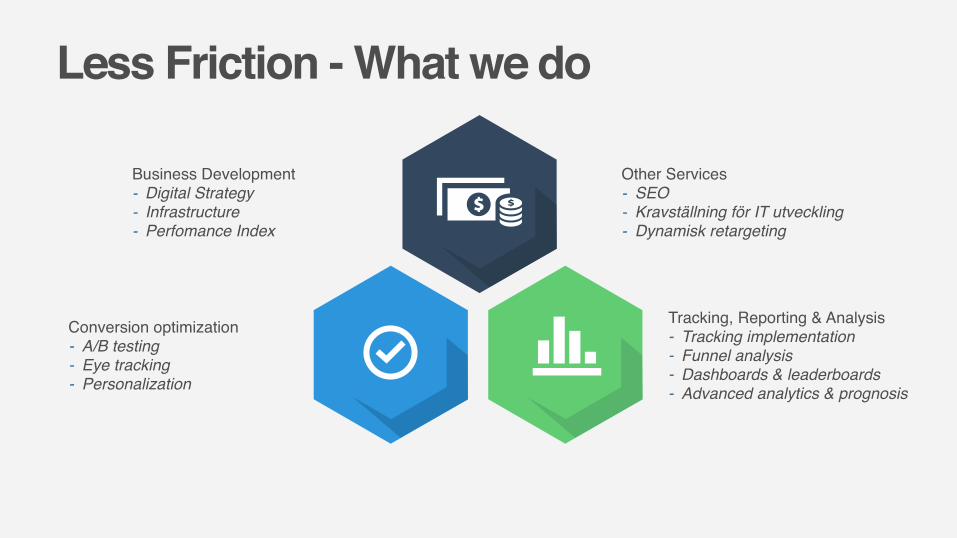
Conversion optimization- A/B testing- Eye tracking- Personalization
Tracking, Reporting & Analysis - Tracking implementation- Funnel analysis- Dashboards & leaderboards- Advanced analytics & prognosis
Less Friction - What we do
Business Development- Digital Strategy- Infrastructure- Perfomance Index
Other Services- SEO- Kravställning för IT utveckling- Dynamisk retargeting
Clients.
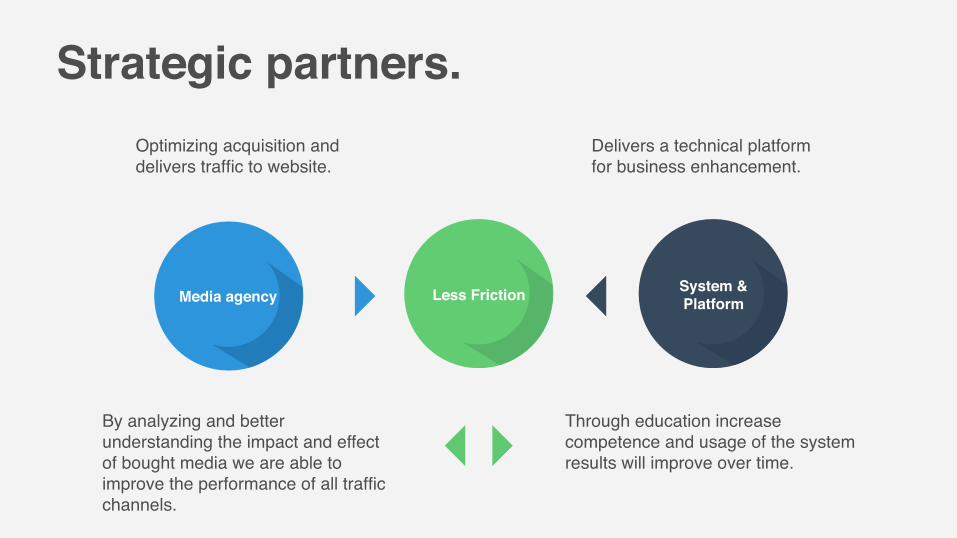
System & PlatformMedia agency Less Friction
Strategic partners.
Through education increase competence and usage of the system results will improve over time.
Delivers a technical platform for business enhancement.
Optimizing acquisition and delivers traffic to website.
By analyzing and better understanding the impact and effect of bought media we are able to improve the performance of all traffic channels.
+
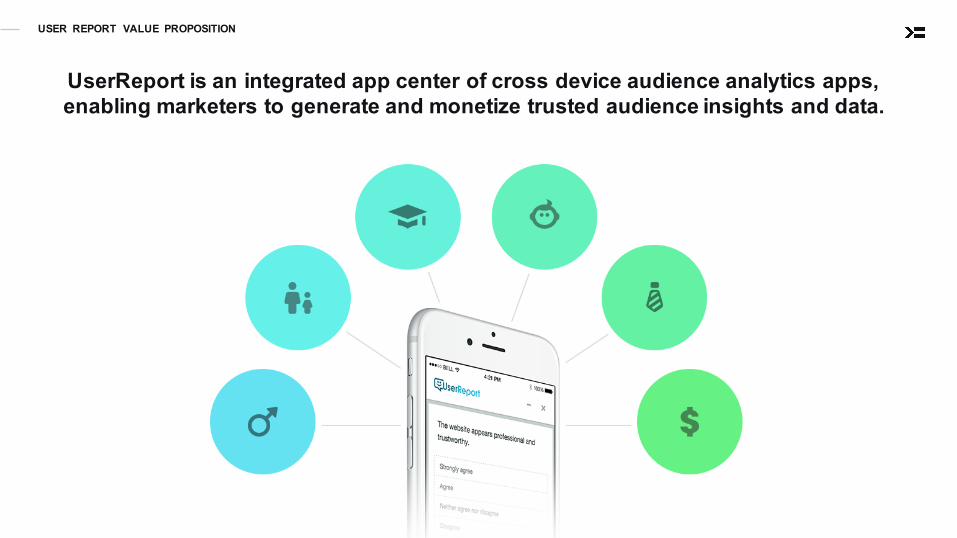
USER REPORT VALUE PROPOSITION
UserReport is an integrated app center of cross device audience analytics apps, enabling marketers to generate and monetize trusted audience insights and data.
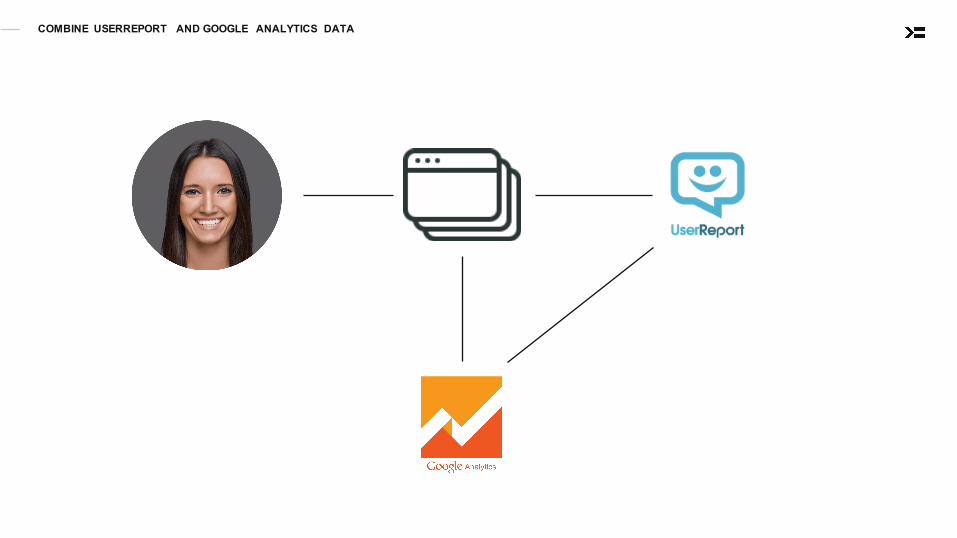
COMBINE USERREPORT AND GOOGLE ANALYTICS DATA
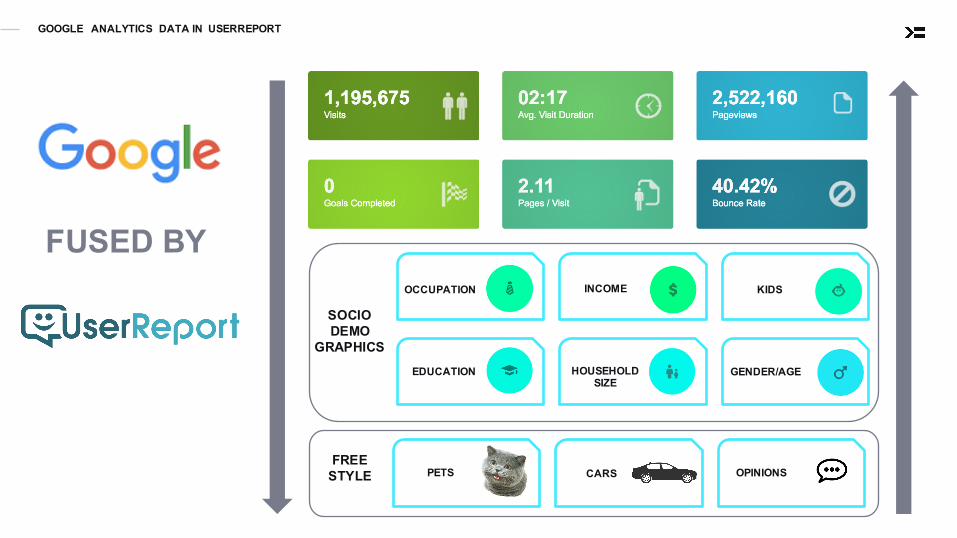
GOOGLE ANALYTICS DATA IN USERREPORT
FUSED BYOCCUPATION INCOME KIDS
EDUCATION HOUSEHOLD SIZE
GENDER/AGE
PETS CARS OPINIONS
SOCIODEMO
GRAPHICS
FREESTYLE
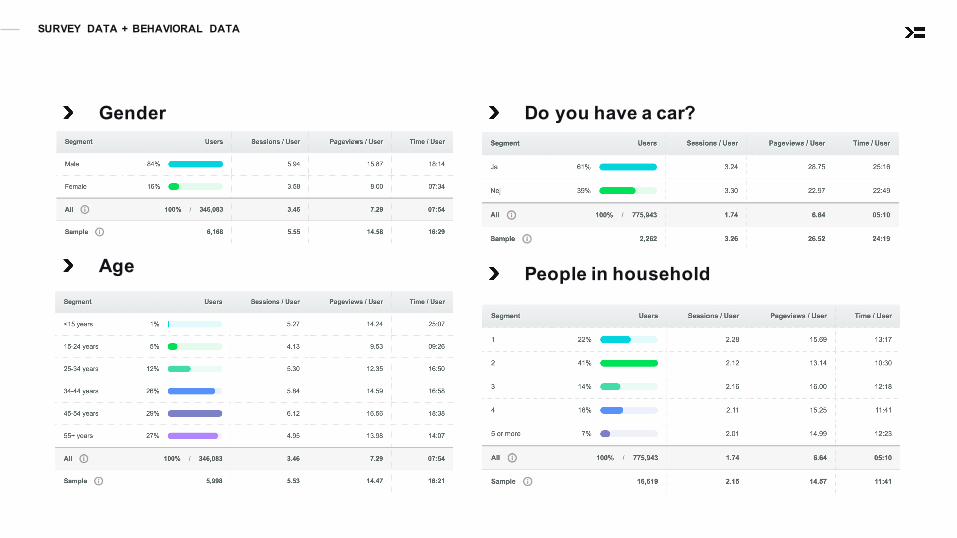
SURVEY DATA + BEHAVIORAL DATA
Gender
Age
Do you have a car?
People in household
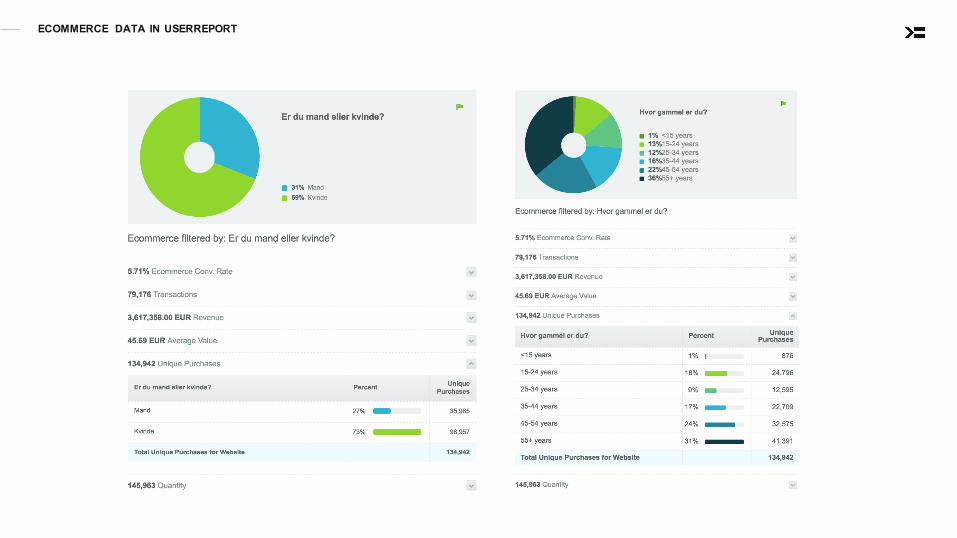
ECOMMERCE DATA IN USERREPORT
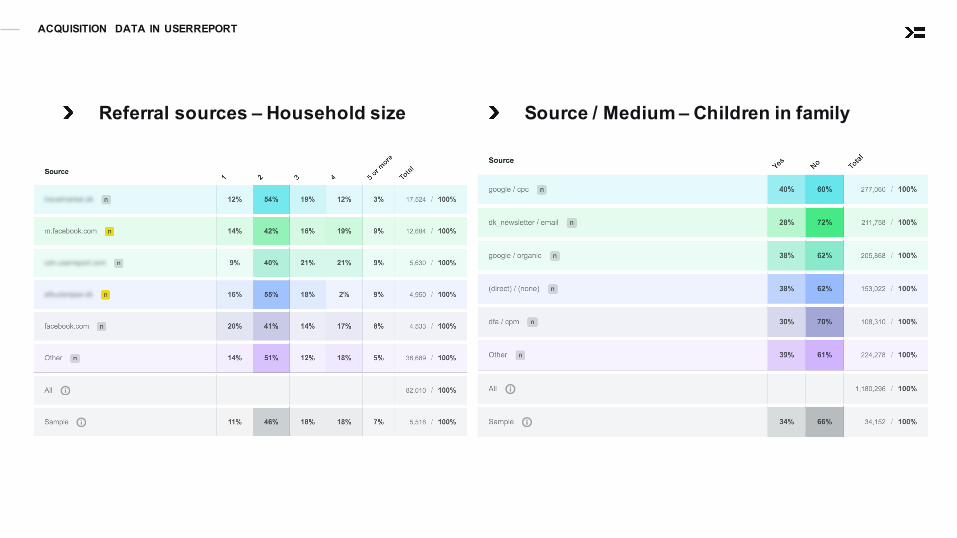
ACQUISITION DATA IN USERREPORT
Referral sources – Household size Source / Medium – Children in family
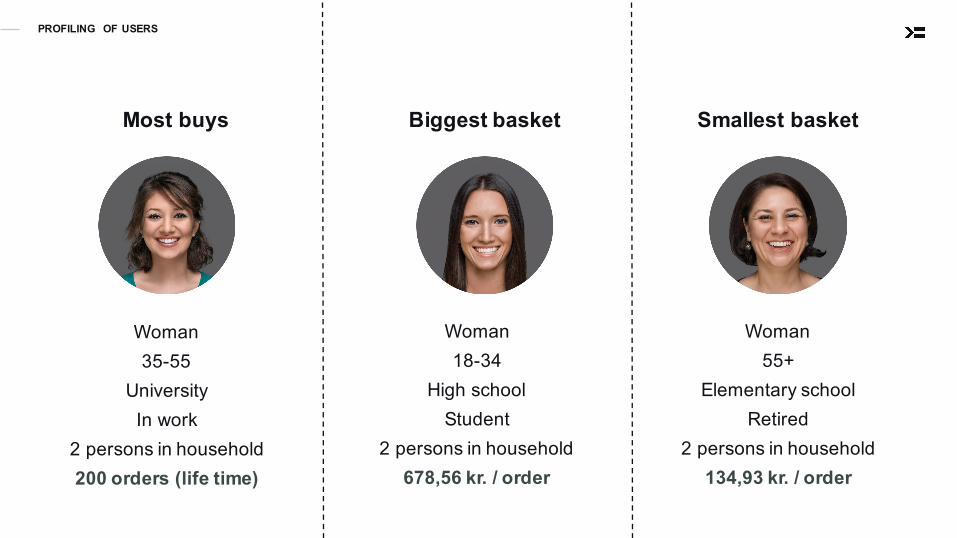
PROFILING OF USERS
Most buys
Woman35-55
UniversityIn work
2 persons in household200 orders (life time)
Biggest basket Smallest basket
Woman18-34
High schoolStudent
2 persons in household678,56 kr. / order
Woman55+
Elementary schoolRetired
2 persons in household134,93 kr. / order
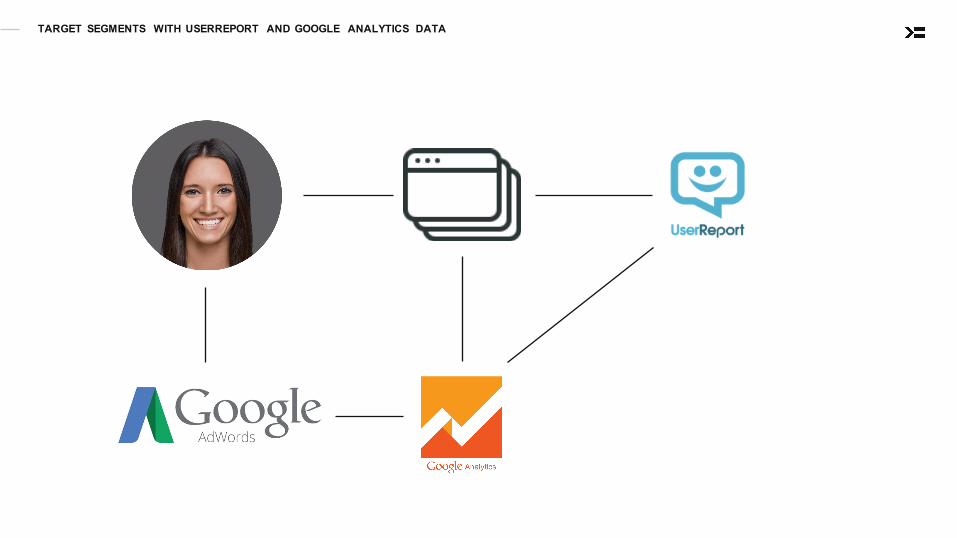
TARGET SEGMENTS WITH USERREPORT AND GOOGLE ANALYTICS DATA
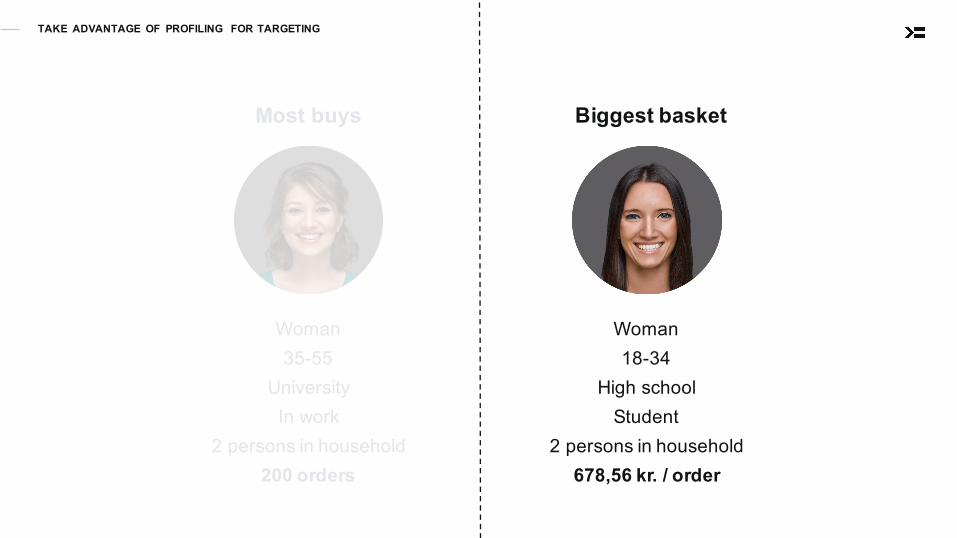
TAKE ADVANTAGE OF PROFILING FOR TARGETING
Most buys
Woman35-55
UniversityIn work
2 persons in household200 orders
Biggest basket
Woman18-34
High schoolStudent
2 persons in household678,56 kr. / order
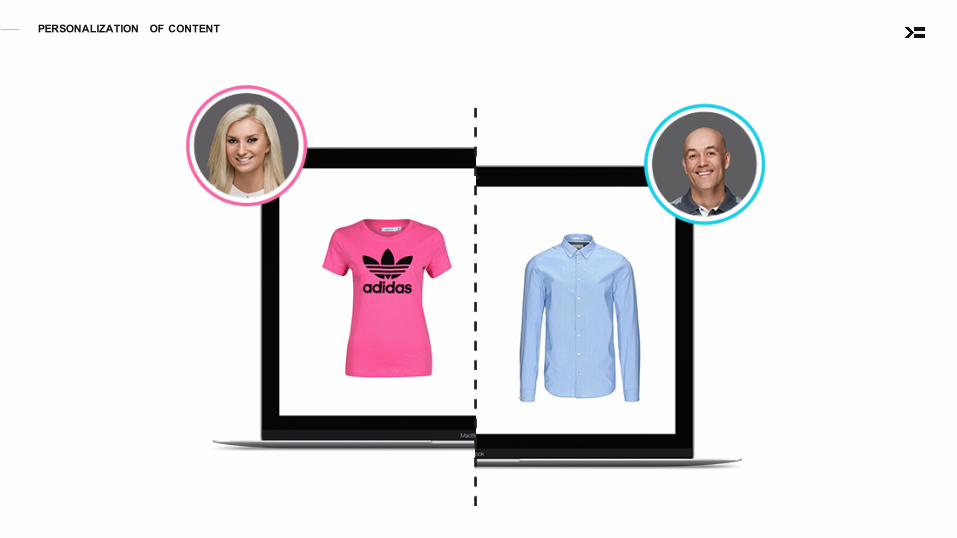
PERSONALIZATION OF CONTENT

The case study
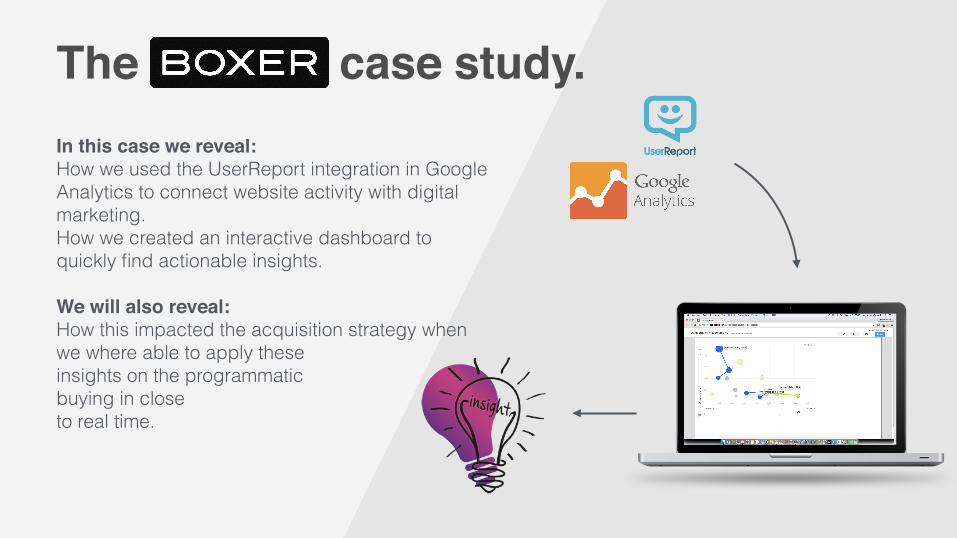
The BOXER case study.In this case we reveal:How we used the UserReport integration in Google Analytics to connect website activity with digital marketing. How we created an interactive dashboard to quickly find actionable insights.
We will also reveal: How this impacted the acquisition strategy when we where able to apply these insights on the programmatic buying in close to real time.
‹#›
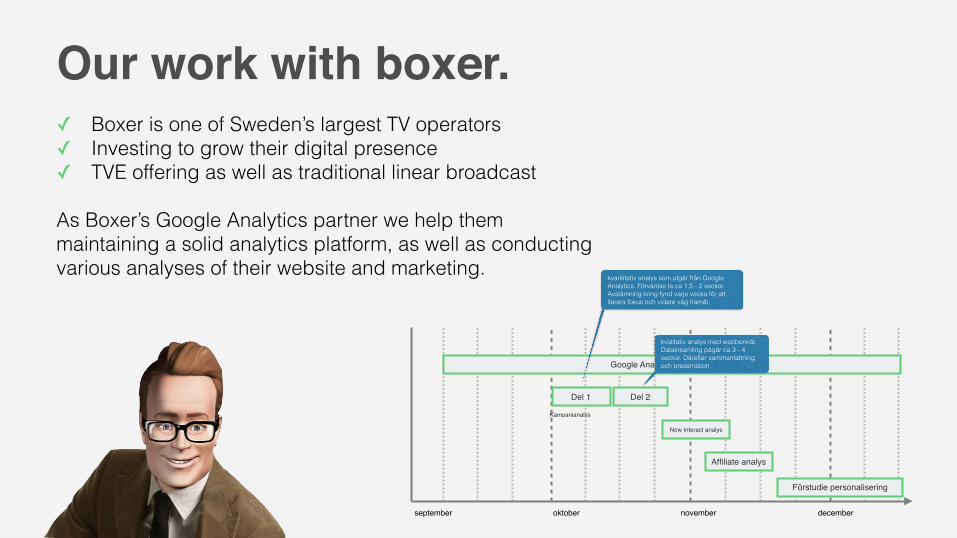
✓ Boxer is one of Sweden’s largest TV operators ✓ Investing to grow their digital presence ✓ TVE offering as well as traditional linear broadcast
As Boxer’s Google Analytics partner we help them maintaining a solid analytics platform, as well as conducting various analyses of their website and marketing.
september oktober november december
Google Analytics & Tag Manager
Del 1
Now Interact analys
Förstudie personalisering
Affiliate analys
Del 2
Kampanjanalys
kvantitativ analys som utgår från Google Analytics. Förväntas ta ca 1,5 - 2 veckor. Avstämning kring fynd varje vecka för att iterera fokus och vidare väg framåt.
kvalitativ analys med webbenkät. Datainsamling pågår ca 3 - 4 veckor. Därefter sammanfattning och presentation
Our work with boxer.
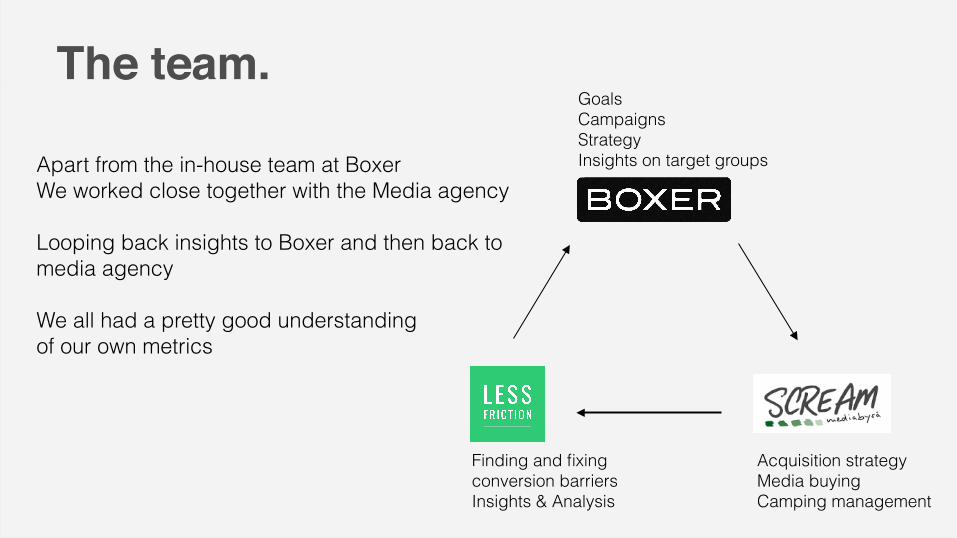
‹#›The team.
Finding and fixing conversion barriers Insights & Analysis
Acquisition strategy Media buying Camping management
Goals Campaigns Strategy Insights on target groupsApart from the in-house team at Boxer
We worked close together with the Media agency
Looping back insights to Boxer and then back to media agency
We all had a pretty good understanding of our own metrics

‹#›Whats happening on the website?
All about the what and not about the who!
‹#›What did we want to achieve?
✓ We needed to develop an analysis model that we could use across the entire team ✓ Easy to use and understand ✓ Easy access for non GA users ✓ Actionable!
With all the different stakeholders it was imperative that everyone was working in the same direction
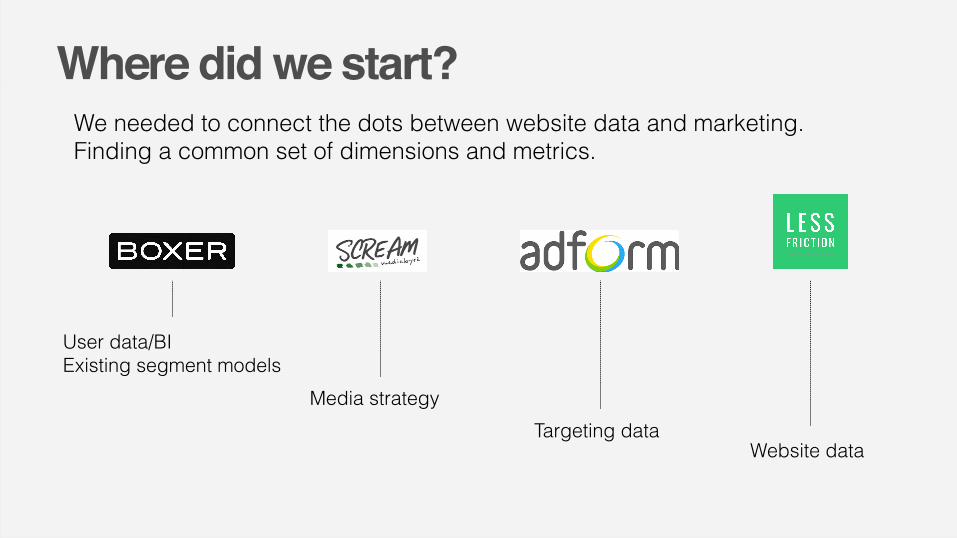
‹#›Where did we start?
User data/BI Existing segment models
Media strategy Targeting data
Website data
We needed to connect the dots between website data and marketing. Finding a common set of dimensions and metrics.
‹#›
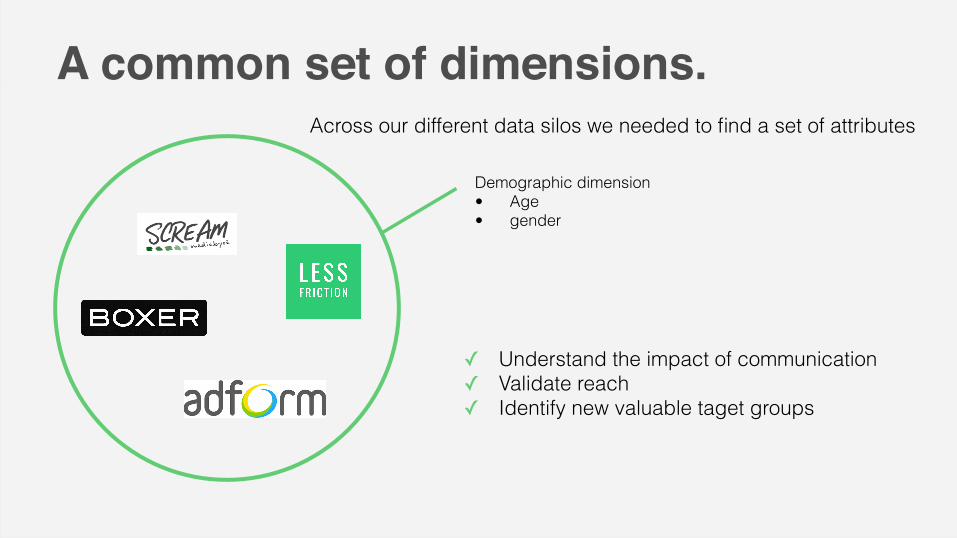
Demographic dimension • Age • gender
Across our different data silos we needed to find a set of attributes
A common set of dimensions.
✓ Understand the impact of communication ✓ Validate reach ✓ Identify new valuable taget groups
‹#›The approach.
✓ Sessions ✓ Conversion rate ✓ Session Value
+ Timelaps
Once we had identified our common set of attributes we could start working on a set of performance metrics.
It was important that the set of metrics were easy to understand and could evaluate both onsite performance as well as acquisition strategy.
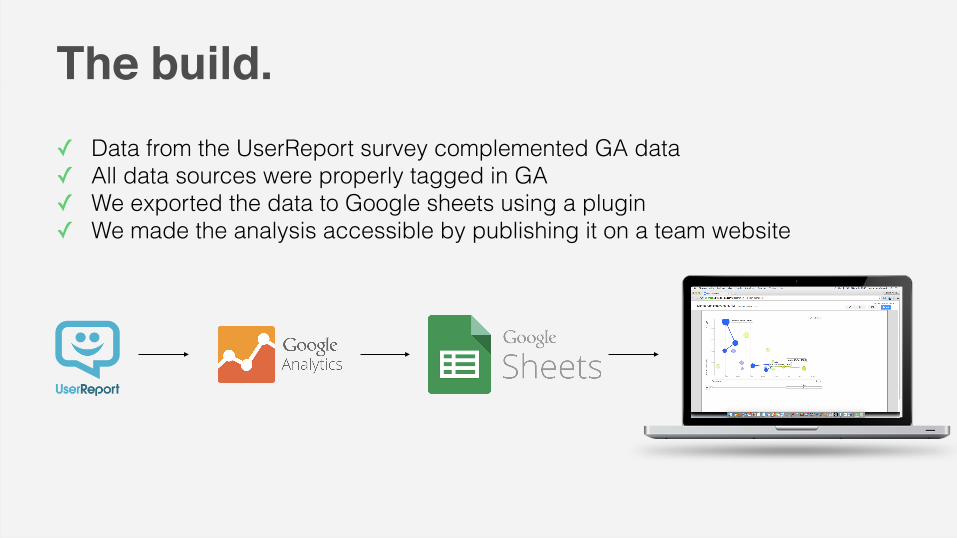
‹#›The build.✓ Data from the UserReport survey complemented GA data ✓ All data sources were properly tagged in GA ✓ We exported the data to Google sheets using a plugin ✓ We made the analysis accessible by publishing it on a team website
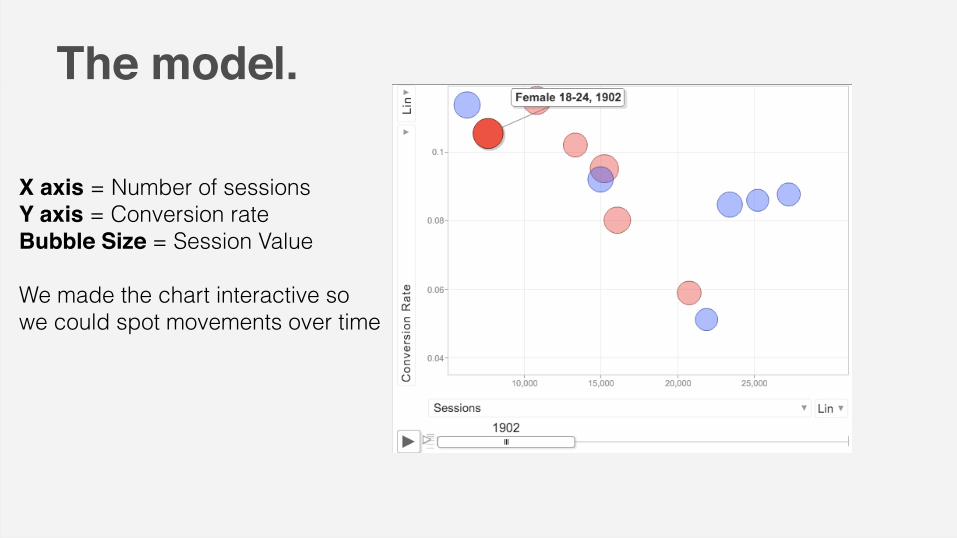
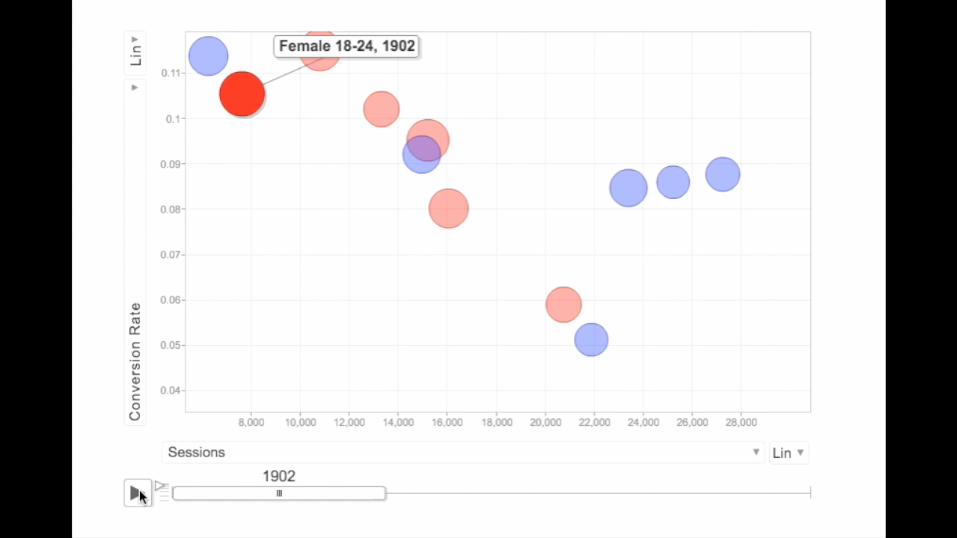
‹#›The model.
X axis = Number of sessions Y axis = Conversion rate Bubble Size = Session Value
We made the chart interactive so we could spot movements over time
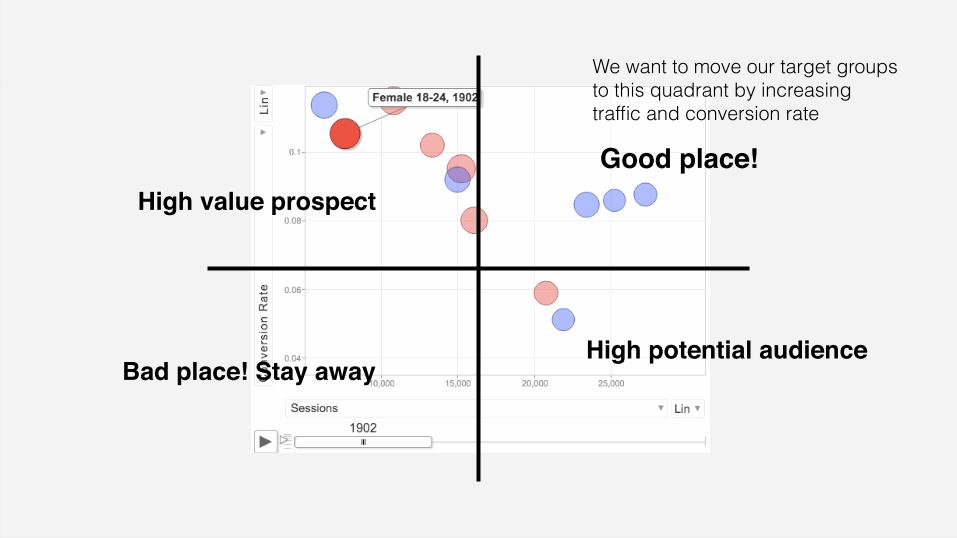
‹#›
Good place!
We want to move our target groups to this quadrant by increasing traffic and conversion rate
High value prospect
High potential audienceBad place! Stay away
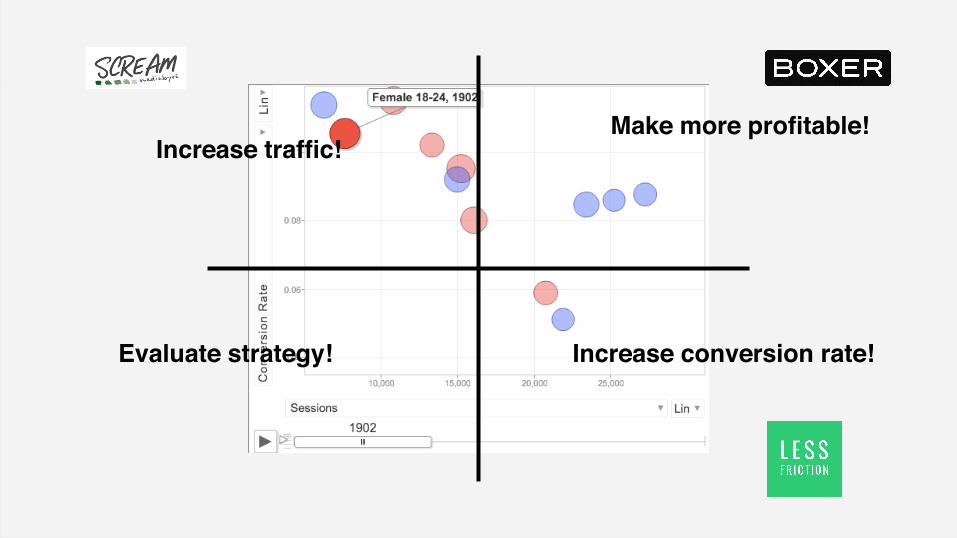
‹#›
Make more profitable!Increase traffic!
Increase conversion rate!Evaluate strategy!
‹#›
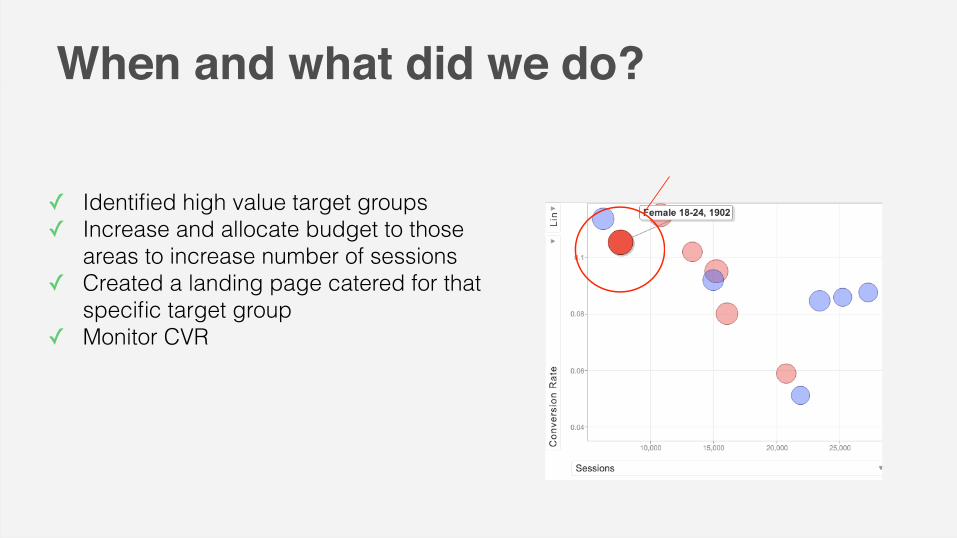
✓ Identified high value target groups ✓ Increase and allocate budget to those
areas to increase number of sessions ✓ Created a landing page catered for that
specific target group ✓ Monitor CVR
When and what did we do?
‹#›
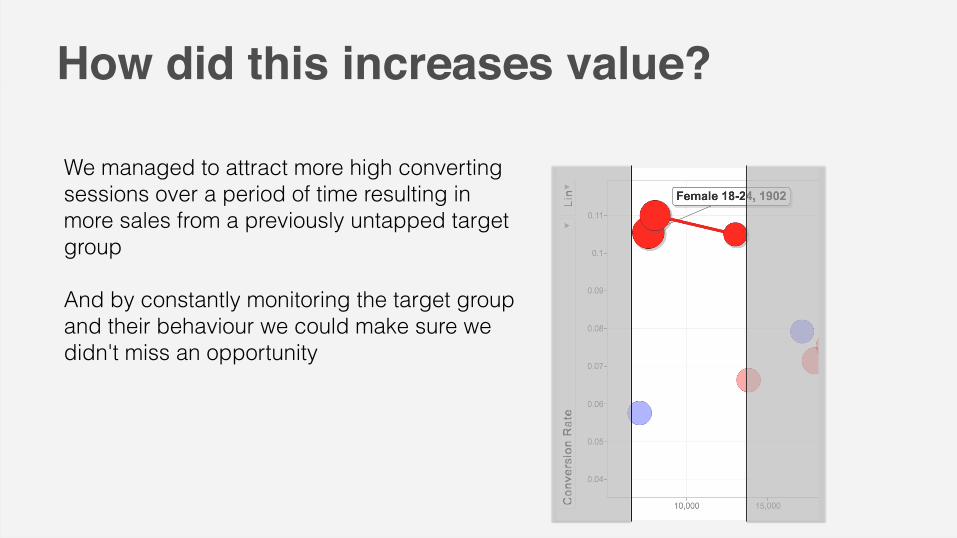
We managed to attract more high converting sessions over a period of time resulting in more sales from a previously untapped target group
And by constantly monitoring the target group and their behaviour we could make sure we didn't miss an opportunity
How did this increases value?
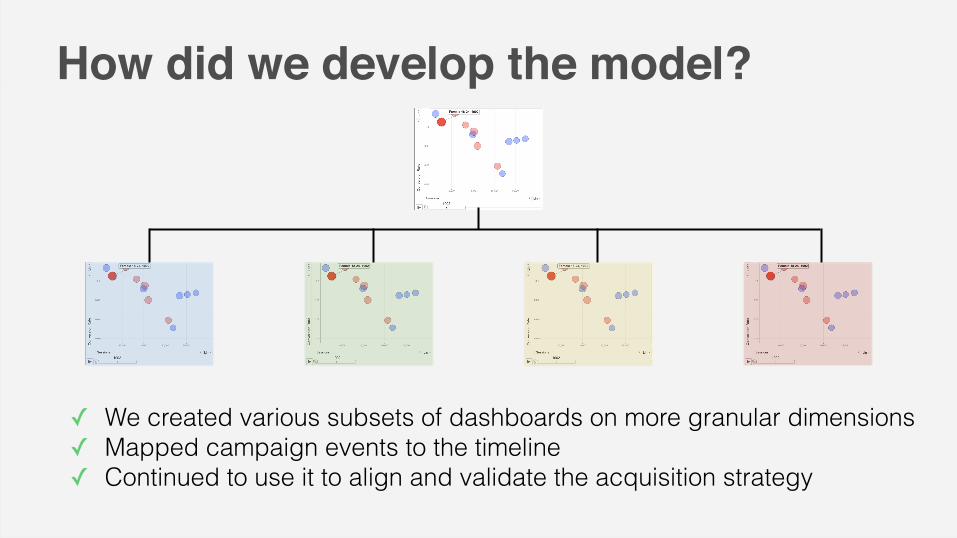
‹#›How did we develop the model?
✓ We created various subsets of dashboards on more granular dimensions ✓ Mapped campaign events to the timeline ✓ Continued to use it to align and validate the acquisition strategy
Thank you!+ 46 761 012 250
alexanderwidmark1
Alexander WidmarkLess Friction
twitter.com/lessfriction
Recommended