Handbook of Cliometrics,
Claude Diebolt and Michael Haupert, editors
Springer-Verlag, forthcoming.
Human Capital
Claudia Goldin
Department of Economics
Harvard University
and
National Bureau of Economic Research
ABSTRACT
Human capital is the stock of skills that the labor force possesses. The flow of
these skills is forthcoming when the return to investment exceeds the cost (both
direct and indirect). Returns to these skills are private in the sense that an
individual’s productive capacity increases with more of them. But there are often
externalities that increase the productive capacity of others when human capital is
increased. This essay discusses these concepts historically and focuses on two
major components of human capital: education and training, and health. The
institutions that encourage human capital investment are discussed, as is the role
of human capital in economic growth. The notion that the study of human capital
is inherently historical is emphasized and defended.
Table of Contents
I. Human Capital and History .................................................................................................... 1
A. What Is Human Capital? .................................................................................................. 1
B. Why the Study of Human Capital is Inherently Historical .............................................. 2
II. Human Capital and Economic Growth ................................................................................... 4
A. Human Capital and Economic Performance in the Long Run: Escaping Malthus .......... 4
B. Human Capital, Institutions and Economic Growth ........................................................ 5
III. Producing Human Capital: Education and Training ............................................................... 7
A. The Rise of Formal Education and the Role of the State ................................................ 7
B. Formal Schooling in Europe and America ...................................................................... 8
C. Why Invest in Education or Training? ........................................................................... 11
D. Role of the State in Education ....................................................................................... 13
E. Why Education Levels Increased .................................................................................. 14
F. Race between Education and Technology ..................................................................... 16
G. Human Capital and Education: Concluding Remarks ................................................... 17
IV. Producing Human Capital: Health ........................................................................................ 17
A. Health Human Capital and Income ................................................................................ 17
B. Measures of Health Human Capital ............................................................................... 18
C. Increased Life Expectation: The Three Historical Phases ............................................. 19
(1) Phase I: Improvements in Nutrition ....................................................................... 19
(2) Phase II: Public Health Interventions ..................................................................... 20
(3) Phase III: The Age of Modern Medicine ................................................................ 21
V. Human Capital: Summary..................................................................................................... 22
References .................................................................................................................................... 24
Figure and Tables ......................................................................................................................... 29
Claudia Goldin, Human Capital 2/23/2014 -1-
I. Human Capital and History
For much of recorded history, income levels were low, lives were short and there was
little or no economic growth. We now have healthier, longer, richer and hopefully happier lives.
The regime shift involved increased knowledge and its diffusion, greater levels of training and
education, improved health, more migration, fertility change and the demographic transition. In
short, the process involved advances in human capital.
A. What Is Human Capital?
Human capital is defined in the Oxford English Dictionary as “the skills the labor force
possesses and is regarded as a resource or asset.” It encompasses the notion that there are
investments in people (e.g., education, training, health) and that these investments increase an
individual’s productivity.
We use the term today as if it were always part of our lingua franca. But it wasn’t. Not
that long ago, even economists scoffed at the notion of “human capital.” As Theodore Schultz
noted in his American Economic Association presidential address in 1961 many thought that free
people were not to be equated with property and marketable assets (Schultz, 1961). To them,
that implied slavery.
But the concept of human capital goes back at least to Adam Smith. In his fourth
definition of capital he noted: “The acquisition of … talents during … education, study, or
apprenticeship, costs a real expense, which is capital in [a] person. Those talents [are] part of his
fortune [and] likewise that of society” (Smith, 1776).
The earliest formal use of the term “human capital” in economics is probably by Irving
Fisher in 1897.1 It was later adopted by various writers but did not become a serious part of the
economists’ lingua franca until the late 1950s. It became considerably more popular after Jacob
Mincer’s 1958 Journal of Political Economy article “Investment in Human Capital and Personal
Income Distribution.” In Gary Becker’s Human Capital: A Theoretical and Empirical Analysis,
with Special Reference to Education, published in 1964 (and preceded by his 1962 Journal of
Political Economy article, “Investment in Human Capital”), Becker notes that he hesitated to use
the term “human capital” in the title of his book and employed a long subtitle to guard against
1 Fisher cites J.S. Nicholson, “The Living Capital of the United Kingdom,” for the term “living capital” as
opposed to “dead capital.”
Claudia Goldin, Human Capital 2/23/2014 -2-
criticism.2
Schultz’s article (1961) demonstrates the importance of the concept of human capital in
explaining various economic anomalies. Some are easy to figure out, such as why both migrants
and students are disproportionately young persons. Some are more difficult, such as why the
ratio of capital to income has decreased over time, what explains the growth “residual,” and why
Europe recovered so rapidly after World War II. Some are even more difficult, such as why
labor earnings have risen over time and why they did not for much of human history. As is clear
from most of these issues, the study of human capital is inherently historical.
B. Why the Study of Human Capital is Inherently Historical
Robert Solow’s pioneering work on economic growth in the 1950s led to the formulation
of growth accounting and the discovery (or uncovering) of the “residual.”3 Solow (1957),
working with data from 1909 to 1949, demonstrated that the residual was 87.5 percent of total
growth in per capita terms. The residual is that portion of economic growth that the researcher
cannot explain by the increase in physical productive factors such as the capital stock, the
number of workers and their hours and weeks of work.
The size of the residual during much of the twentieth century relative to economic growth
in per capita or per worker terms demonstrated that physical capital accumulation did not explain
much of growth and that something else did. That something else is knowledge creation and the
augmentation of the labor input through education and training. In other words, much of the
residual was due to the increase in human capital.
Some researchers devised methods to close the “residual” gap by adding human capital
growth to the Solow model (Mankiw, Romer & Weil, 1992). Others demonstrated that the
growth of knowledge and other “non-rival” goods meant that some of the implications of the
Solow model were violated (Jones & Romer, 2010).
Among the most important findings regarding economic growth over the long run, and
the one most relevant to the study of human capital in history, is that the residual has greatly
increased over time. Physical capital accumulation and land clearing explain a substantial
fraction of economic growth in the past. But they do far less well in the more modern era. As a
2 A Google “N Gram” of the term “human capital” reveals that there was virtually no usage in the English
language until the late 1950s. After the 1950s the usage of the term increased until today, with a
somewhat greater uptick in the 1990s than previously. 3 For an understanding of the “residual” in economic growth, see the original Solow (1957) article or an
economic growth theory textbook such as Barro and Sala-i-Martin (2003).
Claudia Goldin, Human Capital 2/23/2014 -3-
fraction of the growth of income per capita in U.S. history the residual has increased from about
57 percent for the 1840 to 1900 period to around 85 percent for the 1900 to 1980s period.4
The residual can be reduced by about 20 percent for the 1900 to 1980s period by
accounting for the growth in human capital embodied in individuals.5 But growth in human
capital does little to reduce the residual for the earlier period. In large measure the reason that
human capital advances explain more economic growth in the twentieth century than the
nineteenth century is because education advances were slower. That is, there simply was not a
lot of human capital formation in the earlier period. Exactly why schooling levels advanced in
the late nineteenth century is discussed in the section on education below. But another reason is
because the productivity increase from higher levels of education was probably less.6
The inclusion of human capital in growth accounting treats increases in education as
enhancing the productivity of individuals. Differential productivity is measured by how much
higher earnings are for workers of different levels of education. That is, earnings ratios by
education (e.g., college/high school graduates) are held constant and the fractions of workers
with different levels of education are allowed to change from one year to the next. These relative
“prices” can be updated in the same way that prices are changed in chain-weighted prices for
commodities.7
The impact of education would be considerably larger, and the residual smaller, if non-
private aspects of human capital accumulation were included. These non-private aspects of
human capital include spillovers across firms from increased knowledge, lower amounts of
criminal activity in society and greater innovation because there are more smart and informed
people.
Another way in which the study of human capital is inherently historical concerns the
origins of the “knowledge economy” (Mokyr, 2004). Knowledge evolved historically beginning
with observations about natural phenomenon—the elemental discoveries or the “what” of
knowledge. These include: “my headache goes away when I chew on the bark of the willow
tree.”8 Knowledge then shifted from “what is it?” to answering “how does it work? This
knowledge involved generalizations and scientific findings. The willow tree contains (acetyl)
salicylic acid, which is an anti-inflammatory and anti-clotting drug. Aspirin was made out of
this substance in the early 1900s. Knowledge then advanced to a deeper understanding of the
4 See the calculations in Robert Gallman’s chapter in Davis, Easterlin, Parker, et al. (1972) and those in
Denison (1962). 5 The calculation is larger in Denison’s work than in Goldin and Katz (2008). But both of these are a
lower bound for a host of reasons including the endogenous nature of capital and, most importantly, the
externalities from having a more educated workforce and population. 6 The data needed to assess this point are very thin and consist of earnings for various occupations.
7 See Goldin and Katz (2008, table 1.3).
8 Hippocrates left records of this finding.
Claudia Goldin, Human Capital 2/23/2014 -4-
“how” and only in 1971 did researchers figure out that the anti-inflammatory response occurred
because of suppression of prostaglandins.
An important part of the creation of knowledge is diffusion of the initial “what.” In pre-
modern periods, the existence of large numbers of people living in close proximity was
important to the maintenance of knowledge. Widely dispersed settlements, on the other hand,
meant that chance discoveries would be less likely to spread and to be built upon. Later
advances, such as the printing press, books, scholarly societies and formal schools, helped
preserve knowledge and spread discoveries. The notion that denser populations enhance the
spread of knowledge and heighten innovation is important to understanding how humans escaped
the Malthusian trap and why investments in human capital were worthwhile.
II. Human Capital and Economic Growth
A. Human Capital and Economic Performance in the Long Run: Escaping Malthus
According to many economic historians, real wages in Europe were stagnant from at least
1200 to about 1800 (Allen 2001, Clark 2005, 2007a, 2007b). As can be seen in Figure 1, real
wages may have been stagnant but they were not unchanging during those centuries. The real
wages of both agricultural laborers and building craftsmen rose when population decreased, as
during the Black Death (peaking around 1350), and they fell as populations rebounded. They
varied, as well, due to agricultural vicissitudes. But, on average they changed little. World
population increased, but only slightly from around −10,000 BC until around 1800 AD (see
Figure 2).
By and large, the data series in Figures 1 and 2 point to a classic Malthusian
equilibrium—stagnant real wages during long periods, small increases in population, and
occasional periods of real wage growth followed by increased population and subsequent
decreased wages. The Malthusian problem was two-fold: a fixed amount of resources in the
form of land and no fertility controls.
But sustained growth in real income per capita and in real wages is apparent in mid-
nineteenth century Europe (see Figures 2 and 3) and somewhat earlier in North America.
Population growth had been extremely low but increased enormously in the period just after the
“industrial revolution.” The demographic transition set in at various moments in Europe and
North America. It occurred in the US and France in the early 1800s, in parts of Europe later in
the nineteenth century and in other parts of Europe as late as the early twentieth century.
By the nineteenth century many parts of Europe, the Western Hemisphere, and elsewhere
had entered the modern era of economic growth and had escaped the Malthusian trap. How the
regime change came about is one the most important issues in economic history. The answer
Claudia Goldin, Human Capital 2/23/2014 -5-
mainly concerns technological change and the fertility transition. Underlying both of these
transformations is the concept of human capital. Without knowledge embodied in people there
can be no technological change. Without an increase in the value of each child parents will opt
for quantity over quality.
One way of reconciling the historical facts is through an insightful endogenous growth
model, pioneered by Galor and Weil (2000) and expanded in Galor (2011). Central to their
model is the emerging role of human capital.
The model contains three regimes and the decision-makers are parents who determine
how many kids to have and how much to invest in each. At the outset there are low levels of
income, no schooling, no income growth, and a very low increase in population. As population
increases, technology advances (recall that the “what” of knowledge diffuses with larger, denser
populations). Even small levels of technological change increase incomes and induce parents to
allocate some of their resources to school their children. Education increases, which in turn
boosts technological change, income and population. At some point intensive growth, a
demographic transition and sustained growth per capita all become possible and the world
escapes the Malthusian trap.
Human capital is fundamental to the Galor-Weil model. A greater and denser population
increases technological change because of the notions about knowledge creation, discussed
above. Technology complements skill and increases the returns to investments in education.
Education, in turn, induces more technical change. Finally, families are induced to have fewer
and more highly-educated children than a greater number of lower-educated children and the
crucial demographic transition can eventually set in.
B. Human Capital, Institutions and Economic Growth
The ability of nations to foster human capital accumulation depends on the existence of
enabling institutions. One set of these enabling institutions is the legal and extra-legal rules that
define property rights in man. Another set includes a host of related institutions such as the
franchise, form of government (due process, rule of law), and religion.
Optimal human capital investment depends on various factors such as the degree to
which capital markets are well functioning and the level of certainty in the economy and polity.
When political power is unequally held, human capital accumulation is likely to be suboptimal
since groups cannot make credible, long-term commitments to the “elites.” Even though
everyone could be better off, one can get stuck in a bad equilibrium.
Claudia Goldin, Human Capital 2/23/2014 -6-
If the key to economic success is good institutions, then “why isn’t the whole world
developed?” as Richard Easterlin aptly questioned in his 1981 Economic History Association
presidential address. A compelling answer is provided in a series of papers.9
Acemoglu, Johnson, and Robinson (2002) reveal the origins of growth-dependent
institutions in the colonized parts of the world. As Europeans arrived, places that were dense in
existing populations and rich in resources were exploited and given “bad” institutions that
allowed Europeans to tax and extract rents. The bleaker, poorer places, on the other hand, were
given enabling institutions to encourage European migration. These institutional differences
persisted and produced “reversals of fortune.” The poorer places, like North America, became
richer and the richer places, like the Caribbean, stagnated.
Engerman and Sokoloff (2012) and Sokoloff and Engerman (2000) contain similar logic
and underscore the fact that the same European powers that brought bad institutions to some
places brought good institutions to others. The British settled much of North America but they
also settled parts of the Caribbean. Engerman and Sokoloff emphasize particular institutions
such as those relating to property rights in man, educational institutions and the franchise.
A spectrum of labor and human capital institutions have existed historically. Starting
with the least free, these institutions include: slavery, indentured servitude, labor contracts of
various types including apprenticeships and, ultimately, free labor with its associated educational
institutions. If free labor is at one end of the spectrum, then slavery is at the other and indentured
servitude and contract labor are somewhere in between.
Slavery is an ancient labor system. Slaves are mentioned in the bible and the majority of
Athenians were enslaved in some respects. But slavery in the New World was different. It was
not a temporary state. Rather, it was in perpetuity. And in the Americas slavery was mainly
based on race. Whites could be indentured servants and convict laborers, they could be coerced
and duped, but they could not be slaves.
The slave trade from Africa began in the 1500s with the vast majority brought to Brazil
and the Caribbean (60 percent). Just 7 percent went to North America. Slaves in the Western
Hemisphere were mainly used in tropical and warmer areas to produce sugar, rice, tobacco,
indigo, and later (and most consequentially) cotton. But they also produced a large amount of
the food consumed in the South. Slavery had once existed in many northern states but changed
in the 1790s through a series of gradual and then immediate emancipation laws and state
constitutions.10
9 Mark Twain provides a similar answer in A Connecticut Yankee in King Arthur’s Court.
10 Fogel (1989) provides a definitive treatment of the subject.
Claudia Goldin, Human Capital 2/23/2014 -7-
After the U.S. and British slave trade closed in 1808, the market for slaves, which had
previously existed in various ways, rapidly developed into a market for hires (rentals) and a
market for sales (prices). Slavery provides the most extreme form of the market for human
capital. Human beings were rented and they were sold. But did this market mean that there was
optimal human capital investment in slaves? Did masters have the right incentives to invest in
formal schooling and training in various trades such as carpentry, shoe making and mechanics?
It would appear that slavery reduced two barriers to optimal human capital investment.
The first concerns capital market constraints since most masters would have been wealthier than
ordinary laborers. The second is having an employer invest in the general skills of his employee.
In this case the employee was bound to the master. But two larger problems arose.
The first concerns the alignment of private incentives. If a master invested in his slave,
would he be able to obtain optimal effort and could the slave escape? In antebellum southern
towns and cities and even in the farm areas, slaves were often hired out.11
Some of the more
trusted and skilled slaves hired themselves out and master and slave had an implicit or explicit
contracts regarding how the income would be shared. These agreements, however, were not
commonly found possibly because of issues of trust but most likely for another reason. That
reason concerned the public sphere.
Reading and writing, it was believed, would provide slaves with a greater ability to
communicate with each other and revolt. Around the 1820s all southern states made the teaching
of slaves any literacy skills illegal. The second reason, therefore, is that endowing slaves with
much human capital became prohibited.
Indentured servitude was another labor market form that existed to solve a capital market
problem. Whereas slavery was for life and for all future generations, indentured servitude was
for a given period to pay back a loan generally for passage to America but also to care for
orphaned children (e.g., Oliver Twist). In the eighteenth century many who came to North
America were “indentured servants” (Galenson, 1984). Indentures appear to have enhanced
capital markets and enabled geographic mobility. They declined as transport costs decreased and
as incomes in the sending nations rose, thereby obviating the need for loans.
III. Producing Human Capital: Education and Training
A. The Rise of Formal Education and the Role of the State
A fundamental difference between humans and other species is the extensive
transmission and preservation of knowledge among humans. This transmission and preservation
11
See Goldin (1976) on slavery in U.S. cities from 1820 to 1860.

Claudia Goldin, Human Capital 2/23/2014 -8-
is what had led to modern economic growth. But the transmission could not have been broad
based and could not have reached the “masses” of people if not for institutions called schools.
Knowledge was, and still is, transmitted without a formal and extensive school system.
Socrates taught Plato; Plato taught Aristotle; private tutors taught the Confucian classics to
hundreds of thousands of Chinese from the Sung to the Qing so they could take part in the “exam
system”; apprentices were taught skills by their masters; parents have always taught their
children. But only with schools, in which training begins with young children could the system
reach large numbers of ordinary people.
B. Formal Schooling in Europe and America
The transition to mass primary education in much of Europe began sometime in the late
nineteenth century but occurred much earlier in North America. According to the data in Figure
4, the United States and Prussia, leading nations in education, had primary schooling rates of
about 70 percent by 1860 for 5 to 14 year olds.12
The United States retained its lead and
surpassed (unified) Germany in the late nineteenth century and had a primary schooling rate of
exceeding 90 percent. But France, Germany and Britain all had primary school rates in excess of
70 percent by the start of the twentieth century.
Although the main contours of educational change at the elementary level from around
1840 to 1940 in Europe and the United States are probably well captured in these data, they must
be used with some caution. School data are often gleaned from census records and do not
account for the number of months children are in school. Especially when school data come
from administrative records, it is not always clear that the numerator is for youths between
certain ages even though the denominator is. In many places where secondary schools did not
yet exist, older youths attended the common or primary schools that held the elementary grades.
Therefore the numerator could be inflated by the older children. Another difficulty is that
comparisons across nations must account for a variety of institutional details since schools are
almost always at least in part in the public sector.
The educational lead of the United States that is apparent in the primary school data for
the nineteenth century expanded enormously in the twentieth century with the beginnings of the
“high school movement.” Although many of the richer nations of Europe had broad based
primary education for youth by the early part of the twentieth century, they did not have mass
education at the secondary and tertiary levels. But the United States did.
12
The figure for the United States beginning with 1880 includes the South and all races. Thus the
underlying data are even higher for the white population and that outside the U.S. South, which had and
still has lower schooling rates than the North and the West.

Claudia Goldin, Human Capital 2/23/2014 -9-
The United States greatly increased the number of its youth graduating from secondary
schools, as can be seen in Figure 5, so that by the 1950s the median youth in the United States
had graduated from a secondary school. In contrast, carefully assembled data comparing 13
OECD nations in the mid-1950s, show that secondary school enrollment rates for teenagers in
full-time general schools were low in all of Europe. Many of the nations in northern Europe had
technical programs for teenaged youth. But even adding these, the enrollment numbers, as seen
in Figure 6, do not demonstrate a broad-based system of secondary education and thus not an
open system for tertiary education.
Europe eventually caught up in mass education to the United States and has, in more
recent decades, leaped ahead in terms of both the quantity of secondary schooling and its quality.
I shall return to the more recent period. But at this point it is instructive to understand why the
United States took the initial lead and what roles were played by individual families and by local,
state and federal governments in terms of funding and regulations.
The twentieth century clearly became the human capital century. It began first in North
America but later spread to the rest of the world. How and why did that occur? Mass education
in the United States was achieved early because of several characteristics, emphasized in my
previous writings (Goldin, 2001, 2008). These characteristics were “virtuous” at the time and for
some time after. Many remained in place, even as some lost their virtuous characteristics.
Education in the United States has generally been open and forgiving in nature.
Openness means that schools, by and large, allowed all children to enter. The openness of U.S.
schools is related to that fact that ever since the mid-nineteenth century elementary and
secondary schools were (fully) publicly funded by local and state governments. Forgiving means
that students who did poorly in one grade were generally allowed to advance to the next. The
forgiving nature is related to the fact that until recently there were few standardized tests that
were required by law.
The funding of schools, moreover, was provided by small, fiscally independent districts.
Because the provision was largely by small districts, rather than the state or the federal
government, it was difficult to impose uniform testing. Even more important to the issue of
funding is that the districts were so small that there were thousands of them. At their peak in the
1920s, there were around 130,000 school districts.13
School districts could compete for families
and families could move to areas that had better schools or less expensive schools or different
types of schools.
Another characteristic was that U.S. education was academic, yet it was also practical.
Unlike many European nations there were few “tracks” that shunted youth into industrial and
13
Although most were “common” school districts, a large fraction were fiscally independent. There are
about 16,000 largely independent school districts today. See Goldin and Katz (2008), chapters 3 and 4.

Claudia Goldin, Human Capital 2/23/2014 -10-
vocational programs. All children were to be given the chance to advance to higher grades, even
if financial and intellectual limitations often prevented that ideal.
Related to that ideal is that by the early part of the nineteenth century, most primary
schools were gender neutral and during the high school movement the same was true of the
nascent secondary schools. Colleges became gender neutral somewhat later although those in
the public sector were generally coeducational from their initial opening (Goldin & Katz, 2011a).
U.S. education was, as well, secular. Not only did the United States have no established religion
(prohibited by the U.S. Constitution Bill of Rights, Amendment 1), state constitutions in the
nineteenth century were rewritten to forbid the use of state and municipal funds for religious
schools.
These characteristics were virtuous because, in a variety of ways, they increased
secondary school enrollment when it was low. The most obvious reason is that openness to most
groups meant no exclusions. Small, fiscally independent districts allowed groups of families to
determine the amount spent on and taxed for education. By not tracking children at young ages,
all children had a chance to rise to the next level. By being forgiving, the errors of one’s youth
had less impact on one’s future.
When levels of education are low, these characteristics are virtuous. Even if a small
fraction of the districts want to increases taxes to fund a secondary school, they can do just that
and do not have to wait until the majority in a state want to do so. Families that want to increase
public schooling expenditures can migrate to districts that have them or they can send their
children across school district borders and pay tuition.
But these characteristics are not necessarily virtuous in all times. They might increase
the quantity of schooling but not necessarily the quality. When enrollment and graduation rates
increase, quality not quantity becomes important. Small districts will increase quantity but may
also lead to large differences in expenditures per pupil.
Exactly what these characteristics did manage to accomplish in the United States can be
seen in Figure 7 part A. Educational attainment rose by about one year per decade, a feat that
could happen only with a broad-based educational system. Each generation could look forward
to being more educated than its parents and to having children more educated than they.
Interestingly, females had more years of education than males until cohorts born around
1920 and they again did with cohorts born after 1950 when the female lead emerged because of
their increase among college students. But after the cohorts born around 1950, a great slowdown
ensued in educational attainment, which has only just begun to pick up again, especially for
females.
Claudia Goldin, Human Capital 2/23/2014 -11-
African Americans, as can be seen in Figure 7 part B, had extremely low levels of
education early in the twentieth century. Those born around 1880 would have completed just
four years of formal schooling whereas the average white would have completed around eight
years. The quality of schooling for African Americans was considerably worse than it was for
whites and the number of actual months attended was far less (Card & Krueger, 1992a).14
The
levels increased considerably in the twentieth century but did not converge.
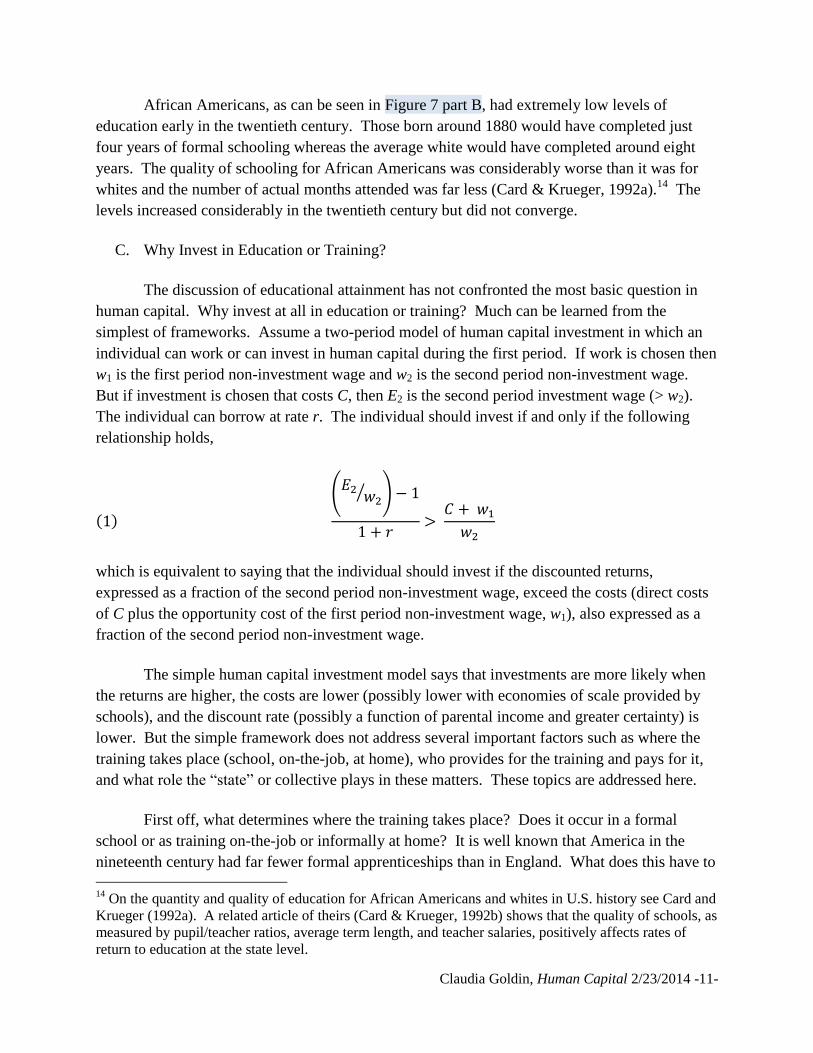
C. Why Invest in Education or Training?
The discussion of educational attainment has not confronted the most basic question in
human capital. Why invest at all in education or training? Much can be learned from the
simplest of frameworks. Assume a two-period model of human capital investment in which an
individual can work or can invest in human capital during the first period. If work is chosen then
w1 is the first period non-investment wage and w2 is the second period non-investment wage.
But if investment is chosen that costs C, then E2 is the second period investment wage (> w2).
The individual can borrow at rate r. The individual should invest if and only if the following
relationship holds,
( )
( ⁄ )
which is equivalent to saying that the individual should invest if the discounted returns,
expressed as a fraction of the second period non-investment wage, exceed the costs (direct costs
of C plus the opportunity cost of the first period non-investment wage, w1), also expressed as a
fraction of the second period non-investment wage.
The simple human capital investment model says that investments are more likely when
the returns are higher, the costs are lower (possibly lower with economies of scale provided by
schools), and the discount rate (possibly a function of parental income and greater certainty) is
lower. But the simple framework does not address several important factors such as where the
training takes place (school, on-the-job, at home), who provides for the training and pays for it,
and what role the “state” or collective plays in these matters. These topics are addressed here.
First off, what determines where the training takes place? Does it occur in a formal
school or as training on-the-job or informally at home? It is well known that America in the
nineteenth century had far fewer formal apprenticeships than in England. What does this have to
14
On the quantity and quality of education for African Americans and whites in U.S. history see Card and
Krueger (1992a). A related article of theirs (Card & Krueger, 1992b) shows that the quality of schools, as
measured by pupil/teacher ratios, average term length, and teacher salaries, positively affects rates of
return to education at the state level.
Claudia Goldin, Human Capital 2/23/2014 -12-
do with the investment decision? The answer is that when technological change is rapid and
geographic mobility is high, a general, flexible education is more valuable than one that is
specific to a particular occupation or place and is relatively inflexible. When the opposite is the
case, specific training is much better. America had greater geographic mobility and, for some
time, greater technological dynamism than in Europe. Both factors made general, flexible
education more valuable and occupation specific apprenticeships and industrial training less
valuable.
The second item that is omitted in the simple framework concerns who pays for human
capital investment and the role played by the “state.” By the “state” I mean a collective of
individuals. The collective can be involved in the provision of schooling (e.g., capital
investment in the building, hiring of teachers and selection of curriculum) and it can also be
involved in its funding. One can think of the possibilities as a two by two matrix, as in Table 1,
where the horizontal headings are the provision (public, private) and the vertical headings are the
funding (public, private).
From the nineteenth century to the present there have been examples of each of the forms
contained in the matrix. Cases along the main (positive) diagonal are the most common. They
include privately provided schools that are privately funded and publicly provided schools that
are publicly funded.
But the minor-diagonal elements, which may seem like oddities, exist today and have
existed historically. In the nineteenth century, many school districts had schools that were
publicly provided but were privately funded. Families received rate-bills, also known as tuition
bills, for the attendance of their children. The rate-bill in some places was for the full amount
but in other districts parents were assessed for the child’s attendance only above some maximum
number of days.
There are also cases of schools that are privately provided but publicly funded. In some
cities in the early nineteenth century schools were provided for the children of impoverished
families by private groups, including religious orders, but were funded by the municipality. In
more recent periods, the United States and Sweden, for example, have been using vouchers to
fund private schools out of taxes. Therefore, there are a multitude of possibilities that history
provides.
Another issue is whether individuals who invest in training have greater ability and,
therefore, whether estimates of the return to education and training are biased upwards because
of selection. The best recent analysis of the magnitude of ability bias shows that it is not very
large (Card, 1999). For historical estimates of the return to years of schooling given below,
because secondary schools in the early twentieth century were just spreading, youths who did not
attend them were not necessarily less able than those who did.
Claudia Goldin, Human Capital 2/23/2014 -13-
D. Role of the State in Education
In almost all places and during most historical periods, education has been publicly
provided and publicly funded. There have been times when the private sector has been larger but
the public sector has almost always increased in relative importance compared with the private
sector. The reasons for the increasing government involvement in education are many.
The state has various interests in education that increase demand for schools and, in turn,
lead the state to subsidize education. A main interest of the state is that education provides
public goods of various types including endowing citizens with a set of common values. The
state also has interests in correcting market failures concerning schooling.
Democracies require literate citizens and educated leaders; non-democratic governments
often restrict education (see, for example, Sokoloff & Engerman, 2000). States have a
multiplicity of needs for educated individuals including teachers, engineers, military personnel,
clerical staff and bureaucrats. Education creates positive externalities of many types, such as
lower crime rates and better health. In places with low population density schools are often
natural monopolies and state provision or regulation can be justified on efficiency grounds to
increase the quantity available to the public and decrease the price.
Another reason for state involvement in education is that parents often face capital
market constraints. Some parents may be insufficiently altruistic, and because children cannot
write binding contracts with their parents they cannot borrow against their future human capital.
To increase efficiency, the state might want to lower the interest rate faced by parents and
children. A customary way of doing this is to have the schools funded by communities as in an
“overlapping generations” framework. Young families with children are subsidized by older
families whose children have grown.
If parents are insufficiently altruistic the state might want to compel them to send their
children to schools. If children are too myopic, the state might want to compel them to attend
school. Compulsory schooling and child labor laws often accomplish these goals. But these
laws were not often binding in the United States (Goldin & Katz, 2011b). The reason is that the
United States was already providing schools for the masses. In consequence, few families and
youths were constrained by the compulsory education and labor laws. In contrast, these laws
were often binding in other countries, such as Britain and Ireland. The main reason is that they
“compelled” the state to provide schools and pay for teachers for broad-based education.
Most of the reasons just provided for government interference in the production of
educated individuals need not involve the provision of schools but would involve the financing
of education. The involvement of government in the provision of schools, the hiring of teachers

Claudia Goldin, Human Capital 2/23/2014 -14-
and so forth is often because it is convenient for the collective to provide the school capital than
for a private organization to do the same.
I had previously noted that the United States had an enormous number of independent
school districts and that more districts allow the sorting of families by the demand for education
and the ability to pay. In many other countries school districts are far fewer in number relative to
population and centralization is more the norm. In France, for example, there is just one school
district.
Because education is not a pure public good and can be purchased from the private
sector, parents can opt out of the public system even though they are still taxed to pay for it. If
the parents in a school district have a sufficiently wide distribution of demands for the quantity
and quality of education, the public sector can be stymied by what is known as the “ends against
the middle problem” (Epple & Romano, 1996). Parents with low demand for education (or low
income) will not want to vote for high spending and parents with high demand for education (or
high income) will also not want to vote for high spending since they will, most likely, opt out
and use the private sector. One solution is to have small districts that will better match school
expenditures to parental demands and result in higher levels of schooling. One of the initial
virtues of U.S. education was the existence of a large number of small, fiscally independent
districts.
E. Why Education Levels Increased
Education in the United States, and in most other nations, advanced to mass education
across the three transformations that are the three parts of schooling: primary, secondary, and
tertiary.15
The precise number of years of each of these portions and the ages at which youth
make each of the transitions varies somewhat across nations. But there is considerable
uniformity probably relating to the biology of child development.
In the United States the first transformation to mass primary schools occurred before the
twentieth century. Schools for primary school students were often called “common” schools, in
part because youth had a shared experience but also because they were generally one-room
school houses. In their graded form, they were called grammar schools. The schools were
common in the sense of including everyone and common in the sense of being ordinary and
abundant. They were operated, most often, by small communities and in their early days were
funded by parents through “rate bills,” which were charges based on the number of days children
attended school. In the mid-nineteenth century various social movements led to the ending of the
rate bills and by the 1870s primary schools were free to parents and their children. The same
15
Many places have added two other transitions: pre-school to kindergarten and middle school or junior
high school to high school.
Claudia Goldin, Human Capital 2/23/2014 -15-
laws and judicial interpretation that made primary schools free of marginal charges to parents
also made secondary schools free of tuition charges for those living in the school district.
In the late nineteenth century another educational movement emerged, particularly in the
eastern states. It led first to the establishment of private academies of various types that trained
youth beyond the limited courses of the common schools. The private academies were generally
small, ephemeral institutions and not much is known about them. Some were later converted
into the public high school after the community voted to fund one. The fact that academies were
private institutions and almost always funded by individual parents demonstrates that the
movement was grass roots in origin. The academy movement morphed into the “high school
movement,” one that is better known and was national in scope.
Both the academy and high school movements were spurred by the increased demand for
skills so that young people could be better prepared to enter the burgeoning world of business
and commerce and the more mechanized, electrified world of industry. But why did the high
school movement begin and expand when it did, around 1910?
One way to assess this question is to look at the earnings of young people with skills
valuable to commercial establishment relative to those without these skills. In the pre-1920s,
these ratios were exceptionally high, pointing to high rates of return to secondary education just
as the high school movement was spreading.16
The evidence on whether these rates of return
were also high in the nineteenth century is less clear (see Goldin & Katz, 2008, chap. 4).
The first national U.S. census to ask years of completed schooling was in 1940. A few
state censuses contained questions on education and the best of these was done in Iowa. The
Iowa state census of 1915 contains rich information on education and earnings for the precise
period when greater education was exceptionally valuable in the factory, the counting house and
even the farm.
A set of individual-level earnings functions, as provided in Table 2, reveals that years of
high school greatly mattered at the start of the high school movement. The pecuniary return to
each year of high school, for 18 to 34 year olds, was around 12 percent. The return to more
education was experienced even within blue collar and farming occupations and was not just
because of a shift in the educated population to the white collar sector.
In places that did not have public secondary schools, some youths remained in the
common schools for more years. But additional years in the common schools was far less
valuable than years in an actual secondary school that could provide instruction in a host of
separate disciplines and that could endow youths with various skills.17
Technological changes
16
Goldin and Katz (2008), chapters 4 and 5. 17
This result is given in Goldin and Katz (2008), table 2.5.

Claudia Goldin, Human Capital 2/23/2014 -16-
were occurring in many of the economy’s sectors and education was a complement to it in 1915,
as it is today.
The virtues of education discussed earlier also impacted the spread of higher education in
the United States. U.S. higher education was academic yet practical. The enormous number of
higher education institutions in the United States produced enormous variety and competition
among schools for students and faculty. In 1900, England had just one-seventeenth the numbers
of higher education institutions per capita. And even in 1950, England had one-eighth the
numbers per capita that existed in the United States.
U.S. higher education was relatively open and forgiving, just as was the case for the
lower grades. Students who did not do well enough in high school to enter a university could go
to a community college and then transfer to a better institution. The institutions of higher
education were geographically close to the people, enabling even rural families to send their
children to college. The outcome was that sometime in the twentieth century American colleges
and universities became the finest in the world.18
F. Race between Education and Technology
The rate of return to secondary school was high in the period just preceding the high
school movement. As secondary school enrollment and graduation increased, the high school
premium, meaning the return to graduating high school relative to eighth grade, plummeted.
Because the high school movement shifted some individuals into the college ranks and
since there was some substitution of the skills of high school graduates for those of the college
educated, the premium to college relative to high school also fell. By the 1950s the wage
distribution was far more compressed than it was in the 1910s and 1920s (Goldin & Margo,
1992).
But the relative demand for skilled and educated workers continued to advance. The
college premium rose in the 1970s and it has continued to increase. The premium to a year of
education today, as seen in Figure 8, is even somewhat higher than it was in 1910 at the dawn of
the high school movement.
The point is that ever since the late nineteenth century at the latest, there has been a race
between education, on the one hand, and technology, on the other. That is, there is a race
between the supply of skills and the demand for skills with the return to education as the
equilibrating price. When the return is high, the supply of new skills will be greater and when it
is low, the supply of new skills will be smaller.
18
For a discussion of higher education in the United States, see Goldin and Katz (1999, 2008).

Claudia Goldin, Human Capital 2/23/2014 -17-
New technologies increase the demand for superior skills. The technologies of the late
nineteenth and early twentieth centuries increased the demand for workers who could read
blueprints, knew a bit about electricity, were numerate and sufficiently literate to type from
scribbled notes and hastily dictated letters. Technological advances throughout the last century
increased demands for yet more human capital.
The large increase in the rate of return to education and training in the United States
during the last several decades occurred largely because the supply of human capital did not
increase sufficiently not because the demand for skills accelerated (Goldin & Katz, 2008). But
the supply of human capital has recently begun to increase again.
G. Human Capital and Education: Concluding Remarks
Human capital, in the form of schooling embodied in the labor force, increased in the
United States from the beginnings of the nation. It greatly changed in content as the demands for
skills in the economy shifted. The increase in years of schooling from the nineteenth century
was fairly continuous until the past three decades when it slowed down. The increase followed
the three transformations and was often a grass roots movement with the cooperation of
communities, states and, at times, the federal government. Compulsion had little effect in the
United States but had a greater impact in other nations where it often constrained governments to
build and maintain schools.
The several virtues of education discussed previously aided the spread of human capital
in terms of years of education. But, in recent decades, these characteristics may have slowed
progress particularly in terms of the quality of education. Publicly-funded education by small,
fiscally independent districts increased years of education but produced large differences in per
student resources. An open and forgiving system helped spread education to the masses but such
a system often has few promotion and graduation standards at even the state level. Many of
these defects of the initial virtues are currently being reassessed by states and by the federal
government.19
IV. Producing Human Capital: Health
A. Health Human Capital and Income
In 1650 Thomas Hobbes famously wrote in the Leviathan that life was “[solitary], nasty,
brutish, and short.” He meant that without strong government, civil society would disintegrate
19
For example, state equalization plans have restricted the degree to which separate districts can raise
funds and states have transferred resources to poorer districts. States have passed more stringent high
school graduation standards and “No Child Left Behind,” passed in 2002, has forced states to have higher
standards at all grades.
Claudia Goldin, Human Capital 2/23/2014 -18-
into war of every man against every man. But in 1650 life was “nasty, brutish, and short,” with
or without strong government. It was filled with infectious disease and pestilential maladies.
And people really were “short.” They were five inches shorter in Great Britain and France than
today and seven inches shorter in Denmark than currently.
People eventually became healthier and taller. They live a lot longer now and have less
nasty lives with less pain and suffering. People now die mainly of chronic diseases, far less from
infectious maladies. During the period from the 1600s to the present, the human body changed
in a multitude of ways and in a time frame that defies the usual rules of Darwinian evolution.
Increased resources allow people to invest more in their health human capital. But, in
addition, more health human capital allows people to be more productive. In the discussion that
follows, the causation will mainly go from increased resources to advances in health human
capital. There is also an important historical literature in which the causation goes from
improvements in health to increases in income.
Improvements to health for most of history are the result of increased resources, not the
cause. More resources allow people to consume more calories and protein and to eat more
nutritious foods. Investments in improved nutrition enhance health human capital.
For the more recent historical period, however, health improvements have served to
increase income. The channel is generally through improvements in health for the young that
enable children to attend school for more days and to learn more. Bleakley (2007) shows the
effect for hookworm eradication in the U.S. South in the early twentieth century. Almond (2006)
investigates the long-term consequences of the 1918 influenza epidemic for those in utero at the
time. Health improvements also allow adults to work more days and years over their lifetime
and to labor more intensively. The direction of causality here is from an exogenous
improvement in health human capital to income.20
B. Measures of Health Human Capital
Mortality is the clearest indicator of health status and one that exists across long periods
and for many places. A large number of related measures of health exist historically. Heights
and weights for adults and for children during the growth spurt, infant weights, body mass index
(BMI), and chronic and infectious disease rates also exist historically. Quality of life measures
generally do not.
Expectation of life at birth is given in Figure 9 for four European nations from the
eighteenth century to the present and in Figure 10 for white males and white females separately
for the United States from the mid-nineteenth century. Life spans at birth were not very long in
20
See Weil (2007) for a clever way to separate the effects of health on income from the reverse causality.
Claudia Goldin, Human Capital 2/23/2014 -19-
much of Europe until the mid-twentieth century. The average citizen of France in the late
eighteenth century had a life expectation that was less than 30 years at birth and an individual in
Sweden or Germany could expect a lifetime at birth of less than 40 years. Even by 1900 a
German or French baby could expect to live to just 40 years or so and one in Sweden, Demark,
or the United States to 50 years. But by 1980 all life expectations at birth converged to around
75 to 80 years old.
Much of the rise in life expectation to the mid-twentieth century in these nations was due
to the decrease in infant and child mortality since life expectation conditional on reaching
adulthood does not change much until fairly modern periods. That fact can be seen in Figure 10
for white males and females in the United States. The largest decrease in infant and child
mortality occurred from around 1880 to 1920s, although decreases continued.
Life expectation conditional on reaching age 40 changes little until the early-twentieth
century when it slowly begins to increase. But from the mid-twentieth century onward the
increase in life expectation was primarily from decreased mortality conditional on reaching
adulthood. Expectation of life at age 40 increases and the distance between it and life-
expectation at birth changes far less than it had up to that point.
Americans lived longer relative to those in other rich countries to mid-nineteenth century.
Relative to the English, life expectation at birth before 1850 was better in United States. But
post-1850, life-expectations for the two populations were about the same. Relative to France, the
expectation of life at birth was better in United States to around 1900. Americans were
abundantly well nourished at least from the start of the nation and were the tallest people in the
world to the mid to late-twentieth century (Floud et al. 2011).
In the United States from 1800 to 2000, there was a gain of about 35 years, 40 to 74 years
for men and 44 to 80 for women. In England from 1750 to 2000, there was a gain of 38 years
from 35 to 77 years. In France from 1750 to 2000, the gain in life expectation was 43 years, 25
to 78 years. The increase in life expectation in each of the countries can be divided into three
phases. The first concerns improvements in nutrition, the second involves improvements in
public health interventions and the third phase encompasses a host of medical discoveries such as
antibiotics.
C. Increased Life Expectation: The Three Historical Phases
(1) Phase I: Improvements in Nutrition
Phase I, described by Fogel (2004) as the escape from hunger and malnutrition in Europe,
occurred from 1700 to the late nineteenth century.21
Fogel and his coauthors have emphasized
21
The division among the three phases is the author’s, not necessarily that of the various contributors to
the literature.
Claudia Goldin, Human Capital 2/23/2014 -20-
that increased income produced better nutrition and that better health, as children and as adults,
allowed the population to fight off infectious disease (Fogel 1997, 2004; Floud et al. 2011).
The notion that health status improved around 1700 because of a marked decrease in
chronic malnutrition goes back to Thomas McKeown, a medical historian who wrote The
Modern Rise of Population (1976). McKeown’s goal was to eliminate from consideration two
competing factors—public health and medical treatments.
Fogel extended McKeown and gave his ideas considerable force. Fogel noted that before
1700 chronic malnutrition, not crisis-year famine, was an ever-present problem that limited the
health of the population. Sometime around 1700 the second agricultural revolution with its
enclosures, plough, seed drill, threshing machine, crop rotation and selective breeding, brought
about a marked increase in caloric intake. In England, for example, calories per capita increased
by 300 and in France by a whopping 1,000 in the century after 1750.
Nutrition not only allowed populations to be healthier. More calories also led, over
generations, to changes in the human body. Greater food consumption first brought about
heavier adults and then produced taller people. The upshot was a higher BMI, healthier
individuals, and decreased mortality.
The interpretations offered by Fogel and McKeown have been criticized by Preston
(1975, 1996) who notes that the disease environment worsened when urban populations polluted
their drinking water, were more distant from food sources and lived in packed quarters. Some of
the overall gain in health status that would have been achieved from increased resources was
clearly eaten away by increased population. But much remained that led to an increase in
weights, heights and lifespan.
(2) Phase II: Public Health Interventions
The next period, Phase II, occurred from the late nineteenth century to the 1930s and was
characterized by public health campaigns and interventions. The era could only have begun in
the late nineteenth century because of the necessity for the “how” of disease to be discovered and
for scientific discoveries concerning the germ theory of disease to be widely accepted.
Little could be accomplished before the understanding of the germ theory of disease.
And even after the mechanism for infectious disease was known, water filtration, chlorination,
proper sewerage disposal, vaccination, quarantine and food quality regulations had to await
public measures and expenditures. Thus greater public acceptance of the channel through which
disease spread was essential. Without that municipalities could not have gained the support to
spend large sums on projects to provide clean water and to separate sewage from drinking water.
Claudia Goldin, Human Capital 2/23/2014 -21-
The mode of disease transmission began to be discovered around 1850 by Semmelweiss
who observed that puerperal fever decreased when physicians washed their hands using
chlorinated lime. The precise causal agents were not known until around 1870s, first with
anthrax, then typhoid and tuberculosis. Robert Koch’s work on anthrax in the 1870s proved the
germ theory. The foundations had been set by Leeuwenhoek (1600s) who first saw the germs,
Pasteur (1860s) who discovered the bacterial basis of decay in foods and later the cause of
disease in living organisms, and Lister (1860s, 1870s) who used carbolic acid as an anti-septic in
surgery. The understanding of the causal agents was later advanced by Paul Ehrlich known for
using Salvarsan chemotherapy, also known as the “Magic Bullet,” to treat syphilis.
In the case of the United States, Cutler and Miller (2005) have demonstrated the impact
of cleaner water on the decrease in infectious disease, particularly typhoid. They estimate the
“treatment” effect of filtration and chlorination for 13 cities using plausibly exogenous variation.
According to their estimates, water filtration and chlorine treatment account for half of reduced
urban mortality in the period.
Some cities (e.g., Philadelphia; Pittsburgh) experienced large effects but the impacts were
small or non-existent in other cities. Across all cities, filtration and chlorination reduced typhoid
fever mortality by 25 percent, total mortality by 13 percent, infant mortality by 46 percent and
child mortality by 50 percent. Since total mortality declined by 30 percent, clean water
accounted for 43 percent of the total, 74 percent of the reduction in infant mortality, and the
complete elimination of typhoid (all from 1900 to 1936). The rates of return to investments in
clean water technologies were huge.
Life expectation in the United States during the period of public health interventions
increased from 45 years to 62 years or by 50 percent of the total change experienced from 1850
to 2000. No other period is as great. Most of the decrease in the period came from the reduction
in infectious disease as a cause of death. The period also saw the elimination of the “urban
health penalty.”22
(3) Phase III: The Age of Modern Medicine
The third phase began with the introduction of Sulfa drugs in 1935. It was preceded by
other medical advances such as the small pox vaccine and Salvarsan, an arsenic compound to
treat syphilis. The first antibiotics, penicillin in 1941 and streptomycin in 1944, were followed
by a multitude of broad spectrum drugs and anti-virals.
Jayachandran, Lleras-Muney and Smith (2010) show that from 1937 to 1943, before the
discovery and diffusion of penicillin, substantial decreases occurred in deaths from infectious
diseases such as scarlet fever, pneumonia, and flu. Maternal mortality, in particular, decreased
22
On the changing relationship between health and economic development, see Preston (1975).
Claudia Goldin, Human Capital 2/23/2014 -22-
considerably. The reason for the decline in particular infectious diseases was because of the
discovery of Sulfa drugs, the precursor to antibiotics.
Infectious diseases were responsible in 1900 for 30 percent of all deaths in the United
States but just 17.5 percent in 1936, and only 4 percent in 2000.23
A combination of public
health measures and modern medicines has all but eliminated infectious disease as a cause of
death. Not only have lifespans been lengthened, a host of modern medical procedures and
medications have improved the quality of the years remaining.
In sum, the majority of the gains in longevity in the United States and elsewhere in the
rich world came about before the spread of modern medicine. But modern medicine is probably
responsible for most of the increase from 65 to 75 or 80 years in the expected age at death from
1936 to 2000 for U.S. men and women. And because of modern medicines and treatments,
chronic disease no longer incapacitates large numbers of individuals in their older years.
V. Human Capital: Summary
Human capital is the stock of productive skills, talents, health and expertise of the labor
force, just as physical capital is the stock of plant, equipment, machines, and tools. Within each
type of capital the performance, vintage and efficiency can vary. The stocks of human and
physical capital are produced through a set of investment decisions, where the investment is
costly in terms of direct costs and, for human capital investment, in terms of the opportunity cost
of the individual’s time.
In this essay I have explored human capital in terms of its use and production. Human
capital (E) enters the aggregate production function given by eq. (2) by augmenting labor, which
is a function of the level of population (P) and the aggregate labor force participation rate (λ). In
practice, human capital is measured as an index of efficiency units of labor. Aggregate output
(Q) is altered as well by other inputs such as the stock of capital (K), resources (X), and the level
of technology (A).
( ) ( [ ] )
This methodology was employed to understand how human capital affects income levels
and economic growth. I mentioned that individual wellbeing could also be impacted in ways that
do not necessarily get reflected in aggregate output. Quality of life measures, as they are called,
have become an important research area but are difficult to produce historically.
This essay has discussed how human capital is augmented and the rules that are often
employed in making human capital investment decisions. Two main types of human capital
23
See Cutler, Deaton & Lleras-Muney (2006), figure 3 for U.S. data and Floud, et al. (2011), figure 4.5
for England and Wales.
Claudia Goldin, Human Capital 2/23/2014 -23-
have been considered here—education and training, and health. Both are produced in schools,
families, firms, and a variety of other facilities. Both types of investments require good
information. Knowledge regarding the cause of disease was important in making investments in
health human capital, particularly expensive ones determined by governments, such as water
purification. Information regarding the effectiveness of education is required for public
investments in schools.
This essay has not emphasized the forces that alter population growth and labor force
participation, both of which are related to aggregate measures of human capital. These subjects
are covered in other essays, as is the effective use of human capital that can be hampered by
discrimination and insufficient geographic mobility.
I have stressed that the subject of human capital is inherently historical. There is much
that remains to be explored historically. Why do governments expand formal schooling and why
is informal training more important in certain places and during certain periods? What has been
the interplay between grass roots demands for schooling and top-down provision of education?
What is the interaction between education and health? Currently, more educated people are
healthier. But has that always been the case? The history of schooling across the globe,
particularly outside Europe and North America, is still in its infancy. The list of questions and
topics in the study of human capital and history is long.
Claudia Goldin, Human Capital 2/23/2014 -24-
References
Acemoglu, Daron, Simon Johnson and James Robinson (2002) “Reversal of Fortune: Geography
and Institutions in the Making of the Modern World Income Distribution,” Quarterly
Journal of Economics 117: 1231-294.
Allen Robert (2001) “The Great Divergence in European Wages and Prices from the Middle
Ages to the First World War,” Explorations in Economic History 38: 411-47.
Almond, Douglas (2006) “Is the 1918 Influenza Pandemic Over? Long-term Effects of In Utero
Influenza Exposure in the Post-1940 U.S. Population,” Journal of Political Economy 114:
672-712.
Barro, Robert and Xavier Sala-i-Martin (2003) Economic Growth, Second Edition. Cambridge,
MA: MIT Press.
Becker, Gary (1962) “Investment in Human Capital: A Theoretical Analysis,” NBER Special
Conference 15, supplement to Journal of Political Economy 70, Issue 5, part 2: 9-49.
Becker, Gary (1964) Human Capital: A Theoretical and Empirical Analysis, with Special
Reference to Education. Cambridge, MA: Harvard University Press.
Bleakley, Hoyt (2007) “Disease and Development: Evidence from Hookworm Eradication in the
American South,” Quarterly Journal of Economics 122: 73-117.
Card, David (1999) “The Causal Effect of Education on Earnings.” In Orley Ashenfelter and
David Card, eds., Handbook of Labor Economics, vol. 3A. Amsterdam: Elsevier North
Holland.
Card, David and Alan Krueger (1992a) “School Quality and Black-White Relative Earnings: A
Direct Assessment,” Quarterly Journal of Economics 107: 151-200.
Card, David and Alan Krueger (1992b) “Does School Quality Matter? Returns to Education and
Characteristics of Public Schools in the United States,” Journal of Political Economy 100:
1-40.
Carter, Susan B., Scott S. Gartner, Michael R. Haines, Alan L. Olmstead, Richard Sutch, and
Gavin Wright (2006) Historical Statistics of the United States, Millennial Edition.
Cambridge: Cambridge University Press.
Clark, Gregory (2005) “The Condition of the Working-Class in England, 1209-2004,” Journal
of Political Economy 113: 1307-340.
Claudia Goldin, Human Capital 2/23/2014 -25-
Clark, Gregory (2007a) A Farewell to Alms: A Brief Economic History of the World. Princeton,
NJ: Princeton Press.
Clark, Gregory (2007b) “The Long March of History: Farm Wages, Population and Economic
Growth, England 1209-1869,” Economic History Review, 60: 97-136.
Clark, Gregory (2009) “The Macroeconomic Aggregates for England, 1209-2008.” University
of California, Davis, Economics WP 09-19.
Cutler, David, Angus Deaton and Adriana Lleras-Muney (2006) “The Determinants of
Mortality,” Journal of Economic Perspectives 20: 97-120.
Cutler, David and Grant Miller (2005) “The Role of Public Health Improvements in Health
Advances: The Twentieth-Century United States,” Demography 42 (February): 1-22.
Davis, Lance E., Richard A. Easterlin, William N. Parker, et al. (1972) American Economic
Growth: An Economist’s History of the United States. New York: Harper and Row.
Denison, Edward F. (1962) The Sources of Economic Growth in the United States and the
Alternatives before Us. New York: Committee for Economic Development.
Easterlin, Richard (1981) “Why Isn’t the Whole World Developed?” Journal of Economic
History 51: 1-19.
Engerman, Stanley L. and Kenneth L. Sokoloff (2012) Economic Development in the Americas
since 1500: Endowments and Institutions. Cambridge: Cambridge University Press.
Epple, Dennis and Richard E. Romano (1996) “Ends Against the Middle: Determining Public
Service Provision When There Are Private Alternatives,” Journal of Public Economics 62:
297-25.
Fisher, Irving (1897) “Senses of ‘Capital’,” The Economic Journal 7: 199-213.
Floud, Roderick, Robert W. Fogel, Bernard Harris, and Sok Chul Hong (2011) The Changing
Body: Health, Nutrition, and Human Development in the Western World since 1700.
Cambridge: Cambridge University Press.
Fogel, Robert W. (1989) Without Consent or Contract. New York: W.W. Norton.
Fogel, Robert W. (1997) “New Findings on Secular Trends in Nutrition and Mortality: Some
Implications for Population Theory.” In M. R. Rosenzweig and O. Stark, eds., Handbook of
Population and Family Economics. Amsterdam: Elsevier North Holland: 433-81.
Claudia Goldin, Human Capital 2/23/2014 -26-
Fogel, Robert W. (2004) The Escape from Hunger and Premature Death: 1700-2100: Europe,
America, and the Third World. Cambridge Studies in Population, Economy and Society in
Past Time. Cambridge: Cambridge University Press.
Galenson, David (1984) “The Rise and Fall of Indentured Servitude in the Americas: An
Economic Analysis,” Journal of Economic History 44: 1-26.
Galor, Oded (2011) Unified Growth Theory. Princeton, NJ: Princeton University Press.
Galor, Oded and David Weil (2000) “Population, Technology, and Growth: From the Malthusian
Regime to the Demographic Transition,” American Economic Review 90: 806-28.
Goldin, Claudia (1976) Urban Slavery in the American South, 1820 to 1860: A Quantitative
History. Chicago, IL: University of Chicago Press.
Goldin, Claudia (2001) “The Human Capital Century and American Leadership: Virtues of the
Past,” Journal of Economic History 61: 263-91.
Goldin, Claudia and Lawrence F. Katz (1999) “The Shaping of Higher Education: The
Formative Years in the United States, 1890 to 1940,” Journal of Economic Perspectives 13:
37-62.
Goldin, Claudia, and Lawrence F. Katz (2008) The Race between Education and Technology.
Cambridge, MA: Belknap Press.
Goldin, Claudia and Lawrence F. Katz (2011a) “Putting the ‘Co’ in Education: Timing, Reasons,
and Consequences of College Coeducation from 1835 to the Present,” Journal of Human
Capital 5: 377-417.
Goldin, Claudia and Lawrence F. Katz (2011b) “Mass Education and the State: The Role of State
Compulsion in the High School Movement.” In Dora Costa and Naomi Lamoreaux, eds.,
Understanding Long Run Economic Growth. Chicago, IL: University of Chicago Press:
275-311.
Goldin, Claudia and Robert A. Margo (1992) “The Great Compression: The Wage Structure in
the United States at Mid-Century,” Quarterly Journal of Economics 107: 1-34.
Jayachandran, Seema, Adriana Lleras-Muney and Kimberly V. Smith (2010) “Modern Medicine
and the Twentieth Century Decline in Mortality: New Evidence on the Impact of Sulfa
Drugs,” American Economic Journal: Applied 2: 118-46.
Claudia Goldin, Human Capital 2/23/2014 -27-
Jones, Charles I. and Paul Romer (2010) “The New Kaldor Facts: Ideas, Institutions, Population,
and Human Capital,” American Economic Journal: Macro 2: 224-45.
Kremer, Michael (1993) “Population Growth and Technological Change: One Million B.C. to
1990,” Quarterly Journal of Economics 108: 681-71.
Lindert, Peter (2004a) Growing Public: Social Spending and Economic Growth since the
Eighteenth Century. Volume 1, The Story. Cambridge: Cambridge University Press.
Lindert, Peter (2004b) Growing Public: Social Spending and Economic Growth since the
Eighteenth Century. Volume 2, Further Evidence. Cambridge: Cambridge University Press.
Mankiw, Gregory, David Romer, and David Weil (1992) “A Contribution to the Empirics of
Economic Growth,” Quarterly Journal of Economics 107: 407-38.
McKeown, Thomas (1976) The Modern Rise of Population. New York: Academic Press.
Mincer, Jacob (1958) “Investment in Human Capital and Personal Income Distribution,”
Journal of Political Economy 66: 281-302.
Mokyr, Joel (2004) Gifts of Athena: Historical Origins of the Knowledge Economy. Princeton,
NJ: Princeton University Press.
Preston, Samuel H. (1975) “The Changing Relation between Mortality and Level of Economic
Development,” Population Studies 29: 231-48.
Preston, Samuel H. (1996) “American Longevity, Past, Present, and Future.” Policy Brief No.
7. Center for Policy Research. Maxwell School, Syracuse University.
Schultz, Theodore W. (1961) “Investment in Human Capital,” American Economic Review 51:
1-17.
Smith, Adam. (1776) An Inquiry into the Nature and Causes of the Wealth of Nations, Book 2.
Sokoloff, Kenneth L. and Stanley L. Engerman (2000) “History Lessons: Institutions, Factor
Endowments, and Paths of Development in the New World,” Journal of Economic
Perspectives 14: 217-32.
Solow, Robert (1957) “Technical Change and the Aggregate Production Function,” Review of
Economics and Statistics 39: 312-20

Claudia Goldin, Human Capital 2/23/2014 -28-
Weil, David (2007) “Accounting for the Effect of Health on Economic Growth,” Quarterly
Journal of Economics 122: 1265-306.
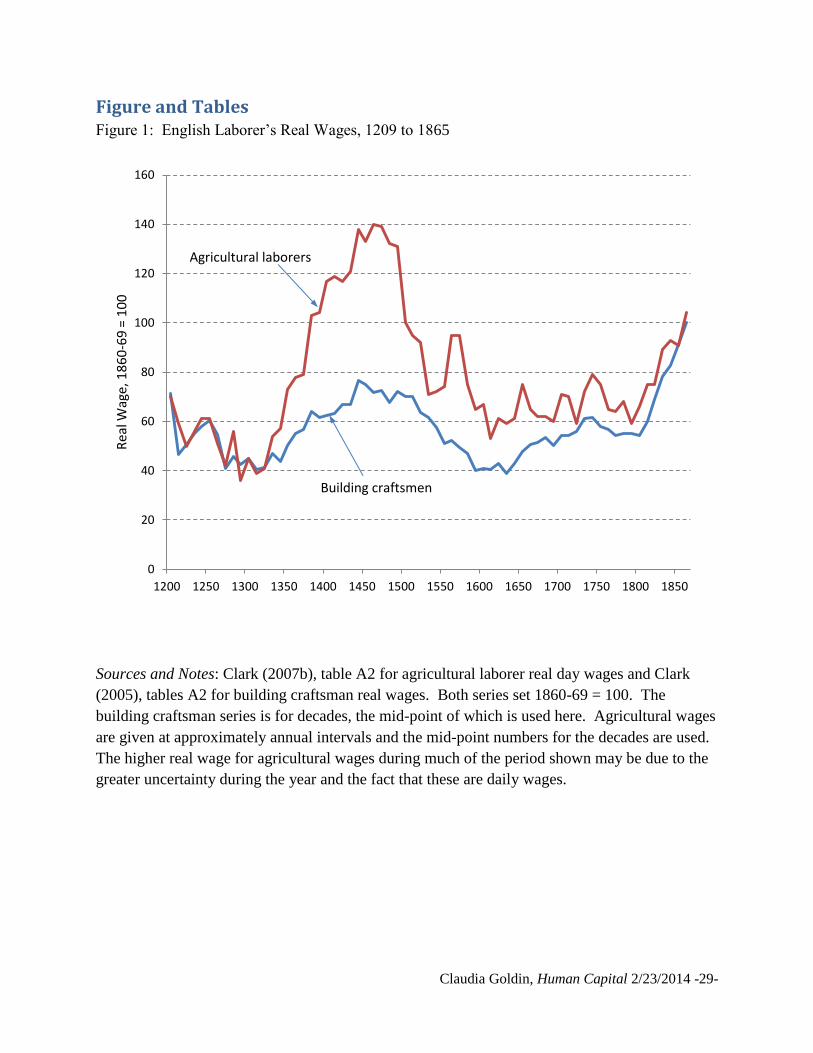
Claudia Goldin, Human Capital 2/23/2014 -29-
Figure and Tables Figure 1: English Laborer’s Real Wages, 1209 to 1865
Sources and Notes: Clark (2007b), table A2 for agricultural laborer real day wages and Clark
(2005), tables A2 for building craftsman real wages. Both series set 1860-69 = 100. The
building craftsman series is for decades, the mid-point of which is used here. Agricultural wages
are given at approximately annual intervals and the mid-point numbers for the decades are used.
The higher real wage for agricultural wages during much of the period shown may be due to the
greater uncertainty during the year and the fact that these are daily wages.
0
20
40
60
80
100
120
140
160
1200 1250 1300 1350 1400 1450 1500 1550 1600 1650 1700 1750 1800 1850
Rea
l Wag
e, 1
86
0-6
9 =
10
0
Agricultural laborers
Building craftsmen
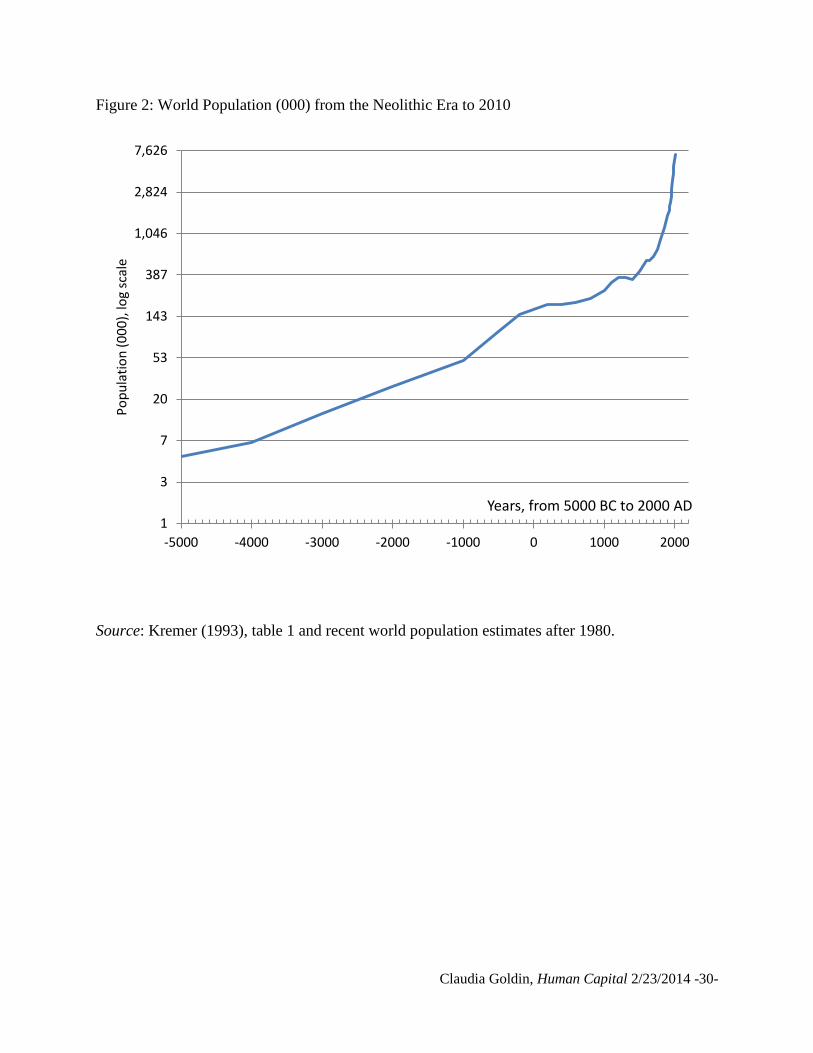
Claudia Goldin, Human Capital 2/23/2014 -30-
Figure 2: World Population (000) from the Neolithic Era to 2010
Source: Kremer (1993), table 1 and recent world population estimates after 1980.
1
3
7
20
53
143
387
1,046
2,824
7,626
-5000 -4000 -3000 -2000 -1000 0 1000 2000
Po
pu
lati
on
(0
00
), lo
g sc
ale
Years, from 5000 BC to 2000 AD
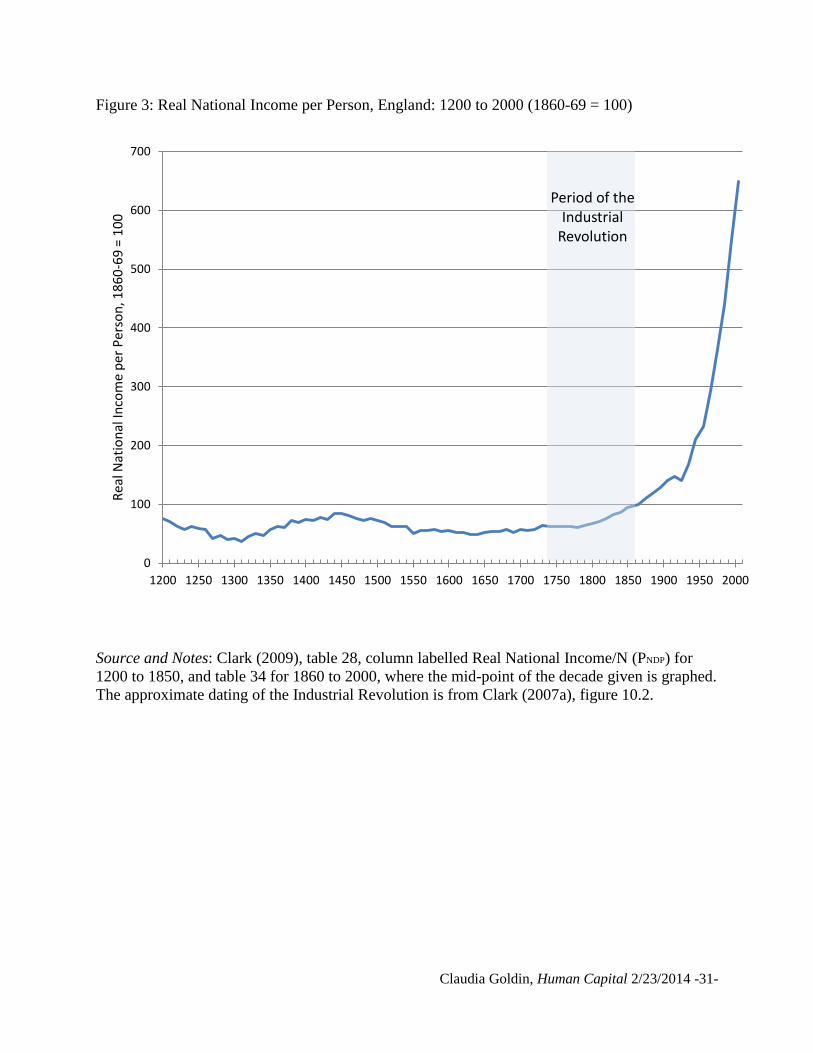
Claudia Goldin, Human Capital 2/23/2014 -31-
0
100
200
300
400
500
600
700
1200 1250 1300 1350 1400 1450 1500 1550 1600 1650 1700 1750 1800 1850 1900 1950 2000
Rea
l Nat
ion
al In
com
e p
er P
erso
n, 1
86
0-6
9 =
10
0
Figure 3: Real National Income per Person, England: 1200 to 2000 (1860-69 = 100)
Source and Notes: Clark (2009), table 28, column labelled Real National Income/N (PNDP) for
1200 to 1850, and table 34 for 1860 to 2000, where the mid-point of the decade given is graphed.
The approximate dating of the Industrial Revolution is from Clark (2007a), figure 10.2.
Period of the Industrial
Revolution
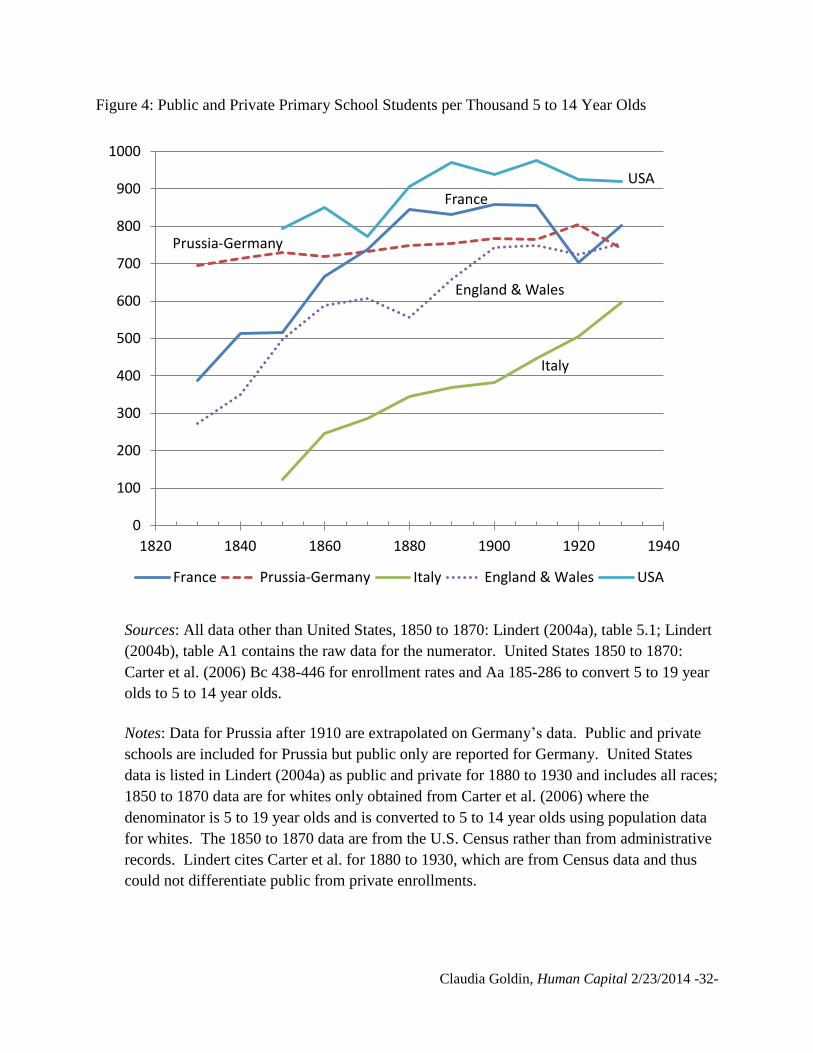
Claudia Goldin, Human Capital 2/23/2014 -32-
Figure 4: Public and Private Primary School Students per Thousand 5 to 14 Year Olds
Sources: All data other than United States, 1850 to 1870: Lindert (2004a), table 5.1; Lindert
(2004b), table A1 contains the raw data for the numerator. United States 1850 to 1870:
Carter et al. (2006) Bc 438-446 for enrollment rates and Aa 185-286 to convert 5 to 19 year
olds to 5 to 14 year olds.
Notes: Data for Prussia after 1910 are extrapolated on Germany’s data. Public and private
schools are included for Prussia but public only are reported for Germany. United States
data is listed in Lindert (2004a) as public and private for 1880 to 1930 and includes all races;
1850 to 1870 data are for whites only obtained from Carter et al. (2006) where the
denominator is 5 to 19 year olds and is converted to 5 to 14 year olds using population data
for whites. The 1850 to 1870 data are from the U.S. Census rather than from administrative
records. Lindert cites Carter et al. for 1880 to 1930, which are from Census data and thus
could not differentiate public from private enrollments.
0
100
200
300
400
500
600
700
800
900
1000
1820 1840 1860 1880 1900 1920 1940
France Prussia-Germany Italy England & Wales USA
USA
France
Prussia-Germany
England & Wales
Italy
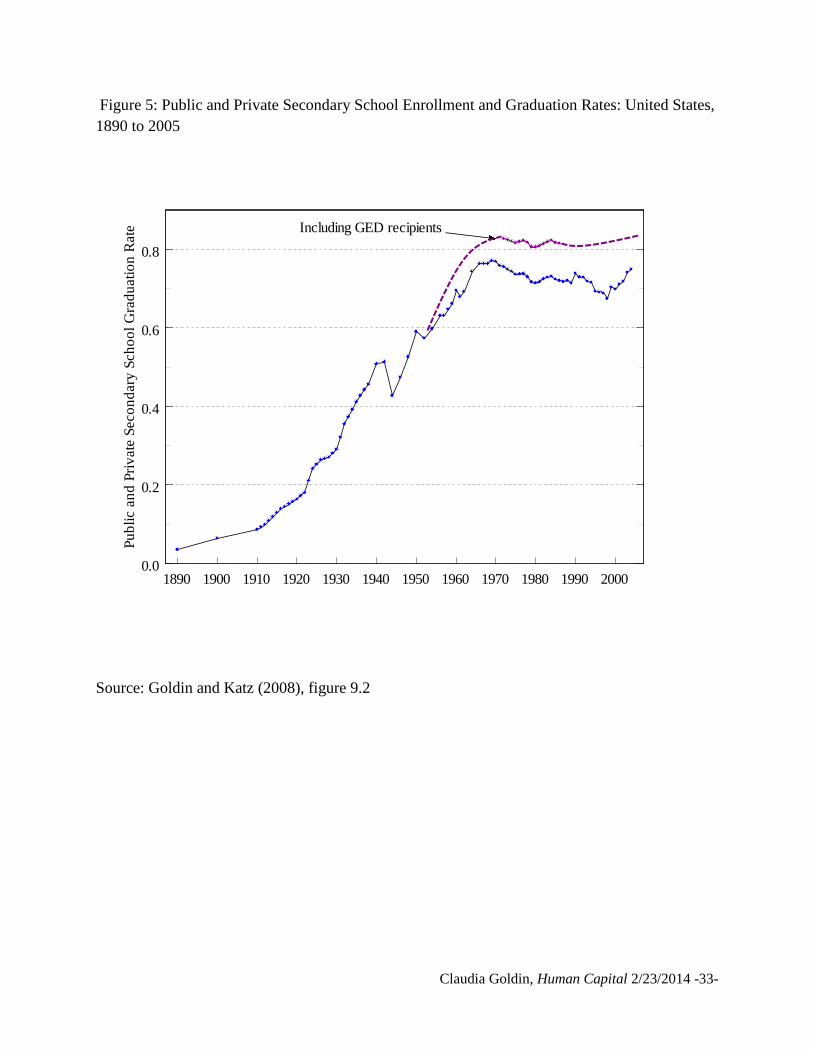
Claudia Goldin, Human Capital 2/23/2014 -33-
Figure 5: Public and Private Secondary School Enrollment and Graduation Rates: United States,
1890 to 2005
Source: Goldin and Katz (2008), figure 9.2
1890 1900 1910 1920 1930 1940 1950 1960 1970 1980 1990 20000.0
0.2
0.4
0.6
0.8
Pu
bli
c a
nd
Pri
vate
Seco
nd
ary
Sch
oo
l G
rad
uati
on
Rate Including GED recipients
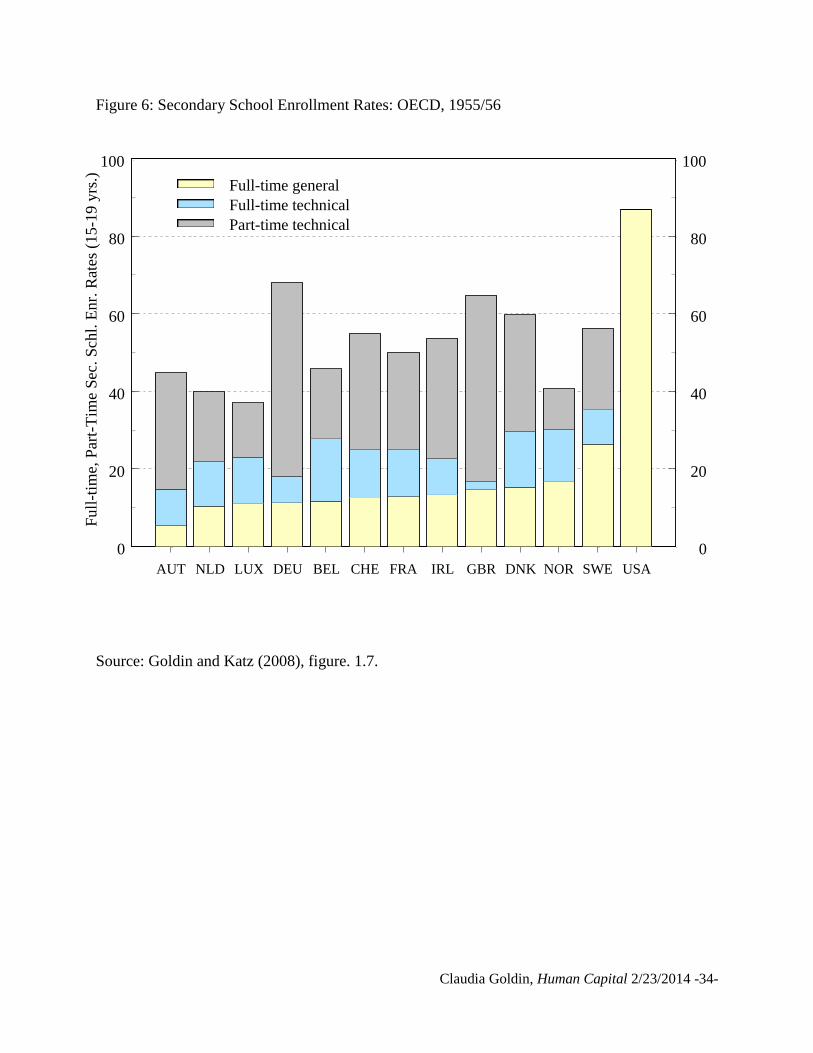
Claudia Goldin, Human Capital 2/23/2014 -34-
AUT NLD LUX DEU BEL CHE FRA IRL GBR DNK NOR SWE USA
0
20
40
60
80
100
0
20
40
60
80
100
Fu
ll-t
ime,
Par
t-T
ime
Sec
. S
chl.
En
r. R
ates
(1
5-1
9 y
rs.)
Full-time general
Full-time technical
Part-time technical
Figure 6: Secondary School Enrollment Rates: OECD, 1955/56
Source: Goldin and Katz (2008), figure. 1.7.
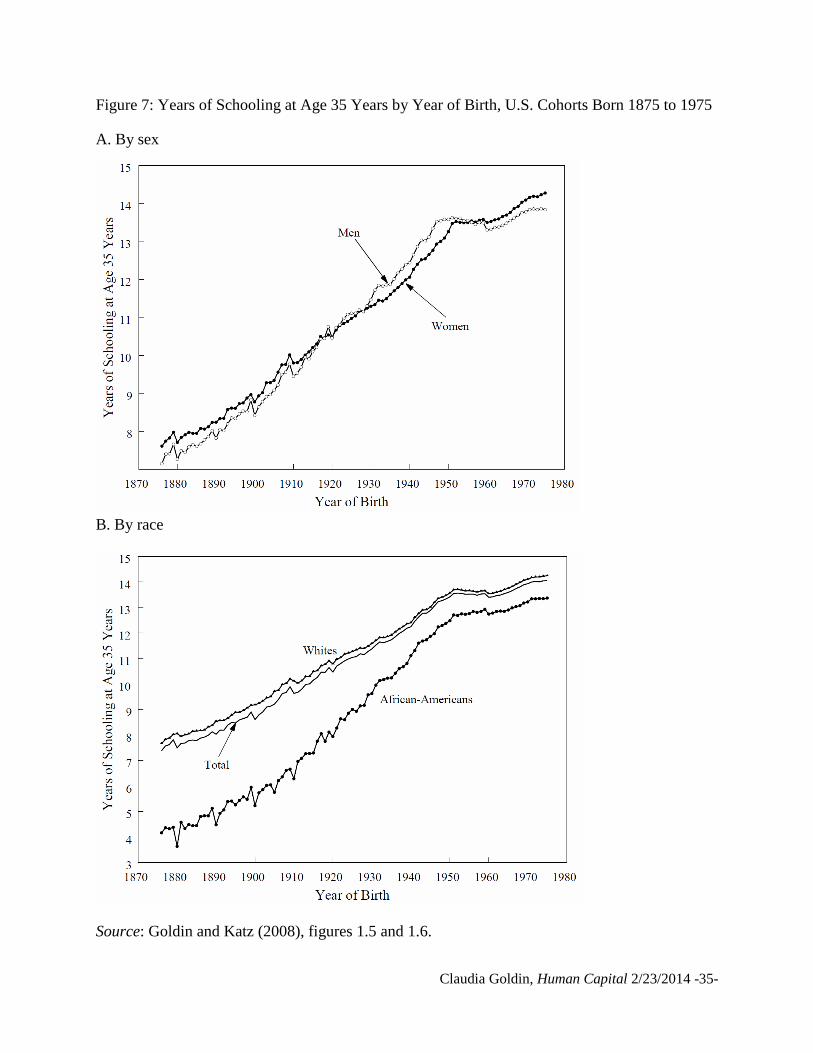
Claudia Goldin, Human Capital 2/23/2014 -35-
Figure 7: Years of Schooling at Age 35 Years by Year of Birth, U.S. Cohorts Born 1875 to 1975
A. By sex
B. By race
Source: Goldin and Katz (2008), figures 1.5 and 1.6.
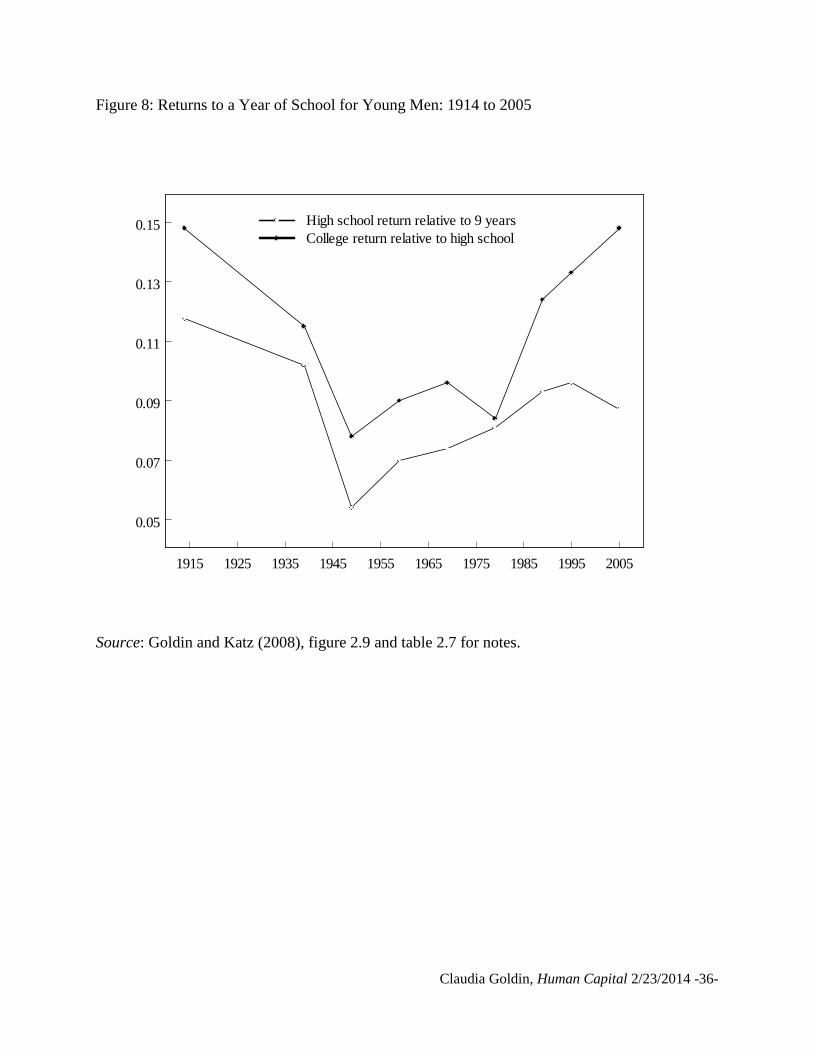
Claudia Goldin, Human Capital 2/23/2014 -36-
Figure 8: Returns to a Year of School for Young Men: 1914 to 2005
Source: Goldin and Katz (2008), figure 2.9 and table 2.7 for notes.
1915 1925 1935 1945 1955 1965 1975 1985 1995 2005
0.05
0.07
0.09
0.11
0.13
0.15 High school return relative to 9 years
College return relative to high school
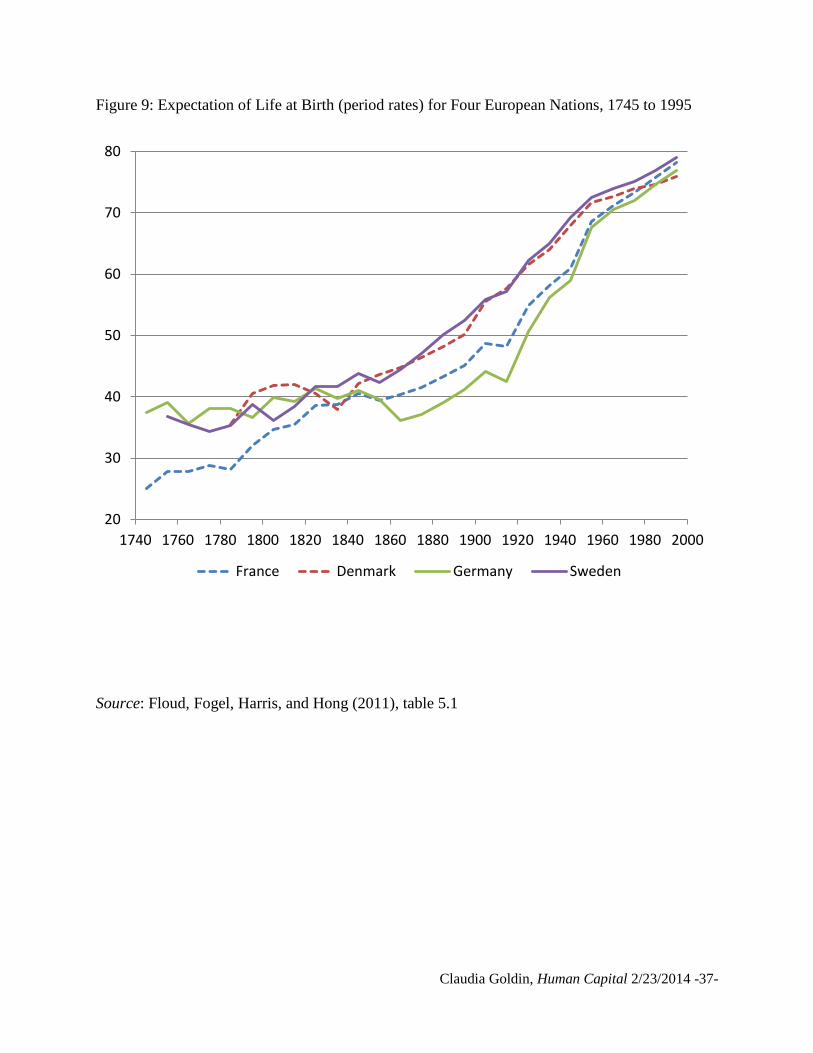
Claudia Goldin, Human Capital 2/23/2014 -37-
Figure 9: Expectation of Life at Birth (period rates) for Four European Nations, 1745 to 1995
Source: Floud, Fogel, Harris, and Hong (2011), table 5.1
20
30
40
50
60
70
80
1740 1760 1780 1800 1820 1840 1860 1880 1900 1920 1940 1960 1980 2000
France Denmark Germany Sweden
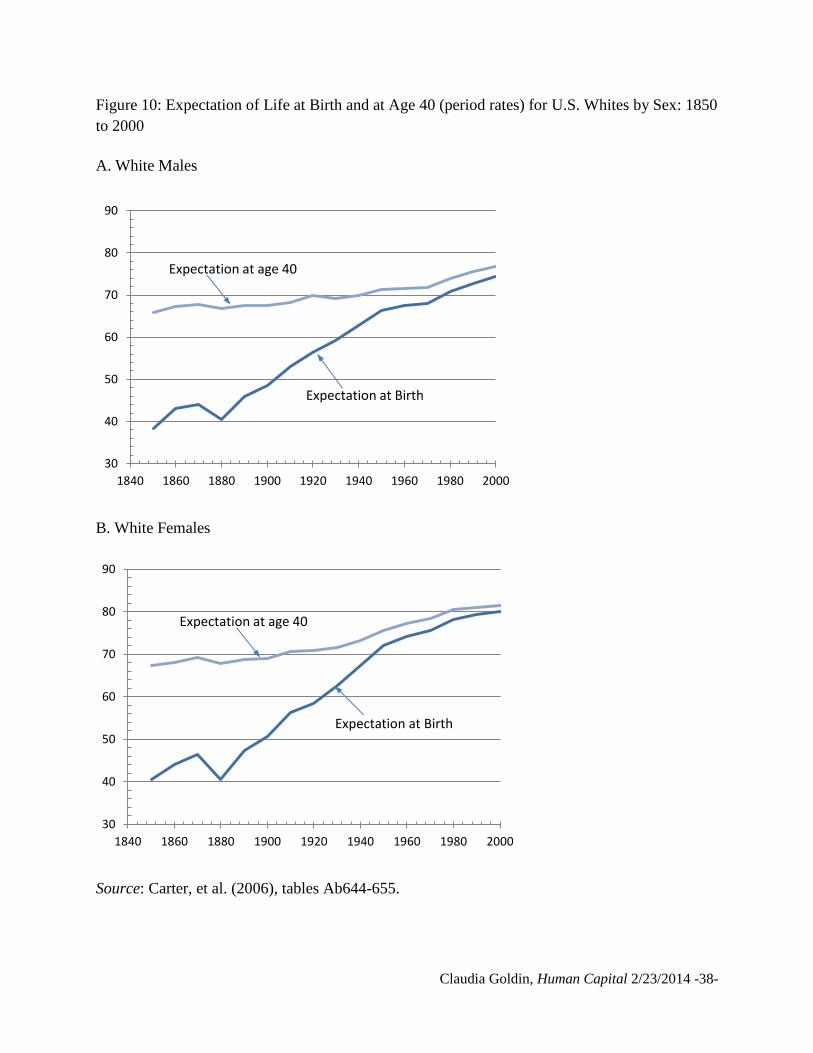
Claudia Goldin, Human Capital 2/23/2014 -38-
Figure 10: Expectation of Life at Birth and at Age 40 (period rates) for U.S. Whites by Sex: 1850
to 2000
A. White Males
B. White Females
Source: Carter, et al. (2006), tables Ab644-655.
30
40
50
60
70
80
90
1840 1860 1880 1900 1920 1940 1960 1980 2000
Expectation at age 40
Expectation at Birth
30
40
50
60
70
80
90
1840 1860 1880 1900 1920 1940 1960 1980 2000
Expectation at age 40
Expectation at Birth

Claudia Goldin, Human Capital 2/23/2014 -39-
Table 1: Private versus public provision and funding of K-12 schooling
Provision
Funding Public Private
Public Public schools (also
called common schools,
graded or grammar
schools, high schools)
Vouchers (U.S., Sweden
21st century)
Pauper schools (U.S. 19th
century)
Private Rate-bills (early to mid-
19th
century U.S.)
Tuition bills (early 20th
century)
Private schools (any
century)
Academies (U.S. 19th
century)
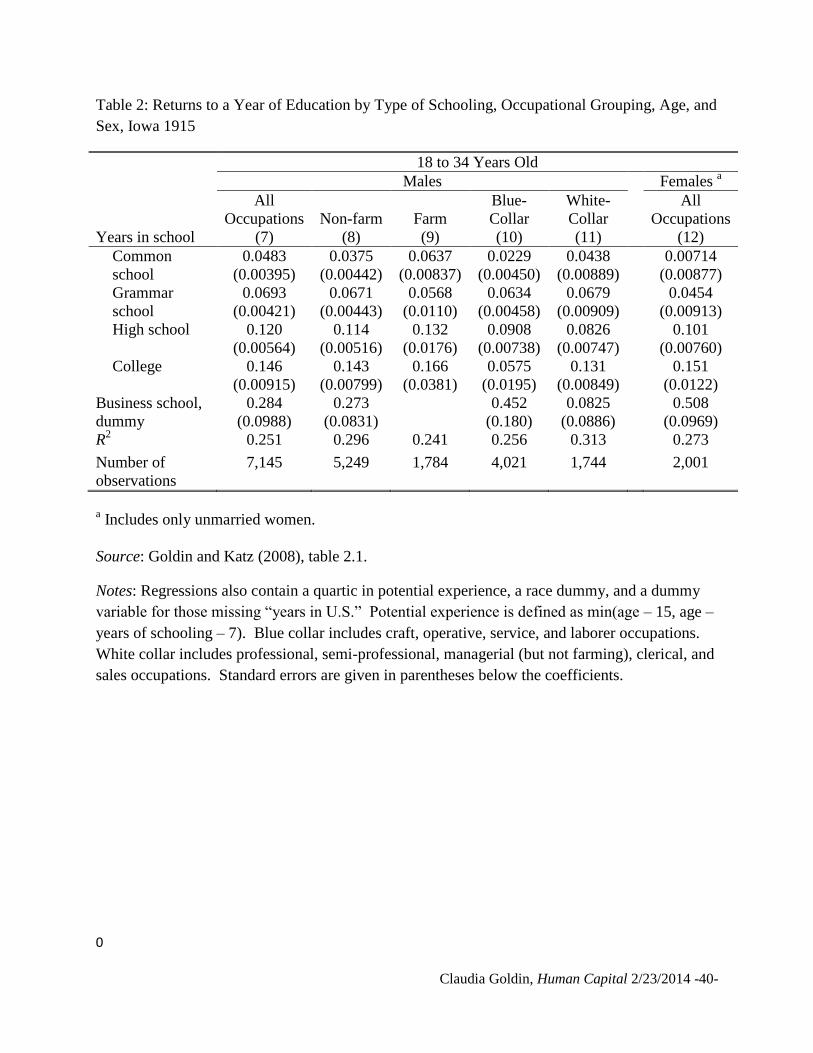
Claudia Goldin, Human Capital 2/23/2014 -40-
Table 2: Returns to a Year of Education by Type of Schooling, Occupational Grouping, Age, and
Sex, Iowa 1915
18 to 34 Years Old
Males Females a
All
Occupations
Non-farm
Farm
Blue-
Collar
White-
Collar
All
Occupations
Years in school (7) (8) (9) (10) (11) (12)
Common
school
0.0483
(0.00395)
0.0375
(0.00442)
0.0637
(0.00837)
0.0229
(0.00450)
0.0438
(0.00889)
0.00714
(0.00877)
Grammar
school
0.0693
(0.00421)
0.0671
(0.00443)
0.0568
(0.0110)
0.0634
(0.00458)
0.0679
(0.00909)
0.0454
(0.00913)
High school 0.120
(0.00564)
0.114
(0.00516)
0.132
(0.0176)
0.0908
(0.00738)
0.0826
(0.00747)
0.101
(0.00760)
College 0.146
(0.00915)
0.143
(0.00799)
0.166
(0.0381)
0.0575
(0.0195)
0.131
(0.00849)
0.151
(0.0122)
Business school,
dummy
0.284
(0.0988)
0.273
(0.0831)
0.452
(0.180)
0.0825
(0.0886)
0.508
(0.0969)
R2
0.251 0.296 0.241 0.256 0.313 0.273
Number of
observations
7,145 5,249 1,784 4,021 1,744 2,001
a Includes only unmarried women.
Source: Goldin and Katz (2008), table 2.1.
Notes: Regressions also contain a quartic in potential experience, a race dummy, and a dummy
variable for those missing “years in U.S.” Potential experience is defined as min(age – 15, age –
years of schooling – 7). Blue collar includes craft, operative, service, and laborer occupations.
White collar includes professional, semi-professional, managerial (but not farming), clerical, and
sales occupations. Standard errors are given in parentheses below the coefficients.
0
Recommended