Hybrid positron emission tomographysegmentation of heterogeneous lungtumors using 3D Slicer: improvedGrowCut algorithm with thresholdinitialization
Hannah Mary T. ThomasDevadhas DevakumarBalukrishna SasidharanStephen R. BowenDanie Kingslin HeckE. James Jebaseelan Samuel
Hannah Mary T. Thomas, Devadhas Devakumar, Balukrishna Sasidharan, Stephen R. Bowen, DanieKingslin Heck, E. James Jebaseelan Samuel, “Hybrid positron emission tomography segmentation ofheterogeneous lung tumors using 3D Slicer: improved GrowCut algorithm with thresholdinitialization,” J. Med. Imag. 4(1), 011009 (2017), doi: 10.1117/1.JMI.4.1.011009.
Hybrid positron emission tomography segmentationof heterogeneous lung tumors using 3D Slicer:improved GrowCut algorithm with thresholdinitialization
Hannah Mary T. Thomas,a Devadhas Devakumar,b Balukrishna Sasidharan,c Stephen R. Bowen,dDanie Kingslin Heck,b and E. James Jebaseelan Samuela,*aVIT University, School of Advanced Sciences, Department of Physics, Vellore, Tamil Nadu 632004, IndiabChristian Medical College, Department of Nuclear Medicine, Vellore, Tamil Nadu 632004, IndiacChristian Medical College, Department of Radiation Oncology, Vellore, Tamil Nadu 632004, IndiadUniversity of Washington, School of Medicine, Departments of Radiology and Radiation Oncology, Seattle, Washington 98195, United States
Abstract. This paper presents an improved GrowCut (IGC), a positron emission tomography-based segmen-tation algorithm, and tests its clinical applicability. Contrary to the traditional method that requires the user toprovide the initial seeds, the IGC algorithm starts with a threshold-based estimate of the tumor and a three-dimensional morphologically grown shell around the tumor as the foreground and background seeds, respec-tively. The repeatability of IGC from the same observer at multiple time points was compared with the traditionalGrowCut algorithm. The algorithm was tested in 11 nonsmall cell lung cancer lesions and validated against theclinician-defined manual contour and compared against the clinically used 25% of the maximum standardizeduptake value [SUV-(max)], 40% SUVmax, and adaptive threshold methods. The time to edit IGC-defined functionalvolume to arrive at the gross tumor volume (GTV) was compared with that of manual contouring. The repeatabilityof the IGC algorithm was very high compared with the traditional GrowCut (p ¼ 0.003) and demonstrated higheragreement with the manual contour with respect to threshold-based methods. Compared with manual contouring,editing the IGC achieved the GTV in significantly less time (p ¼ 0.11). The IGC algorithm offers a highly repeatablefunctional volume and serves as an effective initial guess that can well minimize the time spent on labor-intensivemanual contouring. © 2017 Society of Photo-Optical Instrumentation Engineers (SPIE) [DOI: 10.1117/1.JMI.4.1.011009]
Keywords: positron emission tomography/computed tomography; nonsmall cell lung cancer; segmentation; GrowCut.
Paper 16108SSR received Jun. 10, 2016; accepted for publication Dec. 20, 2016; published online Jan. 23, 2017.
1 IntroductionIn recent years, 18fluoro-deoxyglucose (18F-FDG) positronemission tomography (PET) has emerged as an essential imag-ing modality in staging, tumor volume delineation, prognosisassessment, and evaluation of treatment response of nonsmallcell lung cancer (NSCLC). The superior sensitivity and speci-ficity of 18F-FDG PET particularly help to differentiate atelec-tasis in lungs and identify the presence of malignant lymphnodes, which are often difficult to visualize with computedtomography (CT). Consequently, the amount of normal tissueincluded in the target volume decreases and geometric massis reduced.1 However, uncertainty in target definition still con-tributes to the majority of the errors in radiation oncology. Theinclusion of biological imaging may have the highest impact inthe reduction of interobserver variability in target definitions.2
Since the early 2000s, there has been a surge of PET-based auto-matic and semiautomatic contouring methods that have beenproposed to help delineate the metabolic tumor activity. Themethods range from simple to complex methods.1,3,4 The seg-mentation methods include but are not limited to constant andadaptive threshold methods,5–9 region growing methods,10–12
gradient-based methods,13–15 fuzzy models,16–18 and Gaussian
mixture modeling.10,19 All these methods offer different com-promises in terms of versatility and performance and comparewell against manual segmentations by clinicians or the patho-logical measurements with varying rates of success.3 Yetthere is not enough consensus among the clinical communityon algorithms that work well to be incorporated into commer-cially available imaging software and treatment planningsystems.3,4 Most of these state-of-the-art algorithms are propri-etary and are currently unavailable for clinical use. There is alack of adequate documentation for these methods and theyoften do not have user/developer support, which makes it diffi-cult to replicate the results in a similar clinical setting. Otherlimitations include the methods being optimized for specificscanner properties, the results of which are often difficult toreproduce.20 The segmentation task is further complicated whentumors display cellular heterogeneity.
In this study, we have tried to delineate heterogeneous lungtumors using the GrowCut algorithm made available in thefreely accessible 3D Slicer software. However, the algorithmis dependent on the accuracy of user-defined initial labels. Toovercome this limitation, we provide a threshold-based initialestimate of the tumor and a three-dimensional (3-D) backgroundshell as the initial seeds. The objective of this study was to
*Address all correspondence to: E. James Jebaseelan Samuel, E-mail:[email protected] 2329-4302/2017/$25.00 © 2017 SPIE
Journal of Medical Imaging 011009-1 Jan–Mar 2017 • Vol. 4(1)
Journal of Medical Imaging 4(1), 011009 (Jan–Mar 2017)
improve the existing GrowCut algorithm. We tested the repeat-ability of the improved GrowCut (IGC) algorithm from the sameobserver at multiple time points in comparison with the 3DSlicer GrowCut algorithm. We postulate that the IGC algorithmwould be able to provide reliable functional NSCLC tumor vol-umes compared with the clinically used threshold-based meth-ods. The algorithm was tested in 11 NSCLC heterogeneouslesions and validated against the clinician-defined manual con-tour and compared against the 25% of maximum standardizeduptake value [SUV-(max)], 40% SUVmax, and adaptive thresh-old methods. We also tested whether the proposed IGC methodcould offer itself as an effective initial guess for the gross diseasesegmentation as an alternative to the manual segmentation cur-rently employed to delineate the NSCLC. The time taken formanual gross tumor volume (GTV) contouring versus thetime to edit the IGC contours was assessed as a measure of effi-ciency in this approach.
2 Materials and Methods
2.1 Data
The patients retrospectively included for this study were treatedfor advanced NSCLC and had PET/CT scans taken betweenJuly and December 2014. The patients were instructed to fast10 to 14 h before the FDG injection was administered, afterwhich the patients were encouraged to rest (no music, reading,or talking) in a cool (23°C to 24°C), dimly lit room. The totalinjected activity of FDG was expressed in MBq. The injectedactivity was 5 MBq∕kg of FDG for all patients and was depen-dent on the weight of the patient and limited at 370 MBq withthe average adult dose range between 7 and 8 mCi. Free-breath-ing PET and CT images were acquired at 60 (50 to 70) min. Thescans were done at the Christian Medical College, Vellore,India. The Institutional Review Board and the ethical committeeof the hospital approved this study.
The data included 11 primary tumors of 9 patients (5 menand 4 women). The patient demographics are shown inTable 1. The PET/CT scans were performed on a Biograph 6TruePoint HD (Siemens Medical Solutions Inc., Knoxville,Tennessee) PET scanner. The CT images were first acquired at124 mAs, 130 kVp, and 400 mm field-of-view (FOV). The CTimages were reconstructed with a transaxial plane resolution of0.78 mm × 0.78 mm and slice thickness of 2 mm per slice; theimage size was 512 × 512 pixels. The PET images wereacquired with a 700-mm FOV and reconstructed using attenu-ation weighted ordered subset expectation maximization recon-struction (3 iterations, 21 subsets, and 4-mm FWHM Gaussianfilter). During the reconstruction, corrections for point spreadfunction (TrueX), attenuation, and scatter were performed. Thesinogram data were decay, dead time, and random corrected.The CT images were used for the attenuation correction. Theresultant PET image size was 168 × 168 pixels and the in-plane resolution is 4.07 mm × 4.07 mm. The slice thickness inseven patients was 2 mm and in two patients it was 2.1 mm.
The treating clinician manually segmented the gross diseaseonce for each patient based on combined CT and PET informa-tion. The display protocol with a fixed window/level setting forthe CT scan (lung window) and upper window set to SUVmax inthe lesion of interest, with the lower window set at 0 for PETimages for delineation. Delineations were performed on theEclipse™ treatment planning system (Varian Medical SystemsInc.). The clinician-defined volumes were used as the referencevolume and henceforth are referred to as MANUAL contours.
2.2 GrowCut Algorithm
The GrowCut algorithm developed by Vezhnevets andKonouchine21 follows an iterative labeling procedure, wherethe user-defined “seed” pixels try to occupy the neighbors.The automaton defines a set of local transition rules, whichdetermines the value of each cell given the value of the cells
Table 1 Summary of patient demographics included in this study.
Patientno. Sex
Age(years)
Activity(MBq) Histology Stage Location
Timepostinjection
(min)
1 M 50 312.1 Moderately differentiatedsquamous cell carcinoma
T4N3 Right middle and lowerlobe
60
2* M 30 234.8 Poorly differentiated nonsmall cellcarcinoma not otherwise specified
T3N2 Left upper lobe 60
3 F 34 315.9 Myoepithelial neoplasm withinvasive carcinoma of squamousdifferentiation
T4N0 Trachea andmediastinum andbilateral main bronchus
70
5 F 61 267.4 Nonsmall cell adenocarcinoma T2N2 Left upper lobe 55
6 F 62 261.2 Mucin secreting adenocarcinoma T3N2 Right lower lobe 55
7 M 45 281.8 Adenocarcinoma T4N2 Right lower lobe 60
8 M 65 268.2 Moderately differentiatedsquamous cell carcinoma
T4N2 Right upper lobe 70
9** M 61 270.0 Moderately differentiatedsquamous cell carcinoma
T3N3 Right upper lobe 65
Note: Patients 2* and 9** had two lesions and three lesions, respectively, with high PET uptake.
Journal of Medical Imaging 011009-2 Jan–Mar 2017 • Vol. 4(1)
T. Thomas et al.: Hybrid positron emission tomography segmentation. . .
in its neighborhood. The commonly described neighborhooddefinitions are the 4-connected Von Neumann or the 8-con-nected Moore neighborhoods.
The GrowCut algorithm uses the image features to drive thetransition function. The current state of each cell is given by thetriplet ðlp; θp; IpÞ, where lp is the class label of the cell, θp is thestrength of the cell, and Ip is the cell feature vector, defined in ourcase as the pixel intensity. Assume there are two competing cells,one an attacker cell and the other the defender cell, each havingstrengths θp and θq and pixel intensities Ip and Iq, respectively.The attack force is defined as the strength of the attacker θp andthe distance between the pixel intensities for the attacker anddefender cells. The local transition function between the cellsis defined by the monotonically decreasing function g, boundedto [0,1] and given by the following equation:
EQ-TARGET;temp:intralink-;e001;63;308gðxÞ ¼ 1 −
"x
ðmax k I⇀k2Þ
#
: (1)
Therefore, if the strength of the attacker is greater than that of thedefender cell, the attacker overtakes the defender, leading to achange in its label and strength which are replaced by the function
gkIp!− Iq
!kθtq. The algorithm is iterated till the automaton con-verges to a stable configuration and there are no more local labelupdates. The algorithm always converges since the cell strength isincreasing and bound.
The iteration steps can be described in Algorithm 1.To initiate the segmentation, the user has to specify the seeds
corresponding to “foreground” and “background” using differ-ent colored brush strokes, which set the initial labels andstrengths of seed pixels. The strength of the seed pixels is setto one and the neighboring pixel strength to zero. The seed pix-els grow over the image until some contact is made with theedges of two different labels. From that point forward, the pixelstry to occupy their neighbors following the transition rule.
The algorithm is simple to implement and allows the user tointeractively guide the segmentation while the algorithm is stilliterating. However, experiments have shown that the method isvery sensitive to small changes in the user-defined seeds andoften required many user seeds distributed over the entireimage for an adequate segmentation.22,23
2.3 Preprocessing of PET Images
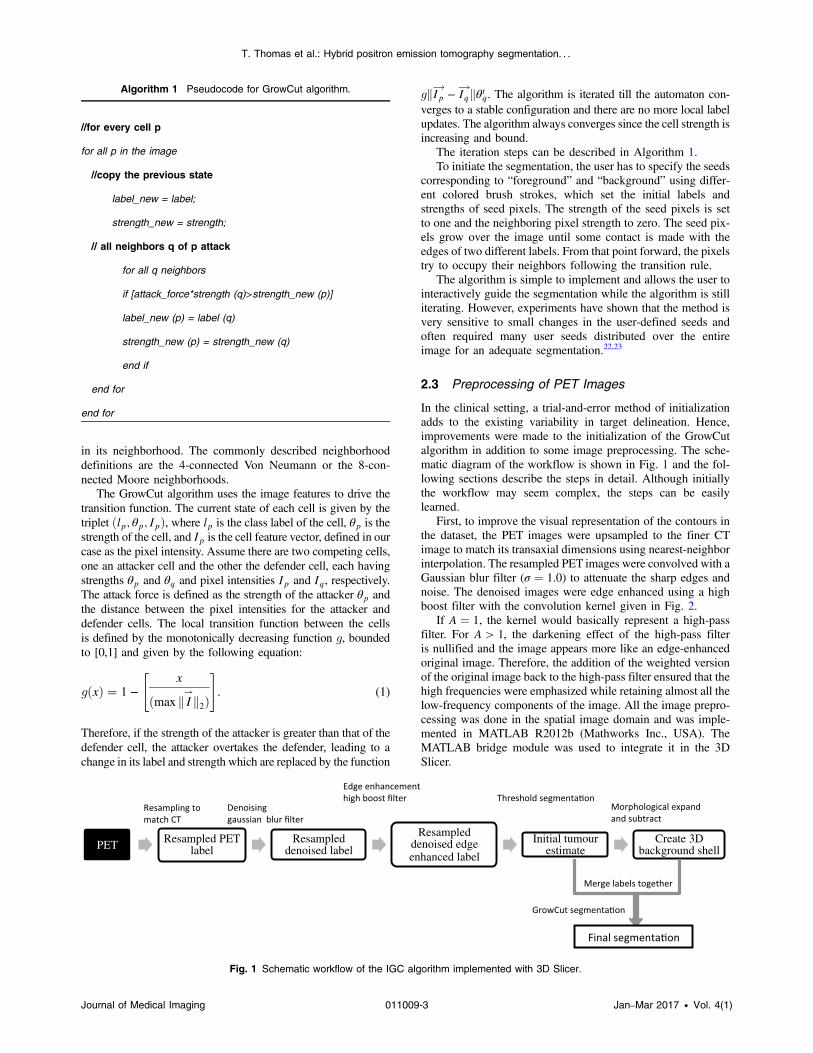
In the clinical setting, a trial-and-error method of initializationadds to the existing variability in target delineation. Hence,improvements were made to the initialization of the GrowCutalgorithm in addition to some image preprocessing. The sche-matic diagram of the workflow is shown in Fig. 1 and the fol-lowing sections describe the steps in detail. Although initiallythe workflow may seem complex, the steps can be easilylearned.
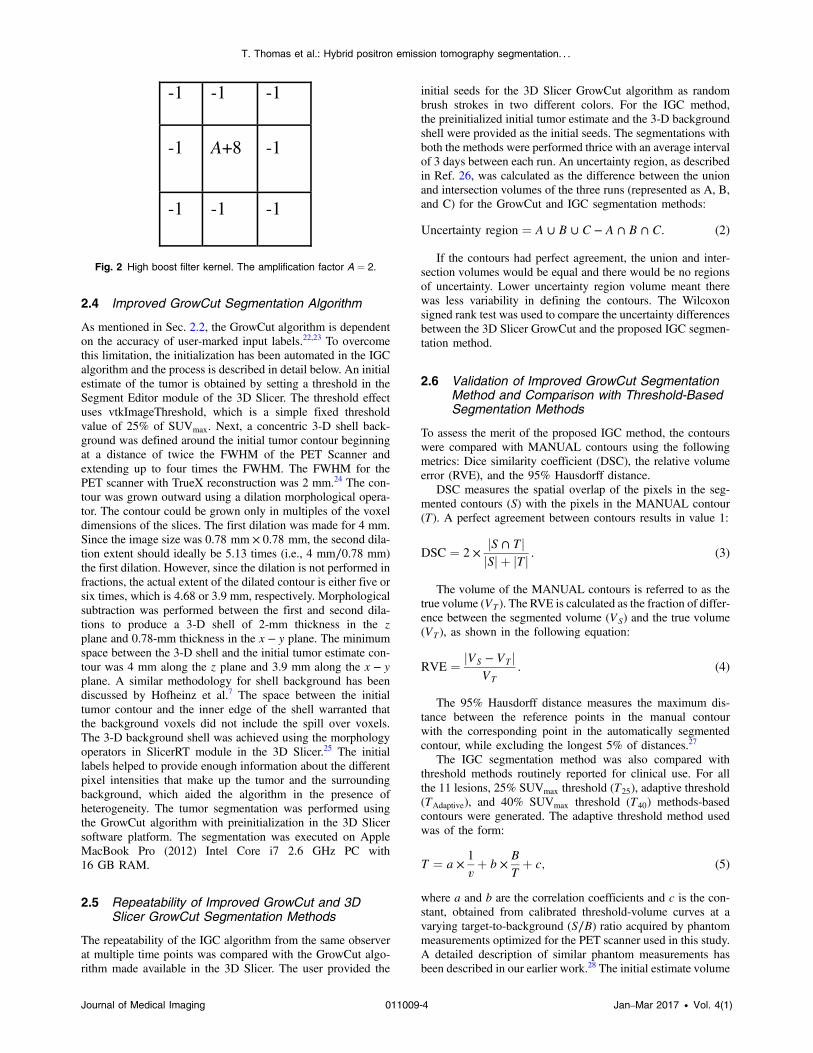
First, to improve the visual representation of the contours inthe dataset, the PET images were upsampled to the finer CTimage to match its transaxial dimensions using nearest-neighborinterpolation. The resampled PET images were convolved with aGaussian blur filter (σ ¼ 1.0) to attenuate the sharp edges andnoise. The denoised images were edge enhanced using a highboost filter with the convolution kernel given in Fig. 2.
If A ¼ 1, the kernel would basically represent a high-passfilter. For A > 1, the darkening effect of the high-pass filteris nullified and the image appears more like an edge-enhancedoriginal image. Therefore, the addition of the weighted versionof the original image back to the high-pass filter ensured that thehigh frequencies were emphasized while retaining almost all thelow-frequency components of the image. All the image prepro-cessing was done in the spatial image domain and was imple-mented in MATLAB R2012b (Mathworks Inc., USA). TheMATLAB bridge module was used to integrate it in the 3DSlicer.
Algorithm 1 Pseudocode for GrowCut algorithm.
//for every cell p
for all p in the image
//copy the previous state
label_new = label;
strength_new = strength;
// all neighbors q of p attack
for all q neighbors
if [attack_force*strength (q)>strength_new (p)]
label_new (p) = label (q)
strength_new (p) = strength_new (q)
end if
end for
end for
PET Resampled PET label
Resampled denoised label
Resampled denoised edge enhanced label
Initial tumourestimate
Create 3D background shell
Fig. 1 Schematic workflow of the IGC algorithm implemented with 3D Slicer.
Journal of Medical Imaging 011009-3 Jan–Mar 2017 • Vol. 4(1)
T. Thomas et al.: Hybrid positron emission tomography segmentation. . .
2.4 Improved GrowCut Segmentation Algorithm
As mentioned in Sec. 2.2, the GrowCut algorithm is dependenton the accuracy of user-marked input labels.22,23 To overcomethis limitation, the initialization has been automated in the IGCalgorithm and the process is described in detail below. An initialestimate of the tumor is obtained by setting a threshold in theSegment Editor module of the 3D Slicer. The threshold effectuses vtkImageThreshold, which is a simple fixed thresholdvalue of 25% of SUVmax. Next, a concentric 3-D shell back-ground was defined around the initial tumor contour beginningat a distance of twice the FWHM of the PET Scanner andextending up to four times the FWHM. The FWHM for thePET scanner with TrueX reconstruction was 2 mm.24 The con-tour was grown outward using a dilation morphological opera-tor. The contour could be grown only in multiples of the voxeldimensions of the slices. The first dilation was made for 4 mm.Since the image size was 0.78 mm × 0.78 mm, the second dila-tion extent should ideally be 5.13 times (i.e., 4 mm∕0.78 mm)the first dilation. However, since the dilation is not performed infractions, the actual extent of the dilated contour is either five orsix times, which is 4.68 or 3.9 mm, respectively. Morphologicalsubtraction was performed between the first and second dila-tions to produce a 3-D shell of 2-mm thickness in the zplane and 0.78-mm thickness in the x − y plane. The minimumspace between the 3-D shell and the initial tumor estimate con-tour was 4 mm along the z plane and 3.9 mm along the x − yplane. A similar methodology for shell background has beendiscussed by Hofheinz et al.7 The space between the initialtumor contour and the inner edge of the shell warranted thatthe background voxels did not include the spill over voxels.The 3-D background shell was achieved using the morphologyoperators in SlicerRT module in the 3D Slicer.25 The initiallabels helped to provide enough information about the differentpixel intensities that make up the tumor and the surroundingbackground, which aided the algorithm in the presence ofheterogeneity. The tumor segmentation was performed usingthe GrowCut algorithm with preinitialization in the 3D Slicersoftware platform. The segmentation was executed on AppleMacBook Pro (2012) Intel Core i7 2.6 GHz PC with16 GB RAM.
2.5 Repeatability of Improved GrowCut and 3DSlicer GrowCut Segmentation Methods
The repeatability of the IGC algorithm from the same observerat multiple time points was compared with the GrowCut algo-rithm made available in the 3D Slicer. The user provided the
initial seeds for the 3D Slicer GrowCut algorithm as randombrush strokes in two different colors. For the IGC method,the preinitialized initial tumor estimate and the 3-D backgroundshell were provided as the initial seeds. The segmentations withboth the methods were performed thrice with an average intervalof 3 days between each run. An uncertainty region, as describedin Ref. 26, was calculated as the difference between the unionand intersection volumes of the three runs (represented as A, B,and C) for the GrowCut and IGC segmentation methods:
EQ-TARGET;temp:intralink-;e002;326;653Uncertainty region ¼ A ∪ B ∪ C − A ∩ B ∩ C: (2)
If the contours had perfect agreement, the union and inter-section volumes would be equal and there would be no regionsof uncertainty. Lower uncertainty region volume meant therewas less variability in defining the contours. The Wilcoxonsigned rank test was used to compare the uncertainty differencesbetween the 3D Slicer GrowCut and the proposed IGC segmen-tation method.
2.6 Validation of Improved GrowCut SegmentationMethod and Comparison with Threshold-BasedSegmentation Methods
To assess the merit of the proposed IGC method, the contourswere compared with MANUAL contours using the followingmetrics: Dice similarity coefficient (DSC), the relative volumeerror (RVE), and the 95% Hausdorff distance.
DSC measures the spatial overlap of the pixels in the seg-mented contours (S) with the pixels in the MANUAL contour(T). A perfect agreement between contours results in value 1:
EQ-TARGET;temp:intralink-;e003;326;416DSC ¼ 2 ×jS ∩ TjjSjþ jTj
: (3)
The volume of the MANUAL contours is referred to as thetrue volume (VT ). The RVE is calculated as the fraction of differ-ence between the segmented volume (VS) and the true volume(VT ), as shown in the following equation:
EQ-TARGET;temp:intralink-;e004;326;328RVE ¼ jVS − VT jVT
: (4)
The 95% Hausdorff distance measures the maximum dis-tance between the reference points in the manual contourwith the corresponding point in the automatically segmentedcontour, while excluding the longest 5% of distances.27
The IGC segmentation method was also compared withthreshold methods routinely reported for clinical use. For allthe 11 lesions, 25% SUVmax threshold (T25), adaptive threshold(TAdaptive), and 40% SUVmax threshold (T40) methods-basedcontours were generated. The adaptive threshold method usedwas of the form:
EQ-TARGET;temp:intralink-;e005;326;174T ¼ a ×1
vþ b ×
BTþ c; (5)
where a and b are the correlation coefficients and c is the con-stant, obtained from calibrated threshold-volume curves at avarying target-to-background (S∕B) ratio acquired by phantommeasurements optimized for the PET scanner used in this study.A detailed description of similar phantom measurements hasbeen described in our earlier work.28 The initial estimate volume
-1 -1 -1
-1 A+8 -1
-1 -1 -1
Fig. 2 High boost filter kernel. The amplification factor A ¼ 2.
Journal of Medical Imaging 011009-4 Jan–Mar 2017 • Vol. 4(1)
T. Thomas et al.: Hybrid positron emission tomography segmentation. . .
for the adaptive threshold was obtained from T25 threshold. Thetracer uptake ratio in the source and background was obtainedfrom the T25 defined contour and the 3-D shell background,respectively.
The threshold-segmented contours were also comparedagainst the MANUAL contours. The evaluation metrics forthe IGC and threshold-based methods were compared usingthe Kruskal–Wallis test with the significance set at p < 0.05.
2.7 Contour Edits for Gross Tumor Definition
The IGC contours were provided as a starting contour that couldbe edited by the clinician for defining the final GTV, whichincluded composite information from CT and PET. The timetaken for MANUAL GTV contouring versus the time to editthe IGC contours to create the GTV was assessed as a measureof clinical efficiency in this approach. The difference in contour-ing time and edit time was compared using Wilcoxon test andwas considered significantly different when the p-value waslower than 0.05.
3 Results
3.1 Comparison of Improved GrowCut with3D Slicer GrowCut Segmentation Method
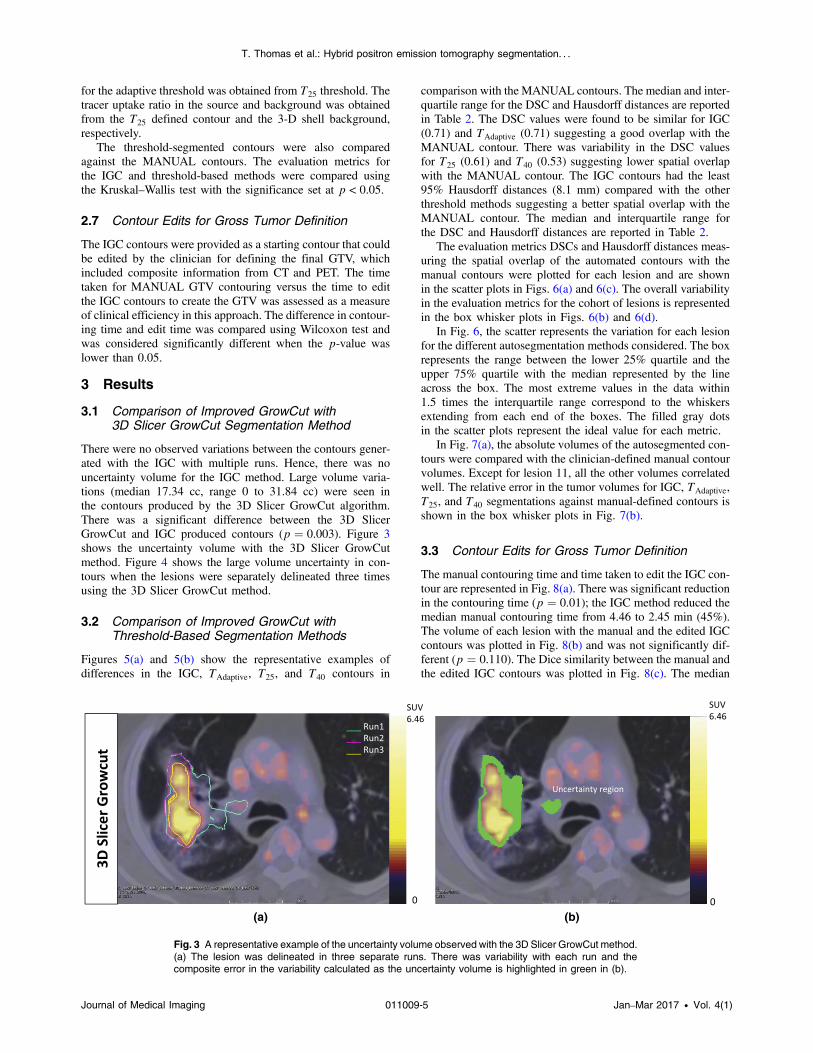
There were no observed variations between the contours gener-ated with the IGC with multiple runs. Hence, there was nouncertainty volume for the IGC method. Large volume varia-tions (median 17.34 cc, range 0 to 31.84 cc) were seen inthe contours produced by the 3D Slicer GrowCut algorithm.There was a significant difference between the 3D SlicerGrowCut and IGC produced contours (p ¼ 0.003). Figure 3shows the uncertainty volume with the 3D Slicer GrowCutmethod. Figure 4 shows the large volume uncertainty in con-tours when the lesions were separately delineated three timesusing the 3D Slicer GrowCut method.
3.2 Comparison of Improved GrowCut withThreshold-Based Segmentation Methods
Figures 5(a) and 5(b) show the representative examples ofdifferences in the IGC, TAdaptive, T25, and T40 contours in
comparison with the MANUAL contours. The median and inter-quartile range for the DSC and Hausdorff distances are reportedin Table 2. The DSC values were found to be similar for IGC(0.71) and TAdaptive (0.71) suggesting a good overlap with theMANUAL contour. There was variability in the DSC valuesfor T25 (0.61) and T40 (0.53) suggesting lower spatial overlapwith the MANUAL contour. The IGC contours had the least95% Hausdorff distances (8.1 mm) compared with the otherthreshold methods suggesting a better spatial overlap with theMANUAL contour. The median and interquartile range forthe DSC and Hausdorff distances are reported in Table 2.
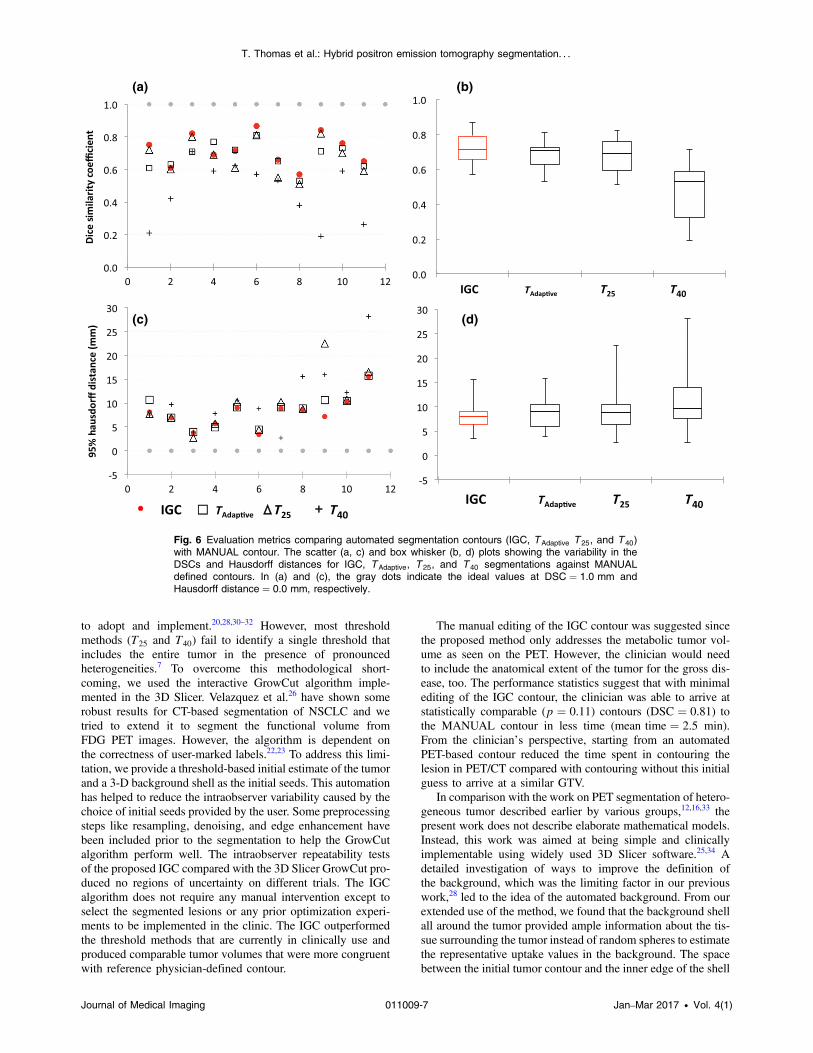
The evaluation metrics DSCs and Hausdorff distances meas-uring the spatial overlap of the automated contours with themanual contours were plotted for each lesion and are shownin the scatter plots in Figs. 6(a) and 6(c). The overall variabilityin the evaluation metrics for the cohort of lesions is representedin the box whisker plots in Figs. 6(b) and 6(d).
In Fig. 6, the scatter represents the variation for each lesionfor the different autosegmentation methods considered. The boxrepresents the range between the lower 25% quartile and theupper 75% quartile with the median represented by the lineacross the box. The most extreme values in the data within1.5 times the interquartile range correspond to the whiskersextending from each end of the boxes. The filled gray dotsin the scatter plots represent the ideal value for each metric.
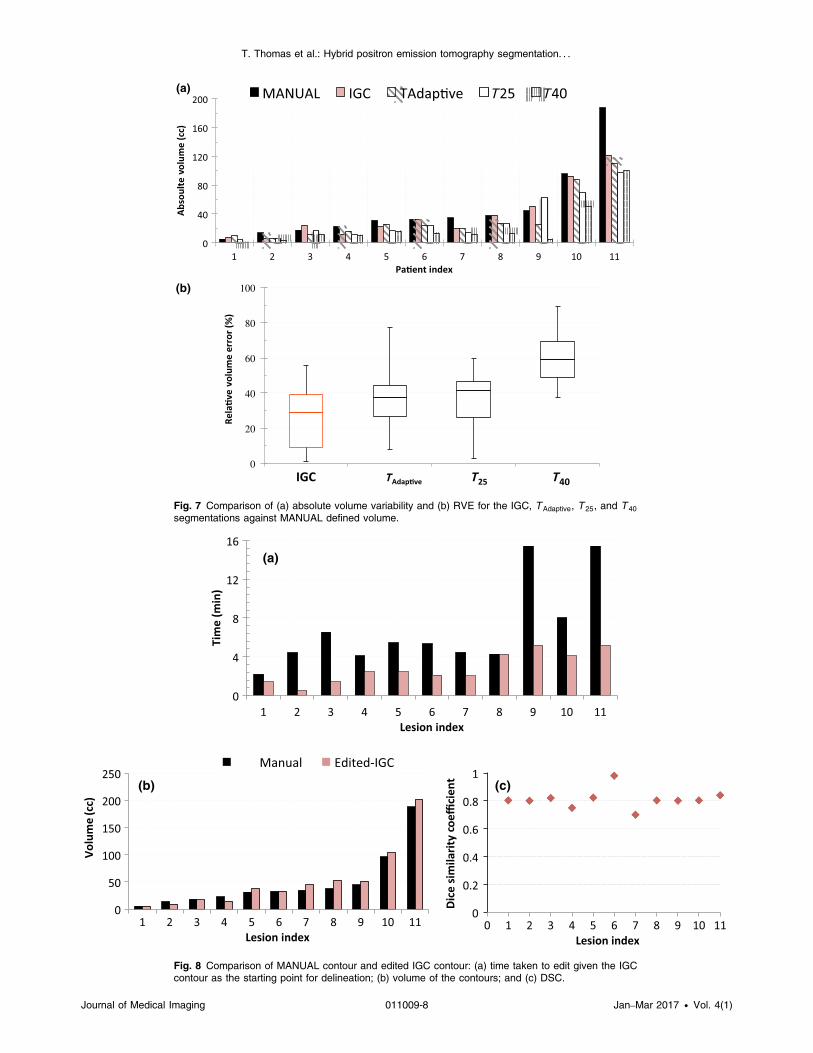
In Fig. 7(a), the absolute volumes of the autosegmented con-tours were compared with the clinician-defined manual contourvolumes. Except for lesion 11, all the other volumes correlatedwell. The relative error in the tumor volumes for IGC, TAdaptive,T25, and T40 segmentations against manual-defined contours isshown in the box whisker plots in Fig. 7(b).
3.3 Contour Edits for Gross Tumor Definition
The manual contouring time and time taken to edit the IGC con-tour are represented in Fig. 8(a). There was significant reductionin the contouring time (p ¼ 0.01); the IGC method reduced themedian manual contouring time from 4.46 to 2.45 min (45%).The volume of each lesion with the manual and the edited IGCcontours was plotted in Fig. 8(b) and was not significantly dif-ferent (p ¼ 0.110). The Dice similarity between the manual andthe edited IGC contours was plotted in Fig. 8(c). The median
(a) (b)
Fig. 3 A representative example of the uncertainty volume observed with the 3D Slicer GrowCut method.(a) The lesion was delineated in three separate runs. There was variability with each run and thecomposite error in the variability calculated as the uncertainty volume is highlighted in green in (b).
Journal of Medical Imaging 011009-5 Jan–Mar 2017 • Vol. 4(1)
T. Thomas et al.: Hybrid positron emission tomography segmentation. . .
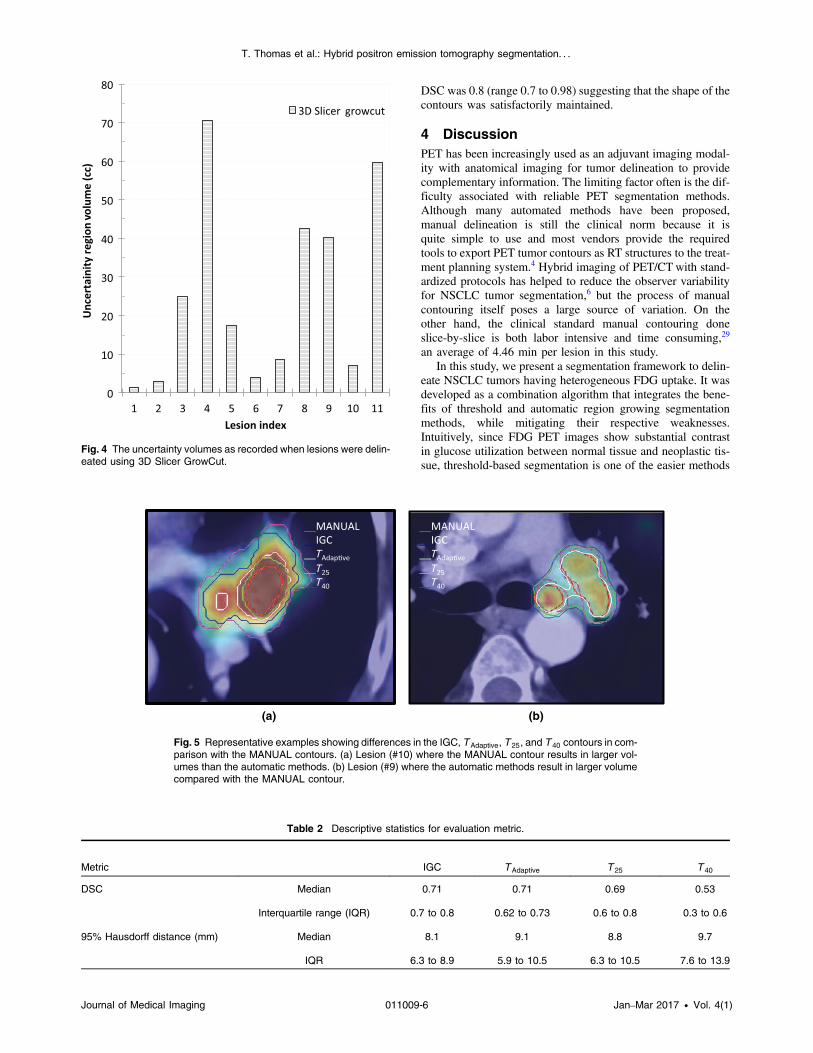
DSC was 0.8 (range 0.7 to 0.98) suggesting that the shape of thecontours was satisfactorily maintained.
4 DiscussionPET has been increasingly used as an adjuvant imaging modal-ity with anatomical imaging for tumor delineation to providecomplementary information. The limiting factor often is the dif-ficulty associated with reliable PET segmentation methods.Although many automated methods have been proposed,manual delineation is still the clinical norm because it isquite simple to use and most vendors provide the requiredtools to export PET tumor contours as RT structures to the treat-ment planning system.4 Hybrid imaging of PET/CT with stand-ardized protocols has helped to reduce the observer variabilityfor NSCLC tumor segmentation,6 but the process of manualcontouring itself poses a large source of variation. On theother hand, the clinical standard manual contouring doneslice-by-slice is both labor intensive and time consuming,29
an average of 4.46 min per lesion in this study.In this study, we present a segmentation framework to delin-
eate NSCLC tumors having heterogeneous FDG uptake. It wasdeveloped as a combination algorithm that integrates the bene-fits of threshold and automatic region growing segmentationmethods, while mitigating their respective weaknesses.Intuitively, since FDG PET images show substantial contrastin glucose utilization between normal tissue and neoplastic tis-sue, threshold-based segmentation is one of the easier methods
(a) (b)
Fig. 5 Representative examples showing differences in the IGC, T Adaptive, T 25, and T 40 contours in com-parison with the MANUAL contours. (a) Lesion (#10) where the MANUAL contour results in larger vol-umes than the automatic methods. (b) Lesion (#9) where the automatic methods result in larger volumecompared with the MANUAL contour.
Table 2 Descriptive statistics for evaluation metric.
Metric IGC T Adaptive T 25 T 40
DSC Median 0.71 0.71 0.69 0.53
Interquartile range (IQR) 0.7 to 0.8 0.62 to 0.73 0.6 to 0.8 0.3 to 0.6
95% Hausdorff distance (mm) Median 8.1 9.1 8.8 9.7
IQR 6.3 to 8.9 5.9 to 10.5 6.3 to 10.5 7.6 to 13.9
Fig. 4 The uncertainty volumes as recorded when lesions were delin-eated using 3D Slicer GrowCut.
Journal of Medical Imaging 011009-6 Jan–Mar 2017 • Vol. 4(1)
T. Thomas et al.: Hybrid positron emission tomography segmentation. . .
to adopt and implement.20,28,30–32 However, most thresholdmethods (T25 and T40) fail to identify a single threshold thatincludes the entire tumor in the presence of pronouncedheterogeneities.7 To overcome this methodological short-coming, we used the interactive GrowCut algorithm imple-mented in the 3D Slicer. Velazquez et al.26 have shown somerobust results for CT-based segmentation of NSCLC and wetried to extend it to segment the functional volume fromFDG PET images. However, the algorithm is dependent onthe correctness of user-marked labels.22,23 To address this limi-tation, we provide a threshold-based initial estimate of the tumorand a 3-D background shell as the initial seeds. This automationhas helped to reduce the intraobserver variability caused by thechoice of initial seeds provided by the user. Some preprocessingsteps like resampling, denoising, and edge enhancement havebeen included prior to the segmentation to help the GrowCutalgorithm perform well. The intraobserver repeatability testsof the proposed IGC compared with the 3D Slicer GrowCut pro-duced no regions of uncertainty on different trials. The IGCalgorithm does not require any manual intervention except toselect the segmented lesions or any prior optimization experi-ments to be implemented in the clinic. The IGC outperformedthe threshold methods that are currently in clinically use andproduced comparable tumor volumes that were more congruentwith reference physician-defined contour.
The manual editing of the IGC contour was suggested sincethe proposed method only addresses the metabolic tumor vol-ume as seen on the PET. However, the clinician would needto include the anatomical extent of the tumor for the gross dis-ease, too. The performance statistics suggest that with minimalediting of the IGC contour, the clinician was able to arrive atstatistically comparable (p ¼ 0.11) contours (DSC ¼ 0.81) tothe MANUAL contour in less time (mean time ¼ 2.5 min).From the clinician’s perspective, starting from an automatedPET-based contour reduced the time spent in contouring thelesion in PET/CT compared with contouring without this initialguess to arrive at a similar GTV.
In comparison with the work on PET segmentation of hetero-geneous tumor described earlier by various groups,12,16,33 thepresent work does not describe elaborate mathematical models.Instead, this work was aimed at being simple and clinicallyimplementable using widely used 3D Slicer software.25,34 Adetailed investigation of ways to improve the definition ofthe background, which was the limiting factor in our previouswork,28 led to the idea of the automated background. From ourextended use of the method, we found that the background shellall around the tumor provided ample information about the tis-sue surrounding the tumor instead of random spheres to estimatethe representative uptake values in the background. The spacebetween the initial tumor contour and the inner edge of the shell
(a) (b)
(c) (d)
Fig. 6 Evaluation metrics comparing automated segmentation contours (IGC, T Adaptive T 25, and T 40)with MANUAL contour. The scatter (a, c) and box whisker (b, d) plots showing the variability in theDSCs and Hausdorff distances for IGC, T Adaptive, T 25, and T 40 segmentations against MANUALdefined contours. In (a) and (c), the gray dots indicate the ideal values at DSC ¼ 1.0 mm andHausdorff distance ¼ 0.0 mm, respectively.
Journal of Medical Imaging 011009-7 Jan–Mar 2017 • Vol. 4(1)
T. Thomas et al.: Hybrid positron emission tomography segmentation. . .
(a)
(b)
Fig. 7 Comparison of (a) absolute volume variability and (b) RVE for the IGC, T Adaptive, T 25, and T 40segmentations against MANUAL defined volume.
(a)
(b) (c)
Fig. 8 Comparison of MANUAL contour and edited IGC contour: (a) time taken to edit given the IGCcontour as the starting point for delineation; (b) volume of the contours; and (c) DSC.
Journal of Medical Imaging 011009-8 Jan–Mar 2017 • Vol. 4(1)
T. Thomas et al.: Hybrid positron emission tomography segmentation. . .
ensured that the background voxel does not include the tumorvoxels that may lie within the spill-out region due to partial vol-ume effects. The background voxels were considered to extendbeyond twice the FWHM based on the available resolution ofthe PET imaging system. The definition also allowed the con-tour to increase in volume using the GrowCut method from theinitial tumor estimation to the actual extent of the tumor.Hofheinz et al.7 described a similar method of describing theradius of the background shell such that the reference voxelbeing determined is not localized at the boundary of the lesion.
Even though manual contour in PET has its limitations ofinter- and intraobserver variability owing to various windowlevel settings used by different operators, the clinician-definedtumor volume takes into account all contextual informationabout the tumor from multiple imaging modalities and patho-logical findings. It has been argued that the clinicians usuallyoutperform computer algorithms in the high-level task oftumor recognition.35 This was our motivation to use manual seg-mentation as the gold standard to validate computerized imagesegmentation techniques in the absence of the surgical specimenof the tumor that serves as the gold standard.36 Due to practicaldifficulties in finding more experienced clinicians in contouringlung lesions based on PET imaging, we had to use a single cli-nician-defined volume for validation. Comparison against multi-ple clinician-defined tumor volumes may be part of our futurestudies.
Presently, the segmentation pipeline is not fully automated,which makes the whole process seem too long. The total com-putational time for the preprocessing and segmentation recordedis less than 10 s. The majority of the time is spent in loading theimages and choosing the appropriate parameters involved in theworkflow. This limitation would be addressed when we auto-mate the steps into a click and use module in the near future.
Another limitation of this study is that the IGC algorithmfails to perform well in lesions surrounded by high-metabolicuptake regions, e.g., brain lesions. Predominantly, this is dueto the limitation of the fixed threshold of 25% to provide theinitial estimate. This may be addressed by attempting a differentinitialization approach in future studies. Since this method iscurrently validated only in lung cancer patients, further testingis required if it is intended for other anatomical tumor sites.
The impact of the PET-based segmentation method to delin-eate treatment volumes for the purpose of PET-guided radiationtherapy treatment planning on patient management and clinicaloutcome is still not clear. It may be answered only with furtherclinical trials involving a larger sample of patients. Nevertheless,in comparison with the threshold segmentations that are in cur-rent clinical use and with no additional requirements of phantomexperiments for implementation, the IGC algorithm could beused as a reliable starting point to delineate GTVs, whichhelps to reduce the inter- and intraobserver variability. Whenthe IGC contour was provided, the clinician often only neededto incorporate the anatomical regions from the CT that are notpart of the metabolic volume which resulted in less contouringtime. It also helped in identifying regions that are often difficultto gauge on CT alone (atelectasis).
5 ConclusionThe proposed segmentation method improves the interactivesemiautomatic GrowCut algorithm using a threshold-basedinitialization. This removes any variability in the contoursdue to the user inputs. This study demonstrates that the IGC
segmentation algorithm could be easily implementable in thefreely available 3D Slicer platform to achieve reliable and highlyrepeatable functional volumes with no user inputs required forthe initialization of the GrowCut algorithm. The IGC algorithmalso shows promise to serve as an effective initial guess that canwell minimize the time spent on labor-intensive manual GTVdelineation.
DisclosuresAuthors have no relevant financial interests in the manuscriptand no other potential conflicts of interest to disclose.
AcknowledgmentsH.M.T. Thomas acknowledges the senior research fellowshipfrom the Council of Scientific Research (CSIR), India, andMs. Madhurima Debanath and Ms. Josia Selia for their earlycontributions in GrowCut and adaptive threshold algorithms,respectively. The authors would like to gratefully acknowledgethe contributions made by Mr. Mohammed Rafiq, Mr. SatishKumar, and Ms. Susan in assembling the data before manualdelineation. The authors also acknowledge 3D Slicer teamand Dr. Csaba Pinter for their help.
References1. P. Lee et al., “Current concepts in F18 FDG PET/CT-based radiation
therapy planning for lung cancer,” Front. Oncol. 2, 1–11 (2012).2. R. Jeraj, T. J. Bradshaw, and U. Simoncic, “Molecular imaging to plan
radiotherapy and evaluate its efficacy,” J. Nucl. Med. 56, 1752–1765(2015).
3. B. Foster et al., “A review on segmentation of positron emission tomog-raphy images,” Comput. Biol. Med. 50, 76–96 (2014).
4. H. Zaidi and I. El Naqa, “PET-guided delineation of radiation therapytreatment volumes: a survey of image segmentation techniques,” Eur. J.Nucl. Med. Mol. Imaging 37(11), 2165–2187 (2010).
5. Y. E. Erdi et al., “Segmentation of lung lesion volume by adaptive posi-tron emission tomography image thresholding,” Cancer 80(12 Suppl.),2505–2509 (1997).
6. C. Greco et al., “Current status of PET/CT for tumour volume definitionin radiotherapy treatment planning for non-small cell lung cancer(NSCLC),” Lung Cancer 57(2), 125–134 (2007).
7. F. Hofheinz et al., “An automatic method for accurate volume delinea-tion of heterogeneous tumors in PET,” Med. Phys. 40(8), 082503(2013).
8. T. Konert et al., “PET/CT imaging for target volume delineation in cura-tive intent radiotherapy of non-small cell lung cancer: IAEA consensusreport 2014,” Radiother. Oncol. 116(1), 27–34 (2015).
9. A. Schaefer et al., “A contrast-oriented algorithm for FDG-PET-baseddelineation of tumour volumes for the radiotherapy of lung cancer: der-ivation from phantom measurements and validation in patient data,”Eur. J. Nucl. Med. Mol. Imaging 35(11), 1989–1999 (2008).
10. C. Ballangan et al., “Lung tumor delineation in PET-CT images using adownhill region growing and a Gaussian mixture model,” in Proc. 18thIEEE Int. Conf. on Image Processing, Belgium, Brussels, pp. 2173–2176 (2011).
11. H. Li et al., “A novel PET tumor delineation method based on adaptiveregion-growing and dual-front active contours,” Med. Phys. 35(8),3711–3721 (2008).
12. D. P. Onoma et al., “Segmentation of heterogeneous or small FDG PETpositive tissue based on a 3D-locally adaptive random walk algorithm,”Comput. Med. Imaging Graphics 38(8), 753–763 (2014).
13. X. Geets et al., “Metabolic imaging in non-small-cell lung cancer radio-therapy,” Cancer/Radiothérapie 18(5–6), 402–405 (2014).
14. A. D. Nelson et al., “PET tumor segmentation: multi-observer validationof a gradient-based method using a NSCLC PET phantom,” Int. J.Radiat. Oncol. Biol. Phys. 75(3), S627 (2009).
15. M. Werner-Wasik et al., “What is the best way to contour lung tumorson PET scans? Multiobserver validation of a gradient-based method
Journal of Medical Imaging 011009-9 Jan–Mar 2017 • Vol. 4(1)
T. Thomas et al.: Hybrid positron emission tomography segmentation. . .
using a NSCLC digital PET phantom,” Int. J. Radiat. Oncol. Biol. Phys.82(3), 1164–1171 (2012).
16. S. Belhassen and H. Zaidi, “A novel fuzzy C-means algorithm for unsu-pervised heterogeneous tumor quantification in PET,”Med. Phys. 37(3),1309–1324 (2010).
17. M. Hatt et al., “A fuzzy locally adaptive Bayesian segmentationapproach for volume determination in PET,” IEEE Trans. Med.Imaging 28(6), 881–893 (2009).
18. M. A. Sutton, J. C. Bezdek, and T. C. Cahoon, Image Segmentation byFuzzy Clustering: Methods and Issues, Academic Press, New York(2000).
19. M. Aristophanous et al., “A Gaussian mixture model for definition oflung tumor volumes in positron emission tomography,” Med. Phys.34(11), 4223–4235 (2007).
20. J. A. Lee, “Segmentation of positron emission tomography images:some recommendations for target delineation in radiation oncology,”Radiother. Oncol. 96(3), 302–307 (2010).
21. V. Vezhnevets and V. Konouchine, “‘GrowCut’—interactive multi-labeln-d image segmentation by cellular automata,” in Proc. Graphicon,Japan, Osaka, pp. 150–156 (2005).
22. O. J. Arndt, B. Scheuermann, and B. Rosenhahn, “‘RegionCut’—inter-active multi-label segmentation utilizing cellular automaton,” in IEEEWorkshop on Applications of Computer Vision (WACV), pp. 309–316 (2013).
23. P. Ghosh et al., “Unsupervised grow-cut: cellular automata-based medi-cal image segmentation,” in First IEEE Int. Conf. on HealthcareInformatics, Imaging and Systems Biology (HISB ‘11), pp. 40–47(2011).
24. “BiographTM truepoint PET CT system specifications,” http://www.activexray.com/pdf/Siemens_Biograph.pdf (December 2008).
25. C. Pinter et al., “SlicerRT: radiation therapy research toolkit for 3DSlicer,” Med. Phys. 39(10), 6332–6338 (2012).
26. E. R. Velazquez et al., “Volumetric CT-based segmentation of NSCLCusing 3D Slicer,” Sci. Rep. 3, 3529 (2013).
27. D. P. Huttenlocher, G. A. Klanderman, and W. A. Rucklidge,“Comparing images using the Hausdorff distance,” IEEE Trans.Pattern Anal. Mach. Intell. 15(9), 850–863 (1993).
28. H. M. T. Thomas et al., “Adaptive threshold segmentation of pituitaryadenomas from FDG PET images for radiosurgery,” J. Appl. Clin. Med.Phys. 15(6), 279–294 (2014).
29. M. Hatt, D. Visvikis, and C. C. Le Rest, “Autocontouring versus manualcontouring,” J. Nucl. Med. 52(4), 658–658 (2011).
30. C. Greco et al., “Evaluation of different methods of 18F-FDG-PET tar-get volume delineation in the radiotherapy of head and neck cancer,”Am. J. Clin. Oncol. 31(5), 439–445 (2008).
31. P. Tylski et al., “Comparative assessment of methods for estimatingtumor volume and standardized uptake value in 18F-FDG PET,”J. Nucl. Med. 51(2), 268–276 (2010).
32. D. A. X. Schinagl et al., “Can FDG PET predict radiation treatmentoutcome in head and neck cancer? Results of a prospective study,”Eur. J. Nucl. Med. Mol. Imaging 38(8), 1449–1458 (2011).
33. M. Hatt et al., “Accurate automatic delineation of heterogeneous func-tional volumes in positron emission tomography for oncology applica-tions,” Int. J. Radiat. Oncol. Biol. Phys. 77(1), 301–308 (2010).
34. A. Fedorov et al., “3D Slicer as an image computing platform forthe quantitative imaging network,” Magn. Reson. Imaging 30(9),1323–1341 (2012).
35. T. Shepherd et al., “Comparative study with new accuracy metrics fortarget volume contouring in PET image guided radiation therapy,” IEEETrans. Med. Imaging 31(11), 2006–2024 (2012).
36. A. A. W. Baardwijk van et al., “PET-CT based autocontouring in non-small-cell lung cancer correlates with pathology and reduces interob-server variability in the delineation of the primary tumor and involvednodal volumes,” Int. J. Radiat. Oncol. Biol. Phys. 68(3), 771–778(2007).
Hannah Mary T. Thomas received her PhD from VIT University,Vellore, India, in 2016. She is currently a senior research fellow inthe Department of Developmental Paediatrics at Christian MedicalCollege Vellore. Her research interests include incorporating multimo-dality imaging with an aim to improve radiotherapy treatment planning.
Devadhas Devakumar received his PhD from MGR MedicalUniversity, Chennai, India. He is an associate professor in medicalphysics in the Department of Nuclear medicine at Christian MedicalCollege, Vellore. His current interests include preprocessing andsegmentation of PET, MRI, SPECT, and CT for radiotherapytreatment planning and surgical planning, preoperative risk evalu-ation, and epileptic focus localization using EEG source imagingand fMRI.
Balukrishna Sasidharan received his master’s degree in radiationoncology from MGR Medical University, Chennai, India. He is anassociate professor of radiation oncology at the Christian MedicalCollege, Vellore. He is a clinician and researcher with interests intreating and caring for patients with solid malignancies, particularlyin head and neck, esophagus and lung. His research interests includedesign and conduct of clinical trials and improvising treatment plan-ning and related tools.
Stephen R. Bowen received his PhD in medical physics from theUniversity of Wisconsin in 2011. He is an assistant professor inthe Departments of Radiation Oncology and Radiology at theUniversity of Washington and is certified by the American Board ofRadiology in therapeutic medical physics. His current research inter-ests include quantitative molecular imaging of cancer and normal tis-sue for precision oncology strategies, including outcome predictionand biologically adaptive therapy.
Danie Kingslin Heck is a senior technologist in the Department ofNuclear Medicine at the Christian Medical College, Vellore. Hisresearch interests are in optimization of PET scanners, networking,and clinical data management.
E. James Jebaseelan Samuel received his PhD fromManonmaniamSundaranar University, Tirunelveli, India. He is a senior professor ofphysics at the VIT University. His current research interests includemedical gel dosimetry and radiotherapy treatment planning.
Journal of Medical Imaging 011009-10 Jan–Mar 2017 • Vol. 4(1)
T. Thomas et al.: Hybrid positron emission tomography segmentation. . .
Recommended