H1 2008 UK online adspend study

1. Introduction
Agenda
1. Introduction
2. Study methodology
3. Market background and trends
4. UK online adspend – headline results
5. Online in context
6. The digital media mix
7. Industry categories
8. Summary
9. Looking ahead…
10. Questions
Background
• Census of all major UK online media owners
• Official Advertising Association figures since 1997
• Information collected each half year
• Analysis available by
‒ Format
‒ Industry category
2. Methodology
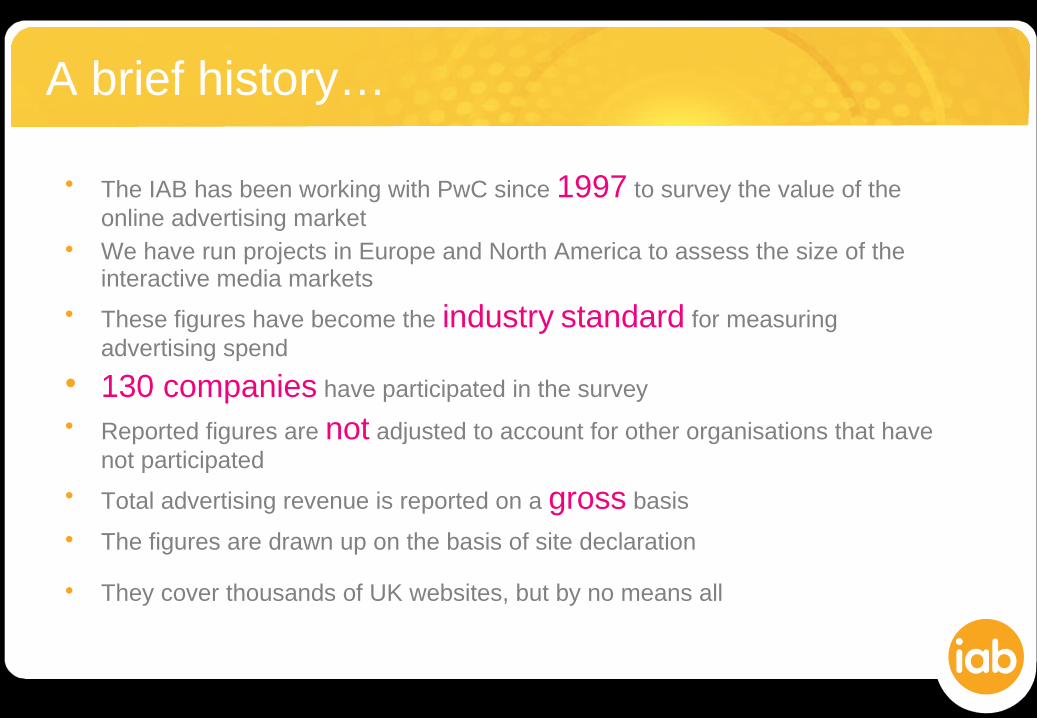
• The IAB has been working with PwC since 1997 to survey the value of the online advertising market
• We have run projects in Europe and North America to assess the size of the interactive media markets
• These figures have become the industry standard for measuring advertising spend
• 130 companies have participated in the survey
• Reported figures are not adjusted to account for other organisations that have not participated
• Total advertising revenue is reported on a gross basis
• The figures are drawn up on the basis of site declaration
• They cover thousands of UK websites, but by no means all
A brief history…
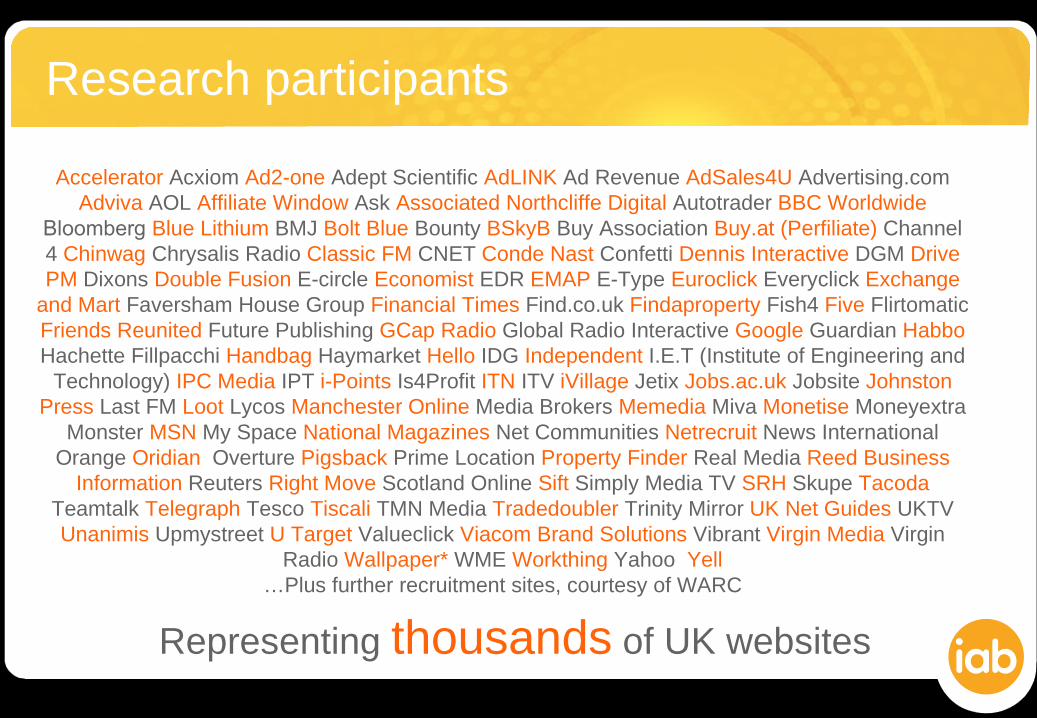
Research participants
Accelerator Acxiom Ad2-one Adept Scientific AdLINK Ad Revenue AdSales4U Advertising.com Adviva AOL Affiliate Window Ask Associated Northcliffe Digital Autotrader BBC Worldwide
Bloomberg Blue Lithium BMJ Bolt Blue Bounty BSkyB Buy Association Buy.at (Perfiliate) Channel 4 Chinwag Chrysalis Radio Classic FM CNET Conde Nast Confetti Dennis Interactive DGM Drive PM Dixons Double Fusion E-circle Economist EDR EMAP E-Type Euroclick Everyclick Exchange
and Mart Faversham House Group Financial Times Find.co.uk Findaproperty Fish4 Five Flirtomatic Friends Reunited Future Publishing GCap Radio Global Radio Interactive Google Guardian Habbo Hachette Fillpacchi Handbag Haymarket Hello IDG Independent I.E.T (Institute of Engineering and
Technology) IPC Media IPT i-Points Is4Profit ITN ITV iVillage Jetix Jobs.ac.uk Jobsite Johnston Press Last FM Loot Lycos Manchester Online Media Brokers Memedia Miva Monetise Moneyextra
Monster MSN My Space National Magazines Net Communities Netrecruit News International Orange Oridian Overture Pigsback Prime Location Property Finder Real Media Reed Business
Information Reuters Right Move Scotland Online Sift Simply Media TV SRH Skupe Tacoda Teamtalk Telegraph Tesco Tiscali TMN Media Tradedoubler Trinity Mirror UK Net Guides UKTV Unanimis Upmystreet U Target Valueclick Viacom Brand Solutions Vibrant Virgin Media Virgin
Radio Wallpaper* WME Workthing Yahoo! Yell…Plus further recruitment sites, courtesy of WARC
Representing thousands of UK websites

3. Market background
and trends
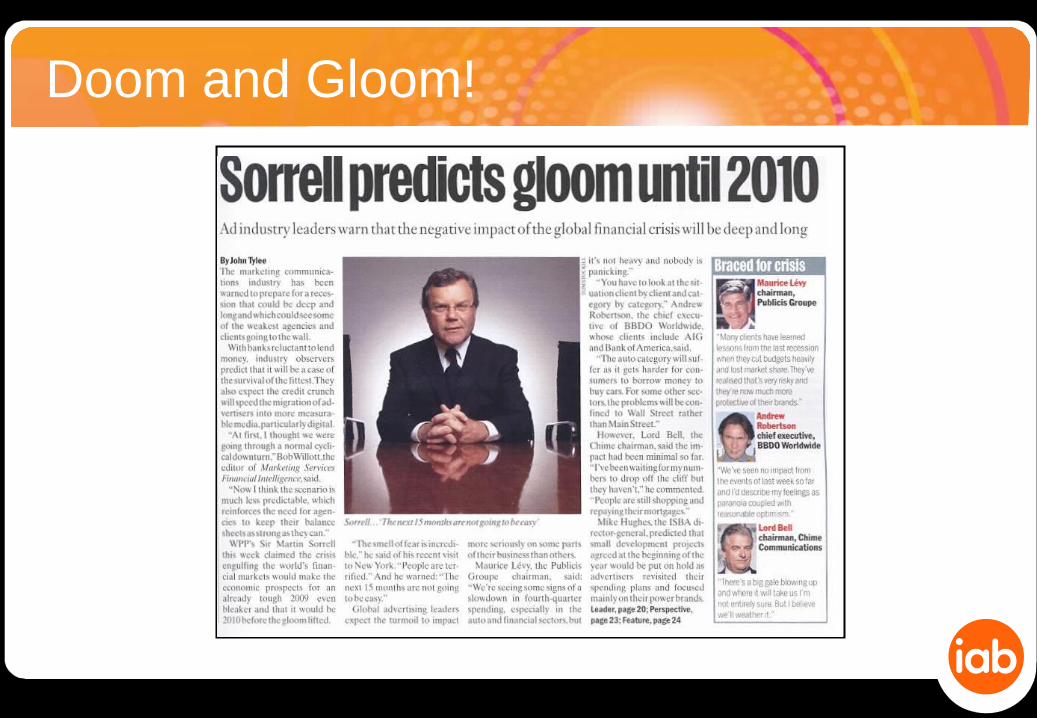
Doom and Gloom!
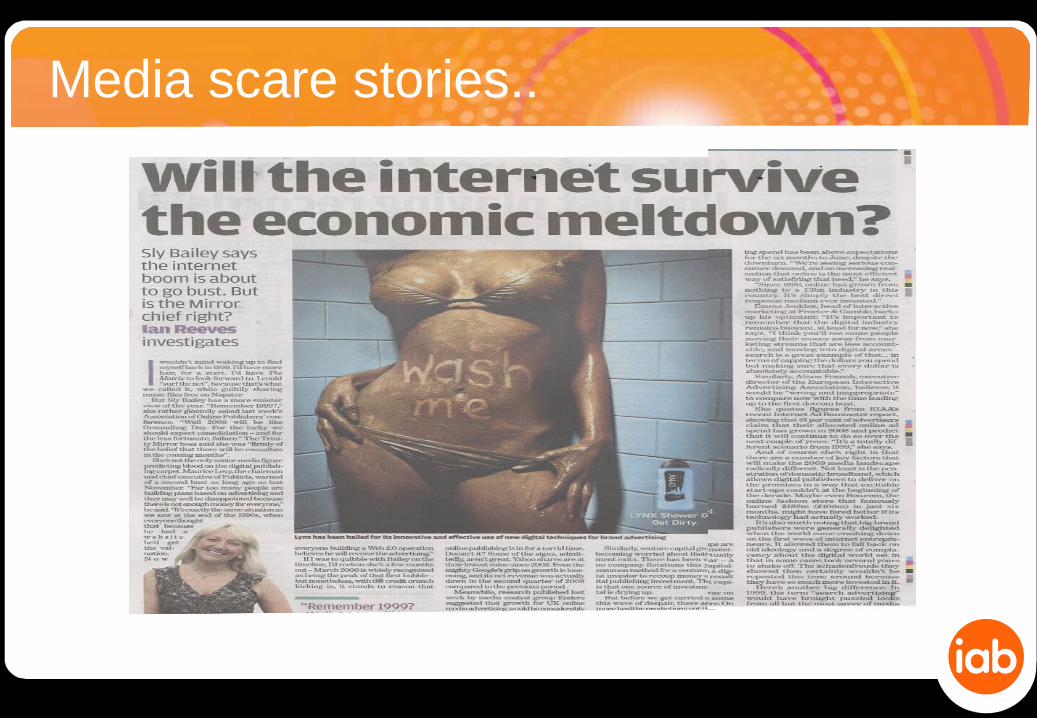
Media scare stories..
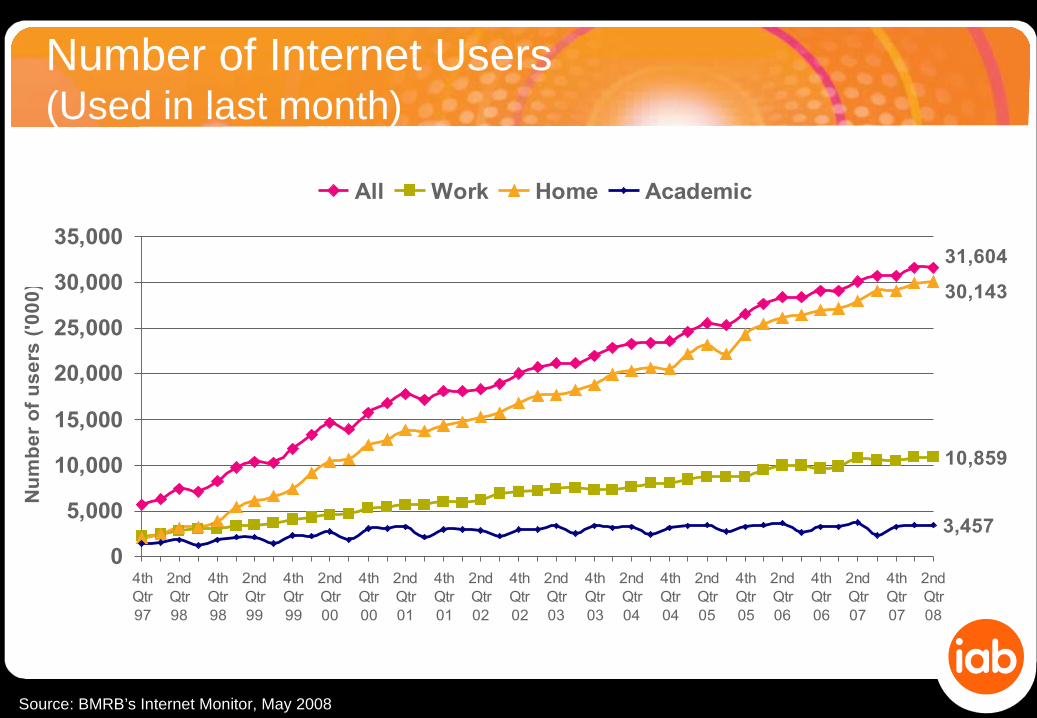
Number of Internet Users(Used in last month)
31,604
10,859
30,143
3,457
0
5,000
10,000
15,000
20,000
25,000
30,000
35,000
4thQtr97
2ndQtr98
4thQtr98
2ndQtr99
4thQtr99
2ndQtr00
4thQtr00
2ndQtr01
4thQtr01
2ndQtr02
4thQtr02
2ndQtr03
4thQtr03
2ndQtr04
4thQtr04
2ndQtr05
4thQtr05
2ndQtr06
4thQtr06
2ndQtr07
4thQtr07
2ndQtr08
Nu
mb
er
of
us
ers
('0
00
)
All Work Home Academic
Source: BMRB’s Internet Monitor, May 2008

Large majority of broadband services are now above 2 MB
19% 34%
24% 70%6%
47%
0% 20% 40% 60% 80% 100%
May '07
May '08
< 2MB2 MB>2 MB
Base: All respondents with a broadband connection at home. Q: Do you know the connection speed of your home broadband package? (May 07 - 388; May 08 - 392)
Source: BMRB Internet Monitor May 2007; May 2008
46% have used wireless broadband at home in the last month (May 2008)
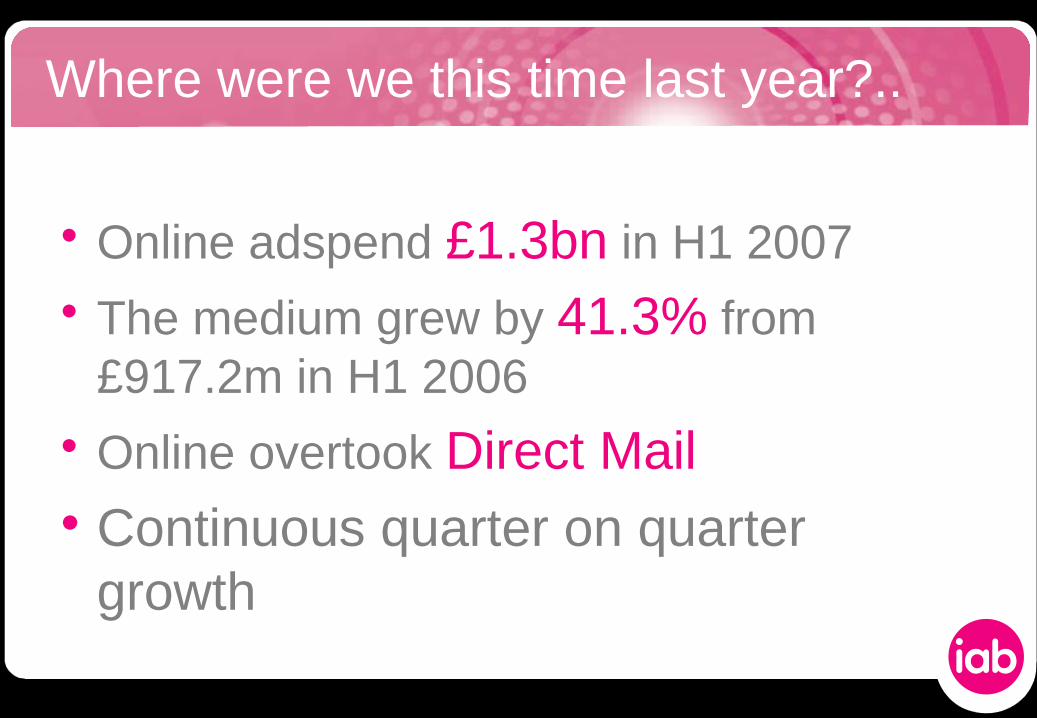
Where were we this time last year?..
• Online adspend £1.3bn in H1 2007• The medium grew by 41.3% from
£917.2m in H1 2006• Online overtook Direct Mail• Continuous quarter on quarter
growth
4. UK Online Adspend Study
Results for the H1 2008Prepared by PricewaterhouseCoopers for the IAB

£1,682.5mmarket in H1 2008
An increase of £348.2m year-on-year
Source: PricewaterhouseCoopers / Internet Advertising Bureau / WARC
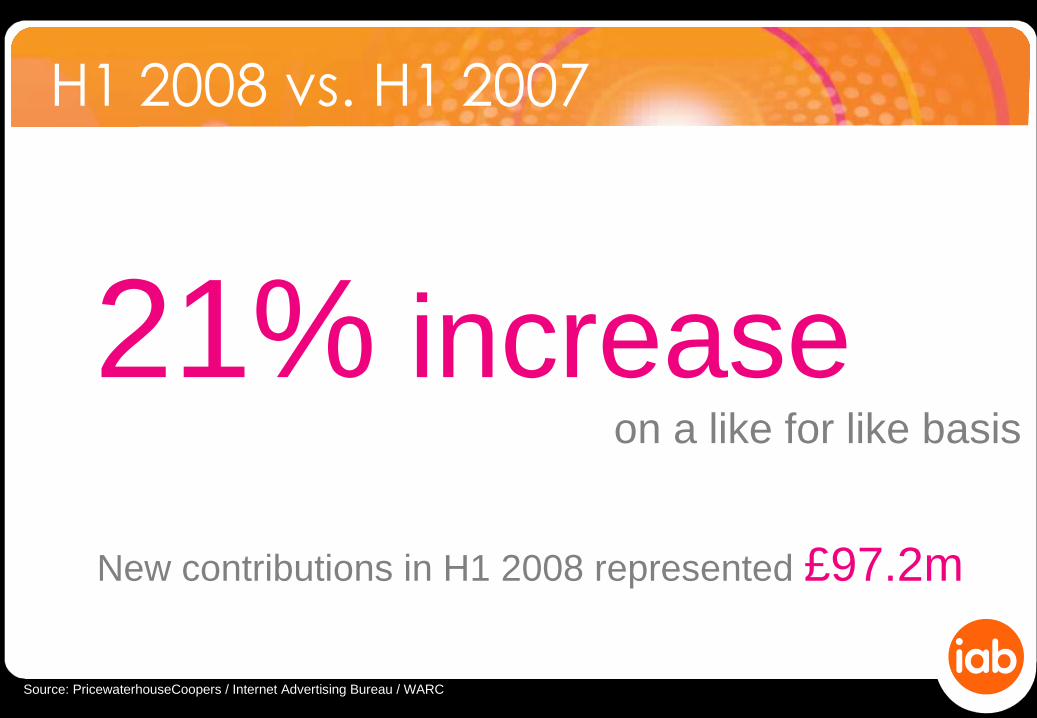
21% increase
New contributions in H1 2008 represented £97.2m
H1 2008 vs. H1 2007
on a like for like basis
Source: PricewaterhouseCoopers / Internet Advertising Bureau / WARC

Online advertising reaches £853m in Q1 08
47.442.836.638.936.645.251.163.888.0105.2119.7
152.1171.8
224.1
303.5327.0
350.5
461.2
514.9
583.7
653.8680.6
724.1
829.1
754.2
853.4
385.5456.0
174.6254.6
0
100
200
300
400
500
600
700
800
900
Q101
Q201
Q301
Q401
Q102
Q202
Q302
Q402
Q103
Q203
Q303
Q403
Q104
Q204
Q304
Q404
Q105
Q205
Q305
Q405
Q106
Q206
Q306
Q406
Q107
Q207
Q307
Q407
Q108
Q208
£ m
illio
ns
Source: PricewaterhouseCoopers / Internet Advertising Bureau / WARC
‘01 ‘03‘02 ‘04 ‘05 ‘06 ‘07 ‘08
A seasonal “dip” in Q2 appearing?
5. Online in context…Breaking market trends in the UK ad industry
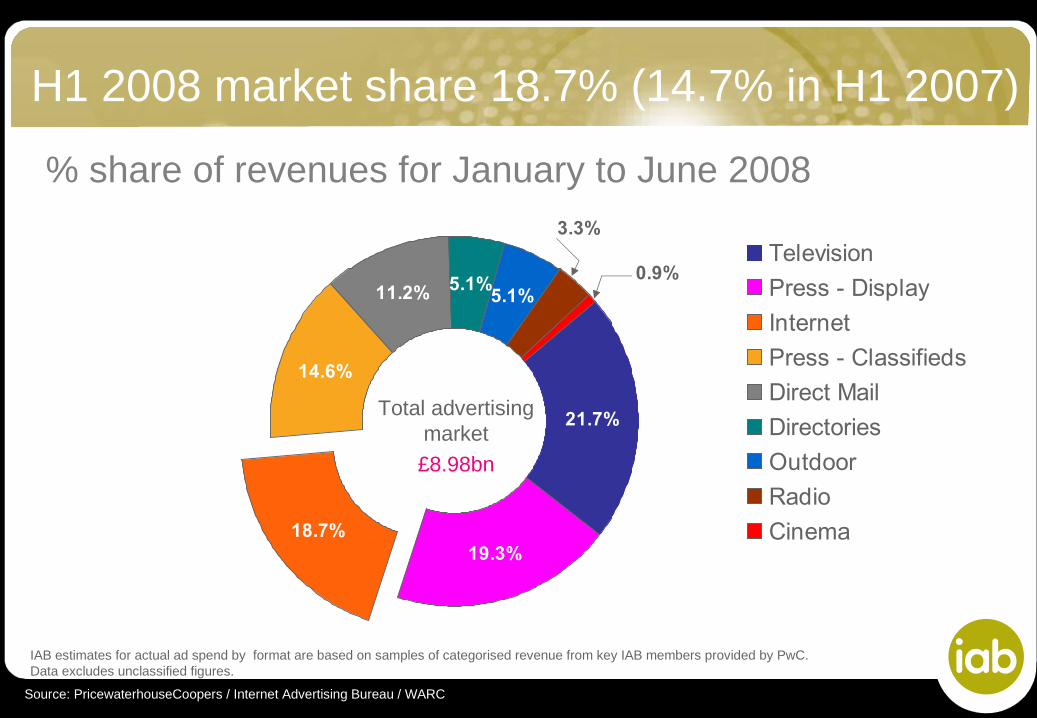
21.7%
19.3%18.7%
14.6%
11.2% 5.1%5.1%
3.3%
0.9%Television
Press - Display
Internet
Press - Classifieds
Direct Mail
Directories
Outdoor
Radio
Cinema
H1 2008 market share 18.7% (14.7% in H1 2007)
% share of revenues for January to June 2008
Source: PricewaterhouseCoopers / Internet Advertising Bureau / WARC
IAB estimates for actual ad spend by format are based on samples of categorised revenue from key IAB members provided by PwC. Data excludes unclassified figures.
Total advertisingmarket£8.98bn
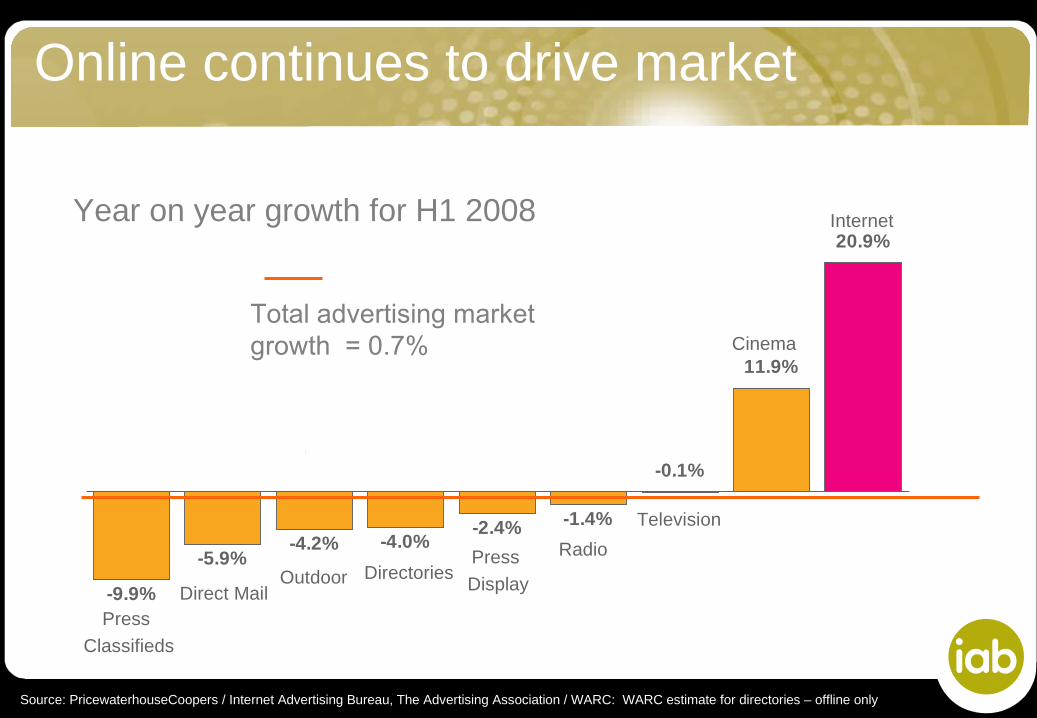
-9.9%
-5.9%-4.2% -4.0%
-2.4% -1.4%
-0.1%
11.9%
20.9%
Source: PricewaterhouseCoopers / Internet Advertising Bureau, The Advertising Association / WARC: WARC estimate for directories – offline only
Online continues to drive market
Total advertising market growth = 0.7%
Year on year growth for H1 2008 Internet
Cinema
Television
Press
Classifieds
OutdoorDirect Mail
Press
Display
RadioDirectories
Mar
ket
Sha
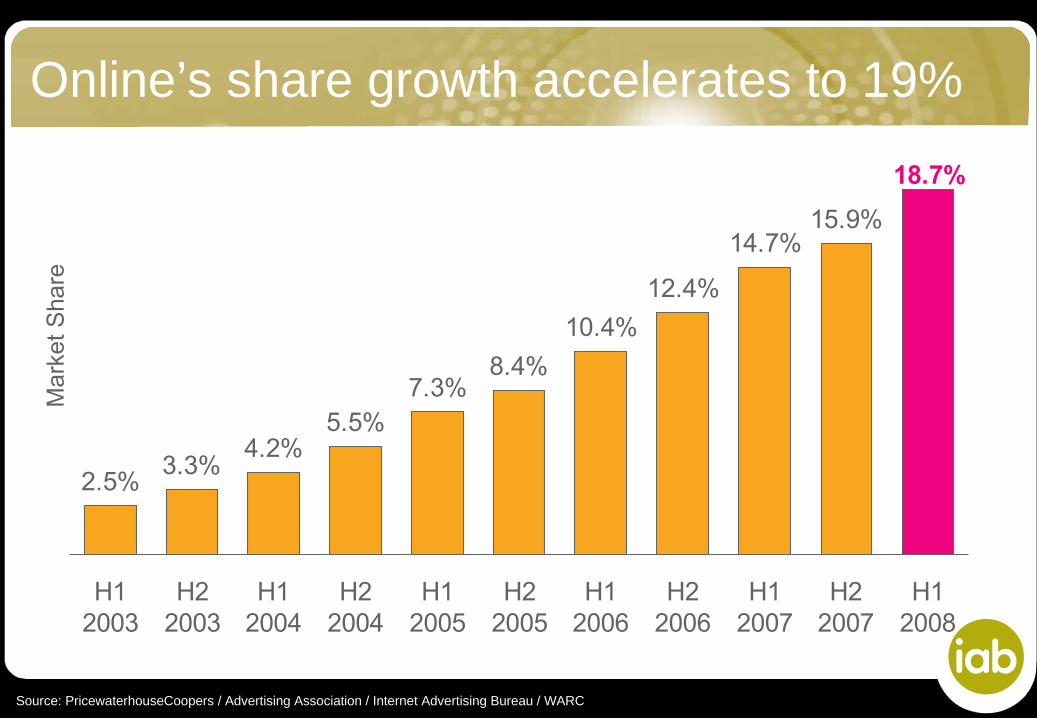
reOnline’s share growth accelerates to 19%
Source: PricewaterhouseCoopers / Advertising Association / Internet Advertising Bureau / WARC
2.5%3.3%
4.2%5.5%
7.3%8.4%
10.4%
12.4%
14.7%15.9%
18.7%
H12003
H22003
H12004
H22004
H12005
H22005
H12006
H22006
H12007
H22007
H12008
0
200
400
600
800
1000
1200
Q398
Q498
Q199
Q299
Q399
Q499
Q100
Q200
Q300
Q400
Q101
Q201
Q301
Q401
Q102
Q202
Q302
Q402
Q103
Q203
Q303
Q403
Q104
Q204
Q304
Q404
Q105
Q205
Q305
Q405
Q106
Q206
Q306
Q406
Q107
Q207
Q307
Q407
Q108
Q208
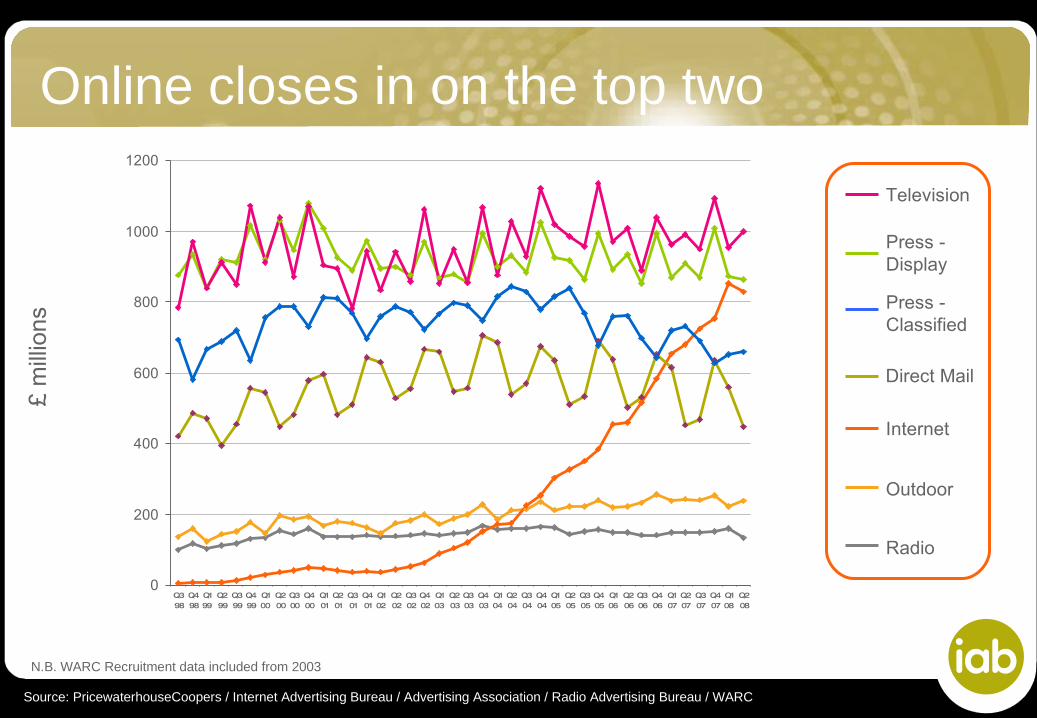
Online closes in on the top two£
mill
ions
Source: PricewaterhouseCoopers / Internet Advertising Bureau / Advertising Association / Radio Advertising Bureau / WARC
N.B. WARC Recruitment data included from 2003
Radio
Outdoor
Internet
Press - Display
Television
Press - Classified
Direct Mail
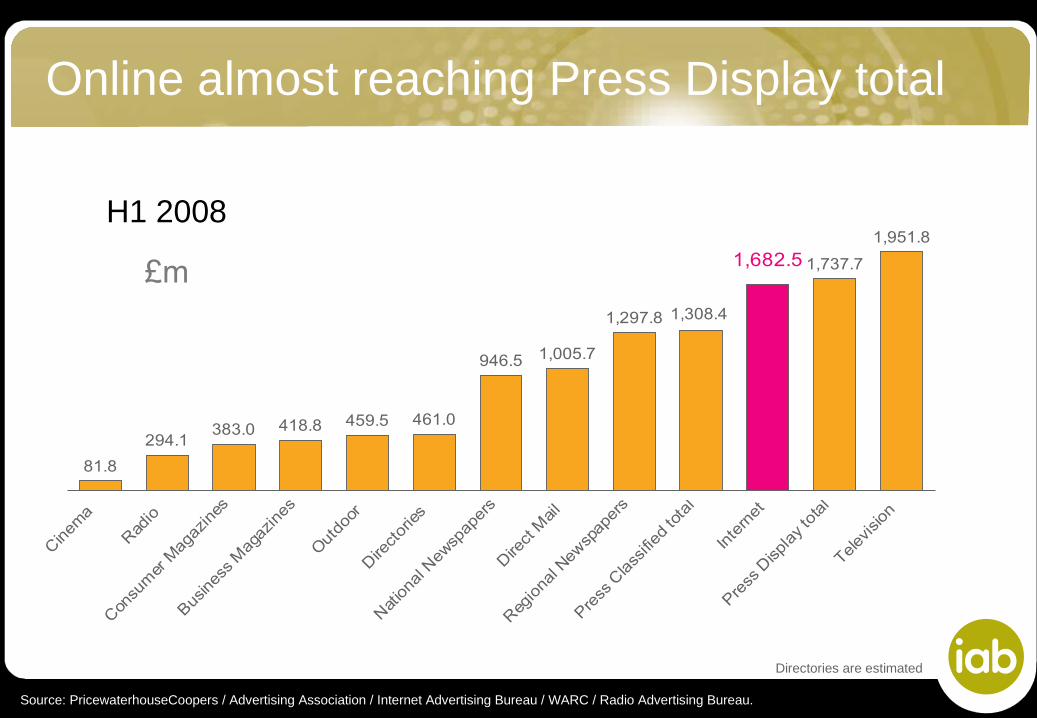
Online almost reaching Press Display total
81.8
294.1383.0 418.8 459.5 461.0
946.5 1,005.7
1,297.8
1,737.7
1,951.8
1,308.4
1,682.5
Cinem
a
Rad
io
Con
sum
er M
agaz
ines
Busines
s M
agaz
ines
Out
door
Dire
ctor
ies
Nat
iona
l New
spap
ers
Dire
ct M
ail
Reg
iona
l New
spap
ers
Press
Class
ified
tota
l
Inte
rnet
Press
Disp
lay to
tal
Telev
ision
£m
Source: PricewaterhouseCoopers / Advertising Association / Internet Advertising Bureau / WARC / Radio Advertising Bureau.
H1 2008
Directories are estimated

Summary – H1 2008
• Online advertising growth supports the entire media market
• Internet advertising reaches £1,682.5m in H1 2008
• Online achieved a share of 18.7%, up 4 points from H1 2007 (14.7%)
• The market grew on a like for like basis by 21% year-on-year, maintaining growth in a difficult climate
6. The digital media mixThe developing mix of ad products
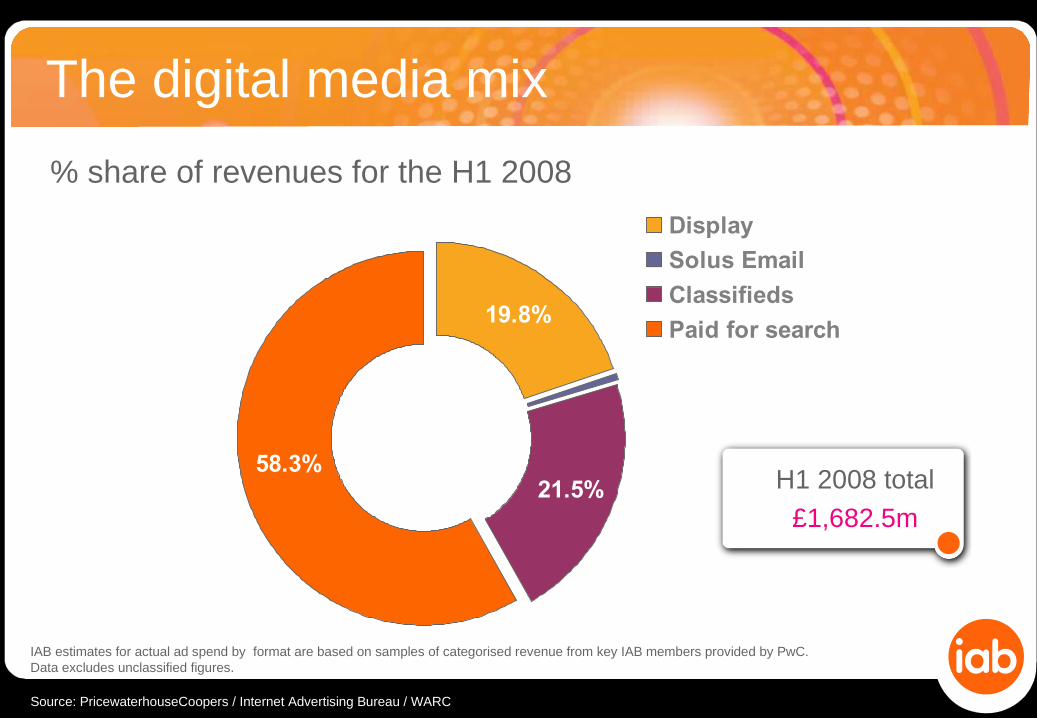
19.8%
21.5%58.3%
Display
Solus Email
Classifieds
Paid for search
Source: PricewaterhouseCoopers / Internet Advertising Bureau / WARC
IAB estimates for actual ad spend by format are based on samples of categorised revenue from key IAB members provided by PwC. Data excludes unclassified figures.
H1 2008 total
£1,682.5m
% share of revenues for the H1 2008
The digital media mix

215.9162.2
531.3
287.0 277.7
762.3
333.8 361.6
981.0
Display Classifieds Paid for search
H1 2006 H1 2007 H1 2008
£ m
illio
ns
+16.3% +30.2%
+28.7%
Source: PricewaterhouseCoopers / Internet Advertising Bureau / WARC
IAB estimates for actual ad spend by format are based on samples of categorised revenue from key IAB members provided by PwC. Data excludes unclassified figures.
The digital media mix
All online formats continue to experience growth
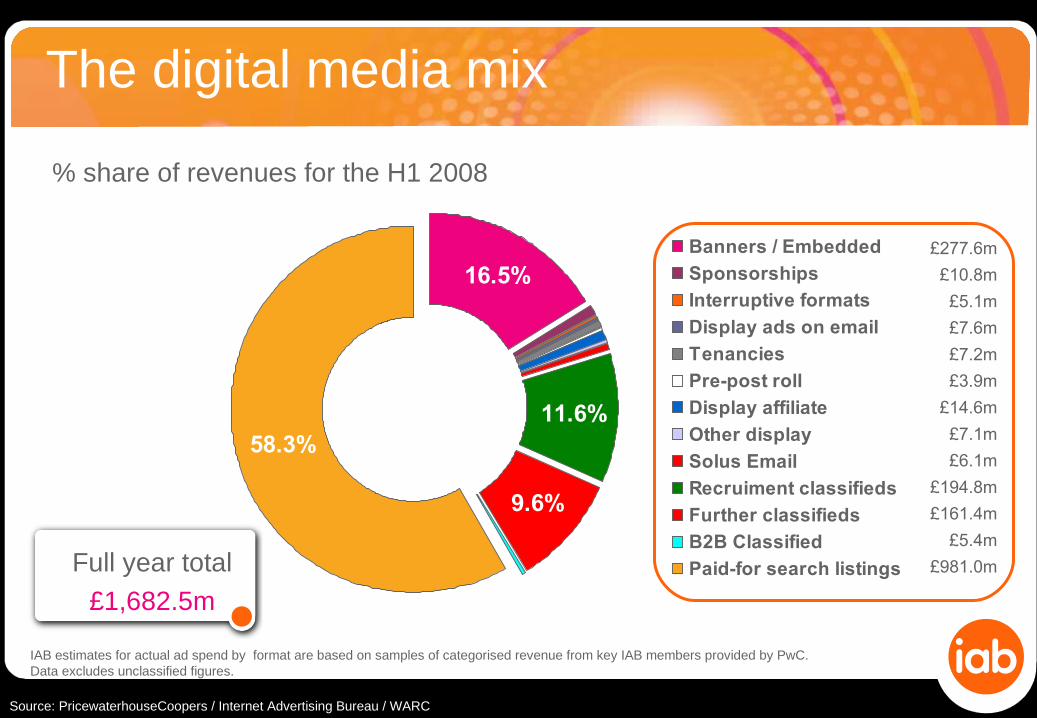
16.5%
11.6%
9.6%
58.3%
Banners / Embedded
Sponsorships
Interruptive formats
Display ads on email
Tenancies
Pre-post roll
Display affiliate
Other display
Solus Email
Recruiment classifieds
Further classifieds
B2B Classified
Paid-for search listings
The digital media mix
Source: PricewaterhouseCoopers / Internet Advertising Bureau / WARC
IAB estimates for actual ad spend by format are based on samples of categorised revenue from key IAB members provided by PwC. Data excludes unclassified figures.
Full year total
£1,682.5m
£277.6m
£10.8m
£5.1m
£7.6m
£7.2m
£3.9m
£14.6m
£7.1m
£6.1m
£194.8m
£161.4m
£5.4m
£981.0m
% share of revenues for the H1 2008
The digital media mix£
mill
ions
IAB estimates for actual ad spend by format are based on samples of categorised revenue from key IAB members provided by PwC. Data excludes unclassified figures.
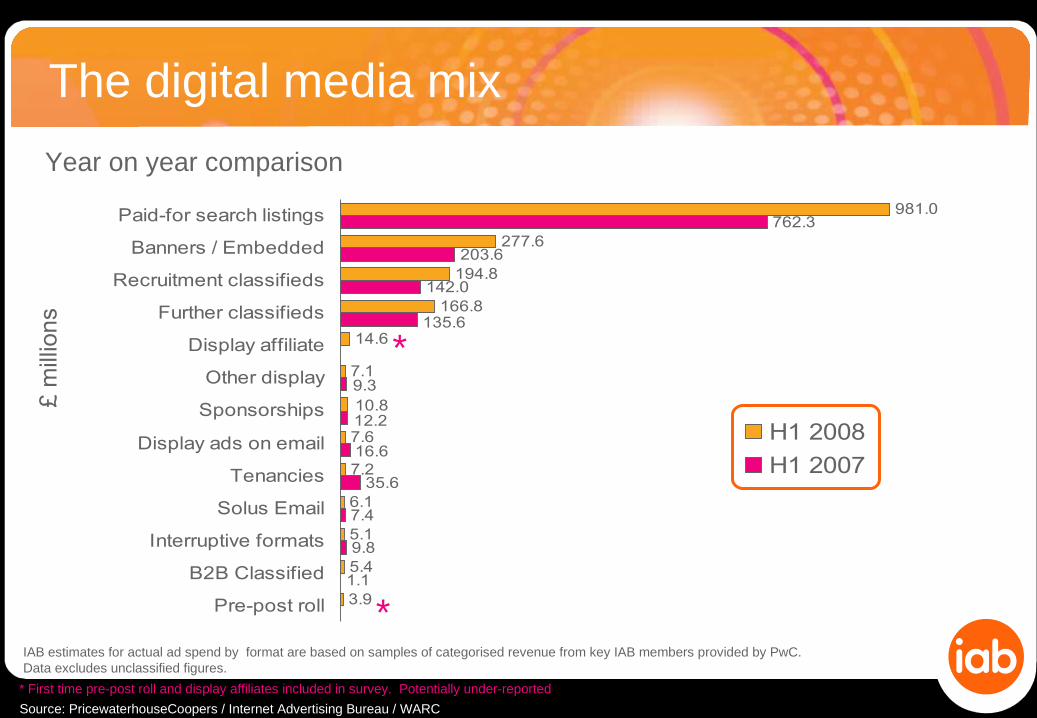
1.1
9.8
7.4
35.6
142.0
203.6
762.3
3.9
5.4
5.1
6.1
7.2
7.6
7.1
14.6
166.8
194.8
277.6
981.0
16.6
12.2
9.3
135.6
10.8
Pre-post roll
B2B Classified
Interruptive formats
Solus Email
Tenancies
Display ads on email
Sponsorships
Other display
Display affiliate
Further classifieds
Recruitment classifieds
Banners / Embedded
Paid-for search listings
H1 2008
H1 2007
Source: PricewaterhouseCoopers / Internet Advertising Bureau / WARC
Year on year comparison
*
* First time pre-post roll and display affiliates included in survey. Potentially under-reported
*
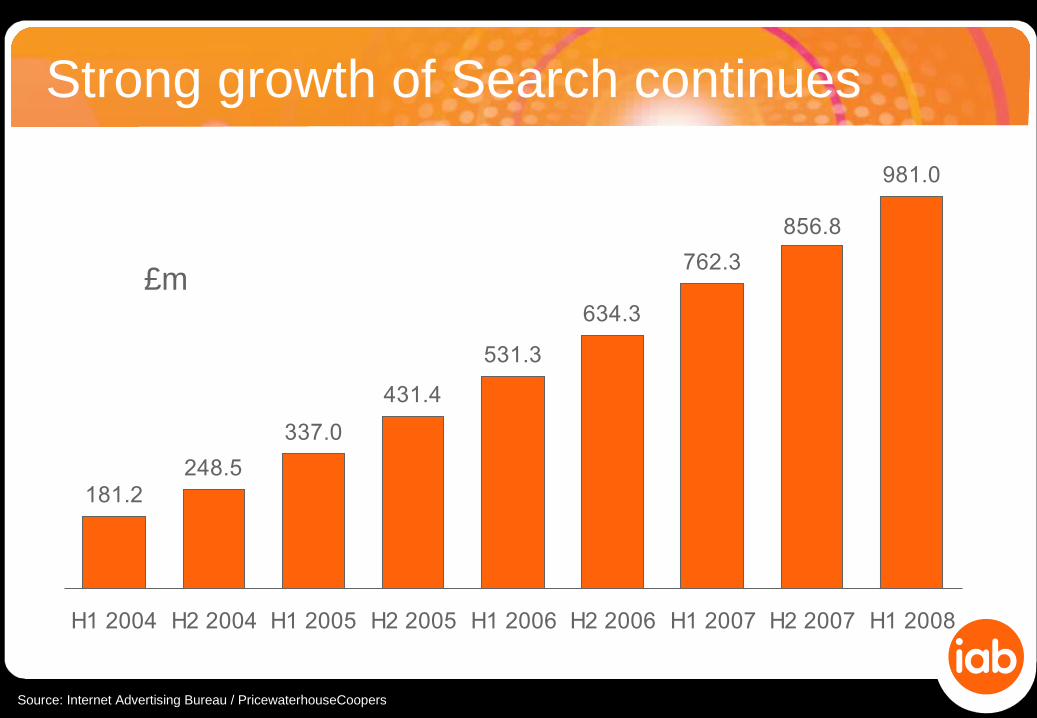
Strong growth of Search continues
181.2248.5
337.0
431.4
531.3
634.3
762.3
981.0
856.8
H1 2004 H2 2004 H1 2005 H2 2005 H1 2006 H2 2006 H1 2007 H2 2007 H1 2008
£m
Source: Internet Advertising Bureau / PricewaterhouseCoopers
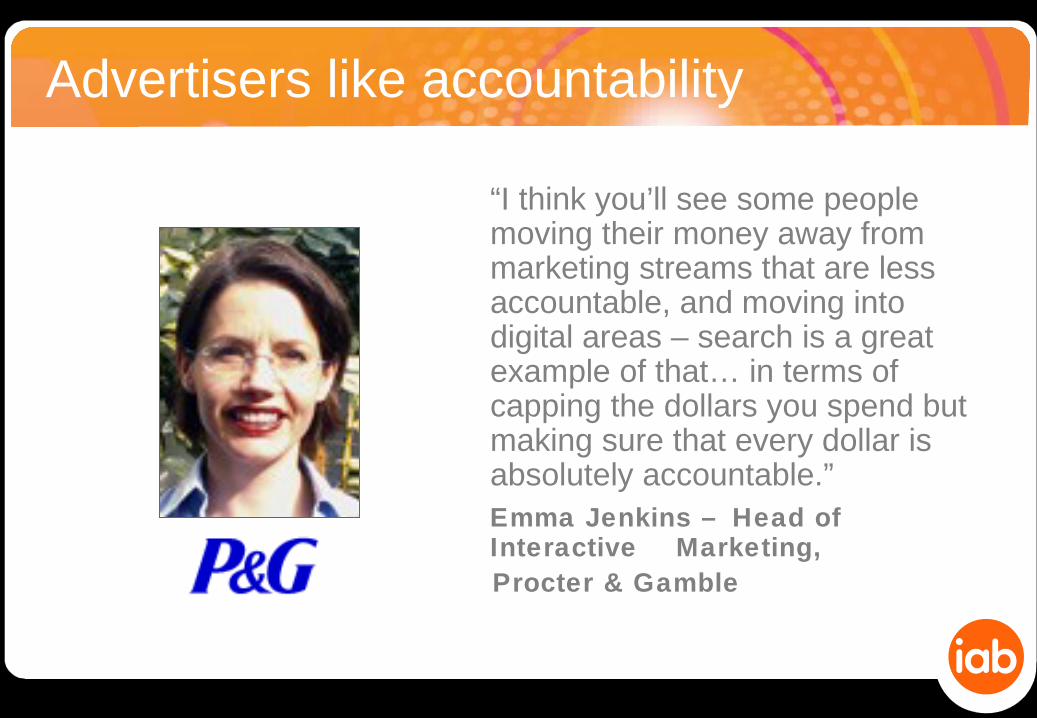
Advertisers like accountability
“I think you’ll see some people moving their money away from marketing streams that are less accountable, and moving into digital areas – search is a great example of that… in terms of capping the dollars you spend but making sure that every dollar is absolutely accountable.”
Emma Jenkins – Head of Interactive Marketing,
Procter & Gamble

53.8 67.4 94.4 87.6 102.8 112.3142.0 144.8
194.8
14.326.0
37.0 43.359.3
104.5
135.6162.8
166.8
0
50
100
150
200
250
300
350
400
H12004
H22004
H12005
H22005
H12006
H22006
H12007
H22007
H12008
Recruiment classifieds Other classifieds
£m
Source: Internet Advertising Bureau / PricewaterhouseCoopers
Growth in all classifieds
Classifieds led by key players
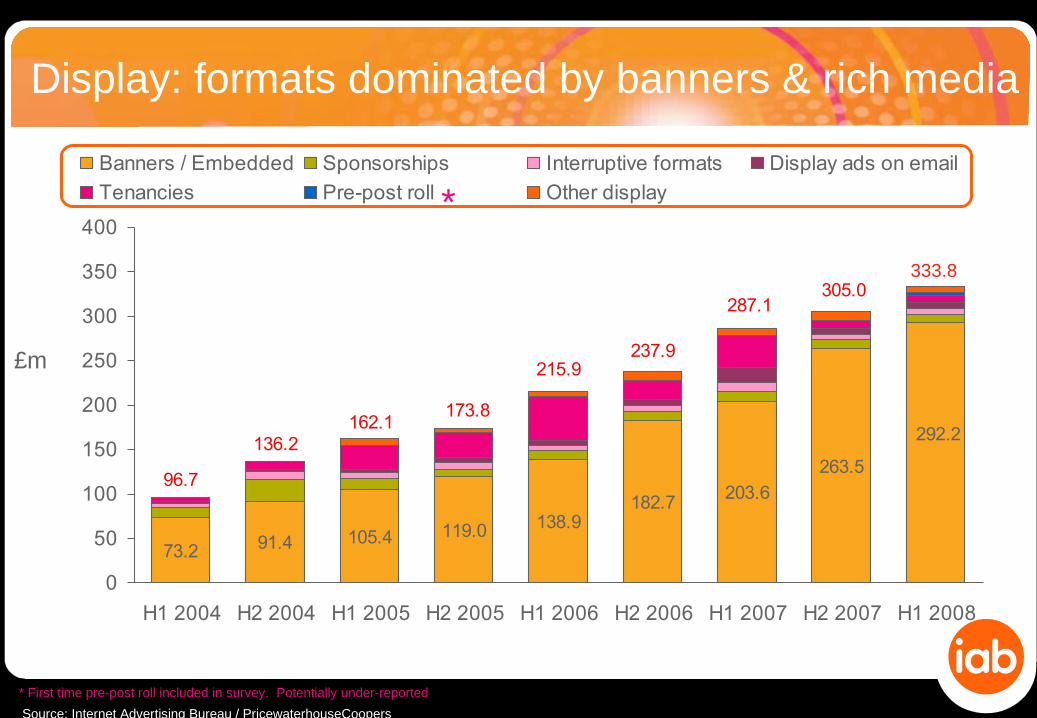
Display: formats dominated by banners & rich media
73.2 91.4 105.4 119.0 138.9182.7 203.6
263.5
292.2
96.7
136.2162.1
173.8
215.9237.9
287.1305.0
0
50
100
150
200
250
300
350
400
H1 2004 H2 2004 H1 2005 H2 2005 H1 2006 H2 2006 H1 2007 H2 2007 H1 2008
Banners / Embedded Sponsorships Interruptive formats Display ads on email
Tenancies Pre-post roll Other display
£m
Source: Internet Advertising Bureau / PricewaterhouseCoopers
333.8
* First time pre-post roll included in survey. Potentially under-reported
*
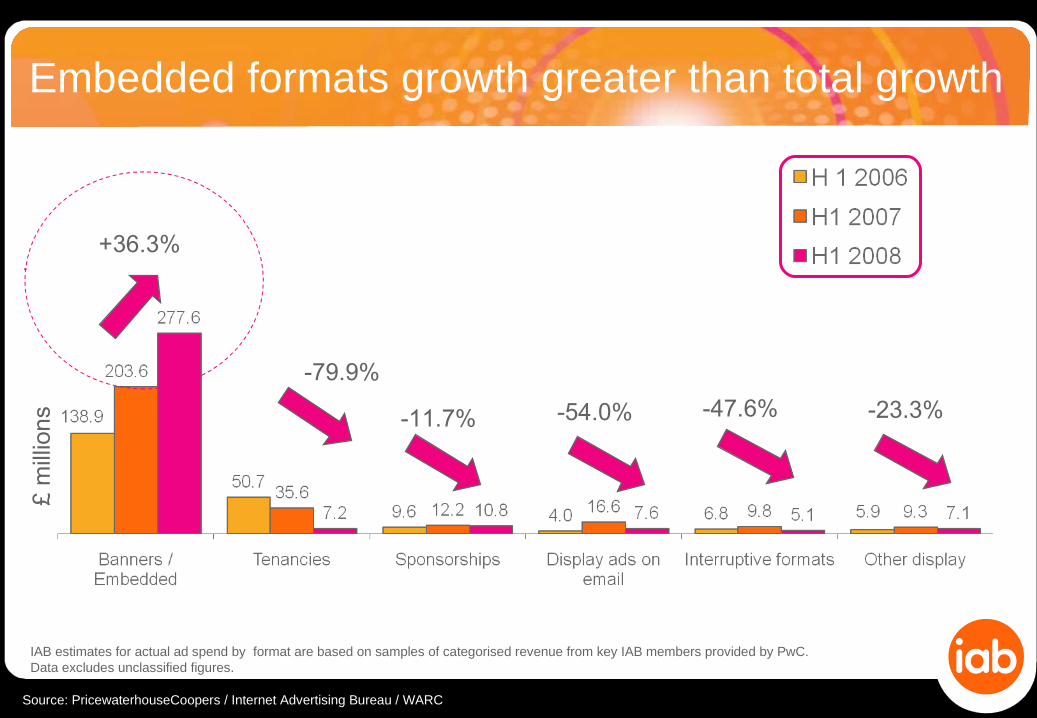
Embedded formats growth greater than total growth£
mill
ions
IAB estimates for actual ad spend by format are based on samples of categorised revenue from key IAB members provided by PwC. Data excludes unclassified figures.
Source: PricewaterhouseCoopers / Internet Advertising Bureau / WARC
+36.3%
-47.6%-11.7% -23.3%-54.0%
-79.9%
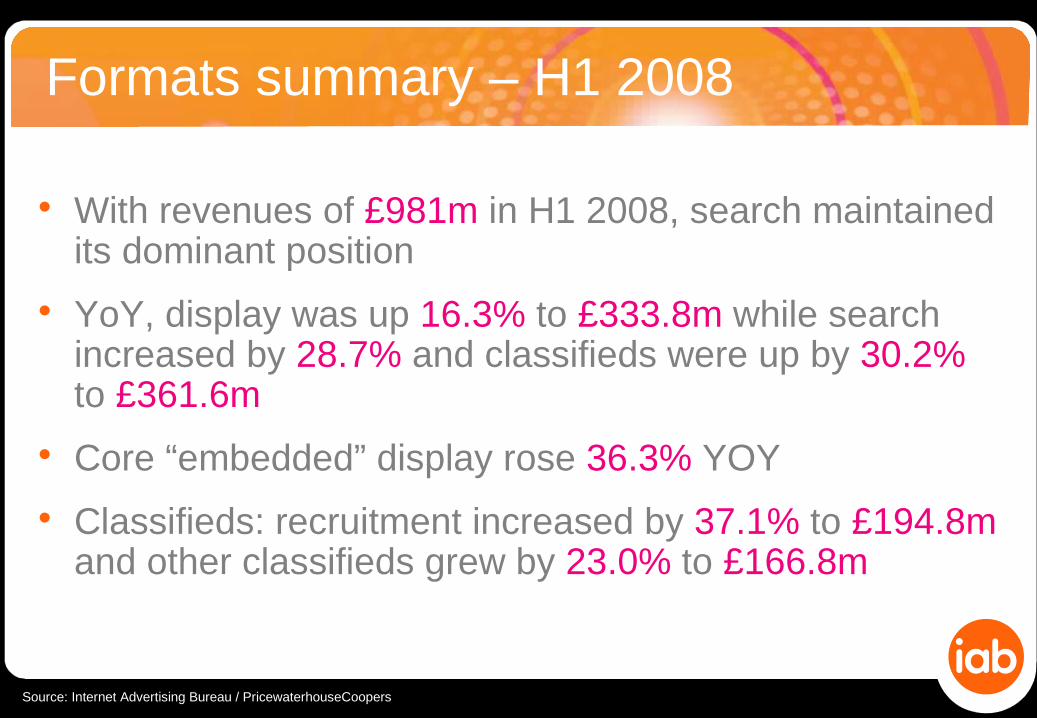
Formats summary – H1 2008
• With revenues of £981m in H1 2008, search maintained its dominant position
• YoY, display was up 16.3% to £333.8m while search increased by 28.7% and classifieds were up by 30.2% to £361.6m
• Core “embedded” display rose 36.3% YOY
• Classifieds: recruitment increased by 37.1% to £194.8m and other classifieds grew by 23.0% to £166.8m
Source: Internet Advertising Bureau / PricewaterhouseCoopers

7. Industry categories

Source: PricewaterhouseCoopers / Internet Advertising Bureau / WARC
IAB estimates for industry sector shares are based on samples of categorised net revenue from key IAB members provided by PwC. Data excludes unclassified figures and covers 37% of online revenues in H1 2008.
Recruitment continues to lead the market
0.1%0.3%
1.9%
2.5%
2.5%
2.8%
2.9%
4.2%
4.8%
5.2%
6.2%
9.4%
11.1%
13.0%
32.9%
Gardening & Agriculture
Leisure
Government & other organisations
Business & Industrial
Consumer-to-consumer Classifieds
Retail
Consumer Goods
Travel & Transport
Telecoms
Entertainment & Media
Finance
Technology
Property
Automotive
Recruitment
Based on 37% oftotal ad spend –
largely display
And classifieds

Sector Market Shares
0.4%
1.0%
1.5%
3.2%
0.0%
3.1%
6.7%
0.1%
0.3%
1.9%
2.5%
2.5%
2.8%
2.9%
4.2%
4.8%
5.2%
6.2%
9.4%
11.1%
13.0%
32.9%
5.3%
6.0%
11.1%
5.7%
24.7%
12.5%
11.7%
7.2%
Gardening & Agriculture
Leisure
Government & other organisations
Business & Industrial
Consumer-to-consumer Classifieds
Retail
Consumer Goods
Travel & Transport
Telecoms
Entertainment & Media
Finance
Technology
Property
Automotive
Recruitment
H1 2008
H1 2007
IAB estimates for industry sector shares are based on samples of categorised net revenue from key IAB members provided by PwC. Data excludes unclassified figures and covers 37% of online revenues in H1 2008.
Source: PricewaterhouseCoopers / Internet Advertising Bureau / WARC
Based on 37% of
total ad spend – largely display and classifieds
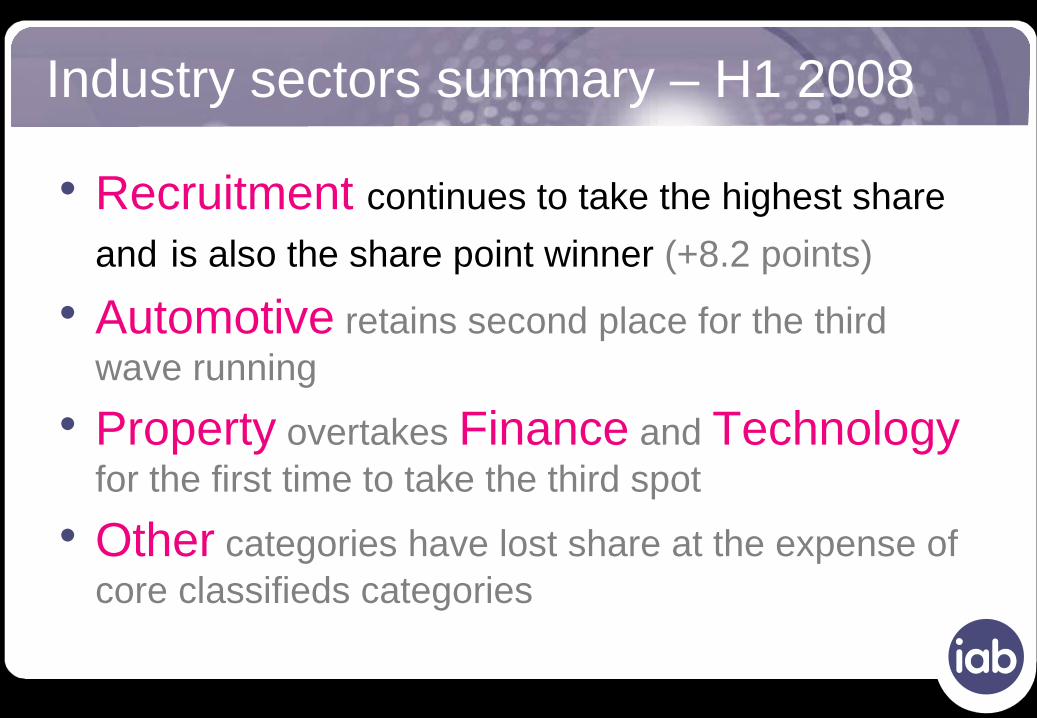
• Recruitment continues to take the highest share
and is also the share point winner (+8.2 points)
• Automotive retains second place for the third wave running
• Property overtakes Finance and Technology for the first time to take the third spot
• Other categories have lost share at the expense of core classifieds categories
Industry sectors summary – H1 2008

Source: PricewaterhouseCoopers / Internet Advertising Bureau / WARC
IAB estimates for industry sector shares are based on samples of categorised net revenue from key IAB members provided by PwC. Data excludes unclassified figures and covers 87% of online display revenues in H1 2008. NB – an immaterial amount of these figures are classifieds
Isolating display gives a different picture
0.7%
0.9%
1.9%
3.6%
4.1%
6.2%
6.3%
8.3%
8.4%
9.7%
9.9%
10.7%
11.9%
17.3%
Leisure Equipment
Classified - Consumer-to-consumer
Property
Business and Industrial
Government, social, poiltical organisations
Consumer Goods
Retail
Automotive
Travel & Transport
Telecomms
Recruitment
Entertainment & the Media
Finance
Technology
Based on 87% of total display ad spend

8. Summary
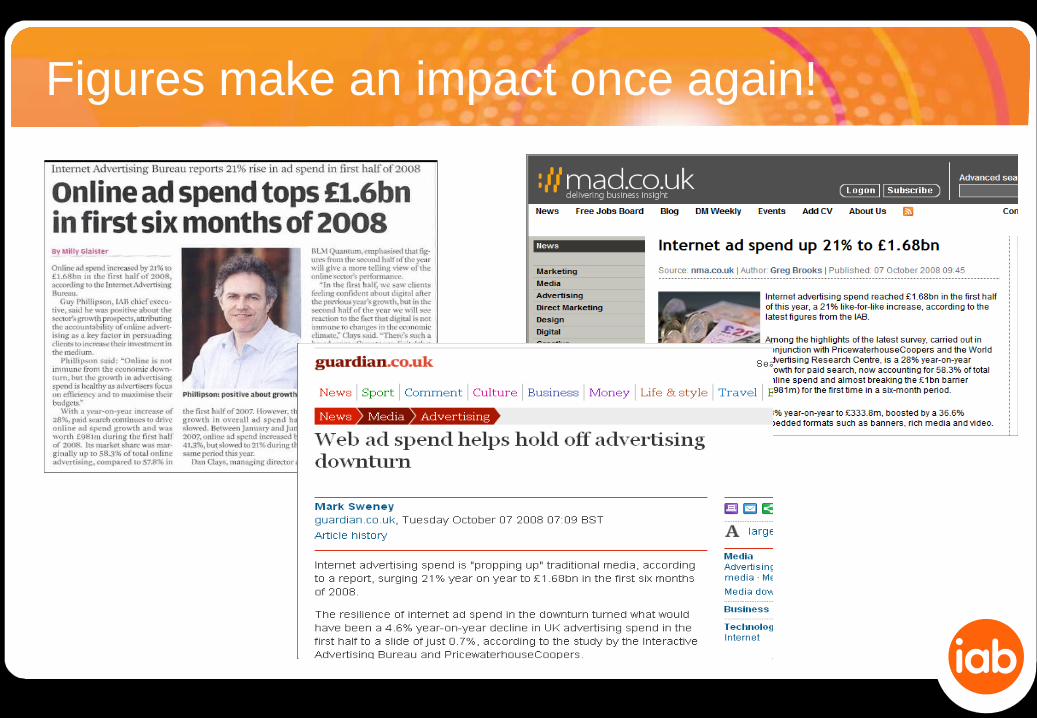
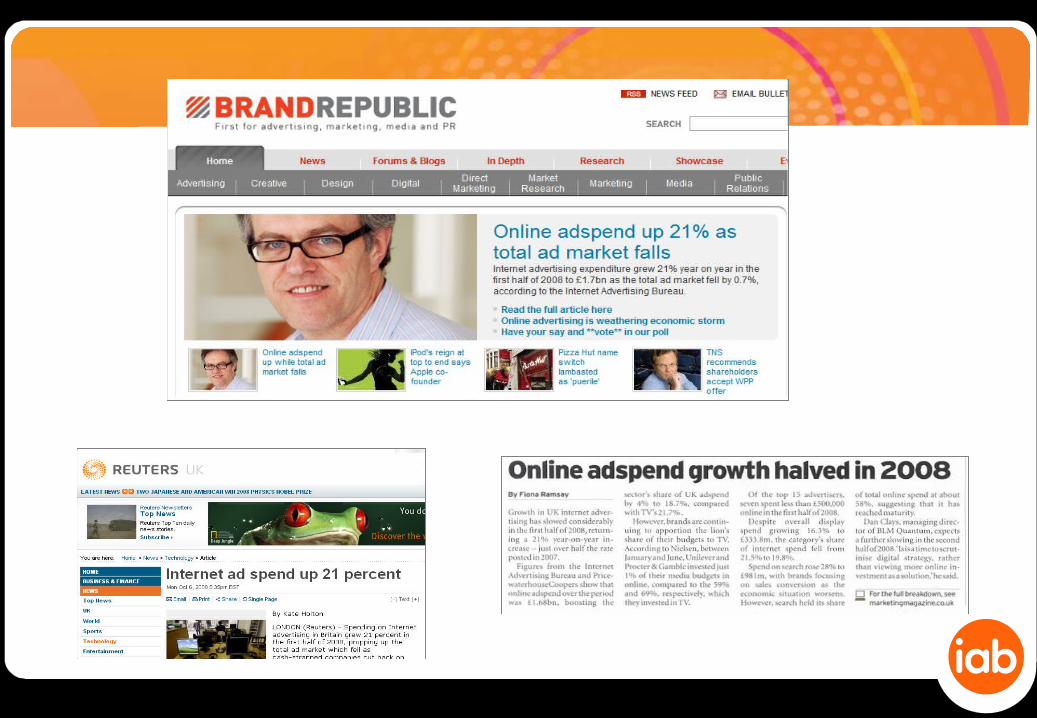
Figures make an impact once again!
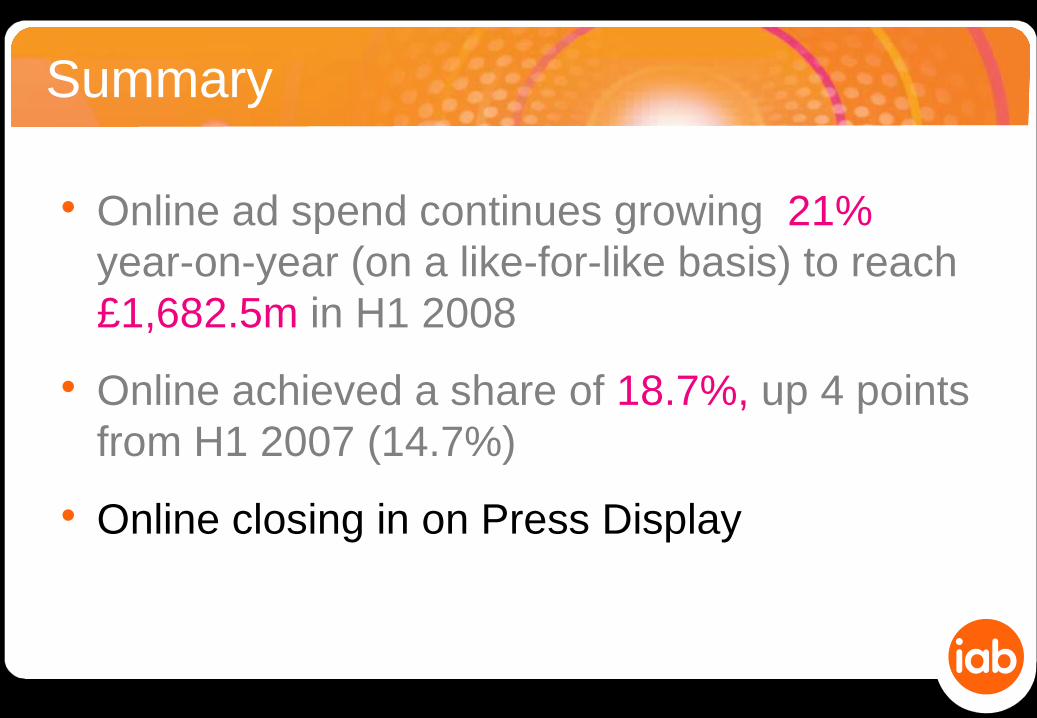
Summary
• Online ad spend continues growing 21% year-on-year (on a like-for-like basis) to reach £1,682.5m in H1 2008
• Online achieved a share of 18.7%, up 4 points from H1 2007 (14.7%)
• Online closing in on Press Display
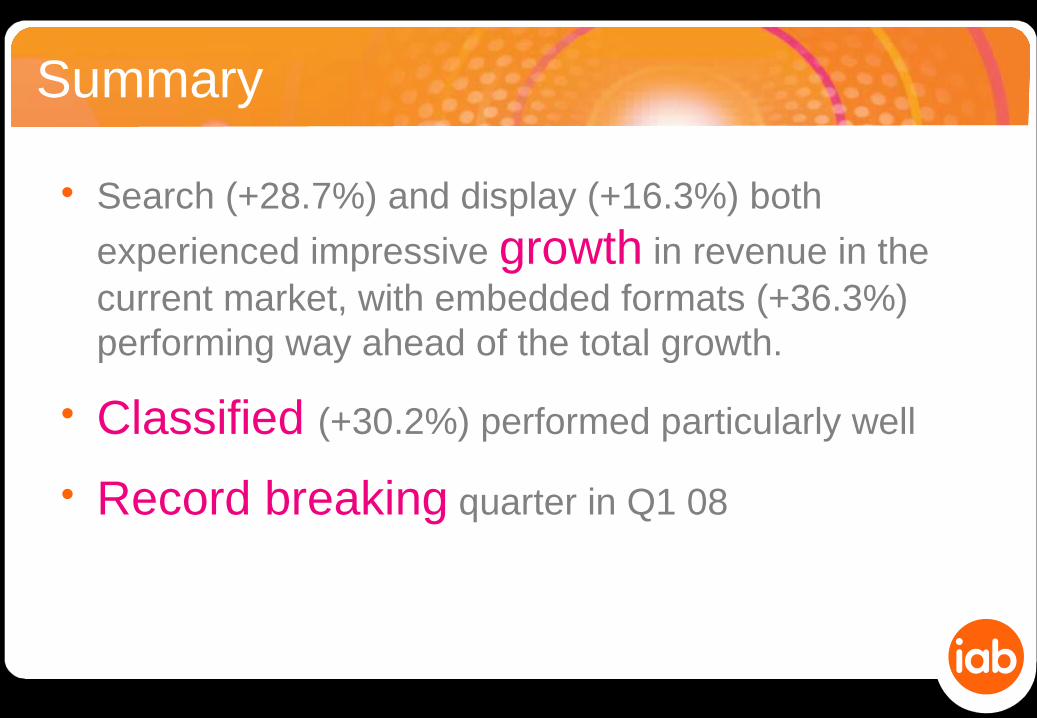
Summary
• Search (+28.7%) and display (+16.3%) both
experienced impressive growth in revenue in the current market, with embedded formats (+36.3%) performing way ahead of the total growth.
• Classified (+30.2%) performed particularly well
• Record breaking quarter in Q1 08

9. Looking ahead

Online draws level with total Press display
0
200
400
600
800
1000
1200
Q103
Q203
Q303
Q403
Q104
Q204
Q304
Q404
Q105
Q205
Q305
Q405
Q106
Q206
Q306
Q406
Q107
Q207
Q307
Q407
Q108
Q208
Internet Press Display
£m
Source: PricewaterhouseCoopers / Advertising Association / Internet Advertising Bureau / WARC
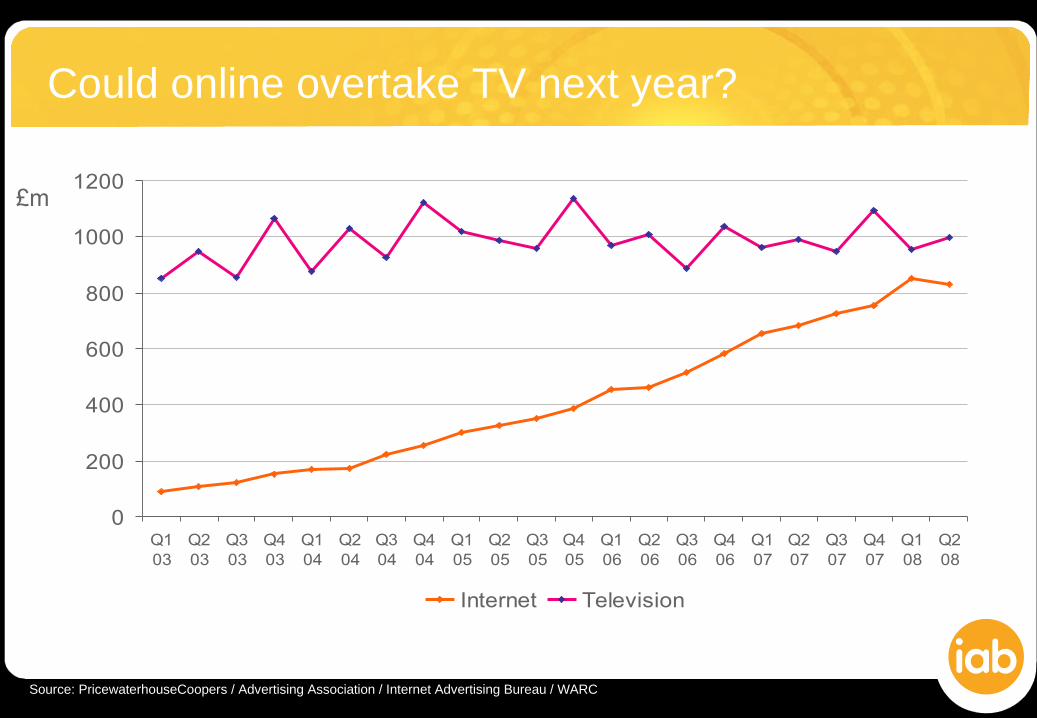
Could online overtake TV next year?
0
200
400
600
800
1000
1200
Q103
Q203
Q303
Q403
Q104
Q204
Q304
Q404
Q105
Q205
Q305
Q405
Q106
Q206
Q306
Q406
Q107
Q207
Q307
Q407
Q108
Q208
Internet Television
£m
Source: PricewaterhouseCoopers / Advertising Association / Internet Advertising Bureau / WARC

£
Our current forecast range for 2008 is…
£3.2 £3.3bn£2.81billion in 2007
All of the 130 companies taking part, representing thousands of websites
and to
Our thanks to…
Paul Rosen, Executive and
Paul Pilkington, Director
Colin Macleod, Research Director
Recommended