Identifying High Risk Individuals in Youth Football and Evaluating Tackling Technique
Ryan A. Gellner
Thesis submitted to the faculty of the Virginia Polytechnic Institute and State University in partial fulfillment of the requirements for the degree of
Master of Science
In Biomedical Engineering
Steven Rowson, Chair Stefan M. Duma Per G. Brolinson
April 4, 2018 Blacksburg, VA
Keywords: youth football, individual, head acceleration, high magnitude, tackling form,
individual intervention, helmet, force-deflection
Copyright © 2018, Ryan Gellner

Identifying High Risk Individuals in Youth Football and Evaluating Tackling Technique
Ryan A. Gellner
ACADEMIC ABSTRACT
Nearly 3.5 million kids play youth football every year in the United States, many in independent organizations with few or no rules for limiting head impact exposure in practices or competition. Studies have found potential long-term effects of repetitive head impact exposure from a young age, even in the absence of concussion. The best methods for reducing head impact exposure include a multi-pronged approach: limiting contact through rules changes, teaching proper technique for contact, and designing equipment with better protective capabilities.
Four youth football teams were studied for one season each using helmet mounted accelerometer arrays. The instrumentation measured all head accelerations the athletes experienced above a 10 g threshold. Head acceleration data indicated that youth teams often have a small subset of players who account for a disproportionately large number of high-risk (>40 g) head impacts. As few as six players (6%) accounted for over 50% of all high-risk impacts seen in practice sessions. Technique used during tackling and tackle-absorption had considerable effect on head acceleration experienced. Both the tackler and ball carrier were found to be at greater risk for high magnitude head impacts when exhibiting poor form as defined by specific tackling recommendation criteria.
These data suggest that individualized interventions encouraging proper form, especially for a subset of impact-prone players, may be beneficial in reducing high magnitude head impact exposure for an entire youth football team. This is especially critical because a majority of high-risk impacts are experienced in practice at the youth level.

Identifying High Risk Individuals in Youth Football and Evaluating Tackling Technique
Ryan A. Gellner
GENERAL AUDIENCE ABSTRACT
Nearly 3.5 million kids play youth football every year in the United States, many in independent organizations with few or no rules for limiting head impact exposure in practices or competition. Studies have found potential long-term effects of repetitive head impact exposure from a young age, even in the absence of concussion. The best methods for reducing head impact exposure include a multi-pronged approach: limiting contact through rules changes, teaching proper technique for contact when it does occur, and designing equipment with better protective capabilities. Four youth football teams were studied for one season each using helmet mounted accelerometer arrays. Head acceleration data indicated that youth teams often have a small subset of players who account for a disproportionately large number of high-risk head impacts. As few as six players (6%) accounted for over 50% of all high-risk impacts seen in practice sessions. Technique used during tackling and tackle-absorption had considerable effect on head acceleration. Both the tackler and ball carrier were found to be at greater risk for high magnitude head impacts when exhibiting poor form as defined by specific tackling recommendation criteria. These data suggest that individualized interventions encouraging proper form, especially for a subset of impact-prone players, may be beneficial in reducing high magnitude head impact exposure for an entire youth football team. This is especially critical because a majority of high-risk impacts are experienced in practice at the youth level. Results from this work could be applied by coaching staffs in youth football leagues to increase the safety of their athletes.
iv
ACKNOWLEDGEMENTS
I would first like to thank my Lord and Savior for carving my path to Blacksburg and continuing to lead me as I leave. I owe all to Him.
I would like to acknowledge Virginia Tech and Wake Forest for their excellent collaboration in creating the learning environment that is the School of Biomedical Engineering and Sciences. I will always be grateful for the kindness and encouragement of the faculty and staff.
I would like to thank Dr. Steve Rowson, my advisor and mentor, for his patience, kindness, and unrelenting desire to lead his lab with integrity. Gratitude also goes to my committee Dr. Brolinson and Dr. Duma for their guidance and mentorship. I owe thanks to Eamon Campolettano, my partner on the youth football project, for his friendship and incredible work ethic. As for the youth football parents, coaches, organizers, and players – I have enjoyed being a part of your football season, and I appreciate your willingness to participate!
Thanks goes to my lab mates Ty, Emily, Davy, Megan, Abi, and Bethany as well as the interns who have been a part of the lab, for being willing to drop anything to help me with my work. My family and friends, both in Blacksburg and West Virginia, have also been an incredible encouragement during my time at Virginia Tech. I would especially like to thank my fiancé Blake for toughing out the long-distance part of our relationship these last two years!
I would like to extend my gratitude to Craig McNally, Dr. Scott Gayzik, Dr. Philip Brown, and Dr. Andrew Kemper for the equipment they developed and lent to my work.
Research reported in this thesis was supported by the National Institute of Neurological Disorders and Stroke of the National Institutes of Health under Award Number R01NS094410. The content is solely the responsibility of the authors and does not necessarily represent the official views of the National Institutes of Health.

v
TABLE OF CONTENTS
ACADEMIC ABSTRACT ............................................................................................................ i PUBLIC ABSTRACT .................................................................................................................... i
ACKNOWLEDGEMENTS ........................................................................................................ iv
TABLE OF CONTENTS ............................................................................................................. v
LIST OF FIGURES .................................................................................................................... vii LIST OF TABLES ....................................................................................................................... ix
ATTRIBUTION ............................................................................................................................ x
INTRODUCTION......................................................................................................................... 1
CHAPTER 1 .................................................................................................................................. 4
Abstract ....................................................................................................................................... 4
Introduction ................................................................................................................................. 5
Methods ....................................................................................................................................... 6
Results ....................................................................................................................................... 10
High Magnitude Accelerations Experienced vs High Magnitude Impact Involvement ..................... 11
Discussion ................................................................................................................................. 14
Conclusions ............................................................................................................................... 19
References ................................................................................................................................. 20
CHAPTER 2 ................................................................................................................................ 23
Abstract ..................................................................................................................................... 23
Introduction ............................................................................................................................... 23
Methods ..................................................................................................................................... 25
Results ....................................................................................................................................... 27
Discussion ................................................................................................................................. 30
Conclusions ............................................................................................................................... 32
References ................................................................................................................................. 32
CHAPTER 3 ................................................................................................................................ 34
Abstract ..................................................................................................................................... 34
Introduction ............................................................................................................................... 35
Methods ..................................................................................................................................... 36
Selection of Criteria ............................................................................................................................ 36
Measuring Reliability .......................................................................................................................... 38
Association with Head Acceleration ................................................................................................... 42

vi
Results ....................................................................................................................................... 44
Balance ................................................................................................................................................ 46
Posture................................................................................................................................................. 47
Line of Sight ....................................................................................................................................... 48
Primary Contact .................................................................................................................................. 49
Initiation .............................................................................................................................................. 50
Primary Contact Into ........................................................................................................................... 51
Ball Placement .................................................................................................................................... 52
Important Categories ........................................................................................................................... 53
Discussion ................................................................................................................................. 55
Conclusions ............................................................................................................................... 58
References ................................................................................................................................. 58
CHAPTER 4 ................................................................................................................................ 61
Abstract ..................................................................................................................................... 61
Introduction ............................................................................................................................... 61
Methods ..................................................................................................................................... 62
Results ....................................................................................................................................... 66
Discussion ................................................................................................................................. 68
Conclusions ............................................................................................................................... 69
References ................................................................................................................................. 69
CONCLUSIONS ......................................................................................................................... 71
REFERENCES (INTRODUCTION) ........................................................................................ 73
PUBLICATION PLANS ............................................................................................................ 75
APPENDIX A .............................................................................................................................. 76

vii
LIST OF FIGURES
Figure 1.1: Players who experienced more high magnitude accelerations themselves were more likely to be involved in impacts associated with high magnitude accelerations in other players. ......................................................................................................................................... 11
Figure 1.2: Distributions of high magnitude accelerations received in practices over an entire season by team and position group................................................................................. 12
Figure 1.3: Bar graphs showing proportion of team’s high magnitude practice impacts in which players experienced a high magnitude acceleration by position. ................................ 13
Figure 1.4: Bar graph showing proportion of position’s high magnitude practice impacts in which players experienced a high magnitude acceleration across all teams. ........................ 14
Figure 1.5: Number of high magnitude accelerations experienced in games was correlated with number of high magnitude accelerations experienced in practices. .............................. 16
Figure 1.6: A generally increasing trend was observed between years of experience playing contact sports and high magnitude accelerations experienced in practice across all teams. 18
Figure 2.1: Head acceleration magnitude showed a generally decreasing trend with overall tackling grade for both positions in this drill. .......................................................................... 28
Figure 2.2: Grade was shown to be associated with high magnitude accelerations ............. 29
Figure 2.3: Exemplary failing tackles for the tackler and ball carrier. ................................. 30
Figure 3.1: Boxplots showing sum of all category scores for both tacklers and ball carriers combined. ..................................................................................................................................... 45
Figure 3.2: Boxplot showing Balance score for both positions in tackling drills. ................ 46
Figure 3.3: Boxplot showing Posture score for both positions in tackling drills. ................. 47
Figure 3.4: Boxplot showing Line of Sight score for both positions in tackling drills. ......... 48
Figure 3.5: Boxplot showing Primary Contact score for both positions in tackling drills. .. 49
Figure 3.6: Boxplot showing Initiation score for both positions in tackling drills. ............... 50
Figure 3.7: Boxplot showing Primary Contact Into score for the tackler in tackling drills. 51
Figure 3.8: Boxplot showing Ball Placement score for the ball carrier in tackling drills. ... 52
Figure 3.9: Boxplots showing sum of the four important category scores by position. ........ 54
Figure 4.1: Experimental setup consisting of a linear impactor with custom face, bracket with attached helmet, slider table, and accelerometers mounted to impactor face and bracket. ........................................................................................................................................ 63
Figure 4.2: A zero location for the helmet ................................................................................ 65
Figure 4.3: Front and side locations of the helmet for the experimental setup. .................... 65
Figure 4.4: Representative test image and force-deflection curves for all five trials at each speed in the front location. ......................................................................................................... 67
viii
Figure 4.5: Representative test image and force-deflection curves for all five trials at each speed in the side location. ........................................................................................................... 67
ix
LIST OF TABLES
Table 1.1: Summary of Team Demographics ............................................................................. 7
Table 1.2: Position Group Summary by Team .......................................................................... 9
Table 1.3: Summary of Accelerations measured. .................................................................... 10
Table 2.1: Grading criteria used to evaluate individual impacts for the tackler and ball carrier in a one-on-one impact. .................................................................................................. 26
Table 3.1: Final criteria selected for grading video impacts. .................................................. 40
Table 3.2: Summary of interrater reliability statistics for all seven categories included in final grading criteria for tackler and ball carrier form. ......................................................... 44
Table 4.1: Offset dimensions from the zero point at each location used in experimental setup. ............................................................................................................................................ 66
Table 4.2: Summary of average peak force and deflection values ± standard deviation for each location and test velocity. ................................................................................................... 68
Table A1: Example of contingency table for two independent raters.................................... 76

x
ATTRIBUTION
Chapter Title Co-Authors Ch. 1 Are Specific Players More Likely to be Involved in
High Magnitude Head Impacts in Youth Football? Eamon T. Campolettano, Eric Smith, and Steven Rowson
Ch. 2 Association Between Tackling Technique and Head
Acceleration Magnitude in Youth Football Players Eamon T. Campolettano
and Steven Rowson Ch. 3 Does Tackling Form Affect Head Acceleration in
Youth Football Players? Eamon T. Campolettano
and Steven Rowson Ch. 4 Method for Determining the Structural Response of
Helmet Shells During Dynamic Loading Tyler P. Morris and Steven Rowson
1
INTRODUCTION
Approximately five million athletes play football every year in the United States,7,9 and
nearly 70% of these athletes are below the age of 14. This popular pastime is also associated with
the highest incidence of concussion among team contact sports.5,11 Additionally, recent studies
have found increased risk for long-term neuropsychiatric consequences when players are exposed
to contact football before age 12.1 These consequences are tied to concussion history, but are even
more strongly related to repetitive head impact exposure – regardless of whether acute injury is
manifested.15
Previous studies have summarized overall head impact exposure in youth football
teams.6,7,9,10,25 Generally, youth players experience more impacts, and more high magnitude
impacts, in practices than in games. Youth players experience approximately 240 head impacts
per season, with around 10% of these being above 40 g.3,7 The 95th percentile peak linear
acceleration in youth players (43 ± 7 g) is lower than that seen in high school (56.4 ± 10.5 g) and
collegiate players (62.7 g), but some accelerations among youth players can still reach magnitudes
greater than 100 g.7,8,11,23 Frequency and magnitude of head impact exposure generally scale with
age and weight-based level of play in the youth age group.12 More recent analyses have revealed
that individual youth players’ head impact exposure in games and practices are correlated.22
Practice structure and coaching style have also been revealed as two causes of difference in head
impact exposure among teams, both of which could be changed by league rules.3,4 Some football
organizations have changed their rules in recent years in order to limit contact in practice as a way
of reducing head impact exposure for athletes.16,21
No studies to date have taken an in-depth look at individual player involvement in high-
risk head impacts, nor have any studied how to modify individual-specific behavior to limit this

2
risk. Therefore, the first research objective of this thesis was to quantify individual player
contribution to impacts involving head accelerations above 40 g. Individual player involvement
was measured as any impact in which a given player or his teammate experienced a high magnitude
acceleration during an impact, so as to capture a player’s overall contribution to his team’s high
magnitude acceleration exposure. It was expected that the most skilled players and positions
would have greatest involvement and present the best chance for reducing head impact exposure.
Other football organizations have aimed to reduce head impact exposure by modifying
tackling technique. Tackling is a major part of football, and will likely always be a part of the
game; as such, using proper tackling technique presents a major opportunity for reducing exposure.
The prevailing technique taught to defensive players (tacklers) involves using the shoulder to make
primary contact with the ball carrier while keeping the head away from contact.20,24 A reduction
in the number of concussions in practices was observed when teams implemented both modified
tackling training and rules limiting contact during practice.13
No studies to date have investigated the association between tackling form and head
acceleration outcome on an individual tackle basis. The second research objective of this thesis
was to determine the influence tackling form had on head acceleration outcome in youth football
players through the development and use of tackling form criteria. In addition, no currently
available football technique recommendations are available for ball carriers. Therefore, this
research objective included the development and use of criteria for ball carriers involved in a
tackle, as well.
Finally, football helmets are commonly evaluated for certification and performance in a
laboratory environment.18,19 Lab tests can also be used to validate computer-aided design tools,
which can enable design that is more efficient.14,17 Material testing is typically carried out on a
3
tensile or compressive testing machine at deflection rates below 1 cm/s.2 No methods currently
exist to evaluate football helmets in a dynamic loading environment. This is necessary, as football
helmets are commonly loaded by energy inputs far above the quasi-static range, and rate
dependency in material properties likely exists.19 The third research objective of this thesis was
to develop and demonstrate a novel testing methodology for obtaining force-deflection curves of
helmets under dynamic loading conditions.
4
CHAPTER 1
Are Specific Players More Likely to be Involved in High Magnitude Head Impacts in Youth Football?
Abstract
Youth football attracts approximately 3.5 million participants every year, but concern has
recently risen about the long-term effects of experiencing repetitive head accelerations from a
young age due to participation in football. The objective of this study was to quantify total
involvement in high magnitude impacts among individual players in youth football practices. We
explored the relationship between the total number of high magnitude accelerations in which
players were involved (experienced either by themselves or by other players) during practices and
the number of high magnitude accelerations players experienced.
A local cohort of 94 youth football players (mean age 11.9 ± 1.5, mean body mass 50.3 ±
16.4 kg) from four different teams were recruited and outfitted with helmet-mounted accelerometer
arrays. The teams were followed for one season each for a total of 128 sessions (practices, games,
and scrimmages). Players involved in all high magnitude (greater than 40g) head accelerations
were identified through analysis of practice film.
Players who experienced more high magnitude accelerations were more likely to be
involved in impacts associated with high magnitude accelerations in other players. A small subset
of six players (6%) were collectively involved in 230 (53%) high magnitude impacts during
practice, were involved but did not experience a high magnitude acceleration 78 times (21% of the
370 one-sided high magnitude impacts), and experienced 152 (30%) of the 502 high magnitude
accelerations measured. Backs were involved in the greatest number of high magnitude impacts in
practice and experienced the greatest number of high magnitude accelerations. Team was an
important factor, as one team showed much greater head impact exposure than all others.

5
This study shows that targeting the most impact-prone players for individualized
interventions could reduce high magnitude acceleration exposure for entire teams. These data will
help to further quantify elevated head acceleration exposure and enable data-driven interventions
that modify exposure for individual players and entire teams.
Introduction Football is among the most popular sports in the United States at all ages, with over 70%
of its participants being at the youth level.13,20,29 This team sport is also associated with the highest
incidence of concussion among participants.22,30 Recent research has suggested that sports-related
concussive and sub-concussive impacts, even at the youth level, may be linked to
neurodegeneration later in life.2,31,33 As a result, a number of organizations have moved to change
the game to prevent not just injury, but exposure to head impacts, as well. Current approaches
include changing rules to eliminate high-velocity drills and plays, changing technique through
tackling programs, and creating better equipment.3 Reducing head impact exposure through
interventions has become a topic of discussion in the scientific literature and among youth football
leagues.3,18,22,27,28,30,35,38 Examples of these interventions include limiting contact drills in practice,
especially those exposing players to head impacts not representative of game situations,11,13,34,41
and attempting to improve tackling technique by teaching players to keep their head away from
contact during a tackle.44
Studies quantifying exposure to high magnitude acceleration in American football have
revealed exposure varies in magnitude and frequency between individual players due to
differences in position, amount of playtime, and athleticism. 9,10,17,19,32,40 Level of play and past
experience in football are also important, and these factors may have larger influence at the youth

6
level.1, 2, 22-25 Among youth football players, age- and weight-based level of play substantially
influences the number of high risk head impacts experienced.26 Tolerance to these head impacts
also likely varies by individual due to differences in age, gender, past exposure to head injury, size,
and a range of other factors.1,4,6-8,12-15,20,23-25,37,45
Aggregate analyses have been used to characterize head acceleration exposure in youth
football players.12,13,20,21,42,45 A study of 50 youth players ages 9-12 showed a large range of player
exposure at this level of play.13 Player-to-player variance in impact frequency and magnitude
among 7-8 year old players has been attributed to player experience.45 Frequency and magnitude
of head accelerations in games scales with frequency and magnitude of head accelerations in
practices in individual youth players.42 While these studies provide a summary of exposure in
youth players, there has yet to be an in-depth study quantifying individual-specific involvement in
head accelerations at the youth level.
The objective of this study was to quantify total involvement in high magnitude impacts
among individual players in youth football practices. We explored the relationship between the
total number of high magnitude accelerations in which players were involved (experienced either
by themselves or by other players) during practices and the number of high magnitude
accelerations players experienced among four youth football teams and three position groups.
These data will help to further quantify elevated head acceleration exposure and enable data-driven
interventions that modify exposure for individual players and entire teams.
Methods
Head impact data from 94 male youth football participants (age 11.9 ± 1.5, body mass 50.3
± 16.4 kg) from three recreational league teams and one middle school team were collected over

7
the course of two seasons for a total of four team-seasons (Table 1.1). Ages ranged from 9 to 14
across all teams. Participants were recruited to be a part of this study by obtaining written consent
from parents of each youth athlete and verbal consent from each athlete. This study was approved
by the Virginia Tech Institutional Review Board and all standard procedures were followed in
regards to the research of human subjects and minors.
Table 1.1: Summary of Team Demographics
Team Level of Play Age
Range (years)
Age (years)
Body Mass (kg)
Experience (years) Players
Avg. ± SD Avg. ± SD Avg. ± SD A Junior Rec. 9-11 9.9 ± 0.6 38.9 ± 9.9 1.85 ± 1.46 27
B Senior Rec. 11-13 12.4 ± 0.7 47.1 ± 13.4 3.40 ± 2.48 20
C Senior Rec. 11-13 11.9 ± 0.6 51.4 ± 11.8 2.82 ± 2.19 18
D Middle School 12-14 13.5 ± 0.6 62.8 ± 16.8 4.11 ± 2.72 29
Total 9-14 11.9 ± 1.5 50.3 ± 16.4 3.04 ± 2.39 94
Before the season, demographic information was collected from each player including their
age, body mass, and experience playing contact sports. Experience playing contact sports was
given by parents in the form of sport and number of years played. Restrictions were not placed on
the type of sport the parents could report as contact, and responses varied (e.g. martial arts,
wrestling, basketball).
Helmets of subjects were instrumented with the Head Impact Telemetry (HIT) system
(Simbex, Lebanon, NH; Sideline Response System, Riddell Inc., Chicago, IL). This system
8
consists of a six-accelerometer array inserted into either a Riddell Revolution or a Speed model
helmet and communicates with a sideline computer during all games and practices. Data were
collected at 94 practices (26 Team A, 15 Team B, 31 Team C, and 22 Team D), 31 games (8 Team
A, 8 Team B, 7 Team C, and 8 Team D), and 3 scrimmages (Team D). Resultant linear and
rotational head acceleration values were measured for each impact event players
experienced.16,17,36,39 Data collection was triggered when any one of the six channels exceeded
9.6 g of linear acceleration, and a threshold of 10 g resultant linear acceleration was used to
discriminate between impact and non-impact events.5,6
For the purposes of this study, a high magnitude acceleration (HMA) was defined as any
resultant linear acceleration greater than or equal to 40 g. A high magnitude impact (HMI) was
defined as any collision in which two players were involved and at least one experienced an
acceleration greater than 40 g. High magnitude accelerations account for approximately the top
10% of all accelerations experienced by youth football players.10
Video recordings using Sony HDR-CX160 and HDR-CX440 camcorders (Sony, Tokyo,
Japan) and activity logs of each session were used to verify all high magnitude events. All players
involved in each high magnitude impact during practice sessions were also identified from film
and logged. Both players were identified for all except 30 high magnitude impacts (< 6% of all
high magnitude practice impacts recorded) due to uncertainty associated with group tackles or
poor video quality of the event (e.g. low-light conditions). Total player involvement in high
magnitude impacts was identified for practices only, as this was the only session type for which
acceleration data were available for both players involved in a given impact.
Players were grouped into general position categories based on playtime at each position
during games and the playing style of those positions. At the youth level, players typically play

9
one offensive and one defensive position of similar playing style. Three position groups were used
to account for playing both ways in competition: Backs (n = 30 - quarterbacks, running backs,
linebackers), Line (n = 36 - offensive/defensive line, tight end), and Perimeter (n = 28 - wide
receiver, safety, cornerbacks) (Table 1.2). All data are reported as median [25th – 75th percentile]
unless otherwise noted.
Table 1.2: Position Group Summary by Team
Team Backs Line Perimeter Total Team A 7 11 9 27
Team B 4 8 8 20
Team C 7 7 4 18
Team D 12 10 7 29
Total 30 36 28 94
High magnitude acceleration counts in practice sessions were compared using a linear
model (factors: team, position, team by position). The linear model (R: lm) was analyzed for Type
III SS differences (R: drop1) and a Tukey HSD post-hoc analysis (R: TukeyHSD) was performed
when ANOVA results showed significant differences. Correlations were computed using
Spearman rank-based correlation statistics (R: stat_cor). Results were deemed significant for p <
0.05. R was used for all statistical calculations (R Foundation for Statistical Computing, Vienna,
Austria).

10
Results
A total of 13,909 accelerations were recorded for all players throughout the season: 8806
in practice and 5103 in games (Table 1.3). All teams recorded more head accelerations in practices
than in games except Team B. In practices, there were 2552 accelerations (29%) experienced by
players on Team A, 955 (11%) on Team B, 2980 (34%) on Team C, and 2319 (26%) on Team D.
Using the predetermined threshold of 40 g linear acceleration, 502 high magnitude accelerations
were recorded in practice as a result of 436 high magnitude impacts.
Table 1.3: Summary of Accelerations measured. HM = High magnitude. HMA = High
magnitude acceleration (>40 g). HM Impact events were defined as interactions between two
players in which at least one received a high magnitude acceleration. Multi-HMA Impact Events
were defined as interactions between two players in which both received a high magnitude
acceleration.
All Accelerations
(< 40 g and > 40 g)
HM Impact
Events
Multi-HMA
Impact Events HMAs
Practice Game Total Practice only Practice only Practice only
Team A 2552 964 3516 98 12 110
Team B 955 1141 2096 49 8 57
Team C 2980 1093 4073 205 43 248
Team D 2319 1905 4224 84 3 87
Total 8806 5103 13909 436 66 502

11
High Magnitude Accelerations Experienced vs High Magnitude Impact Involvement
A positive correlation was found between the number of high magnitude head impacts in
which a player was involved without experiencing a high magnitude acceleration and the number
of high magnitude accelerations a player experienced in practices over the course of a season
(Figure 1.1).
Figure 1.1: Players who experienced more high magnitude accelerations themselves were more
likely to be involved in impacts associated with high magnitude accelerations in other players.
Spearman rank-based methods were used to calculate correlations. Players involved in HMIs
could have been the striking (causing) or struck player. Symbols represent individual players,
line represents the Spearman correlation, and shaded area represents 95% CI for correlation.
Team A players experienced 3.0 [1.0 – 5.0] high magnitude accelerations in practices over
the course of the season. Team B players experienced 2.85 [0.0 – 4.25], while those on Team C

12
experienced 13.8 [3.25 – 21.75] high magnitude accelerations. Players on Team D recorded 2.0
[1.0 – 3.0] high magnitude accelerations per player in practices (Figure 1.2). A small handful of
players were involved in a majority of high magnitude impacts in practices on all four teams. Six
players were identified as outliers in both number of impacts in which they were involved during
practices and number of high magnitude accelerations experienced. These six players (6%) (two
lineman from Team A; two backs from Team C; and two backs from Team D) were collectively
involved in 230 (53%) of all high magnitude impacts during practice, were involved but did not
experience an HMA 78 times (21% of the 370 one-sided HMIs), and experienced 152 (30%) of
the 502 high magnitude accelerations measured.
Figure 1.2: Distributions of high magnitude accelerations received in practices over an entire
season by team and position group. The thick black lines within each box represents the median,
the boxes represent the interquartile range (IQR) defined as 25th-75th quartiles, and the whiskers
represent the fences (1.5 * IQR). Any data point (dots) outside the fences represent outliers.

13
The overall proportion of high magnitude impacts in which a player experienced a high
magnitude acceleration was quantified by team and position (Figure 1.3). A Tukey Post hoc test
showed that Team C players were involved in more high magnitude impacts in practice than any
other team (p ≤ 7.76e-5). Other teams were similar in their number of impacts. Comparable results
were produced for the number of high magnitude accelerations experienced, with Team C
accounting for the most (49%).
Figure 1.3: Bar graphs showing proportion of team’s high magnitude practice impacts in which
players experienced a high magnitude acceleration by position.
Additionally, Backs were involved in more high magnitude impacts than Perimeter players
(p = 2.6e-3) and showed evidence of greater involvement than Linemen (p = 0.058). Perimeter
and Line players did not differ in the number of impacts in which they were involved. Similar
results were found for number of high magnitude accelerations purely experienced, with Backs
having more than Perimeter and Line players (Figure 1.4). Adding an interaction term between

14
team and position showed that Backs on Team C team had greater propensity for impacts and high
magnitude accelerations than any other position group on any team in the study.
Figure 1.4: Bar graph showing proportion of position’s high magnitude practice impacts in which
players experienced a high magnitude acceleration across all teams.
Discussion
Previous studies have presented individual-specific head acceleration data, which revealed
the existence of players on youth football teams who experience greater head impact exposure than
their peers.12,13,20,21,45 Experiencing a greater number of head impacts in practice than in games is
common at the youth level, which is consistent with this analysis.11,13,20 Head impact exposure
varied within this cohort of 94 youth football players. This variance can be partially explained by
team and position, as Team C players were exposed to more impacts than others were, and Backs
generally experienced a greater number of high magnitude impacts than did the other position
groups. However, even within the Backs position group, head impact exposure varied greatly.

15
A small subset of players were involved in a majority of the high magnitude head
accelerations recorded. These players were unarguably among the most athletic and competitive
players on their team and therefore received the most playing time, ball carrying time, and were
involved with the most drills during practice and plays during games. Additionally, these players
would likely have been paired against other teams’ most athletic players during games, increasing
their chances of high magnitude collisions outside of practice (Figure 1.5). It is notable that some
players played for different teams across both years of this study and had different roles on each
respective team. Impact-prone players on one team were not necessarily the most impact-prone
the next year, and this is likely caused in part by their role on a given team (e.g. position, playtime).
Thus not only do certain individuals inherently exhibit greater involvement in high magnitude
impacts than their peers do, but their involvement is also influenced by their function on a team.

16
Figure 1.5: Number of high magnitude accelerations experienced in games was correlated with
number of high magnitude accelerations experienced in practices. Spearman rank-based
methods were used to calculate correlations. Symbols represent individual players, line represents
the Spearman correlation, and shaded area represents 95% CI for correlation.
In this dataset, the players involved in more high magnitude impacts without experiencing
head accelerations themselves also experienced more high magnitude head accelerations on
average. This means there is likely a group of players responsible for a large number of the high
magnitude impacts on any given team, putting others and themselves at higher risk for head injury.
At the youth level, players are still learning proper tackling form and often deviate from the best
tackling methods; leading with the helmet was observed in a number of impacts.
Player experience with contact sports, and football in particular, likely influences number
of head impacts experienced due to increased confidence and skill.45 Youth tackle football

17
generally cannot be played until athletes are nine years old; however, many individuals in this
cohort had experience in contact sports beyond football. This increase in familiarity with contact
could have increased their confidence relative to their peers and influenced their propensity for
high magnitude impacts over the course of the season (Figure 1.6). Previous studies have found
that coaching education strategies combined with guidelines for contact during practice is also
most effective for older youth players, specifically 11-15 year olds.27 This may be because of the
players’ ability to accept such information, or could also be due in part to repeated coaching of
proper technique over multiple years of play up until that point. Coaching style likely played a
large role in head impact distribution across the teams in this study, as well. Coaching intensity
has been shown to be a significant factor in high magnitude head impact exposure during practice,
and specific drills can have higher impact rates than others.10,11

18
Figure 1.6: A generally increasing trend was observed between years of experience playing
contact sports and high magnitude accelerations experienced in practice across all teams. The
thick black lines within each box represents the median, the boxes represent the interquartile
range (IQR) defined as 25th-75th quartiles, and the whiskers represent the fences (1.5 * IQR).
Any data point (dots) outside the fences represent outliers.
These data suggest that if players who account for a majority of high magnitude impacts
could be taught to tackle in a way that reduces the likelihood of high magnitude acceleration for
themselves and others, their entire team would benefit. This is especially true because a majority
of high magnitude impacts occur during practice at the youth level.10,11,20,45 Those players who
are not causing a majority of high magnitude impacts should still be taught proper technique, as
they could still be exposed to high magnitude impacts during practice (via their teammates) and in
games. They will also experience a greater frequency of high magnitude impacts if they continue
to play at higher levels.9,43 However, to maximize effect, tackling training that targets the few

19
impact-prone individuals on a team could drastically minimize exposure in practices for all
players.
Limitations of this study include the error associated with the HIT system – subject to up
to 15.7% error for a given individual impact, but less than 1% error on average.5,11 Additionally,
this study used a small sample of players from four youth football teams across two seasons.
Future studies should incorporate a larger sample with a wider demographic range in order to scale
the conclusions to the overall population of youth football players.
Conclusions
This study highlights the potential need for individual-specific intervention to reduce high
magnitude acceleration exposure for youth football teams. Individual players who were involved
in a majority of high magnitude impacts without experiencing a high magnitude acceleration
themselves also experienced the majority of high magnitude accelerations over the course of the
season. A small subset of individual players were involved in a majority of high magnitude
impacts in practices and thus present the greatest opportunity for reducing exposure for an entire
team. High magnitude acceleration exposure generally increased with player experience. Team
and position within team were the best predictors of exposure, as Team C showed noticeably higher
exposure. Backs, who were involved in a majority of ball carrying, were also involved in a
majority of high magnitude collisions on every team but one. This study sets the framework for
identifying players with elevated head impact exposure in youth football leagues and underlines
the necessity for a multi-pronged approach to reducing head acceleration exposure in youth
football players.

20
References
1. Abrahams S, Mc Fie S, Patricios J, Posthumus M, September AV: Risk factors for sports concussion: an evidence-based systematic review. Br J Sports Med:bjsports-2013-092734, 2013
2. Alosco ML, Kasimis AB, Stamm JM, Chua AS, Baugh CM, Daneshvar DH, et al: Age of first exposure to American football and long-term neuropsychiatric and cognitive outcomes. Translational Psychiatry 7:e1236, 2017
3. American Academy of Pediatrics: Tackling in Youth Football. Pediatrics 136:e1419-e1430, 2015
4. Bakhos LL, Lockhart GR, Myers R, Linakis JG: Emergency Department Visits for Concussion in Young Child Athletes. Pediatrics, 2011
5. Beckwith JG, Greenwald RM, Chu JJ: Measuring Head Kinematics in Football: Correlation Between the Head Impact Telemetry System and Hybrid III Headform. Ann Biomed Eng 40:237-248, 2012
6. Beckwith JG, Greenwald RM, Chu JJ, Crisco JJ, Rowson S, Duma SM, et al: Head Impact Exposure Sustained by Football Players on Days of Diagnosed Concussion. Med Sci Sports Exerc 45:737-746, 2013
7. Brainard LL, Beckwith JG, Chu JJ, Crisco JJ, McAllister TW, Duhaime AC, et al: Gender differences in head impacts sustained by collegiate ice hockey players. Med Sci Sports Exerc 44:297-304, 2012
8. Broglio SP, Schnebel B, Sosnoff JJ, Shin S, Fend X, He X, et al: Biomechanical properties of concussions in high school football. Med Sci Sports Exerc 42:2064-2071, 2010
9. Broglio SP, Sosnoff JJ, Shin S, He X, Alcaraz C, Zimmerman J: Head impacts during high school football: a biomechanical assessment. J Athl Train 44:342-349, 2009
10. Campolettano ET, Gellner RA, Rowson S: High-magnitude head impact exposure in youth football. Journal of Neurosurgery: Pediatrics 20:604-612, 2017
11. Campolettano ET, Rowson S, Duma SM: Drill-specific head impact exposure in youth football practice. J Neruosurg Pediatr 18:536-541, 2016
12. Cobb BR, Rowson S, Duma SM: Age-related differences in head impact exposure of 9-13 year old football players. Biomedical sciences instrumentation 50:285-290, 2013
13. Cobb BR, Urban JE, Davenport EM, Rowson S, Duma SM, Maldjian JA, et al: Head impact exposure in youth football: elementary school ages 9-12 years and the effect of practice structure. Ann Biomed Eng 41:2463-2473, 2013
14. Collins CL, Fletcher EN, Fields SK, Kluchurosky L, Rohrkemper MK, Comstock RD, et al: Neck strength: a protective factor reducing risk for concussion in high school sports. The journal of primary prevention 35:309-319, 2014
15. Covassin T, Moran R, Elbin R: Sex differences in reported concussion injury rates and time loss from participation: An update of the National Collegiate Athletic Association Injury Surveillance Program from 2004–2005 through 2008–2009. Journal of athletic training 51:189-194, 2016
16. Crisco JJ, Chu JJ, Greenwald RM: An algorithm for estimating acceleration magnitude and impact location using multiple nonorthogonal single-axis accelerometers. J Biomech Eng 126:849-854, 2004
17. Crisco JJ, Fiore R, Beckwith JG, Chu JJ, Brolinson PG, Duma S, et al: Frequency and location of head impact exposures in individual collegiate football players. J Athl Train 45:549-559, 2010
21
18. Crisco JJ, Greenwald RM: Let's get the head further out of the game: a proposal for reducing brain injuries in helmeted contact sports. Curr Sports Med Rep 10:7-9, 2011
19. Crisco JJ, Wilcox BJ, Machan JT, McAllister TW, Duhaime AC, Duma SM, et al: Magnitude of head impact exposures in individual collegiate football players. J Appl Biomech 28:174-183, 2012
20. Daniel RW, Rowson S, Duma SM: Head Impact Exposure in Youth Football. Ann Biomed Eng 40:976-981, 2012
21. Daniel RW, Rowson S, Duma SM: Head impact exposure in youth football: middle school ages 12–14 years. Journal of biomechanical engineering 136:094501, 2014
22. Duma SM, Rowson S, Cobb B, MacAllister A, Young T, Daniel R: Effectiveness of helmets in the reduction of sports-related concussions in youth. Institute of Medicine, Commissioned paper by the Committee on Sports-Related Concussion in Youth, 2013
23. Greenwald RM, Gwin JT, Chu JJ, Crisco JJ: Head impact severity measures for evaluating mild traumatic brain injury risk exposure. Neurosurgery 62:789-798; discussion 798, 2008
24. Guskiewicz KM, Mihalik JP: Biomechanics of sport concussion: quest for the elusive injury threshold. Exerc Sport Sci Rev 39:4-11, 2011
25. Guskiewicz KM, Mihalik JP, Shankar V, Marshall SW, Crowell DH, Oliaro SM, et al: Measurement of head impacts in collegiate football players: relationship between head impact biomechanics and acute clinical outcome after concussion. Neurosurgery 61:1244-1253, 2007
26. Kelley Mireille E. UJE, Miller Logan E., Jones Derek A., Espeland Mark A., Davenport Elizabeth M., Whitlow Christopher T., Maldjian Joseph A., and Stitzel Joel D.: Head Impact Exposure in Youth Football: Comparing Age- and Weight-Based Levels of Play. Journal of Neurotrauma 34:1939-1947, 2017
27. Kerr ZY, Yeargin S, Valovich McLeod TC, Nittoli VC, Mensch J, Dodge T, et al: Comprehensive coach education and practice contact restriction guidelines result in lower injury rates in youth American football. Orthopaedic journal of sports medicine 3:2325967115594578, 2015
28. Kerr ZY, Yeargin SW, Valovich McLeod TC, Mensch J, Hayden R, Dompier TP: Comprehensive coach education reduces head impact exposure in American youth football. Orthopaedic journal of sports medicine 3:2325967115610545, 2015
29. Langlois JA, Rutland-Brown W, Wald MM: The epidemiology and impact of traumatic brain injury: a brief overview. J Head Trauma Rehabil 21:375-378, 2006
30. Lincoln AE, Caswell SV, Almquist JL, Dunn RE, Norris JB, Hinton RY: Trends in Concussion Incidence in High School Sports. The American Journal of Sports Medicine 39:958-963, 2011
31. McKee AC, Cantu RC, Nowinski CJ, Hedley-Whyte ET, Gavett BE, Budson AE, et al: Chronic traumatic encephalopathy in athletes: progressive tauopathy after repetitive head injury. Journal of Neuropathology & Experimental Neurology 68:709-735, 2009
32. Mihalik JP, Bell DR, Marshall SW, Guskiewicz KM: Measurement of head impacts in collegiate football players: an investigation of positional and event-type differences. Neurosurgery 61:1229-1235; discussion 1235, 2007
33. Montenigro Philip H. AML, Martin Brett M., Daneshvar Daniel H., Mez Jesse, Chaisson Christine E., Nowinski Christopher J., Au Rhoda, McKee Ann C., Cantu Robert C., McClean Michael D., Stern Robert A., and Tripodis Yorghos: Cumulative Head Impact

22
Exposure Predicts Later-Life Depression, Apathy, Executive Dysfunction, and Cognitive Impairment in Former High School and College Football Players. Journal of Neurotrauma 34:328-340, 2017
34. Pop Warner Little Scholars Inc.: Pop Warner Little Scholars Official Rules, in, 2014 35. Rosenthal JA, Foraker RE, Collins CL, Comstock RD: National high school athlete concussion
rates from 2005-2006 to 2011-2012. The American journal of sports medicine 42:1710-1715, 2014
36. Rowson S, Beckwith JG, Chu JJ, Leonard DS, Greenwald RM, Duma SM: A six degree of freedom head acceleration measurement device for use in football. J Appl Biomech 27:8-14, 2011
37. Rowson S, Bland ML, Campolettano ET, Press JN, Rowson B, Smith JA, et al: Biomechanical perspectives on concussion in sport. Sports medicine and arthroscopy review 24:100-107, 2016
38. Rowson S, Duma SM: Development of the STAR Evaluation System for Football Helmets: Integrating Player Head Impact Exposure and Risk of Concussion. Ann Biomed Eng 39:2130-2140, 2011
39. Rowson S, Duma SM, Beckwith JG, Chu JJ, Greenwald RM, Crisco JJ, et al: Rotational head kinematics in football impacts: an injury risk function for concussion. Ann Biomed Eng 40:1-13, 2012
40. Schnebel B, Gwin JT, Anderson S, Gatlin R: In vivo study of head impacts in football: a comparison of National Collegiate Athletic Association Division I versus high school impacts. Neurosurgery 60:490-495; discussion 495-496, 2007
41. Scholars PWL: Limited Contact in Practice Rule, in, 2012, Vol 2018 42. Srinidhi Bellamkonda, Samantha J. Woodward, Eamon Campolettano, Ryan Gellner, Mireille
E. Kelley, Derek A. Jones, et al: Head Impact Exposure in Practices Correlates with Exposure in Games for Youth Football Players. In Revision - Journal of Applied Biomechanics, 2018
43. Urban JE, Davenport EM, Golman AJ, Maldjian JA, Whitlow CT, Powers AK, et al: Head Impact Exposure in Youth Football: High School Ages 14 to 18 Years and Cumulative Impact Analysis. Ann Biomed Eng, 2013
44. USA Football: Heads Up Football, in, 2017, Vol 2017 45. Young TJ, Daniel RW, Rowson S, Duma SM: Head Impact Exposure in Youth Football:
Elementary School Ages 7-8 Years and the Effect of Returning Players. Clin J Sport Med, 2013
23
CHAPTER 2
Association between Tackling Technique and Head Acceleration Magnitude in Youth Football Players
Abstract
In order to address concerns about head injury in youth sports, a number of youth football
organizations have developed rules and recommendations surrounding the tackling form that
should be used in order to reduce unnecessary head impact exposure. Reduction in injury has been
suggested with these programs, but association between tackling form and head acceleration
magnitude has not been studied previously. To address this knowledge gap, grading criteria were
developed from multiple youth organizations’ recommendations for a collision. A total of 142
tackles from a youth football team were graded. Head acceleration data were collected from
helmet-mounted accelerometer arrays. An association was found between poor form and resultant
head acceleration being greater than 40 g for both the tackler and the ball carrier. This study
demonstrates the potential usefulness of tackling technique coaching programs in youth football.
Introduction
Concussions continue to be a major health concern in American football. With a large
majority of players of this contact sport at the youth level, the accumulation of head impact
exposure over a lifetime has begun to be extensively studied as a potential risk factor for
impairment later in life.1,4,6,8,16 Specifically, Alosco et al.1 found that exposure to football before
age 12 resulted in a twofold increase in odds of having clinically impaired scores on self-reported
measures of executive function and behavioral regulation, depression, and apathy in former
amateur and professional football players. Montenigro et al.8 suggested that this increase in odds
may be more strongly related to repetitive head impact exposure than other metrics, including
24
concussion history. Associations such as these have led a number of organizations to seek methods
of reducing head impact exposure in athletes, rather than only addressing injuries. The three best
strategies today are thought to be development of better equipment, rule changes prohibiting head
contact, and teaching better technique when contact occurs.2,5
Recently, multiple organizations have created or prioritized rules which prohibit certain
tackling techniques, and some have even started programs teaching what the organization
considers to be proper tackling technique.9-11,14 Previous studies have shown these types of
programs have resulted in less injury overall. Kerr et al.7 found that injury rates for all types of
injuries in games were lower among teams implementing USA Football’s Heads Up Football
program. Concussions were only found to be reduced in practice if the Heads Up Football program
was implemented and Pop Warner’s practice rules were also followed, which limited time allowed
for contact in practices and eliminated high-speed, head-on tackling drills. These findings scaled
with age, with stronger effects from these tackling recommendations and rule changes seen in
players aged 11-15 rather than those 5-10 years old. There has been disagreement as to the degree
of effectiveness these programs truly have, as reported concussion reduction may have been
skewed when initially reported.7,12 To date, tackling technique programs have only been studied
in terms of concussion incidence numbers, but none have attempted to determine if individual
impacts with proper technique actually result in lower head accelerations for the athletes involved.
The objectives of this study were to discriminate between good and poor impact form for
both a tackler and ball carrier in distinct impacts occurring in youth football practices via a
generalized grading scale and to determine if poor technique was associated with increased head
acceleration magnitude.

25
Methods
Head impact data were collected from 18 youth football players (age 11.9 ± 0.6 years,
weight 51.4 ± 11.8 kg) on a local youth recreation league team. Players had not been formally
trained on any tackling technique outside of conventional coaching. Linear acceleration data were
collected using previously validated helmet mounted accelerometer arrays which incorporate six
single-axis linear accelerometers (Head Impact Telemetry System, Simbex, Lebanon, NH).3 The
devices use an algorithm which calculates linear acceleration using the signals from all six
accelerometers. The pre-set trigger for the device to record and download an impact was 10 g.
Any impacts below this threshold were not recorded. This study was approved by the Virginia
Tech Institutional Review Board (IRB # 15-517) on May 5, 2017 in order to involve human
subjects. Standard procedures were followed using de-identified subject ID numbers, requiring
parental and coach consent as well as minor subject assent; all wording was screened and cleared
for coersive consent language.
A tackling technique grading scale was developed using criteria from a variety of modern
youth football tackling programs that recommend keeping the head out of the impact (Table 2.1).
These modern criteria are at odds with some previous criteria in that previous criteria
recommended contacting the ball carrier with the helmet.13 New criteria were selected based on
their priority given to avoiding head impacts. Some information from USA Hockey’s checking
guidelines were also used, as these guidelines include useful recommendations about absorbing an
impact, whereas most tackling programs only address criteria for a tackler.15

26
Table 2.1: Grading criteria used to evaluate individual impacts for the tackler and ball carrier in a
one-on-one impact. Players performing any of the failing criteria listed in the given phase were
given a fail for that phase. Phases were defined as approach – advancement toward opposing
player up until moment of contact; impact – moment when two players collide; and drive –
period following contact until drill is over, as signified by a coach’s signal.
Approach Impact Drive
Tackler Feet spread less than shoulder width
Only lowers torso, bends at hip rather than knees Face directed downward, head not up
Does not lead with near shoulder
Does not initiate contact, shies away Aims shoulder too high (head) or too low (knees) into ball carrier
Does not keep head up
Does not wrap with both hands
Stops attempting to move legs
Ball Carrier
Feet spread less than shoulder width
Only lowers torso, bends at hip rather than knees
Face directed downward, head not up
Does not lead with near shoulder
Does not initiate contact, shies away
Does not tuck ball and elbow
Does not keep head up
Stops attempting forward progress
These grading criteria were used to evaluate 142 impacts from video of one-on-one tackles
from a variety of drill types in practices at different points throughout the season. Three distinct
phases of a tackle were identified and graded individually: approach, impact, and drive. If a player
failed to meet any of the criteria for a given phase, a fail (0) was given. If all criteria were met for
a given phase, a pass (1) was awarded. Total scores across the three phases were used to
dichotomize tackles into good (summed score ≥ 2) and poor (summed score ≤ 1). All impacts

27
were evaluated by a single grader to determine if significant association existed between tackling
grade and head acceleration. The grader was familiar with tackling form evaluation and all players
and coaches in this study.
Based on previous analyses, a threshold of 40 g was used to classify high magnitude
impacts for this population.5 This threshold resulted in high magnitude impacts accounting for
approximately the top ten percent of data collected over the course of the season. A chi-square
test for independence was used to determine the association of tackling form (good/poor) with
presence of high magnitude acceleration (Y/N). Results were deemed significant for p ≤ 0.05, and
all statistical calculations were completed in R (R Foundation for Statistical Computing, Vienna,
Austria).
Results
A total of 142 tackles were graded; three cases could not be graded because they involved
players not enrolled in the study. This resulted in 281 total grades, one for the tackler and the ball
carrier involved in each tackle. Of the graded impacts, 92 interactions resulted in high magnitude
accelerations and 189 resulted in low magnitude accelerations. Tacklers saw 48 of the 92 high
magnitude accelerations, while the ball carriers received the other 44. A total of 146 tackles passed
overall, 61 for the tacklers and 85 for the ball carriers. Acceleration distributions by grade show
a generally decreasing trend with increasing grade (Figure 2.1).

28
Figure 2.1: Head acceleration magnitude showed a generally decreasing trend with overall
tackling grade for both positions in this drill. Tackles receiving a summed grade of 2 or greater
were considered good form, while tackles receiving 1 or less were considered poor form. All
tackles in which a linear acceleration was not recorded were assumed to have not reached the
system’s trigger threshold of 10 g. These tackles were presumed to be between 0 and 10 g, and
were therefore coded as the average of 5 g.
When combining all grades from tacklers and ball carriers, significant association between
high magnitude accelerations and poor overall grade was identified (p = 0.009). By position,
tackles showed significant association between high magnitude accelerations and poor overall
grade for the tackler (p = 0.005), but not for the ball carrier (p = 0.542). By phase, approach and
impact for the tackler were associated (p = 0.013 and p = 0.001, respectively), and the impact phase
for the ball carrier displayed good evidence of association with head acceleration (p = 0.072). No
other phases showed association between high magnitude accelerations and poor impact grade
(Figure 2.2).

29
Figure 2.2: Grade was shown to be associated with high magnitude accelerations in the
Approach (p=0.013) and Impact (p = 0.001) phases for the tackler, and to display good evidence
of association with outcome in the Impact phase (p = 0.072) for the ball carrier.
Video quality varied by practice and drill type. Some phases of certain tackles were
difficult to grade due to decreased video quality. Examples of good and poor grades for each
phase of both the tackler and ball carrier can be seen in Figure 2.3. The most significant phase
for both positions was the middle impact phase, which resulted in 39-45% of poor tackles being
high magnitude accelerations and over 77% of good tackles being low magnitude (less than 40
g).

30
Approach Impact Drive
Tackler
Ball Carrier
Figure 2.3: Exemplary failing tackles for the tackler and ball carrier. First row from left: 1) the
tackler puts his head down and in the path of the ball carrier; 2) the tackler leads with his chest
and aims too high; 3) the tackler does not wrap the ball carrier. Second row from left: 4) the ball
carrier directs his face downward, 5) the ball carrier does not initiate contact, and 6) the ball
carrier (right) stops attempting forward progress after collision.
Discussion
Although participants had not been trained on the tackling criteria used to evaluate their
tackling form in this study, these players exhibited both good and poor form as defined by the
established criteria during their practices. Tackling form did have an association with acceleration
magnitude outcome, especially for the tackler, in this group of youth football players during one-
on-one tackles. For both position groups, the impact phase was the most significant phase of the
collision in determining acceleration level outcome. The drive phase was seen to have the least
significant association for both positions.
The association between grade and outcome was thought to be high in the impact phase
because this phase was graded at the moment of collision. Additionally, criteria for this phase
1) 2) 3)
4) 5) 6)

31
explicitly included using anything other than the near shoulder (e.g. the head) to lead when striking
the opposing player. This suggests the impact phase should be stressed most during tackling
technique training, as this is where the most improvement can occur to avoid high magnitude head
impact exposure. Interestingly, a logistic general linear model relating approach grade to impact
grade for both positions showed that the chances of obtaining a passing impact phase score were
2.4 times higher when the player first passed in the approach phase. This suggests that the
approach is also a very important piece in avoiding high magnitude accelerations.
The drive phase did not appear to have a meaningful effect on the head acceleration
magnitude in these impacts. This phase occurs after the impact has already taken place and does
not have a large effect on the head’s involvement in a tackle. Reanalyzing the data without the
drive phase yielded very similar results: for overall scores, the tackler showed strong evidence for
association between high acceleration and poor form, and the ball carrier showed similar trends
but with less statistical evidence. As all the noted trends were similarly seen in both tackler and
ball carrier results, it may be important to include sessions on absorbing a tackle in youth football
programs in order to protect players on both sides of the ball.
Lower association among ball carriers with the tackle-absorbing criteria developed for this
study suggest there may be other factors which were not addressed in this grading scheme that also
influence acceleration outcome for these offensive players. This is likely due in part to the fact
that ball carriers and tacklers have entirely different goals when entering a one-on-one collision
scenario. The tackler is aimed only at bringing the ball carrier to the ground and impeding his
progress. On the other hand, the ball carrier’s goal is to get himself and the football past the tackler
in any way he desires. This can include making a last-second cut to avoid the tackler, driving his
body directly into the tackler, or any combination of these types of moves. In other words, a ball

32
carrier is less predictable and his criteria is therefore less generalizable. Regardless, criteria for
training ball carriers might be relevant for youth football training programs, as ball carriers still
received 48% of all high magnitude impacts graded in this study.
This study was limited by video quality, as some impacts occurred closer to the camera
than others. In addition, grading in this study was completed by a single reviewer on a single
team’s tackling technique as a feasibility analysis and because of his familiarity with the subject
population and tackling form requirements. The next step in this process will be to optimize the
grading criteria to obtain sufficient inter-rater reliability with multiple reviewers.
Conclusions
Youth football players exhibit a number of different types of tackling form under
conventional coaching. Youth sports organizations recommend shoulder tackling and keeping the
head out of the tackle to avoid head injury and cumulative head impact exposure. This study
reveals that these training techniques may have efficacy in that good tackling form did show
significant difference from poor form in the acceleration magnitude outcome for this cohort of
players. This study did not specifically investigate any one youth football organization’s tackling
recommendations; further research should be done to confirm that good form as defined by each
organization is truly associated with better head acceleration outcome. In addition, these or similar
grading criteria could be used to evaluate information retention and translation of learnings to the
field among youth athletes trained in proper tackling technique.
References
1. Alosco ML, Kasimis AB, Stamm JM, Chua AS, Baugh CM, Daneshvar DH, et al: Age of first exposure to American football and long-term neuropsychiatric and cognitive outcomes. Translational Psychiatry 7:e1236, 2017

33
2. American Academy of Pediatrics: Tackling in Youth Football. Pediatrics 136:e1419-e1430, 2015
3. Beckwith JG, Greenwald RM, Chu JJ: Measuring Head Kinematics in Football: Correlation Between the Head Impact Telemetry System and Hybrid III Headform. Ann Biomed Eng 40:237-248, 2012
4. Broglio SP, Williams RM, O'Connor KL, Goldstick J: Football Players' Head-Impact Exposure After Limiting of Full-Contact Practices. Journal of Athletic Training 51:511-518, 2016
5. Campolettano ET, Rowson S, Duma SM: Drill-specific head impact exposure in youth football practice. J Neruosurg Pediatr 18:536-541, 2016
6. Daniel RW, Rowson S, Duma SM: Head Impact Exposure in Youth Football. Ann Biomed Eng 40:976-981, 2012
7. Kerr ZY, Yeargin S, Valovich McLeod TC, Nittoli VC, Mensch J, Dodge T, et al: Comprehensive coach education and practice contact restriction guidelines result in lower injury rates in youth American football. Orthopaedic journal of sports medicine 3:2325967115594578, 2015
8. Montenigro Philip H. AML, Martin Brett M., Daneshvar Daniel H., Mez Jesse, Chaisson Christine E., Nowinski Christopher J., Au Rhoda, McKee Ann C., Cantu Robert C., McClean Michael D., Stern Robert A., and Tripodis Yorghos: Cumulative Head Impact Exposure Predicts Later-Life Depression, Apathy, Executive Dysfunction, and Cognitive Impairment in Former High School and College Football Players. Journal of Neurotrauma 34:328-340, 2017
9. National Federation of State High School Associations: Recommendations and Guidlines for Minimizing Head Impact Exposure and Concussion Risk in Football, in NFHS Concussion Summit Task Force, 2014
10. Pop Warner Little Scholars Inc.: Pop Warner Little Scholars Official Rules, in, 2014 11. Safe Football: in, 2017 12. Schwarz A: N.F.L.-Backed Youth Program Says It Reduced Concussions. The Data Disagrees.
The New York Times, 2016 13. Stokes JV, Luiselli JK, Reed DD: A behavioral intervention for teaching tackling skills to high
school football athletes. Journal of Applied Behavior Analysis 43:509-512, 2010 14. USA Football: Heads Up Football, in, 2017, Vol 2017 15. USA Hockey Coaching Education Program: Checking the Right Way for Youth Hockey. 2009 16. Young TJ, Daniel RW, Rowson S, Duma SM: Head Impact Exposure in Youth Football:
Elementary School Ages 7-8 Years and the Effect of Returning Players. Clin J Sport Med, 2013
34
CHAPTER 3
Does Tackling Form Affect Head Acceleration in Youth Football Players?
Abstract
Youth football has become a topic of discussion in scientific literature because of the
potential long-term neuropsychiatric effects of experiencing head impacts from a young age. To
reduce head impact exposure, a number of organizations have begun teaching tackling techniques
that emphasize using the shoulder and keeping the head out of tackles. Few of these training
programs teach tackle absorption. In order to evaluate the effectiveness of using recommended
tackling techniques, this study sought to develop and utilize a set of grading criteria for both
tacklers and ball carriers and relate form during a tackle to head acceleration magnitude. Three
teams consisting of 67 players (age 12.7 ± 0.95, age range 11-14, body mass 55.1 ± 16.2 kg) were
instrumented with helmet-mounted accelerometer arrays and followed for one season each. No
players were trained in specific tackling techniques outside of conventional coaching. Video of
close-range tackling drills (with and without blockers) were used to develop a set of criteria for
use with multiple raters. Two expert raters scored 105 impacts each. Six of the seven categories
were found to have good interrater reliability metrics (TPA ≥ 79%, AC1 ≥ 0.65). Bending at both
the knees and hips, leading with the shoulder or arm, and initiating contact rather than shying away
were found to reduce risk of high magnitude (>40g) head impacts in tacklers. Keeping the eyes
up or looking slightly to one side and avoiding dropping the head reduced risk in ball carriers.
This study shows the potential effectiveness of training both tacklers and ball carriers in proper
technique for collisions in youth football. This study does not endorse any specific tackling
training program; each program’s recommendations should be evaluated individually to determine
its effectiveness in reducing head acceleration exposure.

35
Introduction
Over 5 million athletes play football every year in the United States, and approximately
70% of these players are under the age of 14, at the youth level. Recent information regarding
potential long-term neuropsychiatric and cognitive consequences has raised concerns for football
players, particularly those who are introduced to contact play before age twelve.1,20 Factors
pointing to the cause of these lasting effects include exposure to repetitive head contact, even
without the manifestation of acute injury.20,27 Reduction in head impact exposure through a
number of methods have been suggested and can be grouped into three general categories: making
equipment that better protects athletes, changing rules to limit exposure, and teaching the safest
techniques for contact.2,7,9,23,29 Contact will likely continue to be a part of the game of football,
and as such tackling technique is extremely important in reducing head impact exposure.
A number of organizations have begun to implement strategies that are intended to reduce
head impact exposure through proper technique training and limiting time allowed for contact
during practice.3,21-23,29 The National Federation of State High School Associations recommended
in 2014 that member associations limit contact in practice to 60-90 minutes per week and 30
minutes per day during the season. Pop Warner youth leagues implemented rules beginning in
2012 limiting contact to one-third of practice time and prohibiting full speed head-on drills in
which athletes begin more than three yards apart. USA Football and rugby tackling organizations
teach tackling technique for defensive football players that involves keeping the head behind the
ball carrier and out of the tackle. Previous studies have shown positive effect on injury prevalence
when using USA Football’s technique training in combination with Pop Warner’s guidelines for
contact restriction in practice.18 These positive effects were found in practices only, which the
authors contributed to USA Football’s training program being targeted primarily at changing

36
practice technique. No technique program has been shown to reduce head impact exposure in
games, where coaches have less control of the situations in which their players find themselves.
Because youth players generally experience more head impacts in practice than competition and
because a small group of players can account for a high proportion of high-risk accelerations
experienced by youth players in practice, training individuals in proper form may help reduce head
impact exposure for entire teams.7,10,11,14,31
There is no unilaterally accepted standard for how to tackle in football, and there is even
less information on properly absorbing a tackle. Previous criteria have even suggested using the
head to make a tackle.28 No study to date has sought to determine if individual tackling technique
influences head impact magnitude in youth athletes. The objective of this study was to enable
reliable grading of both players involved in an impact using the most current criteria that suggests
keeping the head out of a tackle. Afterward, we attempted to determine if poor form, as measured
by these new grading criteria, was associated with greater head acceleration magnitude in youth
football players.
Methods
This study consists of three main components: selection of criteria for grading impacts,
measuring reliability of these criteria, and associating grades with head acceleration data.
Selection of Criteria
A number of governing organizations for youth sports involving contact have published
information recommending specific technique for contact. For example, USA Football has
advocated shoulder tackling for defensive players. Their technique involves breaking down the
approach phase to put players in “hit position” and enable them to use their near or “leverage”

37
shoulder, keeping their head behind the ball carrier rather than across his or her chest.29 Technique
training has also become a part of the football market in the form of rugby-style tackling.3 Few
football organizations give recommendations for absorbing a tackle, though proper form is similar
in both situations: the head should be out of the play. USA Hockey does give information on
receiving a check, and their publications recommend tucking the arms and bracing for an impact.30
Information from multiple organizations and sports were incorporated into these initial criteria for
youth football tackling.
A single grader was used to determine feasibility of the initial criteria. These criteria
included 3 phases – Approach, Impact, and Drive – for both the tackler and ball carrier. These
phases each included several conditions, failing any of which was grounds for failing the entire
phase. Impacts were evaluated by overall number of passing phases (0-3), and head acceleration
was shown to be generally higher with lower score. The drive phase, occurring after initial contact
is made, was shown to associate very little with head acceleration for both players involved and
was not included in further analysis. These criteria were modified for use with multiple graders
by breaking down the first two phases, Approach and Impact, into seven pass-fail categories.15
Division of the phases allowed for more specific criteria to be defined and evaluated
independently. Giving more options was also expected to produce better interrater agreement:
dichotomization of multiple options into pass or fail bins allowed for small disagreements on what
was visible in video analysis, while preserving overall agreement about tackling form. For
example, it may be difficult to discern whether a tackler led with his arm or shoulder, but either
option is still considered good form because the head is not the primary point of contact.
Seven categories for each player were selected for the multiple-rater grading criteria.
These categories were, for the tackler, 1) Balance, 2) Posture, 3) Line of sight, 4) Leads with, 5)
38
Shoulder use, 6) Initiation, and 7) Aims contact into; and for the ball carrier, 1) Balance, 2) Posture,
3) Line of sight, 4) Leads with, 5) Shoulder use, 6) Initiation, and 7) Ball Placement/Rib protection.
Several choices were given for each category, covering the range of possible movements
commonly seen among youth football players making a tackle. For example, choices for the
Posture category included (a) bending at both the hips and knees, (b) bending at the hips only, (c)
bending at the knees only, (d) not bending at either joint, or (e) inconclusive (not discernable from
video). Each choice represented either a pass or fail for that category. In the Posture category,
only choice (a), bending at both the hips and knees, was considered a pass.
Measuring Reliability
Two expert raters, who were familiar with proper tackling form as well as the teams and
coaching staff in the practice videos, were selected to grade an initial sample of 31 tackles (62 total
grades each).13,17 Each reviewer evaluated the impacts three times, with at least 24 hours elapsing
between grading sessions. A selection made at least two of the three times was used as the final
selection for each category.24 The final selections for both raters were dichotomized into a pass
(1) or fail (0) for each category, and these scores were compared using multiple inter-rater
reliability measures. If a rater did not select the same choice at least twice, his choice was counted
as a fail for that category.
Comparison of statistics for each category revealed some ambiguous wording and helped
to define less useful categories. The “Shoulder use” category was eliminated from both the tackler
and ball carrier criteria because it was reliant on the raters first agreeing in the “Leads with”
category. This produced little new information for evaluating proper form. The “Leads with”
category was renamed “Primary contact made with” to make the intent of the category more clear.
Primary contact was defined as the part of the body taking the majority of the initial impact force,

39
even if that force shifts to another body part during the impact. Choices of “Arm” and “Shoulder
pad” were both considered passing in the “Primary contact made with” category because of the
difficulty of discerning a player’s use of his arm as opposed to his shoulder pad in most videos.
“Chest” was eliminated as a choice in the same category because this was seldom the primary
point of contact used to lead and “Shoulder pad” accounted for this choice well. The final tackler
category (Aims contact into) was reworded to be “Primary contact into” to similarly clarify intent.
These changes as a whole helped to increase rater reliability across the criteria (Table 3.1).

40
Table 3.1: Final criteria selected for grading video impacts. Ball carriers and tacklers were
graded separately, but shared criteria in five of the six categories. Bolded choices are those
considered passing for that category. A single category could have multiple options resulting in
receiving a “pass.” Inconclusive was an additional option in all categories to account for times
when graders could not see portions of an impact in video analysis. Definitions: Shy away –
refers to the act of purposely stopping one’s own momentum, without making a football cut
move, in an attempt to soften an impact. Tucked into chest – ball carrier holding the ball within
a region projected forward from his torso. *Ball carrier only.
Category Pass Fail Balance • Feet under shoulder
• One foot in front of the other • Feet closer than shoulder
width Posture • Bends at both hips and knees • Bends at hips
• Bends at knees • Does not bend
Line of Sight • Eyes looking to one side
• Eyes looking toward ball carrier or straight ahead
• Eyes looking toward sky • Eyes looking toward ground
Primary Contact • Initial force through shoulder pad
• Initial force through arm • Initial force through helmet • Initial force through
knee/thigh Initiation • Initiates contact
• Makes a football cut move* • Shies away, hit comes to
him Primary Contact Into (Tackler)
• Ball carrier’s body or shoulder • Ball carrier’s knees • Ball carrier’s head
Rib Protection (Ball Carrier)
• Ball and arms tucked into chest • Ball and arms out, not into chest.

41
There exist multiple schools of thought in regards to the effectiveness of Cohen’s kappa at
presenting the full picture of inter-rater reliability.8,12,16 The most convincing arguments agree that
authors should present more than a summary statistic to give the full picture.8,25 For the sake of
presenting all available information, we chose to present five statistics, which together represent
the range of information regarding the reliability of the criteria: Cohen’s kappa (Κ), total percent
agreement (TPA), AC1, rate of positive agreement (Ppos), and rate of negative agreement (Pneg).
Cohen’s kappa was developed to correct for chance agreement between raters, under the
assumption that if raters are not sure of the correct rating, they guess. Total percent agreement,
though uncorrected for chance agreement, gives a summary of the amount of times raters agree
overall. K is influenced by skew in rate of occurrence, which some believe is warranted.8
However, AC1 was developed as a better summary metric for use when rates of occurrence are
high or low.16 This summary metric agrees well with K when rate of occurrence is equal across
raters, but differs purposely otherwise. Finally, arguments for using K alongside other metrics
have advocated the reporting of proportion of positive and negative agreements (Ppos and Pneg).8
These statistics reveal the source of disagreement (if present) better than a single summary statistic
by reporting the rate of agreement in positive (or negative) occurrence as a proportion of all raters’
reporting of positive (negative) occurrence. Equations for all statistics are presented in Appendix
A.
Acceptable values for each of these common metrics are also debated, because their values
depend on multiple factors within each contingency table.19,25 Baseline acceptable values of 80%
TPA and 0.65 AC1 were chosen to represent good agreement in the presence of high or low rates
of occurrence, because high and low rates of occurrence were observed in most categories.17
Kappa, Ppos and Pneg were also reported for the sake of completeness.

42
Association with Head Acceleration
Importance of each category in the grading criteria was determined by comparison with the
outcome measure of linear head acceleration. A total of 67 youth football players (age 12.7 ± 0.95,
age range 11-14, body mass 55.1 ± 16.2 kg) on four teams were instrumented with helmet-mounted
accelerometer arrays, which were worn in every session. Helmet-mounted accelerometers were
part of the Head Impact Telemetry (HIT) system (Simbex, Lebanon, NH; Sideline Response
System, Riddell Inc., Chicago, IL). This system uses a single-channel data collection trigger of
9.6 g and a resultant threshold of 10 g to discriminate between impact and non-impact events.4,5
Video recordings of all practices were taken with Sony HDR-CX160 and HDR-CX440 camcorders
(Sony, Tokyo, Japan). These videos served a dual purpose of providing video confirmation of all
high magnitude impacts (>40g) and film of tackling drills used for developing and testing the
grading criteria. Participants were recruited to be a part of this study by obtaining written consent
from parents of each youth athlete and verbal consent from each athlete. The Virginia Tech
Institutional Review Board approved this study and all standard procedures were followed in
regards to the research of human subjects and minors.
The types of drills used for this study were all tackling drills involving two, four, or six
players. Only the tackler and ball carrier were graded in each drill. If multiple players assisted on
a tackle, this film was not used as a part of the dataset. Only head-on or side tackles were graded:
no tackles in which the tackler had to approach from behind the ball carrier were used due to the
fact the ball carrier would not be able to react in these situations. If multiple accelerations were
measured during a single tackle, the highest linear acceleration value was used to represent the
impact.

43
Two expert raters graded 105 impacts each, for a total of 210 grades each (105 for tacklers,
105 for ball carriers). Each category had one or two possible answers that were deemed “good
form” and one or more answers deemed “poor form.” These answers were used to dichotomize
each response into a pass or fail for each category. Inter-rater reliability and association with
acceleration outcome were calculated using these dichotomized responses. Each impact was
paired with the accelerations of each athlete after grading was complete to avoid biasing the raters
with knowledge of the outcome.
A chi-squared test for independence (R: chisq.test) was used to determine if passing or
failing a category was associated with high magnitude acceleration, defined as greater than 40 g
resultant linear acceleration.6,7 Approximately 10% of the accelerations measured in the impacts
in this dataset were high magnitude, which represents the amount typically found in youth
football,6 but makes drawing statistical conclusions more difficult. A Wilcoxon Rank Sum test
(R: wilcox.test) was used as a supplement to determine a difference in the non-normal linear
acceleration distributions for passing and failing grades in each category. Statistical significance
was determined as p ≤ 0.05. P-values are the result of bootstrapping contingency tables to 10000
iterations (R: simulate.p.value) in chi-squared results, unless otherwise noted. All statistical
calculations were carried out in R (R Foundation for Statistical Computing, Vienna, Austria).

44
Results
Interrater reliability was acceptable in all categories except Balance (Table 3.2). All
remaining categories with acceptable reliability had at least 79% TPA and an AC1 of at least
0.65.
Table 3.2: Summary of interrater reliability statistics for all seven categories included in final
grading criteria for tackler and ball carrier form.
Balance Posture
Line of Sight
Primary contact Initiation
Primary Contact Into
Rib protection
TPA 70% 79% 87% 80% 89% 83% 87%
AC1 0.494 0.667 0.761 0.653 0.852 0.690 0.847
Κ 0.264 0.437 0.691 0.539 0.496 0.605 0.000
Ppos 0.790 0.861 0.901 0.856 0.934 0.871 0.928
Pneg 0.474 0.559 0.789 0.672 0.556 0.727 0.000

45
Overall, summed scores showed a general trend of decreasing with increasing head
acceleration magnitude across both raters (Figure 3.1). This is especially true if only the score
bins with 20 or more impacts are considered (10% of all grades for each rater). Bins for scores
of 3 or greater had more than 20 impacts in them. The highest scores showed the lowest linear
accelerations distribution across both raters. Each category exhibited different interrater
reliability and different association with high magnitude head acceleration.
Figure 3.1: Boxplots showing sum of all category scores for both tacklers and ball carriers
combined. Higher scores, corresponding to better tackling form, showed the lowest
accelerations in bins with at least 20 ratings (all except Score = 1 and 2). Rater 1’s scores are on
the left in each x-axis bin, and Rater 2’s scores on the right.
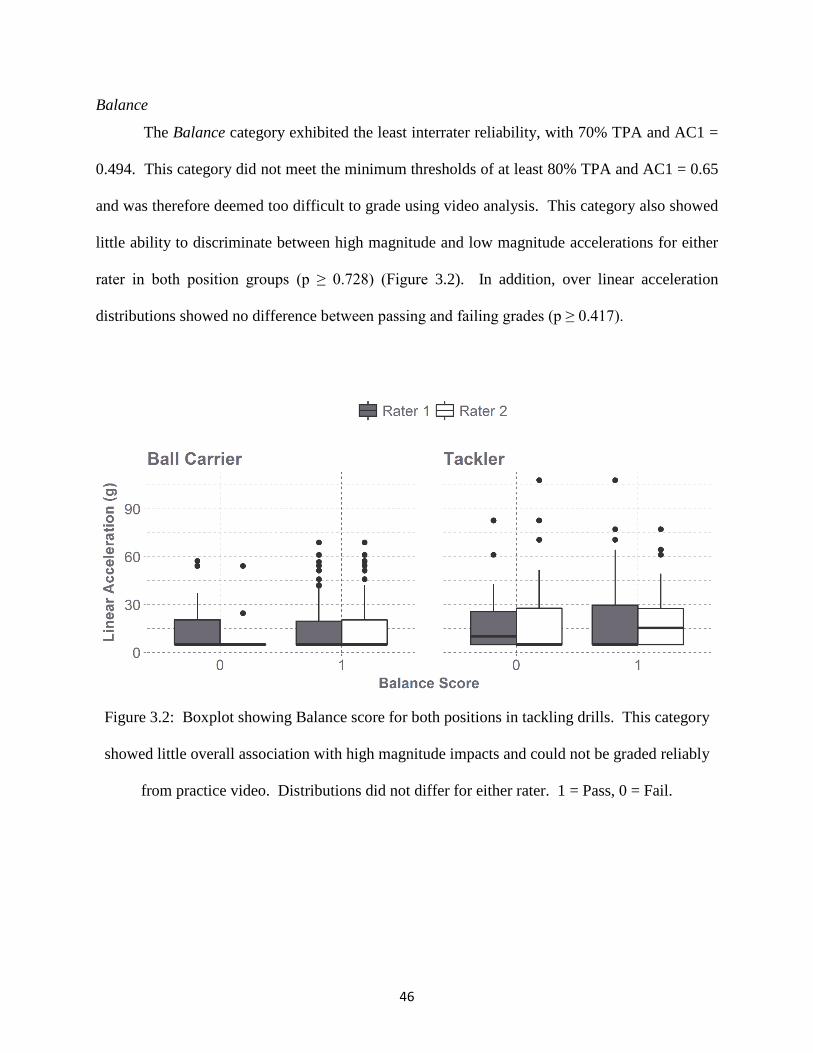
46
Balance
The Balance category exhibited the least interrater reliability, with 70% TPA and AC1 =
0.494. This category did not meet the minimum thresholds of at least 80% TPA and AC1 = 0.65
and was therefore deemed too difficult to grade using video analysis. This category also showed
little ability to discriminate between high magnitude and low magnitude accelerations for either
rater in both position groups (p ≥ 0.728) (Figure 3.2). In addition, over linear acceleration
distributions showed no difference between passing and failing grades (p ≥ 0.417).
Figure 3.2: Boxplot showing Balance score for both positions in tackling drills. This category
showed little overall association with high magnitude impacts and could not be graded reliably
from practice video. Distributions did not differ for either rater. 1 = Pass, 0 = Fail.

47
Posture
The Posture category showed reasonably good interrater reliability with TPA (79%) and
AC1 = 0.667. These scores were deemed sufficient to meet the desired criteria for agreement
because AC1 was higher than the preset threshold and other interrater metrics were in a range
similar to that of metrics with TPA ≥ 80%. Failing this portion of the collision showed association
with high magnitude accelerations in the tackler position for one rater (Rater 2, p = 0.0272) and
but little evidence in the other (Rater 1, p = 0.220). Notably, similar trends are observed in both
raters’ distributions (Figure 3.3), but statistical significance was not seen with Rater 1’s scores.
Distributions showed no difference for either rater (p ≥ 0.283).
Figure 3.3: Boxplot showing Posture score for both positions in tackling drills. Failing this
category showed association with high magnitude impacts for the tackler in Rater 2 but not in
Rater 1. Distributions did not differ for either rater. 1 = Pass, 0 = Fail.

48
Line of Sight
The third category, Line of Sight, showed excellent TPA (87%) and met the criteria for
AC1 (0.761). This agreement reflected in the fact both raters showed similar association between
high magnitude head accelerations and failing scores for the ball carrier (p ≤ 0.033) but not the
tackler (p ≥ 0.534) (Figure 3.4). Wilcox testing showed a difference in linear acceleration
distributions for passing and failing scores in the ball carrier for Rater 2 only (p = 0.021, all other
comparisons p ≥ 0.104). A majority of failing scores (94%) were given due to the player looking
toward the ground rather than toward his opponent or to the side during the tackle.
Figure 3.4: Boxplot showing Line of Sight score for both positions in tackling drills. Failing
category showed association with high magnitude impacts for the ball carrier in both raters.
Distributions differed for the ball carrier in Rater 2’s scores. 1 = Pass, 0 = Fail.

49
Primary Contact
The Primary Contact category showed strong interrater reliability, with TPA of 80% and
AC1 = 0.653. This category was deemed sufficient in agreement measures, and this conclusion
was strengthened by the fact both raters showed evidence of association between failing scores
and high magnitude acceleration outcome among tacklers. Both raters generated similar score
distributions for the tackler, while Rater 1 (p = 0.0518) showed slightly stronger evidence of
association with high magnitude acceleration than Rater 2 (p = 0.0963) (Figure 3.5). Distribution
differences were significant for the tackler in both raters (p ≤ 0.048) and for the ball carrier in
Rater 1’s scores (p = 0.0007) but not in Rater 2’s scores (p = 0.822).
Figure 3.5: Boxplot showing Primary Contact score for both positions in tackling drills. Failing
this category showed evidence of association with high magnitude impacts for the tackler in both
raters’ scoring. Distributions differed for both positions in Rater 1’s scores and differed for the
tackler in Rater 2’s scores. 1 = Pass, 0 = Fail.

50
Initiation
The Initiation category exhibited the highest TPA (89%) and AC1 value (0.852), likely
because of its extremely high proportion of positive agreement (Ppos = 0.934). Raters showed
similar distributions (Figure 3.6) in scores for both positions. Scores from Rater 1 (p = 0.009)
showed association between failing this category and experiencing a high magnitude acceleration
as the tackler, while Rater 2’s trend was similar but did not show the same strength of evidence
for association (p = 0.194). Ball carrier scores did not show association between high magnitude
acceleration and failing scores in this category for either rater (p ≥ 0.457). Distributions were
different for the tackler in Rater 1 (p = 0.0229) and showed evidence of difference for the ball
carrier in Rater 2 (p = 0.0853), but did not differ otherwise (p ≥ 0.224).
Figure 3.6: Boxplot showing Initiation score for both positions in tackling drills. Failing this
category showed evidence of association with high magnitude impacts for the tackler in both
raters. Distributions differed in the tackler with Rater 1’s scores and showed evidence of
difference in the ball carrier with Rater 2’s scores. 1 = Pass, 0 = Fail.

51
Primary Contact Into
The tackler-only category of Primary Contact Into measured whether or not the part of the
ball carrier that was contacted first influenced head acceleration outcome for the tackler. The
intention here was to determine whether the tackler hit too high (head) or too low (knees).
Interrater reliability measures were acceptable for this category (TPA = 83%, AC1 = 0.69). Scores
from neither rater showed evidence of this category being associated with high magnitude
acceleration in the tackler (p ≥ 0.177) (Figure 3.7). Distributions for this category did not differ
for either rater (p ≥ 0.308).
Figure 3.7: Boxplot showing Primary Contact Into score for the tackler in tackling drills. Failing
this category showed no evidence of association with high magnitude impacts for the tackler in
either raters’ scores. Distributions for this category did not differ for either rater. 1 = Pass, 0 =
Fail.

52
Ball Placement
The final category measured, Ball Placement, was intended to determine the extent to
which a ball carrier protected his or herself, especially the torso region, by bracing for an impact.
This category had high occurrence rates and good overall agreement (TPA = 87%), but zero
agreement during non-occurrences. This category was found to be unassociated with high
magnitude acceleration outcome in either rater (p ≥ 0.345) (Figure 3.8). In addition, linear
acceleration distributions did not show evidence of difference in Rater 1 (p = 0.342).
Figure 3.8: Boxplot showing Ball Placement score for the ball carrier in tackling drills. Failing
this category showed no evidence of association with high magnitude impacts in either raters’
scores. Distributions for this category did not differ for either rater. 1 = Pass, 0 = Fail.

53
Important Categories
Four of the six categories emerged as having evidence of association with high magnitude
acceleration in at least one rater’s score in individual impacts during tackling drills: Posture
(Tackler), Line of Sight (Ball carrier), Primary Contact (Tackler), and Initiation (Tackler) (Figure
3.9). Three of these four categories were also found to differ in overall head acceleration
distribution in at least one rater: Line of Sight (Ball carrier), Primary Contact (Tackler, Ball
carrier), and Initiation (Tackler). Each of these categories exhibited high interrater agreement.
Raters may have differed in their findings of association with high magnitude acceleration due to
a difference in only a few ratings; after all, only one-tenth of the impacts had high magnitude
accelerations in this dataset. When association was not found in one rater, the distribution of
accelerations in his pass and fail bins showed similar trends with the other rater, in whose scores
association was statistically significant. Wilcox testing confirmed differences in overall
distributions of head acceleration between passing and failing scores in these same categories,
except Posture.

54
Figure 3.9: Boxplots showing sum of the four important category scores by position. Important
categories were Posture (Tackler), Line of Sight (Ball carrier), Primary Contact (Tackler), and
Initiation (Tackler). Tackles given higher scores, corresponding to better tackling form in
important categories, showed the lowest acceleration distributions. Rater 1’s scores are on the
left, Rater 2’s scores on the right.

55
Discussion
Despite the fact this cohort of youth football players had not been formally trained in any
specific tackling program, technique varied widely across impacts. Receiving a low score as a ball
carrier or a tackler did not guarantee experiencing a high magnitude acceleration, but chances of
experiencing a high-risk impact were higher when a tackle with worse form was observed. This
was similar across both position groups, though a greater number of categories showed association
with high magnitude acceleration outcome in the tackler. Head acceleration distribution was seen
to be different when receiving a passing score in three of the categories also displaying association
with high magnitude accelerations.
The original criteria for scoring impacts was modified for use with multiple raters and
afterward adjusted to improve interrater reliability. The original Shoulder use category was
removed because it gave little new information past the Primary Contact category. Shoulder use
was also difficult to grade reliably via video analysis due to camera angles. It may not be as
important or reliable to train players to place their shoulder in a specific orientation because it may
not be practical in some situations. Rather, shoulder use in general, instead of leading with the
head, should be emphasized for every impact.
Balance, a part of a player’s approach, was deemed insufficient in its interrater reliability.
This category depended on raters being able to determine the placement and angle of players’ feet
directly before an impact, which was often difficult in certain videos. Foot placement could not
be reliably graded with the methods used in this study. Neither raters’ scores for this category
showed association with high magnitude acceleration or difference in acceleration distribution.
Some organizations stress foot placement for making a proper tackle, and this may have something

56
to do with successfully executing a tackle, but has little to do with preventing high-risk head impact
exposure.
The last two categories, Contact and Ball Placement, showed sufficient interrater
reliability, but did not show association with head acceleration outcome or differences in
distribution. Ball placement, thought important for ball carriers’ overall objective of advancing
the ball down the field without losing possession, is not a determiner of head acceleration.
Likewise, the part of the ball carrier that a tackler hits did not seem to affect whether or not the
tackler or ball carrier saw a high magnitude acceleration. Though aiming a hit into a ball carrier’s
head or knees may prevent a tackler from executing a tackle, it does not appear to influence his or
her head acceleration outcome.
The three most important categories for the tackler were Posture, Primary Contact, and
Initiation. These categories represent a tackler bending at the hips and knees, leading with his
shoulder pad or arm, and initiating contact rather than shying away. Proper posture in approaching
a tackle likely sets up the remaining segments of that impact by allowing the tackler to brace for
an impact without dropping his head (bending only at the hips) or sitting back on his heels (bending
only at the knees). Using the shoulder or arm allows the tackler to keep his head away from the
initial impact force. Though players did intentionally lead with the helmet at times, initiating
contact gave the tackler the choice of which body part to lead with rather than being at the mercy
of where the ball carrier decided to make contact with him. These three categories, when passed
together, imply that the tackler was prepared for the impact and chose how to use his body during
the impact by not leading with the head.
The ball carrier showed association with high magnitude acceleration only in the Line of
Sight category, though the Initiation category also showed higher median accelerations for failing
57
scores than passing scores in both raters. Receiving a passing score in the Primary Contact
category was seen to give a significantly different head acceleration distribution than receiving a
failing score. The drills captured on film for use in this study were typically in small zones and
controlled spaces. Ball carriers often did not need to look at the tackler to know where he would
be. Designing drills in which ball carriers are required to look at their target could in turn lead to
them keeping their head out of more plays by making them aware of their head’s impending
involvement (expecting the impact), keeping their head from being the first point of contact, and
possibly keeping them from hitting tacklers’ heads. In addition, ball carriers are not usually the
subject of training in tackling programs. Thus, ball carriers may not have as much training on
proper form (e.g. keeping their heads up) going into an impact.
It is interesting that ball carriers failing in the Line of Sight category did not correlate
entirely with them failing in the Primary Contact category. This could be because ball carriers are
typically trying to avoid the tackler, or glance off him, in order to continue past him. Ball carriers
may be less apt to lead with their heads because of their objectives, but may still receive head
impacts because they do not see the impact coming. Ball carriers may also receive head impacts
when they are driven to the ground. Accelerations measured from being driven to the ground were
not differentiated from accelerations caused by the first point of contact because the highest
measured acceleration was chosen for each impact event.
Limitations of this study include the use of the same two expert raters for all grading.
Interrater reliability was measured and showed good agreement between the two raters in this
study, except in the Balance category. However, more raters may need to be used to effectively
scale to all potential users for evaluating tackling form. Video quality also influenced some
impacts, as different camera angles and lighting conditions were observed across the video records.

58
Having a set angle with each drill type (e.g. perpendicular to the plane of each impact) could help
to standardize grading. Additionally, using two or more cameras to limit occlusions could
eliminate choices of “Inconclusive” or guessing by raters. Finally, the tackles used in development
and grading for this study were from a small sample of three teams over 10 different practice days.
Future studies should investigate these trends across more teams over a longer period of time to
confirm the findings in this study. Extensions of this study should also determine if players use
similar form when engaging in collisions during games. Having been familiar with players in this
study, the authors expect players to engage in similar tackling form during games.26
Conclusions
Technique during contact affects head acceleration outcome for both the tackler and ball
carrier in youth football players during tackling drills in practice. Tacklers who exhibited proper
posture, kept their head out of the impact and favored leading with their shoulder, and initiated
contact rather than shying away had less chance of experiencing high magnitude impacts. Ball
carriers who kept their eyes looking straight ahead or off to one side, without dropping their heads
and taking their eyes off the tackler, showed the best outcome in head acceleration. This study
demonstrates the potential effectiveness of training youth football players in tackling technique to
reduce head acceleration exposure, but also shows a need for tackle absorption training for ball
carriers, as well. This study does not endorse any specific tackling technique – each teaching style
should be evaluated independently to determine its effectiveness in reducing head acceleration.
References
1. Alosco ML, Kasimis AB, Stamm JM, Chua AS, Baugh CM, Daneshvar DH, et al: Age of first exposure to American football and long-term neuropsychiatric and cognitive outcomes. Translational Psychiatry 7:e1236, 2017

59
2. American Academy of Pediatrics: Tackling in Youth Football. Pediatrics 136:e1419-e1430, 2015
3. Atavus Rugby: Tacklytics, in, 2018 4. Beckwith JG, Greenwald RM, Chu JJ: Measuring Head Kinematics in Football: Correlation
Between the Head Impact Telemetry System and Hybrid III Headform. Ann Biomed Eng 40:237-248, 2012
5. Beckwith JG, Greenwald RM, Chu JJ, Crisco JJ, Rowson S, Duma SM, et al: Head Impact Exposure Sustained by Football Players on Days of Diagnosed Concussion. Med Sci Sports Exerc 45:737-746, 2013
6. Campolettano ET, Gellner RA, Rowson S: High-magnitude head impact exposure in youth football. Journal of Neurosurgery: Pediatrics 20:604-612, 2017
7. Campolettano ET, Rowson S, Duma SM: Drill-specific head impact exposure in youth football practice. J Neruosurg Pediatr 18:536-541, 2016
8. Cicchetti DV, Feinstein AR: High agreement but low kappa: II. Resolving the paradoxes. Journal of Clinical Epidemiology 43:551-558, 1990
9. Crisco JJ, Greenwald RM: Let's get the head further out of the game: a proposal for reducing brain injuries in helmeted contact sports. Curr Sports Med Rep 10:7-9, 2011
10. Daniel RW, Rowson S, Duma SM: Head Impact Exposure in Youth Football. Ann Biomed Eng 40:976-981, 2012
11. Daniel RW, Rowson S, Duma SM: Head impact exposure in youth football: middle school ages 12–14 years. Journal of biomechanical engineering 136:094501, 2014
12. Feinstein AR, Cicchetti DV: High agreement but low Kappa: I. the problems of two paradoxes. Journal of Clinical Epidemiology 43:543-549, 1990
13. Gardner AJ, Levi CR, Iverson GL: Observational Review and Analysis of Concussion: a Method for Conducting a Standardized Video Analysis of Concussion in Rugby League. Sports Medicine - Open 3:26, 2017
14. Gellner RA, Campolettano ET, Rowson S: Are Specific Players More Likely to be Involved in High Magnitude Head Impacts in Youth Football? Submitted to Journal of Neurosurgery Pediatrics, 2018
15. Gellner RA, Campolettano ET, Rowson S: Association Between Tackling Technique and Head Acceleration Magnitude in Youth Football Players. Accepted to Biomedical Science Instrumentation, 2018
16. Gwet K: Computing inter-rater reliability and its variance in the presence of high agreement, 2008, Vol 61
17. Hutchison MG, Comper P, Meeuwisse WH, Echemendia RJ: An observational method to code concussions in the National Hockey League (NHL): the heads-up checklist. British Journal of Sports Medicine 48:125-129, 2014
18. Kerr ZY, Yeargin S, Valovich McLeod TC, Nittoli VC, Mensch J, Dodge T, et al: Comprehensive coach education and practice contact restriction guidelines result in lower injury rates in youth American football. Orthopaedic journal of sports medicine 3:2325967115594578, 2015
19. Landis JR, Koch GG: The Measurement of Observer Agreement for Categorical Data. Biometrics 33:159-174, 1977
20. Montenigro Philip H. AML, Martin Brett M., Daneshvar Daniel H., Mez Jesse, Chaisson Christine E., Nowinski Christopher J., Au Rhoda, McKee Ann C., Cantu Robert C., McClean Michael D., Stern Robert A., and Tripodis Yorghos: Cumulative Head Impact

60
Exposure Predicts Later-Life Depression, Apathy, Executive Dysfunction, and Cognitive Impairment in Former High School and College Football Players. Journal of Neurotrauma 34:328-340, 2017
21. National Federation of State High School Associations: Recommendations and Guidlines for Minimizing Head Impact Exposure and Concussion Risk in Football, in NFHS Concussion Summit Task Force, 2014
22. Pop Warner Little Scholars Inc.: Pop Warner Little Scholars Official Rules, in, 2014 23. Scholars PWL: Limited Contact in Practice Rule, in, 2012, Vol 2018 24. Shrout PE: Measurement reliability and agreement in psychiatry. Statistical Methods in
Medical Research 7:301-317, 1998 25. Sim J, C Wright C: The Kappa Statistic in Reliability Studies: Use, Interpretation, and
Sample Size Requirements, 2005, Vol 85 26. Srinidhi Bellamkonda, Samantha J. Woodward, Eamon Campolettano, Ryan Gellner, Mireille
E. Kelley, Derek A. Jones, et al: Head Impact Exposure in Practices Correlates with Exposure in Games for Youth Football Players. In Revision - Journal of Applied Biomechanics, 2018
27. Stern RA, Riley DO, Daneshvar DH, Nowinski CJ, Cantu RC, McKee AC: Long-term consequences of repetitive brain trauma: chronic traumatic encephalopathy. PM R 3:S460-467, 2011
28. Stokes JV, Luiselli JK, Reed DD: A behavioral intervention for teaching tackling skills to high school football athletes. Journal of Applied Behavior Analysis 43:509-512, 2010
29. USA Football: Heads Up Football, in, 2017, Vol 2017 30. USA Hockey Coaching Education Program: Checking the Right Way for Youth Hockey. 2009 31. Young TJ, Daniel RW, Rowson S, Duma SM: Head Impact Exposure in Youth Football:
Elementary School Ages 7-8 Years and the Effect of Returning Players. Clin J Sport Med, 2013
61
CHAPTER 4
Method for Determining the Structural Response of Helmet Shells during Dynamic Loading
Abstract
Football helmet design and development involves changing a range of parameters
including padding material and thickness, shell material and thickness, and padding location, all
of which alter a helmet’s dynamic response to impact. All of these parameters can affect
performance of the helmets in conventional standards and supplemental testing. These parameters
can be costly and time-consuming to change quickly during prototype development, and
computational modeling of helmets helps to reduce both cost and time required. As one method
of enabling helmet modeling for reduced prototyping time, full helmet models will need to be
developed and validated with appropriate material characteristics. Most current material testing
methods do not characterize response during real world loading conditions. We present a novel
method for measuring the force-deflection characteristics of a football helmet shell using a
pneumatic ram. This method involves a rigidly mounted helmet that is allowed to move along a
single axis. Two accelerometers enabled the measurement of force and relative displacement, and
tests were conducted in the range of 3 – 6 m/s input velocities for impacts to the front and side of
the helmet. Data demonstrate repeatability at each impact configuration.
Introduction Tensile or compressive testing machines are often used to determine mechanical properties
of materials. These machines typically load the specimens at rates in the quasi-static range below
1 cm/s.1 Small loading rates such as these can be orders of magnitude lower than loading rates
seen in everyday use of these products. Ideally, the loading rates used in tests would coincide with
the rates at which these products are used, as some rate dependency may exist. In addition,
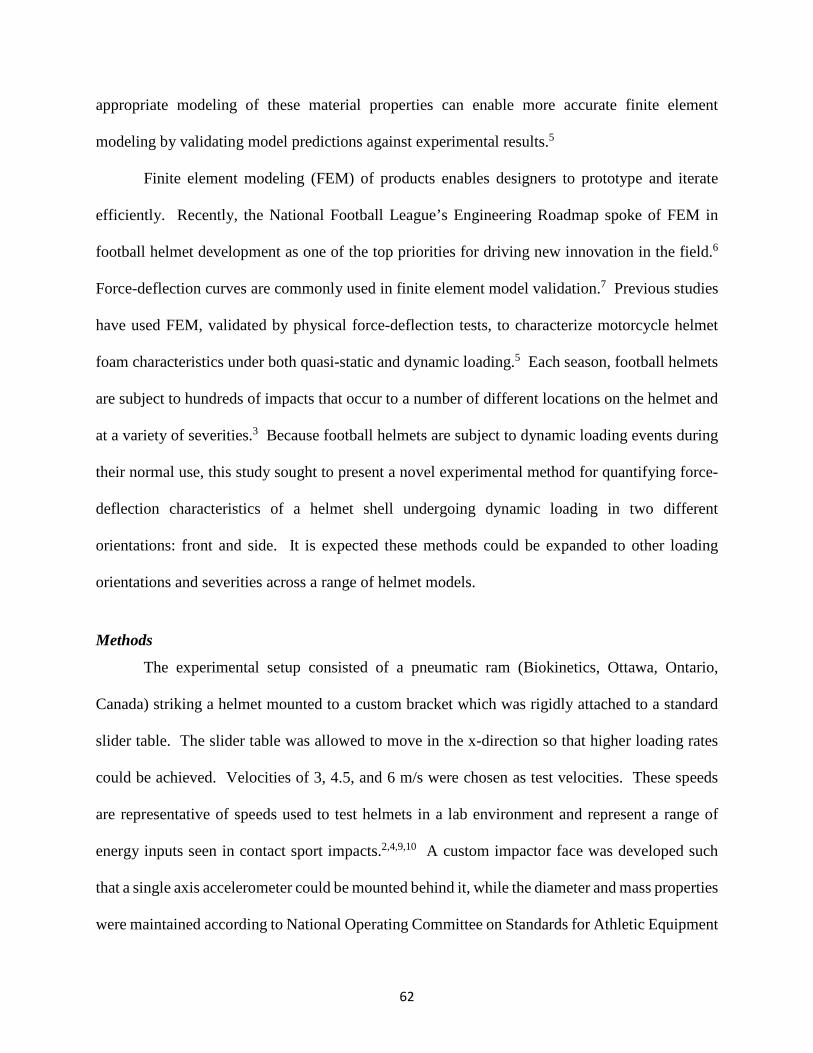
62
appropriate modeling of these material properties can enable more accurate finite element
modeling by validating model predictions against experimental results.5
Finite element modeling (FEM) of products enables designers to prototype and iterate
efficiently. Recently, the National Football League’s Engineering Roadmap spoke of FEM in
football helmet development as one of the top priorities for driving new innovation in the field.6
Force-deflection curves are commonly used in finite element model validation.7 Previous studies
have used FEM, validated by physical force-deflection tests, to characterize motorcycle helmet
foam characteristics under both quasi-static and dynamic loading.5 Each season, football helmets
are subject to hundreds of impacts that occur to a number of different locations on the helmet and
at a variety of severities.3 Because football helmets are subject to dynamic loading events during
their normal use, this study sought to present a novel experimental method for quantifying force-
deflection characteristics of a helmet shell undergoing dynamic loading in two different
orientations: front and side. It is expected these methods could be expanded to other loading
orientations and severities across a range of helmet models.
Methods
The experimental setup consisted of a pneumatic ram (Biokinetics, Ottawa, Ontario,
Canada) striking a helmet mounted to a custom bracket which was rigidly attached to a standard
slider table. The slider table was allowed to move in the x-direction so that higher loading rates
could be achieved. Velocities of 3, 4.5, and 6 m/s were chosen as test velocities. These speeds
are representative of speeds used to test helmets in a lab environment and represent a range of
energy inputs seen in contact sport impacts.2,4,9,10 A custom impactor face was developed such
that a single axis accelerometer could be mounted behind it, while the diameter and mass properties
were maintained according to National Operating Committee on Standards for Athletic Equipment

63
(NOCSAE) standard 081-14m15.8 Another single axis accelerometer was rigidly attached to the
back of the custom bracket on which the helmet was mounted (Figure 4.1). The mass of the custom
bracket and helmet assembly was approximately 21.2 kg; impactor mass was 15.56 kg as per
NOCSAE standard.8 A standard braking mechanism consisting of a metal cone, which
progressively slows a large diameter rubber gasket attached to the impacting rod, was part of the
pneumatic ram; however, complete disengagement of the impactor face from the helmet before
engaging the built-in brake was verified for each orientation. This ensured energy transfer to only
the helmet-slider system during each test.
Figure 4.1: Experimental setup consisting of a linear impactor with custom face, bracket with
attached helmet, slider table, and accelerometers mounted to impactor face and bracket. Positive
sensing axes pointed away from the helmet for both the bracket-mounted and the impactor-
mounted accelerometers.
One commercially available Schutt Air XP Pro model football helmet was used to evaluate
the experimental design with five trials in each impact configuration. To mount the helmets to the
flat bracket, the helmet shells were 3-D scanned, and a 3-D printed mount was developed which

64
enabled interface with both the curvature of the helmet and flat bracket. Different mounting pieces
were used for the front and side locations to account for the different curvatures at these locations.
The liner system was left in the helmets during testing, and was shifted as necessary to allow the
mounts to couple to the helmets.
Impact locations were chosen to represent areas of the helmet shell that are commonly
impacted during regular play.3 Front and side locations were defined from a reference point. The
reference point is described by a point at which the helmet shell is mounted in the front orientation,
is laterally centered with the impactor face, and at which the bottom lip of the foremost edge of
the shell is even with the bottom of the impactor face (Figure 4.2). Both orientations were
measured from this point and are pictured in Figure 4.3. Displacements from the zero point are
listed for both test locations in Table 4.1.

65
Figure 4.2: A zero location for the helmet was set to a point at which the helmet was centered
with the impactor face laterally and the bottom lip of the foremost part of the helmet was aligned
with the bottom of the impactor face. Z-axis is positive toward the bottom of the helmet, Y is
positive out the right ear of the helmet (out of page), and X is positive toward the impactor face.
Figure 4.3: Front and side locations of the helmet for the experimental setup. Dimensions
measured from the zero point are printed in Table 1.
z
x y
3-D printed mount
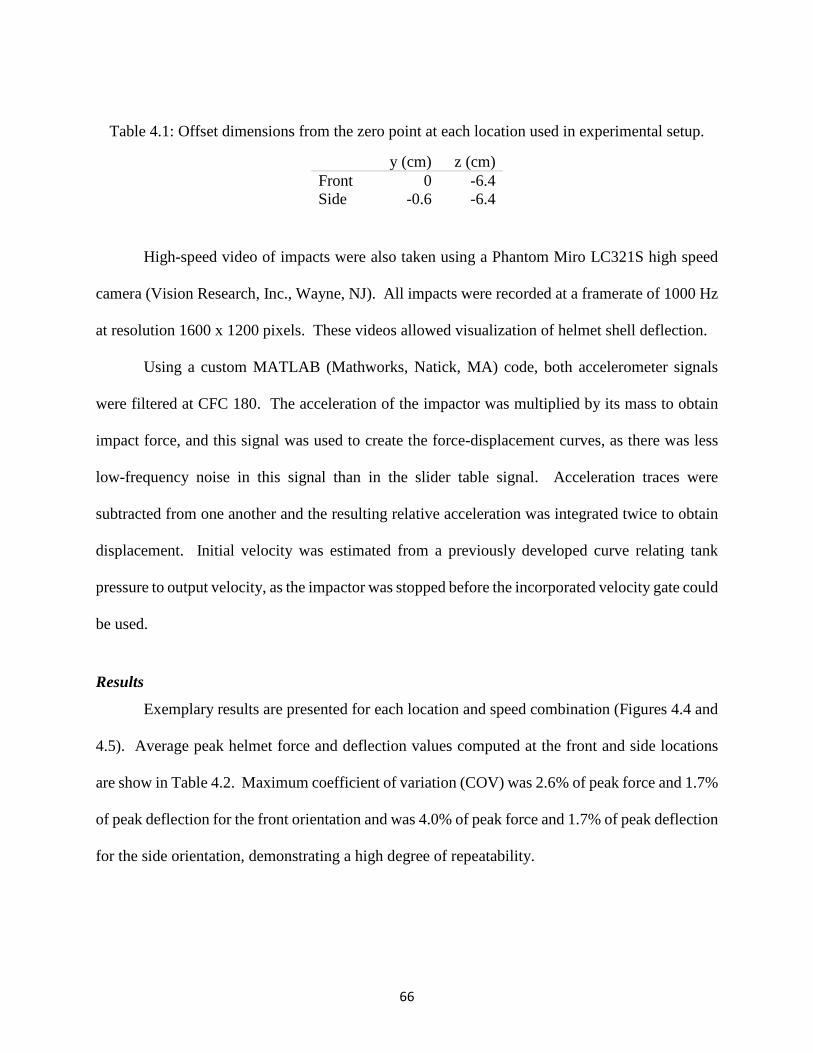
66
Table 4.1: Offset dimensions from the zero point at each location used in experimental setup.
y (cm) z (cm) Front 0 -6.4 Side -0.6 -6.4
High-speed video of impacts were also taken using a Phantom Miro LC321S high speed
camera (Vision Research, Inc., Wayne, NJ). All impacts were recorded at a framerate of 1000 Hz
at resolution 1600 x 1200 pixels. These videos allowed visualization of helmet shell deflection.
Using a custom MATLAB (Mathworks, Natick, MA) code, both accelerometer signals
were filtered at CFC 180. The acceleration of the impactor was multiplied by its mass to obtain
impact force, and this signal was used to create the force-displacement curves, as there was less
low-frequency noise in this signal than in the slider table signal. Acceleration traces were
subtracted from one another and the resulting relative acceleration was integrated twice to obtain
displacement. Initial velocity was estimated from a previously developed curve relating tank
pressure to output velocity, as the impactor was stopped before the incorporated velocity gate could
be used.
Results
Exemplary results are presented for each location and speed combination (Figures 4.4 and
4.5). Average peak helmet force and deflection values computed at the front and side locations
are show in Table 4.2. Maximum coefficient of variation (COV) was 2.6% of peak force and 1.7%
of peak deflection for the front orientation and was 4.0% of peak force and 1.7% of peak deflection
for the side orientation, demonstrating a high degree of repeatability.

67
Figure 4.4: Representative test image and force-deflection curves for all five trials at each speed
in the front location.
Figure 4.5: Representative test image and force-deflection curves for all five trials at each speed
in the side location.
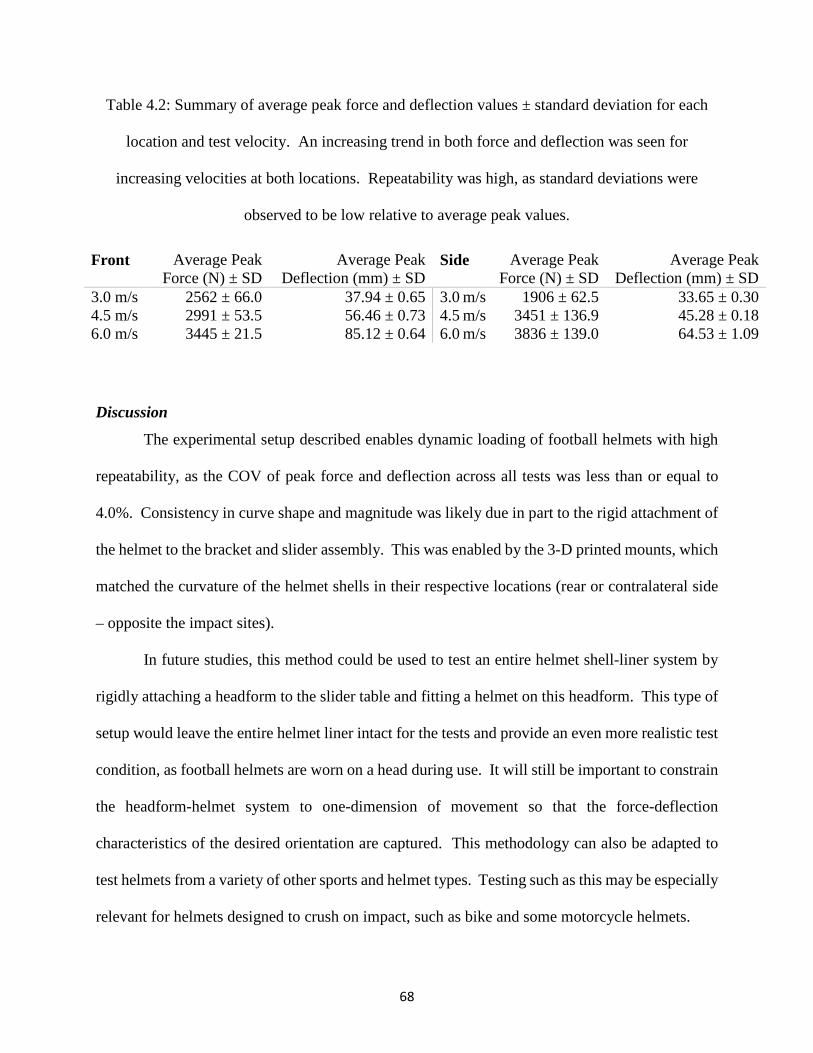
68
Table 4.2: Summary of average peak force and deflection values ± standard deviation for each
location and test velocity. An increasing trend in both force and deflection was seen for
increasing velocities at both locations. Repeatability was high, as standard deviations were
observed to be low relative to average peak values.
Front Average Peak Force (N) ± SD
Average Peak Deflection (mm) ± SD
Side Average Peak Force (N) ± SD
Average Peak Deflection (mm) ± SD
3.0 m/s 2562 ± 66.0 37.94 ± 0.65 3.0 m/s 1906 ± 62.5 33.65 ± 0.30 4.5 m/s 2991 ± 53.5 56.46 ± 0.73 4.5 m/s 3451 ± 136.9 45.28 ± 0.18 6.0 m/s 3445 ± 21.5 85.12 ± 0.64 6.0 m/s 3836 ± 139.0 64.53 ± 1.09
Discussion
The experimental setup described enables dynamic loading of football helmets with high
repeatability, as the COV of peak force and deflection across all tests was less than or equal to
4.0%. Consistency in curve shape and magnitude was likely due in part to the rigid attachment of
the helmet to the bracket and slider assembly. This was enabled by the 3-D printed mounts, which
matched the curvature of the helmet shells in their respective locations (rear or contralateral side
– opposite the impact sites).
In future studies, this method could be used to test an entire helmet shell-liner system by
rigidly attaching a headform to the slider table and fitting a helmet on this headform. This type of
setup would leave the entire helmet liner intact for the tests and provide an even more realistic test
condition, as football helmets are worn on a head during use. It will still be important to constrain
the headform-helmet system to one-dimension of movement so that the force-deflection
characteristics of the desired orientation are captured. This methodology can also be adapted to
test helmets from a variety of other sports and helmet types. Testing such as this may be especially
relevant for helmets designed to crush on impact, such as bike and some motorcycle helmets.

69
This study was limited by the use of one helmet shell of a single model. Other helmet
models may not be as easily mounted to a bracket, and location of padding in other helmet models
may make the use of the exact methods presented more difficult. In addition, an estimated force
was calculated using the mass and measured acceleration traces. A load cell could theoretically
be used in place of accelerometers to measure force directly, but would need to be inertially
compensated. Finally, initial velocity used in the integration of acceleration curves was estimated
from a previously validated correlation between tank pressure and output velocity of the specific
impactor used for this test series.
Conclusions
A novel method for determining force-deflection characteristics of football helmets
undergoing dynamic loading has been described. Illustrative data show force-deflection curves
for the material and geometry with high repeatability in peak force and deflection values in six
distinct test conditions. This method can be further developed in the future by modifying for
multiple helmet types, directly measuring input velocity, and including other locations at which
the helmet can be impacted. In addition, this method can also be modified to enable testing of an
entire helmet-liner system so that finite element models of a range of helmet types can be validated.
It is expected these data can inform finite element modeling by validating dynamic characteristics
of football helmet models.
References
1. ASTM International: ASTM D638-14 Standard Test Method for Tensile Properties of Plastics, in. West Conshohocken, PA, 2014
2. Brolinson PG, Manoogian S, McNeely D, Goforth M, Greenwald R, Duma S: Analysis of linear head accelerations from collegiate football impacts. Curr Sports Med Rep 5:23-28, 2006
3. Crisco JJ, Fiore R, Beckwith JG, Chu JJ, Brolinson PG, Duma S, et al: Frequency and location of head impact exposures in individual collegiate football players. J Athl Train 45:549-559, 2010

70
4. Crisco JJ, Wilcox BJ, Machan JT, McAllister TW, Duhaime AC, Duma SM, et al: Magnitude of head impact exposures in individual collegiate football players. J Appl Biomech 28:174-183, 2012
5. Mills NJ, Wilkes S, Derler S, Flisch A: FEA of oblique impact tests on a motorcycle helmet. International Journal of Impact Engineering 36:913-925, 2009
6. National Football League: The NFL's Engineering Roadmap: Driving Progress Toward Better Protective Equipment, in, 2017, Vol 2017
7. Nicholas A. Vavalle, Matthew L. Davis, Joel D. Stitzel, Gayzik FS: Quantitative Validation of a Human Body Finite Element Model Using Rigid Body Impacts. Annals of Biomedical Engineering 43:2163-2174, 2015
8. NOCSAE: Standard pneumatic ram test method and equipment used in evaluating the performance characteristics of protective headgear and face guards: NOCSAE DOC (ND) 081-14m15, in, 2016
9. Rowson B, Rowson S, Duma SM: Hockey STAR: A Methodology for Assessing the Biomechanical Performance of Hockey Helmets. Annals of Biomedical Engineering 43:2429-2443, 2015
10. Rowson S, Duma SM: Development of the STAR Evaluation System for Football Helmets: Integrating Player Head Impact Exposure and Risk of Concussion. Ann Biomed Eng 39:2130-2140, 2011

71
CONCLUSIONS
Youth football head acceleration data revealed that team, position, and position within team
were all significant factors in individual player head impact exposure. A player’s role on the team
(e.g. playtime) and the coaching style on that team also influence the frequency of head impacts
experienced by members of a team. Some individual players are more prone to being involved in
high magnitude impacts, and a small group is typically responsible for a majority of high
magnitude impacts on any given team. Individual-specific interventions could reduce exposure to
high magnitude head accelerations in practice for entire teams by as much as half.
Technique used during contact affects head acceleration outcome for both the tackler and
ball carrier in youth players during tackling drills in practice. The most important aspects for a
tackler are posture (bending at the hips and knees), keeping the head out of the tackle and leading
with the shoulder or arm, and initiating contact rather than shying away. Ball carriers should keep
their head and eyes looking forward, toward the tackler, or off to one side without looking down
and taking their eyes off the tackler. Training youth players in proper form may be effective at
reducing head acceleration exposure, so long as the training causes players to exhibit good form
during tackling drills. Ball carriers, for whom no current recommendation exist, should be
included in training for collision absorption – offensive players experienced just as many high
magnitude accelerations as tacklers in graded impacts. This thesis did not investigate outcome
measures tied to specific training programs; all training programs should be evaluated individually
to determine effectiveness in reducing head acceleration.
Force-deflection characteristics of helmets under dynamic loading can be generated in a
lab environment. The presented methodology could be modified in future experiments for
different helmet types. Potential improvements could be made to this methodology by modifying

72
the 3-D printed mounts for multiple helmet types, directly measuring impact velocity, and
including other orientations (e.g. top) in the test matrix.

73
REFERENCES (INTRODUCTION)
1. Alosco ML, Kasimis AB, Stamm JM, Chua AS, Baugh CM, Daneshvar DH, et al: Age of first exposure to American football and long-term neuropsychiatric and cognitive outcomes. Translational Psychiatry 7:e1236, 2017
2. ASTM International: ASTM D638-14 Standard Test Method for Tensile Properties of Plastics, in. West Conshohocken, PA, 2014
3. Campolettano ET, Gellner RA, Rowson S: High-magnitude head impact exposure in youth football. Journal of Neurosurgery: Pediatrics 20:604-612, 2017
4. Campolettano ET, Rowson S, Duma SM: Drill-specific head impact exposure in youth football practice. J Neruosurg Pediatr 18:536-541, 2016
5. CDC: Sports related concussions. HCUIP: Agency for Healthcare Research and Quality 60, 2011
6. Cobb BR, Rowson S, Duma SM: Age-related differences in head impact exposure of 9-13 year old football players. Biomedical sciences instrumentation 50:285-290, 2013
7. Cobb BR, Urban JE, Davenport EM, Rowson S, Duma SM, Maldjian JA, et al: Head impact exposure in youth football: elementary school ages 9-12 years and the effect of practice structure. Ann Biomed Eng 41:2463-2473, 2013
8. Crisco JJ, Wilcox BJ, Beckwith JG, Chu JJ, Duhaime AC, Rowson S, et al: Head impact exposure in collegiate football players. J Biomech 44:2673-2678, 2011
9. Daniel RW, Rowson S, Duma SM: Head Impact Exposure in Youth Football. Ann Biomed Eng 40:976-981, 2012
10. Daniel RW, Rowson S, Duma SM: Head impact exposure in youth football: middle school ages 12–14 years. Journal of biomechanical engineering 136:094501, 2014
11. Duma SM, Rowson S, Cobb B, MacAllister A, Young T, Daniel R: Effectiveness of helmets in the reduction of sports-related concussions in youth. Institute of Medicine, Commissioned paper by the Committee on Sports-Related Concussion in Youth, 2013
12. Kelley Mireille E. UJE, Miller Logan E., Jones Derek A., Espeland Mark A., Davenport Elizabeth M., Whitlow Christopher T., Maldjian Joseph A., and Stitzel Joel D.: Head Impact Exposure in Youth Football: Comparing Age- and Weight-Based Levels of Play. Journal of Neurotrauma 34:1939-1947, 2017
13. Kerr ZY, Yeargin S, Valovich McLeod TC, Nittoli VC, Mensch J, Dodge T, et al: Comprehensive coach education and practice contact restriction guidelines result in lower injury rates in youth American football. Orthopaedic journal of sports medicine 3:2325967115594578, 2015
14. Mills NJ, Wilkes S, Derler S, Flisch A: FEA of oblique impact tests on a motorcycle helmet. International Journal of Impact Engineering 36:913-925, 2009
15. Montenigro Philip H. AML, Martin Brett M., Daneshvar Daniel H., Mez Jesse, Chaisson Christine E., Nowinski Christopher J., Au Rhoda, McKee Ann C., Cantu Robert C., McClean Michael D., Stern Robert A., and Tripodis Yorghos: Cumulative Head Impact Exposure Predicts Later-Life Depression, Apathy, Executive Dysfunction, and Cognitive Impairment in Former High School and College Football Players. Journal of Neurotrauma 34:328-340, 2017

74
16. National Federation of State High School Associations: Recommendations and Guidlines for Minimizing Head Impact Exposure and Concussion Risk in Football, in NFHS Concussion Summit Task Force, 2014
17. Nicholas A. Vavalle, Matthew L. Davis, Joel D. Stitzel, Gayzik FS: Quantitative Validation of a Human Body Finite Element Model Using Rigid Body Impacts. Annals of Biomedical Engineering 43:2163-2174, 2015
18. NOCSAE: Standard Performance Specification for Newly Manufactured Football Helmets, in: National Operating Committee on Standards for Athletic Equipment, 2011
19. Rowson S, Duma SM: Development of the STAR Evaluation System for Football Helmets: Integrating Player Head Impact Exposure and Risk of Concussion. Ann Biomed Eng 39:2130-2140, 2011
20. Rugby A: Tacklytics, in, 2018 21. Scholars PWL: Limited Contact in Practice Rule, in, 2012, Vol 2018 22. Srinidhi Bellamkonda, Samantha J. Woodward, Eamon Campolettano, Ryan Gellner,
Mireille E. Kelley, Derek A. Jones, et al: Head Impact Exposure in Practices Correlates with Exposure in Games for Youth Football Players. In Revision - Journal of Applied Biomechanics, 2018
23. Urban JE, Davenport EM, Golman AJ, Maldjian JA, Whitlow CT, Powers AK, et al: Head Impact Exposure in Youth Football: High School Ages 14 to 18 Years and Cumulative Impact Analysis. Ann Biomed Eng, 2013
24. USA Football: Heads Up Football, in, 2017, Vol 2017 25. Young TJ, Daniel RW, Rowson S, Duma SM: Head Impact Exposure in Youth Football:
Elementary School Ages 7-8 Years and the Effect of Returning Players. Clin J Sport Med, 2013

75
PUBLICATION PLANS
Chapter Title Journal Ch. 1 Are Specific Players More Likely to be
Involved in High Magnitude Head Impacts in Youth Football?
Submitted for review to Journal of Neurosurgery, Pediatrics
Ch. 2 Association Between Tackling Technique
and Head Acceleration Magnitude in Youth Football Players
Accepted for presentation at the 2018 Rocky Mountain Bioengineering Symposium, to be published in Biomedical Science Instrumentation
Ch. 3 Does Tackling Form Affect Head
Acceleration in Youth Football Players? Submitted for review to Journal of Neurosurgery, Pediatrics
Ch. 4 Method for Determining the Structural
Response of Helmet Shells During Dynamic Loading
Accepted for presentation at the 2018 Rocky Mountain Bioengineering Symposium, to be published in Biomedical Science Instrumentation

76
APPENDIX A
Using an example contingency table (Table A1), the formula for K is presented in
Equations 1 through 1.4. Total percent agreement, though uncorrected for chance agreement, gives
a summary of the amount of times raters agree overall (Equation 2). K is influenced by skew in
rate of occurrence, which some believe is warranted.8 However, AC1 was developed as a better
summary metric for use when rates of occurrence are high or low.16 This summary metric agrees
well with K when rate of occurrence is equal (A = D), but differs purposely otherwise (Equations
3 – 3.2). Finally, arguments for using K alongside other metrics have advocated the reporting of
proportion of positive and negative agreements (Ppos and Pneg).8 These statistics reveal the source
of disagreement (if present) better than a single summary statistic by reporting the rate of
agreement in positive (or negative) occurrence as a proportion of all raters’ reporting of positive
(negative) occurrence. Equations 4 and 5 show how to calculate Ppos and Pneg.
Table A1: Example of contingency table for two independent raters. Letters A-D represent
number of times raters agreed or disagreed and are used in the following equations to
demonstrate each statistical reliability measure presented.
Rater 1
Pass Fail
Rater 2 Pass A B
Fail C D
𝐾𝐾 = 𝑃𝑃𝑜𝑜−𝑃𝑃𝑒𝑒1−𝑃𝑃𝑒𝑒, where (1)
𝑃𝑃𝑜𝑜 = 𝐴𝐴+𝐷𝐷𝐴𝐴+𝐵𝐵+𝐶𝐶+𝐷𝐷
(1.1)

77
𝑃𝑃𝑒𝑒 = 𝑃𝑃𝑦𝑦𝑒𝑒𝑦𝑦 + 𝑃𝑃𝑛𝑛𝑜𝑜 (1.2)
𝑃𝑃𝑦𝑦𝑒𝑒𝑦𝑦 = 𝐴𝐴+𝐵𝐵𝐴𝐴+𝐵𝐵+𝐶𝐶+𝐷𝐷
∗ 𝐴𝐴+𝐶𝐶𝐴𝐴+𝐵𝐵+𝐶𝐶+𝐷𝐷
(1.3)
𝑃𝑃𝑛𝑛𝑜𝑜 = 𝐶𝐶+𝐷𝐷𝐴𝐴+𝐵𝐵+𝐶𝐶+𝐷𝐷
∗ 𝐵𝐵+𝐷𝐷𝐴𝐴+𝐵𝐵+𝐶𝐶+𝐷𝐷
(1.4)
𝑇𝑇𝑃𝑃𝑇𝑇 = 𝐴𝐴+𝐷𝐷𝐴𝐴+𝐵𝐵+𝐶𝐶+𝐷𝐷 ∗100% (2)
𝑇𝑇𝐴𝐴1 = 𝑃𝑃𝑜𝑜−𝑃𝑃𝑒𝑒∗
1−𝑃𝑃𝑒𝑒∗ , where (3)
𝑃𝑃𝑒𝑒∗ = 2 ∗ Π ∗ (1 − Π) (3.1)
Π = 12∗ ( 𝐴𝐴+𝐶𝐶
𝐴𝐴+𝐵𝐵+𝐶𝐶+𝐷𝐷+ 𝐴𝐴+𝐵𝐵
𝐴𝐴+𝐵𝐵+𝐶𝐶+𝐷𝐷) (3.2)
𝑃𝑃𝑝𝑝𝑜𝑜𝑦𝑦 = 2∗𝐴𝐴2∗𝐴𝐴+𝐵𝐵+𝐶𝐶 (4)
𝑃𝑃𝑛𝑛𝑒𝑒𝑛𝑛 = 2∗𝐷𝐷2∗𝐷𝐷+𝐵𝐵+𝐶𝐶 (5)
Recommended