© IESE Business School - Barcelona - 2011 Page 1
IESE Family-Responsible environment (FRe) Index for the World Benchmark with the Philippines
Prof. Nuria Chinchilla Prof. Mireia Las Heras
© IESE Business School - Barcelona - 2011 Page 2© IESE Business School - Barcelona - 2011
In collaboration with:
Work and Family Foundation, Canada
© IESE Business School - Barcelona - 2011 Page 3© IESE Business School - Barcelona - 2011
The Corporate Sponsors of the International Center for Work and Family
© IESE Business School - Barcelona - 2011 Page 4© IESE Business School - Barcelona - 2011
What is a family-responsible company?
A “family-responsible company” is a company that in an explicit way develops programs, policies and practices that facilitate work-family conciliation (for example, flexibility, leave,
policies regarding services for dependents, professional and personal support or counseling, social benefits).
© IESE Business School - Barcelona - 2011 Page 5© IESE Business School - Barcelona - 2011
Principal Objetive
IFREI stands for IESE FAMILY-RESPONSIBLE EMPLOYER INDEX. It aims to show the impact of family-responsible policies, practices and leadership of a company on employee health,
commitment to loyalty, intention to leave to the company, and satisfaction.
© IESE Business School - Barcelona - 2011 Page 6© IESE Business School - Barcelona - 2011
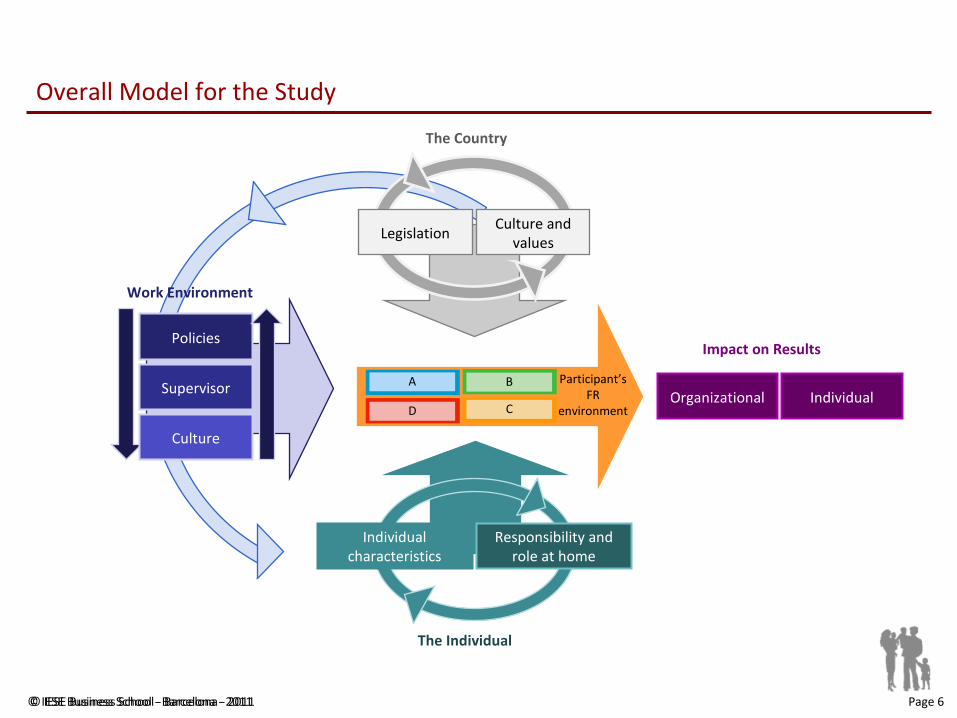
Overall Model for the Study
The Country
LegislationCulture and
values
The Individual
Individual characteristics
Responsibility and role at home
Policies
Work Environment
Supervisor
Culture
Organizational Individual
Impact on Results
Participant’s FR
environment
A
D
B
C
© IESE Business School - Barcelona - 2011 Page 7© IESE Business School - Barcelona - 2011
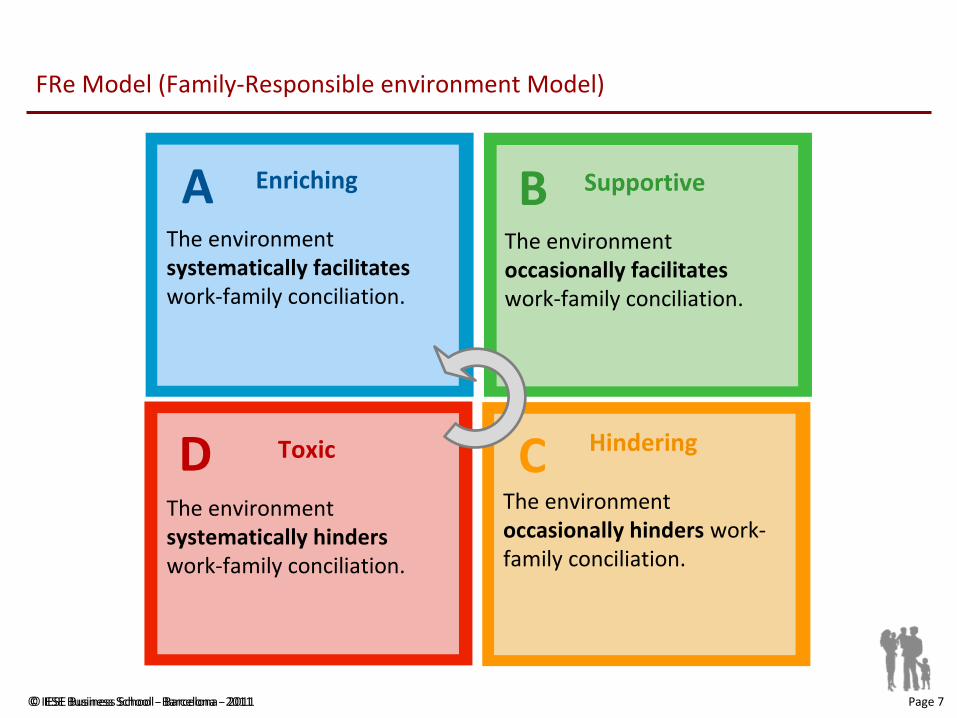
A Enriching
The environment systematically facilitates work-family conciliation.
Supportive
The environment occasionally facilitates work-family conciliation.
Toxic
The environment systematically hinders work-family conciliation.
D
B
C Hindering
The environment occasionally hinders work-family conciliation.
FRe Model (Family-Responsible environment Model)

© IESE Business School - Barcelona - 2011 Page 8© IESE Business School - Barcelona - 2011
IFREI Study Framework
A. FR Policies
1. Flexibility with Time and Space2. Family Support3. Information4. Maternity/Paternity Leave
C. FR Culture
B. FR Supervisor
1. Emotional Support2. Instrumental Support3. Policy Management4. Role Model
Impact on Results
1. Intention to Leave
2. Loyalty
3. Commitment
4. Perceived Organizational Support
Organizational Individual
FR Environment
Individual Characteristics
A. Coping Strategies
B. Integration/ Segmentation Preferences
C. Job Preferences
D. Transition Styles
1. Overall Health
2. Family ↔ Work Enrichment
3. Satisfaction with Work/Family Balance
© IESE Business School - Barcelona - 2011 Page 9© IESE Business School - Barcelona - 2011
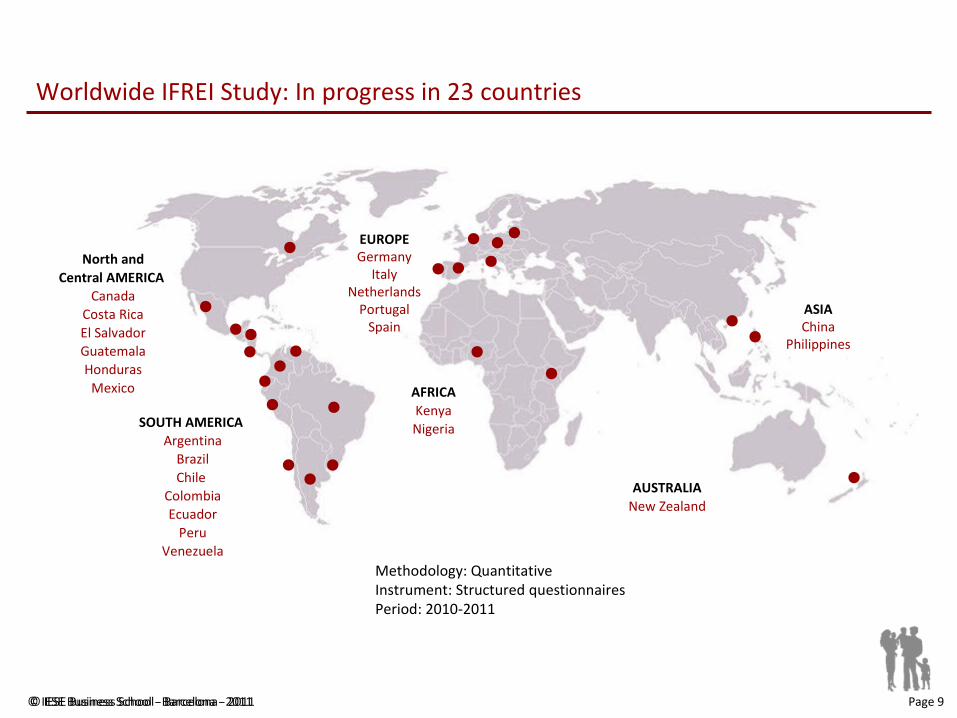
Worldwide IFREI Study: In progress in 23 countries
SOUTH AMERICA Argentina
BrazilChile
ColombiaEcuador
PeruVenezuela
North and Central AMERICA
CanadaCosta RicaEl SalvadorGuatemalaHonduras
Mexico AFRICAKenyaNigeria
ASIAChina
Philippines
EUROPEGermany
ItalyNetherlands
PortugalSpain
AUSTRALIANew Zealand
Methodology: QuantitativeInstrument: Structured questionnaires Period: 2010-2011
© IESE Business School - Barcelona - 2011 Page 10© IESE Business School - Barcelona - 2011
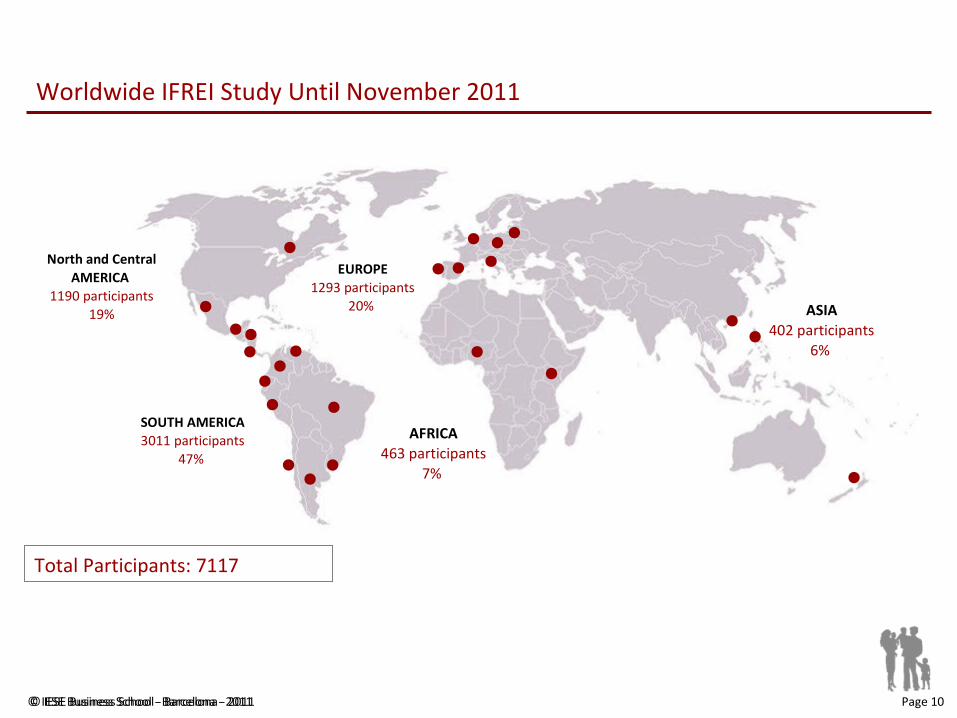
Worldwide IFREI Study Until November 2011
SOUTH AMERICA3011 participants
47%
North and Central AMERICA
1190 participants19%
AFRICA463 participants
7%
ASIA402 participants
6%
EUROPE1293 participants
20%
Total Participants: 7117
© IESE Business School - Barcelona - 2011 Page 11© IESE Business School - Barcelona - 2011
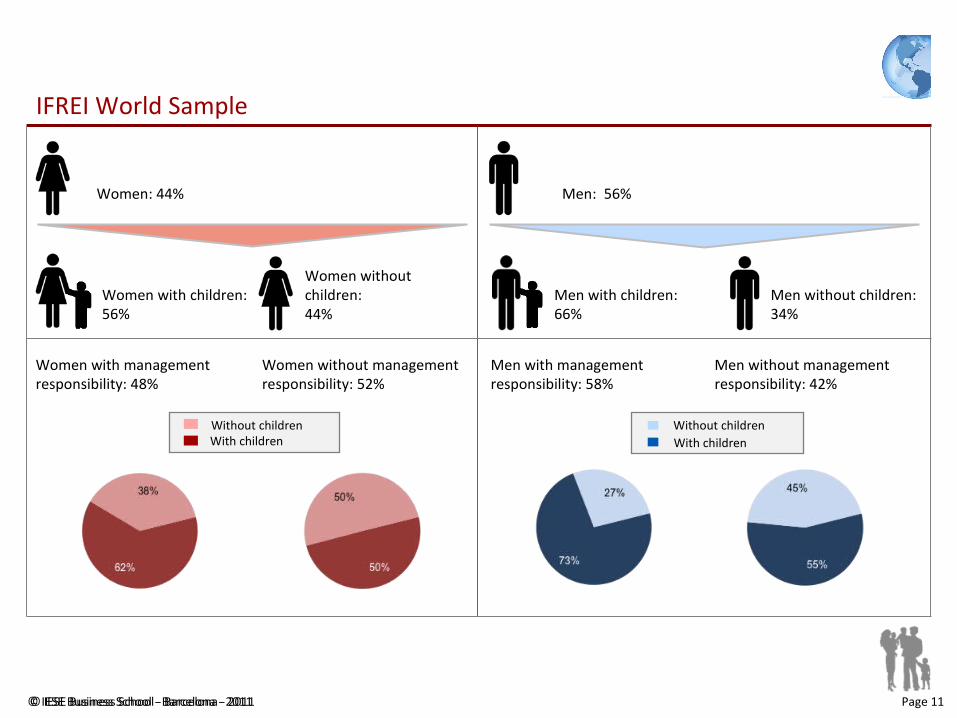
IFREI World Sample
Women: 44%
Women with children: 56%
Women without children: 44%
Men: 56%
Men with children: 66%
Men without children: 34%
Women without management responsibility: 52%
Men with management responsibility: 58%
Men without management responsibility: 42%
Women with management responsibility: 48%
With childrenWithout children
With childrenWithout children
© IESE Business School - Barcelona - 2011 Page 12© IESE Business School - Barcelona - 2011
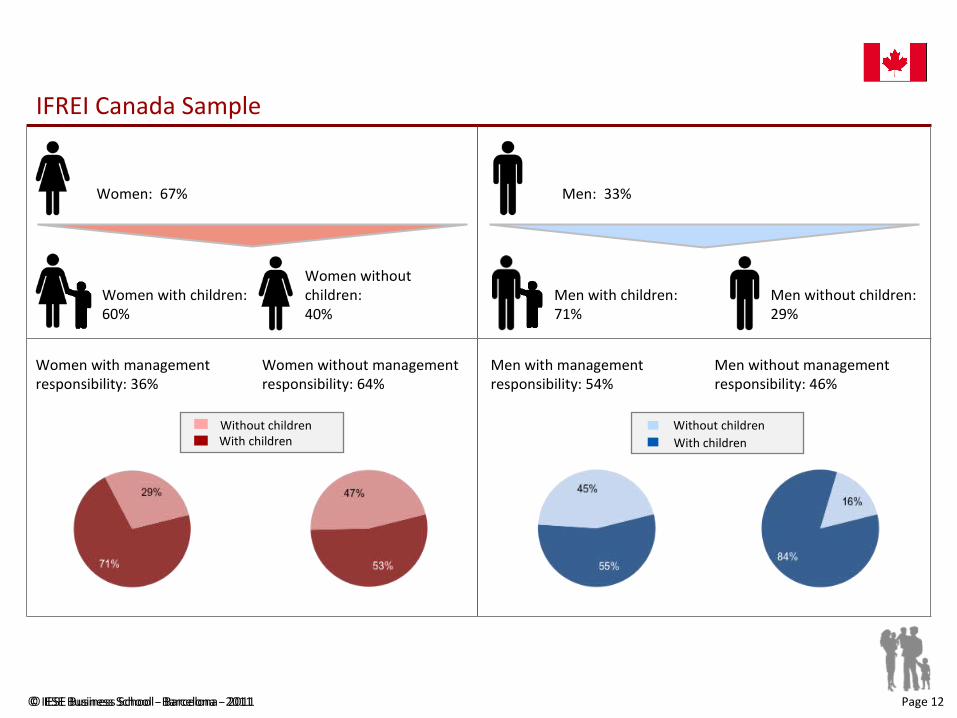
IFREI Canada Sample
With childrenWithout children
With childrenWithout children
Women: 67%
Women with children: 60%
Women without children: 40%
Men: 33%
Men with children: 71%
Men without children: 29%
Women without management responsibility: 64%
Men with management responsibility: 54%
Men without management responsibility: 46%
Women with management responsibility: 36%
© IESE Business School - Barcelona - 2011 Page 13© IESE Business School - Barcelona - 2011
A Enriching Supportive
ToxicD
B
C Hindering
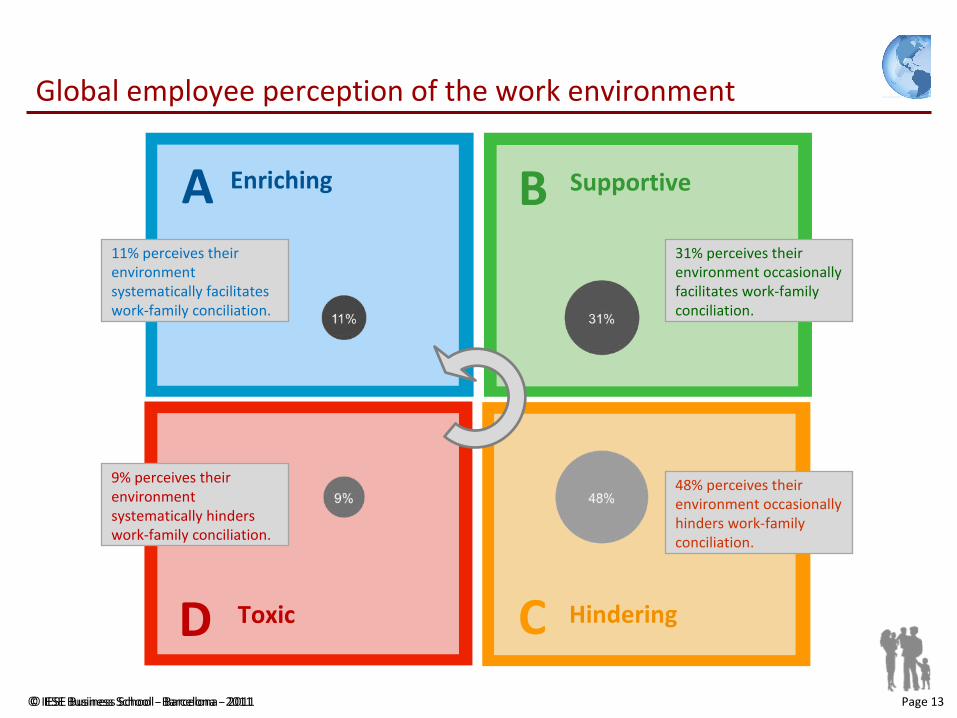
Global employee perception of the work environment
31% perceives their environment occasionally facilitates work-family conciliation.
48% perceives their environment occasionally hinders work-family conciliation.
11% perceives their environment systematically facilitates work-family conciliation.
9% perceives their environment systematically hinders work-family conciliation.
© IESE Business School - Barcelona - 2011 Page 14© IESE Business School - Barcelona - 2011
A Enriching Supportive
ToxicD
B
C Hindering
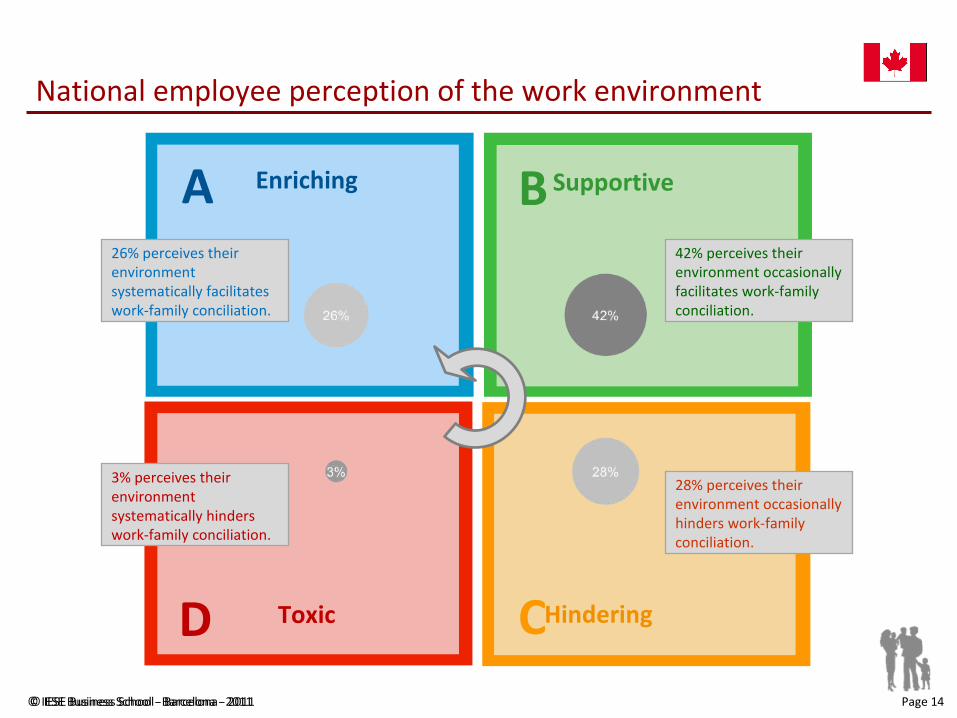
National employee perception of the work environment
42% perceives their environment occasionally facilitates work-family conciliation.
28% perceives their environment occasionally hinders work-family conciliation.
26% perceives their environment systematically facilitates work-family conciliation.
3% perceives their environment systematically hinders work-family conciliation.
© IESE Business School - Barcelona - 2011 Page 15© IESE Business School - Barcelona - 2011
Family-Responsible Environment: Policies
© IESE Business School - Barcelona - 2011 Page 16© IESE Business School - Barcelona - 2011
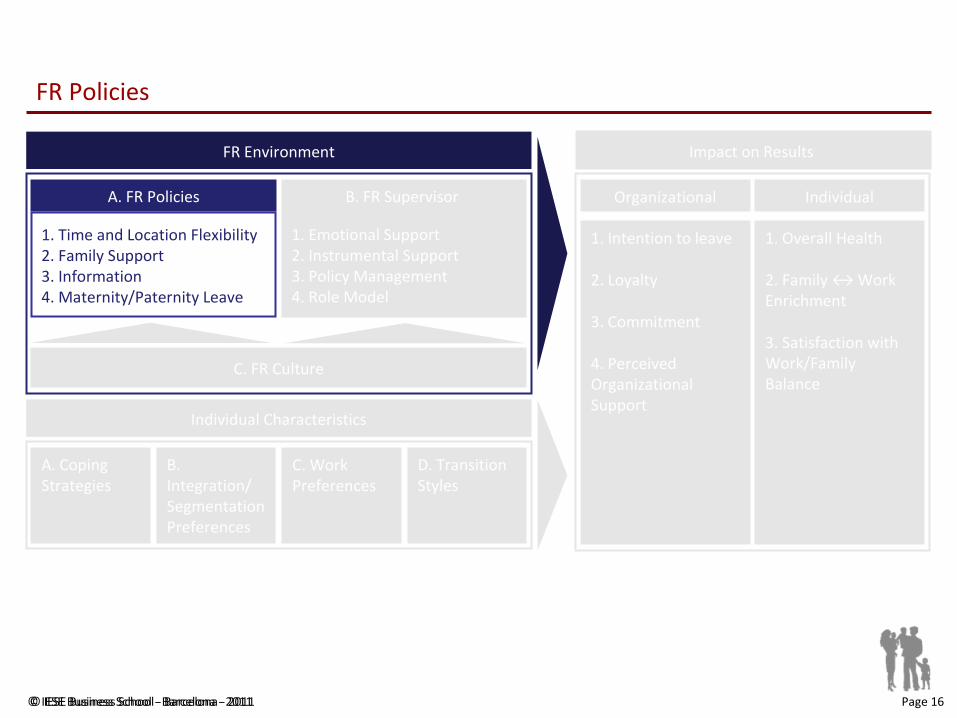
FR Policies
A. FR Policies
1. Time and Location Flexibility2. Family Support3. Information4. Maternity/Paternity Leave
C. FR Culture
B. FR Supervisor
Impact on Results
1. Intention to leave
2. Loyalty
3. Commitment
4. Perceived Organizational Support
Organizational Individual
FR Environment
1. Overall Health
2. Family ↔ Work Enrichment
3. Satisfaction with Work/Family Balance
Individual Characteristics
A. Coping Strategies
B. Integration/ Segmentation Preferences
C. Work Preferences
D. Transition Styles
1. Emotional Support2. Instrumental Support3. Policy Management4. Role Model
© IESE Business School - Barcelona - 2011 Page 17© IESE Business School - Barcelona - 2011
FR Policies
Family-responsible policies are the practices formally established within a company that support employee work-life balance by providing flexibility in time and space. They also include those practices that provide professional support, services and family-friendly benefits that go beyond financial remuneration.
© IESE Business School - Barcelona - 2011 Page 18© IESE Business School - Barcelona - 2011
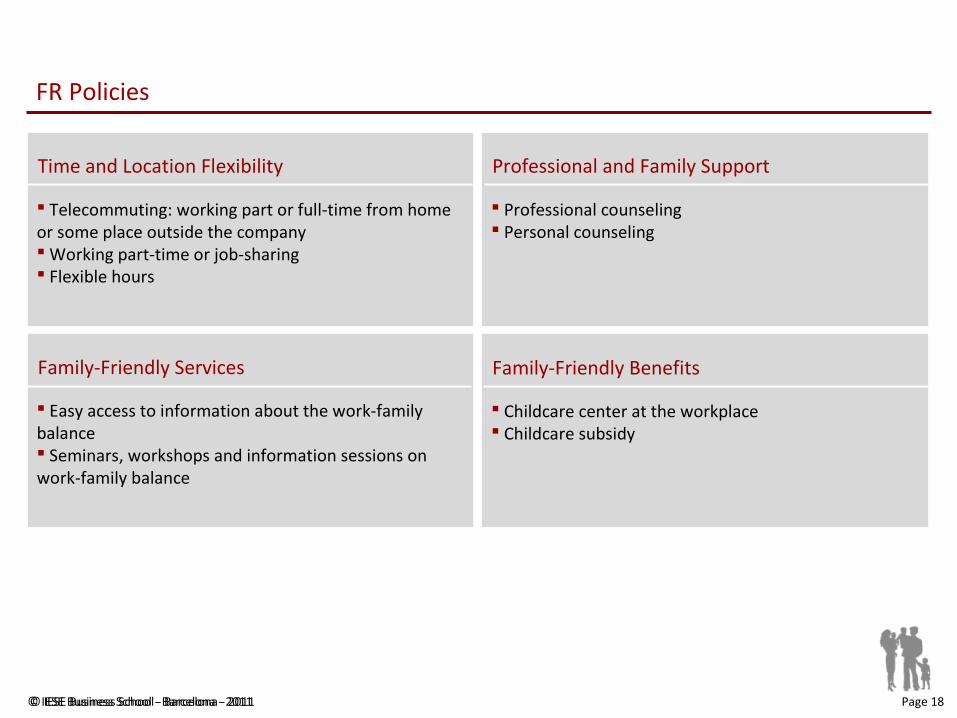
FR Policies
Telecommuting: working part or full-time from home or some place outside the company Working part-time or job-sharing Flexible hours
Time and Location Flexibility
Professional counseling Personal counseling
Professional and Family Support
Easy access to information about the work-family balance Seminars, workshops and information sessions on work-family balance
Family-Friendly Services
Childcare center at the workplace Childcare subsidy
Family-Friendly Benefits

© IESE Business School - Barcelona - 2011 Page 19© IESE Business School - Barcelona - 2011
FR Policies
Positive Impact of Family-Responsible
Policies
Individuals
Company
Society
© IESE Business School - Barcelona - 2011 Page 20© IESE Business School - Barcelona - 2011
FR Policies: Impact on Individuals
FR policies have a positive impact on individuals since they allow a person to organize their work hours such that time spent working does not interfere or hamper their family responsibilities. In addition, FR policies tend to reduce commute time, and thus, improve the employee’s performance.

© IESE Business School - Barcelona - 2011 Page 21© IESE Business School - Barcelona - 2011
FR Policies: Impact on Companies
FR policies have a positive impact on companies because they can facilitate longer customer service hours, reduce expenses due to absenteeism, and increase the involvement of individuals at work.Furthermore, FR policies are essentially necessary and positive for industries or sectors that experience constant and rapid product or service changes, where the added value of the employees is greater.
© IESE Business School - Barcelona - 2011 Page 22© IESE Business School - Barcelona - 2011
FR Policies: Impact on Society
FR policies have a direct impact on society by facilitating the reduction of environmental pollution due to reduced employee commute time. They also decrease costs in health services since FR policies lessen stress and other related illnesses.
In addition, FR policies have a positive impact on the country's educational level as parents can be more involved in their child’s education, resulting in better academic performance, as well as reduced addiction and crime rates.
© IESE Business School - Barcelona - 2011 Page 23© IESE Business School - Barcelona - 2011
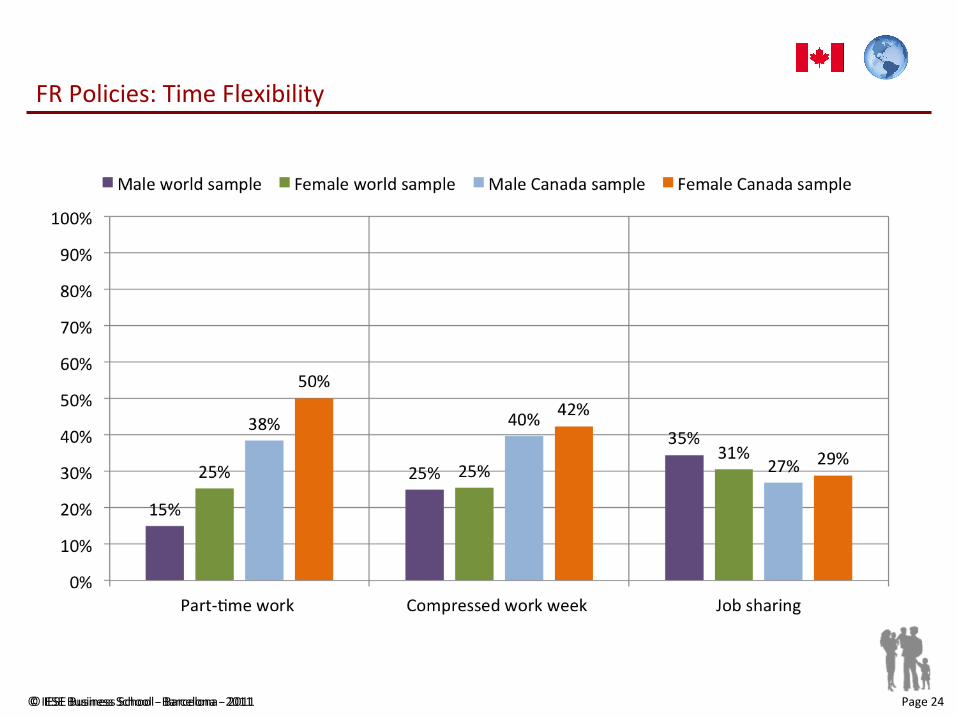
FR Policies: Time Flexibility
The graph “FR Policies: Time Flexibility” refers to the following questions in the questionnaire:
Please indicate if you have access to these policies (Yes / No):
Part-time work (reduced working hours in exchange for a lower salary) Compressed week hours (i.e. half day free in exchange for working longer hours the rest of the week ) Job-sharing (i.e. when the duties of a full-time position are shared by two or more employees)
© IESE Business School - Barcelona - 2011 Page 24© IESE Business School - Barcelona - 2011
FR Policies: Time Flexibility
© IESE Business School - Barcelona - 2011 Page 25© IESE Business School - Barcelona - 2011
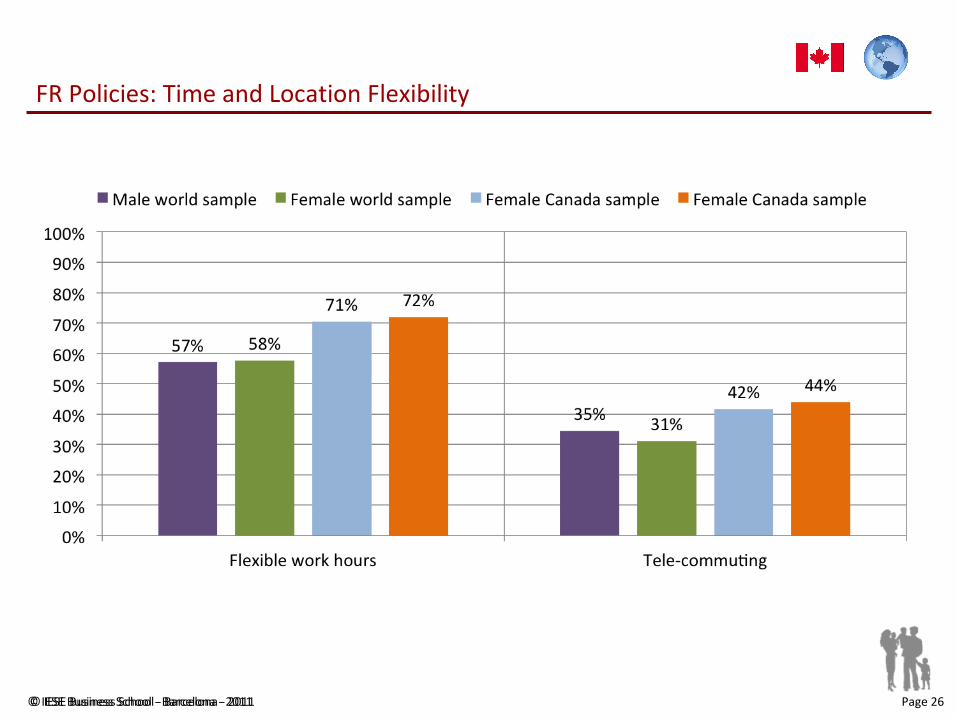
FR Policies: Time and Location Flexibility
The graph “FR Policies: Time and Location Flexibility” refers to the following questions in the questionnaire:
Please indicate if you have access to these policies (Yes / No):
Flexible work schedule Tele-commuting (i.e. allowing employees to work from an alternative location, such as a home office)
© IESE Business School - Barcelona - 2011 Page 26© IESE Business School - Barcelona - 2011
FR Policies: Time and Location Flexibility
© IESE Business School - Barcelona - 2011 Page 27© IESE Business School - Barcelona - 2011
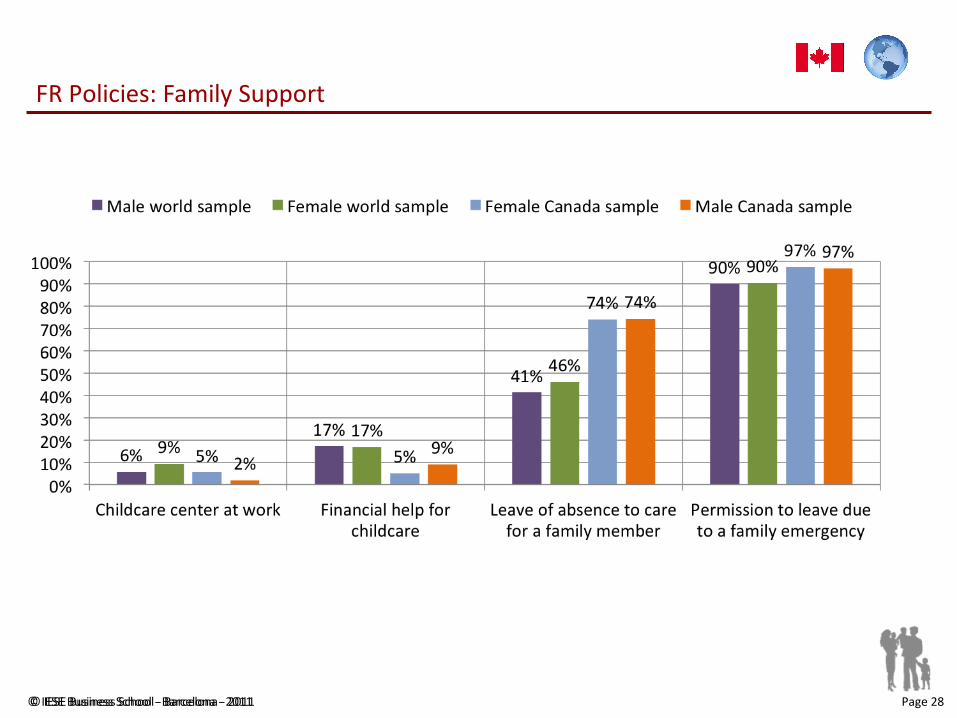
FR Policies: Family Support
The graph “FR Policies: Family Support” refers to the following questions in the questionnaire:
Please indicate if you have access to these policies (Yes / No):
Childcare center at the workplace Financial help for the care of a child or a dependent Leave of absence to take care of a family member
© IESE Business School - Barcelona - 2011 Page 28© IESE Business School - Barcelona - 2011
FR Policies: Family Support
© IESE Business School - Barcelona - 2011 Page 29© IESE Business School - Barcelona - 2011
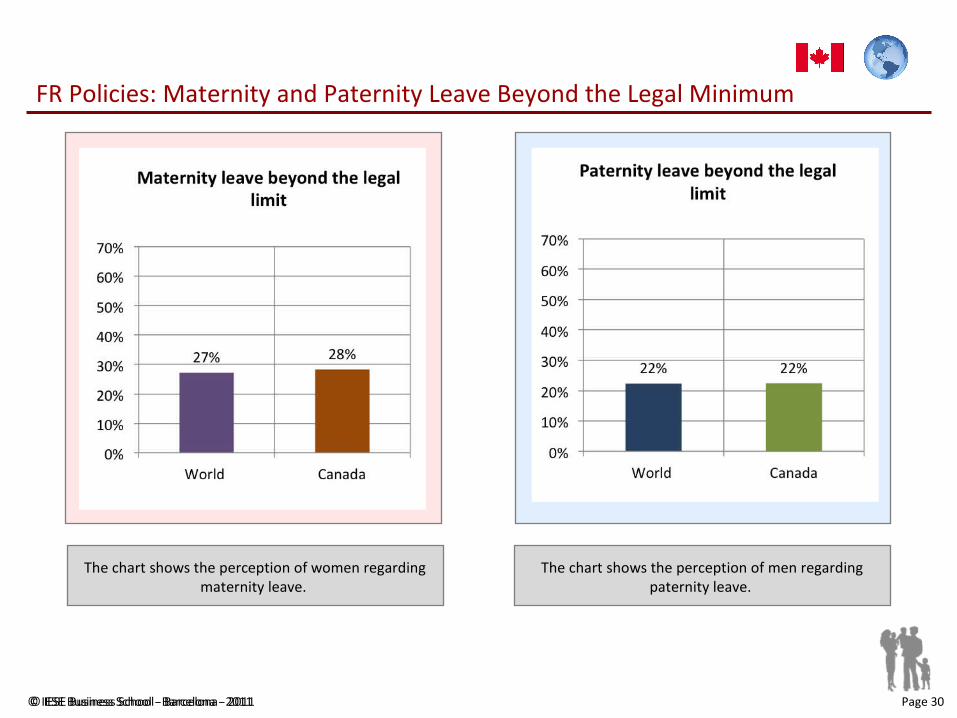
FR Policies: Maternity and Paternity Leave Beyond the Legal Minimum
The graph “FR Policies: Maternity and Paternity Leave Beyond the Legal Minimum” refers to the following questions in the questionnaire:
Please indicate if you have access to these policies (Yes / No):
Maternity leave beyond the legal minimum Paternity leave beyond the legal minimum
© IESE Business School - Barcelona - 2011 Page 30© IESE Business School - Barcelona - 2011
FR Policies: Maternity and Paternity Leave Beyond the Legal Minimum
The chart shows the perception of women regarding maternity leave.
The chart shows the perception of men regarding paternity leave.
© IESE Business School - Barcelona - 2011 Page 31© IESE Business School - Barcelona - 2011
FR Policies: Information
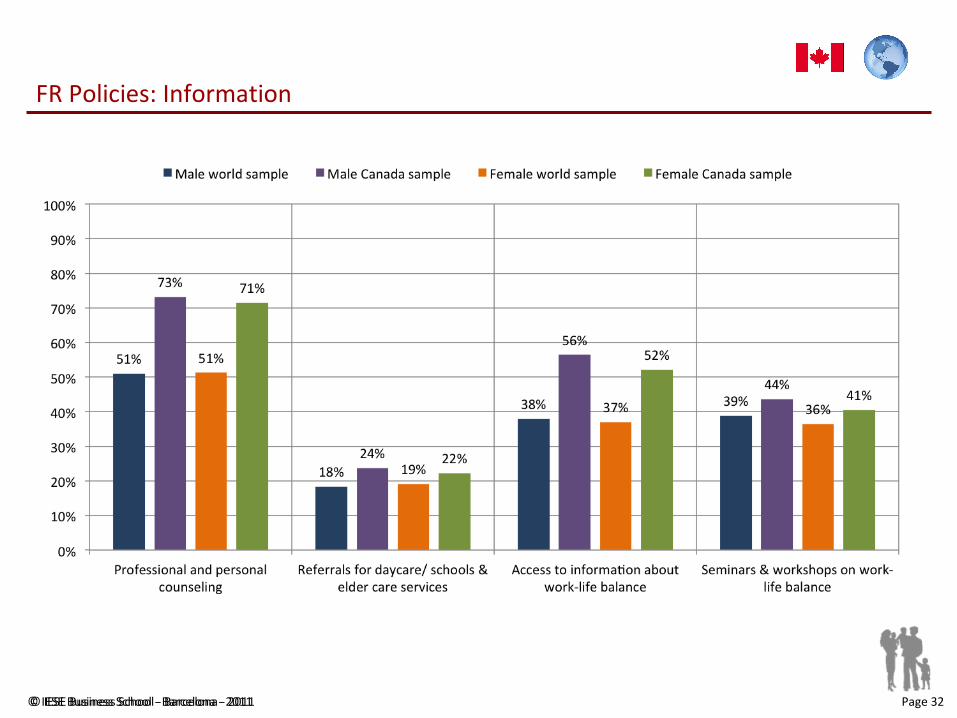
The graph “FR Policies: Information” refers to the following questions in the questionnaire:
Please indicate if you have access to these policies (Yes / No):
Professional and personal counseling Referrals for daycare and schools or elder care and services Easy access to information about work-life balance benefits available to you through your company Seminars, workshops or information sessions on work/life balance issues
© IESE Business School - Barcelona - 2011 Page 32© IESE Business School - Barcelona - 2011
FR Policies: Information
© IESE Business School - Barcelona - 2011 Page 33© IESE Business School - Barcelona - 2011
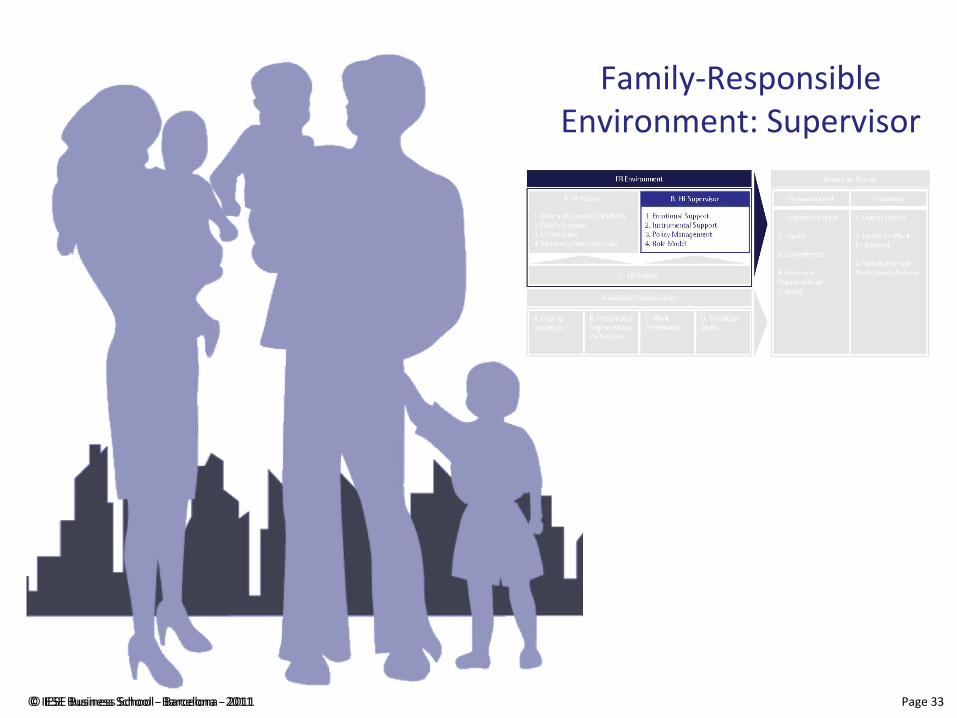
Family-Responsible Environment: Supervisor
© IESE Business School - Barcelona - 2011 Page 34© IESE Business School - Barcelona - 2011
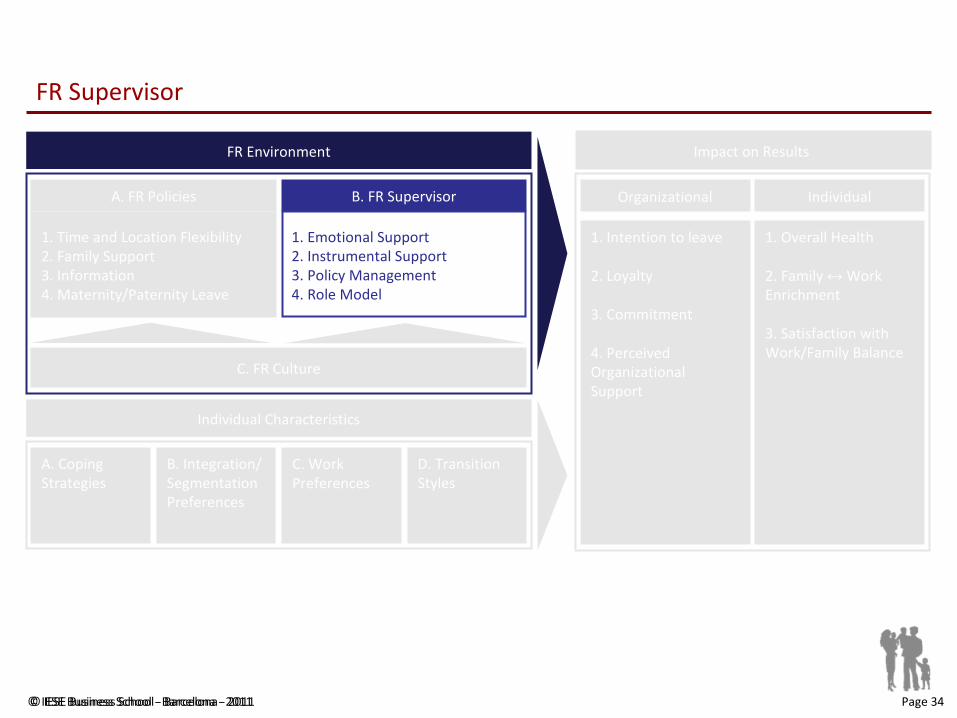
FR Supervisor
Impact on Results
1. Intention to leave
2. Loyalty
3. Commitment
4. Perceived Organizational Support
Organizational Individual
1. Overall Health
2. Family ↔ Work Enrichment
3. Satisfaction with Work/Family Balance
Individual Characteristics
A. Coping Strategies
B. Integration/ Segmentation Preferences
C. Work Preferences
D. Transition Styles
B. FR Supervisor
1. Emotional Support2. Instrumental Support3. Policy Management4. Role Model
FR Environment
C. FR Culture
A. FR Policies
1. Time and Location Flexibility2. Family Support3. Information4. Maternity/Paternity Leave
© IESE Business School - Barcelona - 2011 Page 35© IESE Business School - Barcelona - 2011
FR Supervisor
A family-responsible supervisor is one who responds to the family needs of his/her employees. Furthermore, he/she supports and facilitates work-family balance, promotes the use of family-responsible practices and is open and sensitive to these issues, while respecting personal freedom.
© IESE Business School - Barcelona - 2011 Page 36© IESE Business School - Barcelona - 2011
FR Supervisor: Supervisor’s Emotional Support
The graphs “FR Supervisor: Supervisor’s Emotional Support” refer to the following questions in the questionnaire:
Do you agree with the following statements? (1 = strongly disagree / 7 = strongly agree)
My supervisor is willing to listen to my problems in juggling work and non-work life My supervisor takes the time to learn about my personal needs My supervisor makes me feel comfortable talking to him or her about my conflicts between work and non-work My supervisor and I can talk effectively to solve conflicts between work and non-work issues

© IESE Business School - Barcelona - 2011 Page 37© IESE Business School - Barcelona - 2011
FR Supervisor: Supervisors Showing Excellent Emotional Support
© IESE Business School - Barcelona - 2011 Page 38© IESE Business School - Barcelona - 2011
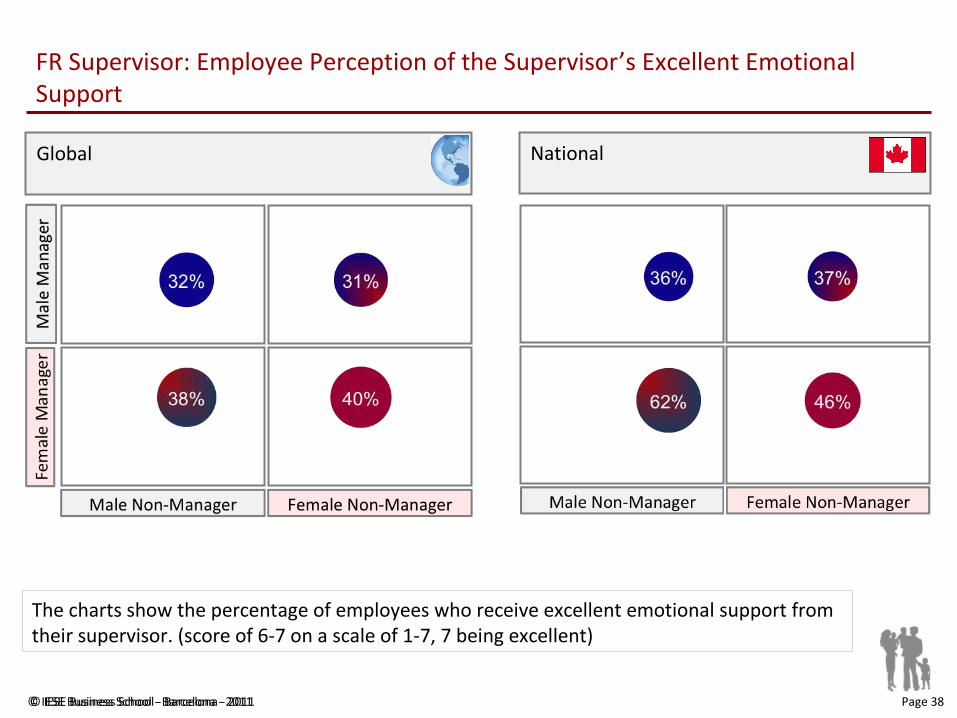
FR Supervisor: Employee Perception of the Supervisor’s Excellent Emotional Support
The charts show the percentage of employees who receive excellent emotional support from their supervisor. (score of 6-7 on a scale of 1-7, 7 being excellent)
Global National
© IESE Business School - Barcelona - 2011 Page 39© IESE Business School - Barcelona - 2011
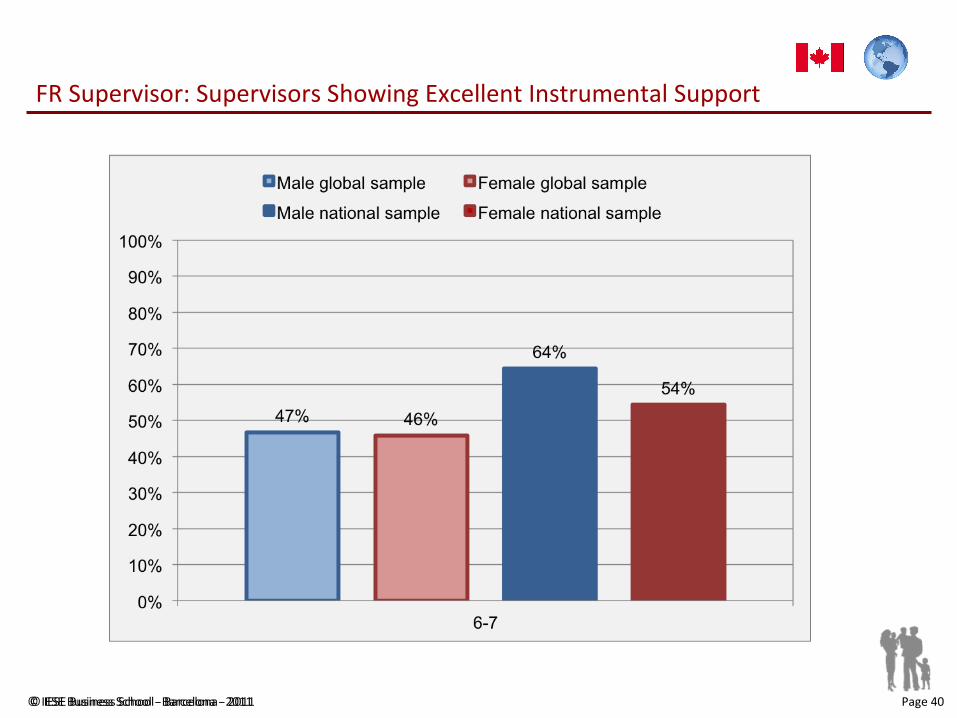
FR Supervisor: Supervisor’s Instrumental Support
The graphs “FR Supervisor: Supervisor’s Instrumental Support” refer to the following question in the questionnaire:
Do you agree with the following statements? (1 = strongly disagree / 7 = strongly agree)
I can depend on my supervisor to help me with scheduling conflicts between work and non-work issues
© IESE Business School - Barcelona - 2011 Page 40© IESE Business School - Barcelona - 2011
FR Supervisor: Supervisors Showing Excellent Instrumental Support
© IESE Business School - Barcelona - 2011 Page 41© IESE Business School - Barcelona - 2011
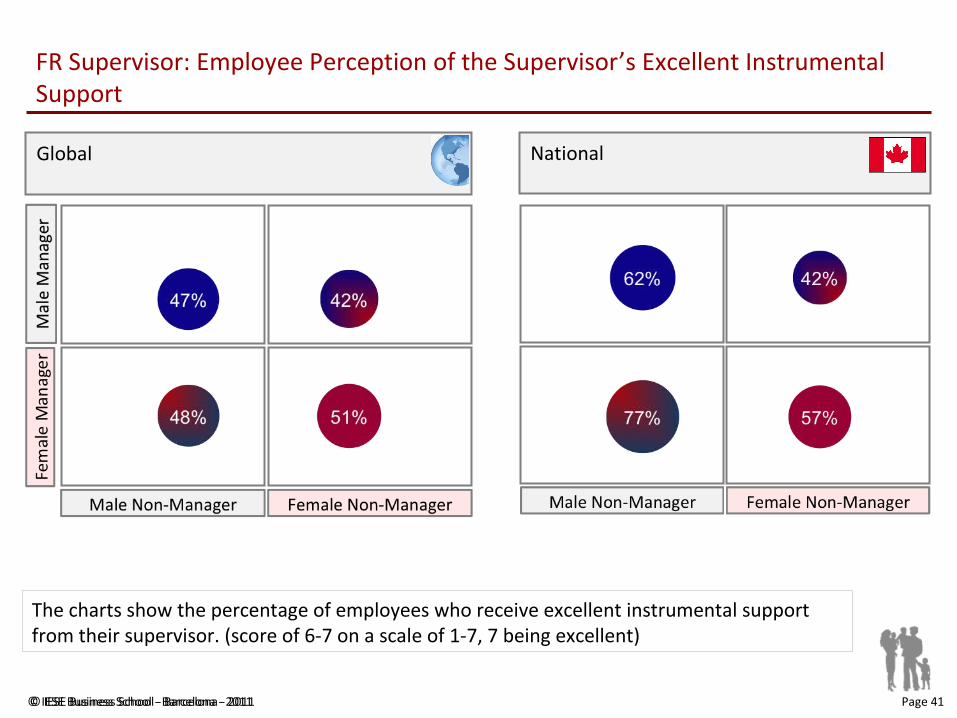
FR Supervisor: Employee Perception of the Supervisor’s Excellent Instrumental Support
The charts show the percentage of employees who receive excellent instrumental support from their supervisor. (score of 6-7 on a scale of 1-7, 7 being excellent)
Global National
© IESE Business School - Barcelona - 2011 Page 42© IESE Business School - Barcelona - 2011
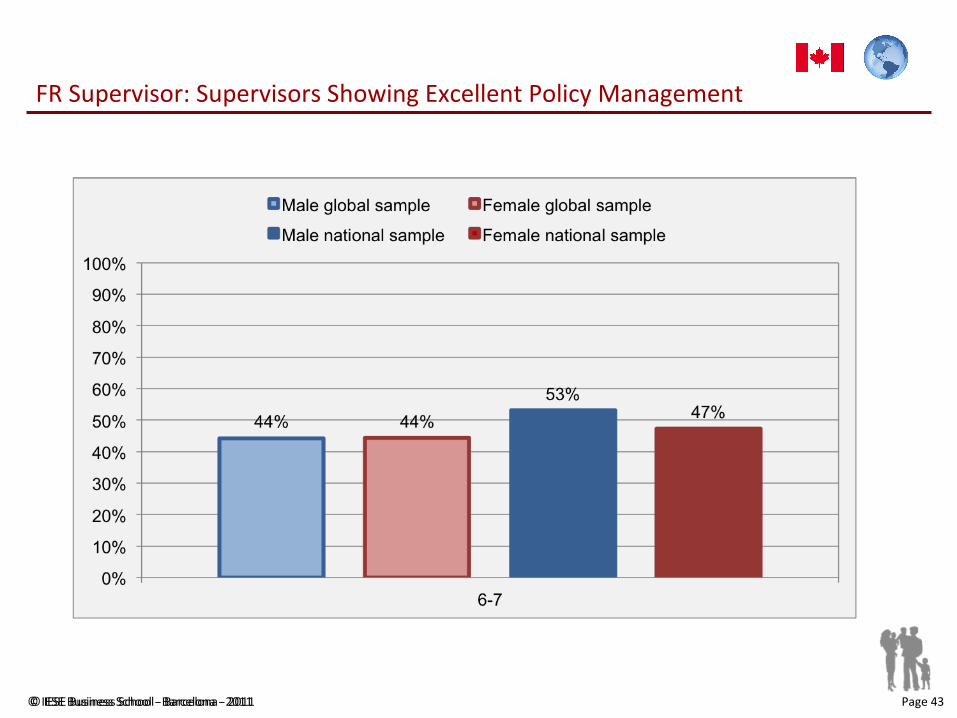
FR Supervisor: Supervisor’s Policy Management
The graphs “FR Supervisor: Supervisor’s Policy Management” refer to the following question in the questionnaire:
Do you agree with the following statements? (1 = strongly disagree / 7 = strongly agree)
My supervisor asks for suggestions to make it easier for employees to balance work and non-work demands
© IESE Business School - Barcelona - 2011 Page 43© IESE Business School - Barcelona - 2011
FR Supervisor: Supervisors Showing Excellent Policy Management
© IESE Business School - Barcelona - 2011 Page 44© IESE Business School - Barcelona - 2011
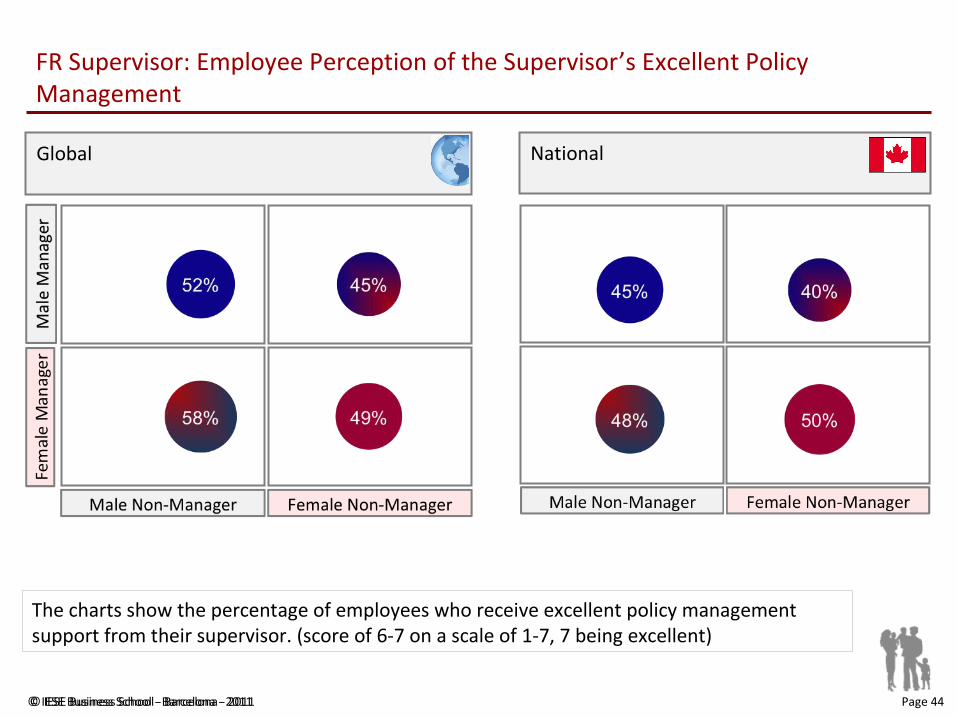
FR Supervisor: Employee Perception of the Supervisor’s Excellent Policy Management
The charts show the percentage of employees who receive excellent policy management support from their supervisor. (score of 6-7 on a scale of 1-7, 7 being excellent)
Global National
© IESE Business School - Barcelona - 2011 Page 45© IESE Business School - Barcelona - 2011
FR Supervisor:Supervisors as Role Models
The graphs “FR Supervisor: Supervisors as Role Models” refer to the following question in the questionnaire:
Do you agree with the following statement? (1 = strongly disagree / 7 = strongly agree)
My supervisor is a good role model for work and non-work balance

© IESE Business School - Barcelona - 2011 Page 46© IESE Business School - Barcelona - 2011
FR Supervisor: Supervisors Who are Perceived as Excellent Role Models
© IESE Business School - Barcelona - 2011 Page 47© IESE Business School - Barcelona - 2011
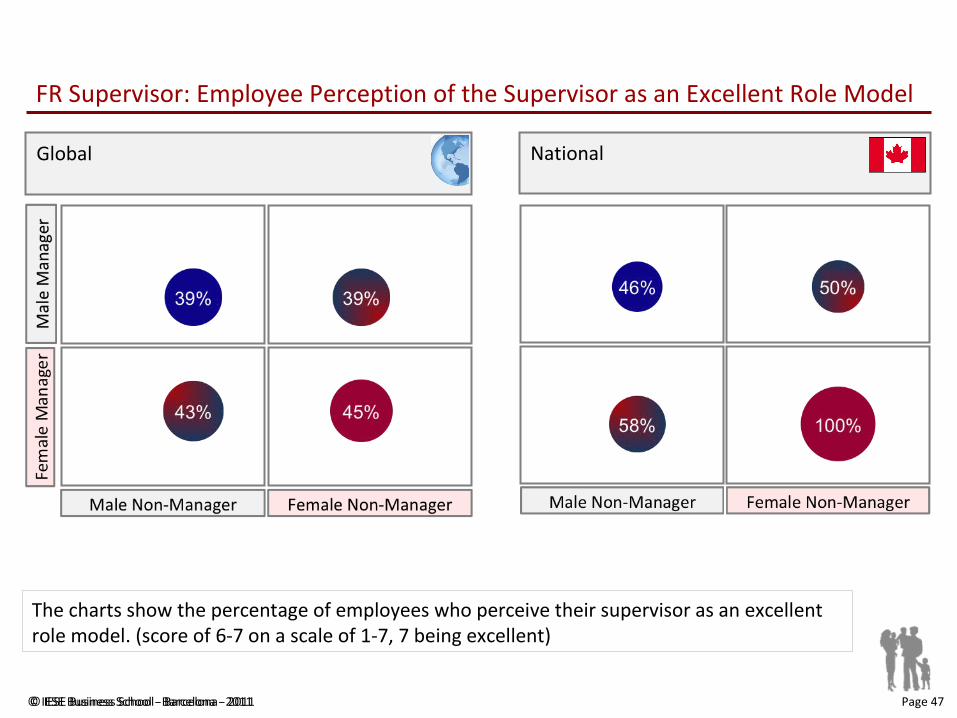
FR Supervisor: Employee Perception of the Supervisor as an Excellent Role Model
The charts show the percentage of employees who perceive their supervisor as an excellent role model. (score of 6-7 on a scale of 1-7, 7 being excellent)
Global National
© IESE Business School - Barcelona - 2011 Page 48© IESE Business School - Barcelona - 2011
Family-Responsible Environment: Organizational
Culture
A. FR Policies
1.Time and Location Flexibility2.Family Support3.Information4.Maternity/Paternity Leave
B. FR Supervisor
1.Emotional Support2.Instrumental Support3.Policy Management4.Role Model
Individual Characteristics
A. Coping Strategies
B. Integration/ Segmentation Preferences
C. Work Preferences
D. Transit ion Styles
C. FR Culture
FR Environment Impact on Results
1.Intention to Leave
2.Loyalty
3.Commitment
4.Perceived Organizational Support
Organizational Individual
1.Overall Health
2.Family ↔ Work Enrichment
3.Satisfaction with Work/Family Balance
© IESE Business School - Barcelona - 2011 Page 49© IESE Business School - Barcelona - 2011
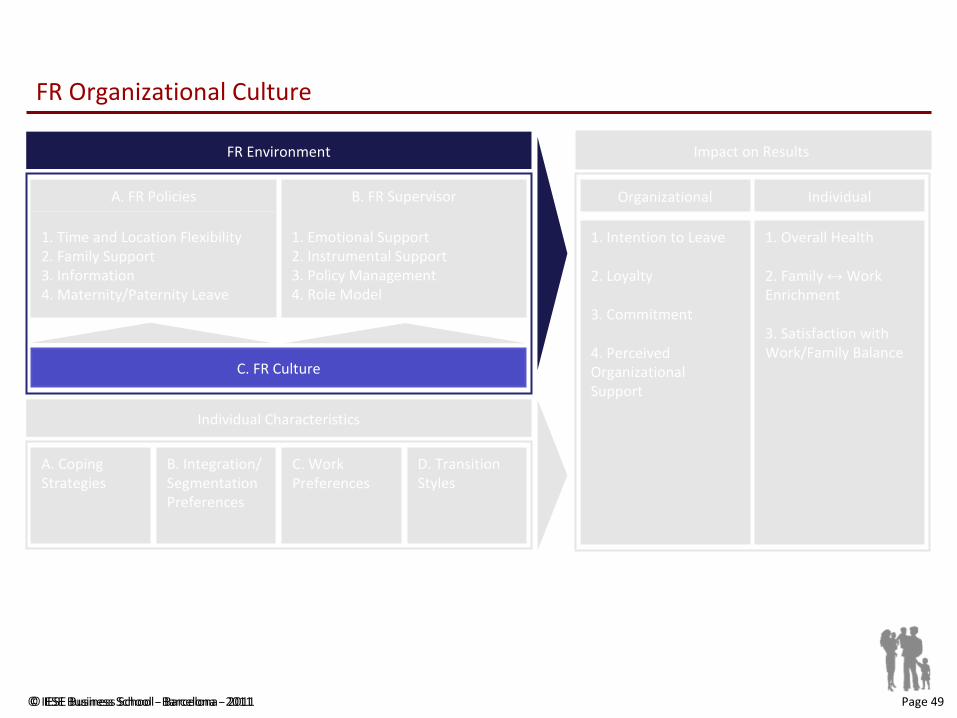
FR Organizational Culture
A. FR Policies
1. Time and Location Flexibility2. Family Support3. Information4. Maternity/Paternity Leave
B. FR Supervisor
1. Emotional Support2. Instrumental Support3. Policy Management4. Role Model
Individual Characteristics
A. Coping Strategies
B. Integration/ Segmentation Preferences
C. Work Preferences
D. Transition Styles
C. FR Culture
FR Environment Impact on Results
1. Intention to Leave
2. Loyalty
3. Commitment
4. Perceived Organizational Support
Organizational Individual
1. Overall Health
2. Family ↔ Work Enrichment
3. Satisfaction with Work/Family Balance
© IESE Business School - Barcelona - 2011 Page 50© IESE Business School - Barcelona - 2011
FR Organizational Culture
An FR organizational culture promotes work-life balance: People who use flexible policies are valued for their contribution to the company and not penalized for the use of flexible policies. A person’s workload is respected and it is not expected that people constantly place their work before their family.
© IESE Business School - Barcelona - 2011 Page 51© IESE Business School - Barcelona - 2011
FR Organizational Culture: Co-Workers Respect For Extended Maternity or Paternity Leave
The graph “FR Organizational Culture: Co-Workers Who Respect Extended Maternity or Paternity Leave” refers to the following questions in the questionnaire:
Do you agree with the following statements?(1 = strongly disagree / 7 = strongly agree)
Many employees are resentful when men in this organization take extended leaves to care for newborn or adopted children Many employees are resentful when women in this organization take extended leaves to care for newborn or adopted children
In this dimension, the lower the score between 1 and 7, the more family-responsible the organizational culture.
© IESE Business School - Barcelona - 2011 Page 52© IESE Business School - Barcelona - 2011
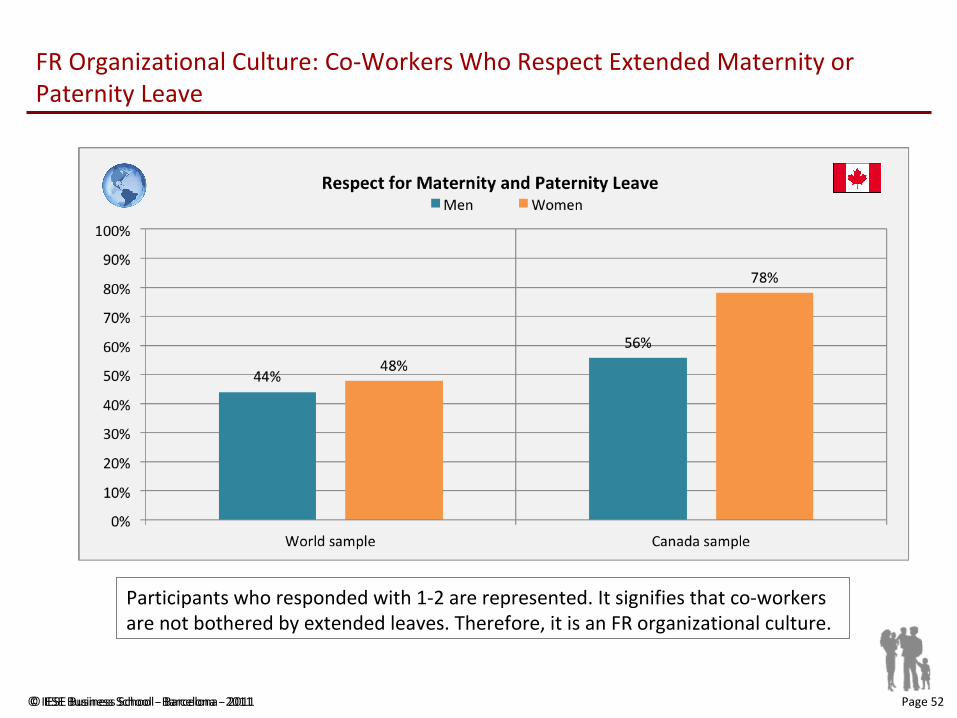
FR Organizational Culture: Co-Workers Who Respect Extended Maternity or Paternity Leave
Participants who responded with 1-2 are represented. It signifies that co-workers are not bothered by extended leaves. Therefore, it is an FR organizational culture.
© IESE Business School - Barcelona - 2011 Page 53© IESE Business School - Barcelona - 2011
FR Organizational Culture: Negative Consequences for the Career
The graph “FR Organizational Culture: Negative Consequences for the Career due to FR Behavior” refers to the following questions in the questionnaire:
Do you agree with the following statements? (1 = strongly disagree / 7 = strongly agree)
In this organization employees who participate in available work-family programs are viewed as less serious about their careers than those who do not participate in these programs To turn down a promotion or transfer for family-related reasons will seriously hurt one’s career progress in this organization In this organization employees on a flexible schedule are less likely to advance their careers than those who do not use flextime
In this dimension, the lower the score between 1 and 7, the more family-responsible the organizational culture.

© IESE Business School - Barcelona - 2011 Page 54© IESE Business School - Barcelona - 2011
FR Organizational Culture: Negative Consequences for the Career due to FR Behavior
Participants who responded with 1-2 are represented. It signifies that there are no negative consequences. Therefore, it is an FR organizational culture.
© IESE Business School - Barcelona - 2011 Page 55© IESE Business School - Barcelona - 2011
FR Organizational Culture: Expectations regarding Workload and Working Hours
El The graph “FR Organizational Culture: FR Expectations regarding Workload and Working Hours” refers to the following questions in the questionnaire:
Do you agree with the following statements? (1 = strongly disagree / 7 = strongly agree)
To get ahead at this organization, employees are expected to work more than 50 hours a week, whether at the workplace or at home Employees are often expected to take work home in the evenings and/or on weekends Employees are regularly expected to put their jobs before their families To be viewed favorably by top management, employees in this organization must constantly put their jobs ahead of their families or personal lives
In this dimension, the lower the score between 1 and 7, the more family-responsible the organizational culture.
© IESE Business School - Barcelona - 2011 Page 56© IESE Business School - Barcelona - 2011
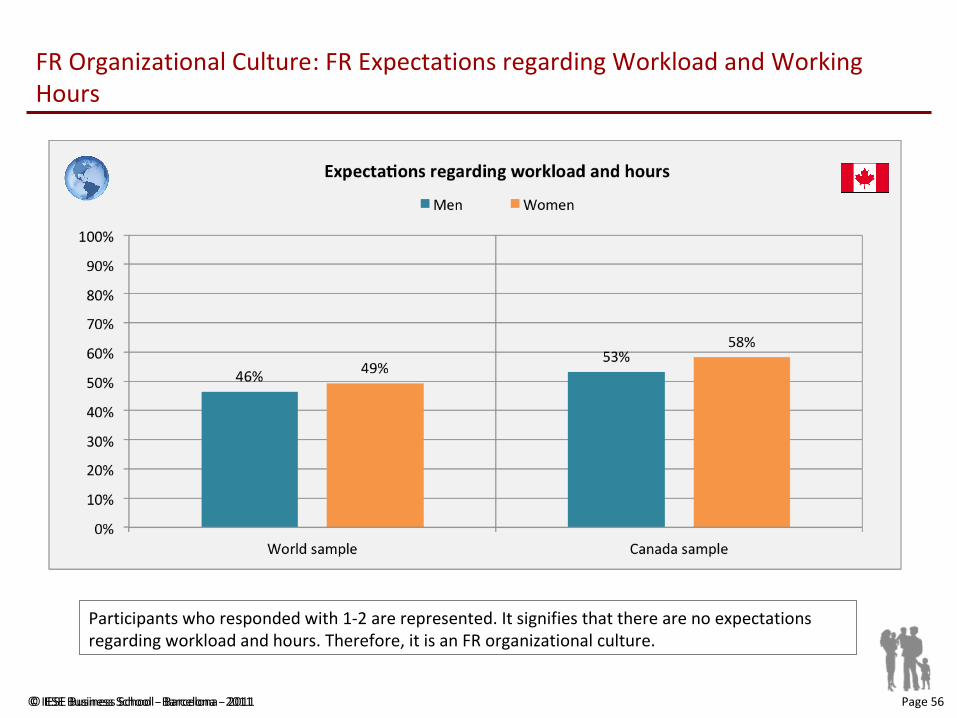
FR Organizational Culture: FR Expectations regarding Workload and Working Hours
Participants who responded with 1-2 are represented. It signifies that there are no expectations regarding workload and hours. Therefore, it is an FR organizational culture.
© IESE Business School - Barcelona - 2011 Page 57© IESE Business School - Barcelona - 2011
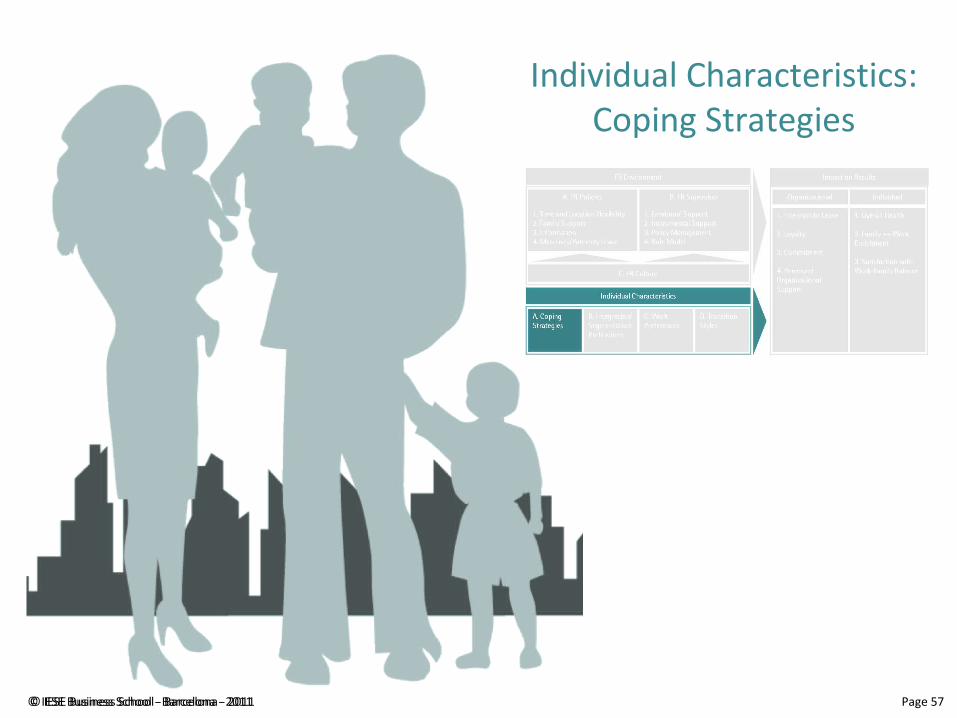
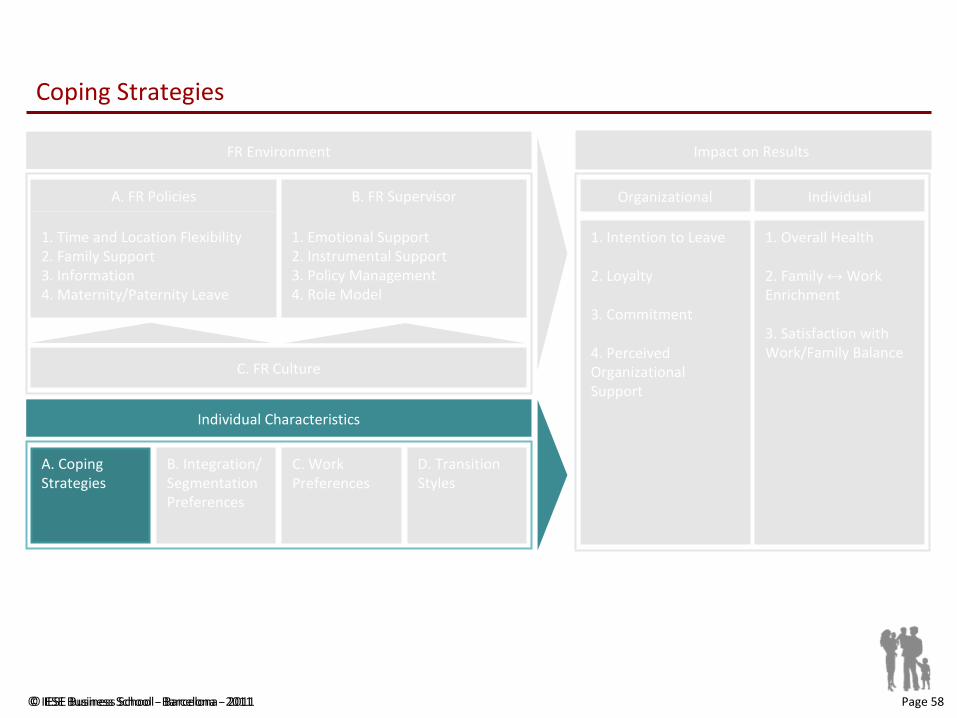
Individual Characteristics: Coping Strategies
© IESE Business School - Barcelona - 2011 Page 58© IESE Business School - Barcelona - 2011
Coping Strategies
Individual Characteristics
A. Coping Strategies
Impact on Results
1. Intention to Leave
2. Loyalty
3. Commitment
4. Perceived Organizational Support
Organizational Individual
1. Overall Health
2. Family ↔ Work Enrichment
3. Satisfaction with Work/Family Balance
A. FR Policies
1. Time and Location Flexibility2. Family Support3. Information4. Maternity/Paternity Leave
C. FR Culture
B. FR Supervisor
1. Emotional Support2. Instrumental Support3. Policy Management4. Role Model
FR Environment
B. Integration/ Segmentation Preferences
C. Work Preferences
D. Transition Styles
© IESE Business School - Barcelona - 2011 Page 59© IESE Business School - Barcelona - 2011
Coping Strategies
Coping strategies are the methods people use to overcome challenges and accomplish all they have committed to at home and at work.
Coping strategies consist in:
Planning daily work and prioritizing different tasks Seeking emotional and material support among family and friends
© IESE Business School - Barcelona - 2011 Page 60© IESE Business School - Barcelona - 2011
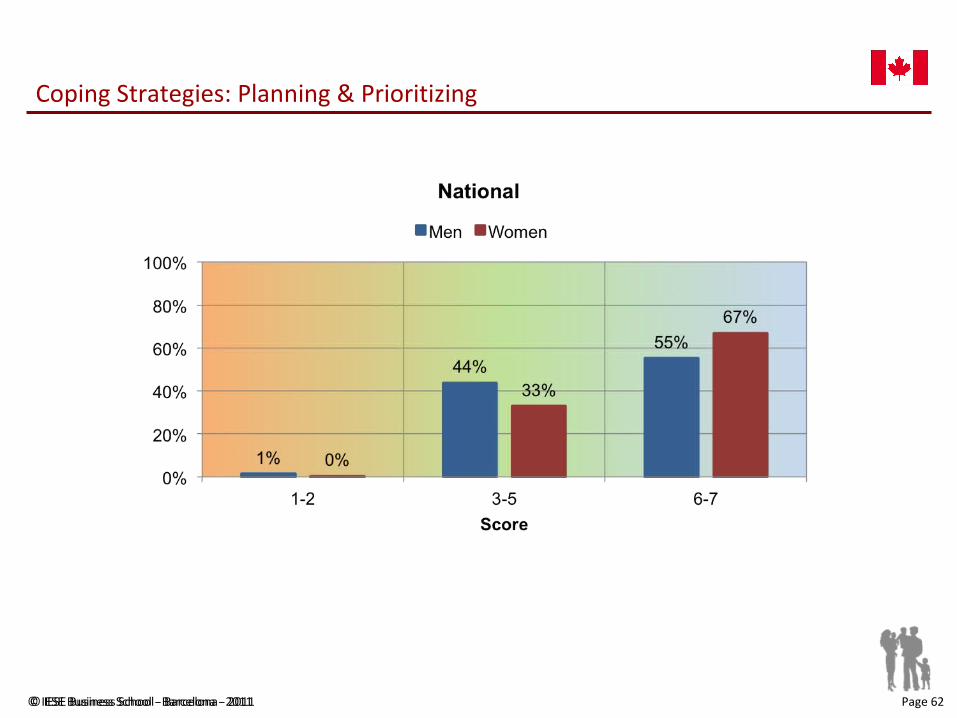
Coping Strategies: Planning & Prioritizing
The graph “Coping Strategies: Planning & Prioritizing” refers to the following questions in the questionnaire:
Do you agree with the following statements? (1 = strongly disagree / 7 = strongly agree)
I plan and organize my time at work I set priorities and do the most important thing first I work more efficiently so I can finish things quickly I plan and organize my tasks
© IESE Business School - Barcelona - 2011 Page 61© IESE Business School - Barcelona - 2011
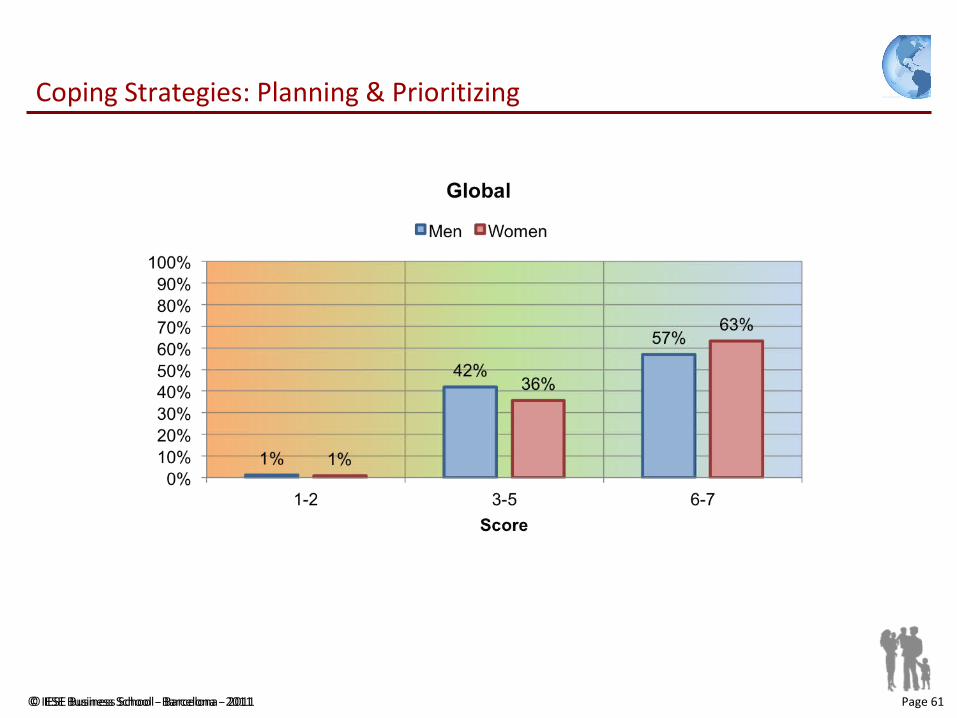
Coping Strategies: Planning & Prioritizing
© IESE Business School - Barcelona - 2011 Page 62© IESE Business School - Barcelona - 2011
Coping Strategies: Planning & Prioritizing
© IESE Business School - Barcelona - 2011 Page 63© IESE Business School - Barcelona - 2011
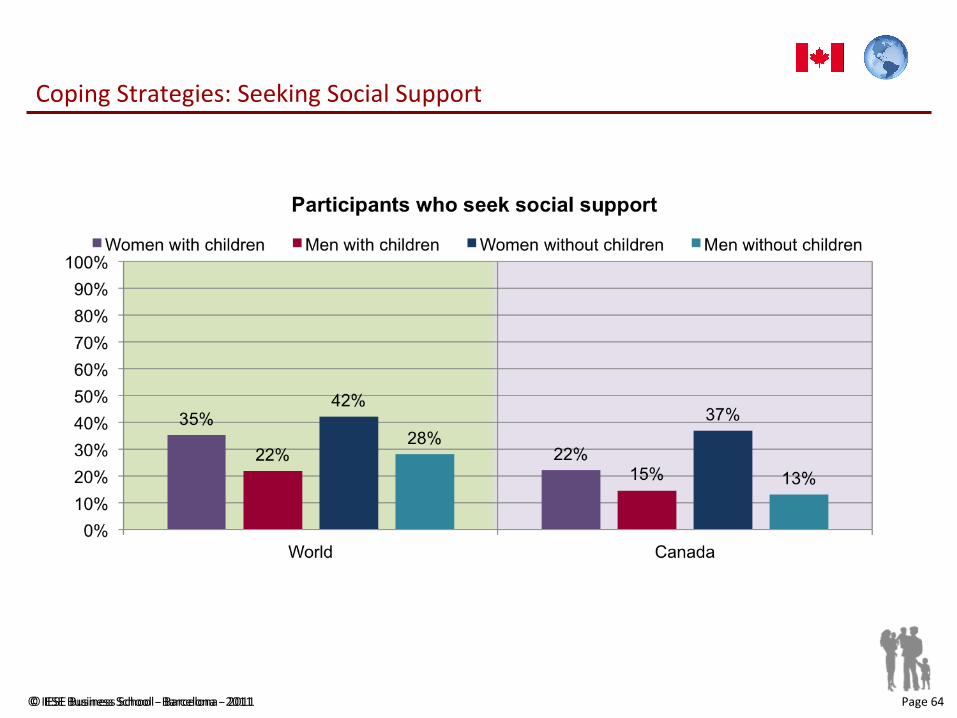
Coping Strategies: Seeking Social Support
The graph “Coping Strategies: Seeking Social Support” refers to the following questions in the questionnaire:
Do you agree with the following statements? (1 = strongly disagree / 7 = strongly agree)
I talk about my feelings with someone who is not directly involved I have several friends I can readily talk to about what matters most to me I seek understanding from someone I ask my relatives for help when I need it My family helps me if I have a problem
© IESE Business School - Barcelona - 2011 Page 64© IESE Business School - Barcelona - 2011
Coping Strategies: Seeking Social Support
© IESE Business School - Barcelona - 2011 Page 65© IESE Business School - Barcelona - 2011
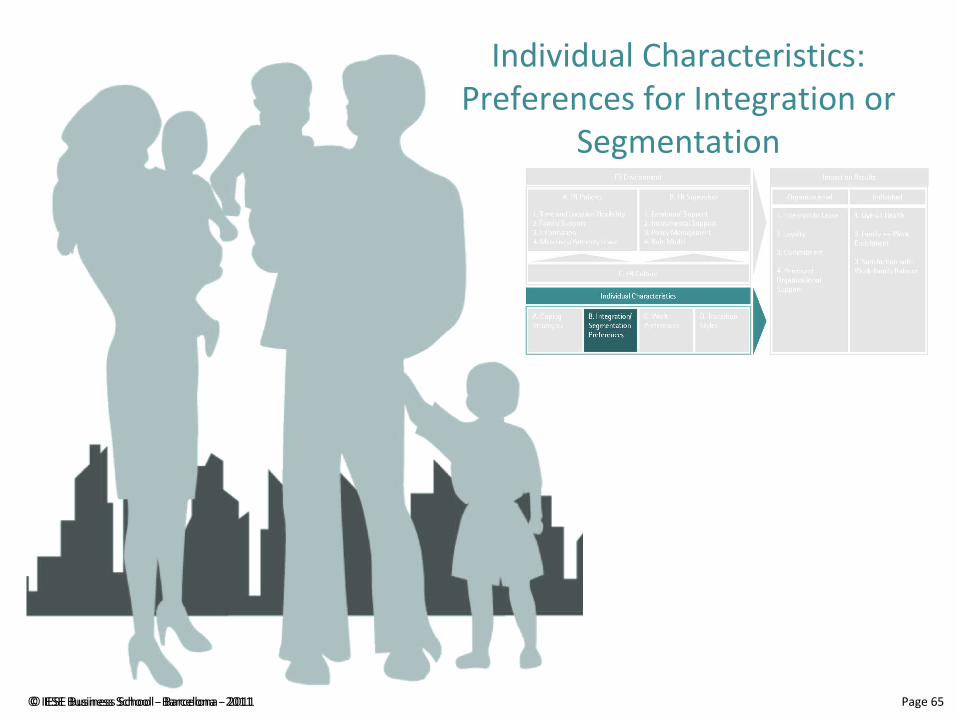
Individual Characteristics: Preferences for Integration or
Segmentation
© IESE Business School - Barcelona - 2011 Page 66© IESE Business School - Barcelona - 2011
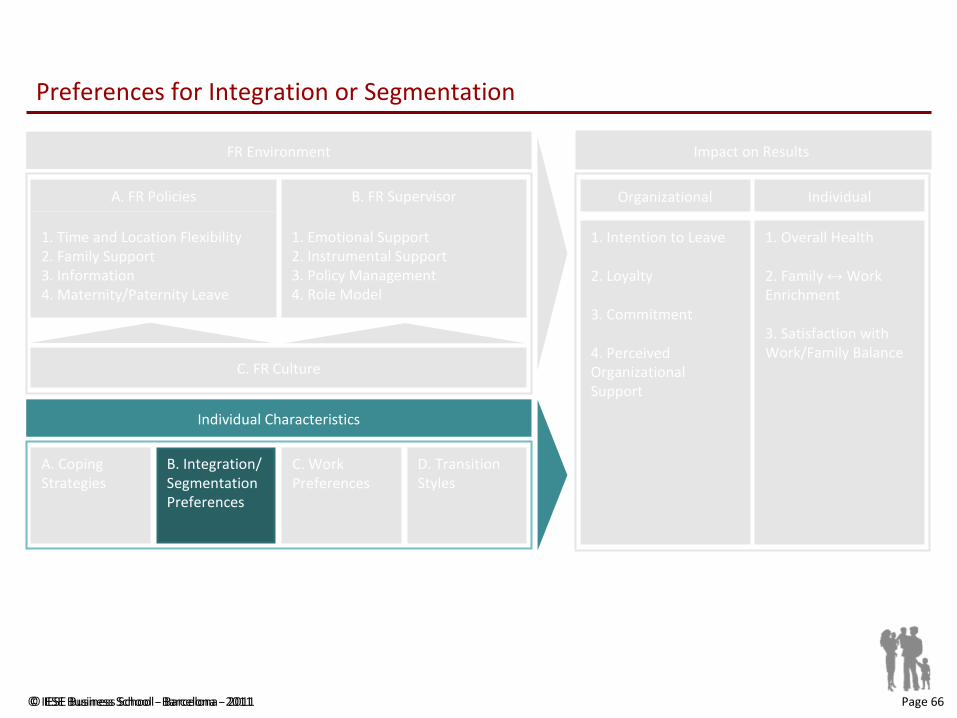
Preferences for Integration or Segmentation
Individual Characteristics
B. Integration/ Segmentation Preferences
Impact on Results
1. Intention to Leave
2. Loyalty
3. Commitment
4. Perceived Organizational Support
Organizational Individual
1. Overall Health
2. Family ↔ Work Enrichment
3. Satisfaction with Work/Family Balance
A. FR Policies
1. Time and Location Flexibility2. Family Support3. Information4. Maternity/Paternity Leave
C. FR Culture
B. FR Supervisor
1. Emotional Support2. Instrumental Support3. Policy Management4. Role Model
FR Environment
A. Coping Strategies
C. Work Preferences
D. Transition Styles
© IESE Business School - Barcelona - 2011 Page 67© IESE Business School - Barcelona - 2011
Preference for Integration or Segmentation
Some individuals prefer to establish barriers such that work and family domains do not overlap and
are completely separate (segmentation). Others prefer to unify the different domains (integration).
Segmentation and integration are two extremes of a continuum. At one end, work and non-work life
do not overlap at all; on the other end, they fully share the same time and space.
In and of itself, one preference is not better than the other. However, a company’s way of working to
accommodate the preferences of an individual, whether it be integration or segmentation, is
significant.
© IESE Business School - Barcelona - 2011 Page 68© IESE Business School - Barcelona - 2011
Preference for Integration or Segmentation: Working at Home
The graphs “Preference for Integration or Segmentation: Working at Home” refers to the following questions in the questionnaire:
How acceptable are the following situations for you? (1 = Not at all / 7 = Very much)
Being required to work while at home Being required to think about work while at home Being required to think about work once I leave the workplace Being expected to take work home
© IESE Business School - Barcelona - 2011 Page 69© IESE Business School - Barcelona - 2011
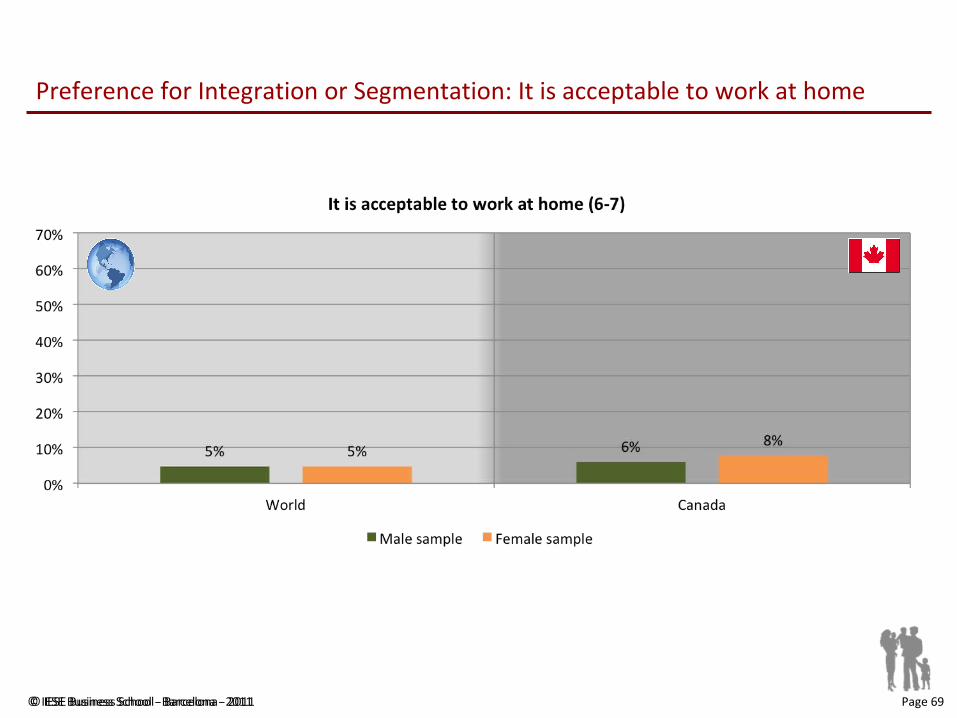
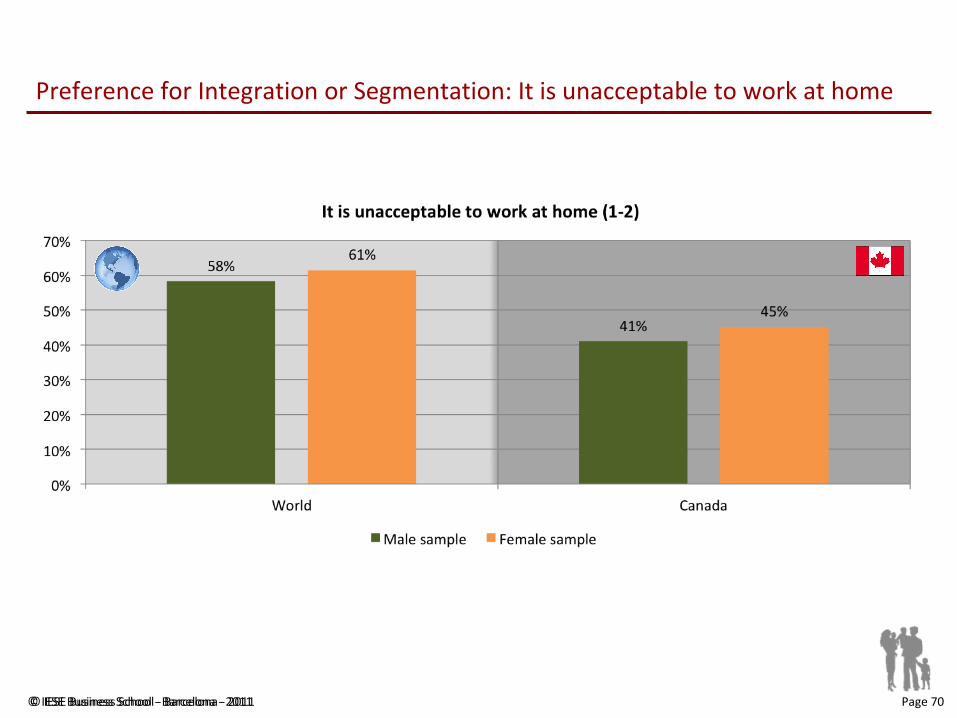
Preference for Integration or Segmentation: It is acceptable to work at home
© IESE Business School - Barcelona - 2011 Page 70© IESE Business School - Barcelona - 2011
Preference for Integration or Segmentation: It is unacceptable to work at home
© IESE Business School - Barcelona - 2011 Page 71© IESE Business School - Barcelona - 2011
Preference for Integration or Segmentation: Bringing Family Issues to Work
The graph “Preference for Integration or Segmentation: Bringing Family Issues to Work” refers to the following questions in the questionnaire:
How acceptable are the following situations for you? (1 = Not at all / 7 = Very much)
Having to solve family issues while at work Thinking about family issues while at work Running family errands during standard working hours
© IESE Business School - Barcelona - 2011 Page 72© IESE Business School - Barcelona - 2011
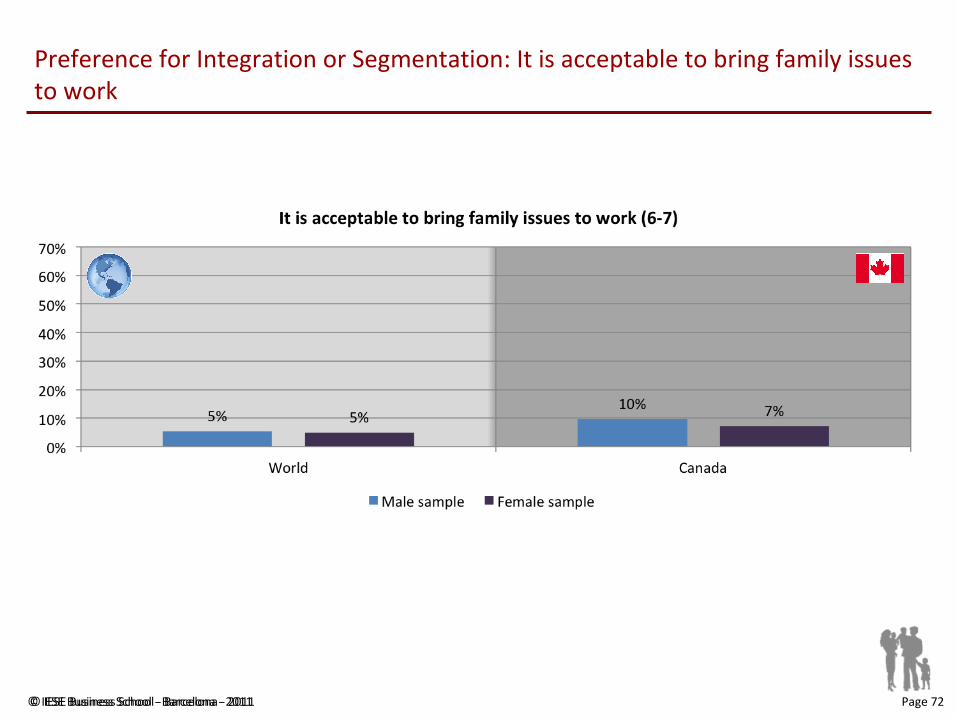
Preference for Integration or Segmentation: It is acceptable to bring family issues to work
© IESE Business School - Barcelona - 2011 Page 73© IESE Business School - Barcelona - 2011
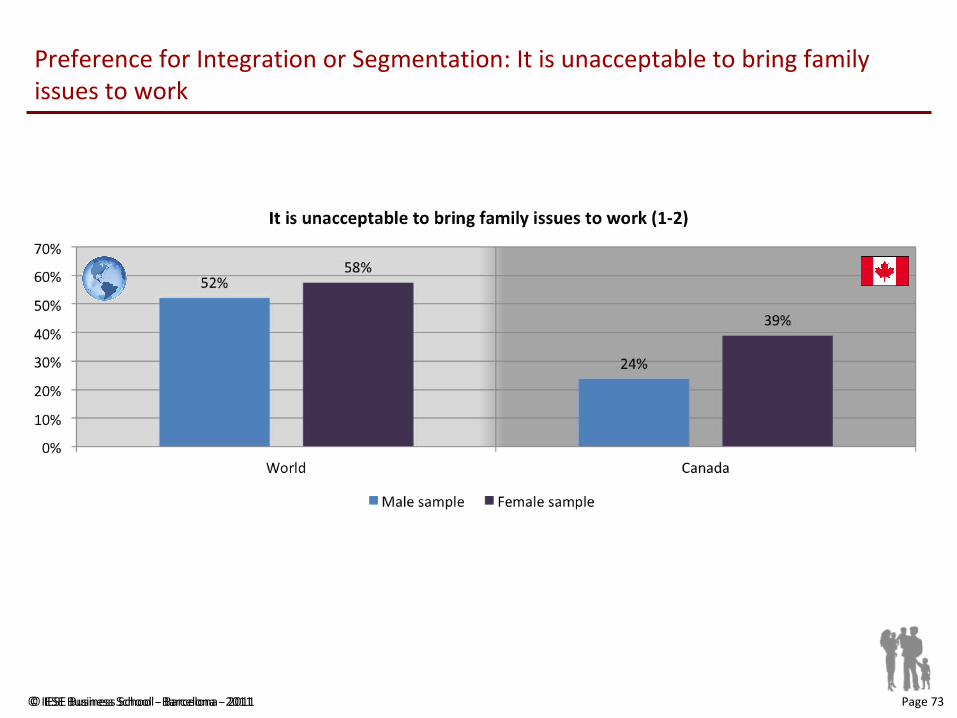
Preference for Integration or Segmentation: It is unacceptable to bring family issues to work
© IESE Business School - Barcelona - 2011 Page 74© IESE Business School - Barcelona - 2011
Individual Characteristics: Work Preferences
Individual Characteristics
C. Work Preferences
Impact on Results
1.Intention to Leave
2.Loyalty
3.Commitment
4.Perceived Organizational Support
Organizational Individual
1.Overall Health
2.Family ↔ Work Enrichment
3.Satisfaction with Work/Family Balance
A. FR Policies
1.Time and Location Flexibility2.Family Support3.Information4.Maternity/Paternity Leave
C. FR Culture
B. FR Supervisor
1.Emotional Support2.Instrumental Support3.Policy Management4.Role Model
FR Environment
A. Coping Strategies
B. Integration/ Segmentation Preferences
D. Transition Styles
© IESE Business School - Barcelona - 2011 Page 75© IESE Business School - Barcelona - 2011
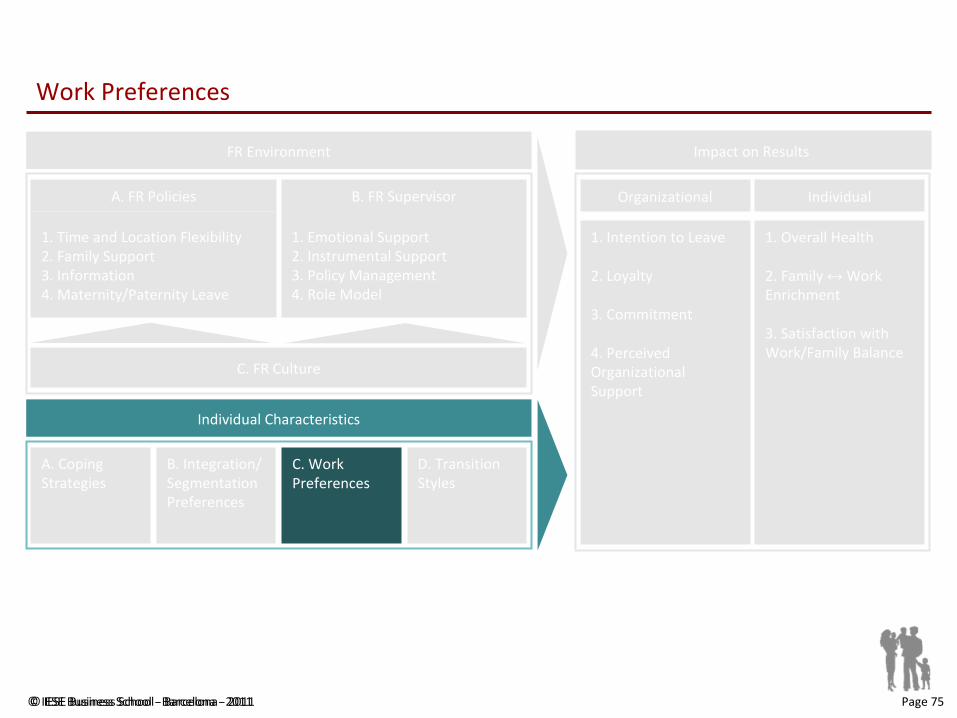
Work Preferences
Individual Characteristics
C. Work Preferences
Impact on Results
1. Intention to Leave
2. Loyalty
3. Commitment
4. Perceived Organizational Support
Organizational Individual
1. Overall Health
2. Family ↔ Work Enrichment
3. Satisfaction with Work/Family Balance
A. FR Policies
1. Time and Location Flexibility2. Family Support3. Information4. Maternity/Paternity Leave
C. FR Culture
B. FR Supervisor
1. Emotional Support2. Instrumental Support3. Policy Management4. Role Model
FR Environment
A. Coping Strategies
B. Integration/ Segmentation Preferences
D. Transition Styles
© IESE Business School - Barcelona - 2011 Page 76© IESE Business School - Barcelona - 2011
Work Preferences
It is defined as the reason or reasons why an individual decides to work on a particular task or in a particular job. There are three types: preference for extrinsic, intrinsic and transcendent motivations.
Extrinsic motivation: the individual searches for separable and tangible satisfaction generated by interactions. In other words, the individual searches for his or her own satisfaction without considering the consequences for others.
Intrinsic motivation or preference for growth opportunities: it is what causes a person to search for his or her own learning.
Transcendent motivation or preference for opportunities to contribute: it is what causes a person to consider positive and relevant learning. Persons that act on transcendent motivations grant importance to the effects of their actions on others.
© IESE Business School - Barcelona - 2011 Page 77© IESE Business School - Barcelona - 2011
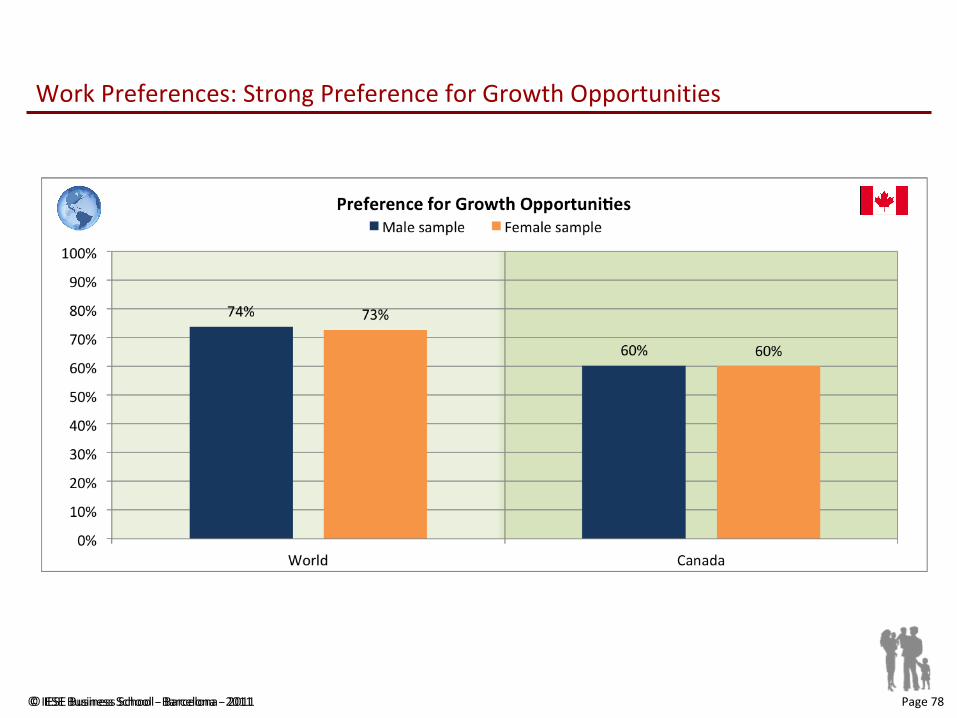
Work Preferences: Preference for Growth Opportunities
The graph “Work Preferences: Preference for Growth Opportunities” refers to the following questions in the questionnaire:
Do you agree with the following statements? (1 = strongly disagree / 7 = strongly agree)
I like challenging jobs I do not like repetitive jobs, without a lot of decision making or major challenges (reverse) I prefer assignments that contribute to my professional experience
© IESE Business School - Barcelona - 2011 Page 78© IESE Business School - Barcelona - 2011
Work Preferences: Strong Preference for Growth Opportunities
© IESE Business School - Barcelona - 2011 Page 79© IESE Business School - Barcelona - 2011
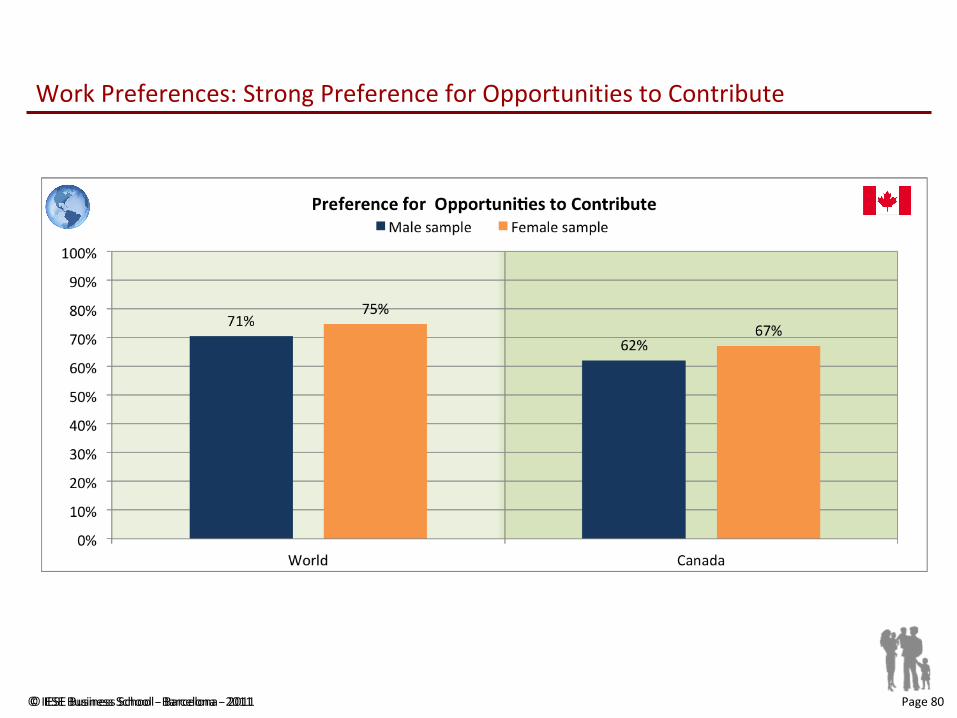
Work Preferences: Preference for Opportunities to Contribute
The graph “Work Preferences: Preference for Opportunities to Contribute” refers to the following questions in the questionnaire:
Do you agree with the following statements? (1 = strongly disagree / 7 = strongly agree)
I feel really fulfilled when I can be useful to others I am deeply thankful to those who help me All things being equal, I prefer a job where I can be more useful to others What I like the most in my job is that I can contribute to the good of others
© IESE Business School - Barcelona - 2011 Page 80© IESE Business School - Barcelona - 2011
Work Preferences: Strong Preference for Opportunities to Contribute
© IESE Business School - Barcelona - 2011 Page 81© IESE Business School - Barcelona - 2011
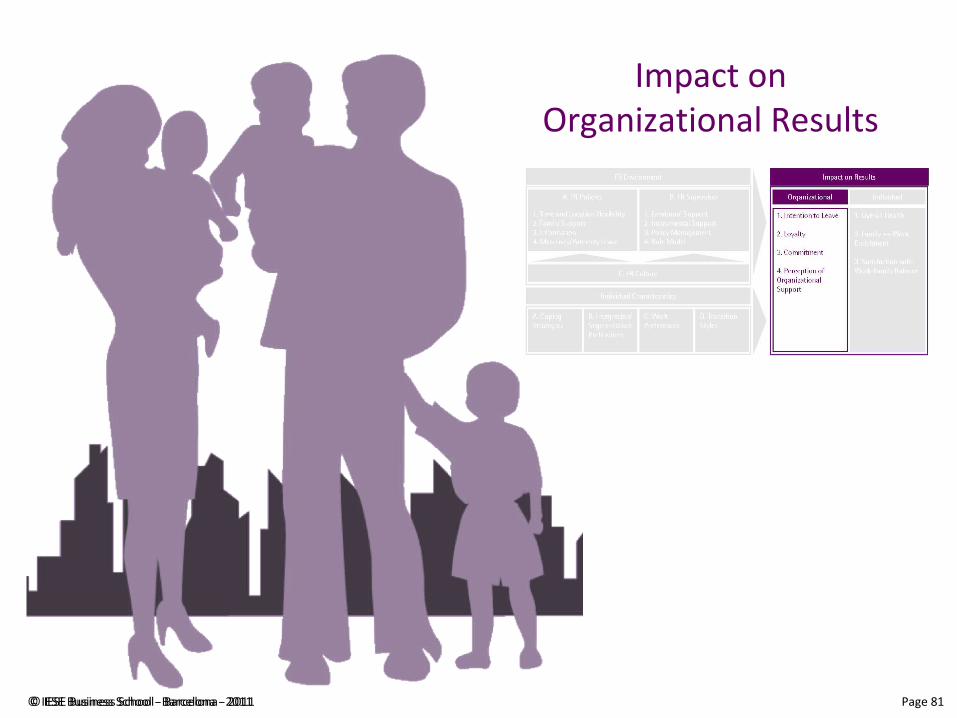
Impact on Organizational Results
© IESE Business School - Barcelona - 2011 Page 82© IESE Business School - Barcelona - 2011
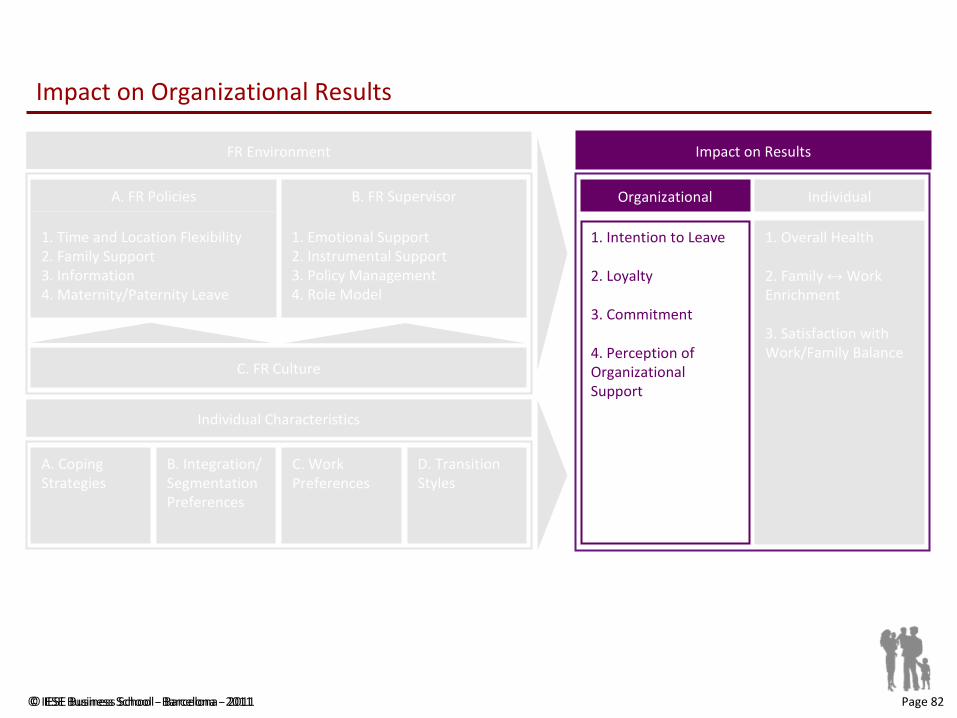
Impact on Organizational Results
A. FR Policies
1. Time and Location Flexibility2. Family Support3. Information4. Maternity/Paternity Leave
C. FR Culture
B. FR Supervisor
1. Emotional Support2. Instrumental Support3. Policy Management4. Role Model
FR Environment
Individual Characteristics
A. Coping Strategies
B. Integration/ Segmentation Preferences
C. Work Preferences
D. Transition Styles
Impact on Results
1. Intention to Leave
2. Loyalty
3. Commitment
4. Perception of Organizational Support
Organizational Individual
1. Overall Health
2. Family ↔ Work Enrichment
3. Satisfaction with Work/Family Balance
© IESE Business School - Barcelona - 2011 Page 83© IESE Business School - Barcelona - 2011
Impact on Organizational Results: Intention to Leave the Company
Undesired turnover has negative consequences that affect the morale of the other employees as well as the outcomes for the company:
Lower productivity Loss of expertise Deteriorated work environment and lack of motivation among the remaining staff
In addition, there are significant direct costs: Costs of recruitment for a replacement Costs of training a new employee Costs of substitution while the vacant position is covered
© IESE Business School - Barcelona - 2011 Page 84© IESE Business School - Barcelona - 2011
Impact on Organizational Results: Intention to Leave the Company
The graphs “Impact on Organizational Results: Intention to Leave the Company” refer to the following questions in the questionnaire:
Do you agree with the following statements? (1 = strongly disagree / 7 = strongly agree)
I would prefer another more ideal job than the one I have now If it was up to me, in three years I would not be in this organization I frequently think of quitting my job
© IESE Business School - Barcelona - 2011 Page 85© IESE Business School - Barcelona - 2011
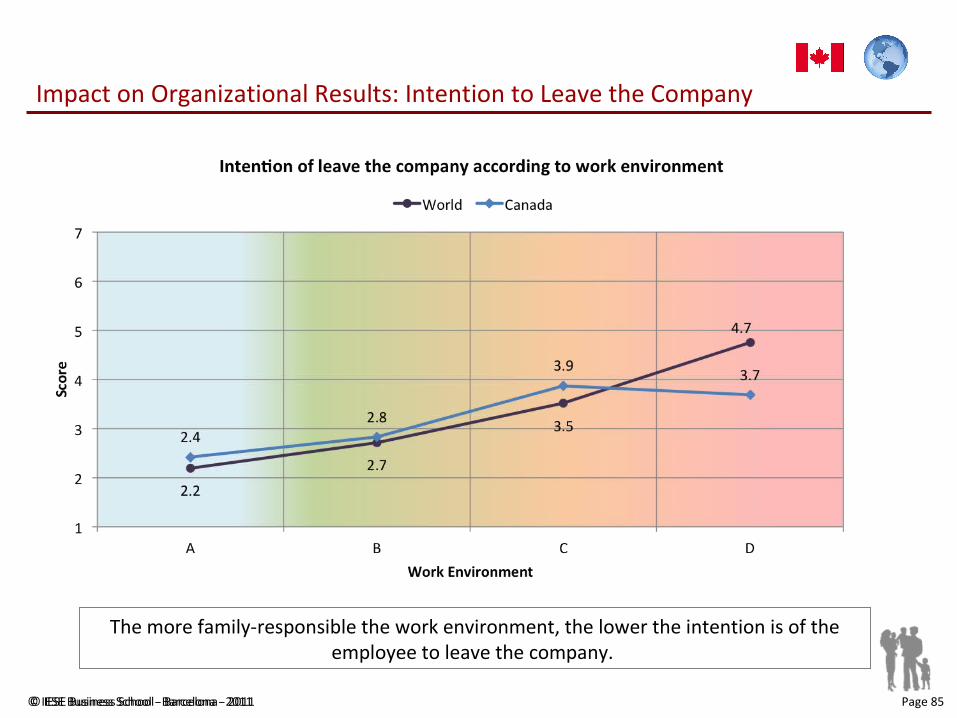
Impact on Organizational Results: Intention to Leave the Company
The more family-responsible the work environment, the lower the intention is of the employee to leave the company.
© IESE Business School - Barcelona - 2011 Page 86© IESE Business School - Barcelona - 2011
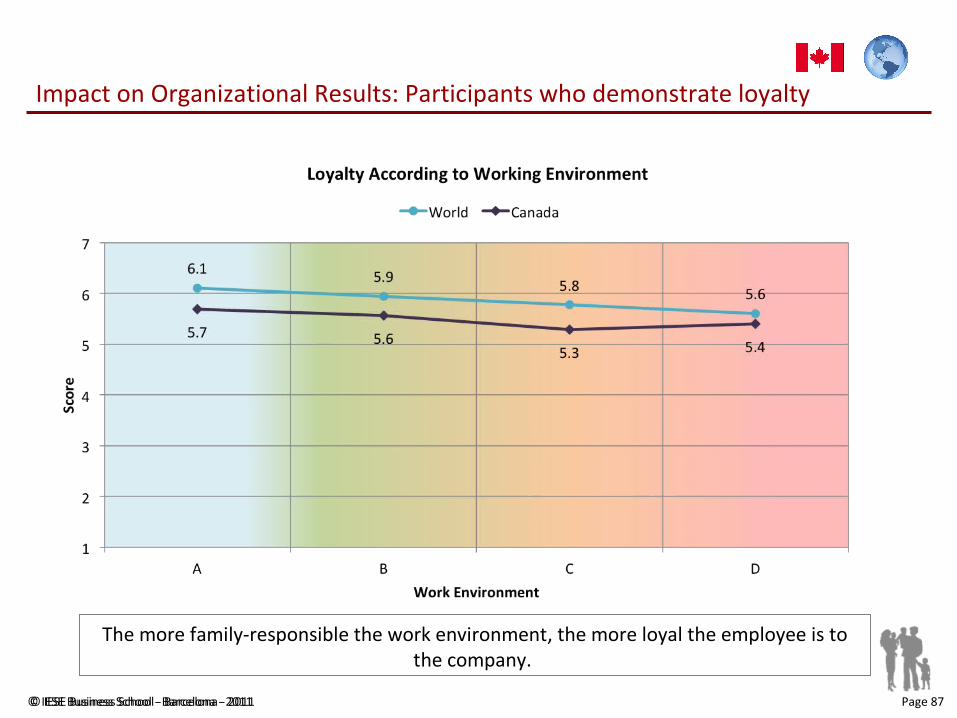
Impact on Organizational Results: Loyalty
The graph “Impact on Organizational Results: Loyalty” refers to the following questions in the questionnaire:
Do you agree with the following statements?(1 = strongly disagree / 7 = strongly agree)
I am loyal to this organization I frequently suggest new ideas to improve my department I am expected to do only the job that I am paid to do Even when it is not required, I try to help other colleagues with their work
© IESE Business School - Barcelona - 2011 Page 87© IESE Business School - Barcelona - 2011
Impact on Organizational Results: Participants who demonstrate loyalty
The more family-responsible the work environment, the more loyal the employee is to the company.
© IESE Business School - Barcelona - 2011 Page 88© IESE Business School - Barcelona - 2011
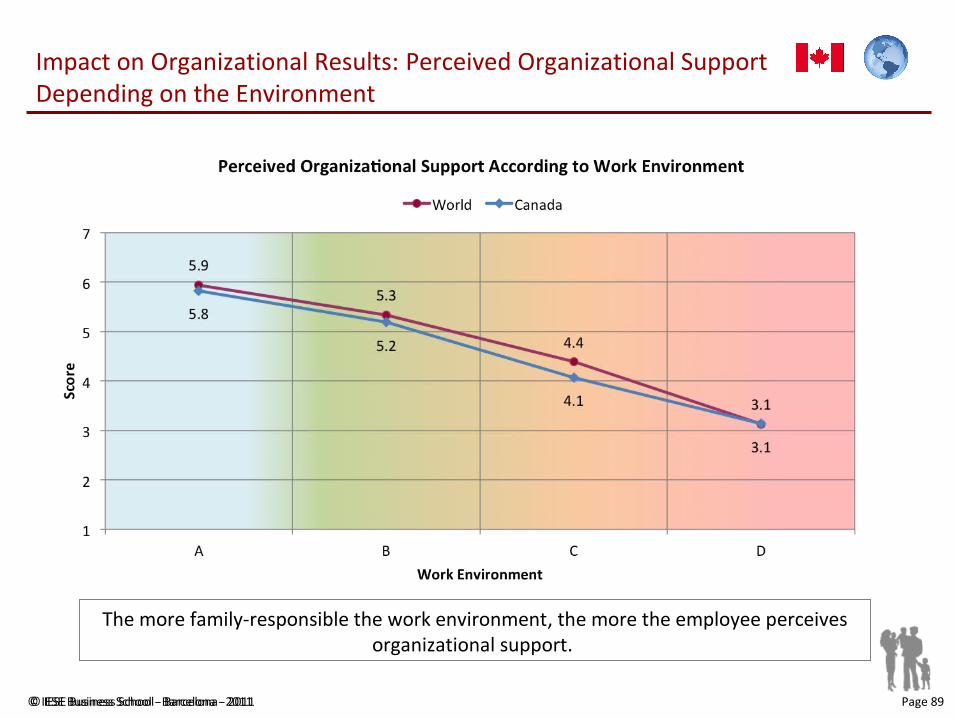
Impact on Organizational Results: Perceived Organizational Support
The graphs “Impact on Organizational Results: Perceived Organizational Support” refer to the following questions in the questionnaire:
Do you agree with the following statements? (1 = strongly disagree / 7 = strongly agree)
When I have a problem, the organization tries to help me The organization is sincerely concerned about my well-being The organization takes my opinion seriously The organization is concerned about my overall satisfaction at work
© IESE Business School - Barcelona - 2011 Page 89© IESE Business School - Barcelona - 2011
Impact on Organizational Results: Perceived Organizational Support Depending on the Environment
The more family-responsible the work environment, the more the employee perceives organizational support.
© IESE Business School - Barcelona - 2011 Page 90© IESE Business School - Barcelona - 2011
Impact on Organizational Results: Commitment
Commitment refers to the nature of the relationship that an individual has with his/her organization.
It can present as:
Commitment due to a lack of alternatives: the commitment of an individual is related to the high costs of leaving the company or to a lack of alternatives. It is the most fragile commitment: the person is willing to leave as soon as he/she finds other options. The higher the commitment due to a lack of alternatives, the worse the quality is of the individual’s relationship with his/her company.
Commitment due to professional development: the commitment is due to the individual’s perception of existent opportunities that will satisfy his/her professional and personal growth. It implies a stronger commitment than the previous one since the person is willing to collaborate while there exists possibilities for learning and development.
Emotional commitment: the commitment manifests itself as a sentiment of personal duty and obligation towards the company. It is the strongest attachment since it is the one in which a person wishes to contribute to the company as a result of personal convincing and moral duty.
© IESE Business School - Barcelona - 2011 Page 91© IESE Business School - Barcelona - 2011
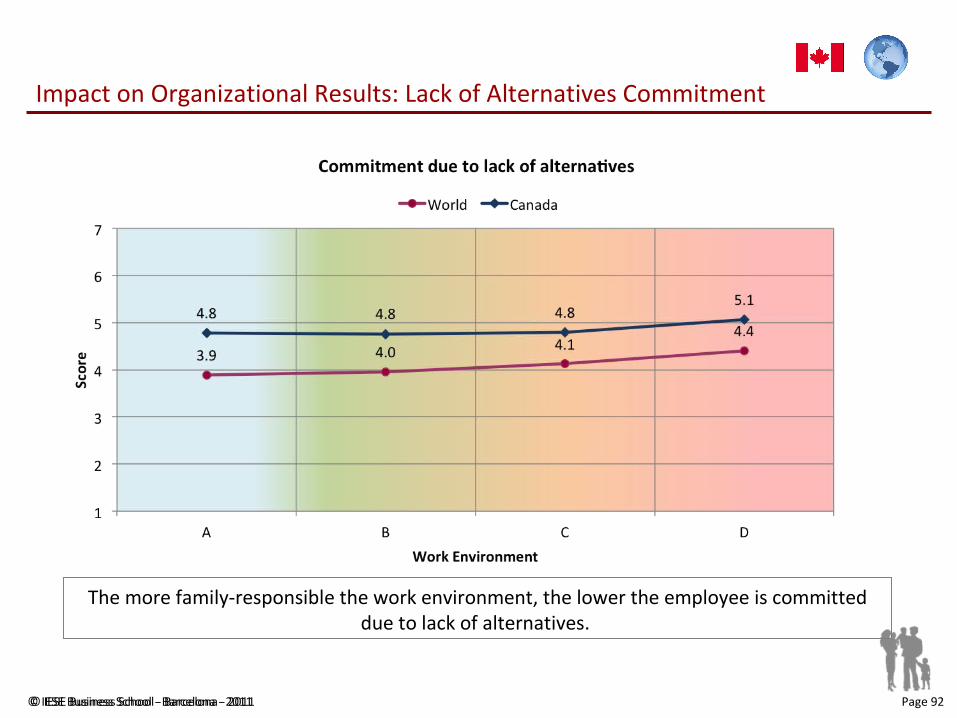
Impact on Organizational Results: Lack of Alternatives Commitment
The graphs “Impact on Organizational Results: Lack of Alternatives Commitment” refer to the following questions in the questionnaire:
Do you agree with the following statements?(1 = strongly disagree / 7 = strongly agree)
Right now, staying with this organization is a necessity for me It would not be difficult for me to find an interesting job in other organization Switching to a different organization would be highly inconvenient right now
© IESE Business School - Barcelona - 2011 Page 92© IESE Business School - Barcelona - 2011
Impact on Organizational Results: Lack of Alternatives Commitment
The more family-responsible the work environment, the lower the employee is committed due to lack of alternatives.
© IESE Business School - Barcelona - 2011 Page 93© IESE Business School - Barcelona - 2011
Impact on Organizational Results: Professional Development Commitment
The graphs “Impact on Organizational Results: Professional Development Commitment” refer to the following questions in the questionnaire:
Do you agree with the following statements?(1 = strongly disagree / 7 = strongly agree)
Working in this organization offers me opportunities to learn and grown professionally I really like working for this organization My work in this organization is not especially attractive

© IESE Business School - Barcelona - 2011 Page 94© IESE Business School - Barcelona - 2011
Impact on Organizational Results: Professional Development Commitment
The more family-responsible the work environment, the more positively the person views the possibilities of professional growth and better values the organization itself.
© IESE Business School - Barcelona - 2011 Page 95© IESE Business School - Barcelona - 2011
Impact on Organizational Results: Emotional Commitment
The graphs “Impact on Organizational Results: Emotional Commitment” refer to the following questions in the questionnaire:
Do you agree with the following statements? (1 = strongly disagree / 7 = strongly agree)
Right now I would not abandon this organization because of a sense of obligation toward the people I work with I feel an obligation to continue working for this organization (reverse) I would feel guilty if I were to quit this organization now
© IESE Business School - Barcelona - 2011 Page 96© IESE Business School - Barcelona - 2011
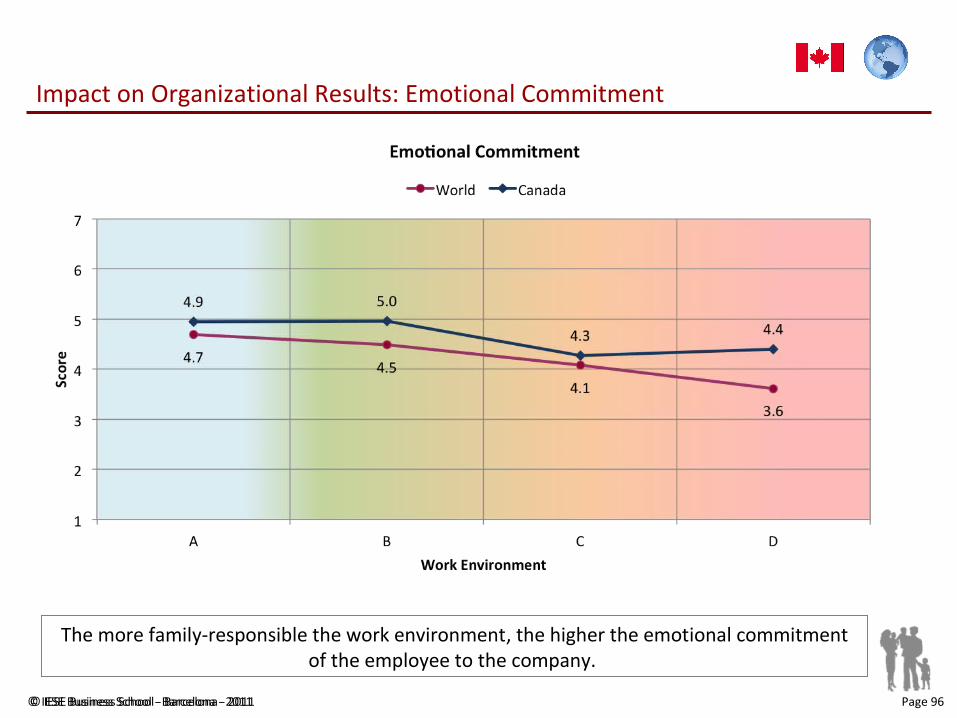
Impact on Organizational Results: Emotional Commitment
The more family-responsible the work environment, the higher the emotional commitment of the employee to the company.
© IESE Business School - Barcelona - 2011 Page 97© IESE Business School - Barcelona - 2011
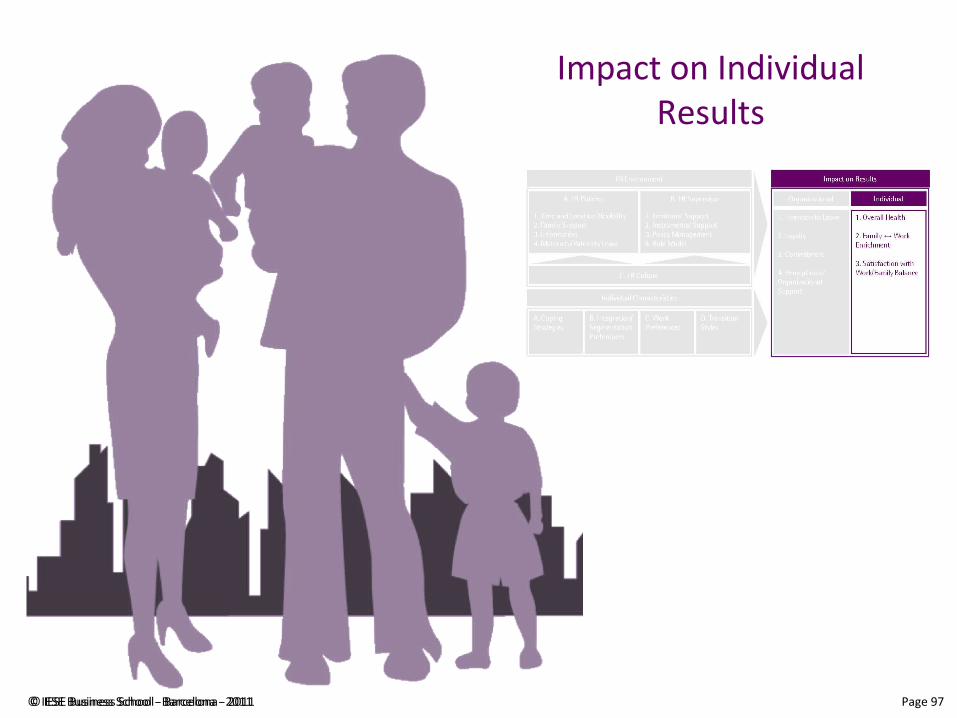
Impact on Individual Results
© IESE Business School - Barcelona - 2011 Page 98© IESE Business School - Barcelona - 2011
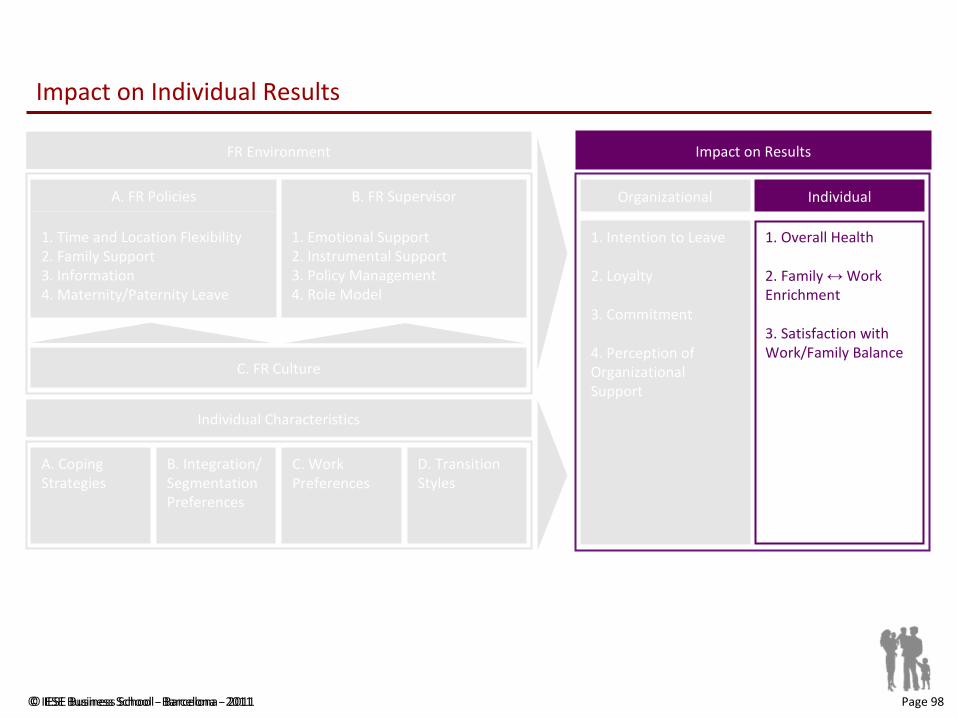
Impact on Individual Results
Impact on Results
1. Intention to Leave
2. Loyalty
3. Commitment
4. Perception of Organizational Support
Organizational Individual
1. Overall Health
2. Family ↔ Work Enrichment
3. Satisfaction with Work/Family Balance
A. FR Policies
1. Time and Location Flexibility2. Family Support3. Information4. Maternity/Paternity Leave
C. FR Culture
B. FR Supervisor
1. Emotional Support2. Instrumental Support3. Policy Management4. Role Model
FR Environment
Individual Characteristics
A. Coping Strategies
B. Integration/ Segmentation Preferences
C. Work Preferences
D. Transition Styles
© IESE Business School - Barcelona - 2011 Page 99© IESE Business School - Barcelona - 2011
Impact on Individual Results: Overall Health
Overall health refers to the wellbeing of an individual, which can have consequences in a company since if the health of an individual is precarious there is:
Greater absenteeism Less productivity Increased leave due to illness Decreased motivation
© IESE Business School - Barcelona - 2011 Page 100© IESE Business School - Barcelona - 2011
Impact on Individual Results:Overall Health
The graphs “Impact on Individual Results: Overall Heath” refer to the following question in the questionnaire:
Please rate the following aspects of your health over the past 4 weeks(1 = very poor / 7 = Excellent)
Overall, how would you rate your health during the past 4 weeks?

© IESE Business School - Barcelona - 2011 Page 101© IESE Business School - Barcelona - 2011
Impact on Individual Results: Overall Health
The more family-responsible the work environment, the better the overall health of the employee.
© IESE Business School - Barcelona - 2011 Page 102© IESE Business School - Barcelona - 2011
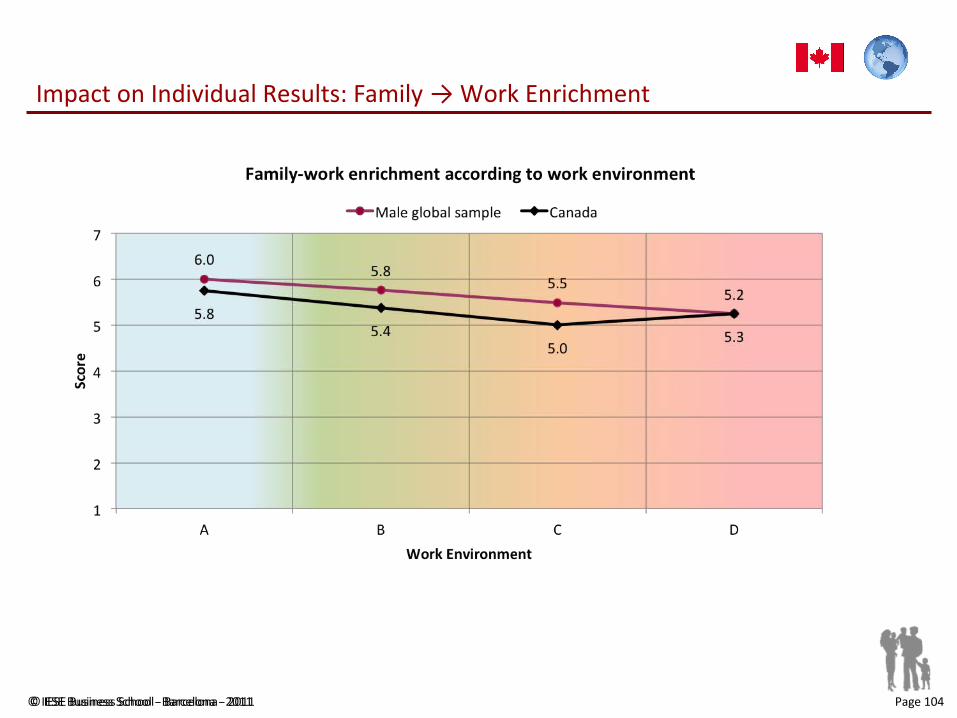
Impact on Individual Results: Enrichment between Work and Family Environments
Work-family enrichment occurs when experiences in the work environment improve the quality of life in the family environment and vice versa. This occurs when abilities and competencies that develop in the professional domain are transferred to the familial domain, and vice versa: the learning and experiences acquired in the family environment are transferred to the professional domain.
© IESE Business School - Barcelona - 2011 Page 103© IESE Business School - Barcelona - 2011
Impact on Individual Results: Family → Work Enrichment
The graphs “Impact on Individual Results: Family → Work Enrichment” refer to the following questions in the questionnaire:
Do you agree with the following statements? (1 = strongly disagree / 7 = strongly agree)
Fulfilling my family responsibilities has enriched the interpersonal skills I need to succeed at work Overcoming obstacles at home has given me more confidence in my abilities at work Juggling multiple tasks at home has improved my ability to multi-task at work Being involved at home has enabled me to better understand people at work
© IESE Business School - Barcelona - 2011 Page 104© IESE Business School - Barcelona - 2011
Impact on Individual Results: Family → Work Enrichment
© IESE Business School - Barcelona - 2011 Page 105© IESE Business School - Barcelona - 2011
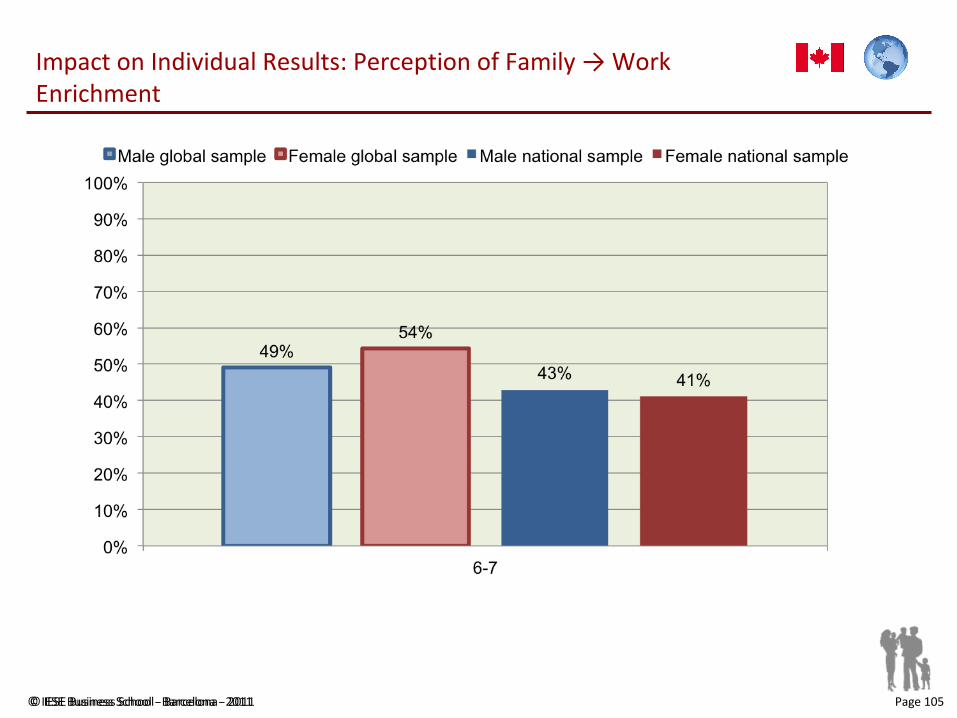
Impact on Individual Results: Perception of Family → Work Enrichment
© IESE Business School - Barcelona - 2011 Page 106© IESE Business School - Barcelona - 2011
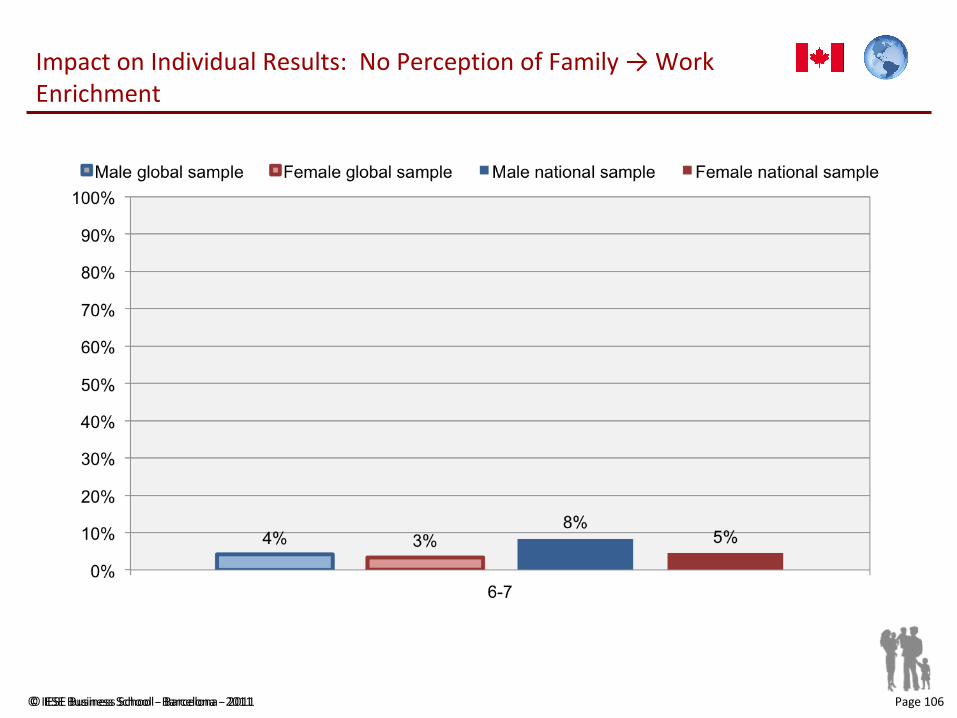
Impact on Individual Results: No Perception of Family → Work Enrichment
© IESE Business School - Barcelona - 2011 Page 107© IESE Business School - Barcelona - 2011
Impact on Individual Results: Work → Family Enrichment
The graphs “Impact on Individual Results: Work → Family Enrichment” refer to the following questions in the questionnaire:
Do you agree with the following statements? (1 = strongly disagree / 7 = strongly agree)
Fulfilling my work responsibilities has enriched the interpersonal skills I need to succeed at home Overcoming obstacles at work has given me more confidence in my abilities at home Juggling multiple tasks at work has improved my ability to multi-task at home Being involved at work has enabled me to better understand people at home
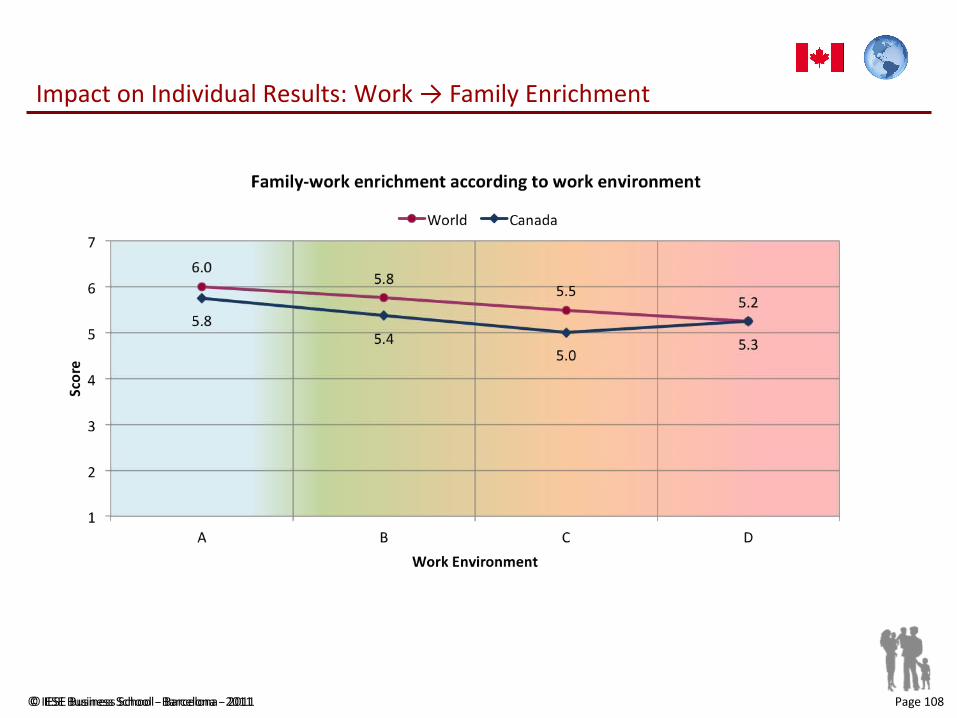
© IESE Business School - Barcelona - 2011 Page 108© IESE Business School - Barcelona - 2011
Impact on Individual Results: Work → Family Enrichment
© IESE Business School - Barcelona - 2011 Page 109© IESE Business School - Barcelona - 2011
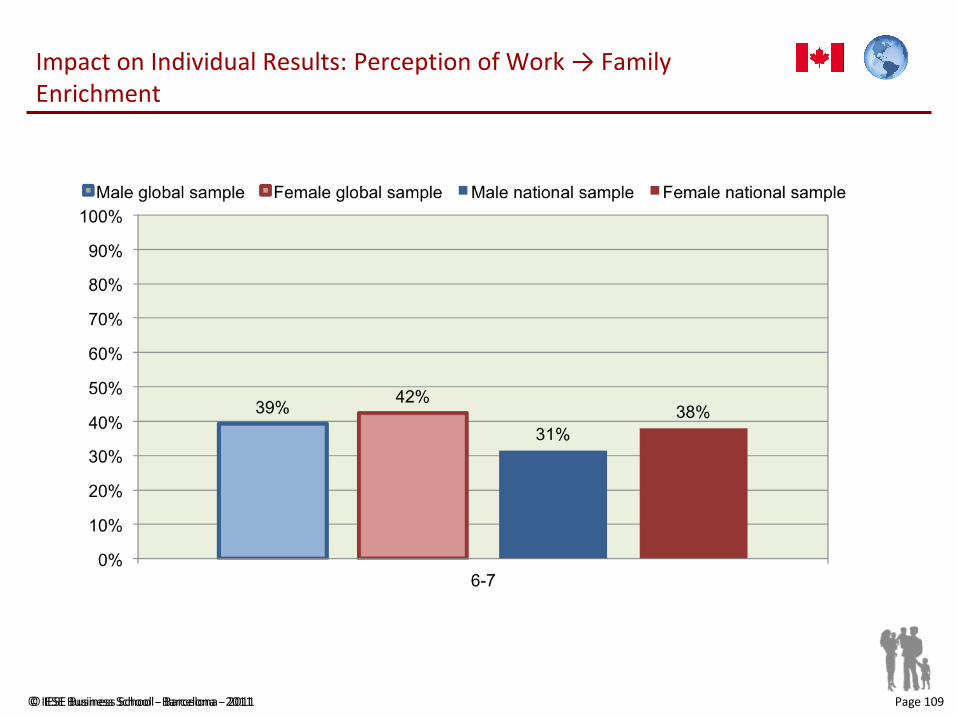
Impact on Individual Results: Perception of Work → Family Enrichment
© IESE Business School - Barcelona - 2011 Page 110© IESE Business School - Barcelona - 2011
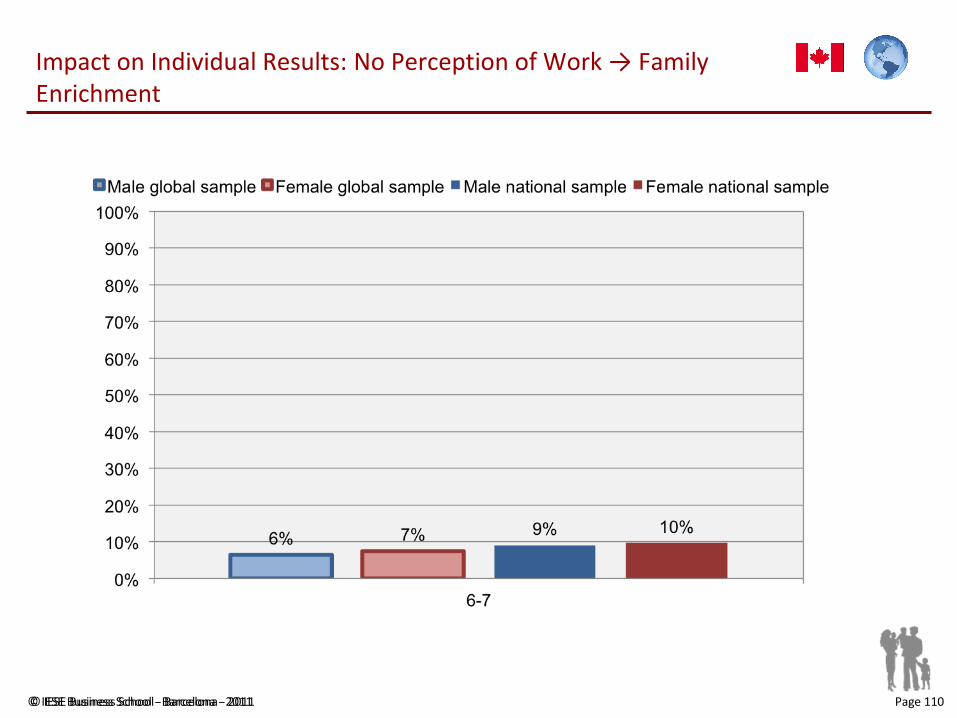
Impact on Individual Results: No Perception of Work → Family Enrichment
© IESE Business School - Barcelona - 2011 Page 111© IESE Business School - Barcelona - 2011
Impact on Individual Results: Satisfaction with Work/Life Balance
The person is satisfied with how he or she is managing work and family responsibilities.
This variable refers to the level of satisfaction that the person has with how he or she divides his or her attention between work and family. It is also the satisfaction with how both domains, the familial and professional, fit to form a balanced framework that the person likes.
This satisfaction is facilitated, in large part, by the resources that the company provides a person to do their job in an independent and flexible manner. In this way, he or she can contribute professionally without it negatively affecting his or her family life.
© IESE Business School - Barcelona - 2011 Page 112© IESE Business School - Barcelona - 2011
Impact on Individual Results: Satisfaction with Work/Life Balance
The graphs of “Impact on Individual Results: Satisfaction with Work/Life Balance” refer to the following questions in the questionnaire:
Please tell us how satisfied you are with the following aspects of your life (1 = Very dissatisfied / 7 = Very satisfied)
The way I divide my time between work and personal or family life The way I divide my attention between work and home The way my personal and family life fit together My ability to balance the needs of your job with those of my personal or family life The opportunity to balance my job and look after my duties at home
© IESE Business School - Barcelona - 2011 Page 113© IESE Business School - Barcelona - 2011
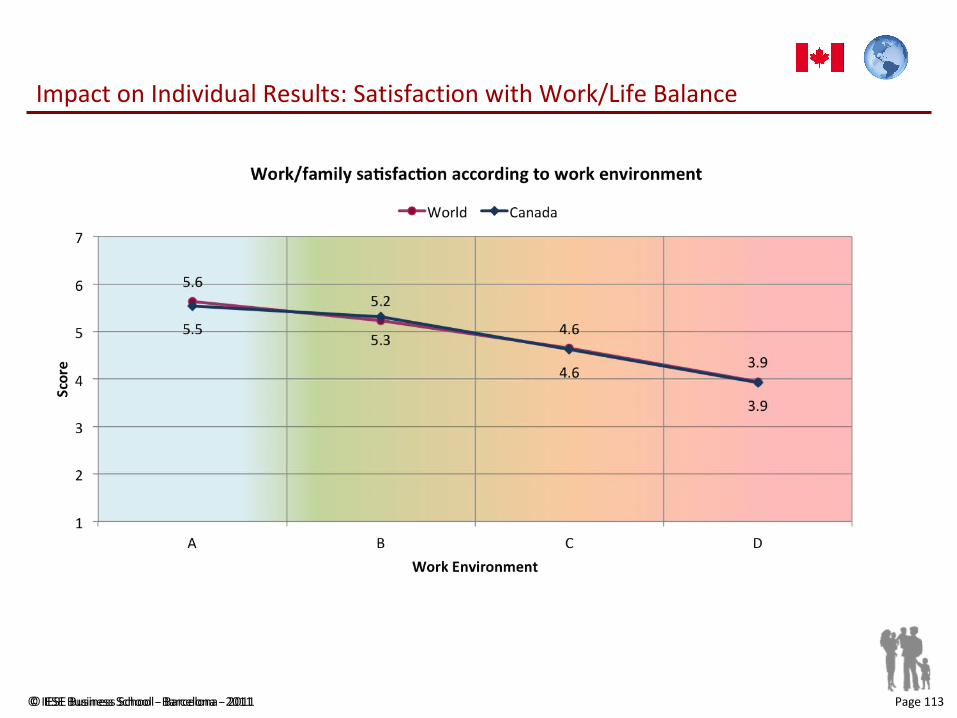
Impact on Individual Results: Satisfaction with Work/Life Balance
© IESE Business School - Barcelona - 2011 Page 114© IESE Business School - Barcelona - 2011
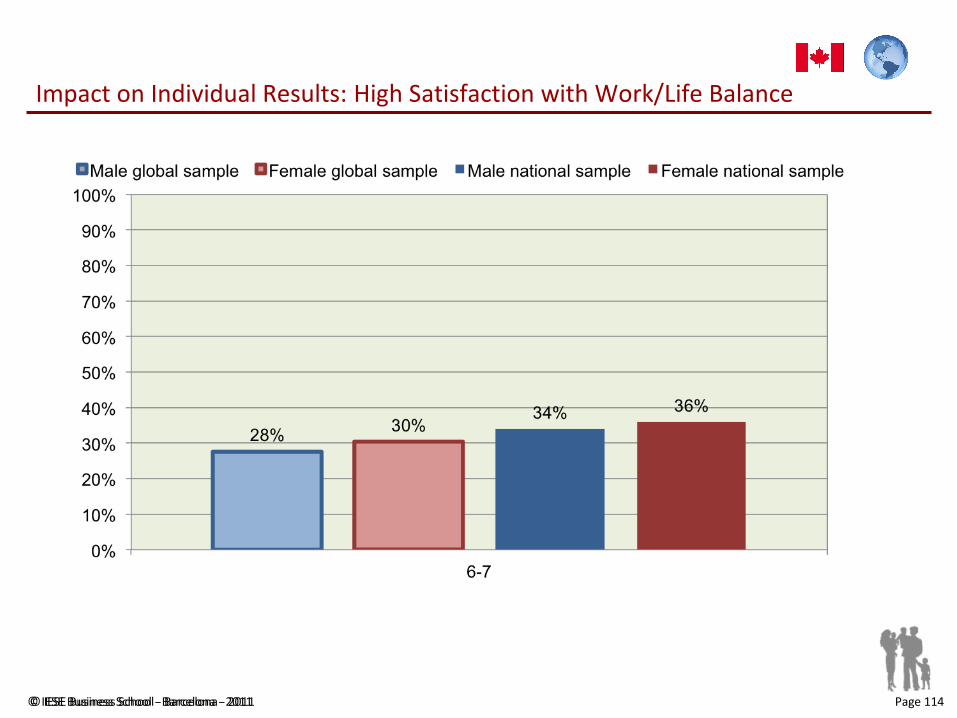
Impact on Individual Results: High Satisfaction with Work/Life Balance

© IESE Business School - Barcelona - 2011 Page 115© IESE Business School - Barcelona - 2011
Impact on Individual Results: Low Satisfaction with Work/Life Balance
© IESE Business School - Barcelona - 2011 Page 116
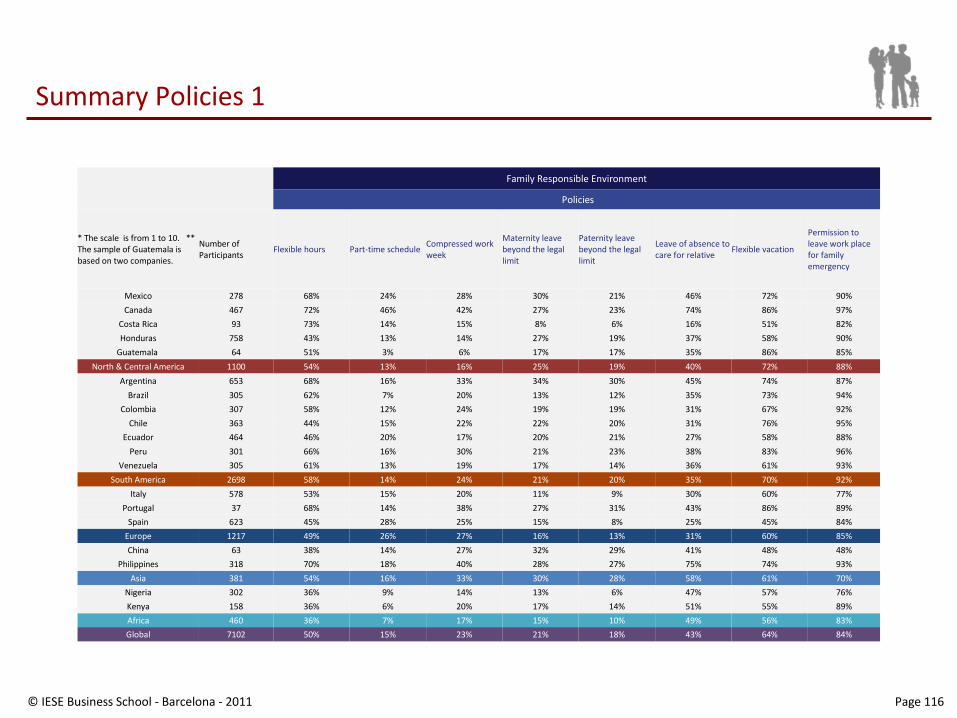
Summary Policies 1
Family Responsible Environment
Policies
* The scale is from 1 to 10. ** The sample of Guatemala is based on two companies.
Number of Participants
Flexible hours Part-time scheduleCompressed work week
Maternity leave beyond the legal limit
Paternity leave beyond the legal limit
Leave of absence to care for relative
Flexible vacation
Permission to leave work place for family emergency
Mexico 278 68% 24% 28% 30% 21% 46% 72% 90%
Canada 467 72% 46% 42% 27% 23% 74% 86% 97%
Costa Rica 93 73% 14% 15% 8% 6% 16% 51% 82%
Honduras 758 43% 13% 14% 27% 19% 37% 58% 90%
Guatemala 64 51% 3% 6% 17% 17% 35% 86% 85%
North & Central America 1100 54% 13% 16% 25% 19% 40% 72% 88%
Argentina 653 68% 16% 33% 34% 30% 45% 74% 87%
Brazil 305 62% 7% 20% 13% 12% 35% 73% 94%
Colombia 307 58% 12% 24% 19% 19% 31% 67% 92%
Chile 363 44% 15% 22% 22% 20% 31% 76% 95%
Ecuador 464 46% 20% 17% 20% 21% 27% 58% 88%
Peru 301 66% 16% 30% 21% 23% 38% 83% 96%
Venezuela 305 61% 13% 19% 17% 14% 36% 61% 93%
South America 2698 58% 14% 24% 21% 20% 35% 70% 92%
Italy 578 53% 15% 20% 11% 9% 30% 60% 77%
Portugal 37 68% 14% 38% 27% 31% 43% 86% 89%
Spain 623 45% 28% 25% 15% 8% 25% 45% 84%
Europe 1217 49% 26% 27% 16% 13% 31% 60% 85%
China 63 38% 14% 27% 32% 29% 41% 48% 48%
Philippines 318 70% 18% 40% 28% 27% 75% 74% 93%
Asia 381 54% 16% 33% 30% 28% 58% 61% 70%
Nigeria 302 36% 9% 14% 13% 6% 47% 57% 76%
Kenya 158 36% 6% 20% 17% 14% 51% 55% 89%
Africa 460 36% 7% 17% 15% 10% 49% 56% 83%
Global 7102 50% 15% 23% 21% 18% 43% 64% 84%
© IESE Business School - Barcelona - 2011 Page 117
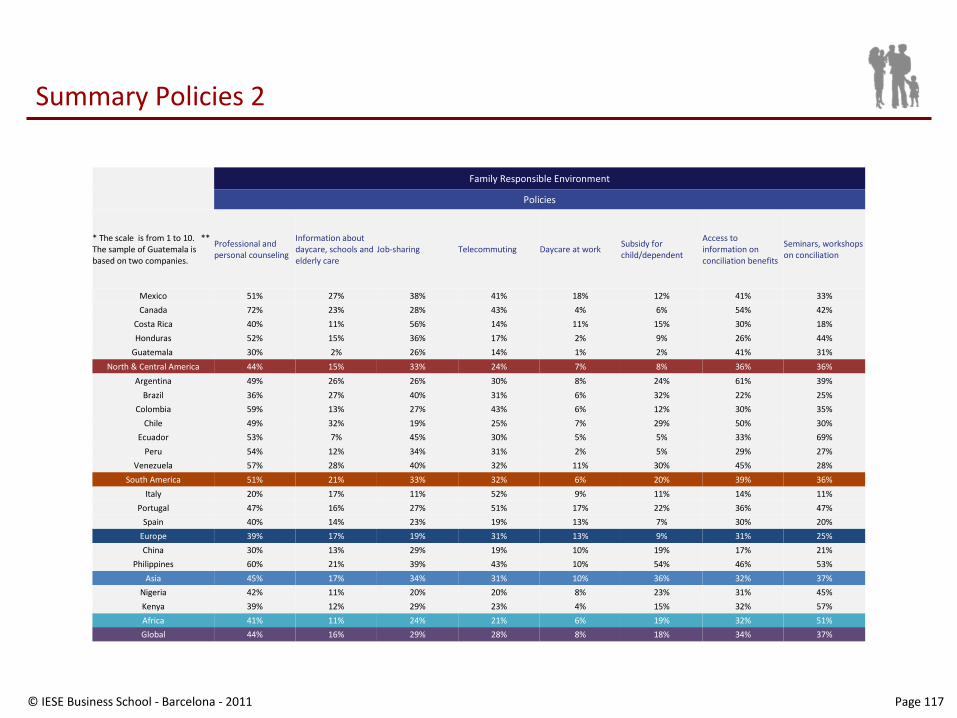
Summary Policies 2
Family Responsible Environment
Policies
* The scale is from 1 to 10. ** The sample of Guatemala is based on two companies.
Professional and personal counseling
Information about daycare, schools and elderly care
Job-sharing Telecommuting Daycare at workSubsidy for child/dependent
Access to information on conciliation benefits
Seminars, workshops on conciliation
Mexico 51% 27% 38% 41% 18% 12% 41% 33%
Canada 72% 23% 28% 43% 4% 6% 54% 42%
Costa Rica 40% 11% 56% 14% 11% 15% 30% 18%
Honduras 52% 15% 36% 17% 2% 9% 26% 44%
Guatemala 30% 2% 26% 14% 1% 2% 41% 31%
North & Central America 44% 15% 33% 24% 7% 8% 36% 36%
Argentina 49% 26% 26% 30% 8% 24% 61% 39%
Brazil 36% 27% 40% 31% 6% 32% 22% 25%
Colombia 59% 13% 27% 43% 6% 12% 30% 35%
Chile 49% 32% 19% 25% 7% 29% 50% 30%
Ecuador 53% 7% 45% 30% 5% 5% 33% 69%
Peru 54% 12% 34% 31% 2% 5% 29% 27%
Venezuela 57% 28% 40% 32% 11% 30% 45% 28%
South America 51% 21% 33% 32% 6% 20% 39% 36%
Italy 20% 17% 11% 52% 9% 11% 14% 11%
Portugal 47% 16% 27% 51% 17% 22% 36% 47%
Spain 40% 14% 23% 19% 13% 7% 30% 20%
Europe 39% 17% 19% 31% 13% 9% 31% 25%
China 30% 13% 29% 19% 10% 19% 17% 21%
Philippines 60% 21% 39% 43% 10% 54% 46% 53%
Asia 45% 17% 34% 31% 10% 36% 32% 37%
Nigeria 42% 11% 20% 20% 8% 23% 31% 45%
Kenya 39% 12% 29% 23% 4% 15% 32% 57%
Africa 41% 11% 24% 21% 6% 19% 32% 51%
Global 44% 16% 29% 28% 8% 18% 34% 37%
© IESE Business School - Barcelona - 2011 Page 118
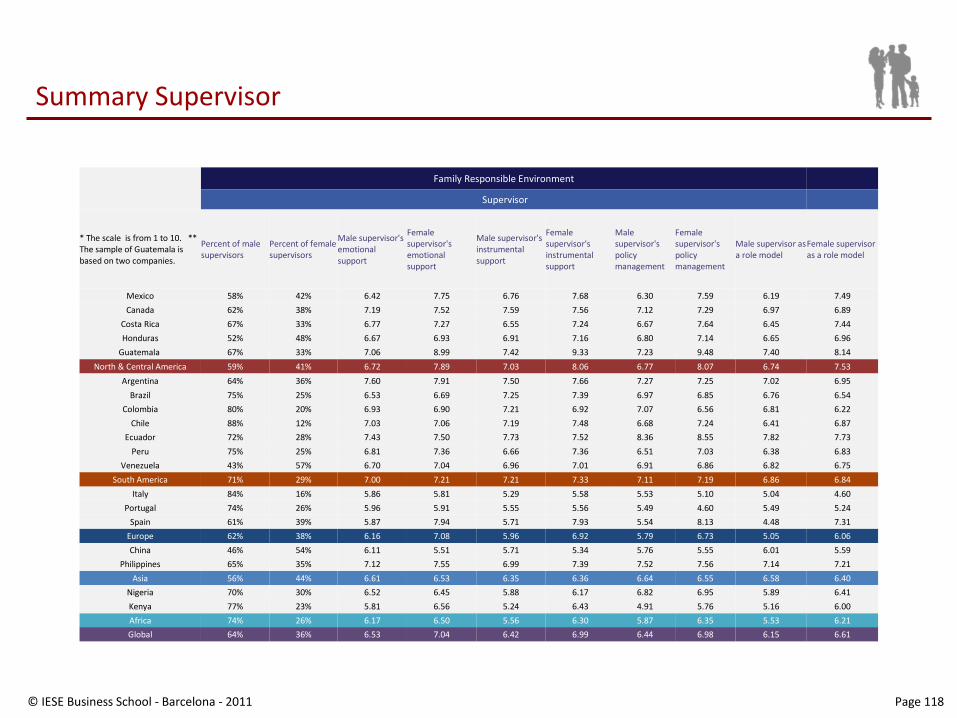
Summary Supervisor
Family Responsible Environment
Supervisor
* The scale is from 1 to 10. ** The sample of Guatemala is based on two companies.
Percent of male supervisors
Percent of female supervisors
Male supervisor's emotional support
Female supervisor's emotional support
Male supervisor's instrumental support
Female supervisor's instrumental support
Male supervisor's policy management
Female supervisor's policy management
Male supervisor as a role model
Female supervisor as a role model
Mexico 58% 42% 6.42 7.75 6.76 7.68 6.30 7.59 6.19 7.49
Canada 62% 38% 7.19 7.52 7.59 7.56 7.12 7.29 6.97 6.89
Costa Rica 67% 33% 6.77 7.27 6.55 7.24 6.67 7.64 6.45 7.44
Honduras 52% 48% 6.67 6.93 6.91 7.16 6.80 7.14 6.65 6.96
Guatemala 67% 33% 7.06 8.99 7.42 9.33 7.23 9.48 7.40 8.14
North & Central America 59% 41% 6.72 7.89 7.03 8.06 6.77 8.07 6.74 7.53
Argentina 64% 36% 7.60 7.91 7.50 7.66 7.27 7.25 7.02 6.95
Brazil 75% 25% 6.53 6.69 7.25 7.39 6.97 6.85 6.76 6.54
Colombia 80% 20% 6.93 6.90 7.21 6.92 7.07 6.56 6.81 6.22
Chile 88% 12% 7.03 7.06 7.19 7.48 6.68 7.24 6.41 6.87
Ecuador 72% 28% 7.43 7.50 7.73 7.52 8.36 8.55 7.82 7.73
Peru 75% 25% 6.81 7.36 6.66 7.36 6.51 7.03 6.38 6.83
Venezuela 43% 57% 6.70 7.04 6.96 7.01 6.91 6.86 6.82 6.75
South America 71% 29% 7.00 7.21 7.21 7.33 7.11 7.19 6.86 6.84
Italy 84% 16% 5.86 5.81 5.29 5.58 5.53 5.10 5.04 4.60
Portugal 74% 26% 5.96 5.91 5.55 5.56 5.49 4.60 5.49 5.24
Spain 61% 39% 5.87 7.94 5.71 7.93 5.54 8.13 4.48 7.31
Europe 62% 38% 6.16 7.08 5.96 6.92 5.79 6.73 5.05 6.06
China 46% 54% 6.11 5.51 5.71 5.34 5.76 5.55 6.01 5.59
Philippines 65% 35% 7.12 7.55 6.99 7.39 7.52 7.56 7.14 7.21
Asia 56% 44% 6.61 6.53 6.35 6.36 6.64 6.55 6.58 6.40
Nigeria 70% 30% 6.52 6.45 5.88 6.17 6.82 6.95 5.89 6.41
Kenya 77% 23% 5.81 6.56 5.24 6.43 4.91 5.76 5.16 6.00
Africa 74% 26% 6.17 6.50 5.56 6.30 5.87 6.35 5.53 6.21
Global 64% 36% 6.53 7.04 6.42 6.99 6.44 6.98 6.15 6.61
© IESE Business School - Barcelona - 2011 Page 119
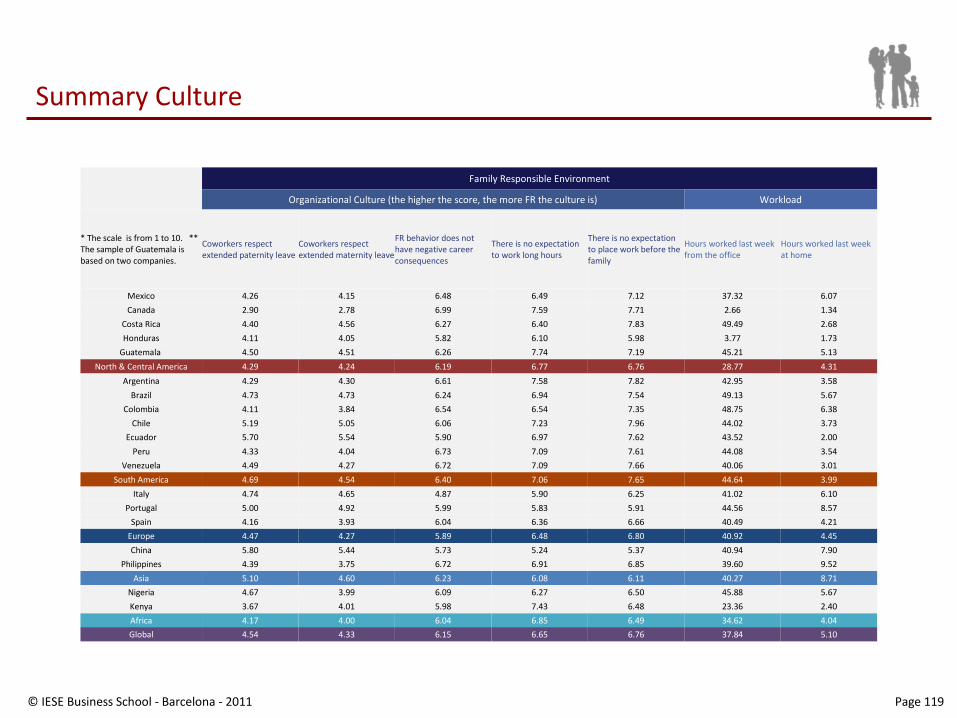
Summary Culture
Family Responsible Environment
Organizational Culture (the higher the score, the more FR the culture is) Workload
* The scale is from 1 to 10. ** The sample of Guatemala is based on two companies.
Coworkers respect extended paternity leave
Coworkers respect extended maternity leave
FR behavior does not have negative career consequences
There is no expectation to work long hours
There is no expectation to place work before the family
Hours worked last week from the office
Hours worked last week at home
Mexico 4.26 4.15 6.48 6.49 7.12 37.32 6.07
Canada 2.90 2.78 6.99 7.59 7.71 2.66 1.34
Costa Rica 4.40 4.56 6.27 6.40 7.83 49.49 2.68
Honduras 4.11 4.05 5.82 6.10 5.98 3.77 1.73
Guatemala 4.50 4.51 6.26 7.74 7.19 45.21 5.13
North & Central America 4.29 4.24 6.19 6.77 6.76 28.77 4.31
Argentina 4.29 4.30 6.61 7.58 7.82 42.95 3.58
Brazil 4.73 4.73 6.24 6.94 7.54 49.13 5.67
Colombia 4.11 3.84 6.54 6.54 7.35 48.75 6.38
Chile 5.19 5.05 6.06 7.23 7.96 44.02 3.73
Ecuador 5.70 5.54 5.90 6.97 7.62 43.52 2.00
Peru 4.33 4.04 6.73 7.09 7.61 44.08 3.54
Venezuela 4.49 4.27 6.72 7.09 7.66 40.06 3.01
South America 4.69 4.54 6.40 7.06 7.65 44.64 3.99
Italy 4.74 4.65 4.87 5.90 6.25 41.02 6.10
Portugal 5.00 4.92 5.99 5.83 5.91 44.56 8.57
Spain 4.16 3.93 6.04 6.36 6.66 40.49 4.21
Europe 4.47 4.27 5.89 6.48 6.80 40.92 4.45
China 5.80 5.44 5.73 5.24 5.37 40.94 7.90
Philippines 4.39 3.75 6.72 6.91 6.85 39.60 9.52
Asia 5.10 4.60 6.23 6.08 6.11 40.27 8.71
Nigeria 4.67 3.99 6.09 6.27 6.50 45.88 5.67
Kenya 3.67 4.01 5.98 7.43 6.48 23.36 2.40
Africa 4.17 4.00 6.04 6.85 6.49 34.62 4.04
Global 4.54 4.33 6.15 6.65 6.76 37.84 5.10
© IESE Business School - Barcelona - 2011 Page 120
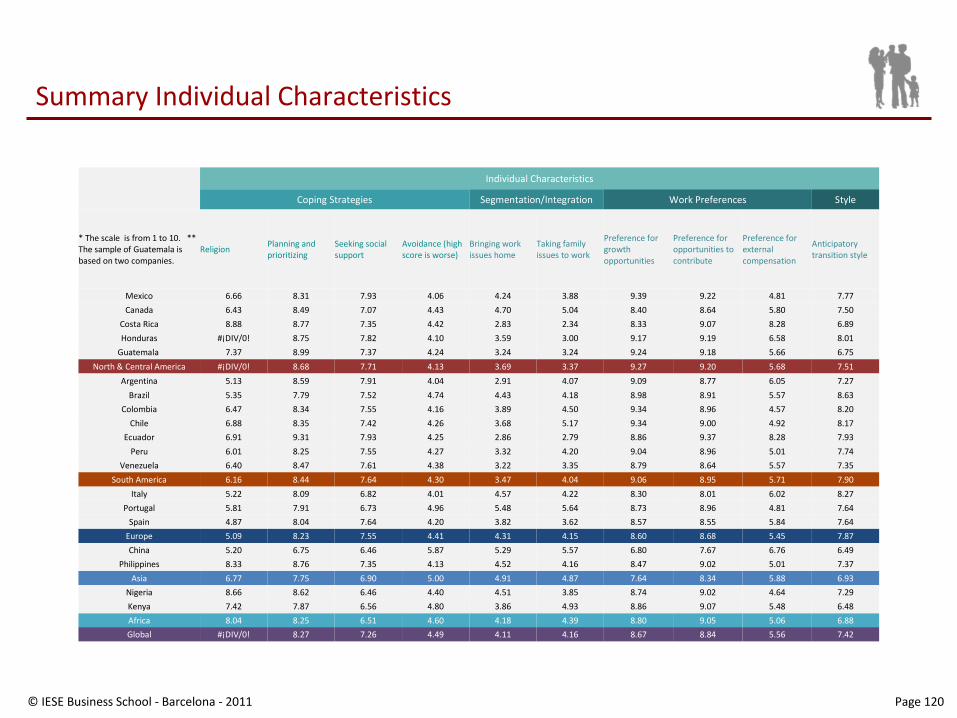
Summary Individual Characteristics
Individual Characteristics
Coping Strategies Segmentation/Integration Work Preferences Style
* The scale is from 1 to 10. ** The sample of Guatemala is based on two companies.
ReligionPlanning and prioritizing
Seeking social support
Avoidance (high score is worse)
Bringing work issues home
Taking family issues to work
Preference for growth opportunities
Preference for opportunities to contribute
Preference for external compensation
Anticipatory transition style
Mexico 6.66 8.31 7.93 4.06 4.24 3.88 9.39 9.22 4.81 7.77
Canada 6.43 8.49 7.07 4.43 4.70 5.04 8.40 8.64 5.80 7.50
Costa Rica 8.88 8.77 7.35 4.42 2.83 2.34 8.33 9.07 8.28 6.89
Honduras #¡DIV/0! 8.75 7.82 4.10 3.59 3.00 9.17 9.19 6.58 8.01
Guatemala 7.37 8.99 7.37 4.24 3.24 3.24 9.24 9.18 5.66 6.75
North & Central America #¡DIV/0! 8.68 7.71 4.13 3.69 3.37 9.27 9.20 5.68 7.51
Argentina 5.13 8.59 7.91 4.04 2.91 4.07 9.09 8.77 6.05 7.27
Brazil 5.35 7.79 7.52 4.74 4.43 4.18 8.98 8.91 5.57 8.63
Colombia 6.47 8.34 7.55 4.16 3.89 4.50 9.34 8.96 4.57 8.20
Chile 6.88 8.35 7.42 4.26 3.68 5.17 9.34 9.00 4.92 8.17
Ecuador 6.91 9.31 7.93 4.25 2.86 2.79 8.86 9.37 8.28 7.93
Peru 6.01 8.25 7.55 4.27 3.32 4.20 9.04 8.96 5.01 7.74
Venezuela 6.40 8.47 7.61 4.38 3.22 3.35 8.79 8.64 5.57 7.35
South America 6.16 8.44 7.64 4.30 3.47 4.04 9.06 8.95 5.71 7.90
Italy 5.22 8.09 6.82 4.01 4.57 4.22 8.30 8.01 6.02 8.27
Portugal 5.81 7.91 6.73 4.96 5.48 5.64 8.73 8.96 4.81 7.64
Spain 4.87 8.04 7.64 4.20 3.82 3.62 8.57 8.55 5.84 7.64
Europe 5.09 8.23 7.55 4.41 4.31 4.15 8.60 8.68 5.45 7.87
China 5.20 6.75 6.46 5.87 5.29 5.57 6.80 7.67 6.76 6.49
Philippines 8.33 8.76 7.35 4.13 4.52 4.16 8.47 9.02 5.01 7.37
Asia 6.77 7.75 6.90 5.00 4.91 4.87 7.64 8.34 5.88 6.93
Nigeria 8.66 8.62 6.46 4.40 4.51 3.85 8.74 9.02 4.64 7.29
Kenya 7.42 7.87 6.56 4.80 3.86 4.93 8.86 9.07 5.48 6.48
Africa 8.04 8.25 6.51 4.60 4.18 4.39 8.80 9.05 5.06 6.88
Global #¡DIV/0! 8.27 7.26 4.49 4.11 4.16 8.67 8.84 5.56 7.42
© IESE Business School - Barcelona - 2011 Page 121
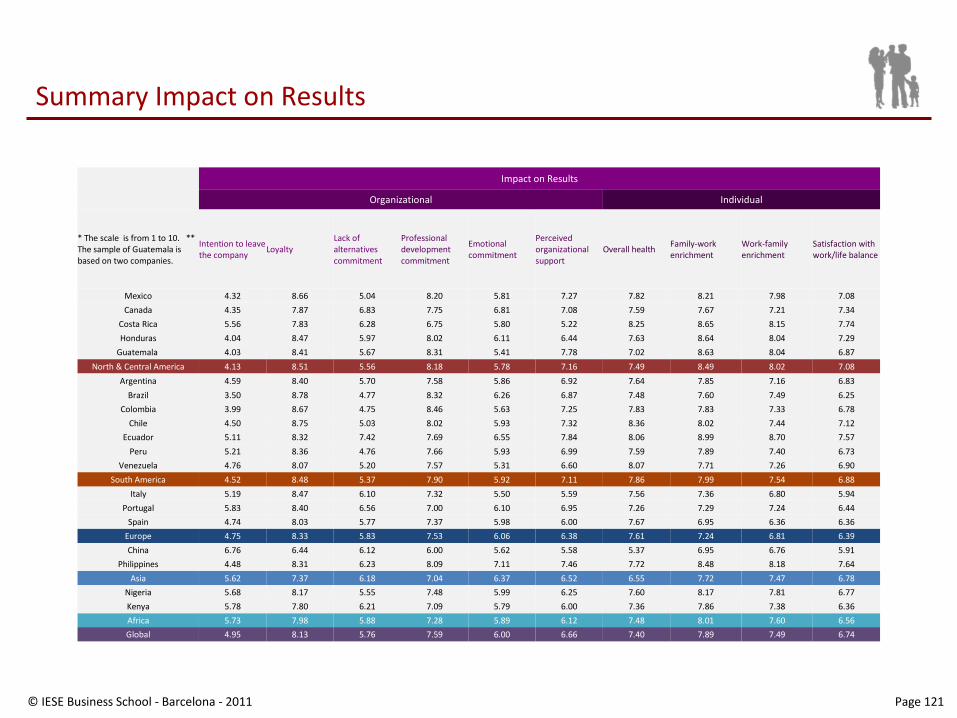
Summary Impact on Results
Impact on Results
Organizational Individual
* The scale is from 1 to 10. ** The sample of Guatemala is based on two companies.
Intention to leave the company
LoyaltyLack of alternatives commitment
Professional development commitment
Emotional commitment
Perceived organizational support
Overall health Family-work enrichment
Work-family enrichment
Satisfaction with work/life balance
Mexico 4.32 8.66 5.04 8.20 5.81 7.27 7.82 8.21 7.98 7.08
Canada 4.35 7.87 6.83 7.75 6.81 7.08 7.59 7.67 7.21 7.34
Costa Rica 5.56 7.83 6.28 6.75 5.80 5.22 8.25 8.65 8.15 7.74
Honduras 4.04 8.47 5.97 8.02 6.11 6.44 7.63 8.64 8.04 7.29
Guatemala 4.03 8.41 5.67 8.31 5.41 7.78 7.02 8.63 8.04 6.87
North & Central America 4.13 8.51 5.56 8.18 5.78 7.16 7.49 8.49 8.02 7.08
Argentina 4.59 8.40 5.70 7.58 5.86 6.92 7.64 7.85 7.16 6.83
Brazil 3.50 8.78 4.77 8.32 6.26 6.87 7.48 7.60 7.49 6.25
Colombia 3.99 8.67 4.75 8.46 5.63 7.25 7.83 7.83 7.33 6.78
Chile 4.50 8.75 5.03 8.02 5.93 7.32 8.36 8.02 7.44 7.12
Ecuador 5.11 8.32 7.42 7.69 6.55 7.84 8.06 8.99 8.70 7.57
Peru 5.21 8.36 4.76 7.66 5.93 6.99 7.59 7.89 7.40 6.73
Venezuela 4.76 8.07 5.20 7.57 5.31 6.60 8.07 7.71 7.26 6.90
South America 4.52 8.48 5.37 7.90 5.92 7.11 7.86 7.99 7.54 6.88
Italy 5.19 8.47 6.10 7.32 5.50 5.59 7.56 7.36 6.80 5.94
Portugal 5.83 8.40 6.56 7.00 6.10 6.95 7.26 7.29 7.24 6.44
Spain 4.74 8.03 5.77 7.37 5.98 6.00 7.67 6.95 6.36 6.36
Europe 4.75 8.33 5.83 7.53 6.06 6.38 7.61 7.24 6.81 6.39
China 6.76 6.44 6.12 6.00 5.62 5.58 5.37 6.95 6.76 5.91
Philippines 4.48 8.31 6.23 8.09 7.11 7.46 7.72 8.48 8.18 7.64
Asia 5.62 7.37 6.18 7.04 6.37 6.52 6.55 7.72 7.47 6.78
Nigeria 5.68 8.17 5.55 7.48 5.99 6.25 7.60 8.17 7.81 6.77
Kenya 5.78 7.80 6.21 7.09 5.79 6.00 7.36 7.86 7.38 6.36
Africa 5.73 7.98 5.88 7.28 5.89 6.12 7.48 8.01 7.60 6.56
Global 4.95 8.13 5.76 7.59 6.00 6.66 7.40 7.89 7.49 6.74
© IESE Business School - Barcelona - 2011 Page 122
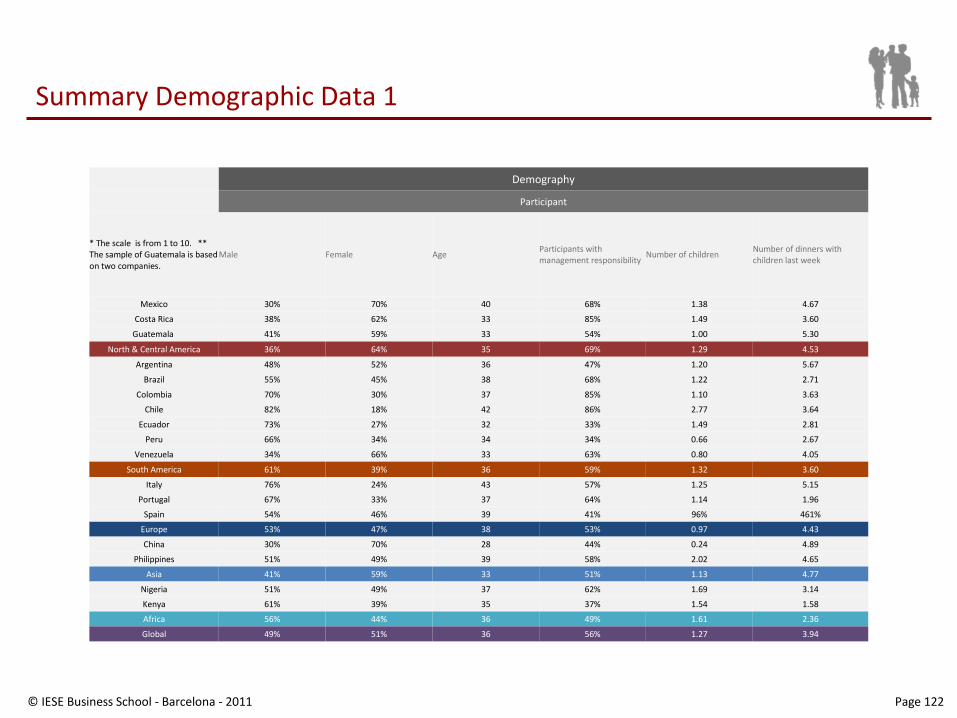
Summary Demographic Data 1
Demography
Participant
* The scale is from 1 to 10. ** The sample of Guatemala is based on two companies.
Male Female AgeParticipants with management responsibility
Number of childrenNumber of dinners with children last week
Mexico 30% 70% 40 68% 1.38 4.67
Costa Rica 38% 62% 33 85% 1.49 3.60
Guatemala 41% 59% 33 54% 1.00 5.30
North & Central America 36% 64% 35 69% 1.29 4.53
Argentina 48% 52% 36 47% 1.20 5.67
Brazil 55% 45% 38 68% 1.22 2.71
Colombia 70% 30% 37 85% 1.10 3.63
Chile 82% 18% 42 86% 2.77 3.64
Ecuador 73% 27% 32 33% 1.49 2.81
Peru 66% 34% 34 34% 0.66 2.67
Venezuela 34% 66% 33 63% 0.80 4.05
South America 61% 39% 36 59% 1.32 3.60
Italy 76% 24% 43 57% 1.25 5.15
Portugal 67% 33% 37 64% 1.14 1.96
Spain 54% 46% 39 41% 96% 461%
Europe 53% 47% 38 53% 0.97 4.43
China 30% 70% 28 44% 0.24 4.89
Philippines 51% 49% 39 58% 2.02 4.65
Asia 41% 59% 33 51% 1.13 4.77
Nigeria 51% 49% 37 62% 1.69 3.14
Kenya 61% 39% 35 37% 1.54 1.58
Africa 56% 44% 36 49% 1.61 2.36
Global 49% 51% 36 56% 1.27 3.94
© IESE Business School - Barcelona - 2011 Page 123
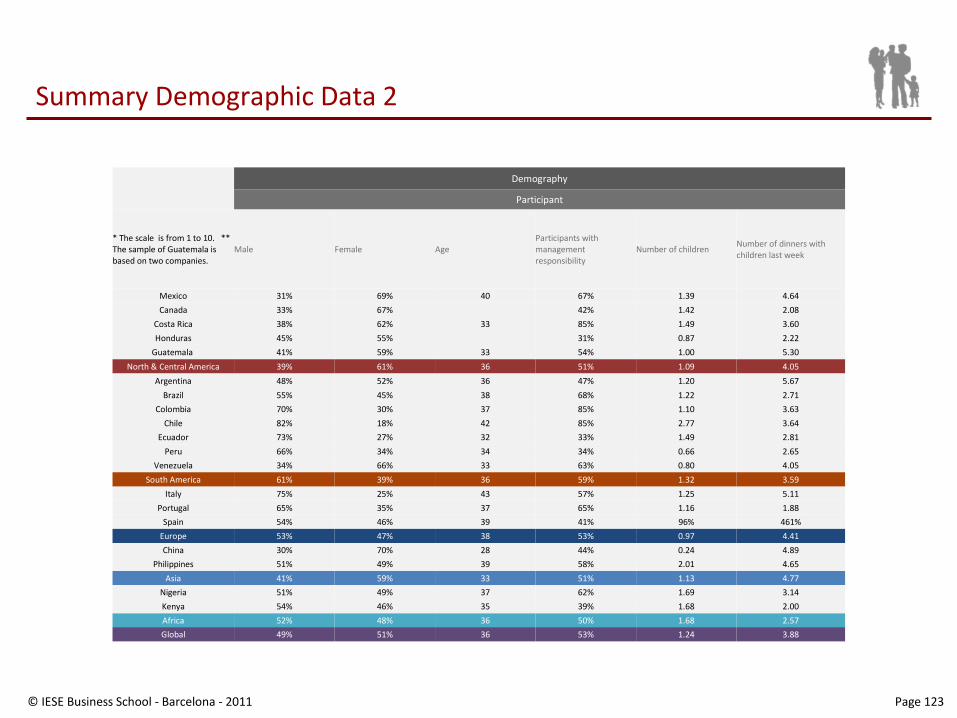
Summary Demographic Data 2
Demography
Participant
* The scale is from 1 to 10. ** The sample of Guatemala is based on two companies.
Male Female AgeParticipants with management responsibility
Number of childrenNumber of dinners with children last week
Mexico 31% 69% 40 67% 1.39 4.64
Canada 33% 67% 42% 1.42 2.08
Costa Rica 38% 62% 33 85% 1.49 3.60
Honduras 45% 55% 31% 0.87 2.22
Guatemala 41% 59% 33 54% 1.00 5.30
North & Central America 39% 61% 36 51% 1.09 4.05
Argentina 48% 52% 36 47% 1.20 5.67
Brazil 55% 45% 38 68% 1.22 2.71
Colombia 70% 30% 37 85% 1.10 3.63
Chile 82% 18% 42 85% 2.77 3.64
Ecuador 73% 27% 32 33% 1.49 2.81
Peru 66% 34% 34 34% 0.66 2.65
Venezuela 34% 66% 33 63% 0.80 4.05
South America 61% 39% 36 59% 1.32 3.59
Italy 75% 25% 43 57% 1.25 5.11
Portugal 65% 35% 37 65% 1.16 1.88
Spain 54% 46% 39 41% 96% 461%
Europe 53% 47% 38 53% 0.97 4.41
China 30% 70% 28 44% 0.24 4.89
Philippines 51% 49% 39 58% 2.01 4.65
Asia 41% 59% 33 51% 1.13 4.77
Nigeria 51% 49% 37 62% 1.69 3.14
Kenya 54% 46% 35 39% 1.68 2.00
Africa 52% 48% 36 50% 1.68 2.57
Global 49% 51% 36 53% 1.24 3.88
© IESE Business School - Barcelona - 2011 Page 124© IESE Business School - Barcelona - 2011
Partners (I/II)
IAE Universidad Austral
Argentina
Work & Family Foundation
Canada
Universidad de la Sabana
Colombia
Universidad de los AndesChile
Instituto Superior de Empresa
Brazil
La Empresa y la Familia
Costa Rica
Instituto de Desarrollo
EmpresarialEcuador
ELISItaly
Universidad del Istmo
Guatemala
Fundación EmprepasEl Salvador
University of MacauChina
Politecnico MilanItaly
© IESE Business School - Barcelona - 2011 Page 125© IESE Business School - Barcelona - 2011
Partners (II/II)
Strathmore Business School
Kenya
Eramus University Rotterdam
Netherlands
Lagos Business School
Nigeria
The University of Waikato
New Zealand
Universidad Pan-Americana
Mexico
Escuela de Dirección Universidad de Piura
Peru
Escola de Direcção e Negócios
Portugal
Universidad MonteávilaVenezuela
University of Asia and the Pacific
Philippines
© IESE Business School - Barcelona - 2011 Page 126
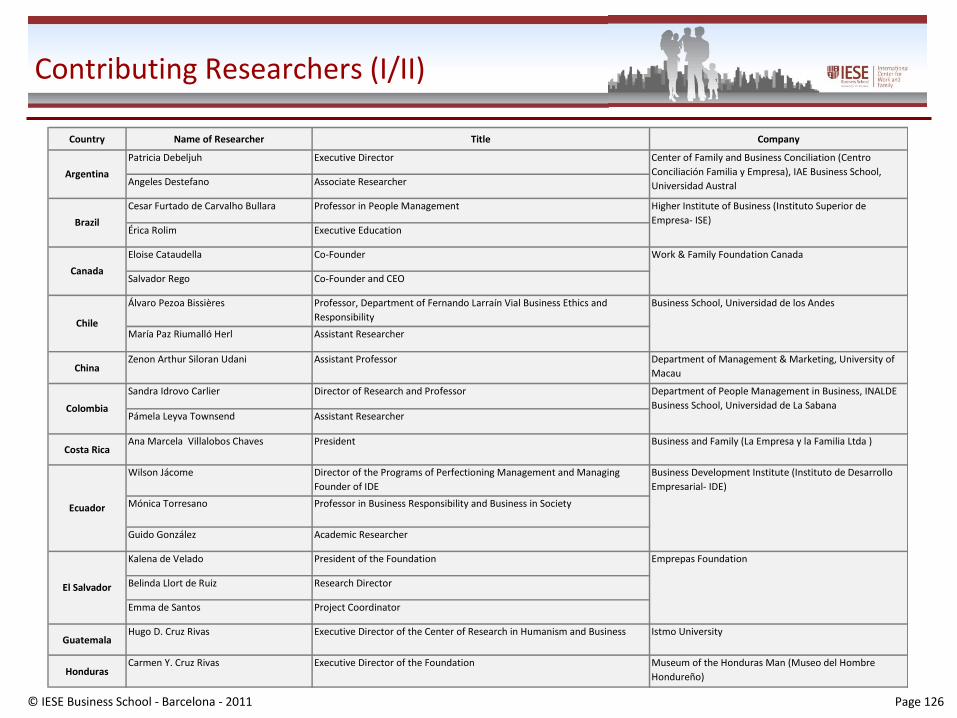
Contributing Researchers (I/II)
Country Name of Researcher Title Company
Patricia Debeljuh Executive Director
Angeles Destefano Associate Researcher
Cesar Furtado de Carvalho Bullara Professor in People Management
Érica Rolim Executive Education
Eloise Cataudella Co-Founder
Salvador Rego Co-Founder and CEO
Álvaro Pezoa Bissières Professor, Department of Fernando Larraín Vial Business Ethics and Responsibility
María Paz Riumalló Herl Assistant Researcher
ChinaZenon Arthur Siloran Udani Assistant Professor Department of Management & Marketing, University of
Macau
Sandra Idrovo Carlier Director of Research and Professor
Pámela Leyva Townsend Assistant Researcher
Costa RicaAna Marcela Villalobos Chaves President Business and Family (La Empresa y la Familia Ltda )
Wilson Jácome Director of the Programs of Perfectioning Management and Managing Founder of IDE
Mónica Torresano Professor in Business Responsibility and Business in Society
Guido González Academic Researcher
Kalena de Velado President of the Foundation
Belinda Llort de Ruiz Research Director
Emma de Santos Project Coordinator
GuatemalaHugo D. Cruz Rivas Executive Director of the Center of Research in Humanism and Business Istmo University
HondurasCarmen Y. Cruz Rivas Executive Director of the Foundation Museum of the Honduras Man (Museo del Hombre
Hondureño)
El Salvador
Emprepas Foundation
Chile
Business School, Universidad de los Andes
Colombia
Department of People Management in Business, INALDE Business School, Universidad de La Sabana
Ecuador
Business Development Institute (Instituto de Desarrollo Empresarial- IDE)
Argentina
Center of Family and Business Conciliation (Centro Conciliación Familia y Empresa), IAE Business School, Universidad Austral
Brazil
Higher Institute of Business (Instituto Superior de Empresa- ISE)
Canada
Work & Family Foundation Canada
© IESE Business School - Barcelona - 2011 Page 127
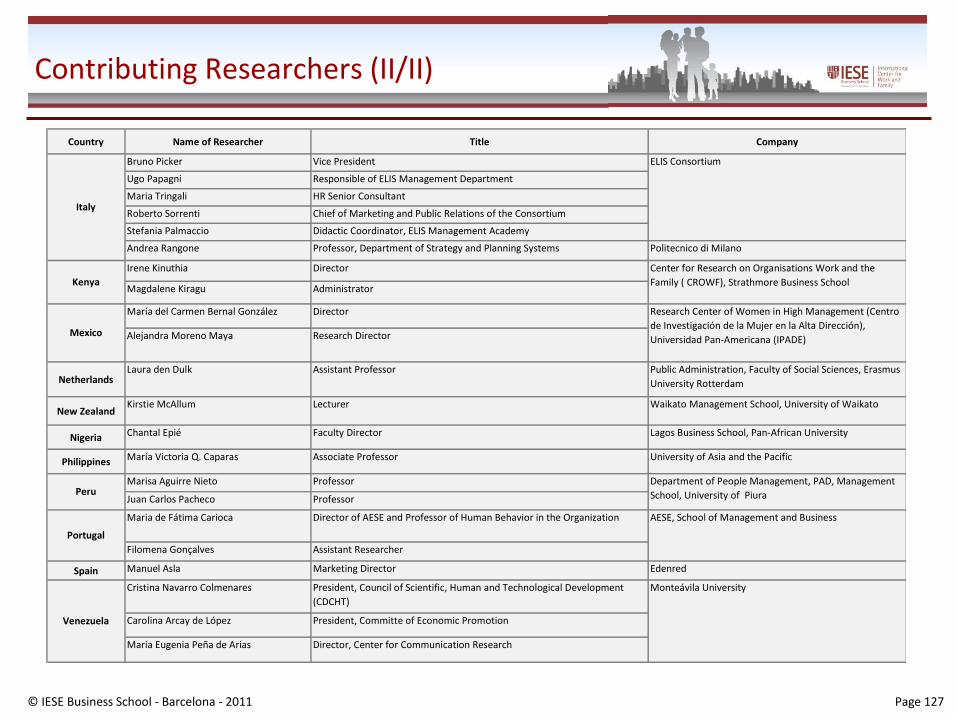
Contributing Researchers (II/II)
Country Name of Researcher Title Company
Bruno Picker Vice President
Ugo Papagni Responsible of ELIS Management Department
Maria Tringali HR Senior Consultant
Roberto Sorrenti Chief of Marketing and Public Relations of the Consortium
Stefania Palmaccio Didactic Coordinator, ELIS Management Academy
Andrea Rangone Professor, Department of Strategy and Planning Systems Politecnico di Milano
Irene Kinuthia Director
Magdalene Kiragu Administrator
María del Carmen Bernal González Director
Alejandra Moreno Maya Research Director
NetherlandsLaura den Dulk Assistant Professor Public Administration, Faculty of Social Sciences, Erasmus
University Rotterdam
New ZealandKirstie McAllum Lecturer Waikato Management School, University of Waikato
Nigeria Chantal Epié Faculty Director Lagos Business School, Pan-African University
Philippines María Victoria Q. Caparas Associate Professor University of Asia and the Pacific
Marisa Aguirre Nieto Professor
Juan Carlos Pacheco Professor
Maria de Fátima Carioca Director of AESE and Professor of Human Behavior in the Organization
Filomena Gonçalves Assistant Researcher
Spain Manuel Asla Marketing Director Edenred
Cristina Navarro Colmenares President, Council of Scientific, Human and Technological Development (CDCHT)
Carolina Arcay de López President, Committe of Economic Promotion
María Eugenia Peña de Arias Director, Center for Communication Research
Venezuela
Monteávila University
Italy
Mexico
Research Center of Women in High Management (Centro de Investigación de la Mujer en la Alta Dirección), Universidad Pan-Americana (IPADE)
PeruDepartment of People Management, PAD, Management School, University of Piura
Portugal
AESE, School of Management and Business
ELIS Consortium
KenyaCenter for Research on Organisations Work and the Family ( CROWF), Strathmore Business School

© IESE Business School - Barcelona - 2011 Page 128
IESE Family-Responsible environment (FRe) Index for the World Benchmark with the Philippines
Prof. Nuria Chinchilla Prof. Mireia Las Heras
Recommended


![Rapala. Catalogo 2011 [Canada]](https://img.pdfslide.net/doc/110x75/568bd86d1a28ab2034a34f30/rapala-catalogo-2011-canada.jpg)