In Silico Prediction of Toxicology - One Can't Embrace Unembraceable
Igor V. Tetko Helmholtz Zentrum München - German Research Center for Environmental Health (GmbH) Institute of Bioinformatics & Systems Biology
Praga, 4 September, marcus evans Predictive Toxicology 2009
Layout of presentation
Introduction: • Why accuracy of prediction is important?
Methods: • What is a Distance to Model? How can we estimate it? What is a property-based space?
Case study 1: Prediction of environmental toxicity
Case study 2: Benchmarking of lipophilicity (logP) predictions
Case study 3: AMES test prediction
Case study 4: CYP450 prediction
Case study 5: Prediction of in vivo acute rodent toxicity
Conclusions
Which common challenges do they face?
Kozma Prutkov
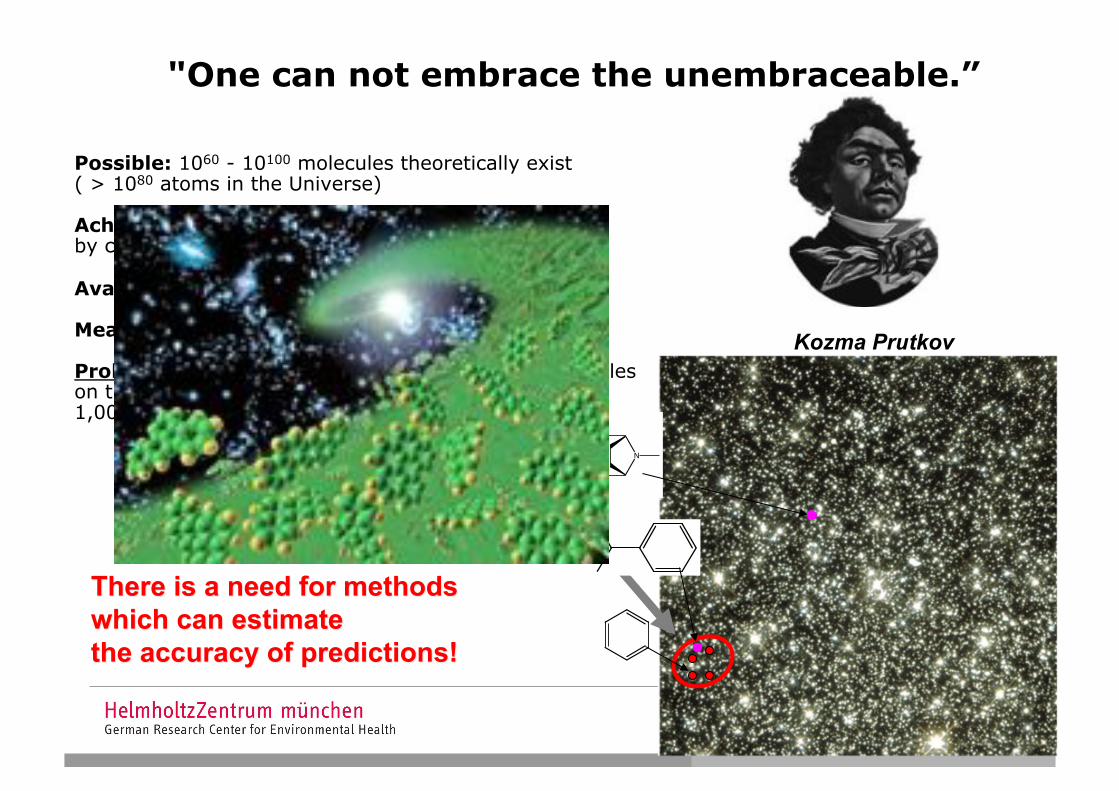
"One can not embrace the unembraceable.”
Possible: 1060 - 10100 molecules theoretically exist ( > 1080 atoms in the Universe)
Achievable: 1020 - 1024 can be synthesized now by companies (weight of the Moon is ca 1023 kg)
Available: 2*107 molecules are on the market
Measured: 102 - 105 molecules with ADME/T data
Problem: To predict ADME/T properties of just molecules on the market we must extrapolate data from one to 1,000 - 100,000 molecules!
NO
OOH
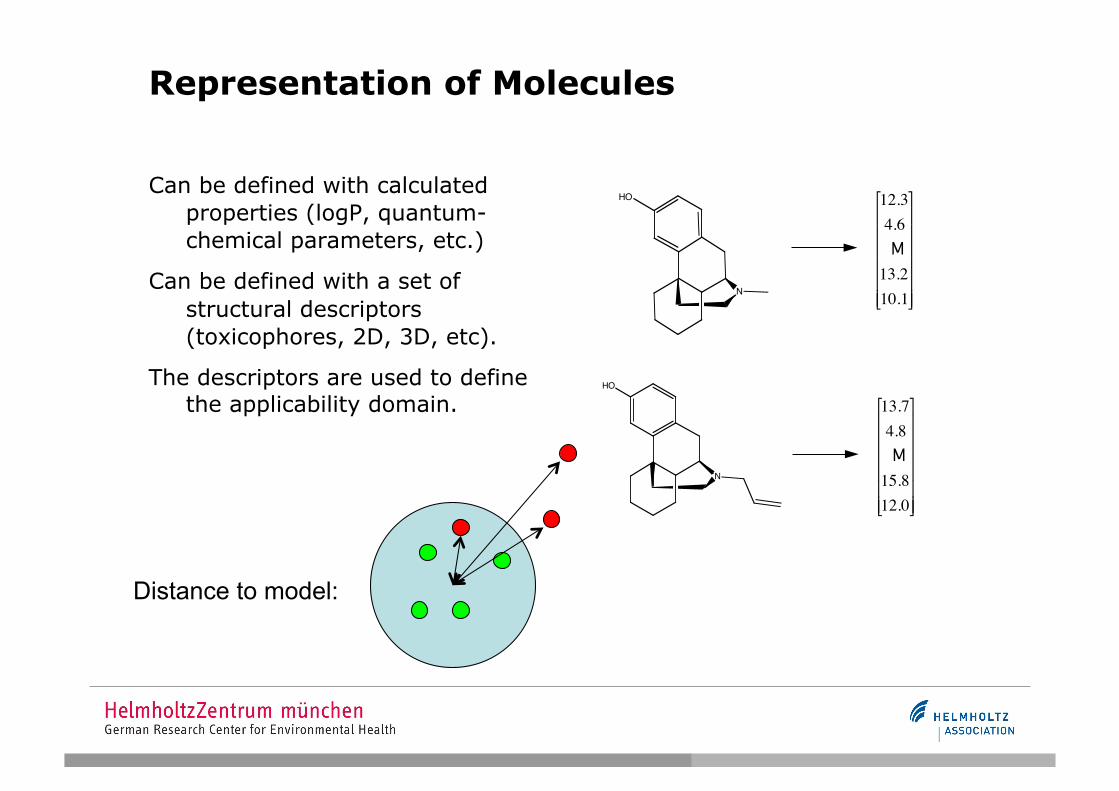
Representation of Molecules
Can be defined with calculated properties (logP, quantum-chemical parameters, etc.)
Can be defined with a set of structural descriptors (toxicophores, 2D, 3D, etc).
The descriptors are used to define the applicability domain.
!
12.34.6M
13.210.1
"
#
$ $ $ $ $ $
%
&
' ' ' ' ' ' N
HO
!
13.74.8M
15.812.0
"
#
$ $ $ $ $ $
%
&
' ' ' ' ' '
N
HO
Distance to model:
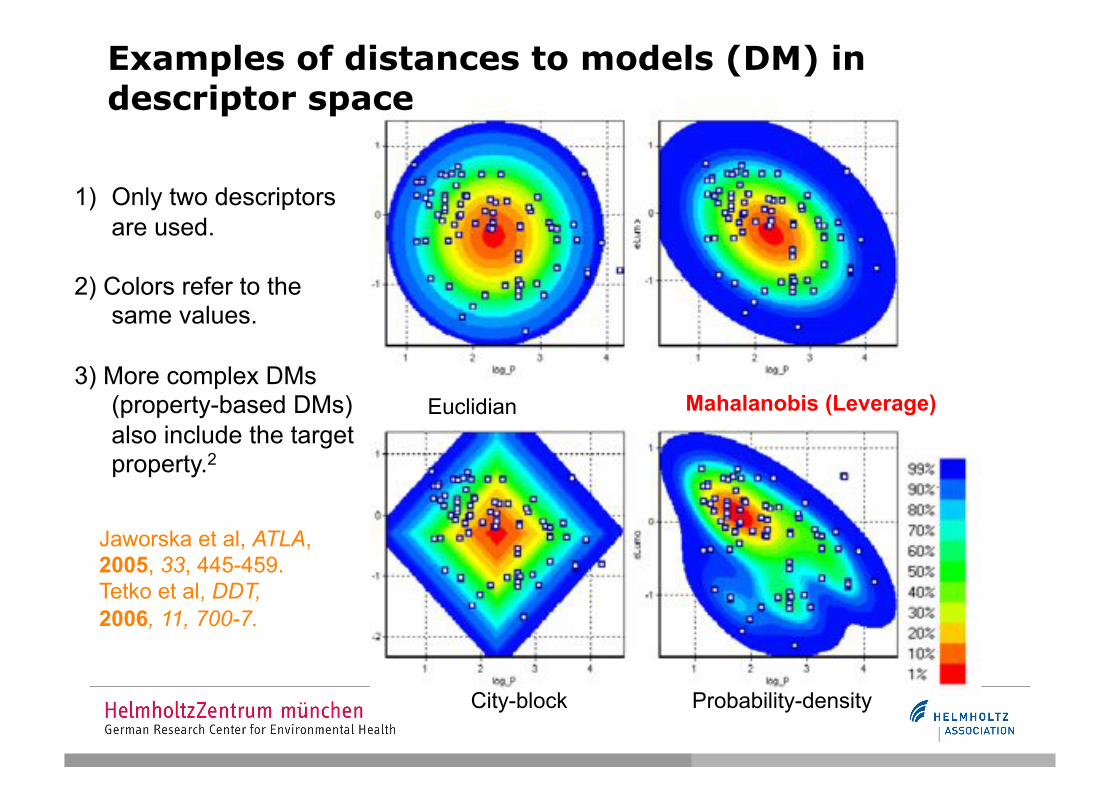
Examples of distances to models (DM) in descriptor space
Jaworska et al, ATLA, 2005, 33, 445-459. Tetko et al, DDT, 2006, 11, 700-7.
Euclidian Mahalanobis (Leverage)
City-block Probability-density
1) Only two descriptors are used.
2) Colors refer to the same values.
3) More complex DMs (property-based DMs) also include the target property.2
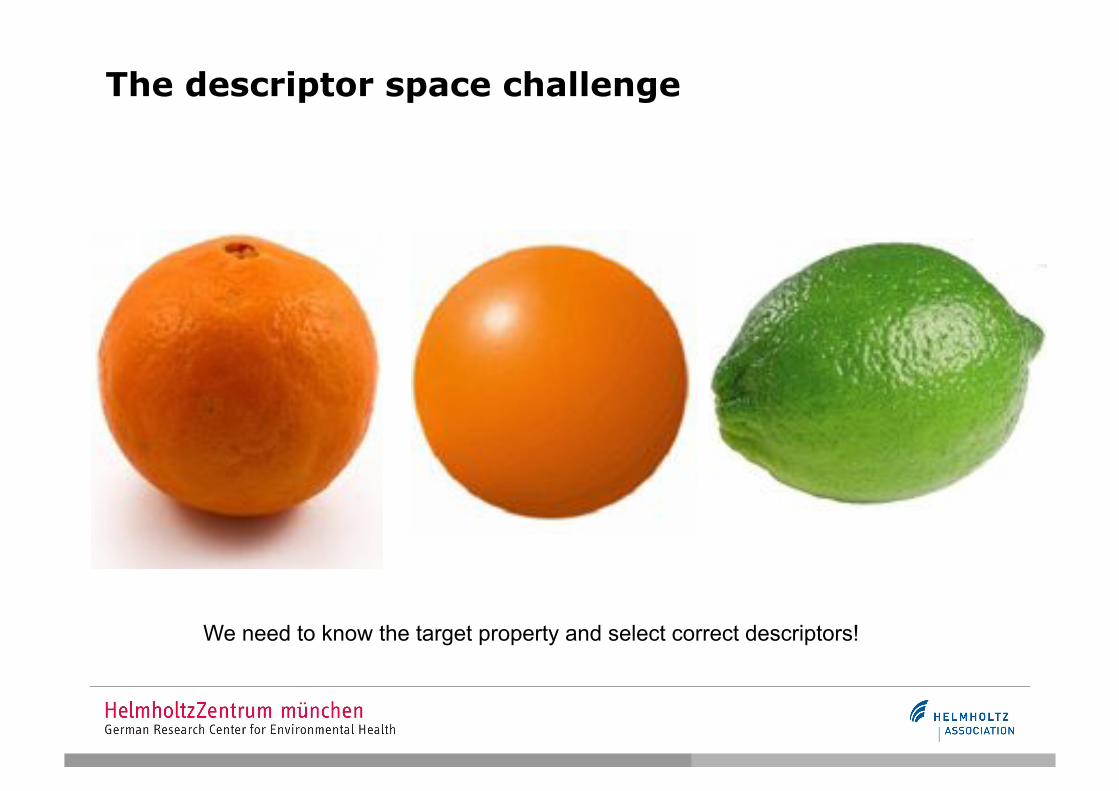
The descriptor space challenge
We need to know the target property and select correct descriptors!
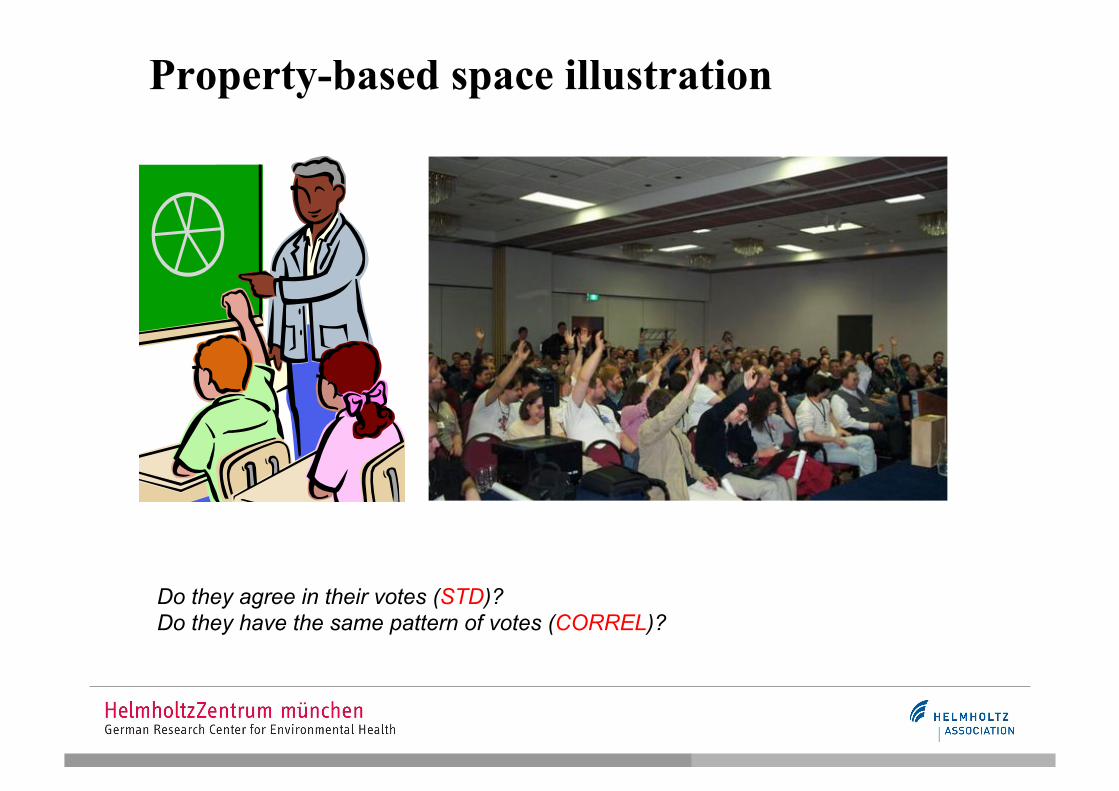
Property-based space illustration
Do they agree in their votes (STD)? Do they have the same pattern of votes (CORREL)?
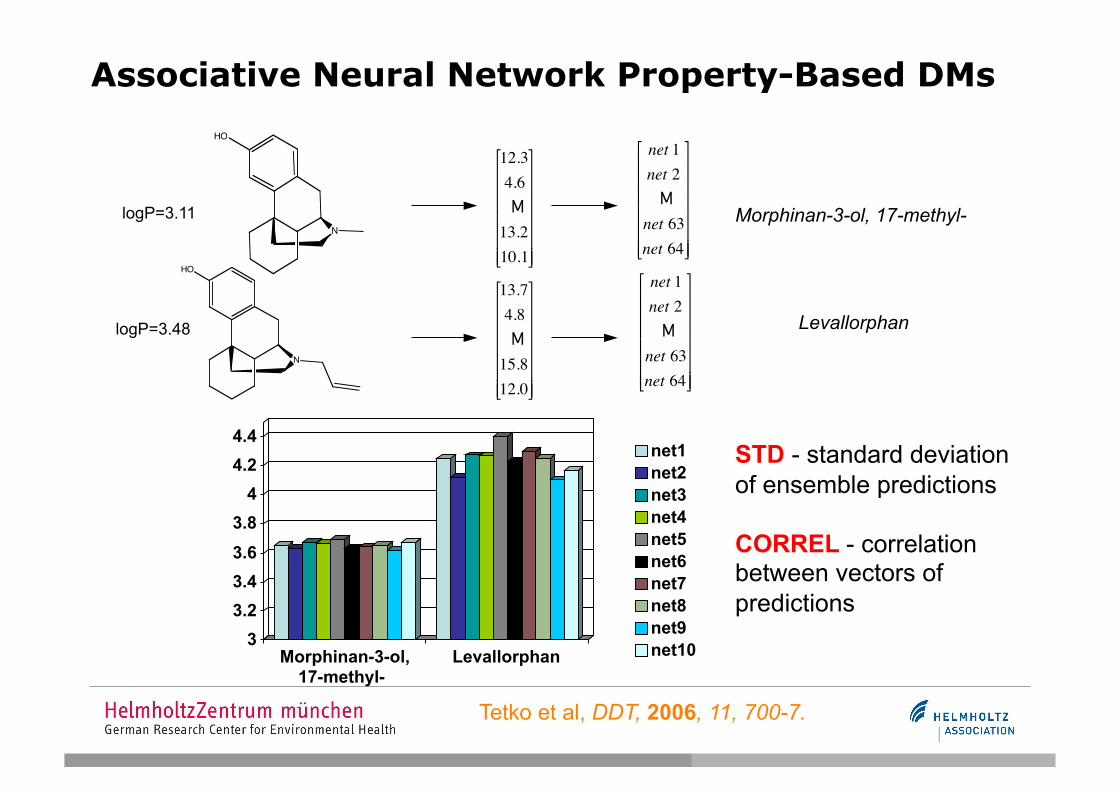
Associative Neural Network Property-Based DMs
!
12.34.6M
13.210.1
"
#
$ $ $ $ $ $
%
&
' ' ' ' ' '
!
net 1net 2
Mnet 63net 64
"
#
$ $ $ $ $ $
%
&
' ' ' ' ' '
3
3.2
3.4
3.6
3.8
4
4.2
4.4
Morphinan-3-ol,
17-methyl-
Levallorphan
net1
net2
net3
net4
net5
net6
net7
net8
net9
net10
!
13.74.8M
15.812.0
"
#
$ $ $ $ $ $
%
&
' ' ' ' ' '
!
net 1net 2
Mnet 63net 64
"
#
$ $ $ $ $ $
%
&
' ' ' ' ' '
N
HO
N
HO
logP=3.11
logP=3.48
Morphinan-3-ol, 17-methyl-
Levallorphan
STD - standard deviation of ensemble predictions
CORREL - correlation between vectors of predictions
Tetko et al, DDT, 2006, 11, 700-7.
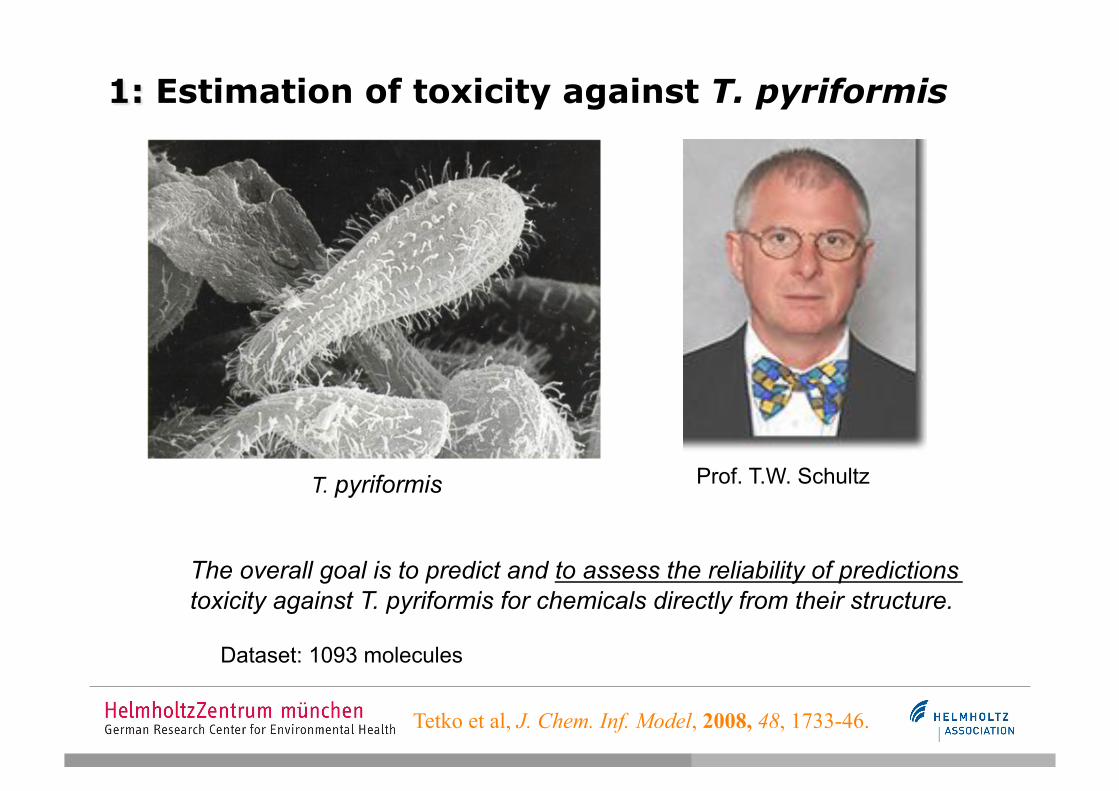
The overall goal is to predict and to assess the reliability of predictions toxicity against T. pyriformis for chemicals directly from their structure.
Prof. T.W. Schultz T. pyriformis
Dataset: 1093 molecules
Tetko et al, J. Chem. Inf. Model, 2008, 48, 1733-46.
CAse studies on the development and application of in-silico techniques for environmental hazard and risk assessment
Challenge (deadline is Sep. 10) is co-organized with the European Neural Network Society
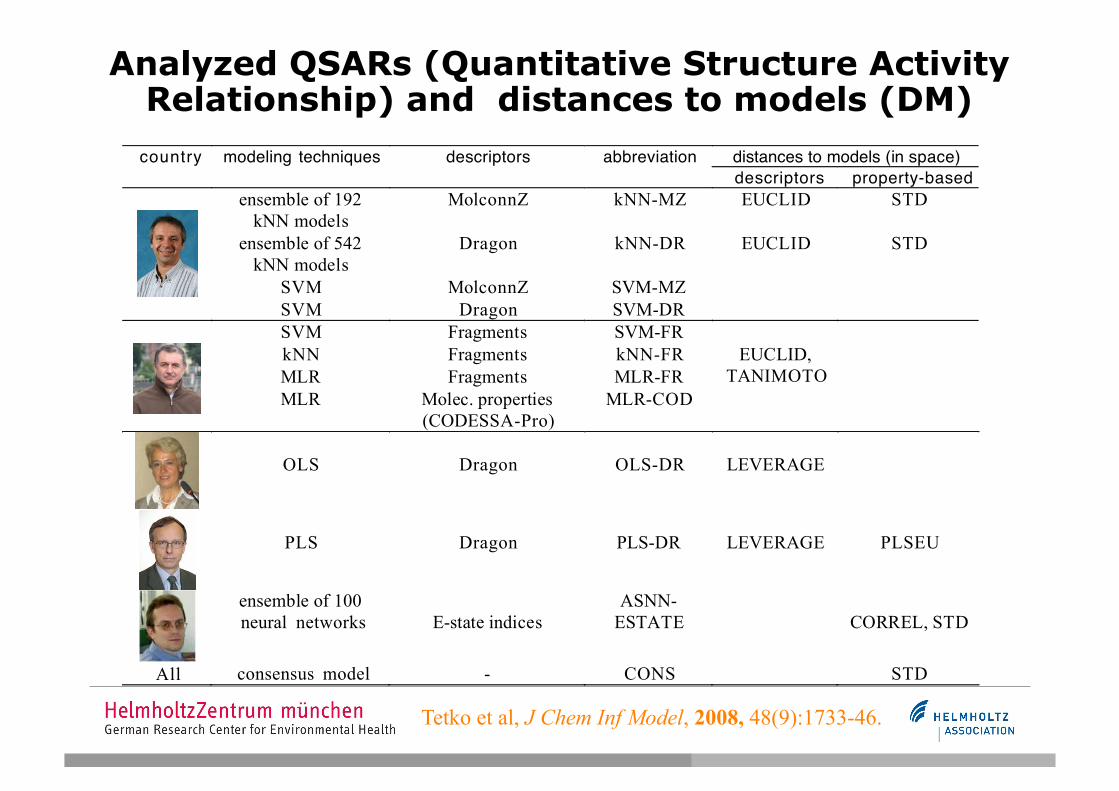
Analyzed QSARs (Quantitative Structure Activity Relationship) and distances to models (DM)
distances to models (in space) country modeling techniques descriptors abbreviation descriptors property-based
ensemble of 192 kNN models
MolconnZ kNN-MZ EUCLID STD
ensemble of 542 kNN models
Dragon kNN-DR EUCLID STD
SVM MolconnZ SVM-MZ
SVM Dragon SVM-DR
SVM Fragments SVM-FR kNN Fragments kNN-FR MLR Fragments MLR-FR
EUCLID, TANIMOTO
MLR Molec. properties (CODESSA-Pro)
MLR-COD
OLS
Dragon
OLS-DR
LEVERAGE
PLS
Dragon
PLS-DR
LEVERAGE
PLSEU
ensemble of 100 neural networks
E-state indices
ASNN-ESTATE
CORREL, STD
All consensus model - CONS STD
Tetko et al, J Chem Inf Model, 2008, 48(9):1733-46.
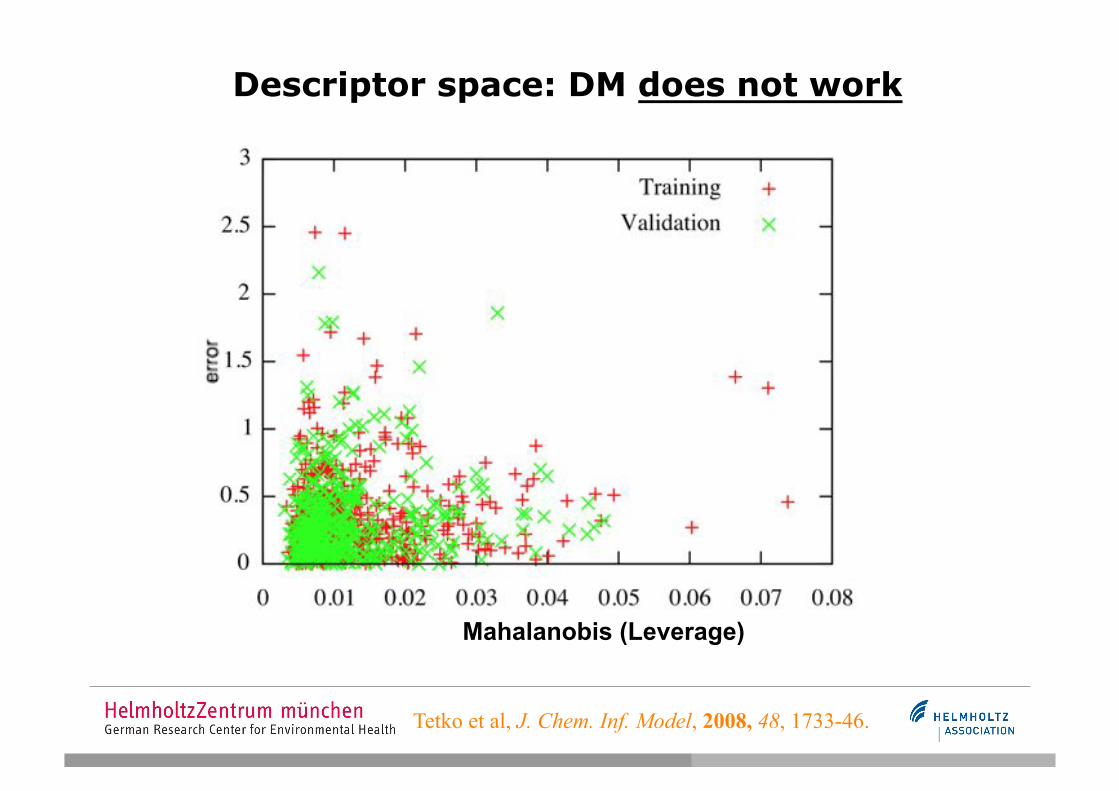
Descriptor space: DM does not work
Mahalanobis (Leverage)
Tetko et al, J. Chem. Inf. Model, 2008, 48, 1733-46.
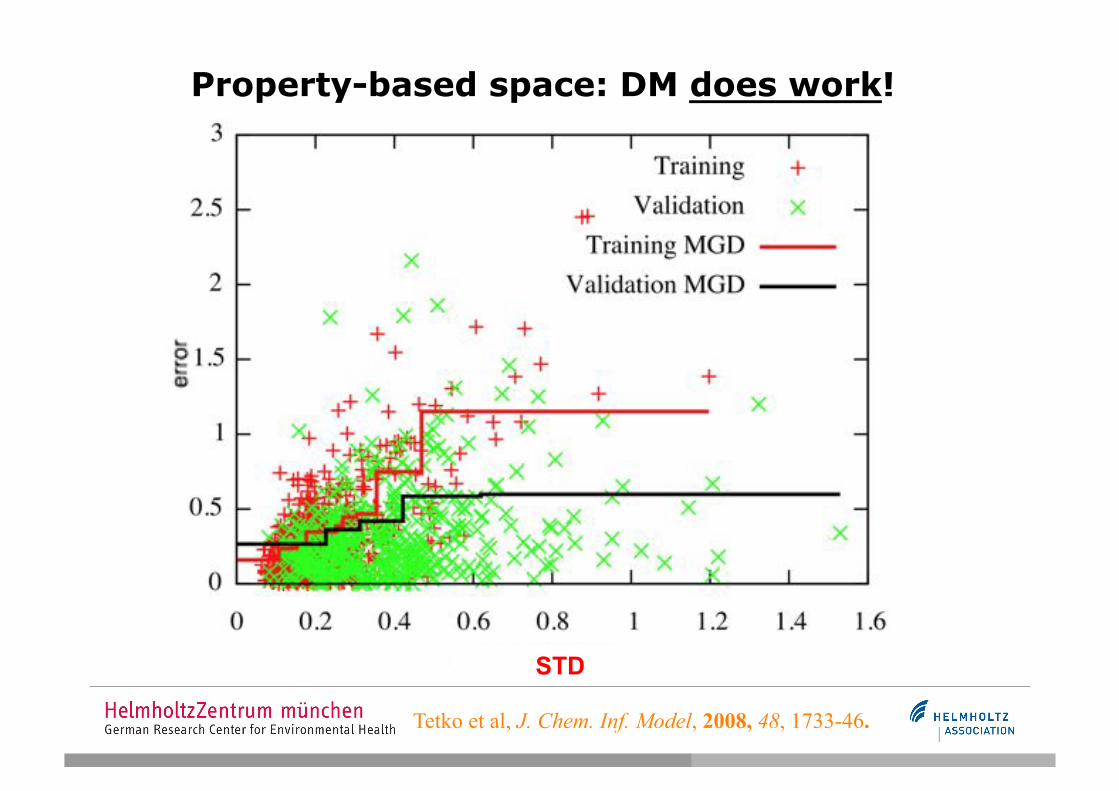
Property-based space: DM does work!
STD
Tetko et al, J. Chem. Inf. Model, 2008, 48, 1733-46.
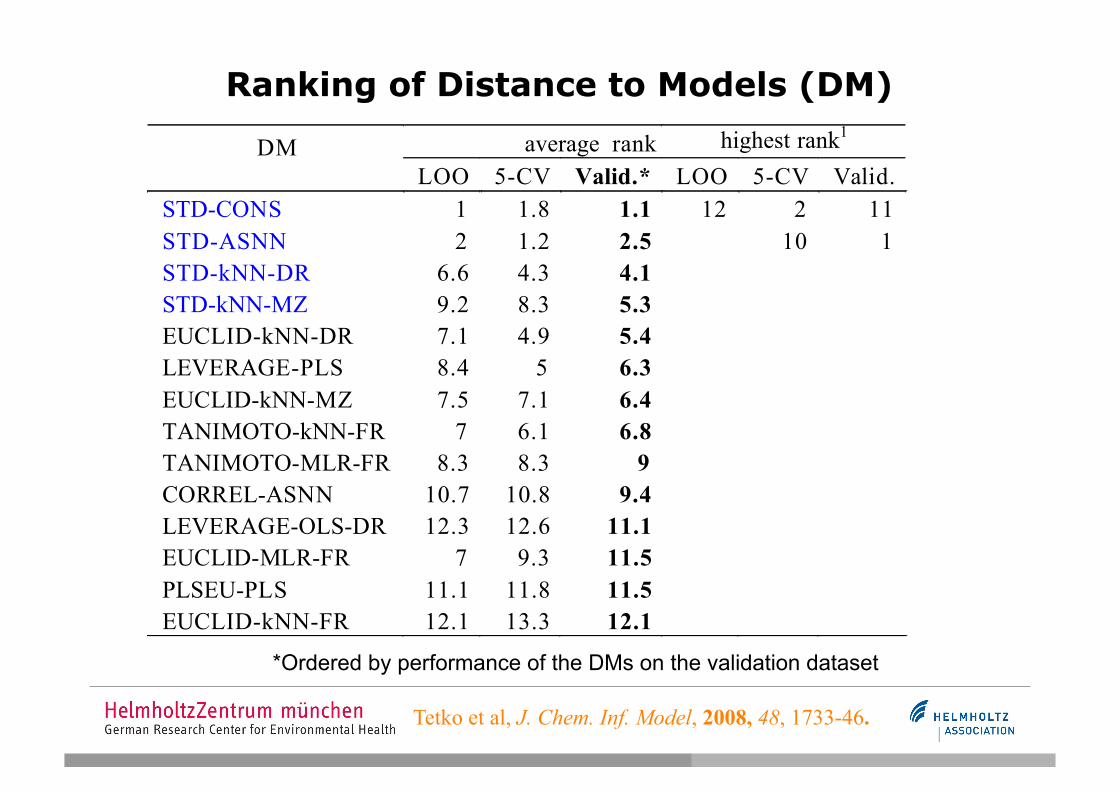
Ranking of Distance to Models (DM)
average rank highest rank1 DM LOO 5-CV Valid.* LOO 5-CV Valid. STD-CONS 1 1.8 1.1 12 2 11 STD-ASNN 2 1.2 2.5 10 1 STD-kNN-DR 6.6 4.3 4.1 STD-kNN-MZ 9.2 8.3 5.3 EUCLID-kNN-DR 7.1 4.9 5.4 LEVERAGE-PLS 8.4 5 6.3 EUCLID-kNN-MZ 7.5 7.1 6.4 TANIMOTO-kNN-FR 7 6.1 6.8 TANIMOTO-MLR-FR 8.3 8.3 9 CORREL-ASNN 10.7 10.8 9.4 LEVERAGE-OLS-DR 12.3 12.6 11.1 EUCLID-MLR-FR 7 9.3 11.5 PLSEU-PLS 11.1 11.8 11.5 EUCLID-kNN-FR 12.1 13.3 12.1
*Ordered by performance of the DMs on the validation dataset
Tetko et al, J. Chem. Inf. Model, 2008, 48, 1733-46.
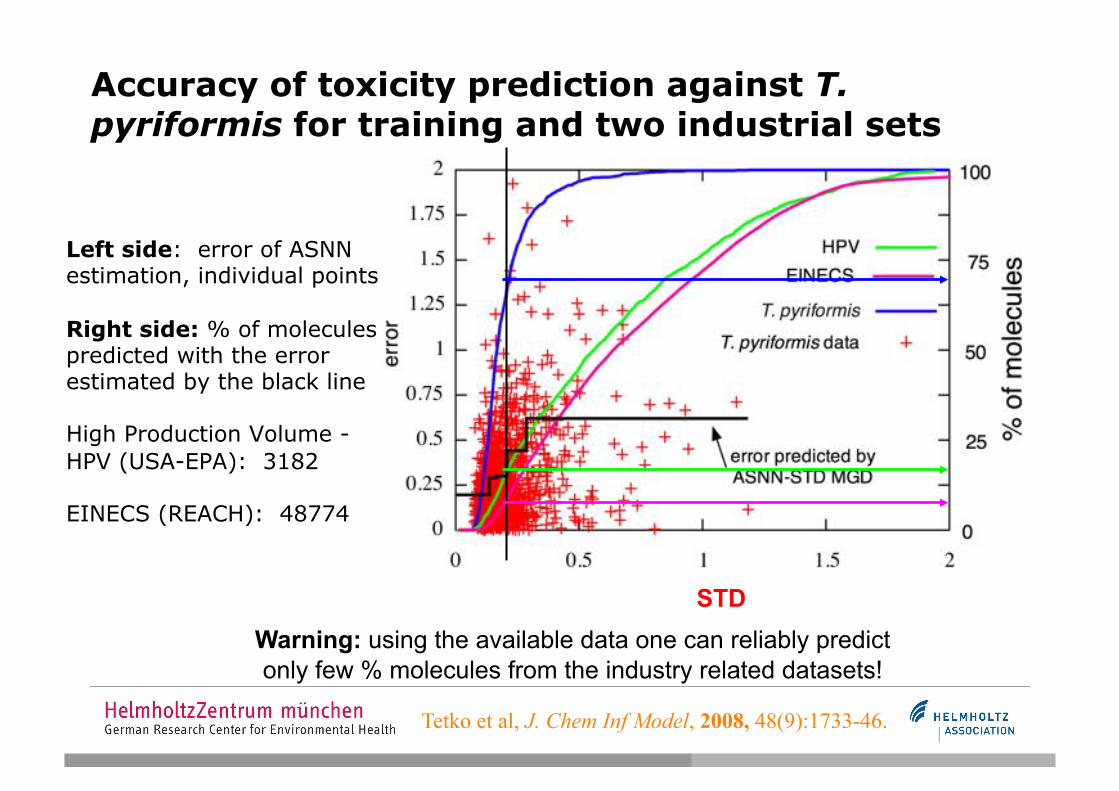
Accuracy of toxicity prediction against T. pyriformis for training and two industrial sets
Left side: error of ASNN estimation, individual points
Right side: % of molecules predicted with the error estimated by the black line
High Production Volume - HPV (USA-EPA): 3182
EINECS (REACH): 48774
Tetko et al, J. Chem Inf Model, 2008, 48(9):1733-46.
Warning: using the available data one can reliably predict only few % molecules from the industry related datasets!
STD
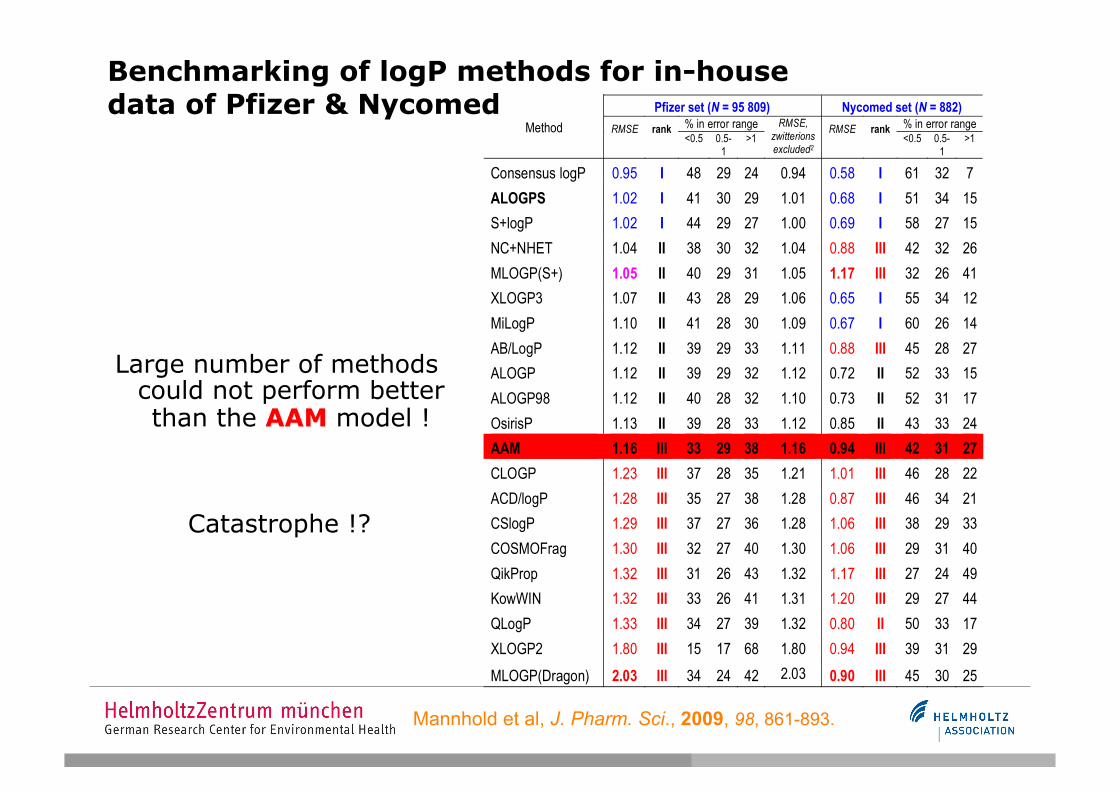
2: Benchmarking of logP calculators
Existing Dogma:
• Prediction of physico-chemical properties, in particular log P, is simple
• There is no need to measure them
• We have enough number of good computational methods
Is this true?
Data & background models
Mannhold et al, J. Pharm. Sci., 2009, 98, 861-893.
Mannhold et al, J. Pharm. Sci., 2009, 98, 861-893.
Pfizer set (N = 95 809) Nycomed set (N = 882)
% in error range % in error range
Method RMSE rank <0.5 0.5-
1 >1
RMSE, zwitterions excluded2
RMSE rank <0.5 0.5-
1 >1
Consensus logP 0.95 I 48 29 24 0.94 0.58 I 61 32 7 ALOGPS 1.02 I 41 30 29 1.01 0.68 I 51 34 15 S+logP 1.02 I 44 29 27 1.00 0.69 I 58 27 15 NC+NHET 1.04 II 38 30 32 1.04 0.88 III 42 32 26 MLOGP(S+) 1.05 II 40 29 31 1.05 1.17 III 32 26 41 XLOGP3 1.07 II 43 28 29 1.06 0.65 I 55 34 12 MiLogP 1.10 II 41 28 30 1.09 0.67 I 60 26 14 AB/LogP 1.12 II 39 29 33 1.11 0.88 III 45 28 27 ALOGP 1.12 II 39 29 32 1.12 0.72 II 52 33 15 ALOGP98 1.12 II 40 28 32 1.10 0.73 II 52 31 17 OsirisP 1.13 II 39 28 33 1.12 0.85 II 43 33 24 AAM 1.16 III 33 29 38 1.16 0.94 III 42 31 27 CLOGP 1.23 III 37 28 35 1.21 1.01 III 46 28 22 ACD/logP 1.28 III 35 27 38 1.28 0.87 III 46 34 21 CSlogP 1.29 III 37 27 36 1.28 1.06 III 38 29 33 COSMOFrag 1.30 III 32 27 40 1.30 1.06 III 29 31 40 QikProp 1.32 III 31 26 43 1.32 1.17 III 27 24 49 KowWIN 1.32 III 33 26 41 1.31 1.20 III 29 27 44 QLogP 1.33 III 34 27 39 1.32 0.80 II 50 33 17 XLOGP2 1.80 III 15 17 68 1.80 0.94 III 39 31 29 MLOGP(Dragon) 2.03 III 34 24 42 2.03 0.90 III 45 30 25
Benchmarking of logP methods for in-house data of Pfizer & Nycomed
Catastrophe !?
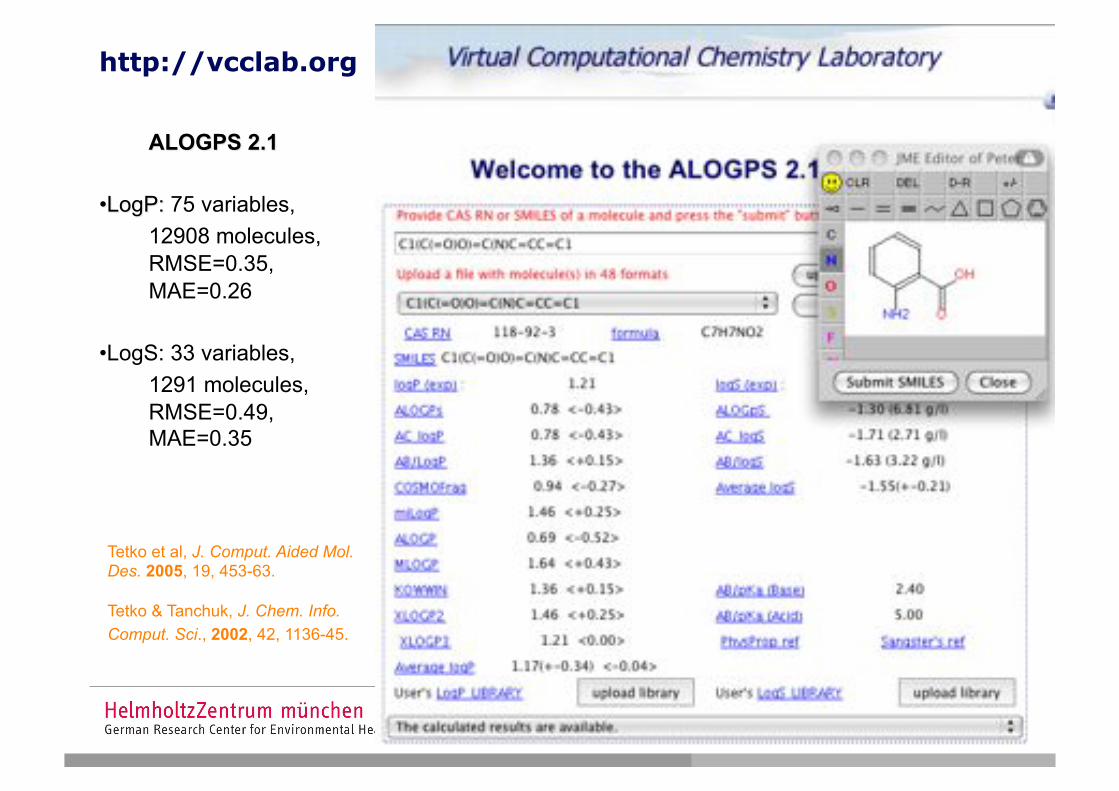
Tetko et al, J. Comput. Aided Mol. Des. 2005, 19, 453-63.
Tetko & Tanchuk, J. Chem. Info. Comput. Sci., 2002, 42, 1136-45.
http://vcclab.org
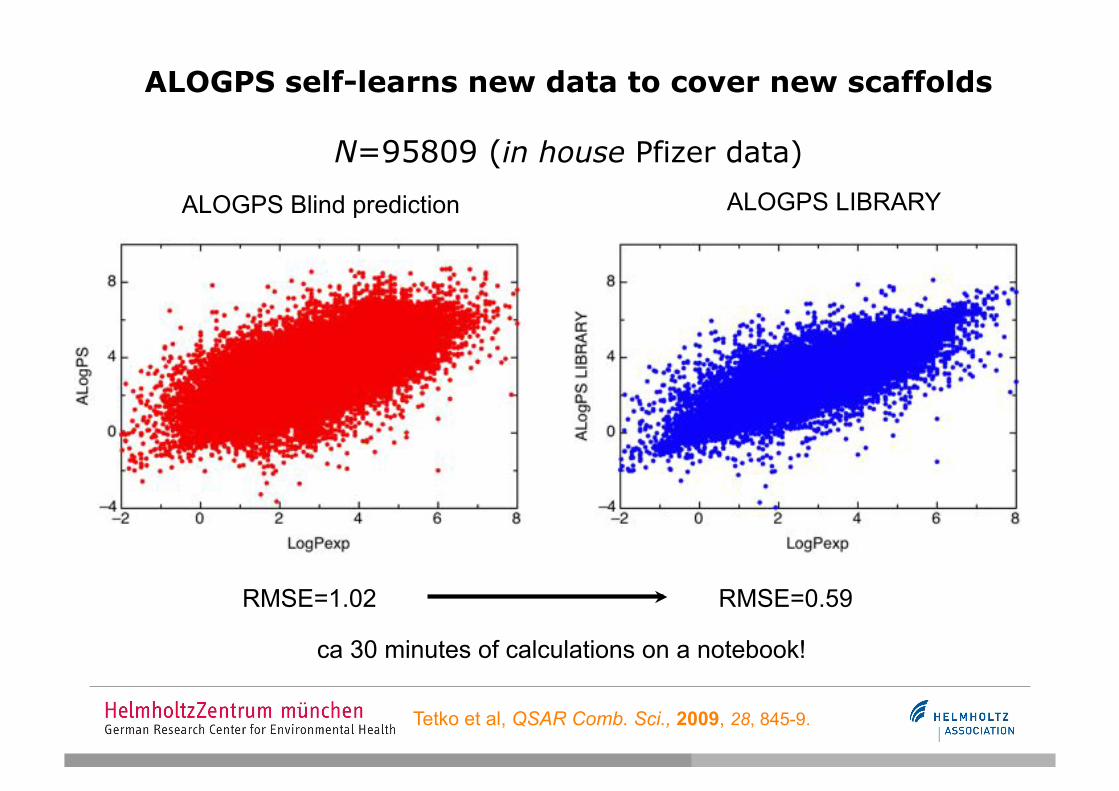
ALOGPS self-learns new data to cover new scaffolds
N=95809 (in house Pfizer data)
ca 30 minutes of calculations on a notebook!
RMSE=1.02 RMSE=0.59
ALOGPS Blind prediction ALOGPS LIBRARY
Tetko et al, QSAR Comb. Sci., 2009, 28, 845-9.
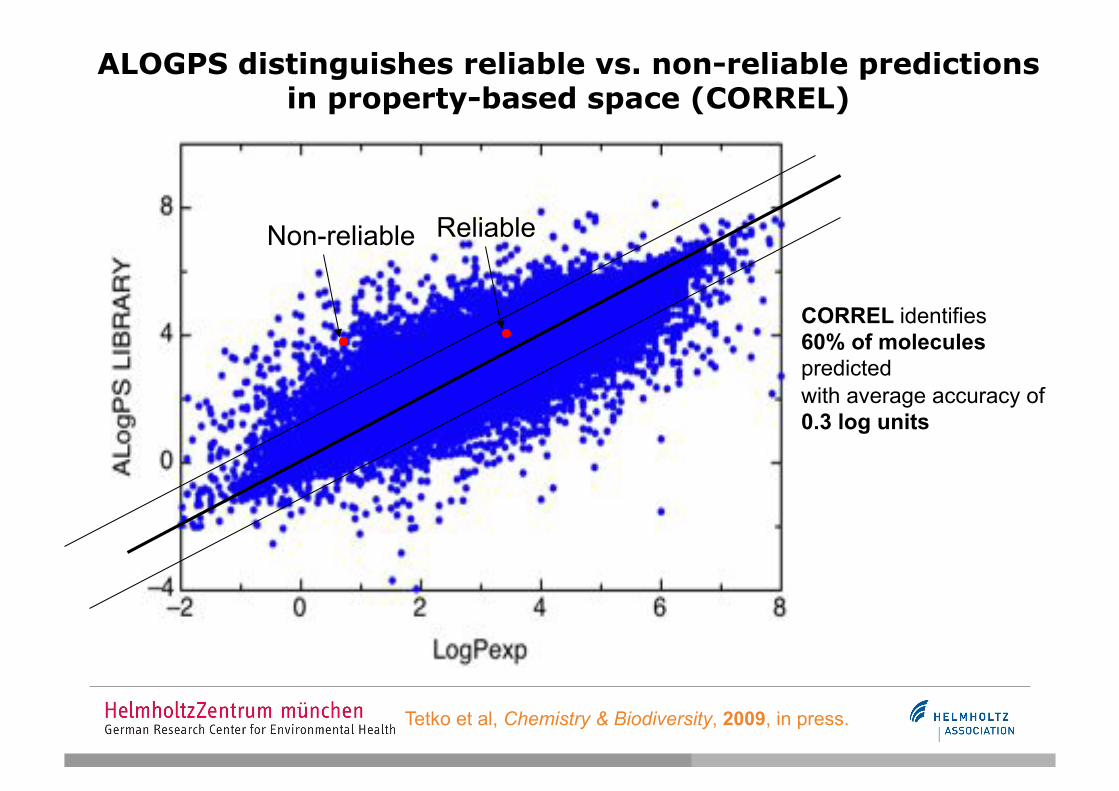
Tetko et al, Chemistry & Biodiversity, 2009, in press.
ALOGPS distinguishes reliable vs. non-reliable predictions in property-based space (CORREL)
Non-reliable Reliable
CORREL identifies 60% of molecules predicted with average accuracy of 0.3 log units
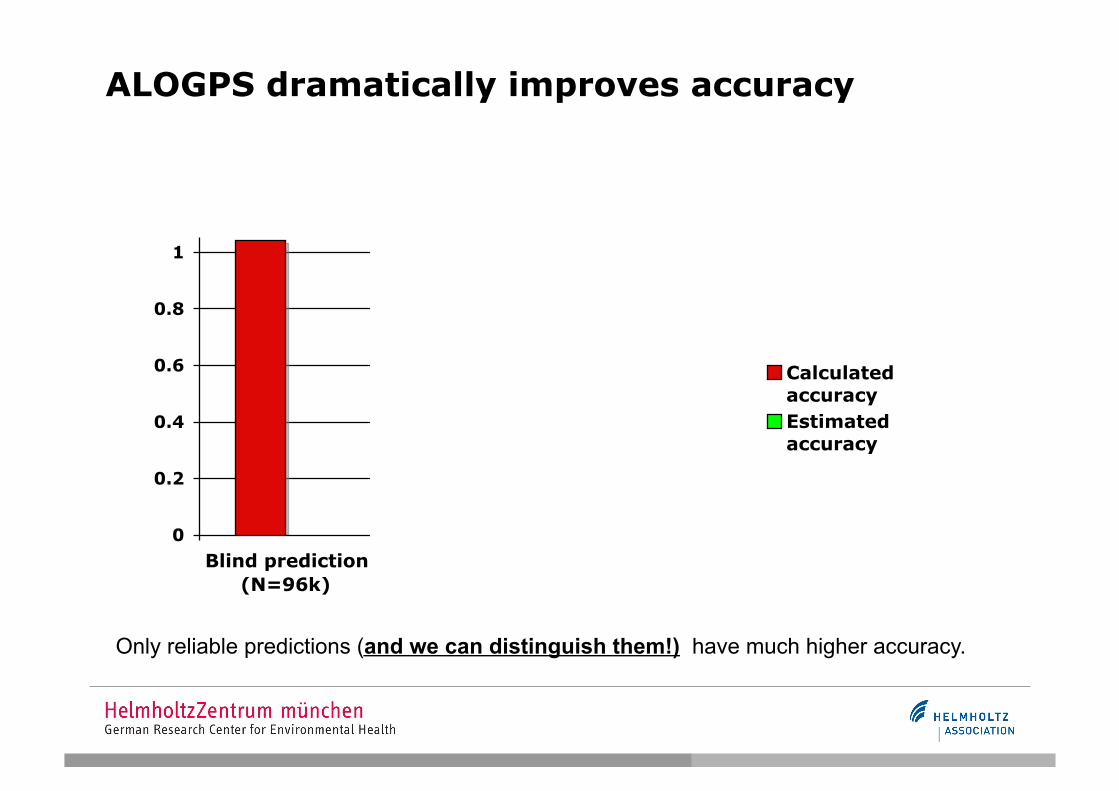
ALOGPS dramatically improves accuracy
0
0.2
0.4
0.6
0.8
1
Blind prediction
(N=96k)
LIBRARY
(N=96k)
Reliable
(N=60k)
Calculated
accuracy
Estimated
accuracy
Only reliable predictions (and we can distinguish them!) have much higher accuracy.
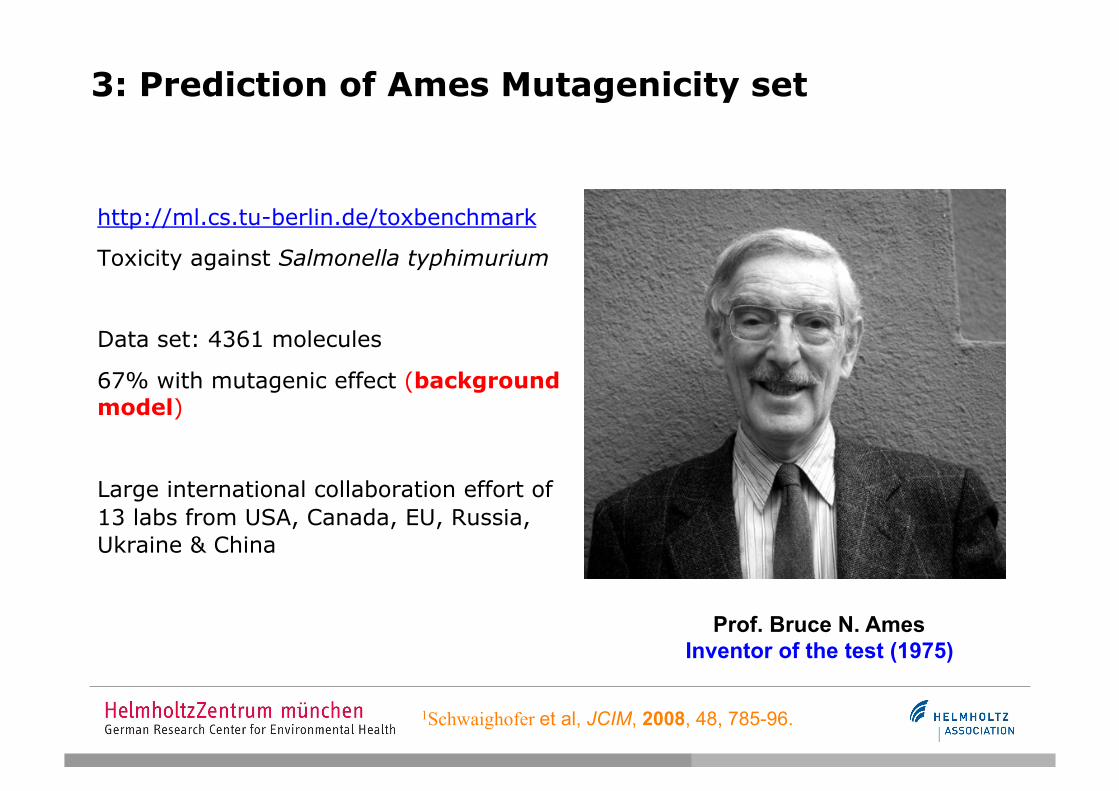
3: Prediction of Ames Mutagenicity set
http://ml.cs.tu-berlin.de/toxbenchmark
Toxicity against Salmonella typhimurium
Data set: 4361 molecules
67% with mutagenic effect (background model)
Large international collaboration effort of 13 labs from USA, Canada, EU, Russia, Ukraine & China
1Schwaighofer et al, JCIM, 2008, 48, 785-96.
Prof. Bruce N. Ames Inventor of the test (1975)
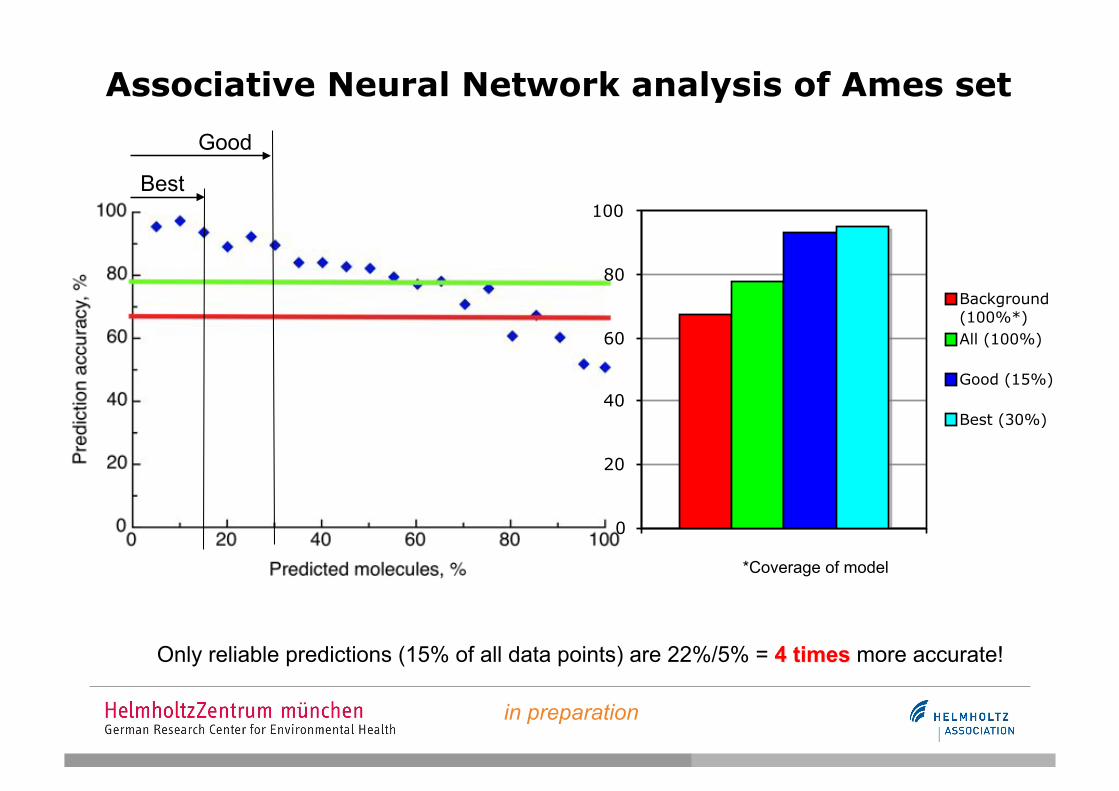
Associative Neural Network analysis of Ames set
0
20
40
60
80
100
Background
(100%*)
All (100%)
Good (15%)
Best (30%)
Best
Good
in preparation
*Coverage of model
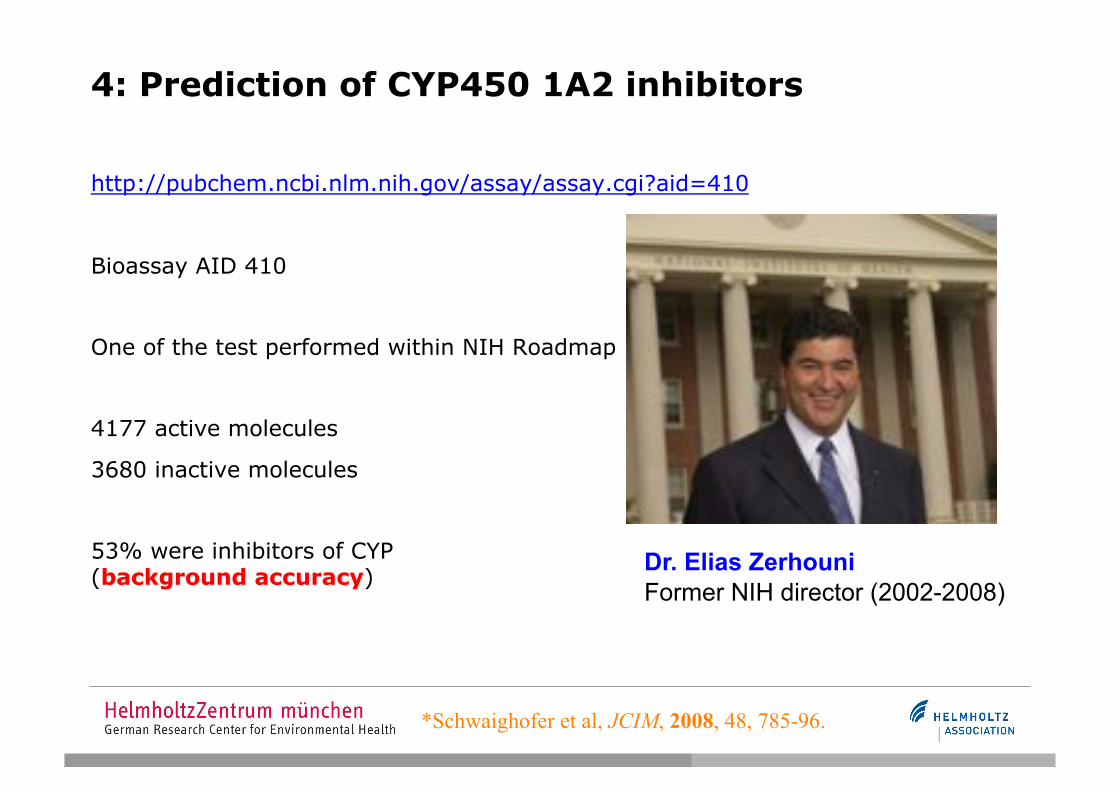
4: Prediction of CYP450 1A2 inhibitors
*Schwaighofer et al, JCIM, 2008, 48, 785-96.
Dr. Elias Zerhouni Former NIH director (2002-2008)
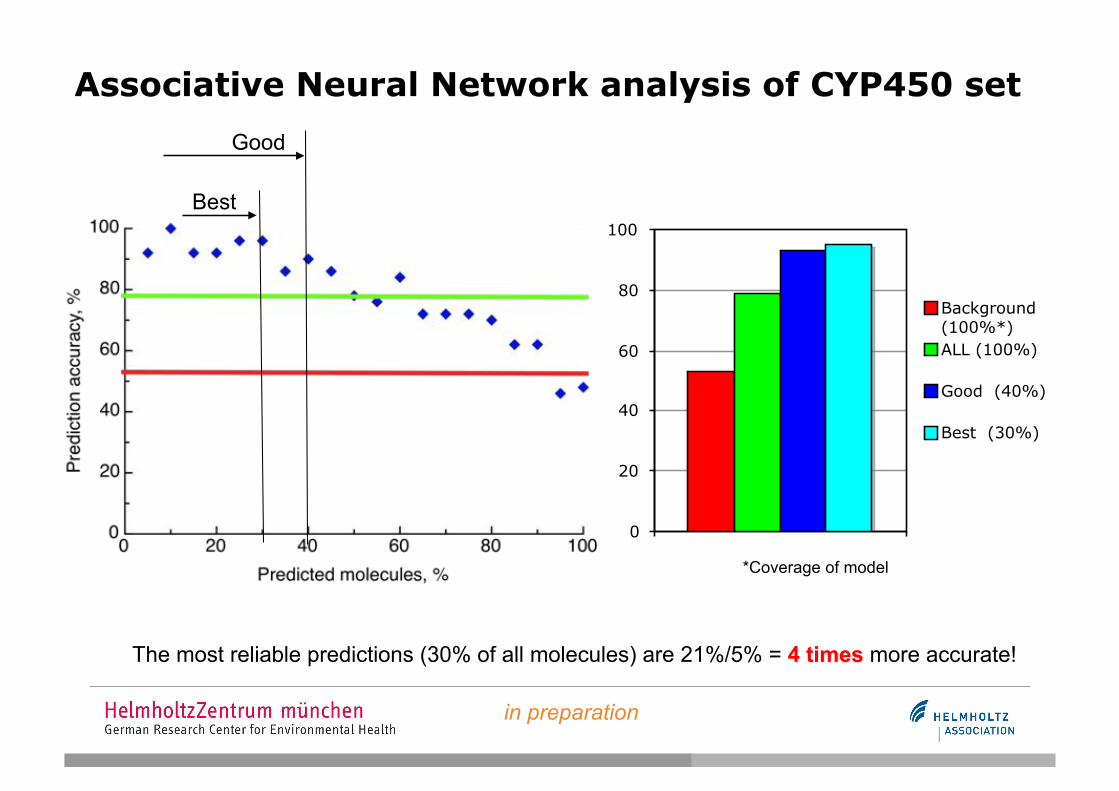
Associative Neural Network analysis of CYP450 set
0
20
40
60
80
100
Background(100%*)
ALL (100%)
Good (40%)
Best (30%)
Best
Good
in preparation
*Coverage of model
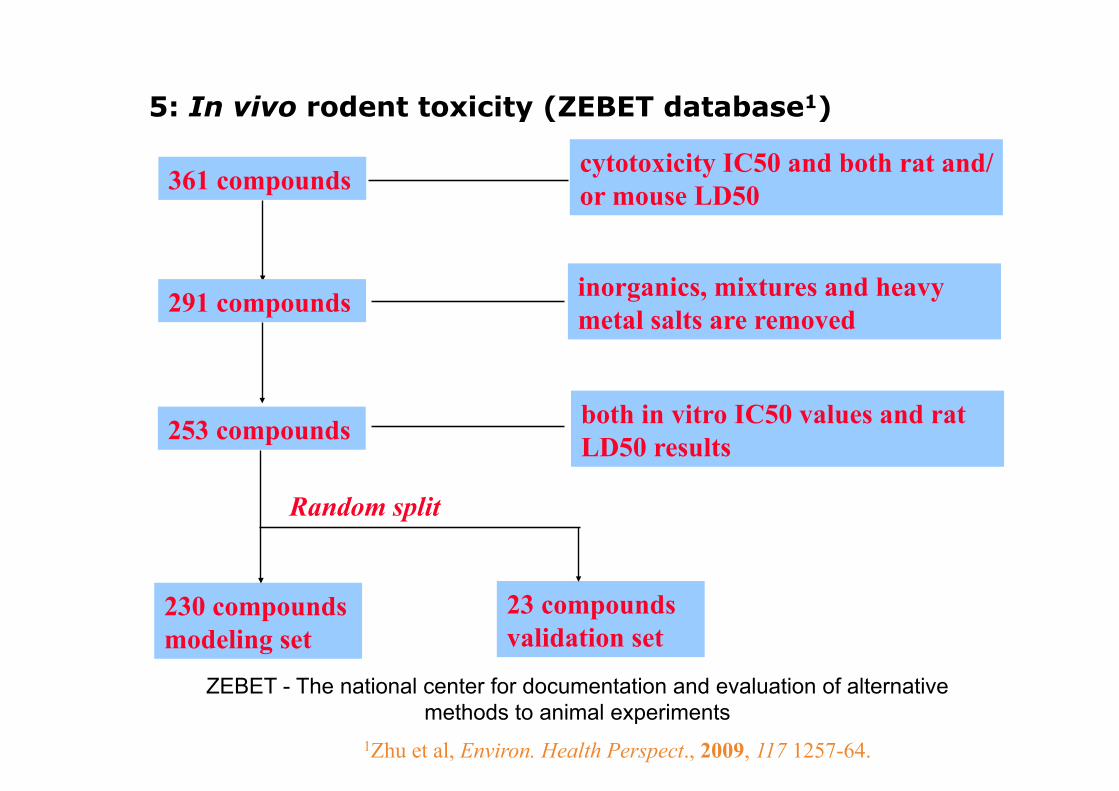
5: In vivo rodent toxicity (ZEBET database1)
361 compounds cytotoxicity IC50 and both rat and/or mouse LD50
291 compounds inorganics, mixtures and heavy metal salts are removed
253 compounds
230 compounds modeling set
23 compounds validation set
both in vitro IC50 values and rat LD50 results
Random split
1Zhu et al, Environ. Health Perspect., 2009, 117 1257-64.
ZEBET - The national center for documentation and evaluation of alternative methods to animal experiments
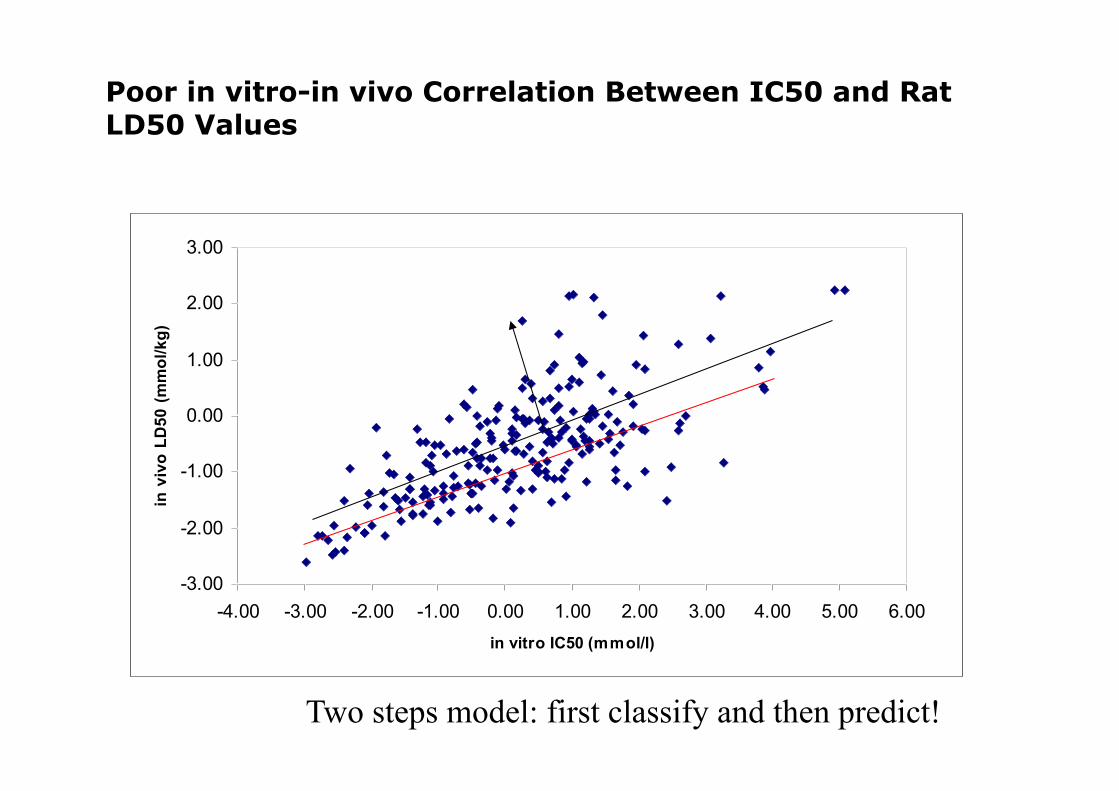
Poor in vitro-in vivo Correlation Between IC50 and Rat LD50 Values
-3.00
-2.00
-1.00
0.00
1.00
2.00
3.00
-4.00 -3.00 -2.00 -1.00 0.00 1.00 2.00 3.00 4.00 5.00 6.00in vitro IC50 (mmol/l)
in v
ivo
LD50
(m
mol
/kg)
Two steps model: first classify and then predict!
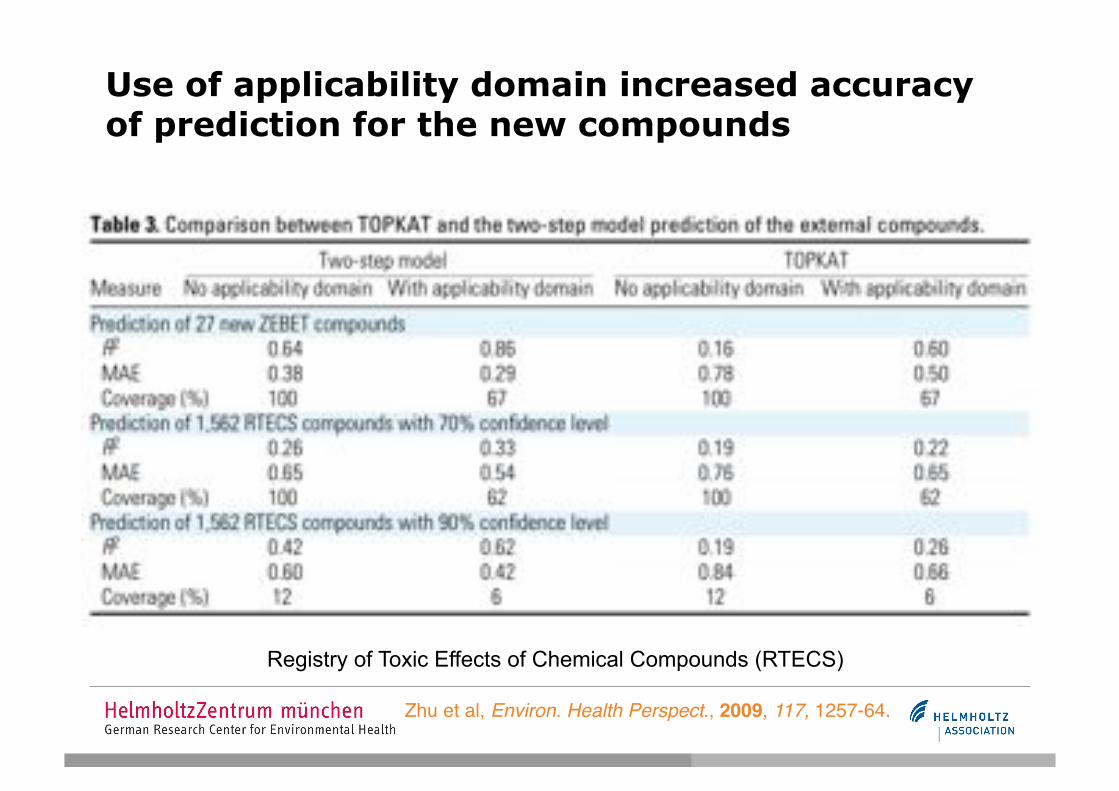
Use of applicability domain increased accuracy of prediction for the new compounds
Zhu et al, Environ. Health Perspect., 2009, 117, 1257-64.
Registry of Toxic Effects of Chemical Compounds (RTECS)
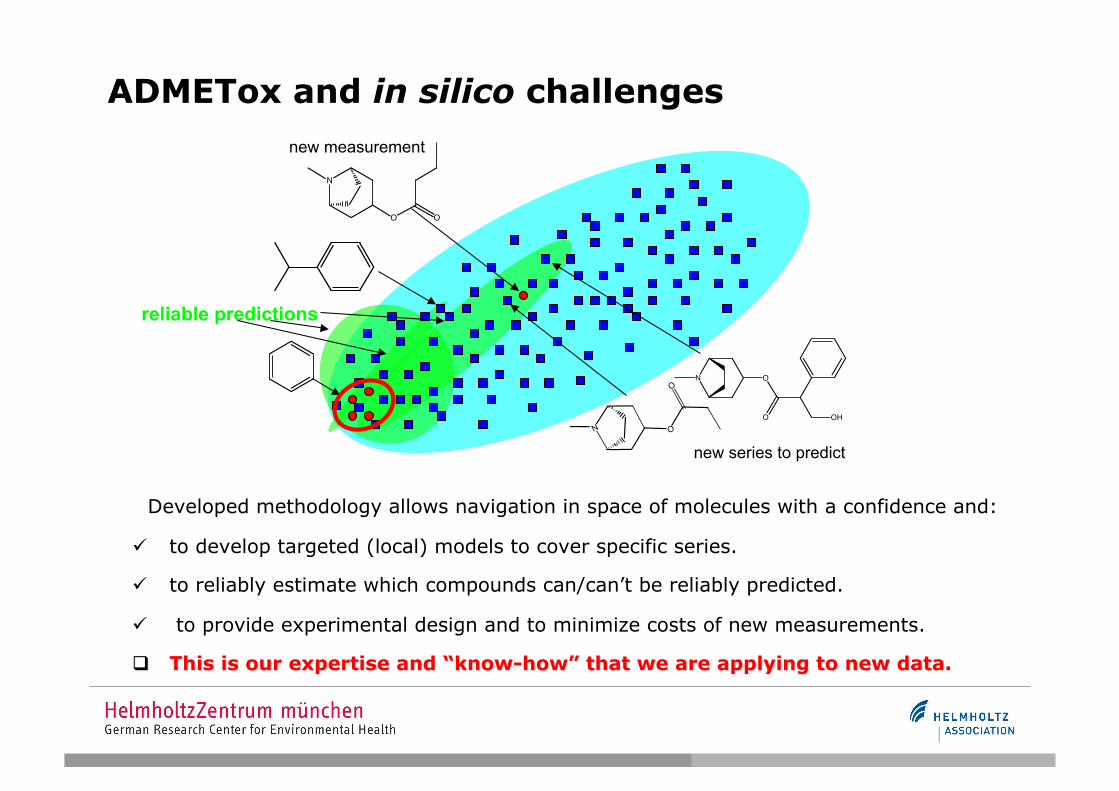
ADMETox and in silico challenges
reliable predictions
N
O O
new measurement
N O
O OHN O
O
new series to predict
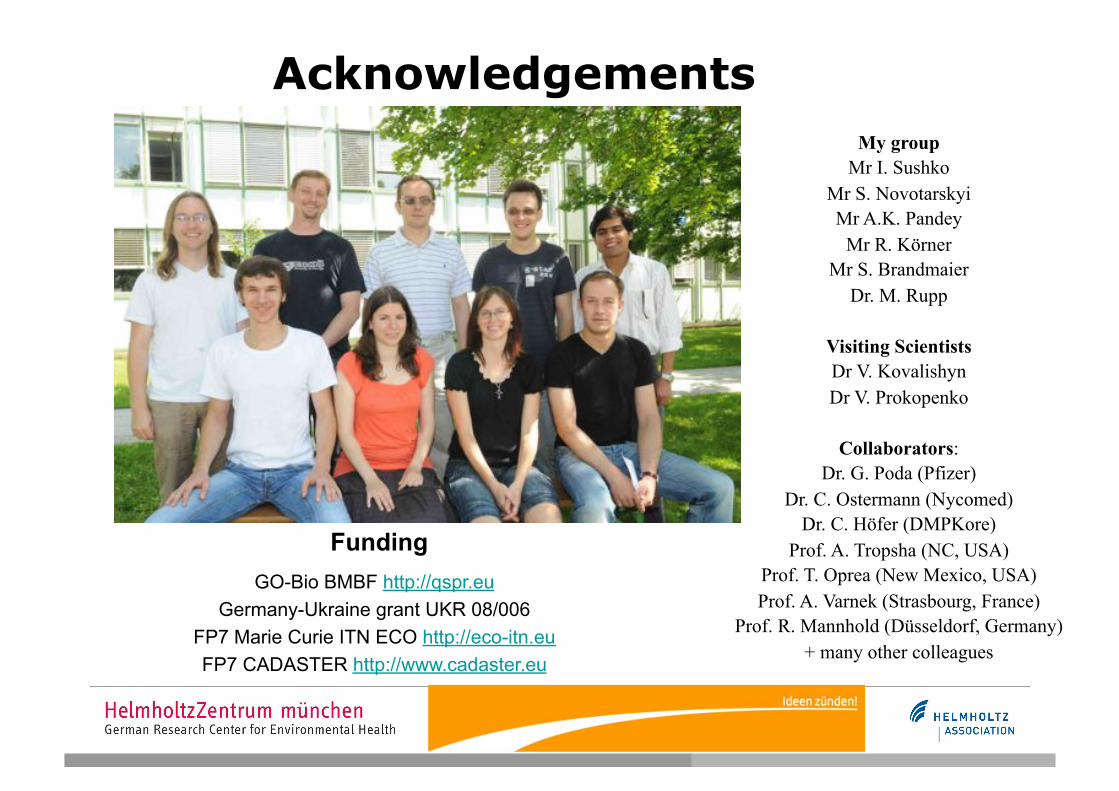
Acknowledgements
GO-Bio BMBF http://qspr.eu Germany-Ukraine grant UKR 08/006
FP7 Marie Curie ITN ECO http://eco-itn.eu FP7 CADASTER http://www.cadaster.eu
Funding
My group Mr I. Sushko
Mr S. Novotarskyi Mr A.K. Pandey
Mr R. Körner Mr S. Brandmaier
Dr. M. Rupp
Visiting Scientists Dr V. Kovalishyn Dr V. Prokopenko
Collaborators: Dr. G. Poda (Pfizer)
Dr. C. Ostermann (Nycomed) Dr. C. Höfer (DMPKore)
Prof. A. Tropsha (NC, USA) Prof. T. Oprea (New Mexico, USA) Prof. A. Varnek (Strasbourg, France)
Prof. R. Mannhold (Düsseldorf, Germany) + many other colleagues
Recommended